1. Introduction
Sixty per cent of residential buildings of the EU stock will be 50 years old in 2021: the highest rate will be recorded in Italy with 79% [
1]. Those buildings were built before the implementation of the first thermal regulations in 1970. Only in few other countries, such as Cyprus, Spain and Ireland, the share of new dwellings (built after 2000) is significant. As a result, buildings account for 40% of the total EU energy consumption, emitting a similar quota of CO
: 36% [
2]. At the same time, looking at the structural performances, those buildings have effectively exhausted their designed service life. Similar considerations might be repeated regarding the entering into force of modern design codes and regulations, such as for earthquake, wind and fire safety. This suggests that the refurbishment of EU building stock cannot be delayed and, at the same time, different issues should be coordinated within an overall Life Cycle perspective: primarily
safety and
sustainability. A new interdisciplinary approach calls for a common language to share data and rules among different practitioners and users involved in the building process; to this end, common
taxonomy,
semantic and
metric are crucial [
3]. To reach these targets, a new avant garde way to conceive structures is needed. The design process should concern the whole life cycle of structures and their components to reduce environmental impacts and increase the durability of structures. The modern concept of
Sustainable Development, or
Sustainability, lays on three distinct pillars:
environment,
economy and
society, as established by the ISO 15392 [
4] (Sustainability in building construction). Whereas safety is part of society’s pillar and energy efficiency is part of environmental pillar, the optimisation of each of these areas must also take into account the third pillar of sustainability: economy. To this end, the
Sustainable Structural Design method (SSD) considers both environmental and structural parameters in a life cycle perspective, comparing them, to each other and with other issues, in economic terms. In this light, the SSD method, hereinafter presented, could be the solution to design constructions, considering all buildings requirements in a holistic way [
5]. In the following sections, the theoretical background of the SSD method is explained in details, after a brief overview about Energy and Environmental issues in the construction sector. Afterwards, the application of the method to a case study is presented: a three-storey reinforced concrete building is evaluated in two different structural solutions (
precast and
cast-in-situ) to analyse and compare the results in terms of combined sustainability and structural performance.
1.1. Environmental Issues in the Construction Sector
In recent years, sustainability has become a new basic term of our vocabulary that is widely used and poorly understood at the same time. As the name indicates, it is the ability of something to sustain itself. More accurately, if a certain activity is fully sustainable, it should be able to continue forever. There are many definitions of sustainability but according to the one given by the World Commission on Environment and Development, it encompasses the simple principle of taking what we need to live now without compromising the ability of future generations to meet their own needs [
6]. The European approach to this problem can be taken as an example, without any loss of generality. Sustainable development is a fundamental objective of the European Union. Its strategy is a long-term vision and an overarching policy framework providing guidance for the EU targets with a timeframe of up to 2050. The intensified ongoing work of the European Commission tends to merge the policies for economic, social and environmental development in order to afford the higher demand for materials and energy [
7]. The European construction sector plays a significant role in the sustainable development as one of the main contributors of the European economy and job market. On the other hand, it also has a large impact on the environment due to greenhouse gas emissions and energy consumption. For this reason, the European target, pursued with several initiatives and action plans, is to develop the market of sustainable constructions. This means that a structure at the same time has to satisfy several requirements related to the environment, society and economy in parallel with requirements of structural design. Moreover, these conditions should be guaranteed during the life cycle of the structure [
5]. The construction industry is a major material and energy consumer and thus a significant contributor to environmental impacts such as climate change and global warming [
8]. The global climate change is caused from the concentrations of greenhouse gases (GHG) such as carbon dioxide (CO
), methane (CH
) and nitrous oxide (N
O) in the atmosphere, with the building sector being responsible for 33% of them [
9]. Further studies indicate that the greatest impacts on human health and toxic releases occur during the manufacturing and construction phases, while the greatest amounts of energy consumption (70–90%) and GHG emissions result during the operation phase [
10]. As a result, the 2012/31/EU directive stated that the focus of the building and construction sector should be in energy efficiency [
11]. For this reason, improving the energy performance of buildings is an essential measure to achieve the ambitions of Europe, specifically the EU Climate and Energy targets, which refer to the reduction of greenhouse gas emissions by 20% and energy savings of 20%, both by 2020 [
12,
13]. Moreover, climate change and global warming are not concepts that touch only specific countries or continents but they are important worldwide issues. The first international effort against the climate change was paid off by the signature of Kyoto Protocol in 1997 as an agreement under which industrialised countries would reduce their collective emissions of greenhouse gases. Finally, after 20 years of UN negotiations, a binding and universal agreement on climate change was signed for the first time from all nations of the world during Paris Climate Change Conference in 2015 [
14].
1.1.1. Life Cycle Assessment (LCA)
The Life Cycle Assessment (LCA) methodology deals with environmental evaluation of products and processes throughout the entire life of the building; it consists in a multi-step procedure for analysing environmental burden of products and processes. The method has gained great recognition through the years as a suitable tool to evaluate energy consumption, emissions and other wastes related to a product in a life cycle perspective [
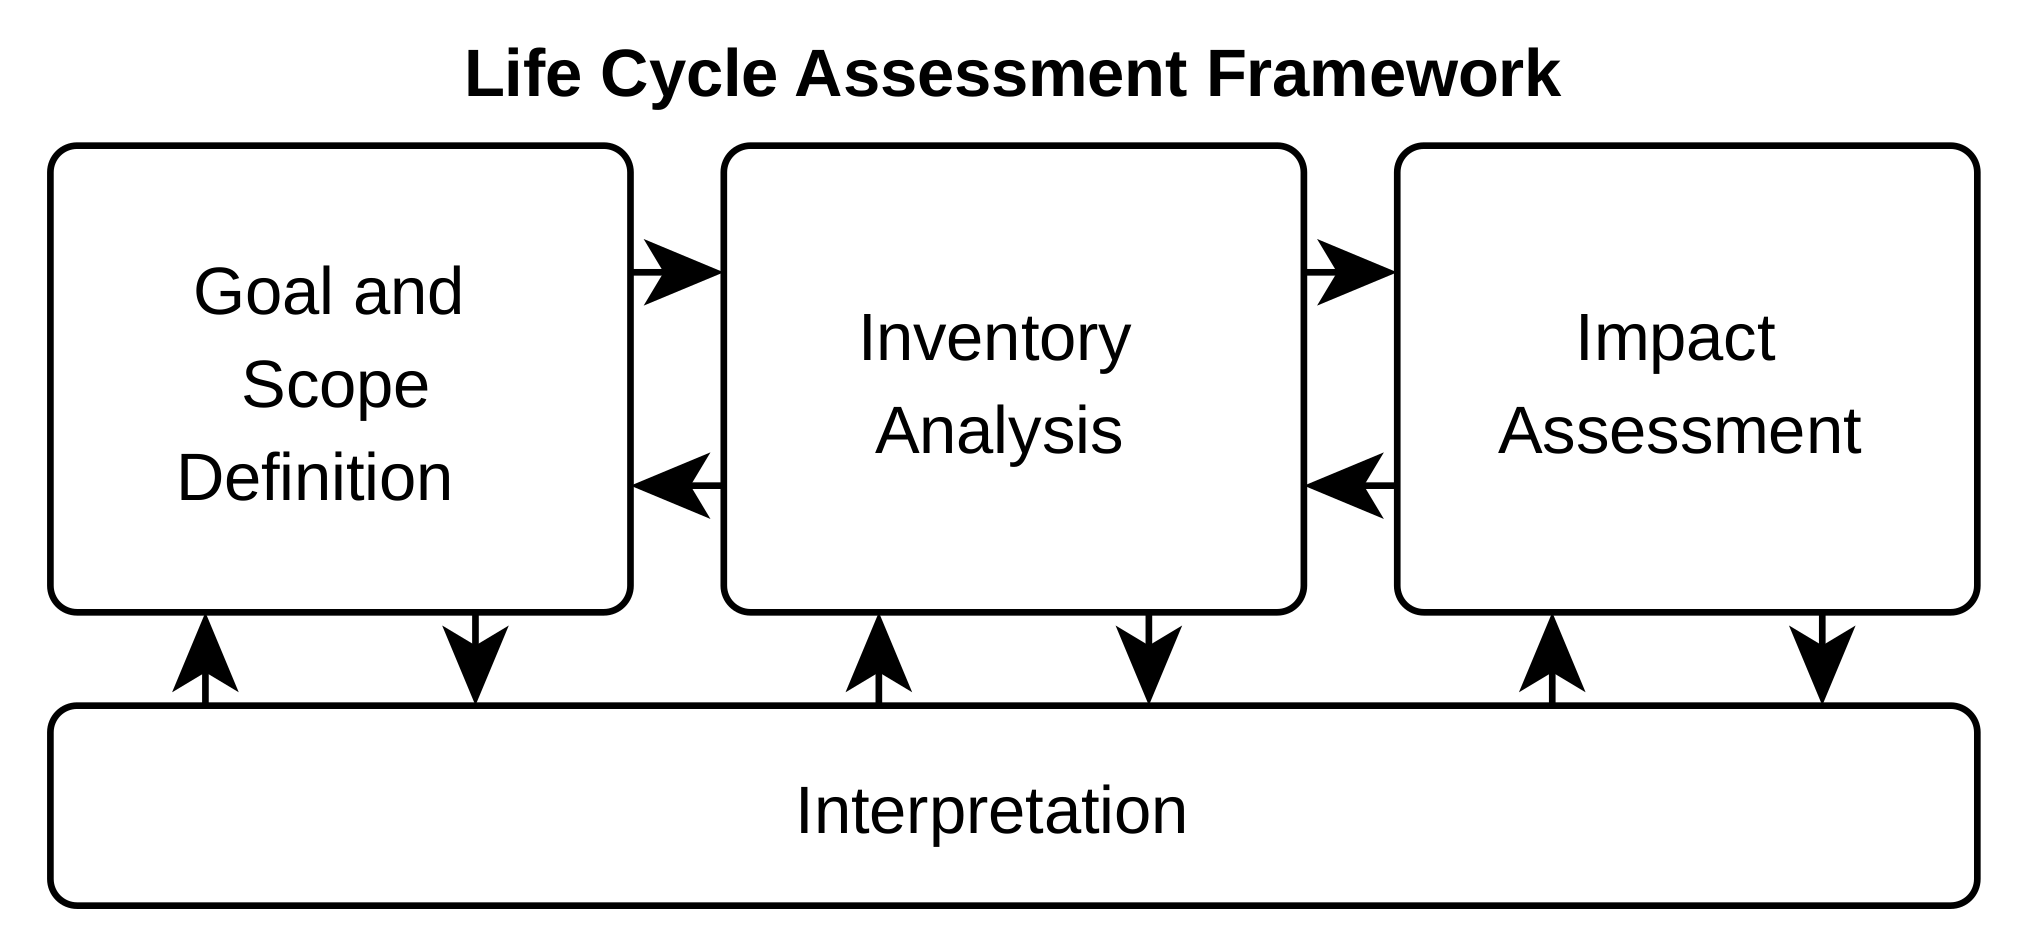
15]. The general procedure for conducting a LCA is defined by the International Organisation for Standards (ISO) series ISO 14040 [
16] and ISO 14044 [
17]. According to those guidelines, the LCA methodology is composed of four steps: (i) goal, scope and boundary definition; (ii) life-cycle inventory (LCI) analysis; (iii) life-cycle impact assessment (LCIA); and (iv) interpretation of results (
Figure 1).
LCA is becoming a powerful framework for the environmental evaluation and several impact assessment methods, such as IPCC 2007 GWP, have been developed. With the current push toward sustainability, the use of LCA is becoming more widespread and nowadays many LCA-based procedures and software are available [
5]. In particular, the application of the method requires advanced skills and comprehensive databases so a continuous research to refine the existing tools is necessary. LCA method has been used to evaluate the environmental impact of many industries for a long time, but in the construction sector its application is still considered innovative [
15]. The method is also known as cradle-to-grave assessment as it encompasses all phases of the building life from raw material extraction, manufacture, transportation, use, maintenance, and end-of-life via disposal or recycling [
18].
Figure 2 shows the flowchart of the LCA for a building in a cradle-to-grave approach.
Different quantities are used to measure the impacts, such as energy or equivalent emission of carbon dioxide as a global measure of greenhouse gases production.
Table 1 describes in detail life cycle stages as defined in the EN 15978:2011 [
19]. According to the ISO 14044 [
20], normalisation is an optional step of Life Cycle Impact Assessment (LCIA). It allows the practitioner to express results after the characterisation step using a common reference impact. To this end, ILCD includes 15 different categories of impact—all considered in this analysis—that can be converted into CO
.
1.1.2. Life Cycle Energy Analysis (LCEA)
The environmental burden of a building can be evaluated by applying the Life Cycle Energy Analysis (LCEA) as an approach that accounts for all energy inputs to a building in its life cycle. The system boundaries of this analysis include the total energy used during the three main phases of the building life: construction (including extraction and manufacture), use and demolition [
21]. Accordingly, the LCEA is determined estimating the energy used for each phase as described following.
Embodied Energy ()
Embodied energy is the energy required for extracting, manufacturing and transporting all the materials used in the building, and energy incurred at the time of the construction or renovation of the building. Embodied energy
is expressed as:
where
is the material quantity;
is the specific energy content needed for the production/extraction of material unit quantity;
is the energy consumed for the transportation of materials to construction site; and
is the energy used at site during the construction.
Operating Energy ()
Operating energy is the energy required for maintaining comfort conditions and day-to-day maintenance of the buildings. It is the energy needed for HVAC (heating, ventilation and air conditioning), domestic hot water, lighting, and running appliances. Operating energy
throughout the lifespan of the building is expressed as below:
where
Demolition Energy ()
Demolition energy is the energy required at the end of the building’s life to demolish it and to transport the materials to landfill or recycling plants. Demolition energy
is expressed as:
where
In the end, the total energy over the entire life of the building is the sum of energy incurred at each phase of the building life. Therefore, the life cycle energy
is expressed as below:
After performing LCEA, phases that demand high amount of energy can be determined and further studies can be done from specialists of various fields to reduce energy consumption and improve building qualities. Similar considerations can originate by a LCA performed in terms of equivalent CO emissions.
2. The Sustainable Structural Design Method (SSD)
The Sustainable Structural Design (SSD) method is conceived as a supporting tool for the general process of building design that takes into account technical-structural aspects along with environmental ones during the life cycle of the structure. It aims at optimising the process of building design in terms of structural and environmental performances, configuring a design method both for safety and sustainability [
22], a goal also expressed by other authors [
23]. SSD should be not considered as just-another-framework to perform multi-criteria evaluations; its ambition is sharing and coordinating the best practices already available and used by different experts in the building sector. To this end, in the definition of the architecture of the SSD method, two main objectives were pursued: the
Openness and the
Sustainability of the method itself.
Openness is necessary to ensure that the largest number of people may be involved and allowed to use and fit the procedure according to their needs. For this purpose, SSD should be Modular, Portable, and Scalable.
Modular: Separating functions into independent, interchangeable modules, such that each contains everything necessary to execute all the aspects of the desired function. Naturally, all modules should be connected to communicate using the same language and the same metrics; to this end, the final layer is converted into purely economic terms.
Portable: It should be possible to use the same procedure for different scenarios. Stakeholders often must provide a response to questions such as the following: “Is it better to refurbish an old building or demolish it and rebuild a new one?” “Which technique could assure the best balance between safety and sustainability, building a new construction?” For this reason, it is also necessary to provide responses for a range of questions that could further include other natural hazards, such as exceptional climatic events (e.g., floods) or man-made hazards (e.g., fires or explosions).
Scalable: Stakeholders need to analyse and compare different solutions ranging from a single building to (in principle) an urban, regional, or national level. The method shall be scalable to be applicable at different levels that require the management of ever increasing amount of data.
The sustainability of the method itself is a transversal objective: whenever a process has been developed and tested already, it should be preferable to use the existing one instead of developing a new one. This approach can therefore promote the spreading of the procedure across different experts’ communities. Thus, everyone may simply use their own tools integrating with the others’ outputs.
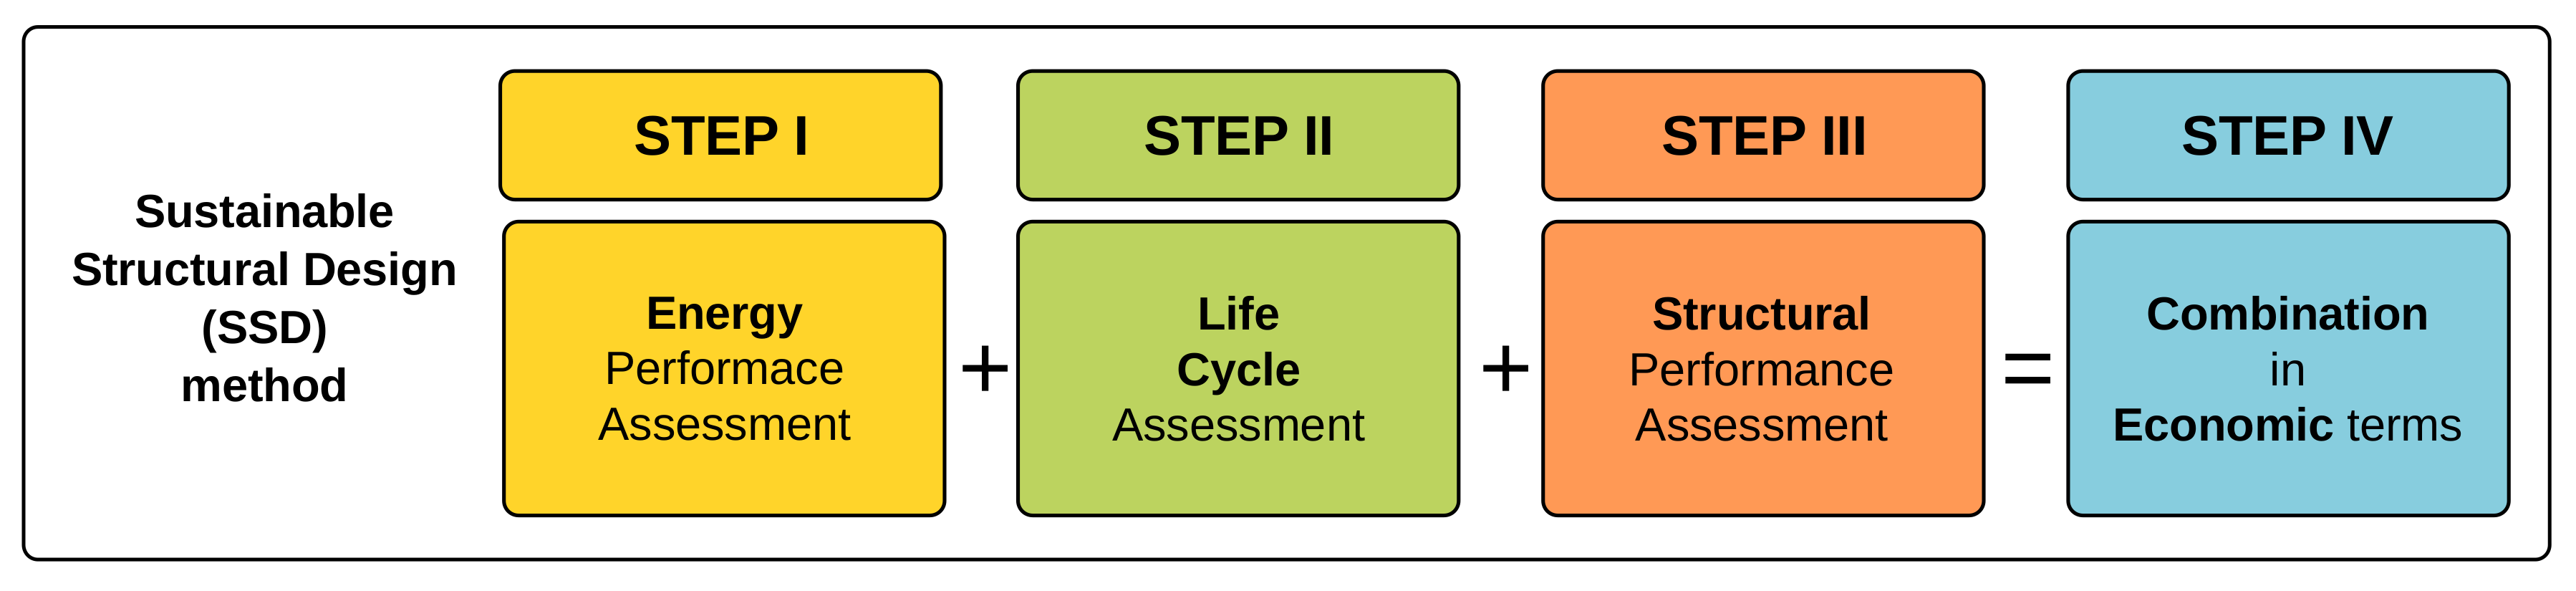
The framework of the SSD method, as shown in
Figure 3, is based on three main pillars, corresponding to the three evaluation steps: Energy Performance Assessment; Life Cycle Assessment; and Structural Performance Assessment. The following sections describe the details of each component.
2.1. STEP I: Energy Performance Assessment
This step, which formally should be part of the Life Cycle Assessment, corresponding to the evaluation of the total energy during the operation phase, is performed independently from the other LCEA components. Even though the output of this step, the operating energy
as defined in Equation (
2), corresponds to an environmental impact, it is more convenient to treat it independently from the Life Cycle Analysis. Indeed, the cost of energy already includes carbon tax which represents the environmental impact corresponding to the production and use of the energy from whatever source. Such tax, as fixed by the relevant authorities, is in principle accounting for the full environmental impact. To avoid these taxes being counted twice, the impact of energy is taken into account separately.
Another, and more practical, reason is that the energy performance assessment is routinely performed by professionals, mechanical, electric and plumbing (MEP) engineers, who mobilise specific competences that are different from the competences required for the LCA. However, one should be aware of the fact that the operating energy represents the largest portion of the total environmental burden, as will be shown in the example. This is precisely why much effort is being put into reducing the operating energy of buildings. The more this is reduced, towards near Zero Energy Buildings (nZEB), the more other contributions will gain in importance.
2.2. STEP II: Life Cycle Assessment
Following the proposed method, LCA should be performed using the common practices. The Life Cycle Assessment is performed according to the standard cradle to grave approach, as explained in
Section 1.1.1. The contribution of the operating phase is estimated using the results of the first step; this output will be expressed in terms of total equivalent CO
emissions. The functional unit and system boundaries shall be defined according to the object of the SSD analysis, e.g., two refurbishment alternatives or the refurbishment vs. demolition & reconstruction.
2.3. STEP III: Structural Performance-Based Assessment
The third step of the SSD method deals with the structural design using a Performance-Based Assessment (PBA). In other terms, the design process should not be seen in the sole aspect of structural response, but also in the light of structural performance. This is expressed in predefined design targets that the structure is required to meet over its design life [
24]. The structural Performance-Based Assessment (PBA) consists in the implementation of probabilistic scenarios that can occur during the lifespan of the structure in terms of uncertainties [
25]. Therefore, not only loads imposed on the structure but also uncertainty and probabilistic response should be taken into account in the structural analysis [
26]. The uncertainties are grouped into three main categories, namely hazard uncertainty (e.g., earthquake, wind, and floods) [
27], structural uncertainty (e.g., stiffness and material properties) and interaction mechanism uncertainty (e.g., pressure duration) [
25]. To this regard, the PBA allows structural systems to be designed in a way that meets performance targets in terms of capacity, safety and quality [
28]. The final results of the structural PBA are presented in economic context by evaluating all the costs associated with a structural solution, as well as the expected losses that may occur to the building during its life for all the design targets. Afterwards, the specialists can evaluate, compare and make decisions between alternative structural design solutions and/or rehabilitation measures [
28].
2.3.1. Simplified Performance-Based Assessment (sPBA) Method
The development of Performance-Based Assessment methods is gaining big interest in the field of structural engineering. This interest originates from the successful implementation of the Performance-Based Earthquake Engineering (PBEE) method from the Pacific Earthquake Engineering Research (PEER) Centre [
29]. The PEER’s PBEE method has been fundamental in addressing the importance of integrating loss-assessment within structural design. However, such method seems too complicated to be applied to ordinary projects due to complex probabilistic relations and high number of parameters [
22]. Considering the latter, a simplified Performance-Based Assessment (sPBA) method has been introduced by
Safety and Security of Buildings Unit of the
Directorate Space Security and Migration-European Commission, Joint Research Centre (JRC) [
28]. The framework of the sPBA method aims at reducing the complexity and the amount of data needed as well as simplifying the procedure of estimating losses due to uncertainties. The method has been developed for seismic actions, but the same approach could, with the respective differences having been considered, be applied to other actions on the structure: flood, wind, fire, blast, etc. The output of the analysis determines the cost of the structure together with expected losses for each defined limit state, corresponding to different peak ground accelerations (PGAs) and inter-storey drifts ratios (IDRs) [
5]. The steps of the sPBA method are explained in detail in the following.
Limit States Definition
The limit states are defined in terms of damageability and the expected costs for each limit state are calculated. The damage (limit) states that can be defined in a building are: low damage, heavy damage, severe structural damage and loss of the building/collapse. The Engineering Demand Parameter (EDP) that measures the structural damage is the Inter-storey Drift Ratio (IDR), thus the IDR values are calculated for each damage level by using fragility curves. An even more accurate definition of limit states can be done according to the designers’ needs.
Structural Analysis
The structural analysis step consists in the calculation of Peak Ground Accelerations (PGAs) that cause the IDR values defined in the previous step. This correlation is defined through skeleton curves that are obtained from the Incremental Dynamic Analysis (IDA) of the FEMA-350 guidelines [
5], or simply from a standard pushover analysis. After performing this analysis to a structural system, the peak ground acceleration versus inter-story drift ratio can be defined for each damage state configuration.
Hazard Analysis
In the hazard analysis, the output of the structural analysis is used to estimate the probability of exceedance. In this regard, modern seismic codes provide the relation between the return periods (TR) and the peak ground accelerations (PGAs). For example, the Italian seismic code [
30] provides a set of values of peak ground accelerations for nine return periods (30, 50, 72, 101, 240, 201, 475, 975 and 2475 years) along with the interpolation formula for values in between:
where
is the PGA calculated for a defined damage state;
is the return period which corresponds to that state;
are the intermediary values of PGA taken from the seismic map; and
are the return periods corresponding to .
After determining
values from the previous step, the return period
can be defined for each damage state. Therefore, the probability of exceeding
in
n years is expressed from the following equation [
30]:
Cost Analysis
The total cost of the building
is the sum of the initial construction cost
I (
investment) and the expected total
loss (
L) over the project’s life cycle (Equation (
7)).
While the initial cost includes the expenses related to the initial establishment of the facility, the estimation of expected total loss is more complex and involves different stakeholder categories [
22]. More specifically, the contractor estimates in advance the time needed to repair the damages of each limit state. This information about time, needed for each limit state, is associated with the downtime loss. Downtime refers to the period of time in which the system fails to provide its primary function and therefore downtime loss expresses the amount of money that will be spent (lost) while the building is not used. Later, for each state, the structural engineer calculates the cost to repair the damages [
22]. Therefore, the expected loss
for each limit state
i is expressed in term of conditional probability in Equation (
8) as the sum of monetary loss (the amount of money needed to repair the damaged building) and downtime loss (the amount of money spent during the repairing actions, e.g., for rent, removal, etc.) (Equation (
9)).
2.4. STEP IV: Global Assessment Parameter of the SSD Method
The outputs of the previous phases are expressed in terms of different units of measurements: energy () for the Energy Performance Assessment, mass () of the equivalent carbon dioxide emissions for the Life Cycle Analysis and costs () for the Structural Performance Assessment. These quantities cannot be summed up to obtain a single global parameter, therefore outputs of the energy and environmental impact will be converted into monetary units (costs) as explained in the following. At this stage, all the financial issues related to discount costs and benefits over the time, to calculate the net present value, may be performed following common financial procedures.
2.4.1. Energy Performance into Monetary Unit
The calculated amount of energy corresponds to the energy consumed during the use phase and it is expressed usually in kilowatt-hour (
) or in cubic metres of natural gas (
gas) [
31]. The price for gas and electricity can be determined using the data of the Statistical Office of the European Union (Eurostat) [
32] for each member state or the average price of all the Union in the household or industrial category. Therefore, the total energy price
(€) can be calculated for a specific country or using the average price by the following equation:
where
2.4.2. Environmental Performance into Monetary Unit
Following the binding decisions laid down by the Paris Agreement [
14], several international, national and regional carbon pricing initiatives have been implemented. Other initiatives are scheduled for implementation and under consideration, such as Emissions Trading Systems (ETSs) or Carbon Taxes. A detailed review on this topic can be found in [
33]. The European approach to this problem can be taken as an example, without any loss of generality.
Currently, in Europe, there are only market prices for the carbon dioxide (CO
), therefore only the environmental impacts associated with the global warming potential (carbon footprint) can be converted into economic costs [
22]. Carbon footprint is defined as the total amount of
greenhouse gases (GHG) emissions caused by building life cycle phases, usually expressed in equivalent tonnes of carbon dioxide (CO
). The embodied energy includes the energy consumed by processes associated with the production, use and demolition of the building; it is usually expressed in megajoule (
), kilowatt-hour (
) or cubic metres of natural gas (
gas) [
31]. The conversion of the results into monetary unit can be done following the EU directives. The carbon dioxide price per tonne is linked with the
European Union Emissions Trading System (EU ETS). According to the EU ETS, each member state agrees on a maximum national emission limit that should be approved by the European Commission. Then, the EU countries allocate allowance values to their industrial operators, who are able to buy or sell such allowances named
European Emission Allowances (EUA) [
34]. The total number of permits issued, either auctioned or allocated, defines the price per carbon, which is therefore determined by stock exchange rules. Considering the carbon prices deriving from EU ETS, the monetary cost of the environmental impact referring carbon footprint
can be expressed as follows:
where
2.4.3. Equation of the Global Assessment Parameter
After converting environmental impacts into monetary unit, the
Global Assessment Parameter of the Sustainable Structural Design method can be expressed as the total sum of environmental and structural impact as follows:
2.4.4. Significance of the Global Assessment Parameter
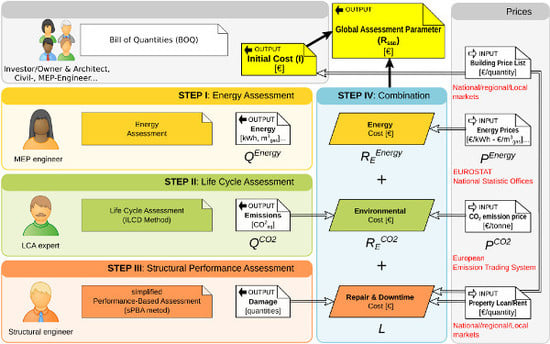
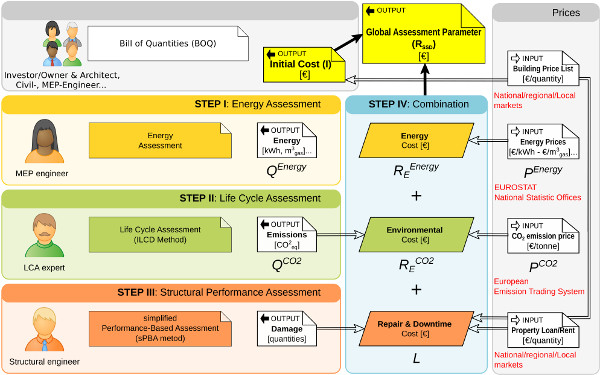
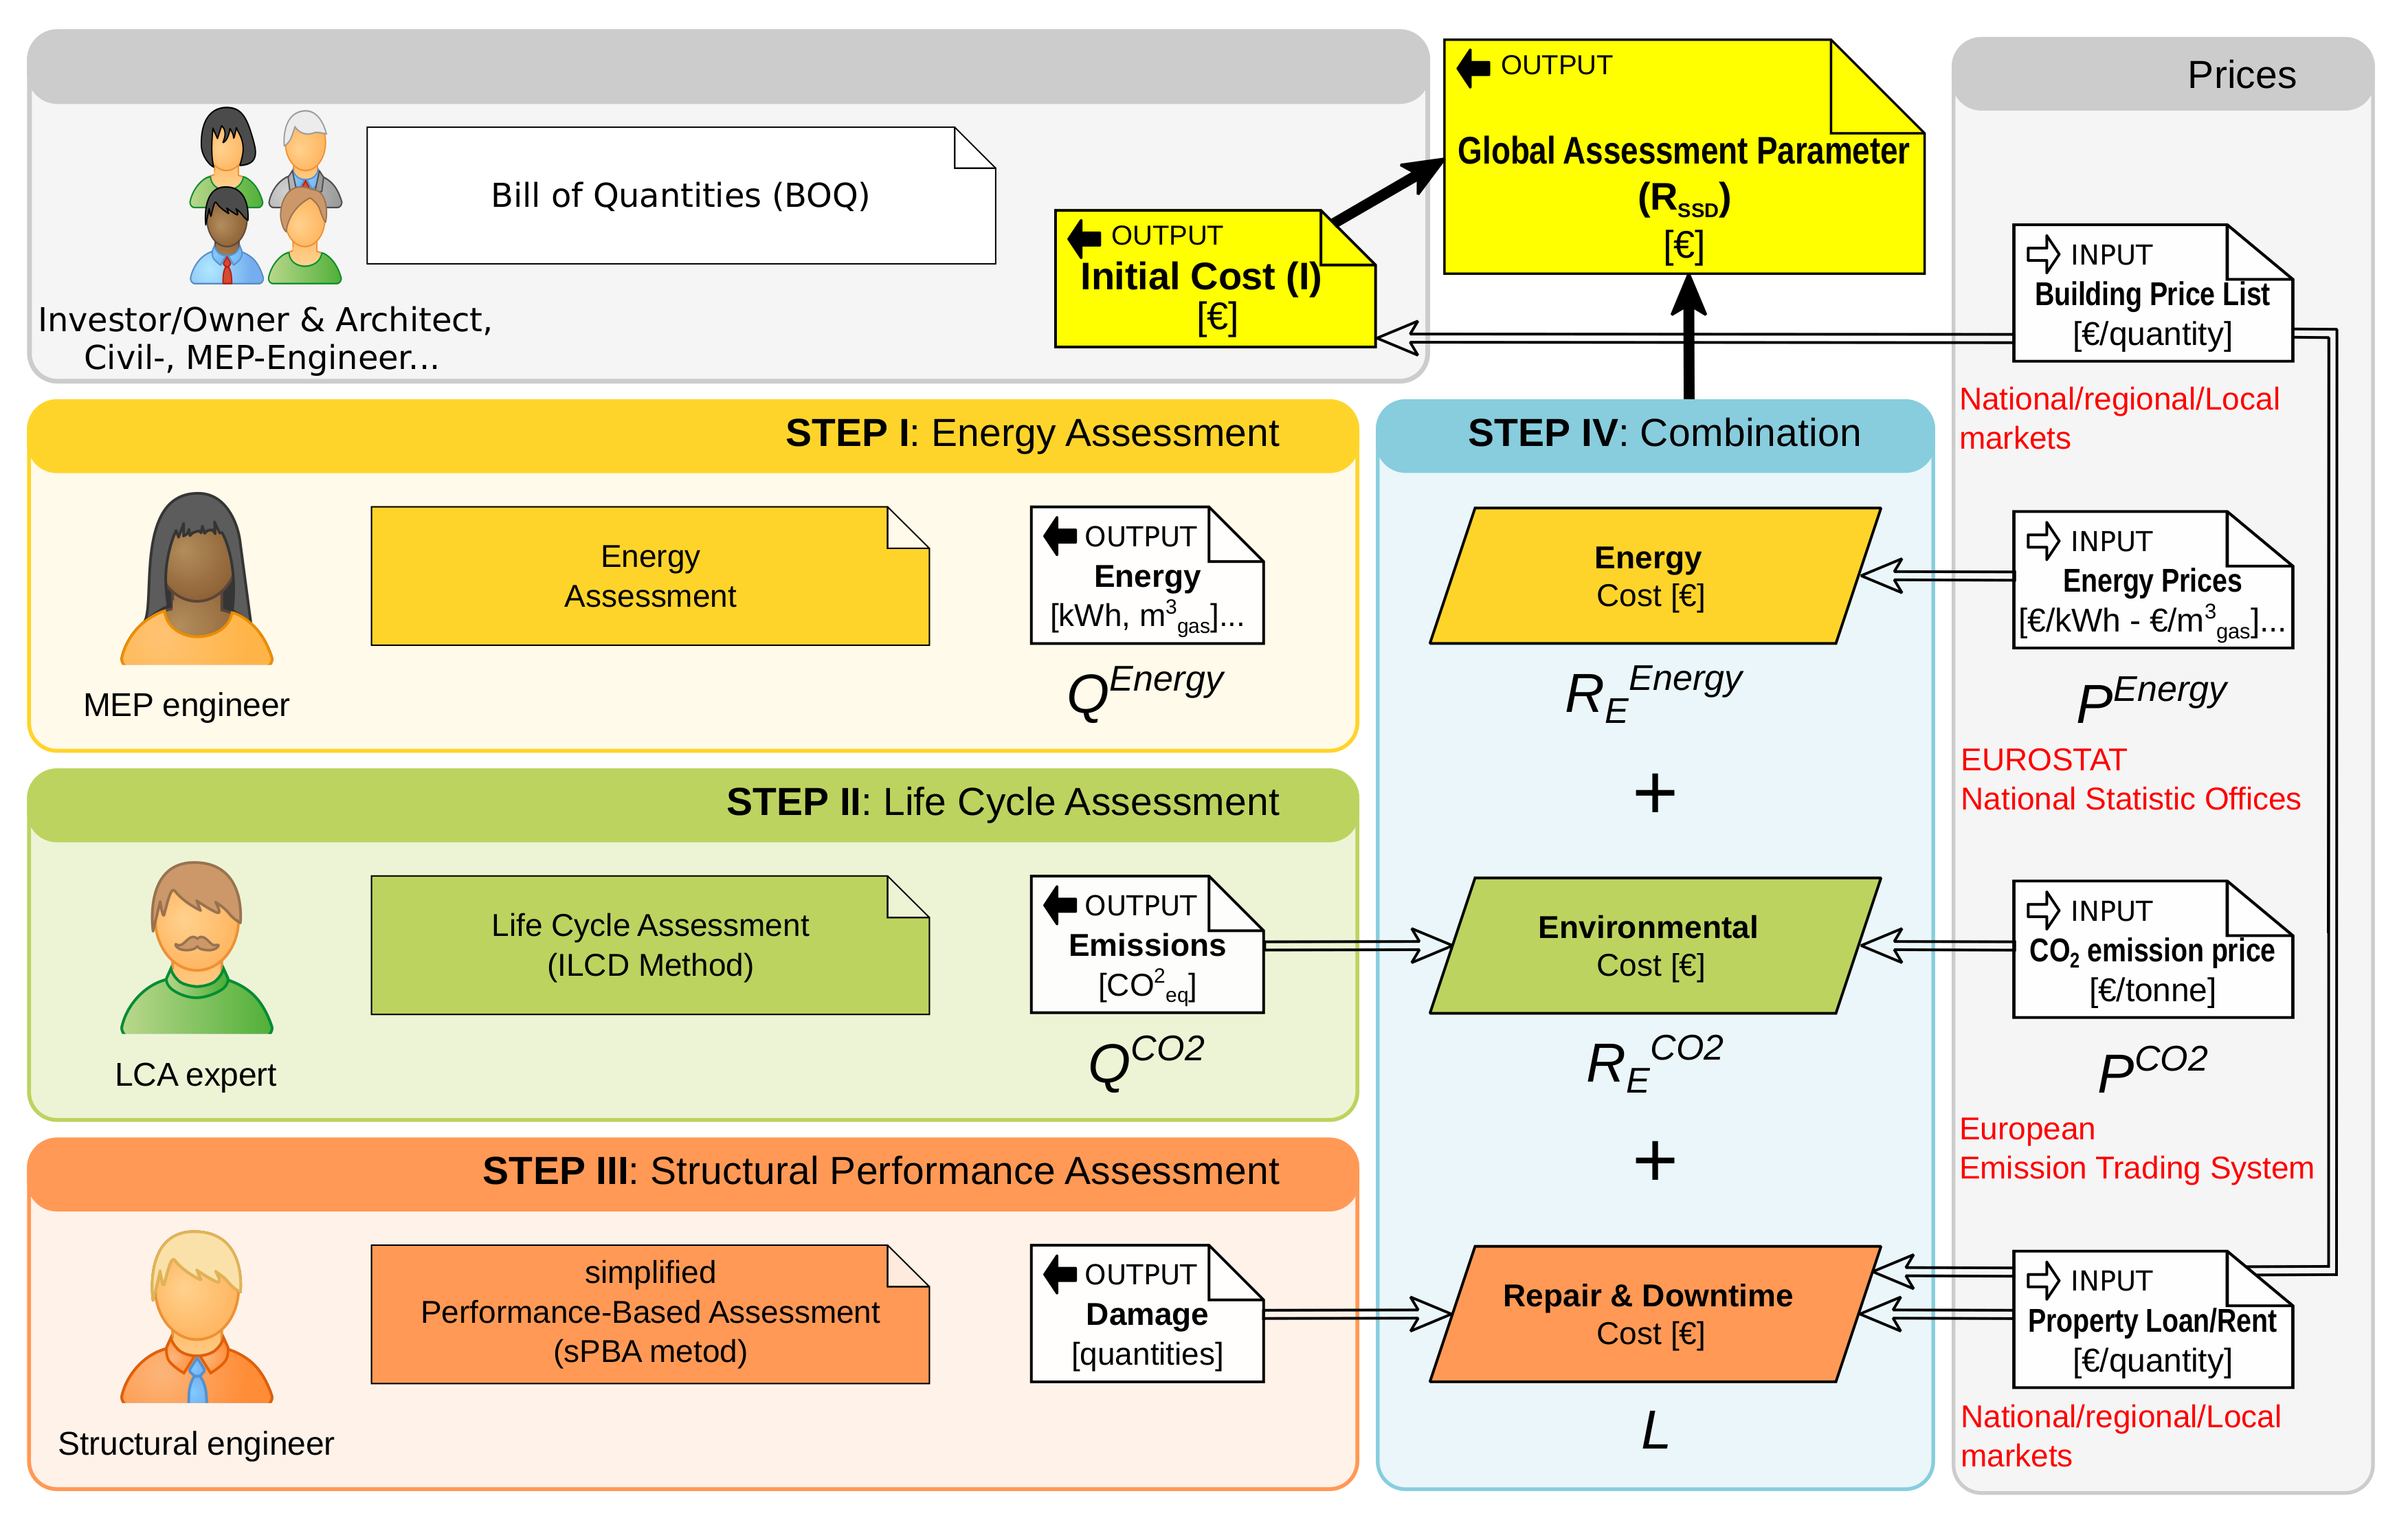
The breakdown of SSD method, as represented in
Figure 4, points out that the proposed method supports the traditional design process and does not replace it. The traditional actors of the design phase (Architects, as well as Civil, MEP and Structural engineers) are assisted by additional practitioners, namely the LCA experts. Each outcome is expressed in terms of the same monetary units, therefore, decision makers can compare and evaluate all parameters, which are independently regulated by their respective markets.
The sources that fix the different prices, written in red in the
Figure 4, are included as a sample for the European and Italian market, in which the forthcoming example will be developed. Replacement with other data shall not affect the general application of the method.
The Global Assessment Parameter, which is the main outcome of the procedure, represents a direct evolution of the more traditional process, based on the (initial) price of the building, which indeed represents the greater part of
. The procedure is scalable to be extended to other processes: building renovation or retrofitting, even to compare different solutions including demolition; infrastructure projects, etc.; for this purpose, it remains open to include other risk assessments, such as fire, wind, floods, etc. A comparison among several solutions to repair damages due to natural hazards, even calculating the environmental burden, is given in [
35].
3. Example of Application
The SSD method was applied to a three-storey building of commercial (office) occupancy. Two different structural systems for the building were conceived. Firstly, it was designed as a precast reinforced concrete structure and afterwards to its equivalent cast-in-situ to find the best solution in terms of environmental and structural aspects. The goal of this example is not to show the benefit of the best solution, but the feasibility and the ease of use of the method itself. Similar examples could compare two refurbishment alternatives or assess the refurbishment vs. demolition and reconstruction.
According to the aim of this LC analysis, the functional unit is a whole office building having the same energy and structural performances. Since the comparison should evaluate two alternative technical systems, namely precast and cast-in-situ structures, the system boundaries shall include all the parts to be compared, excluding all the elements which are the same in both the evaluated systems. Therefore, all the structural parts are included in the analysis, together with internal and external partition walls, which are not structural, but typical of each building technology. All non-structural parts, which are the same in both cases, are excluded (but the walls): flooring and finishes, windows and shutters, plants and equipments. In the same manner, the end-of-life scenarios are the same in both cases. Further environmental impacts in the life cycle could be generated by a second order effect: the repair of damages caused by natural hazards. For sake of simplicity, these are disregarded in the present example.
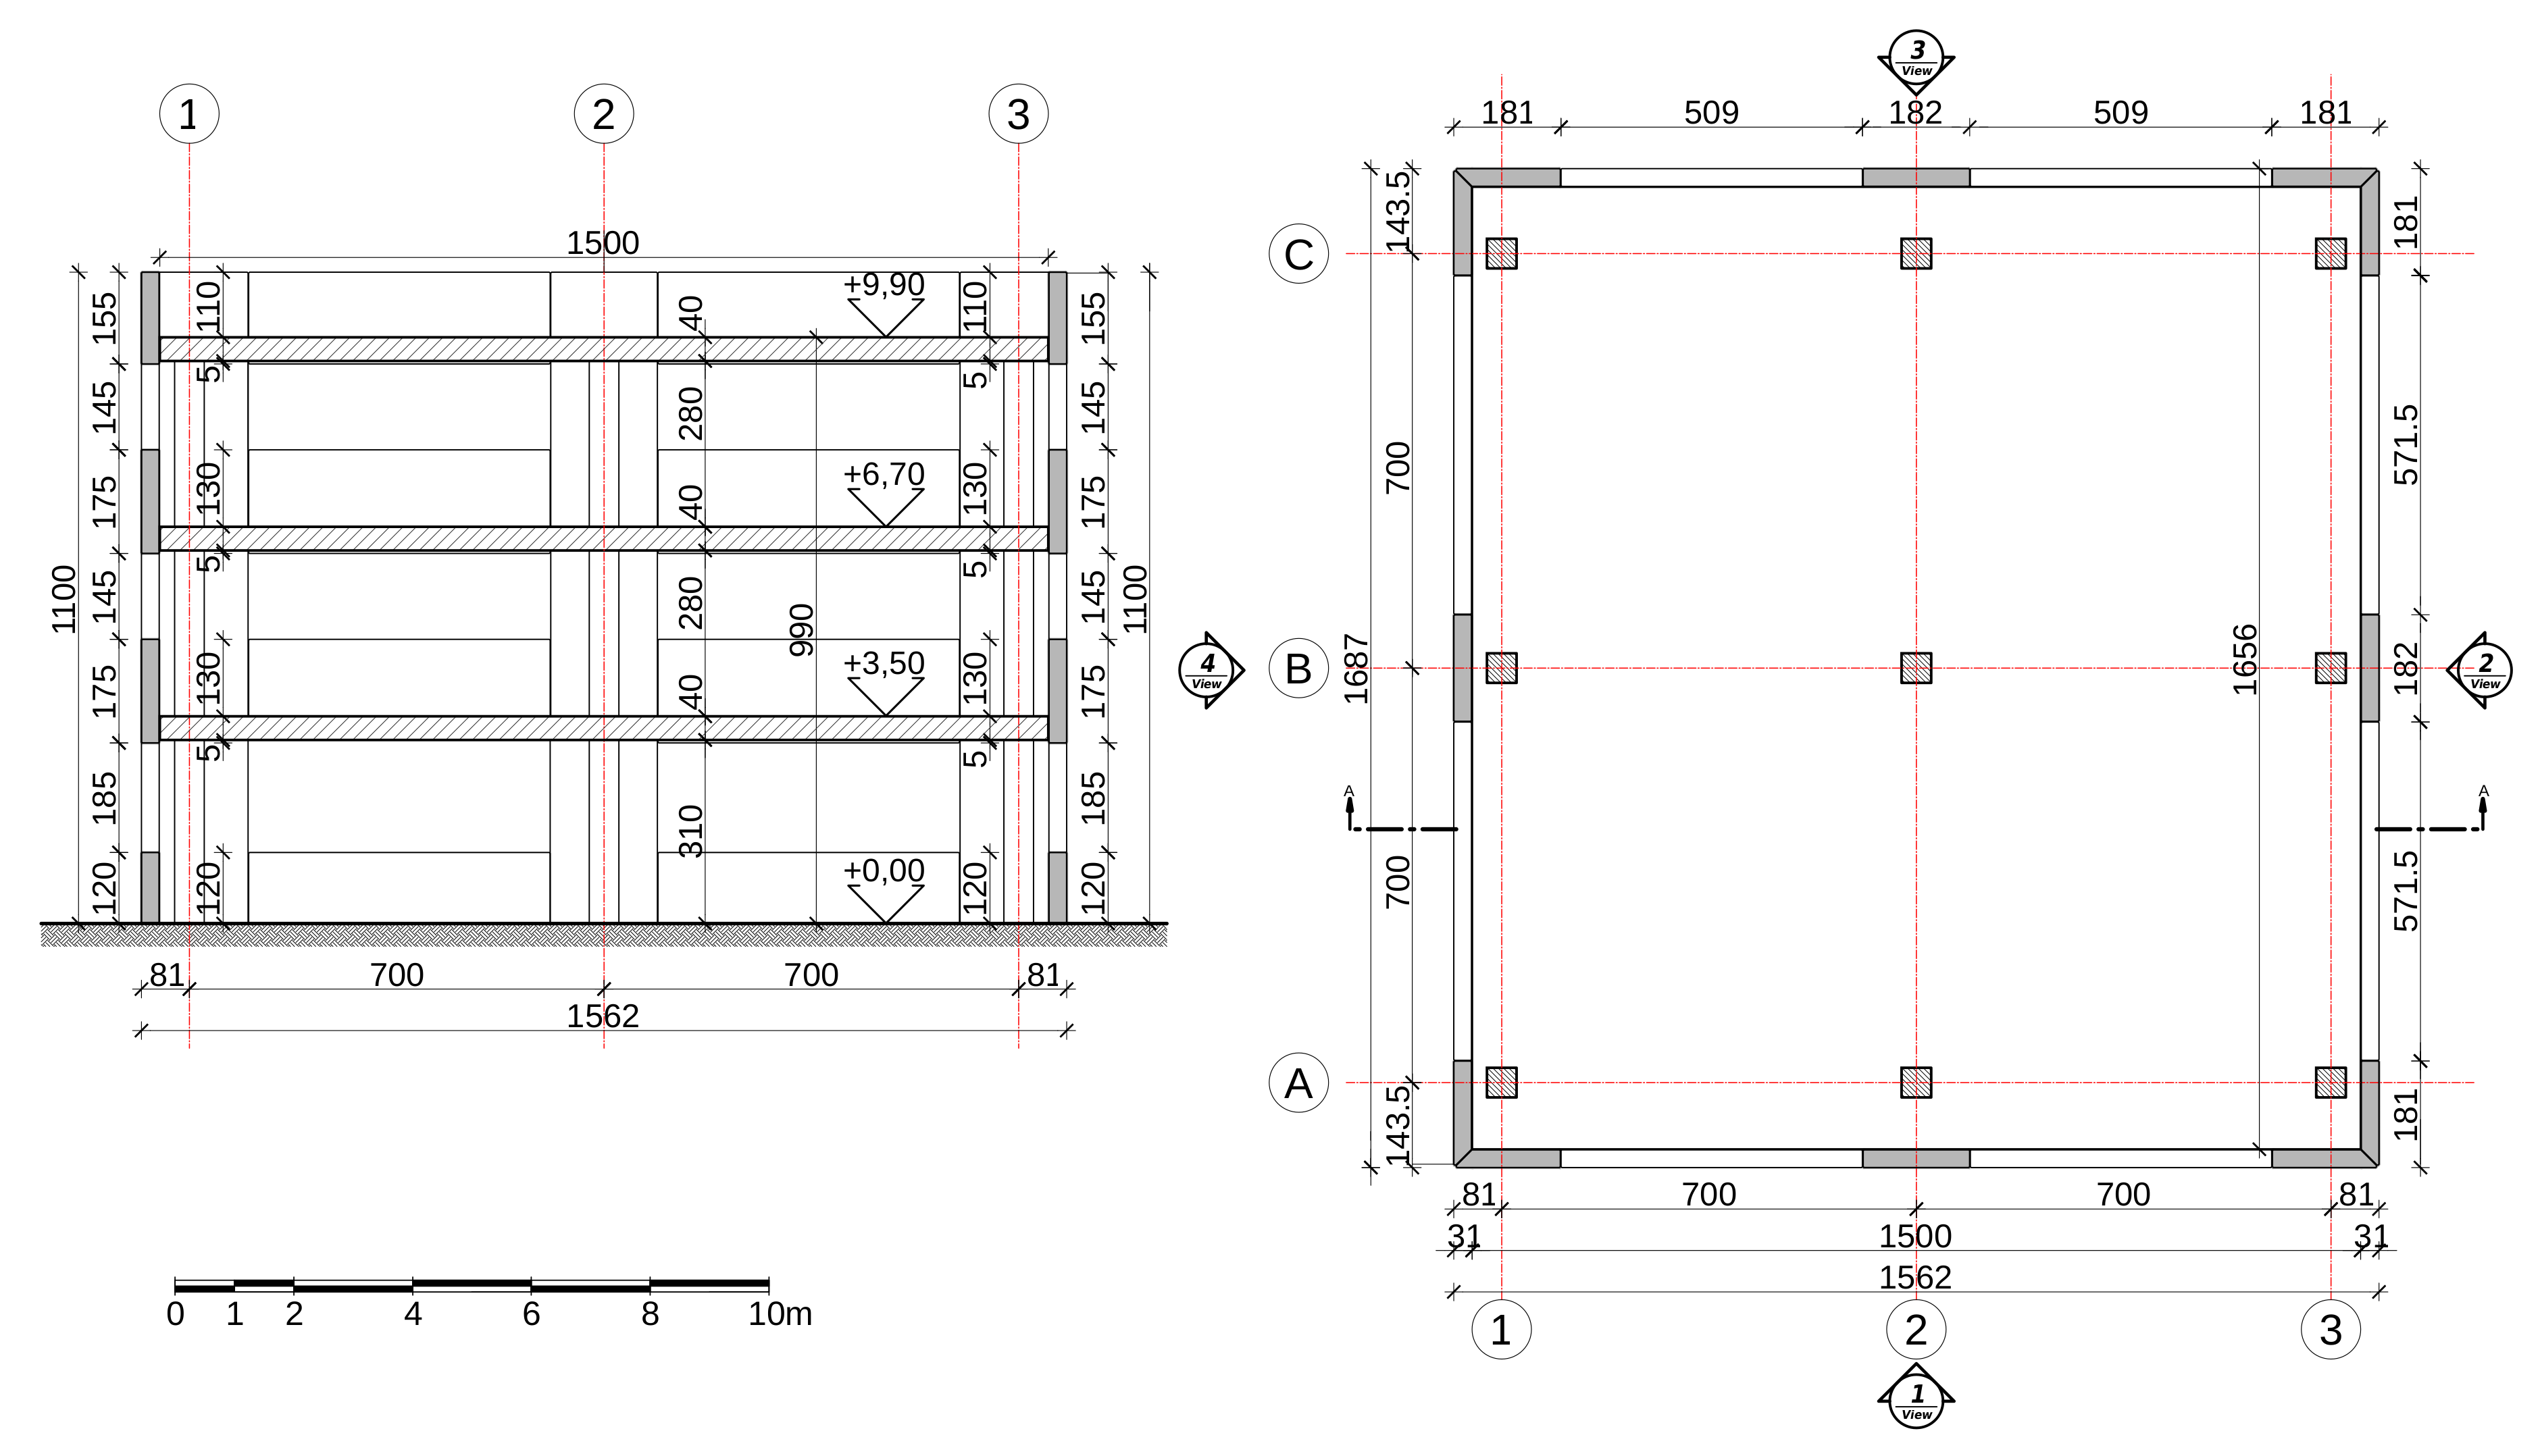
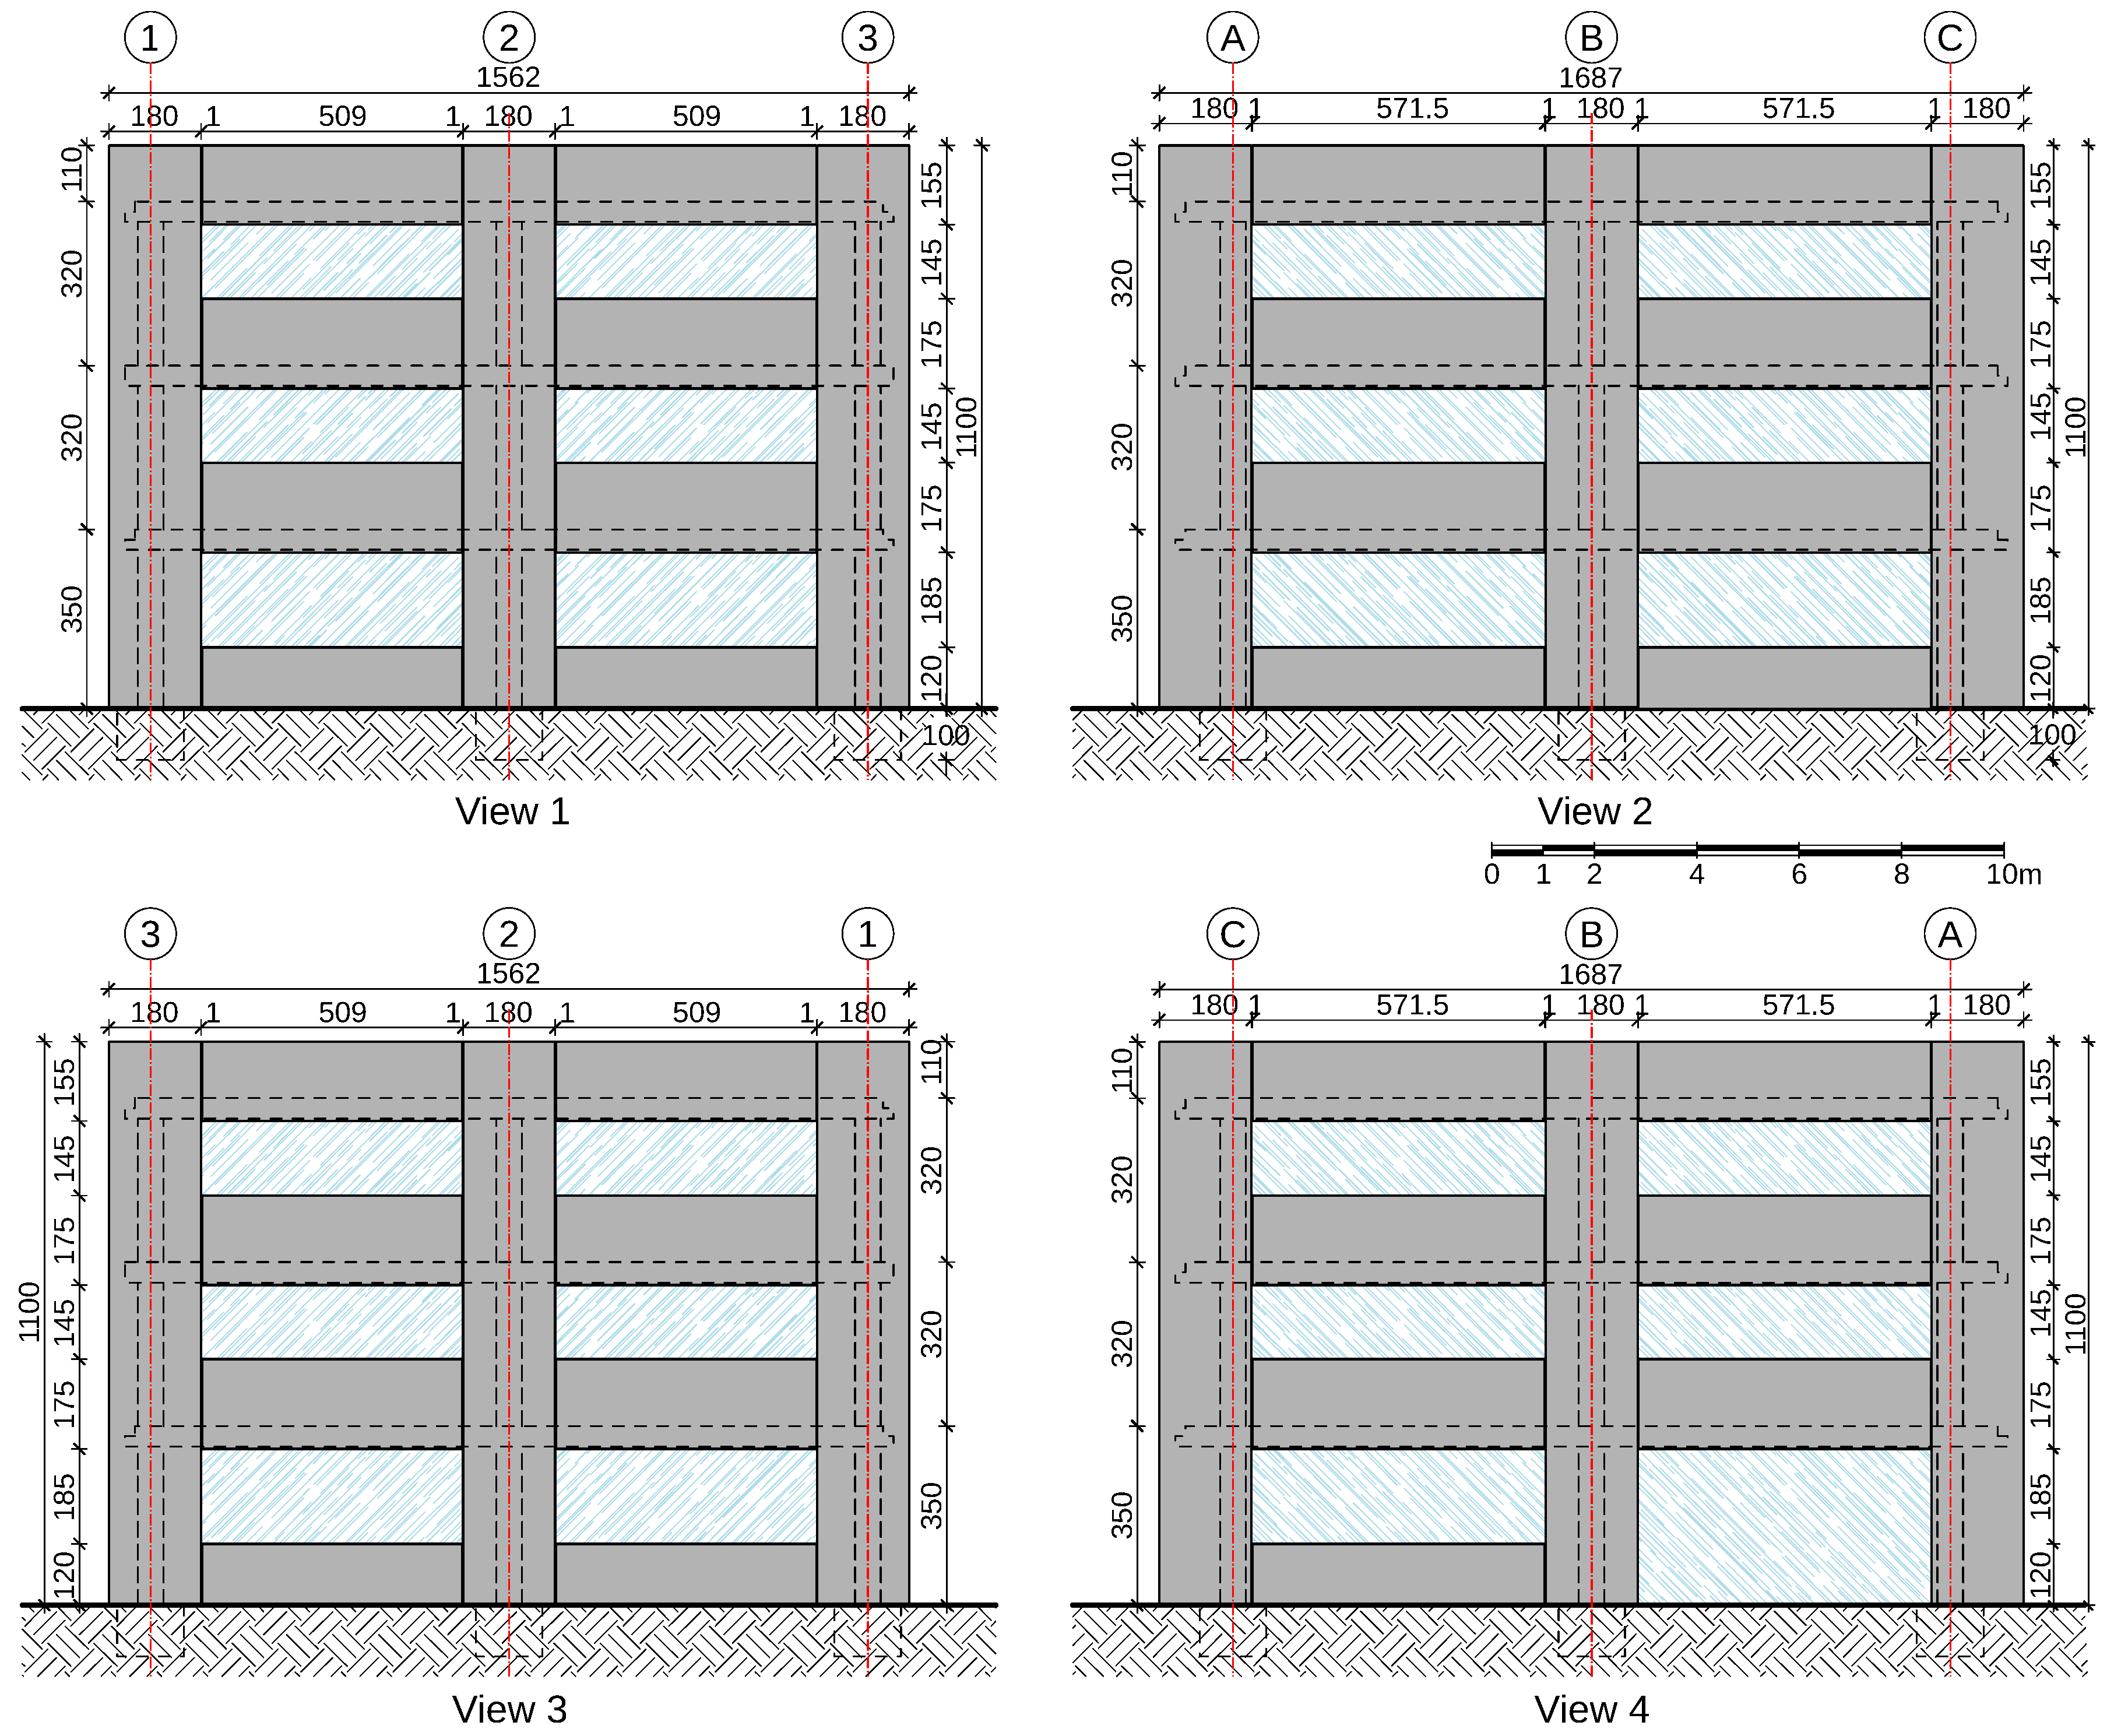
3.1. Description of the Building
The building is 15.62 m × 16.87 m in plan with two
spans in both directions (
Figure 5). The total height of the structure is
with floor heights equal to
for the first floor and
for both second and third floor. Both precast and its equivalent cast-in-situ structures were designed according to
Eurocode 8 [
36] prescriptions to withstand the same vertical and horizontal load. The location of the building is considered in the Comune di Barcis (PN) in the region Friuli-Venezia Giulia (Italy). Seismicity data are taken from the seismic map of Italy [
30] that corresponds to a peak ground acceleration of 0.251 g for a 475 years return period. The material properties and loads acting on both structures are shown in
Table 2.
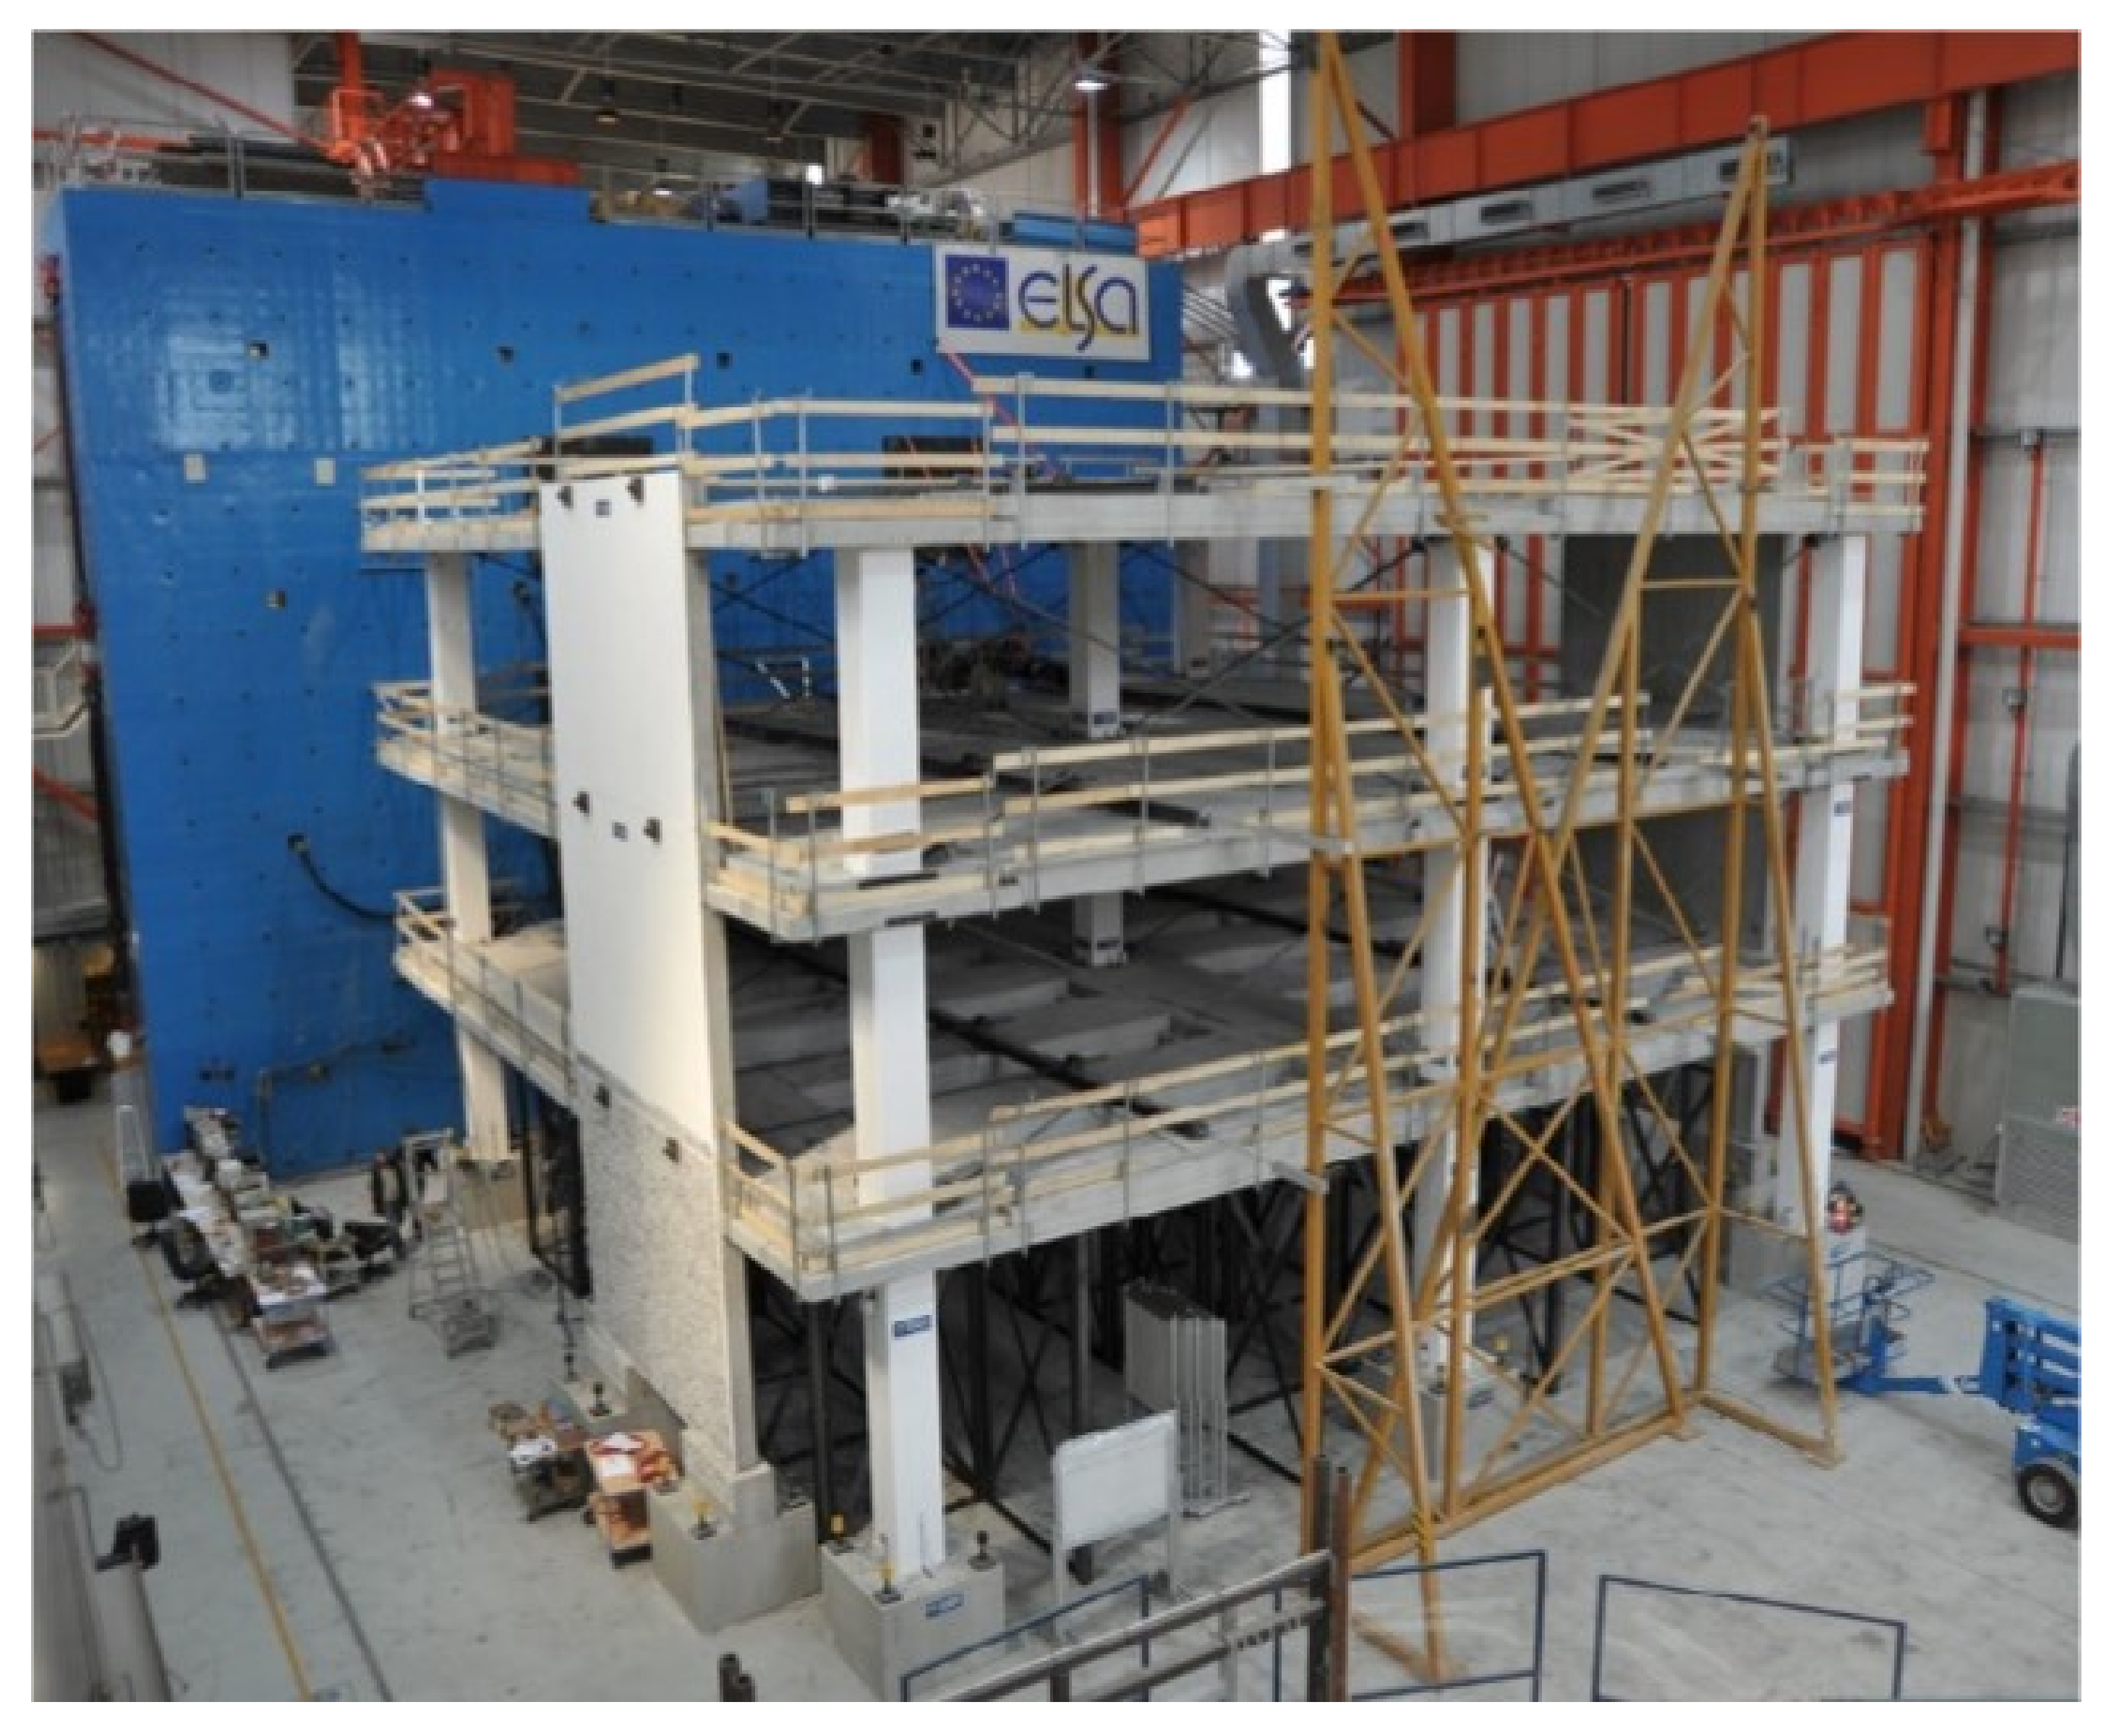
3.1.1. Precast Structure
The first structure is a precast reinforced concrete building that was mocked up and tested at the European Laboratory of Structural Assessment (ELSA) of European Commission’s Joint Research Centre (JRC) in Ispra, Italy as part of the SAFECAST project [
37]. The external façade is also conceived as a precast solution with concrete panels attached to the structure. An overview of the experimental set up is shown in
Figure 6.
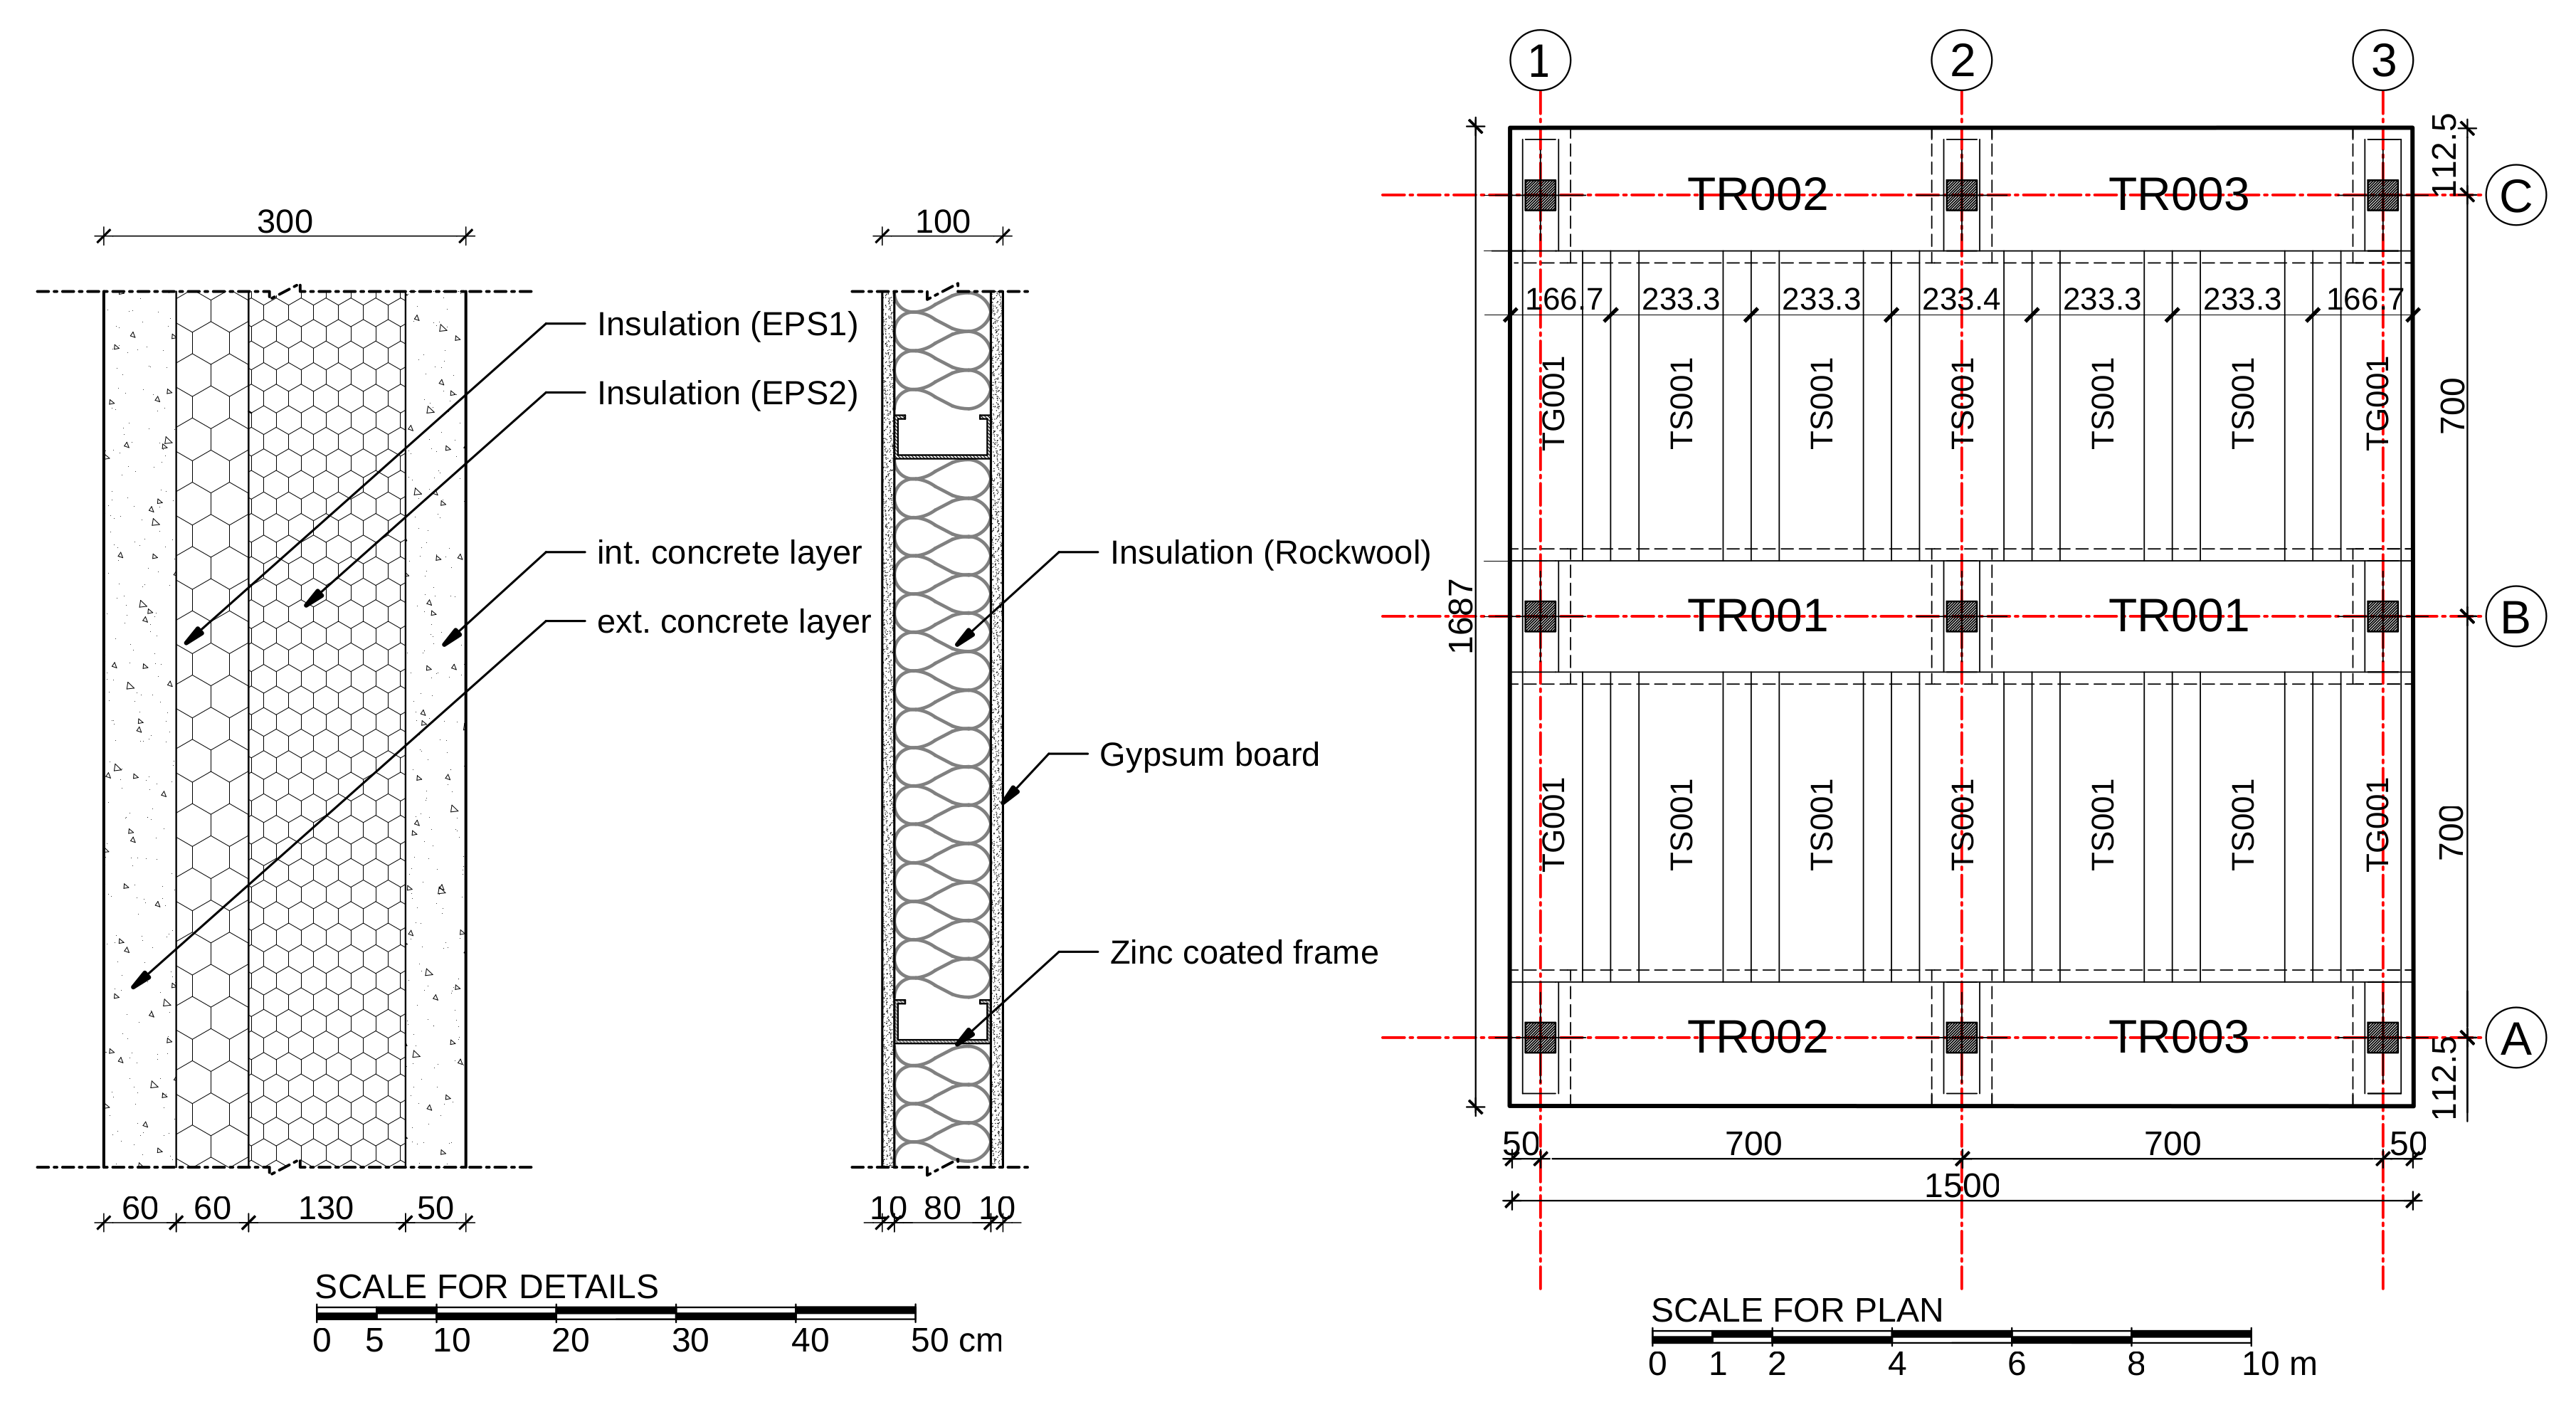
The structure represents the most common connection system in the European precast construction practice with hinged beam-column connections. The skeleton has dimensions in plan 15.00 m × 16.25 m with precast panels of thickness
m attached to the perimeter. The cross section of the columns is 0.5 m × 0.5 m and, in correspondence to the storeys, they have a capital (corbel) with maximum width of
m, on which the hinged beam-column connection is realised. The beams are box elements with maximum width of
m and prefabricated floor systems have been used
Figure 7. The prefabricated concrete panels of the external façade are selected from the manual “Pannelli prefabbricati in calcestruzzo–Linee Guida” (Precast concrete panels–Guidelines) of the Italian association of precast producers (ASSOBETON) [
38].
A detailed view of the precast cladding system is given in
Figure 8. According to the Italian climatic map, the building is situated in zone F, which corresponds to a minimum thermal transmittance U =
W/m
2K [
39]. Therefore, the selected panel is the type 2 with thermal transmittance U =
W/m
2K and cross-section shown in
Figure 7. The division of the compartments inside the floor is considered with partition walls of double gypsum board of 10 mm and acoustic insulation of rock wool in between
Figure 7.
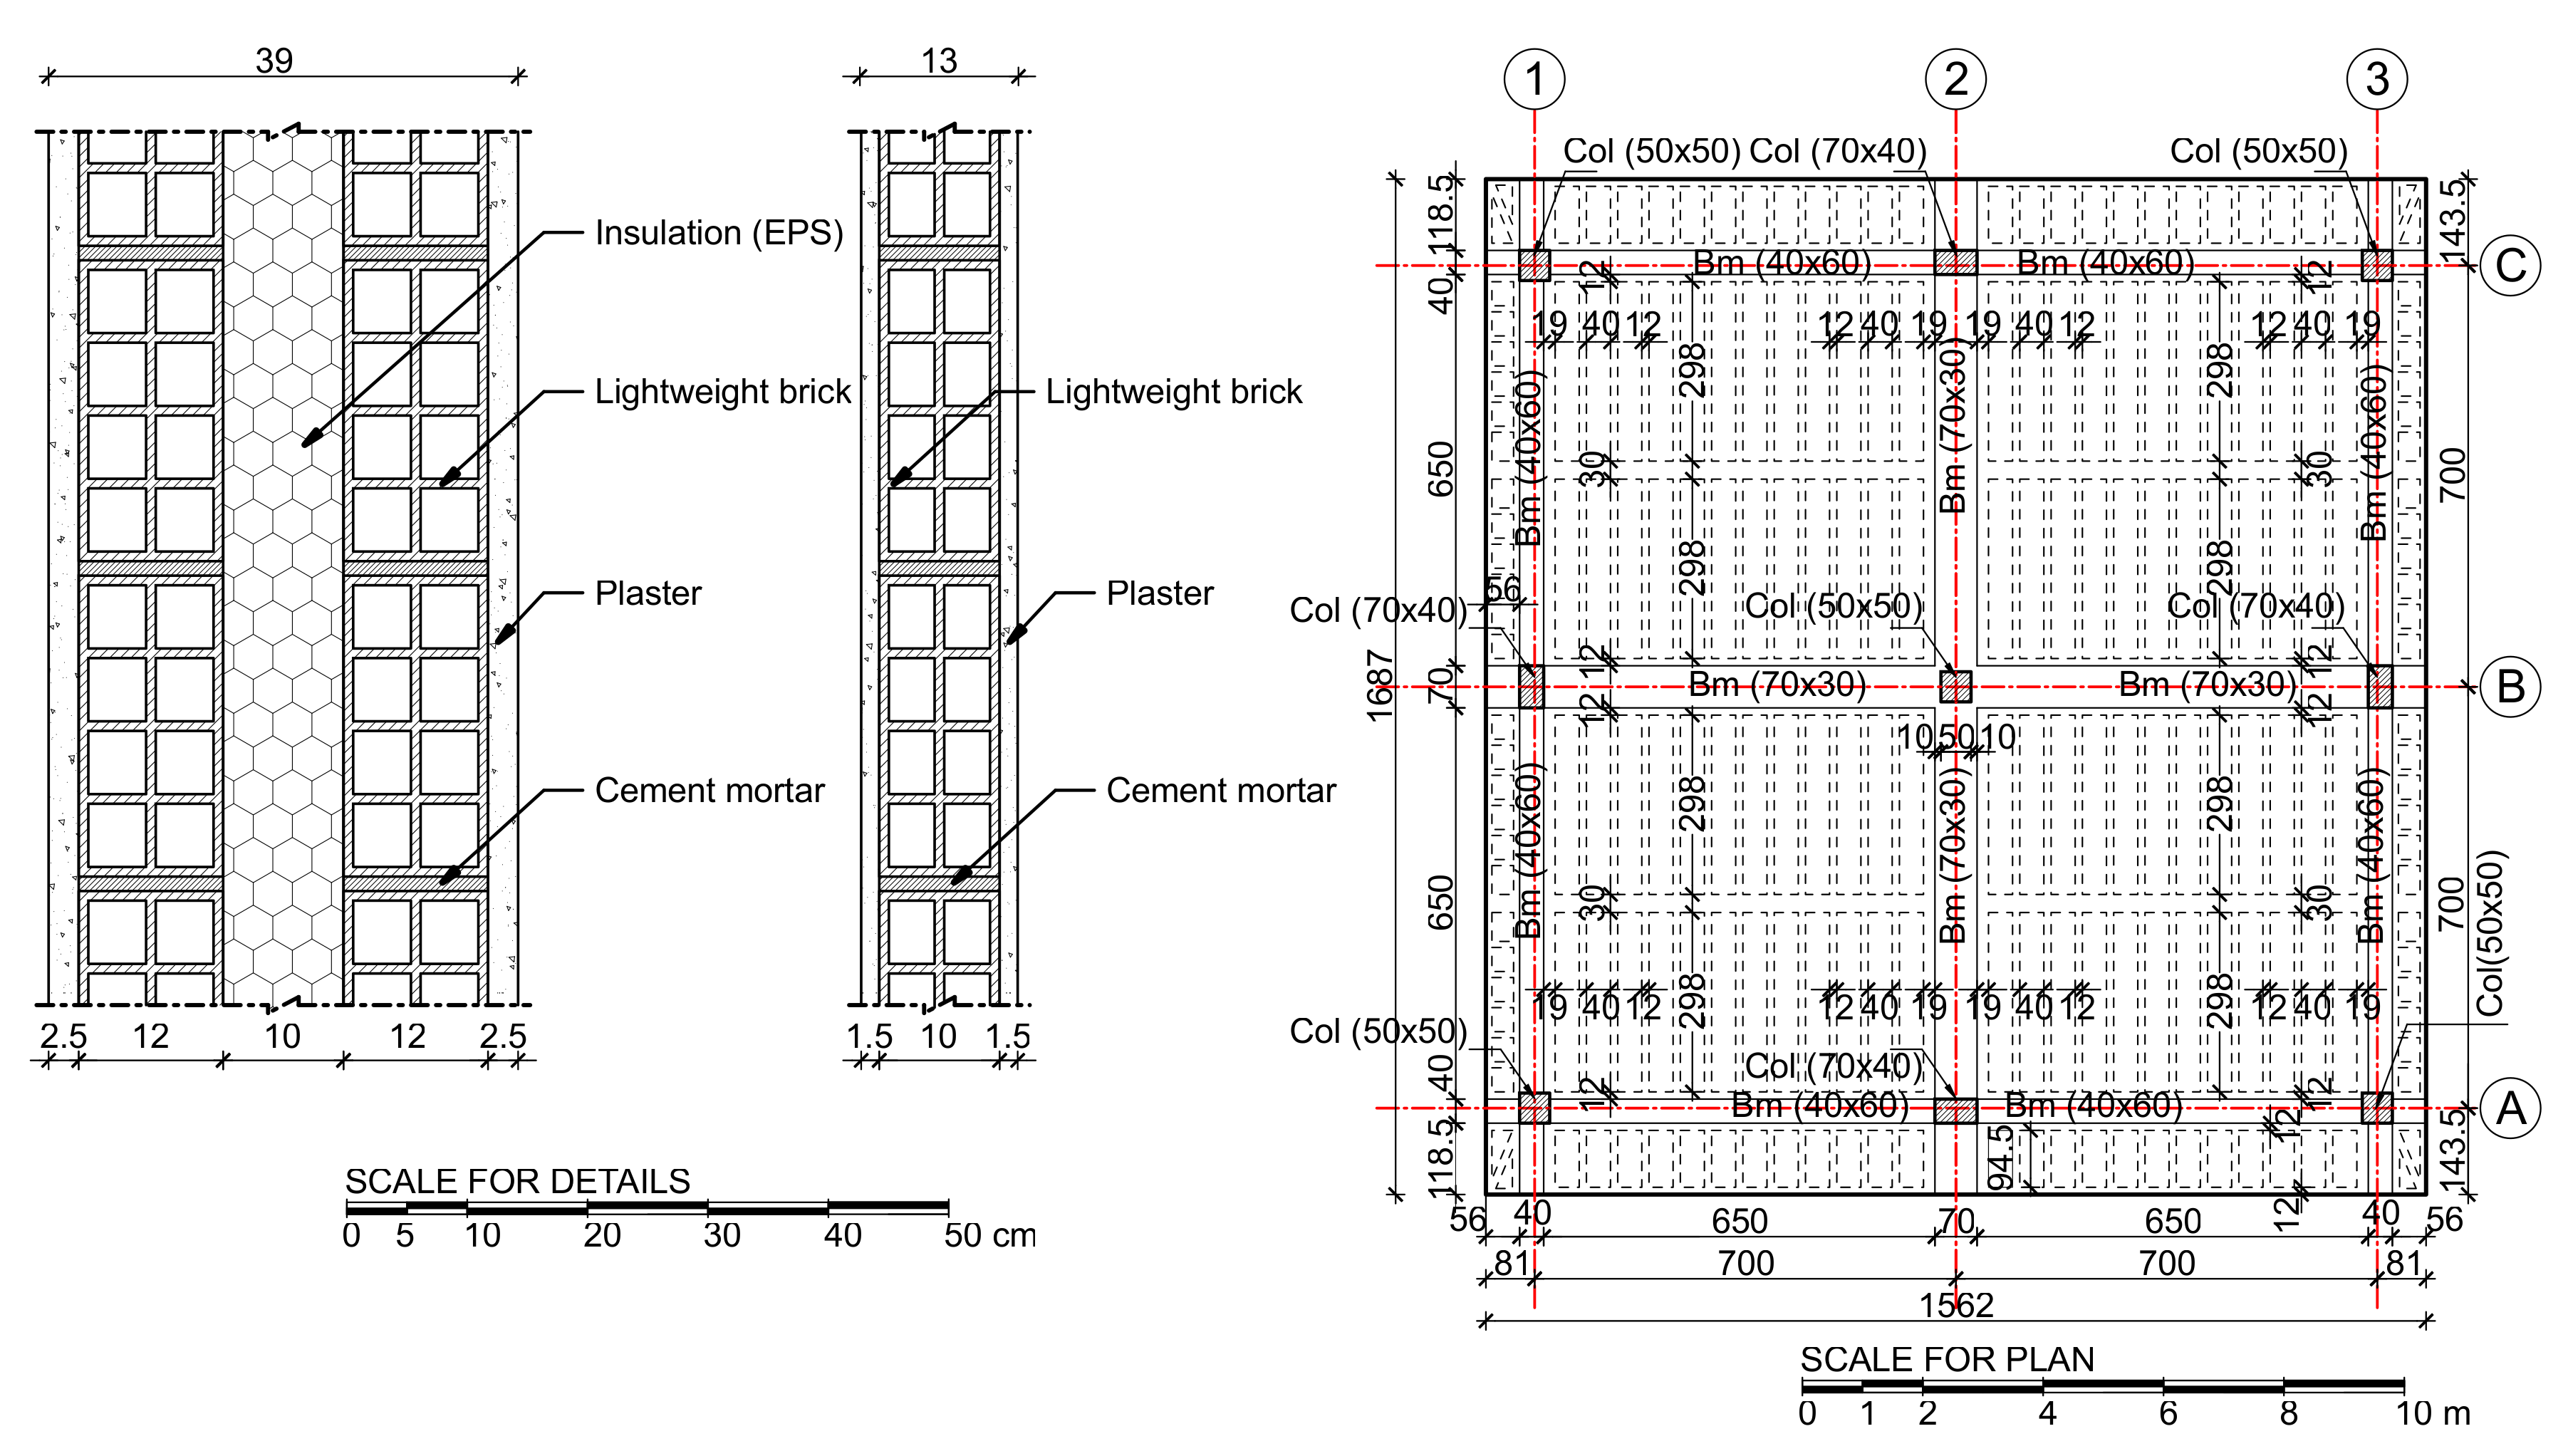
3.1.2. Cast-In-Situ Structure
The cast-in-situ structure was designed with the same loads and dimensions as the precast structure using professional software SAP2000 [
40]. According to the analysis, the structural plan of the cast-in-situ structure is given in
Figure 9. The central and corner columns have dimensions 0.5 m × 0.5 m while the other ones are 0.7 m × 0.4 m. The beams dimensions are 0.7 m × 0.3 m for the internal frames and 0.4 m × 0.6 m for the external ones. The slab is designed as continuous ribbed slab with total height
and thickness of topping 50 mm. The width of the ribs is 120 mm while their axial distance is
. The distance between the ribs is filled with expanded polystyrene (EPS) to have similar slab self-weight as the precast structure (self-weight of the ribbed slab is
kN/m
2 while self-weight of the precast slab is
kN/m
2).
The walling system of the cast-in-situ structure is made of masonry brickwork. The external walls are composed of two parallel lightweight brick walls with thickness of 120 mm each and 100 mm of insulation (EPS) in between. On both sides of the walls, 25 mm of plaster is applied making the thermal transmittance of the wall configuration U =
W/m
2K. The internal divisions are also made of lightweight brick walls of thickness 100 mm with two plaster layers of 15 mm applied on both sides. The cross sections of the external and internal walls for cast-in-situ structure are shown in
Figure 9.
3.2. STEP I: Energy Performance Assessment
The first step consists in the calculation of the energy () needed during the operation phase of the building, i.e., the amount of energy needed for heating, ventilation and air conditioning systems (HVAC); lighting; domestic appliances; etc. This value of energy () is assumed the same in both typologies as the external walls and windows are selected with similar thermal transmittance. The operational energy is calculated in terms of electricity and gas (as the most used sources of energy in Italian HVAC systems) consumed during the entire life of the building by using an average value for office occupancy structures.
3.2.1. Electricity Consumption
The annual electric energy consumed for office occupancy buildings per square meter in the climatic zone F is 52
/
2 year, as reported by Italian Agency for New Technologies, Energy and Sustainable Economic Development (ENEA) [
41]. The total consumption of electricity in 50 years of building LC is:
The conversion of the electricity into monetary unit is done by using the Eurostat data [
32]. According to them, the price of electricity for industrial sector in Italy for the year 2014 is
€/
. Therefore, the cost of electric energy during the operation phase for both typologies is:
3.2.2. Heating Consumption
The report also indicates the annual quantity of electricity or natural gas consumed for heating in office buildings situated in climatic zone F:
/
2 year, or
3/
2 year. Total electricity consumption for all purposes (
/
2 year) is very similar to the European average specific energy consumption in the non-residential sector given by Buildings Performance Institute Europe (BPIE): 280
/
2 year [
2]. In this application, the source of energy used for heating purposes is chosen as natural gas. Therefore, the total gas consumption of the building in 50 years is:
With regard to natural gas consumption, the price in Italy for industrial sector according to Eurostat [
32] is
€/
3. Therefore, the gas price during the operation phase is:
Hence, the total energy assessment in monetary unit is: .
3.3. STEP II: Life Cycle Assessment
The Life Cycle Assessment of the two building solutions has been carried out in a cradle-to-grave approach. The analyses have been performed for the structural and walling systems as the only components of the buildings that are different in both configurations. Other building elements, such as windows, flooring tiles, installations, etc., are considered the same in both buildings so they do not influence the comparison result. The Life Cycle Assessment results for construction, use and demolition phase have been carried out with the help of the software SimaPro [
42]. The software includes several inventory libraries and databases that makes it a very practical tool for measuring the environmental impacts of products and services during all life cycle stages. The analysis has been performed in accordance with internationally recognised guidelines of ILCD Handbook “General guide for Life Cycle Assessment—Detailed guidance” [
43] and requirement of standards ISO 14040:2006 [
16] and ISO 14044:2006 [
17]. The selected methodology for assessing the carbon footprints of the two buildings is IPCC 2007 [
44]. This method is developed by the International Panel on Climate Change (IPCC) and it is characterised by a system of equivalent factors to weight the influence of various greenhouse gases, using the amount of CO
as reference. It lists the Global Warming Potential (GWP) of well-mixed greenhouse gases commonly for time horizon of 20, 100 and 500 years. GWP depends on the timespan over which the potential is calculated as the gas concentration decays over time in the atmosphere. In this study, the results have been carried out for the timeframe of 100 years, as the most recommended time horizon for such analyses.
The system boundaries include construction phase (including extraction, manufacture and transport of materials), operation phase and end-of-life phase via disposal of all the material to landfill. For determining the environmental impact of construction phases, a material inventory of the materials/services that are different for both structures is done. The carbon footprint of the elements that are the same in both buildings is omitted. A distance of 50 km to the construction site was taken into account for the construction materials. The same distance was considered between the construction site and the landfill plant. The quantity of materials/services for both structures and their respective embodied emissions expressed in equivalent tonnes of CO
for each phase are given in
Table 3 and
Table 4. It should be noted that the embodied energy and the associated emissions of the similar complementary elements (windows, tiles, etc.) are not taken into account.
Table 5 shows the carbon emissions during the use phase of the two cases. The operational emissions correspond only to the total energy calculated in the first step neglecting the emissions from any maintenance or repair work during the lifetime of the buildings in both cases.
As it can be seen from the charts in
Figure 10 and
Table 6, the building’s operational phase is responsible for the majority of the total greenhouse gas emissions. The operational energy is used mainly for lighting, heating, cooling, ventilation and appliances, therefore lowering the energy consumption during the building’s operation life would have the biggest impact upon environmental assessment. This conclusion is in the same line of thinking with European studies for constructing new buildings or renovating the existing ones with high standards of efficiency in order to demonstrate actions against climate change and improve the quality of life [
2].
Diagrams in
Figure 10 show the environmental impact of the different components of the buildings during the construction and end-of-life phases. As can be seen, the greenhouse gas emissions of the cast-in-situ building are approximately 20% higher than the emissions of precast one with the structural skeleton being responsible for majority of them.
3.4. Simplified Performance-Based Assessment
The first step of the sPBA method is the evaluation of the initial construction cost for each design solution. The unit price for each material is taken from the price list manual of construction works issued by Commerce Chamber of Milano [
45]. The prices of other components of the buildings, which are the same in both typologies (windows, tiles, installations, etc.), are defined with a simplified price approach per square metre. Afterwards, the second step of the method is the definition of limit states and the evaluation of expected losses that may occur over the life span of the buildings for each state.
Four limit states are defined with different situations of damage as follows.
Low damage: The damage begins for non-structural elements. The first non-structural elements that face damage are considered the external walls parallel to seismic direction including windows in the story with maximum IDR. Repair cost includes the cost of demolition and construction of these walls and replacement of the windows. The definition of this state is done based on the following deformation limitations according to Eurocode 8 (Maximum IDR due to the frequent earthquake):
0.5% for brittle non-structural elements attached to the structure (e.g., brick walls);
0.75% for ductile non-structural elements attached to the structure (e.g., concrete panels); and
1.0% for non-structural elements not interfering with the structure (e.g., glass façade).
Heavy damage: Damage of all non-structural elements. All non-structural elements (walls and windows) are damaged and they need repair works whilst the structure does not need intervention. Damage cost includes demolition and reconstruction of all walls and replacement of the windows. This limit state is considered to occur when the maximum IDR reaches twice the deformation limitation value.
Severe damage: No-collapse requirement. All non-structural elements need to be replaced (limit state 2) and structural beams of first floor parallel to the seismic direction need retrofit due to the creation of plastic hinges. According to Eurocode 8, no-collapse requirement for ordinary structures is met for a reference seismic action with 10% probability of exceedance in 50 years (recommended value), i.e., with 475-year return period. The damage cost of this state includes the cost of the previous step and the retrofit cost for the damaged beams. No discontinuity of activity in the building is considered.
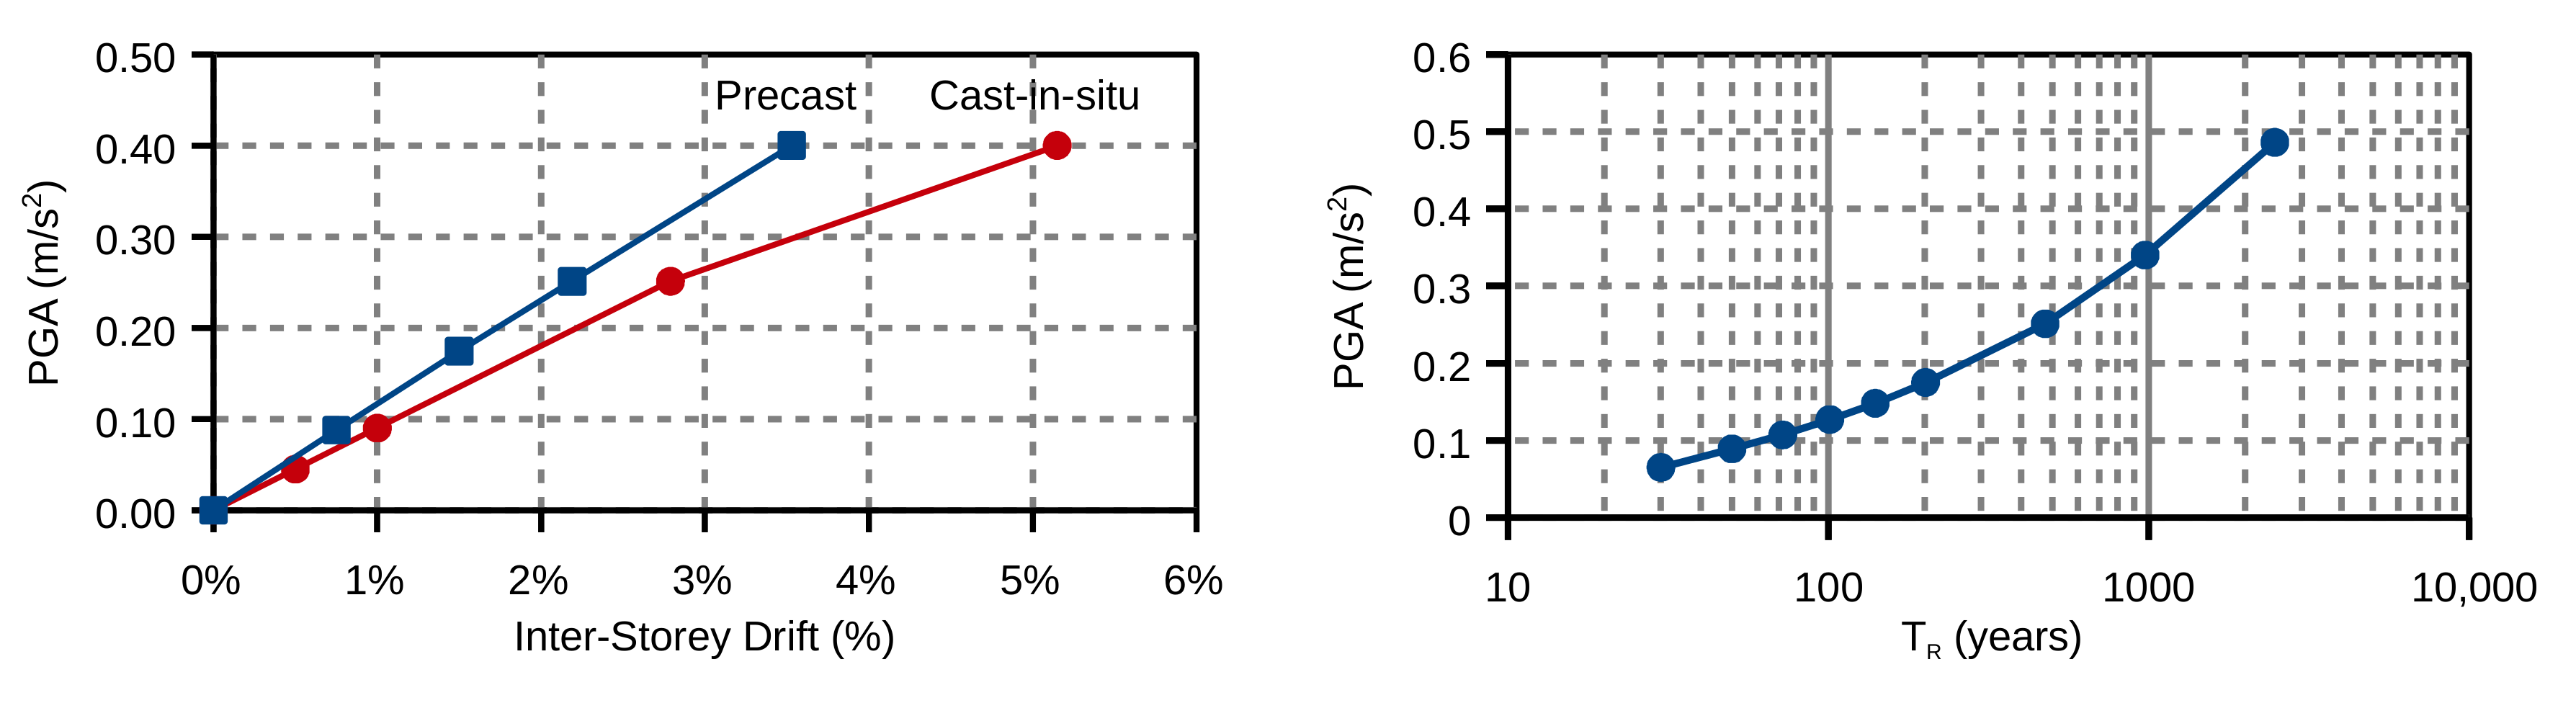
Near Collapse (NC) Limit State: Prevention of global collapse under a very rare event (1500–2000-year return period). This state corresponds to the full exploitation of the deformation capacity of structural elements. According to Eurocode 8, this design verification is needed to reduce the uncertainty and promote a good behaviour of the structure, even under earthquakes more severe than the design seismic action. The total damage cost of this limit state includes the cost of demolition, the reconstruction of new building and the payment of day-off for the time of construction, which is estimated in 12 months. For the precast structure, the relationship between PGA and IDR values is determined using skeleton curves deriving from laboratory tests [
46]. On the other hand, for the cast-in-situ structure, the relationship is obtained by running a pushover analysis in the software SAP2000 [
40], with lumped plasticity beam elements and using an inverted triangular force distribution, typically assumed in seismic analysis and design.
Figure 11 (left) shows the relation between PGA values and IDR for both typologies of structures. For the obtained PGA values, the corresponding return periods are calculated using the set of data provided from the seismic map of Barcis
Figure 11 (right) and the interpolation Equation (
5).
Thus, the probability of exceedance in 50 years is computed using Equation (
6) for the obtained values of return periods. The lifespan of the structure is set to 50 years, as it is the service life for ordinary structures according to Eurocode. After having computed the cost damages for each limit state, it is possible to calculate the expected losses for each limit state. Afterwards, the calculation of the total expected loss can be finally performed. In
Table 7, the calculation of the total expected loss for both structures according the above procedure is given.
Therefore, the total cost of both buildings
is expressed as the sum of initial construction cost and the total expected loss as follows:
3.5. Total Cost (Global Assessment Parameter)
3.5.1. Conversion of Energy Analysis into Monetary Unit
To compute the
for both structures, the first step is to convert the results of energy analysis into monetary unit. The conversion of the electricity into monetary unit is done by using the Eurostat data [
32]. According to them, the price of electricity for industrial sector in Italy for the year 2016 is
€/
. Therefore, the cost of electric energy during the operation phase for both typologies is € 357,622 according to Equation (
14).
3.5.2. Conversion of Environmental Burden into Monetary Unit
At this step, the environmental impact expressed in amount of greenhouse gas emissions needs to be converted in economic terms. According to the European Emission Allowances—Global Environmental Exchange [
34], the price of one tonne CO
was
€/
(first days of January 2016). Therefore, the environmental impact of buildings during construction and demolition phases, expressed in monetary terms, is represented in
Table 8.
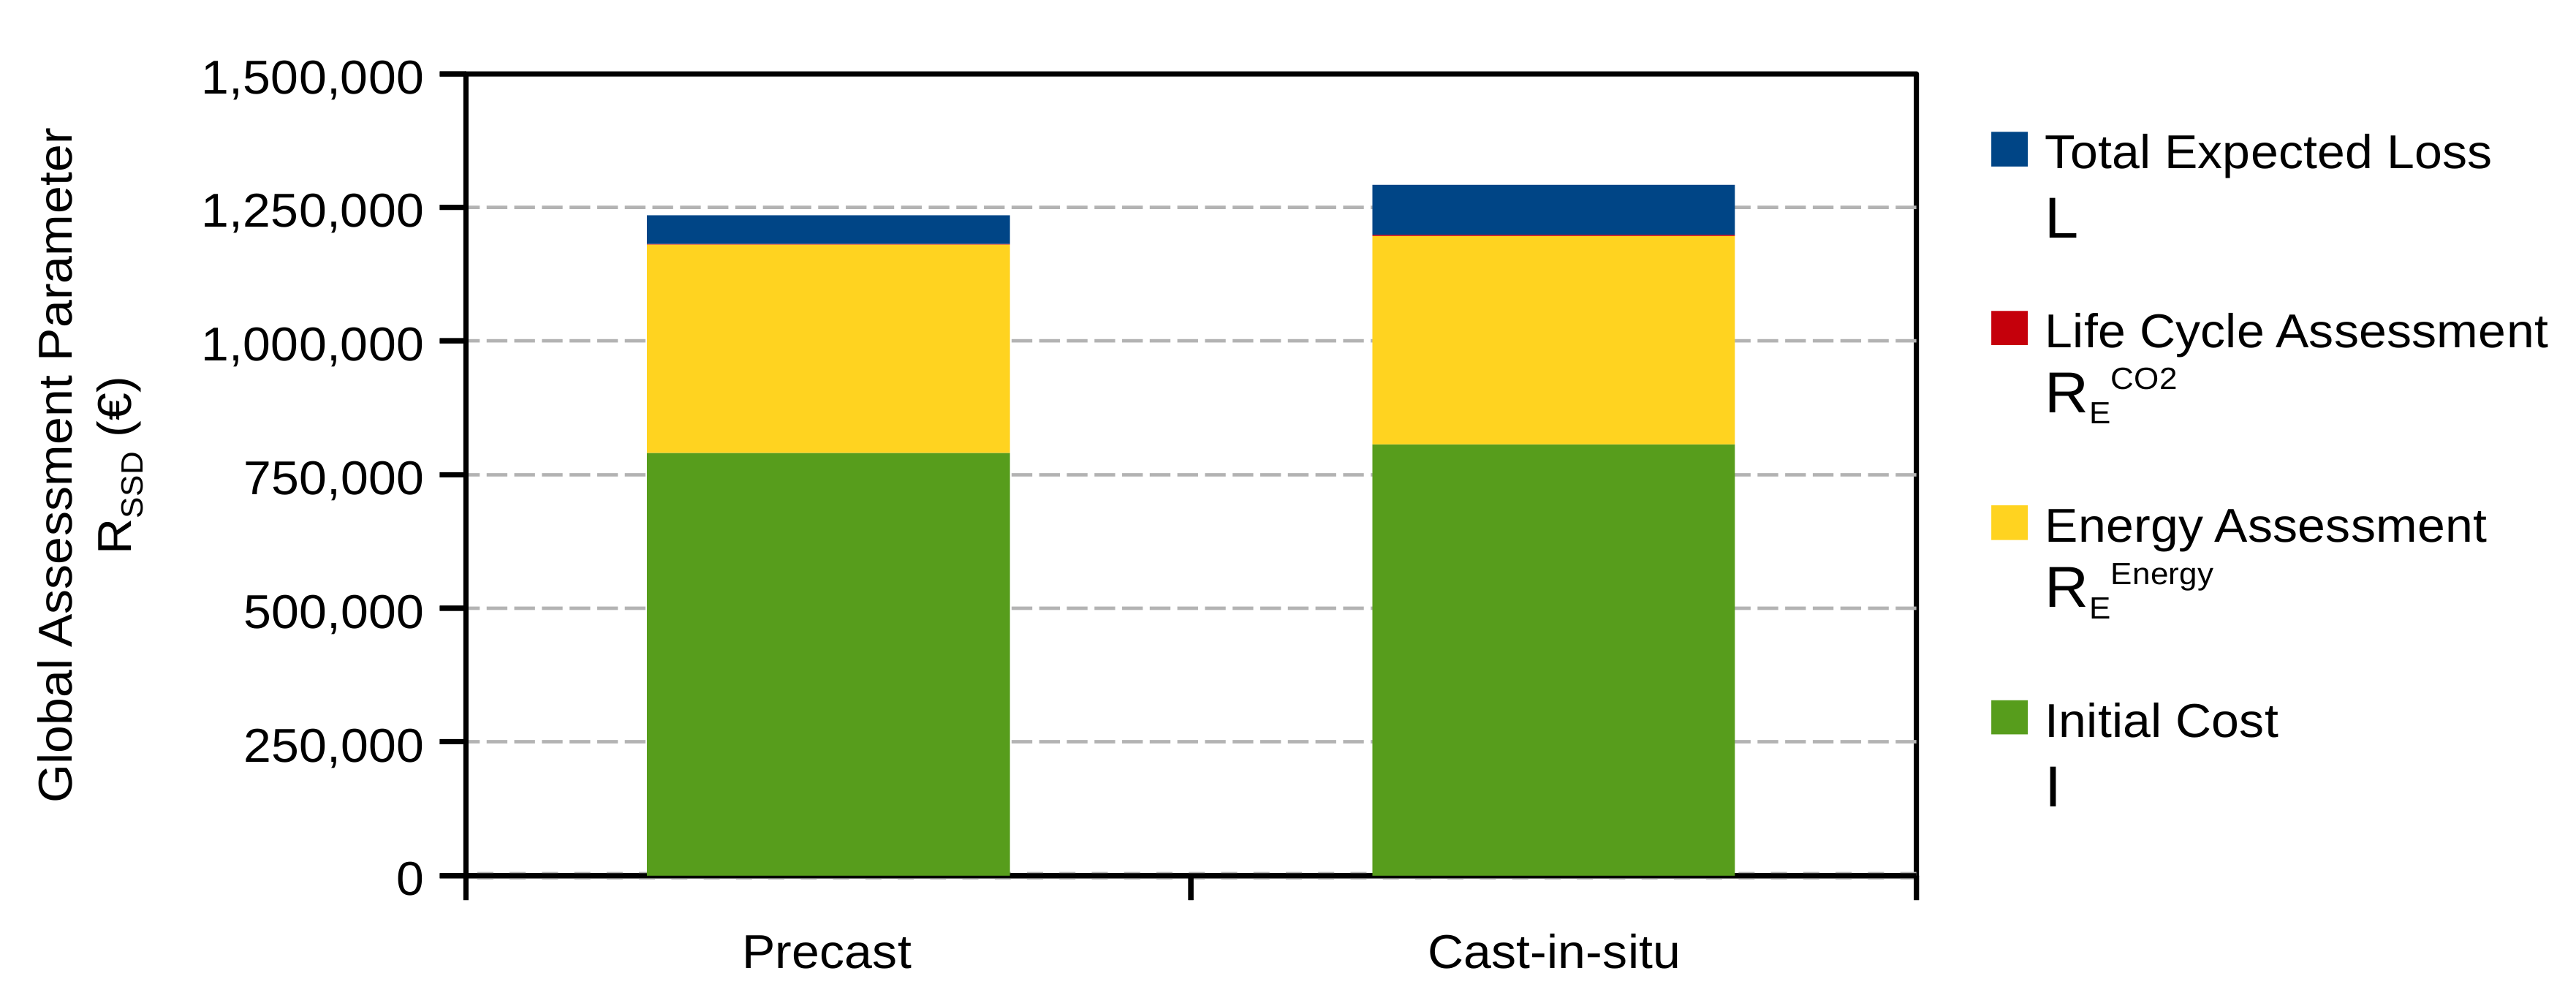
3.5.3. Calculation of Global Assessment Parameter
The
is the sum of energy, environmental and the structural costs; the numerical results are expressed in
Table 8 and they are visually represented in
Figure 12. The figures in this example show that the precast building is here identified with the best performance in each category.
4. Discussion
The Sustainable Structural Design method (SSD) has been presented as a supporting tool for the building design process. Technical-structural aspects are considered along with the environmental ones, during the overall life cycle of the structure. Following the approach of modern sustainable design, the SSD method covers the three domains of sustainability: environment, economy and society, optimising the building design in terms of structural and environmental performances, providing a final Global Assessment Parameter in economic terms.
Other components could be added, besides the three main ones. Even though safety is limited so far to the earthquake, the inclusion of other hazards is in principle allowed. The application of the method to address other categories of hazard (namely, blast hazard) has recently been proposed [
47].
All the technicalities regarding environmental issues, such as the LCA at material level, are carefully taken into account within Steps I and II, following the best practices commonly accepted by the experts. Unlike other methods of conditioned optimisation, all these terms are combined, avoiding the use of any additional weights derived from heterogeneous analyses [
48]. Therefore, each SSD component generates an output only in economic terms. In addition, all operators involved in the design process can use their own tools, independently of each other, thanks to the modular approach.
All financial issues related to the discount over the time of costs and benefits, involved in the calculation of the Global Assessment Parameter as net present value, are performed according to the usual financial procedures, outside the fields of safety and sustainability.
The fixing of weights to combine outputs is a sensitive issue, which is beyond the technical scopes here described. The carbon price is evidently the key-value to estimate the environmental burden in economic terms, for this reason it is fixed by the market and by the policy-makers through the emission allowances system. To this end, it must be taken into account that the price is not determined looking at building sector only, but is also conditioned by industry and transportation; all they contributing with similar proportions to the overall CO emissions. Since all analysed issues have their own rules and standards, which impose mandatory limits, all the selectable solutions are already constrained within the limits set by their standards. The procedure is openly neutral: it deals with different issues, such as Safety, Sustainability and Affordability, without determining which one should prevail a priori.
The environmental burden, estimated by the example (
Table 8), is negligible when calculated using the price of CO
, as it was fixed by EEX:
=
€/
(January 2016). In such case the estimated value for the cast-in-situ building is
= €1875, which accounts for 0.1% of the
= €1,235,651. The figures of
and the share of
might change significantly whereas the carbon price can vary with two orders of magnitude, as reported by the World Bank Report 2016 [
33] for the values of the emission allowances per tonne
:
€/
137 €/
.
Taking the maximum recorded value, i.e., 137 €/ (Sweden Carbon Tax, 2016), the would reach €, with a impact on the total cost equal to 2.1%, while the quota of increases from 30.1% to 38.7% at the same time. Finally, the growth of the CO emissions price increases the by 17%, which is no more negligible.
The scale-up of the method is allowed by the architecture of the SSD, ranging from single buildings to regional/national policy [
49]. For instance, the best action strategy to renew the built heritage, considering both security and environmental needs, might be established by the policy makers using the SSD, allowing to allocate and manage resources in the most effective way. In the same manner, effects of variation of CO
costs in the real estate market could be assessed.
Finally, by addressing life threatening hazards, it is obvious to wonder whether this method hides any procedure to quantify the human life’s value. Since the risk assessment must be carried out in accordance with national laws and standards, the accepted risk threshold for each hazard is that established by the standard. No further arbitrary evaluations or economic estimates are applied.
5. Conclusions
The Sustainable Structural Design method (SSD) considers both structural and environmental parameters of the buildings in a life cycle perspective. It allows the exchange of information among professionals of different fields and involves different categories of stakeholders to make decisions among alternative building solutions. The comparison among different solutions is based on monetary unit, being the
cost the unit used in the communication among the stakeholders involved in the building process. The most suitable solution is the one with the lowest value of Global Assessment Parameter
. It might have higher initial cost but require less damage cost after an earthquake and/or it has a better environmental performance during the whole life cycle. The cost of greenhouse gas emissions is significantly lower than other costs, due to the current low price of CO
in the EU Emissions Trading System [
50]. To set the European economy on a decarbonisation path, the CO
price could be increased to take into account the effects of global warming.
The SSD method aims at becoming a supporting tool for the overall building-design process, being a general method for the accounting of environmental and safety performances. It can be used for all categories of constructions: for the new ones, during the design phase, as well as for the existing buildings that need refurbishing or transformation. In a broader context, further improvements of the method can be obtained by taking into account not only seismic hazard but also different risk assessments, such as fire, wind, flood, etc.


