Comparison of Theoretical and Laboratory Out-of-Plane Shear Stiffness Values of Cross Laminated Timber Panels


Abstract
:1. Introduction
2. Methodology
2.1. Theoretical Methods
2.1.1. Timoshenko Beam Theory
2.1.2. Shear Analogy Method
2.2. Laboratory Tests
2.2.1. Material and Conditioning
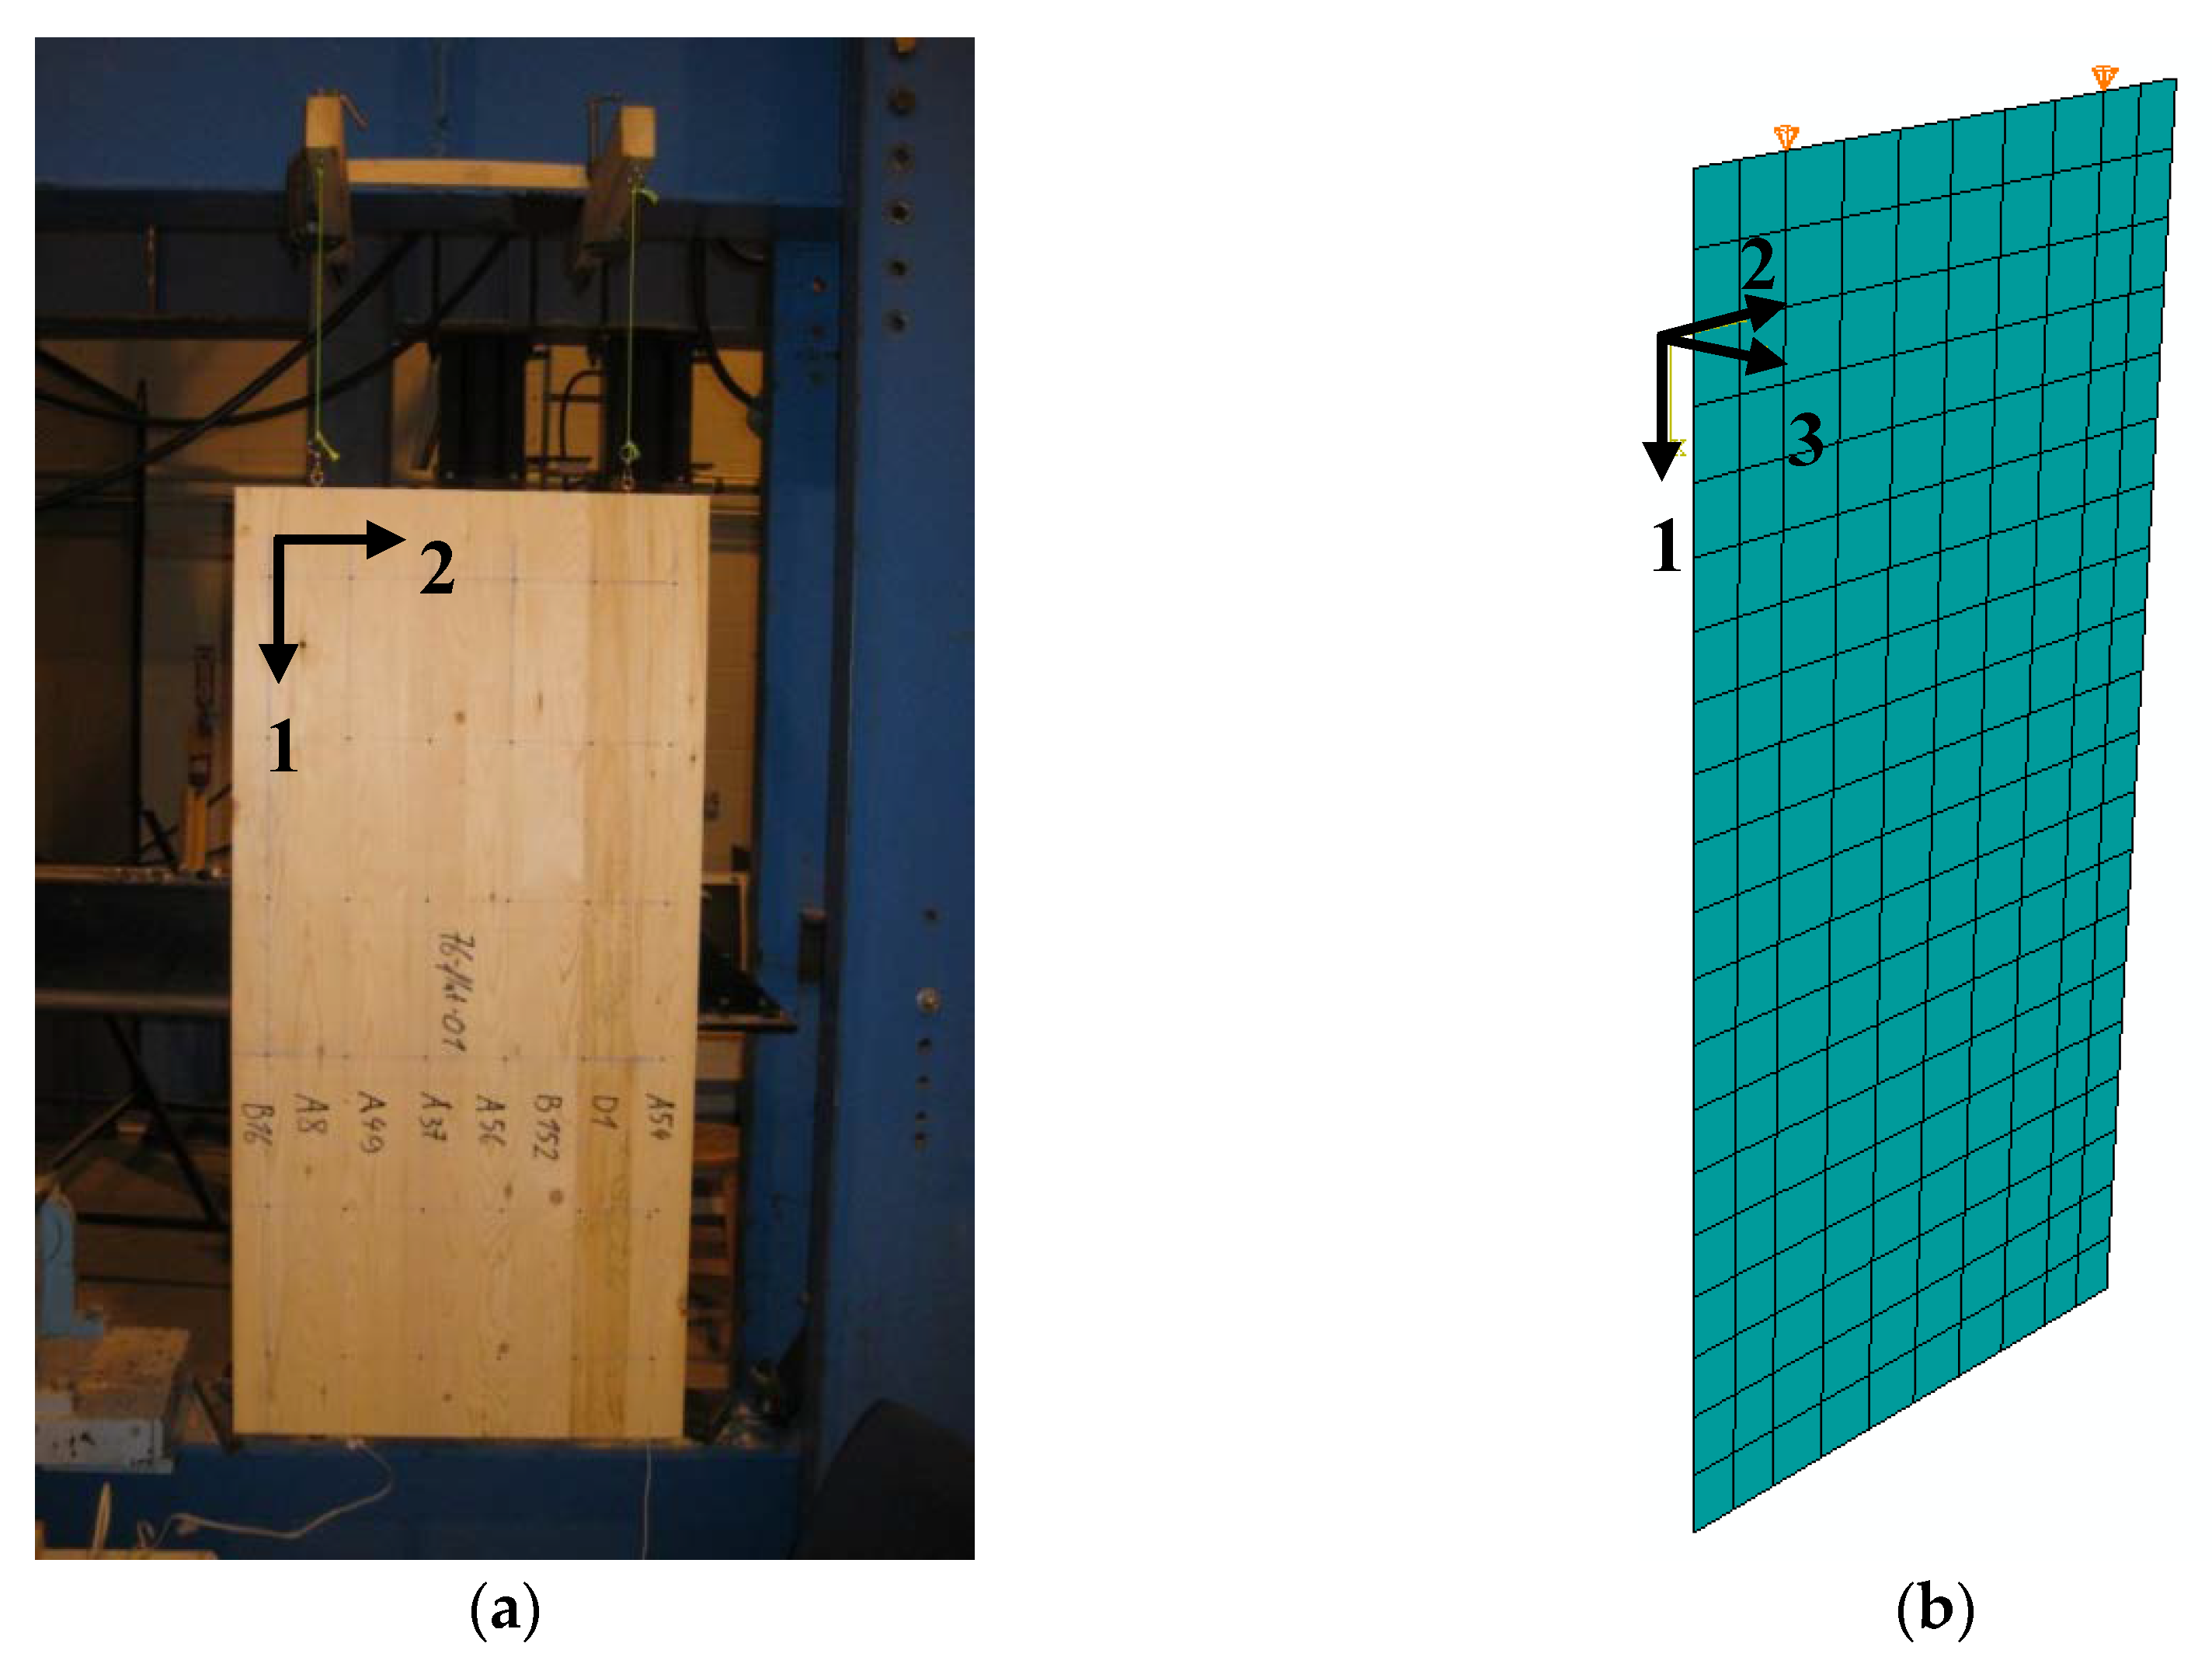
2.2.2. Modal Panel Tests
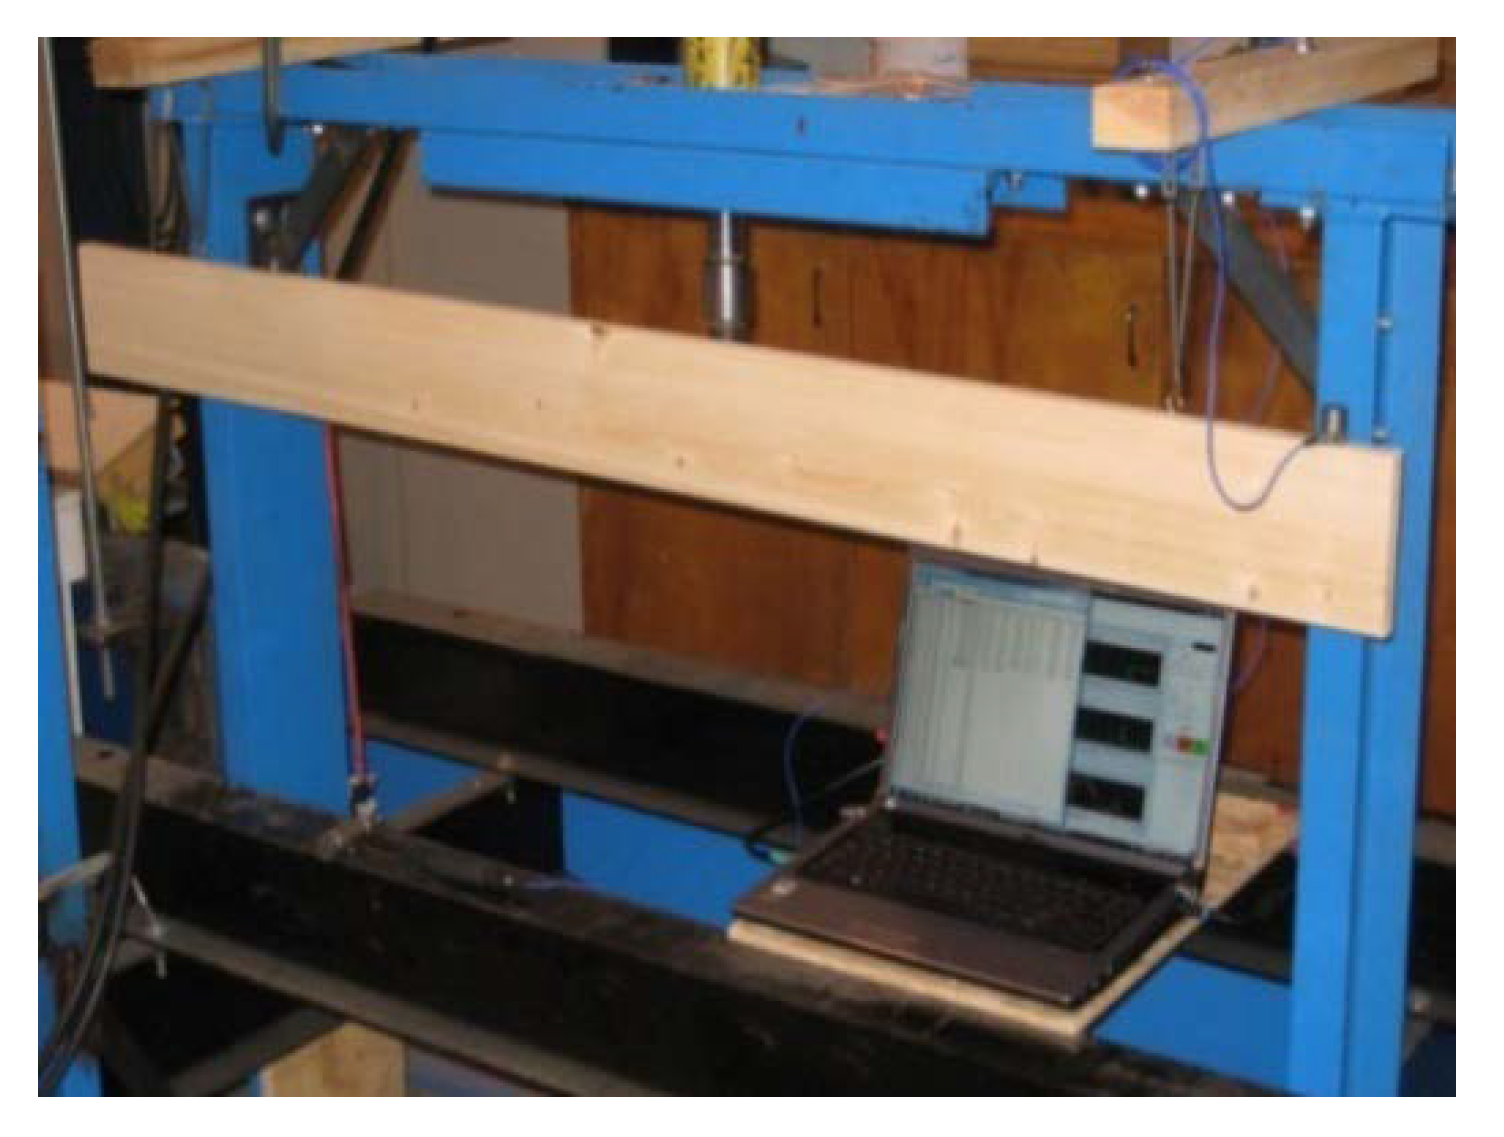
2.2.3. Bending Tests
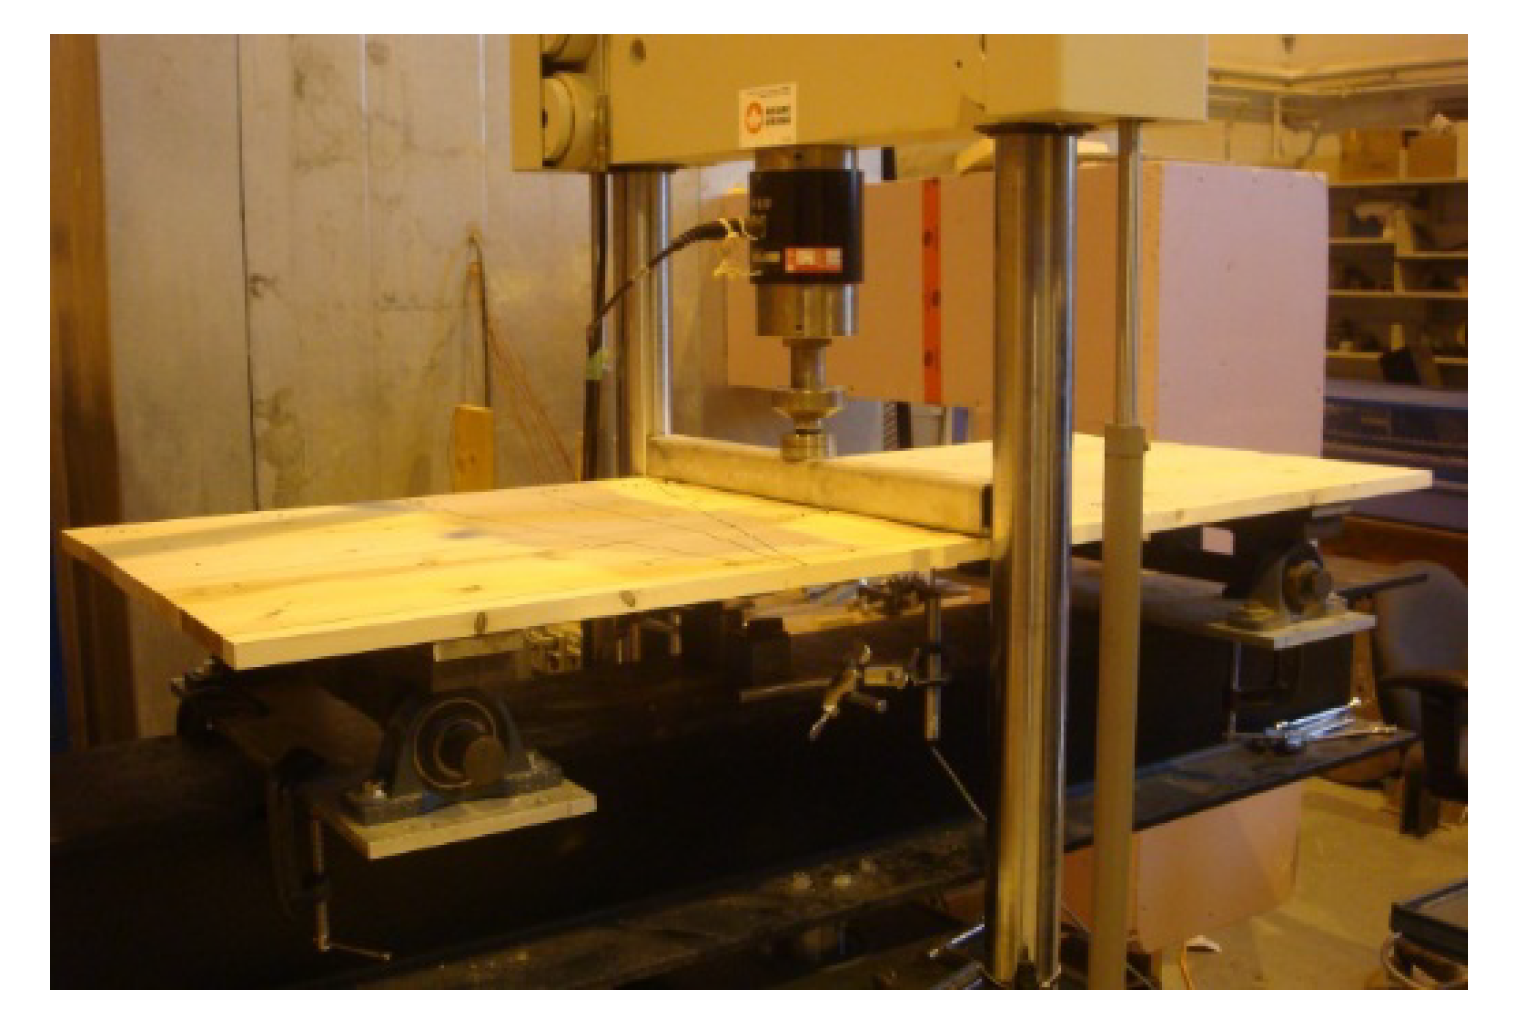
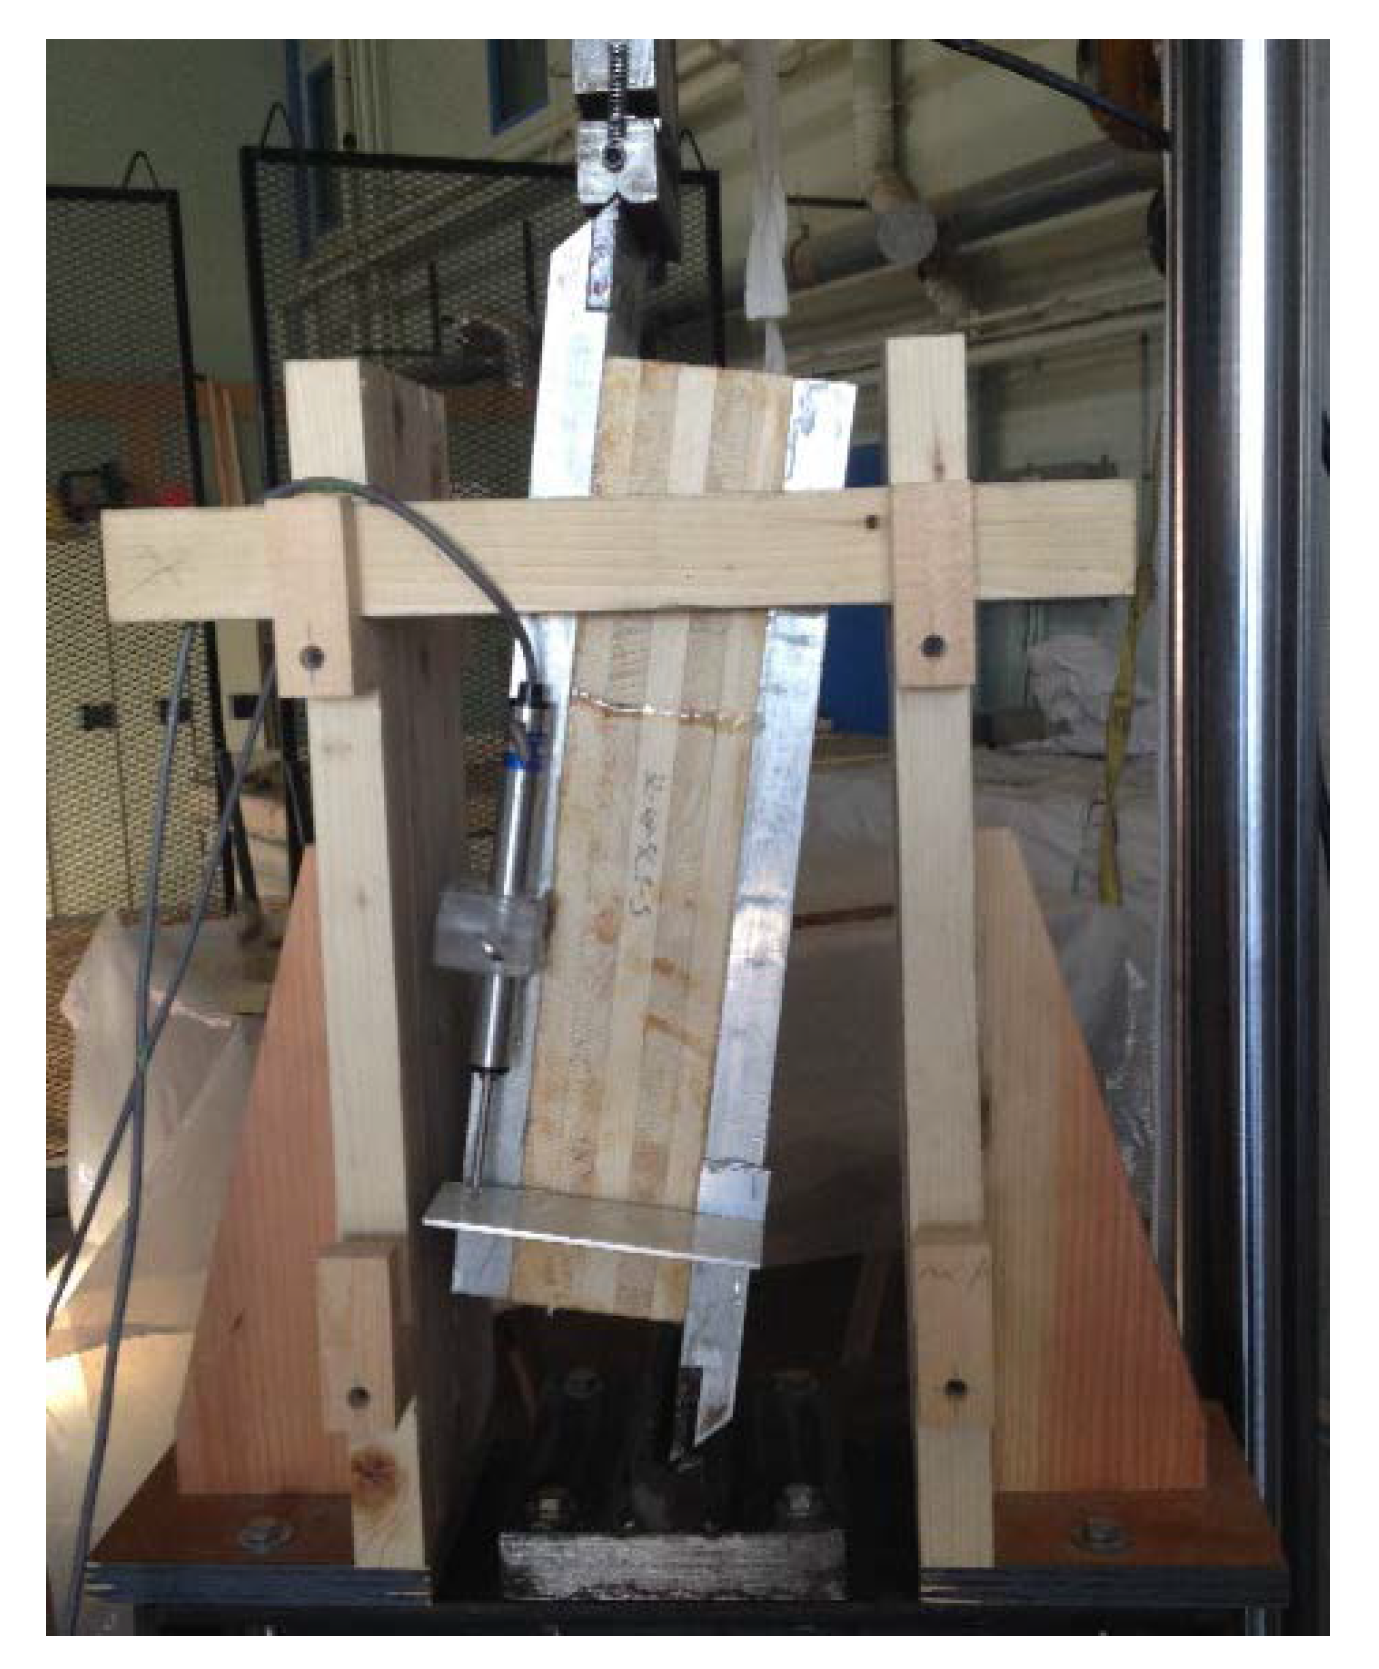
2.2.4. Planar Shear Tests
2.2.5. Evaluation of the Effective Shear Stiffness
3. Test Results
3.1. Single-Layer Tests
3.2. CLT Panel Tests
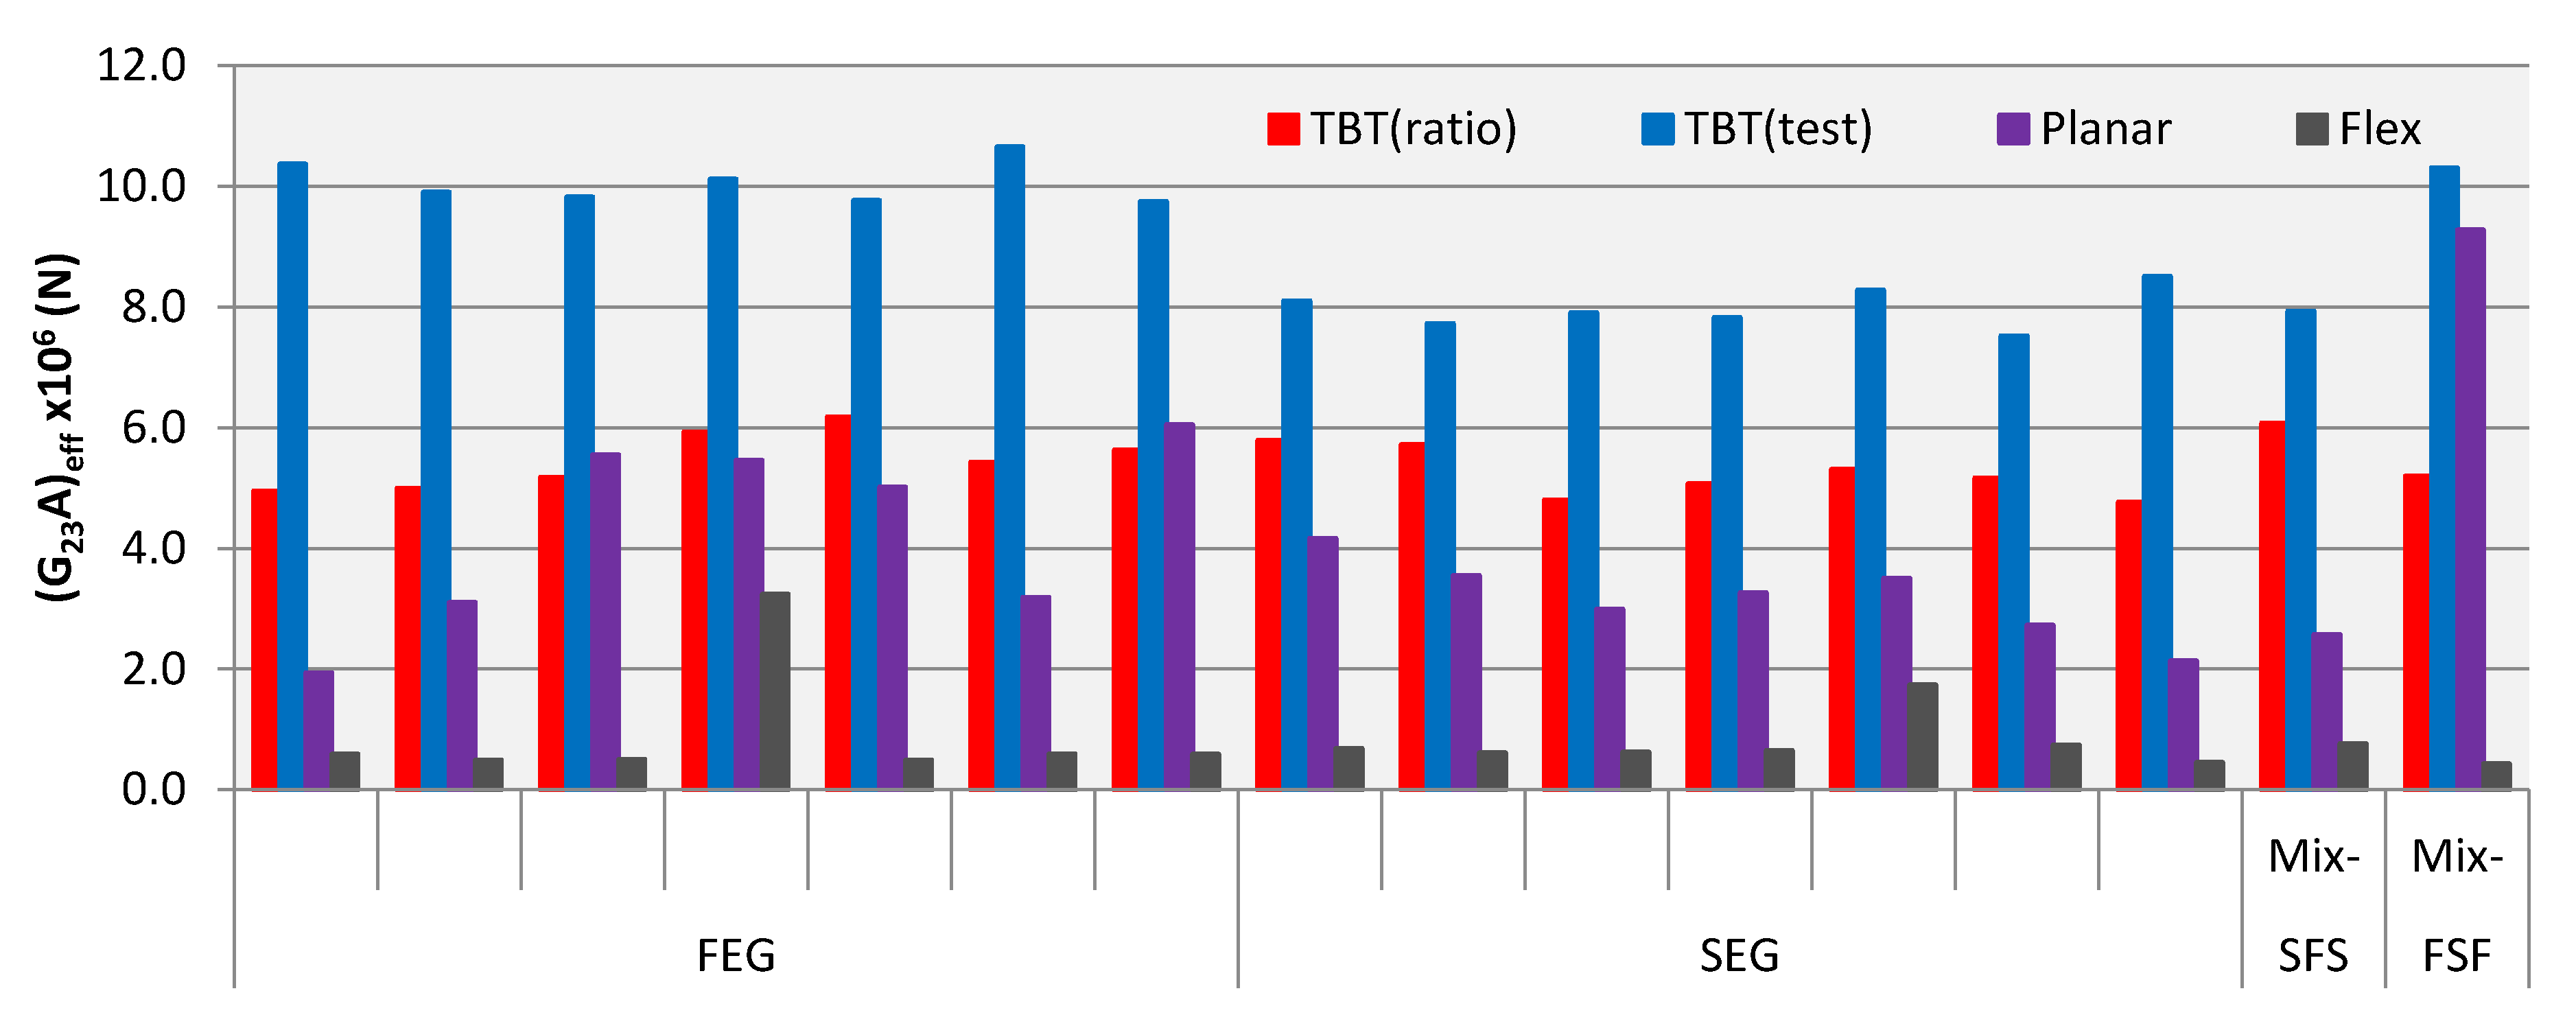
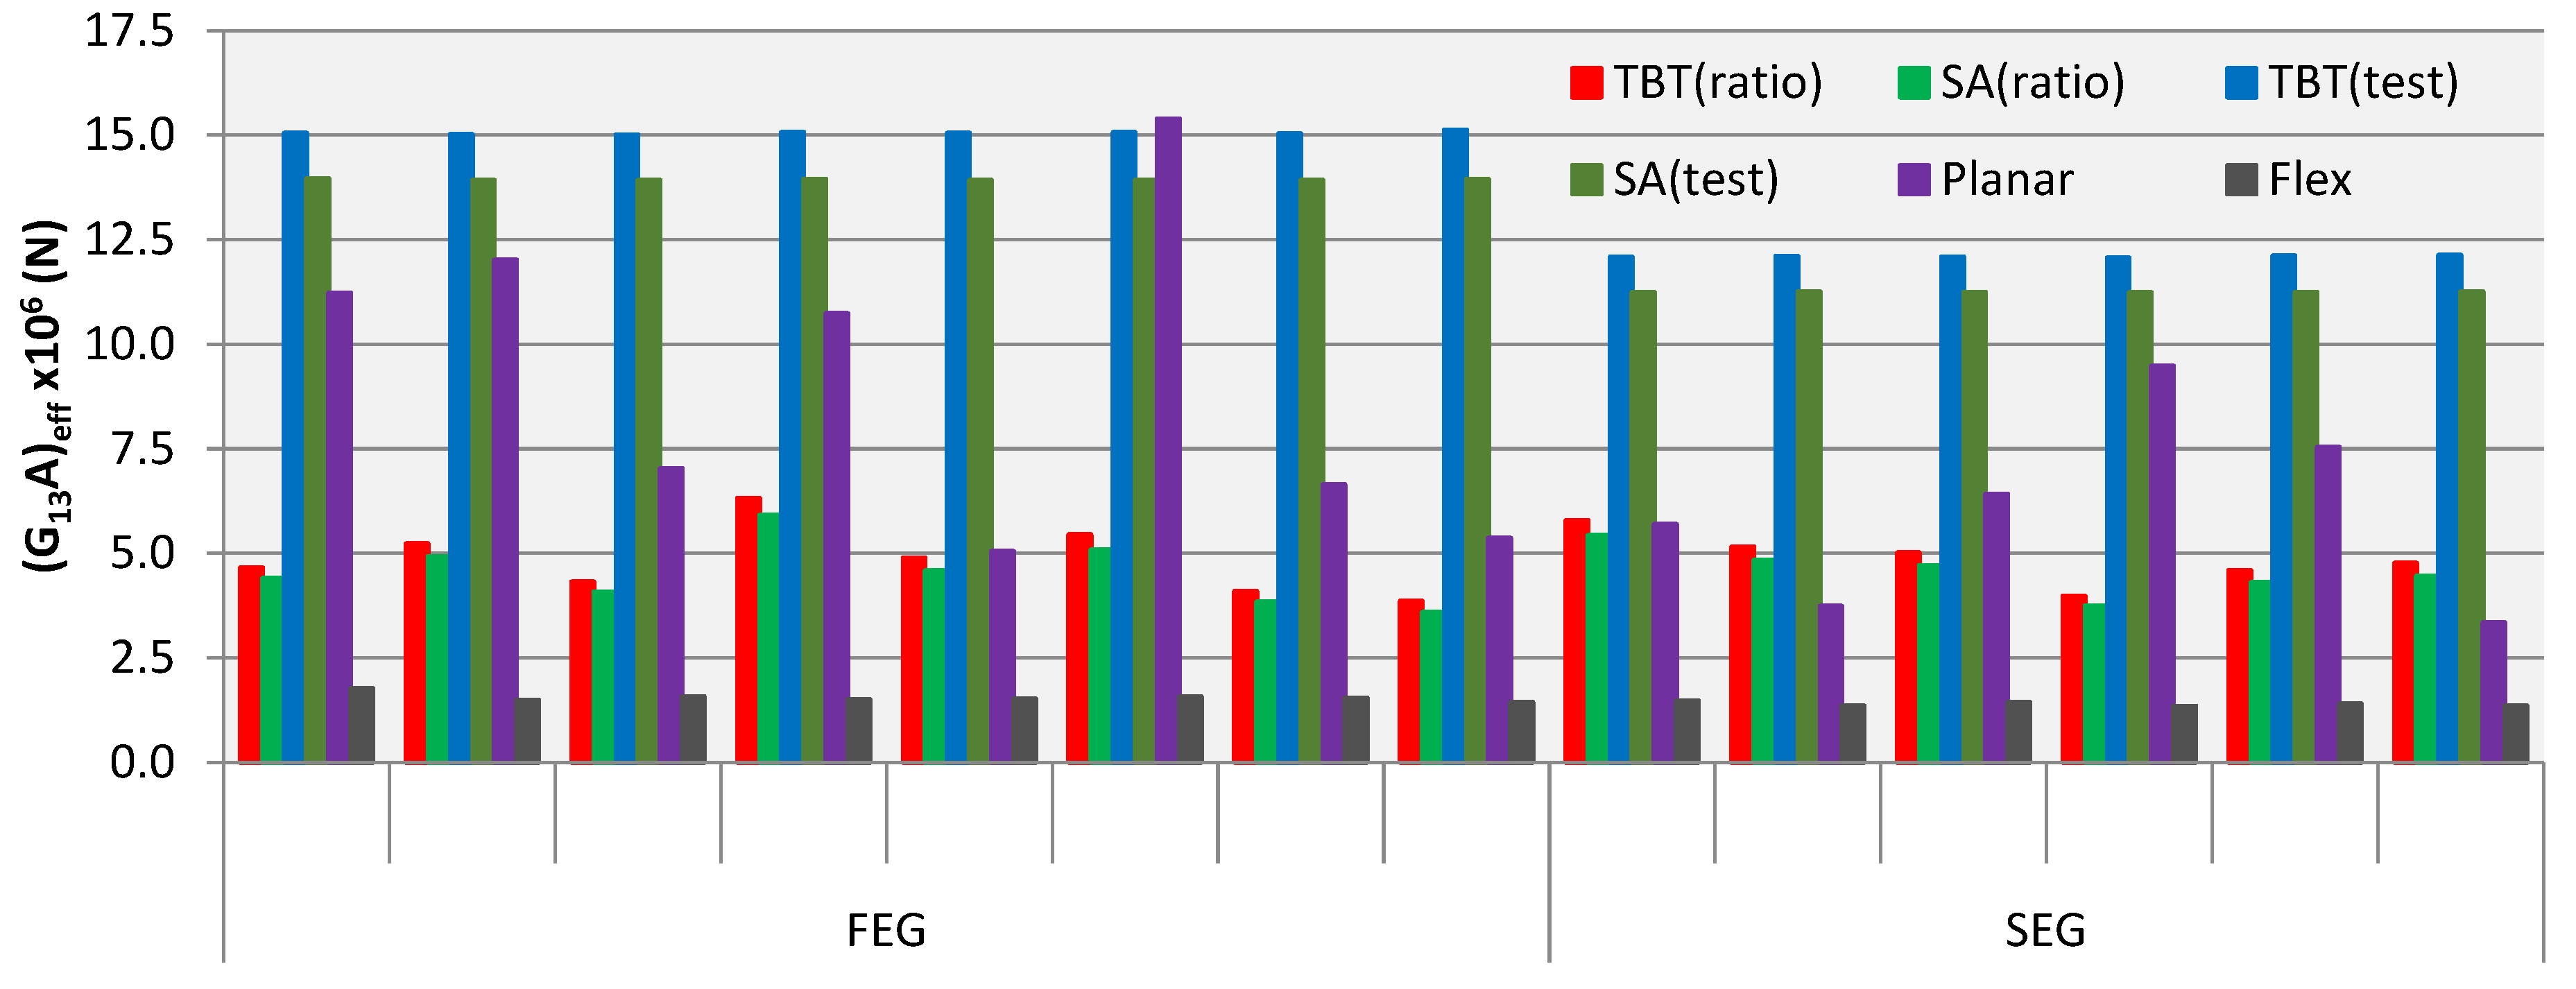
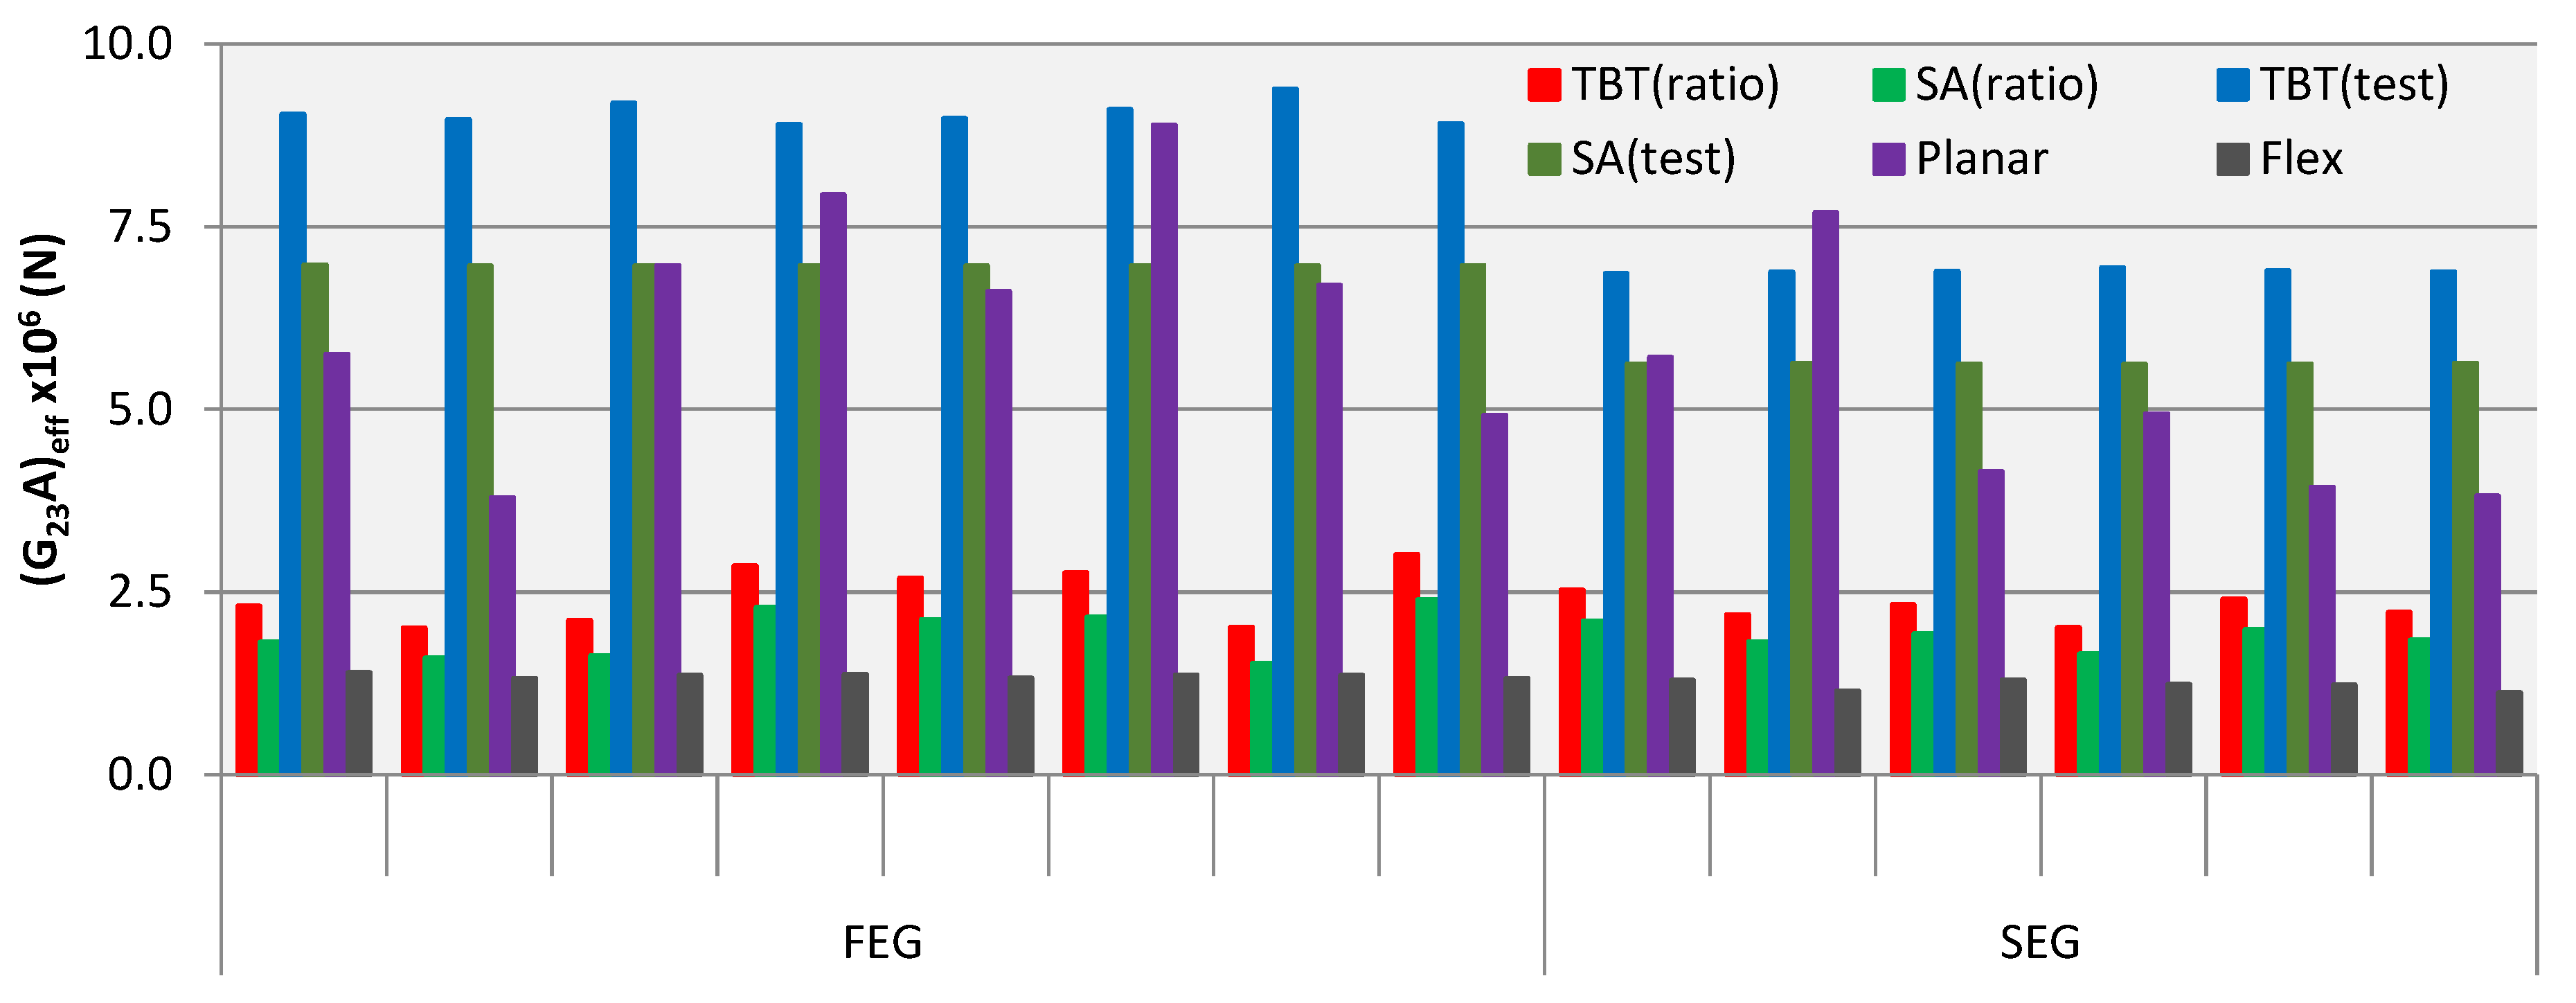
3.3. Shear Stiffness Results
4. Discussion
5. Conclusions
Author Contributions
Funding
Acknowledgments
Conflicts of Interest
References
- Brandner, R.; Flatscher, G.; Ringhofer, A.; Schickhofer, G.; Thiel, A. Cross laminated timber (CLT): Overview and development. Eur. J. Wood Wood Prod. 2016, 74, 331–351. [Google Scholar] [CrossRef]
- O’Ceallaigh, C.; Sikora, K.S.; McPolin, D.O.; Harte, A.M. The Influence of Panel Lay-up on the Characteristic Bending and Rolling Shear Strength of CLT. Buildings 2018, 8, 114. [Google Scholar] [CrossRef]
- Ehrhart, T.; Brandner, R.; Schickhofer, G.; Frangi, A. Rolling Shear Properties of some European Timber Species with Focus on Cross Laminated Timber (CLT): Test Configuration and Parameter Study. In Proceedings of the 48th Meeting of the International Network on Timber Engineering Research (INTER 2015), Šibenik, Croatia, 24–27 August 2015; pp. 61–76. [Google Scholar]
- CEN. Eurocode 5 Design of Timber Structures. Part 1-1: General Common Rules and Rules for Buildings. EN 1995-1-1; European Committee for Standardization: Brussels, Belgium, 2006. [Google Scholar]
- Augustin, M.; Bogensperger, T.; Schickhofer, G. BSPhandbuch: Holz-Massivbauweise in Brettsperrholz—Nachweise auf Basis des Neuen EuropäIschen Normenkonzepts; Verlag der Technischen Univiversitaet Graz: Graz, Austria, 2010. [Google Scholar]
- Kreuzinger, H. Platten, Scheiben und Schalen—Ein Berechnungsmodell für gängige Statikprogramme. Bau mit Holz 1999, 1, 34–39. [Google Scholar]
- Vlachoutsis, S. Shear correction factors for plates and shells. Int. J. Numer. Methods Eng. 1992, 33, 1537–1552. [Google Scholar] [CrossRef]
- Timoshenko, S.P. On the correction of shear of the differential equation for transverse vibrations of prismatic bars. Lond. Edinb. Dublin Philos. Mag. J. Sci. 1921, 41, 744–746. [Google Scholar] [CrossRef]
- Reissner, E. The effect of transverse shear deformation on the bending elastic plates. J. Appl. Mech. 1945, 12, 69–77. [Google Scholar]
- Mindlin, R.D. Thickness-shear and flexural vibrations of crystal plates. J. Appl. Phys. 1951, 22, 316–323. [Google Scholar] [CrossRef]
- Cowper, G.R. The shear coefficient in Timoshenko’s beam theory. J. Appl. Mech. 1966, 33, 335–340. [Google Scholar] [CrossRef]
- Chui, Y.H. Simultaneous Evaluation of Bending and Shear Moduli of Wood and the Influence of Knots on these Parameters. Wood Fiber Sci. 1991, 25, 125–134. [Google Scholar] [CrossRef]
- Larsson, D. Using Modal Analysis for Estimation of Anisotropic Material Constants. J. Eng. Mech. 1997, 123, 222–229. [Google Scholar] [CrossRef]
- ASTM. Standard Test Methods of Static Tests of Lumber in Structural Sizes—Designation D198; ASTM International: West Conshohocken, PA, USA, 2015. [Google Scholar]
- ASTM. Standard Test Methods for Structural Panels in Planar Shear (Rolling Shear)—Designation D2718; ASTM International: West Conshohocken, PA, USA, 2000. [Google Scholar]
- Chui, Y.H.; Gong, M. Evaluation of Planar Shear Properties of Cross Layer in Massive Timber Panel; Final Report #: WSTC2013-015; Wood Science and Technology Centre, The University of New Brunswick: Fredericton, NB, Canada, 2015. [Google Scholar]
- Zhou, Q. Development of Evaluation Methodology for Rolling Shear Properties in Cross Laminated Timber (CLT). Master’s Thesis, University of New Brunswick, Fredericton, NB, Canada, 2013. [Google Scholar]


| Panel | Elastic Moduli | Span (mm) | Span-to-Thickness | Displacement Rate (mm/min) |
|---|---|---|---|---|
| Single-Layer | 1100 | 57.9 | 8.0 | |
| 500 | 26.3 | 0.75 | ||
| 3-Layer CLT | 500 | 10.3–10.8 | 0.5 | |
| 5-Layer CLT | 500 | 6.2–6.7 | 0.5 | |
| Panel Type | Test Method | Average & StDev | Density (kg/m3) | (N/mm2) | (N/mm2) | (N/mm2) | (N/mm2) | (N/mm2) |
|---|---|---|---|---|---|---|---|---|
| FEG | Modal | Average | 465.9 | 10,919.6 | 283.6 | 696.5 | - | - |
| StDev | 25.7 | 1776.9 | 55.5 | 94.9 | ||||
| Static | Average | 465.9 | 10,965.3 | 264.4 | 796.0 1 | 753.4 2 | 261.8 3 | |
| StDev | 25.7 | 1837.7 | 74.5 | 101.5 1 | 80.1 2 | 92.6 3 | ||
| SEG | Modal | Average | 401.2 | 10,152.0 | 60.8 | 482.8 | - | - |
| StDev | 19.8 | 1428.8 | 18.5 | 68.2 | ||||
| Static | Average | 401.2 | 10,655.5 | - | - | 874.5 2 | 188.5 3 | |
| StDev | 19.8 | 1528.3 | 143.9 2 | 74.0 3 |
| Panel Type | Density (kg/m3) | (N/mm2) | (N/mm2) | (N/mm2) | (N/mm2) | (N/mm2) | ||
|---|---|---|---|---|---|---|---|---|
| 3-Layer | F E G | Calc. | 482 (13) | 10,601 (522) | 627 (95) | 725 (93) | - | - |
| Modal | 11,471 (703) | 783 (118) | 853 (111) | - | - | |||
| Static | 3502 (1182) | 612 (96) | - | 231 (47) | 165 (54) | |||
| S E G | Calc. | 407 (27) | 9736 (1179) | 406 (31) | 486 (102) | |||
| Modal | 9216 (1510) | 495 (52) | 353 (97) | |||||
| Static | 2828 (767) | 417 (49) | - | 179 (961) | 115 (24) | |||
| 5-Layer | F E G | Calc. | 480 (11) | 9403 (1780) | 2649 (440) | 679 (79) | ||
| Modal | 12,736 (3246) | 3192 (448) | 904 (142) | |||||
| Static | 1344 (80) | 930 (48) | - | 212 (86) | 149 (38) | |||
| S E G | Calc. | 405 (10) | 9264 (1003) | 2378 (298) | 485 (36) | |||
| Modal | 13,355 (3430) | 2338 (481) | 361 (119) | |||||
| Static | 1078 (57) | 712 (67) | - | 133 (51) | 111 (33) | |||
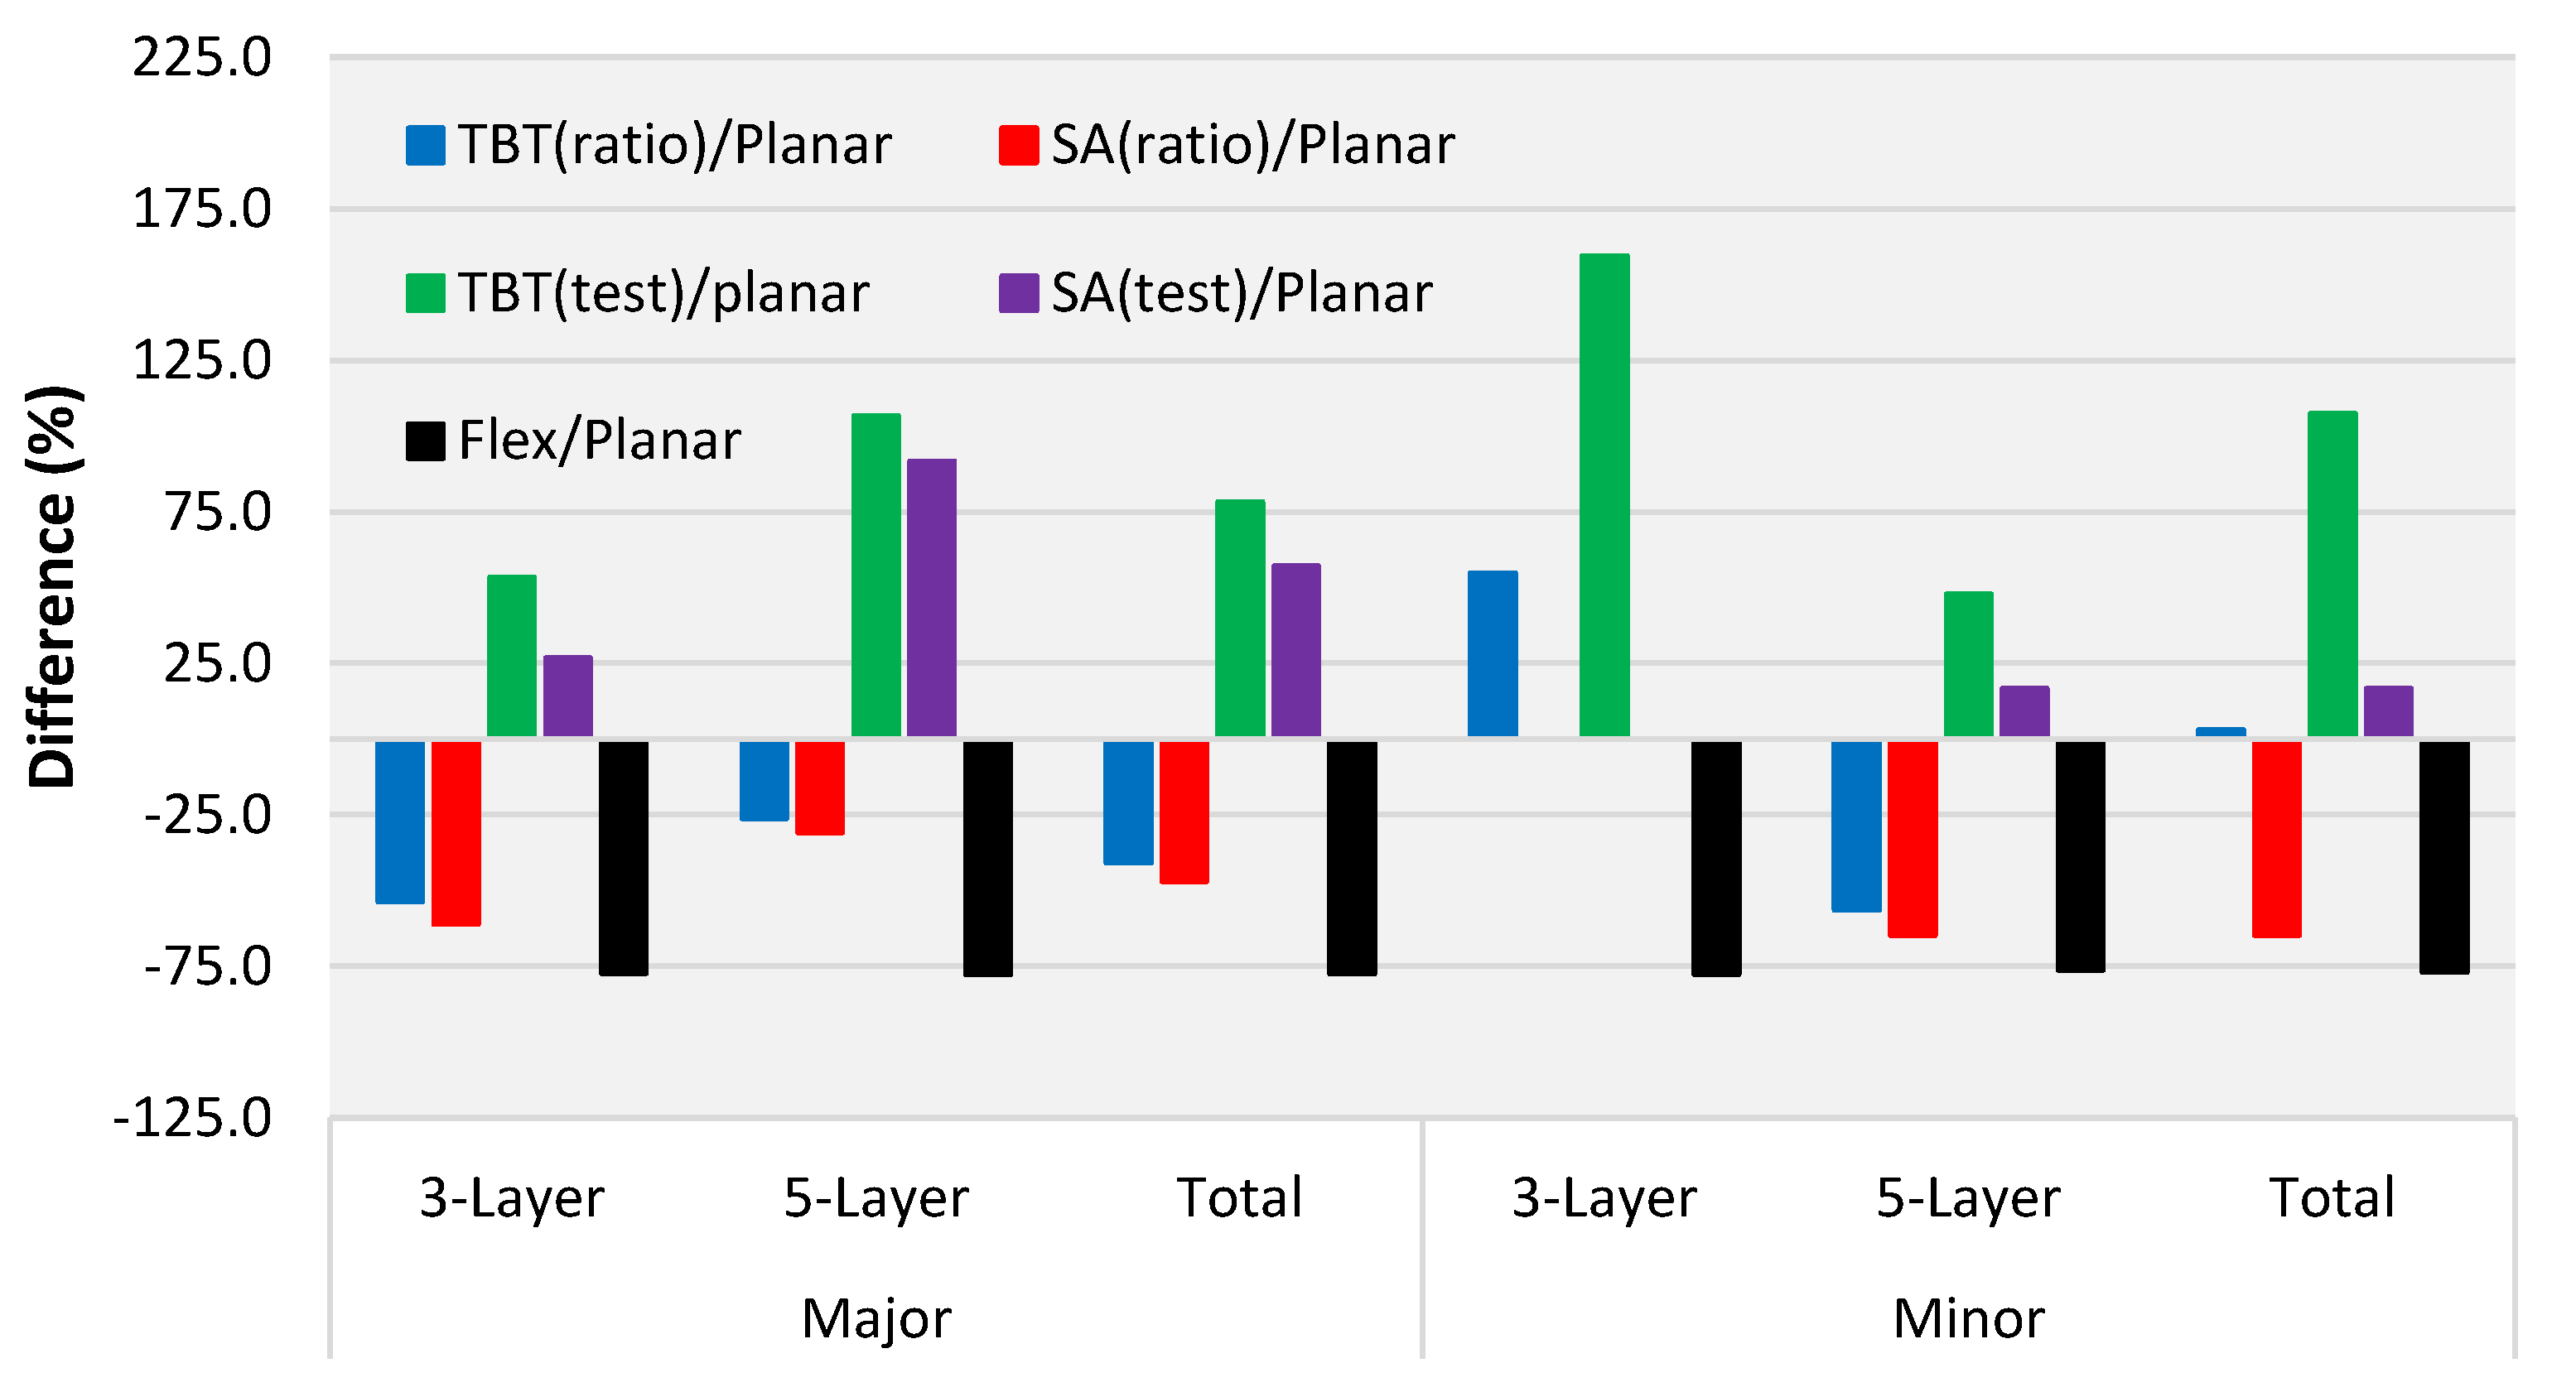
| Panel Type | TBT(ratio)/Planar (%) | SA(ratio)/Planar (%) | TBT(test)/Planar (%) | SA(test)/Planar (%) | Flex/Planar (%) | ||
|---|---|---|---|---|---|---|---|
| Major | 3-Layer | Avg. | −55.7 | −61.0 | 53.3 | 26.8 | −77.3 |
| StDev | 15.1 | 12.6 | 43.3 | 35.8 | 12.1 | ||
| 5-Layer | Avg. | −26.2 | −30.8 | 106.6 | 91.6 | −77.7 | |
| StDev | 34.3 | 32.1 | 83.0 | 76.9 | 9.0 | ||
| Total | Avg. | −40.8 | −46.9 | 78.2 | 57.0 | −77.5 | |
| StDev | 29.2 | 27.9 | 69.2 | 66.3 | 10.6 | ||
| Minor | 3-Layer | Avg. | 54.8 | - | 159.4 | - | −77.5 |
| StDev | 53.9 | - | 103.8 | - | 14.6 | ||
| 5-Layer | Avg. | −56.3 | −64.8 | 47.7 | 16.6 | −76.2 | |
| StDev | 12.1 | 10.3 | 38.4 | 30.7 | 6.3 | ||
| Total | Avg. | 2.9 | −64.8 | 107.3 | 16.6 | −76.9 | |
| StDev | 68.9 | 10.3 | 97.2 | 30.7 | 11.3 | ||
© 2018 by the authors. Licensee MDPI, Basel, Switzerland. This article is an open access article distributed under the terms and conditions of the Creative Commons Attribution (CC BY) license (http://creativecommons.org/licenses/by/4.0/).
Share and Cite
Niederwestberg, J.; Zhou, J.; Chui, Y.-H. Comparison of Theoretical and Laboratory Out-of-Plane Shear Stiffness Values of Cross Laminated Timber Panels. Buildings 2018, 8, 146. https://doi.org/10.3390/buildings8100146
Niederwestberg J, Zhou J, Chui Y-H. Comparison of Theoretical and Laboratory Out-of-Plane Shear Stiffness Values of Cross Laminated Timber Panels. Buildings. 2018; 8(10):146. https://doi.org/10.3390/buildings8100146
Chicago/Turabian StyleNiederwestberg, Jan, Jianhui Zhou, and Ying-Hei Chui. 2018. "Comparison of Theoretical and Laboratory Out-of-Plane Shear Stiffness Values of Cross Laminated Timber Panels" Buildings 8, no. 10: 146. https://doi.org/10.3390/buildings8100146
APA StyleNiederwestberg, J., Zhou, J., & Chui, Y.-H. (2018). Comparison of Theoretical and Laboratory Out-of-Plane Shear Stiffness Values of Cross Laminated Timber Panels. Buildings, 8(10), 146. https://doi.org/10.3390/buildings8100146