1. Introduction
In recent years, in Italy and other European countries prone to earthquakes, the vulnerability of existing buildings and hazard levels characterizing the areas have been responsible for a significant amount of seismic losses. In reference to recent earthquakes, severe economic and financial impacts of building damage (repair/replacement measures) have been highlighted (service and activity disruptions, occupant relocation, income losses, etc.) [
1,
2].
In “peacetime”, due to discrepancies between available economic resources and the number of buildings requiring retrofitting interventions, mitigation strategies based on accurate priority lists must be defined. For public or strategic buildings, this issue can be addressed in several ways [
3]. By contrast, due to the extent of problems faced, for residential buildings (also called “housing systems”), the issue is very complex. On a broad territorial scale, appropriate prioritization strategies for optimizing the use and allocation of available economic resources are needed to minimize future economic seismic losses.
Of course, in the seismic risk mitigation of residential buildings, owners play a central role [
4]. Tools that can directly alert owners to seismic issues must be developed and promoted. In this way, a new approach to seismic risk that is focused on economic issues must be developed for decision-makers interested in the effects of seismic risks on real estate assets such as public administrators, bankers, technical professionals, insurance personnel and investors.
In recent years, several approaches to estimate the economic effects of earthquakes have been developed and promoted. The main outputs of these approaches are vulnerability curves, which translate physical damage (for example, based on fragility curves, FCs) into monetary losses (repair and reconstruction costs) and which relate these to the hazard intensity parameter [
5]. As means to evaluate economic losses, several methodologies have been developed based on component fragility functions [
6,
7,
8,
9,
10,
11].
Recently, user-friendly tools for executing the performance-based earthquake engineering (PBEE) methodology have made feasible the application of component-based vulnerability assessment (CVA) approaches in current practice [
12,
13]. Generally speaking, these methodologies are based on a probabilistic approach: uncertainties associated with hazard assessment and the estimation of engineering demand parameters (EDPs) must be considered [
14]. The PBEE methodology treats every aspect of seismic risk in a probabilistic manner from expected seismic hazards associated with a building site to expected repair costs of individual components. Notably, the methodology requires exercising a much higher level of expertise based on a multidisciplinary view of structural assessment.
The CVA approach [
15,
16] would be most appropriate to use when performing an analysis of special buildings (for example, offices, hospitals, and schools). According to this approach, the majority of economic losses are related to structurally ineffective elements (building content, such as furniture and equipment), for which correlation damage state repair costs may be effective and for which the damage of structural and nonstructural elements is negligible. Using this methodology involves exercising a much higher level of expertise and the definition of FCs and consequence models for specific components. Specific fragilities and repair cost functions (at the component level) have also been developed for existing buildings in Italy [
17,
18]. The expected economic losses are the sum of the expected repair costs of each component; these costs are obtained by combining the probability of exceeding each component’s damage state with the corresponding repair costs.
The building-based vulnerability assessment (BVA) approach [
19,
20,
21,
22,
23] can be considered the most traditional and widely used approach. Unlike the component-based approach, the BVA approach is often based on simple mean cost ratios determined from either expert judgments or empirical post-earthquake studies of loss data, or it is based on distributions of the cost ratio for global damage levels. Cost ratios can be based on post-earthquake data and can be limited by a number of factors [
24,
25]: the occurrence of a small number of strong earthquakes resulting in the generation of insufficient data; the use of macrolevel data (referring to cities and specific areas) or data of differing formats; the use of outdated data or data about specific areas; and the dependence on founding levels.
In the opinion of the authors, the need to assign a given damage state to each building component (based on each component’s FC) represents the main limitation of the CVA approach and is mainly due to difficulties associated with defining fragility curves (FCs) and their convolution based on a global performance evaluation tool.
Instead, when applying the BVA approach, vulnerability curves can be developed based on accurate numerical analyses and existing data for validation, as reported in this study. Consequently, a set of cost ratio distributions is defined based on global damage levels. These distributions provide information about the costs (compared to reconstruction costs) involved to repair a building for each damage level and take into account uncertainties related to building performance and damage distributions resulting from intra-building variability and earthquake-earthquake records. Cost ratio distributions are determined from damage analyses conducted at the component level via damage consequence models (DCMs) of specific components and a subsequent integration process (accounting for the repair costs of all building components). In this manner, DCMs can be considered a tool for quantification of the repair cost needed to restore components to an undamaged state based on their performance. They may be viewed as an alternative to structural, nonstructural, and component FCs.
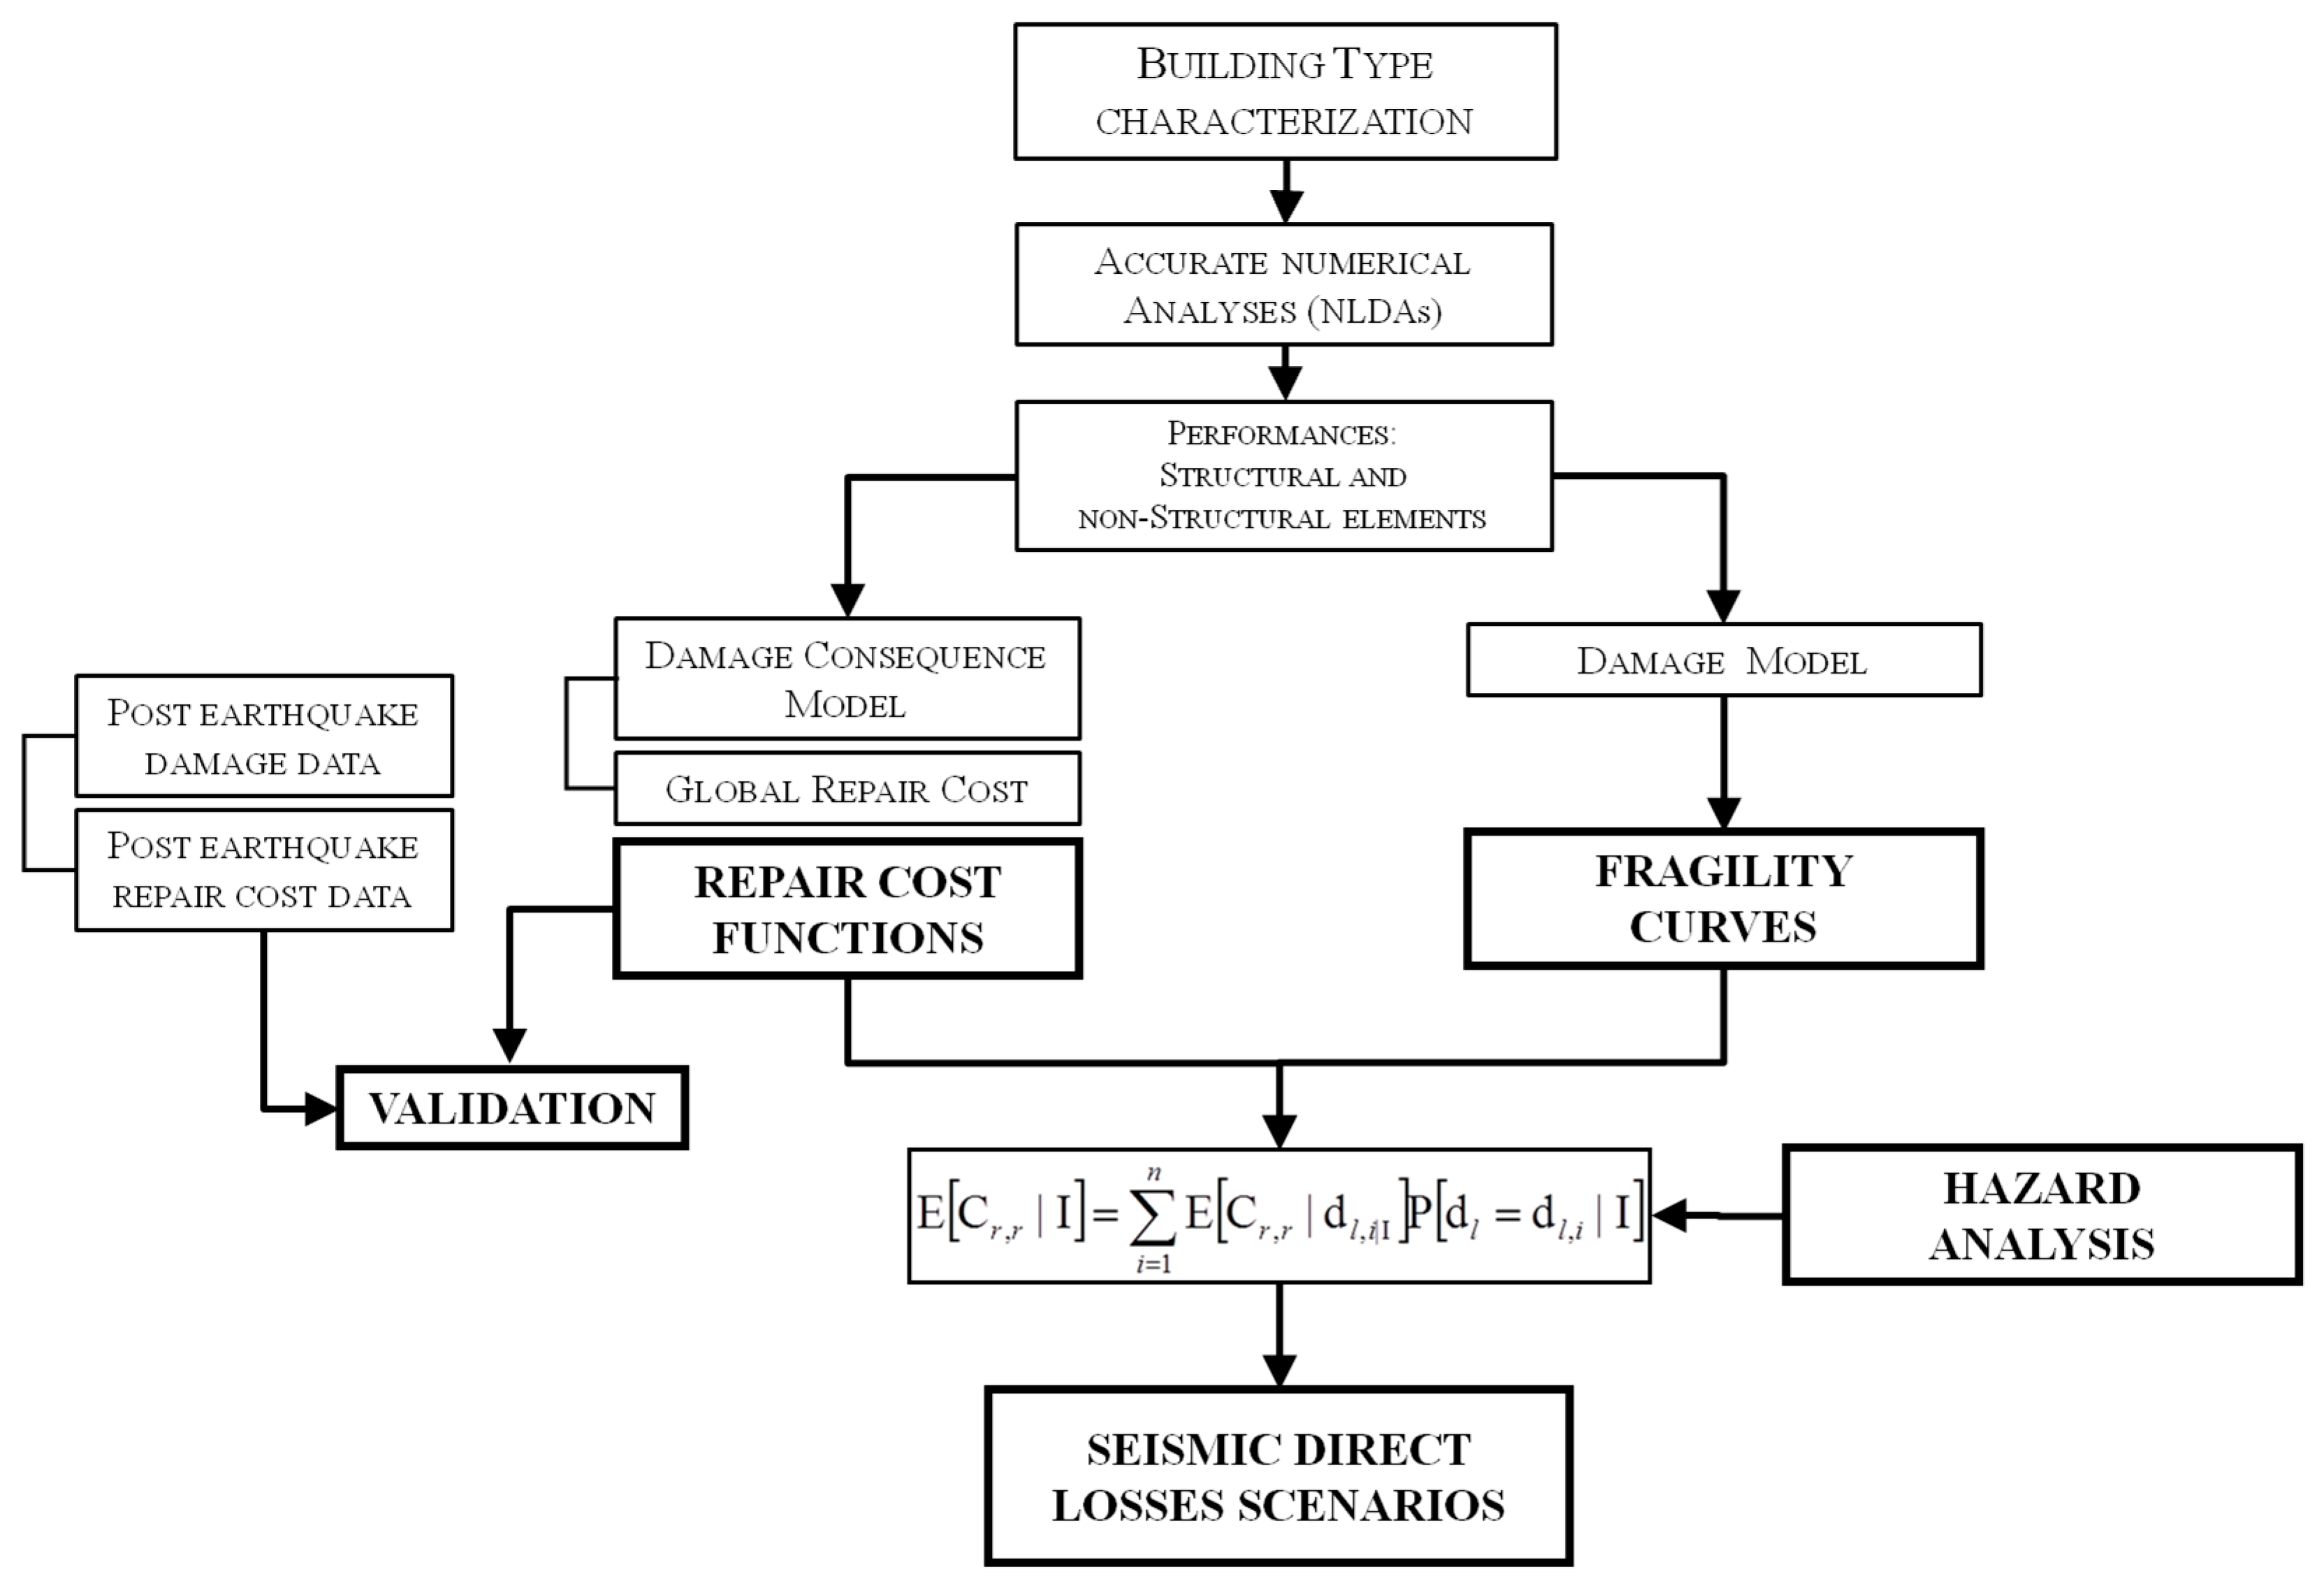
To offer a more accurate assessment of economic losses, this paper proposes an alternative economic loss estimation approach. This method is based on a detailed analysis of performance measured at the local level based on component damage models (DMs). From the BVA method, the proposed method can be viewed as an optimal middle ground between the BVA and CVA methods: when using the proposed approach, the advantages of both methods are optimized (
Figure 1). The proposed procedure has been validated using “real” post-earthquake data: this is an uncommon element. DCMs and obtained economic losses of cost ratio functions are validated according to recently published [
26,
27] repair costs associated with the Abruzzo earthquake reconstruction process. Following and improving previous national and international projects [
28,
29], the procedure has been applied to Town of Potenza (South Italy).
2. Methodological Approach
Seismic economic losses can be classified as different types of indirect and direct losses. Generally, the former result from structural damage that renders buildings unusable. The latter are generally defined as repair costs required to restore structures to their pre-earthquake conditions.
For each investigated building type, the expected value of direct seismic losses is determined through the combination of the probability of exceedance of damage levels and consequent probabilities provided by cost function.
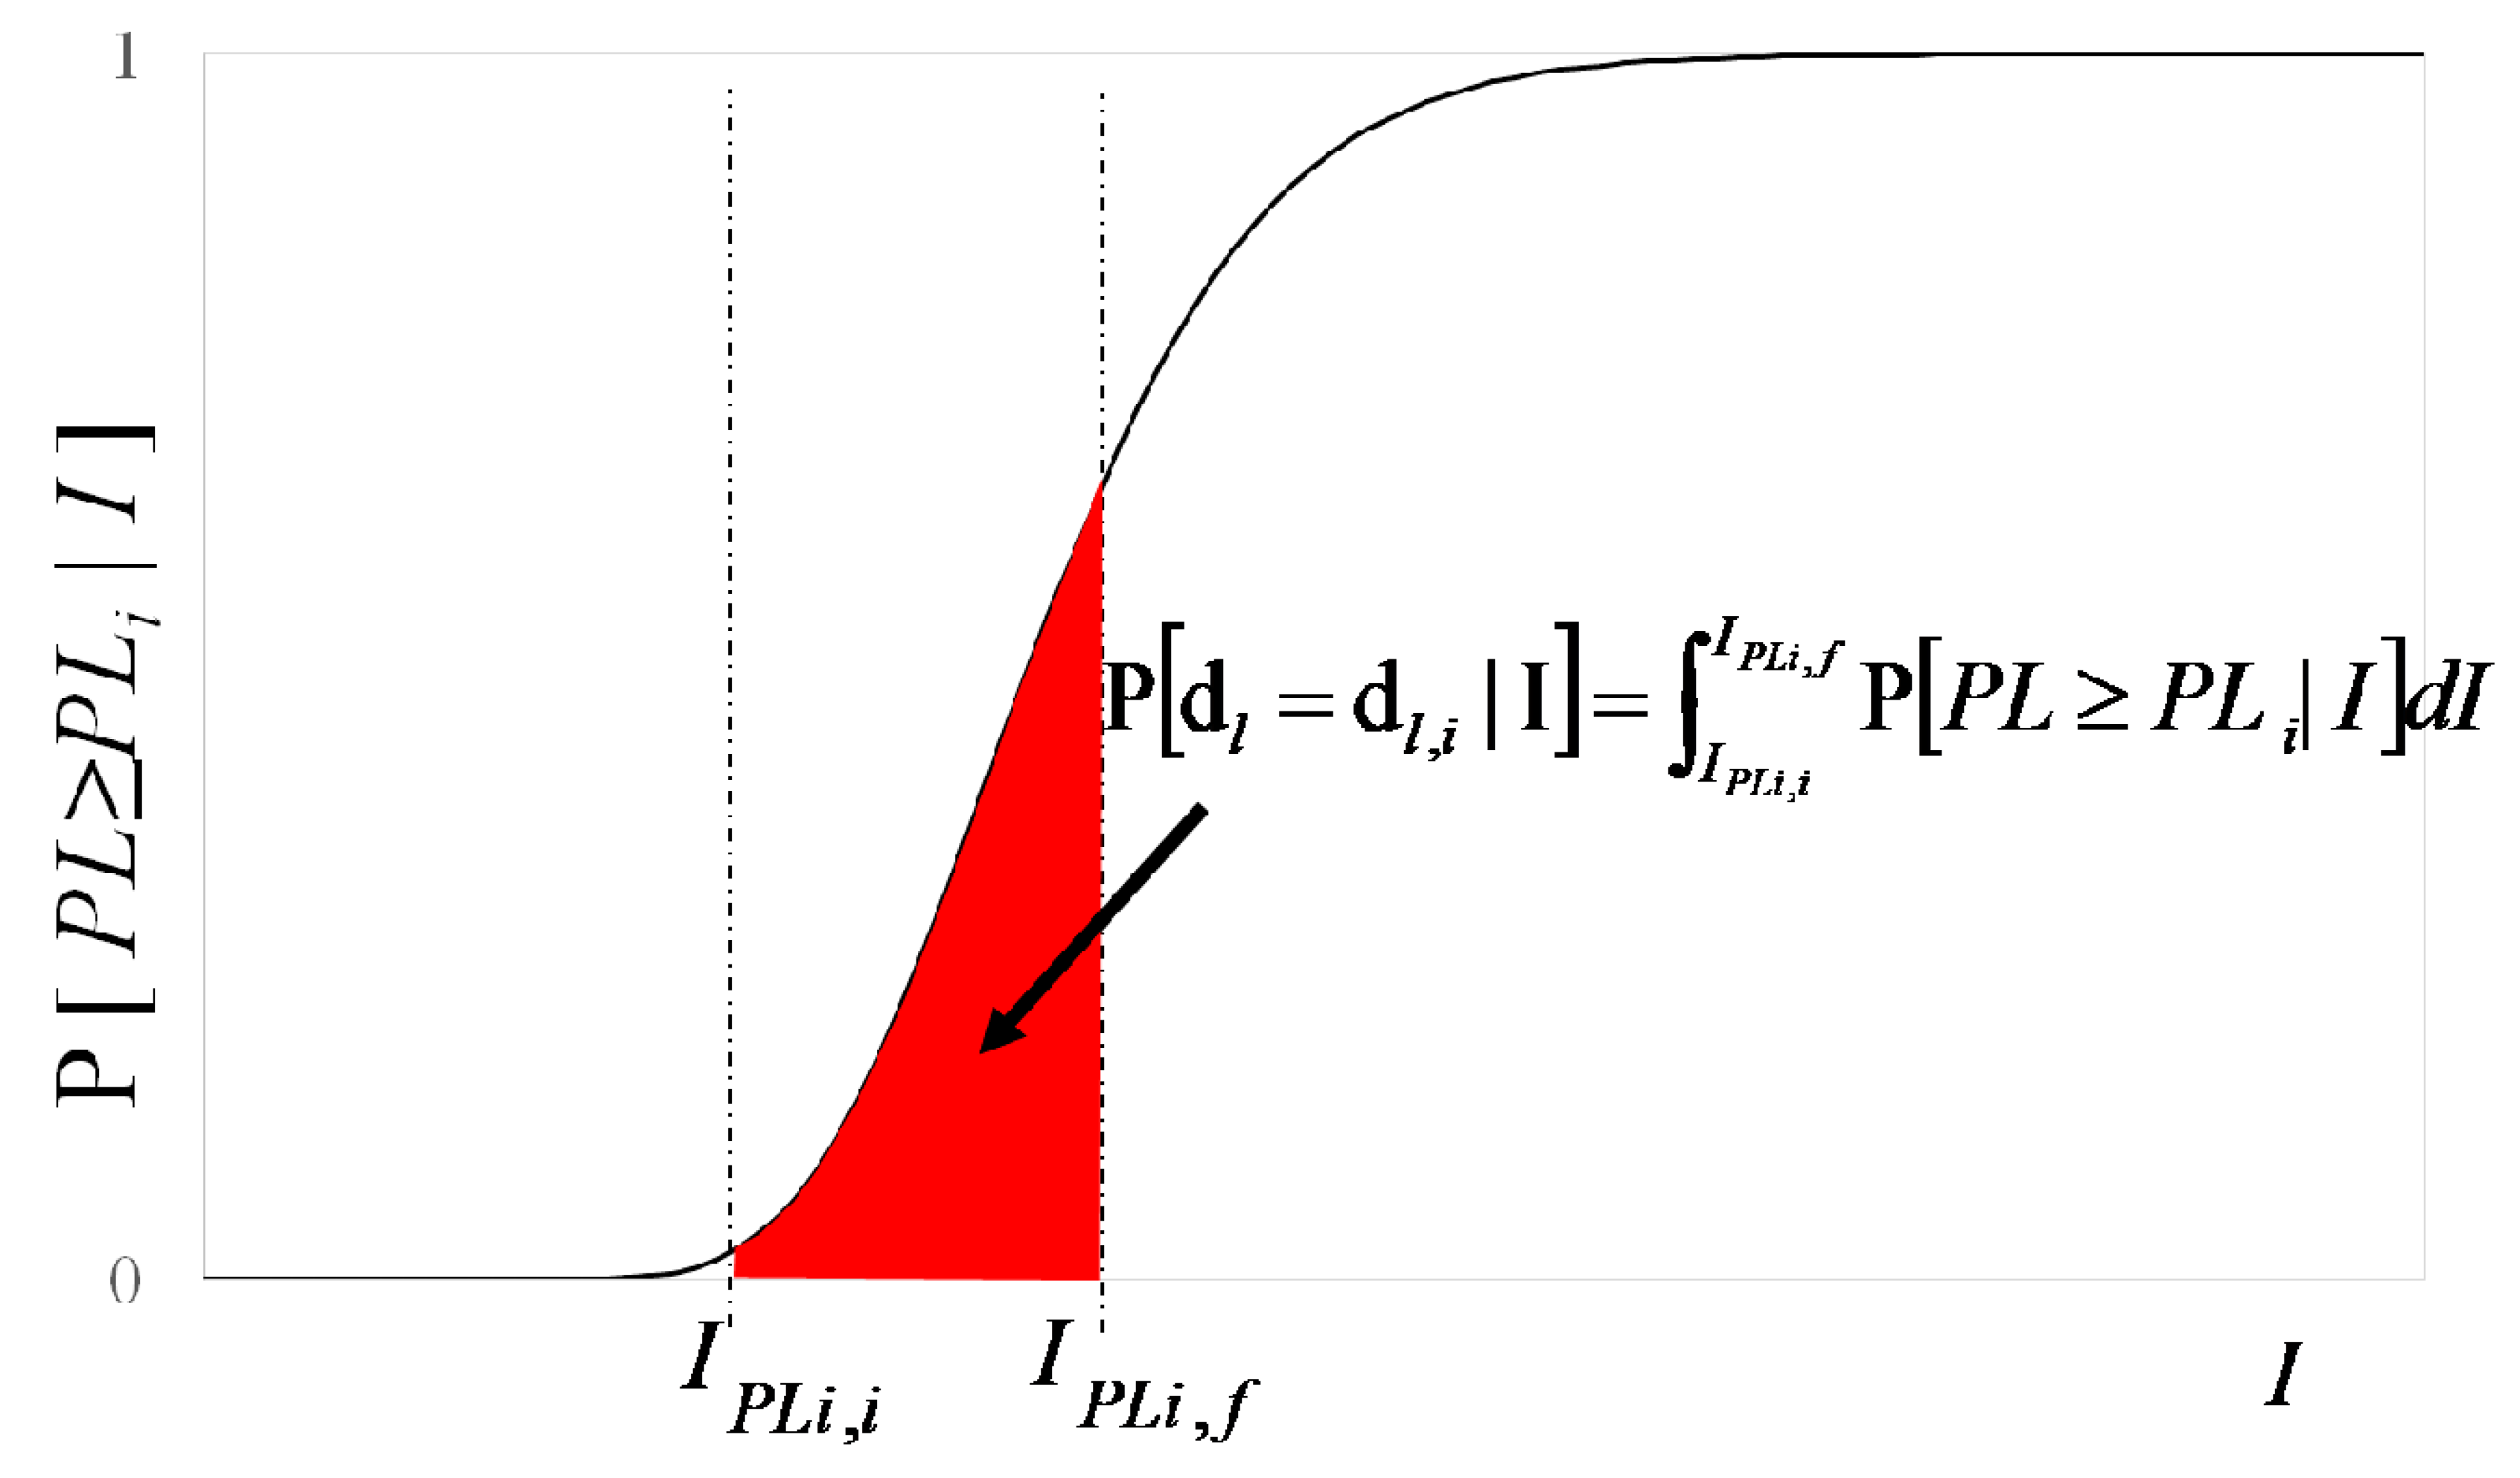
Following the flowchart (
Figure 1), probability of exceedance (P) for each performance level on the considered seismic intensity (from Hazard Analysis) can be defined as:
where
are the damage levels, given a seismic intensity I from hazard analysis.
The probability provided by cost function is based on the repair cost conditional upon the suffered damage level and the building type:
where
is the Relative repair cost; it is evaluated as the ratio of the cost of repair to the cost of replacing the building.
The total probability can be obtained:
where
is the expected value of the repair cost function for a specific building or building type, performance level and level of seismic intensity. Both structural responses and associated economic effects are defined as probabilistic variables.
In this study, the probability is given by fragility curves; the latter are cumulative distribution functions (CDF) defined by the median of the seismic intensity measure, corresponding to the exceeding of a given damage level and the dispersion obtained from the standard deviation of the natural log. This approach has been frequently used by researchers, and it is robust. The cost functions are obtained via numerical analyses using a DCM.
According to Equation (3), the expected economic losses (on a broad territorial scale) can be determined using two different procedures: scenario analysis and risk analysis. On the one hand, a risk analysis refers to all earthquakes that could occur based on estimations of the probability of losses occurring over a specified period. When employing a simpler approach, a scenario analysis refers to a given earthquake (maximum credibility, standard design, and frequent) and offers a complete account of this earthquake (or of multiple earthquakes) [
28]. To perform a seismic risk analysis, Equation (3) must be applied based on site hazard curves. For this reason, hazard curves can serve as useful and efficient tools. These curves provide information about the range of potential levels of seismic intensity and the corresponding occurrence probability levels.
The analysis approach is probabilistic because most of the intervening parameters are characterized as random variables, and this is the core of the proposed framework. Moreover, another characterizing element is the validation process.
First, a probabilistic characterization of building types is needed. Building types are determined from specific combinations of variables (such as plan dimensions, bay lengths, inter-story heights, and concrete and steel strength levels). Then, accurate numerical building models must be defined. In turn, performance levels must be characterized in a probabilistic manner to account for various seismic intensity levels. Consequently, in Equation (3), FCs can be considered the best tools for investigating building vulnerability. Notably, the model’s accuracy plays a key role when a broad territorial scale is considered, which the case for the proposed approach is.
Accurate structural models and numerical analysis methods are fundamental for the accurate evaluation of the achieved performance levels and resulting repair costs. Simplified models and inaccurate analysis methods can prove ineffective for the evaluation of component damage levels. Differences found (in terms of accuracy levels) can be attributed to the analysis methods and procedures used. In another study [
30], this issue is explored at length.
In this study, based on non-linear dynamic analysis (NLDA) results, a detailed analysis of the performance levels achieved at each seismic intensity level considered have been performed.
The structural and nonstructural components of investigated buildings types are widely characterized and studied for a broad territorial scale using an accurate structural model and sophisticated methods (NLDA). Notably, this approach improves the accuracy of the results and the accuracy of the cost function but does not require more computational effort, owing to the nonlinear used model and the current calculation potential.
The accuracy of structural performance evaluation depends on the analysis method selected and the model’s accuracy. In several past studies, static nonlinear analyses have been employed, with several improvements, extensions, and advances relative to conventional static analysis. Moreover, research group in similar contexts (Italy and other countries that are prone to earthquakes) have performed several recent studies using much less accurate approaches [
5,
31,
32,
33].
However, static analysis has several limitations, and several studies and reports in the existing literature suggest methods based on nonlinear dynamic analysis [
12,
13]. These analyses are only apparently more complex and time consuming in comparison with obtained accuracy.
Specific relationships (DMs) between performance levels and local limit structural conditions (for ductility ratios) of global engineering response parameters (interstory drift ratio, IDR) have been defined for several building types. FCs are built based on the proposed DM and are coherent with seismic assessment procedures determined from seismic codes [
34,
35].
A DM, coherent with the qualitative description of damage levels given by the macro seismic EMS-98 intensity scale [
36], is proposed and employed.
In Italy and other European countries that are prone to earthquakes, EMS98 is generally used for post-earthquake damage surveys. Furthermore, EMS98 has been used in many seismic risk studies and may be very accurately related to the instrumental seismic intensity. Moreover, in Italy, a new process for retrofitting existing buildings has been established and regulated by a recent law (Ministerial Decree No. 58, 2017) in order to make the private building stock less vulnerable to natural events. In this law (which could become a European standard), EMS98 is clearly recalled. Thus, the proposed study could be considered a useful tool to plan and verify the impact of mitigation strategies.
Each is assigned a quantitative description in terms of limit states (as reported in
Table 1) for the maximum Ductility Ratio (DR) of structural elements, defined in terms of the curvature
as:
and:
where
is the demand in terms of curvature and
is the yield curvature and
is the ultimate curvature.
DCMs are effective tools that can relate the performance of each structural or nonstructural element to its repair costs. DCMs are designed to measure uncertainties related to repair costs (for the same damage component level) due to variability in levels of damage, the characteristics of materials employed for repair, cost formulations, social-economic work conditions, etc. Generally, national-regional price lists already take into account these sources of uncertainty, providing median cost values. Moreover, for DCMs, the effects of the repair costs related to all preliminary, secondary, and supplementary works must be considered.
For a component, a DCM considers damage levels qualitatively described and quantitatively characterized. In this study, DCMs are defined for two components of the investigated Reinforced Concrete with Moment Resistant Frame (RC-MRF) building types. For the latter, the qualitative characterization of damage at the component level is executed based on experimental results, post-earthquake observations, and numerical simulations, among other methods [
37,
38,
39,
40,
41]. The last enable damage level characterizations of the components of RC-MRF buildings in terms of the form, extent and severity of damage. Each damage level can be further characterized from statistical threshold values of IDR based on the achievement of local limit states for a given component. The extensive application of DCMs to all building damage distributions allows one to define samples or datasets of global building repair costs (one for each DL and seismic intensity range of DL achievement).
Consequently, cost ratio functions can be defined as theoretical probability density functions that best fit the empirical one derived from analytically defined datasets of global building cost ratios.
The ratio cost
is defined as the ratio of the total repair cost needed to restore pre-earthquake conditions to the building replacement cost (including the demolition cost). The cost ratio can vary from 0 to 1. This parameter is more useful for determining the relative importance of repair activities than for measuring the importance of demolition and reconstruction activities. For financial feasibility evaluations, the total building replacement value can be considered [
14].
The main characteristics and contributions of the proposed approach are as follows:
FCs are based on NLDAs results for each element; NLDAs reproduce variability in structural performance resulting from mechanical, geometric, and structural uncertainty. On the contrary, in studies focusing on a broad territorial scale, simplified methods are generally considered.
Damage distributions are accurately evaluated element-by-element according to a new DM. Via element-by-element performance analysis, cost ratio functions are derived.
Numerous uncertainties related to seismic risk analysis (demand parameters, damage states, repair costs, and times) are adequately considered.
Element-by-element analyses are related to the corresponding repair costs of the proposed DCMs.
Repair practices, real labor and material costs of DCMs for common building types are defined. Expert evaluations are excluded; consequently, DCMs are probabilistic for damage level thresholds, for repair interventions and for corresponding costs.
Cost ratio functions are useful for evaluating the economic convenience of total repair or reconstruction strategies. These functions relate to the predominant structural importance of repairs (due to damage to reinforced concrete columns and brick walls) related to building replacement.
In defining the DM, EMS98 is considered. The latter is commonly used in seismic risk studies and in mitigation strategies.
2.1. Example
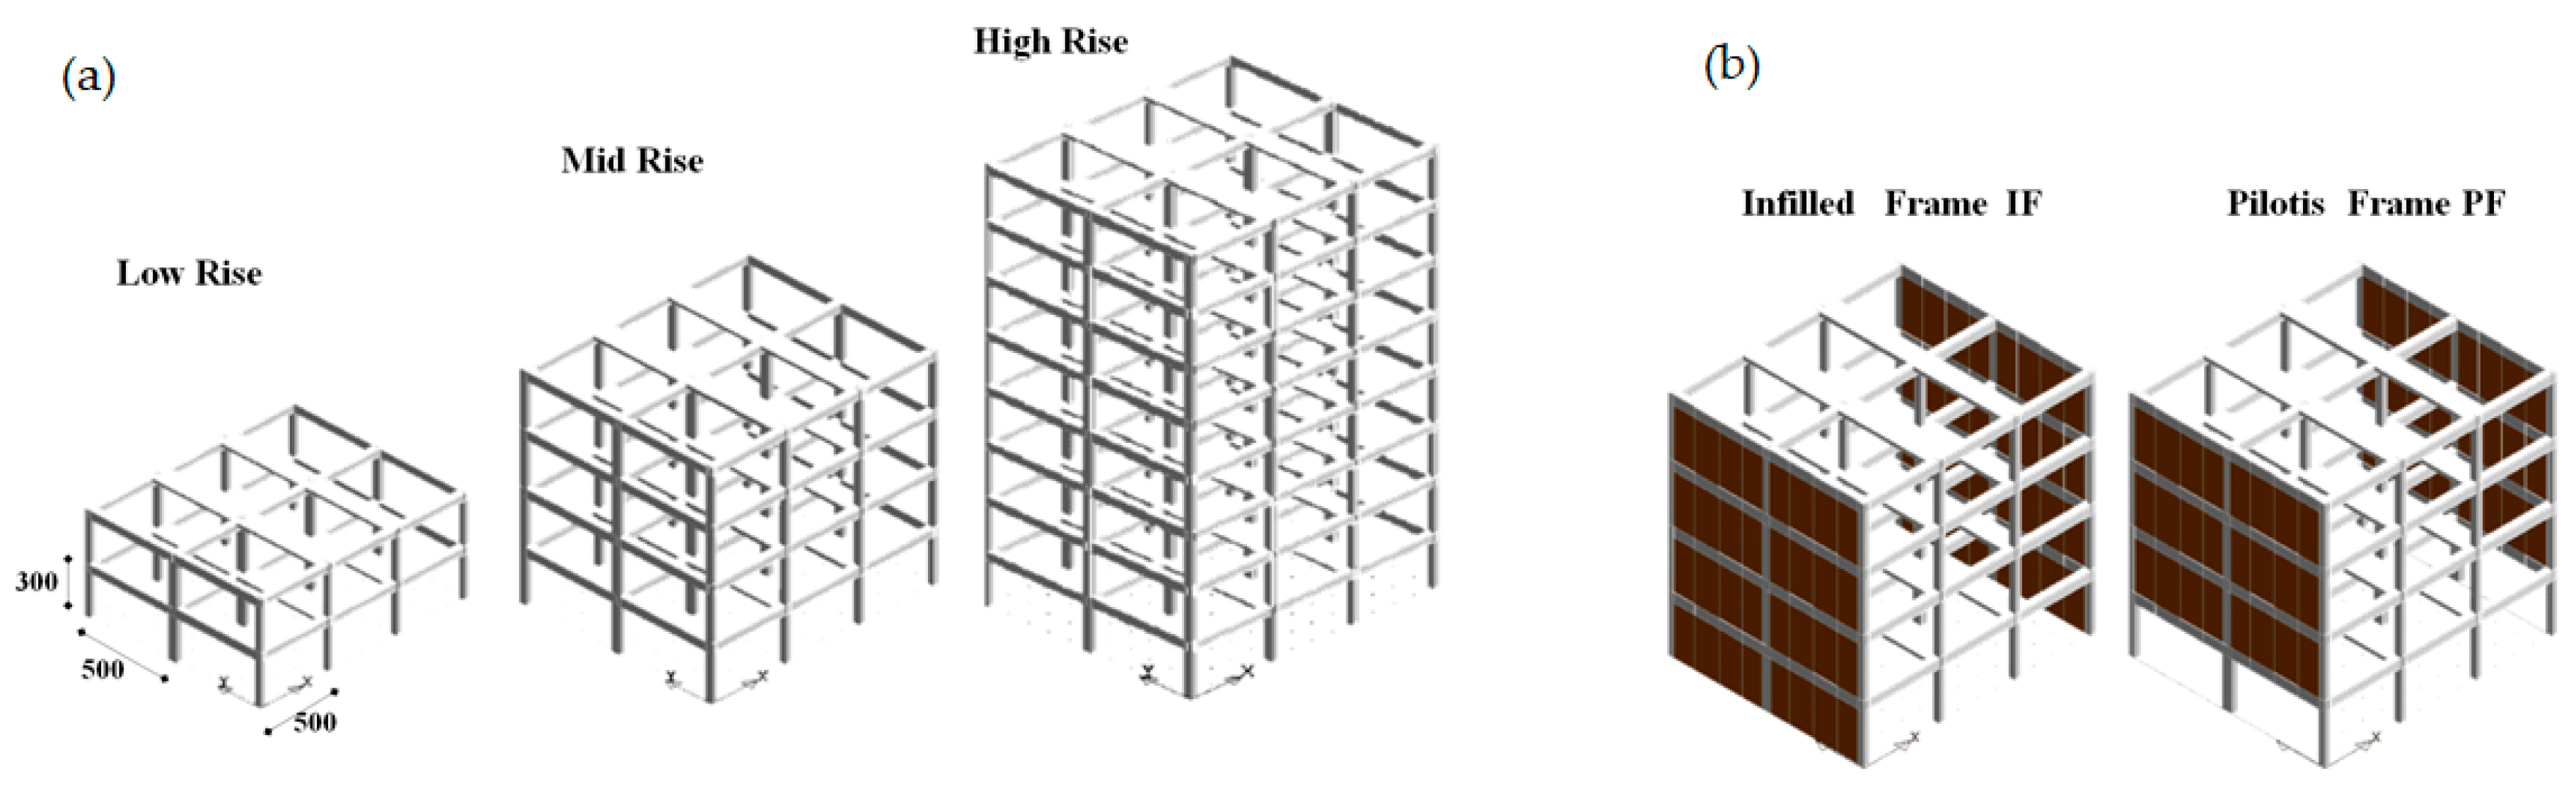
To better explain the new procedure and to illustrate its accuracy and reliability when applied on a broad territorial scale, the proposed approach was employed in the assessment of economic direct seismic losses of widely used RC-MRFs for Italian and European buildings. The building types considered in previous studies [
42,
43,
44] based on their characteristics and based on acquired numerical results are considered perfectly coherent with the proposed approach, and so they are used to better describe the proposed approach. The main features of the types are reported in
Figure 2.
To illustrate the possible application of the proposed approach, in this section, a case study based on previous studies [
43] is considered. The considered existing buildings are based on several types. In this study, only four types are considered: bare-frame (BF) and infilled-frame (IF) with low (2-story) and middle (4-story) rise. These buildings are designed according to Italian old-seismic code (old-Code, OC) and pre seismic code (pre-code, PC) buildings, which form the reference buildings. For the sake of brevity, only the main details are reported in this section. Two beam-column configurations and several values of concrete and steel strengths have been considered for each building type. The dimensions of cross-sections and the amount of reinforcements have been evaluated performing the simulated design coherently with the considered code.
Figure 2 illustrates the geometrical configurations of the considered building types in terms of the dimension plane, number of stories, and beam-column stiffness configurations.
Based on the timing of design and construction, buildings composed of RC-MRF are considered: RC-MRF low-engineered and designed based on an OC and PC typically used in Italy. According to statistical distributions of concrete strength for the two construction periods, the following three different values for the compressive strength of concrete are considered for the OC and PC types, respectively:
and
. Moreover, each building type is characterized in terms of its infill panel distributions and effectiveness (BF, IF, and Pilotis-Frame PF), number of stories (2-4-8 stories) and structural details. The seismic responses of building types are analyzed with NLDAs using the IDARC2Dsoftwarevia lumped plasticity modeling based on the three-parameter hysteretic Park model [
45,
46], applying 50 natural accelerograms. The achieved seismic performance is expressed in terms of the global EDP (IDR) and local structural parameters (ductility ratio of structural elements). To define FCs, a detailed analysis of the local performance levels achieved at each seismic intensity level considered is performed based on the DM presented in
Table 1.
To better describe the proposed procedure,
Figure 3 provides several examples. The damage distributions (based on numerical results) of each damage level and seismic range considered are shown.
Figure 3 shows different damage component (structural and nonstructural elements) distributions for the same global damage level. In particular,
Figure 3 illustrates variability in the following:
the number and locations of structural elements with the same section yields as the most stressed element;
the number and locations of structural elements with lower section yield levels than those of the most stressed element; and
the number and locations of nonstructural elements observed at different section yield levels.
Consequently, differences in component damage distributions lead to relevant differences in repair costs. Based on the differences reported in
Figure 3, cost ratio functions must be dependent on seismic intensity levels. Thus, in defining cost ratio functions, for each NLDA, repair costs must be evaluated based on real damage distributions. For this purpose, building damage distributions must be investigated based on components of DCMs.
A set of repair tasks is defined for each damaged component, involving all preliminary, complementary and supplementary activities. These activities are defined based on practices used by professionals and construction companies. Global repair costs are evaluated. For the RC-MRF considered in this study,
Table 2 and
Table 3 provide examples of DCMs for structural and nonstructural elements. The best-fitting distribution of empirical damage is evaluated based on goodness-of-fit statistical tests. In this study, the best-fitting log-normal and beta distributions were determined.
Based on accurate and available numerical results (from NLDAs and natural accelerograms), a detailed analysis of performance levels achieved at each seismic intensity level considered was performed. FCs were developed using the proposed DM.
The Housner intensity level is considered a reference parameter of seismic intensity. On the one hand, this intensity level is used to achieve a realistic hazard level. The recorded accelerograms are the more appropriate choice when performing vulnerability studies of RC buildings [
14]. For these reasons, from NLDAs, 50 accelerograms were selected based on a Housner intensity range of 0.09–2.34 m and a peak ground acceleration (PGA) range of 0.05–0.50 g. The Housner intensity level, unlike other seismic intensity parameters, is capable of appropriately representing the damage that can result from real seismic events, and it is strictly correlated with engineering response damage parameters [
44]. Moreover, the Housner intensity level is related to the macro seismic EMS-98 intensity scale [
36]. The latter is commonly used in seismic risk analyses and is useful for validation purposes. In this manner, based on the relationship between the European macro seismic scale EMS-98 and Housner intensity level (
) proposed in Chiauzzi et al., [
29], the equivalence between
and EMS-98 is considered.
The damage distributions numerically acquired were investigated based on DCMs. First, DCMs for three component groups were developed: a beam/column (joint), slab/column (joint), and masonry infill panel. The ductility ratio is the parameter most relevant to the beam/column joint and slab/column joint performance groups. However, for masonry infill panels, the IDR is considered.
Thus, in defining the cost ratio functions of a type, DL and intensity range, the repair costs of each real damage distribution must be evaluated based on the component DCMs.
For the moment-resisting reinforced concrete frame considered in this study,
Table 2 and
Table 3 present examples of DCMs for structural and nonstructural elements. The best-fitting distribution of empirical damage is evaluated based on the goodness-of-fit statistical tests. The best-fitting log-normal and beta distributions were determined.
Four damage states were considered for each component. Each damage state was characterized by a specific limit condition for the reference engineering response parameter and by a set of repair activities required to restore the component’s pre-earthquake state. All required secondary work phases were applied (e.g., the installation of scaffolding, the installation of shoring to support gravity loads, the demolition and consequent replacement and restoration of partitions and furnishings obstructing access to RC structural elements, the repair or substitution of electrical and plumbing systems directly connected to these elements, and technical costs).
DCMs for structural systems with different elements and corresponding orientations and configuration were developed (
Table 2). DCMs for masonry infill panels with different types of openings (windows or doors) are considered (see
Table 3). Economic quantifications of repair activities were based on the price list for the Abruzzo Region in correspondence with L’Aquila reconstruction process data.
Based on the defined DCMs, for each form of numerical damage, a global repair cost was assigned and then normalized to a rebuilding cost of 1100 €/m
2. In turn, datasets of global repair costs were developed (
Table 4).
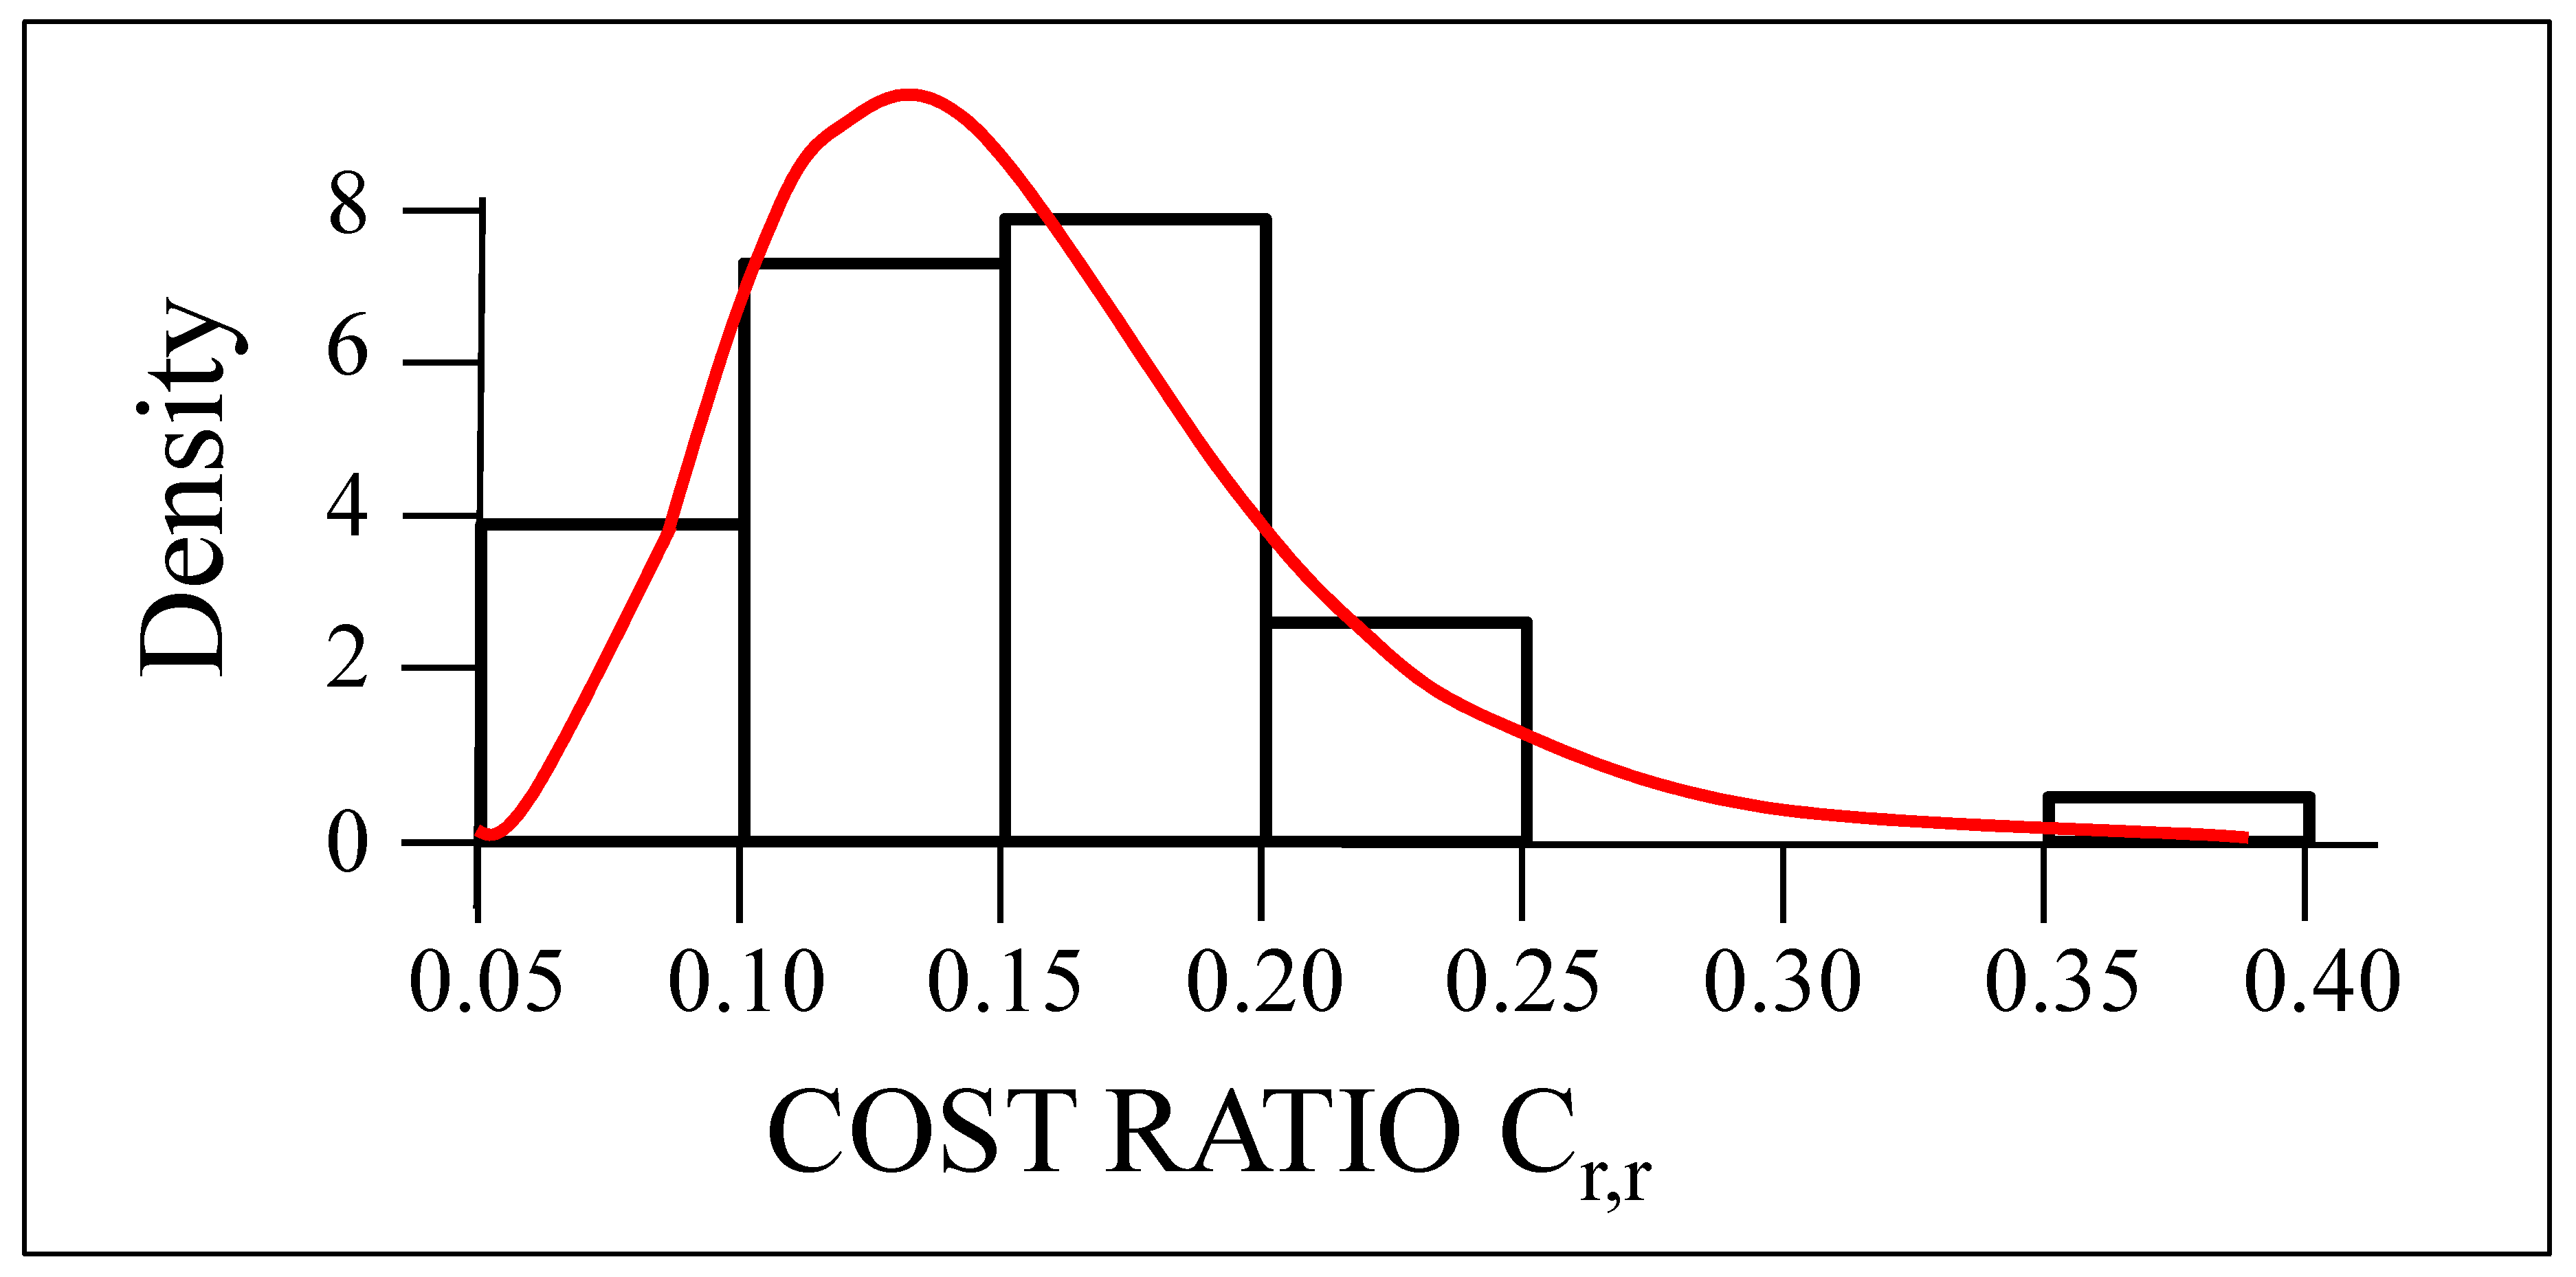
Based on the datasets of cost ratios, empirical probability density distributions were developed for each building type, damage level and seismic intensity range considered. A Kolmogorov-Smirnov test was conducted to determine the goodness-of-fit of several probability density functions (PDF): Exponential, Beta, Normal, Log-normal, Gamma, and Weibull. These functions were used to fit the empirical distributions of cost ratio datasets. The Kolmogorov-Smirnov test results were used to compare the theoretical PDF and empirical distributions. The lowest value for the Kolmogorov-Smirnov test results corresponds to the best-fitting theoretical PDF. For example,
Figure 4 shows the log-normal cost ratio function of 2-story Bare Frame-PC types for damage level 2, and other test results are reported in
Table 5. Log-normal density functions are determined to best fit the discrete empirical frequency distributions of the cost ratio.
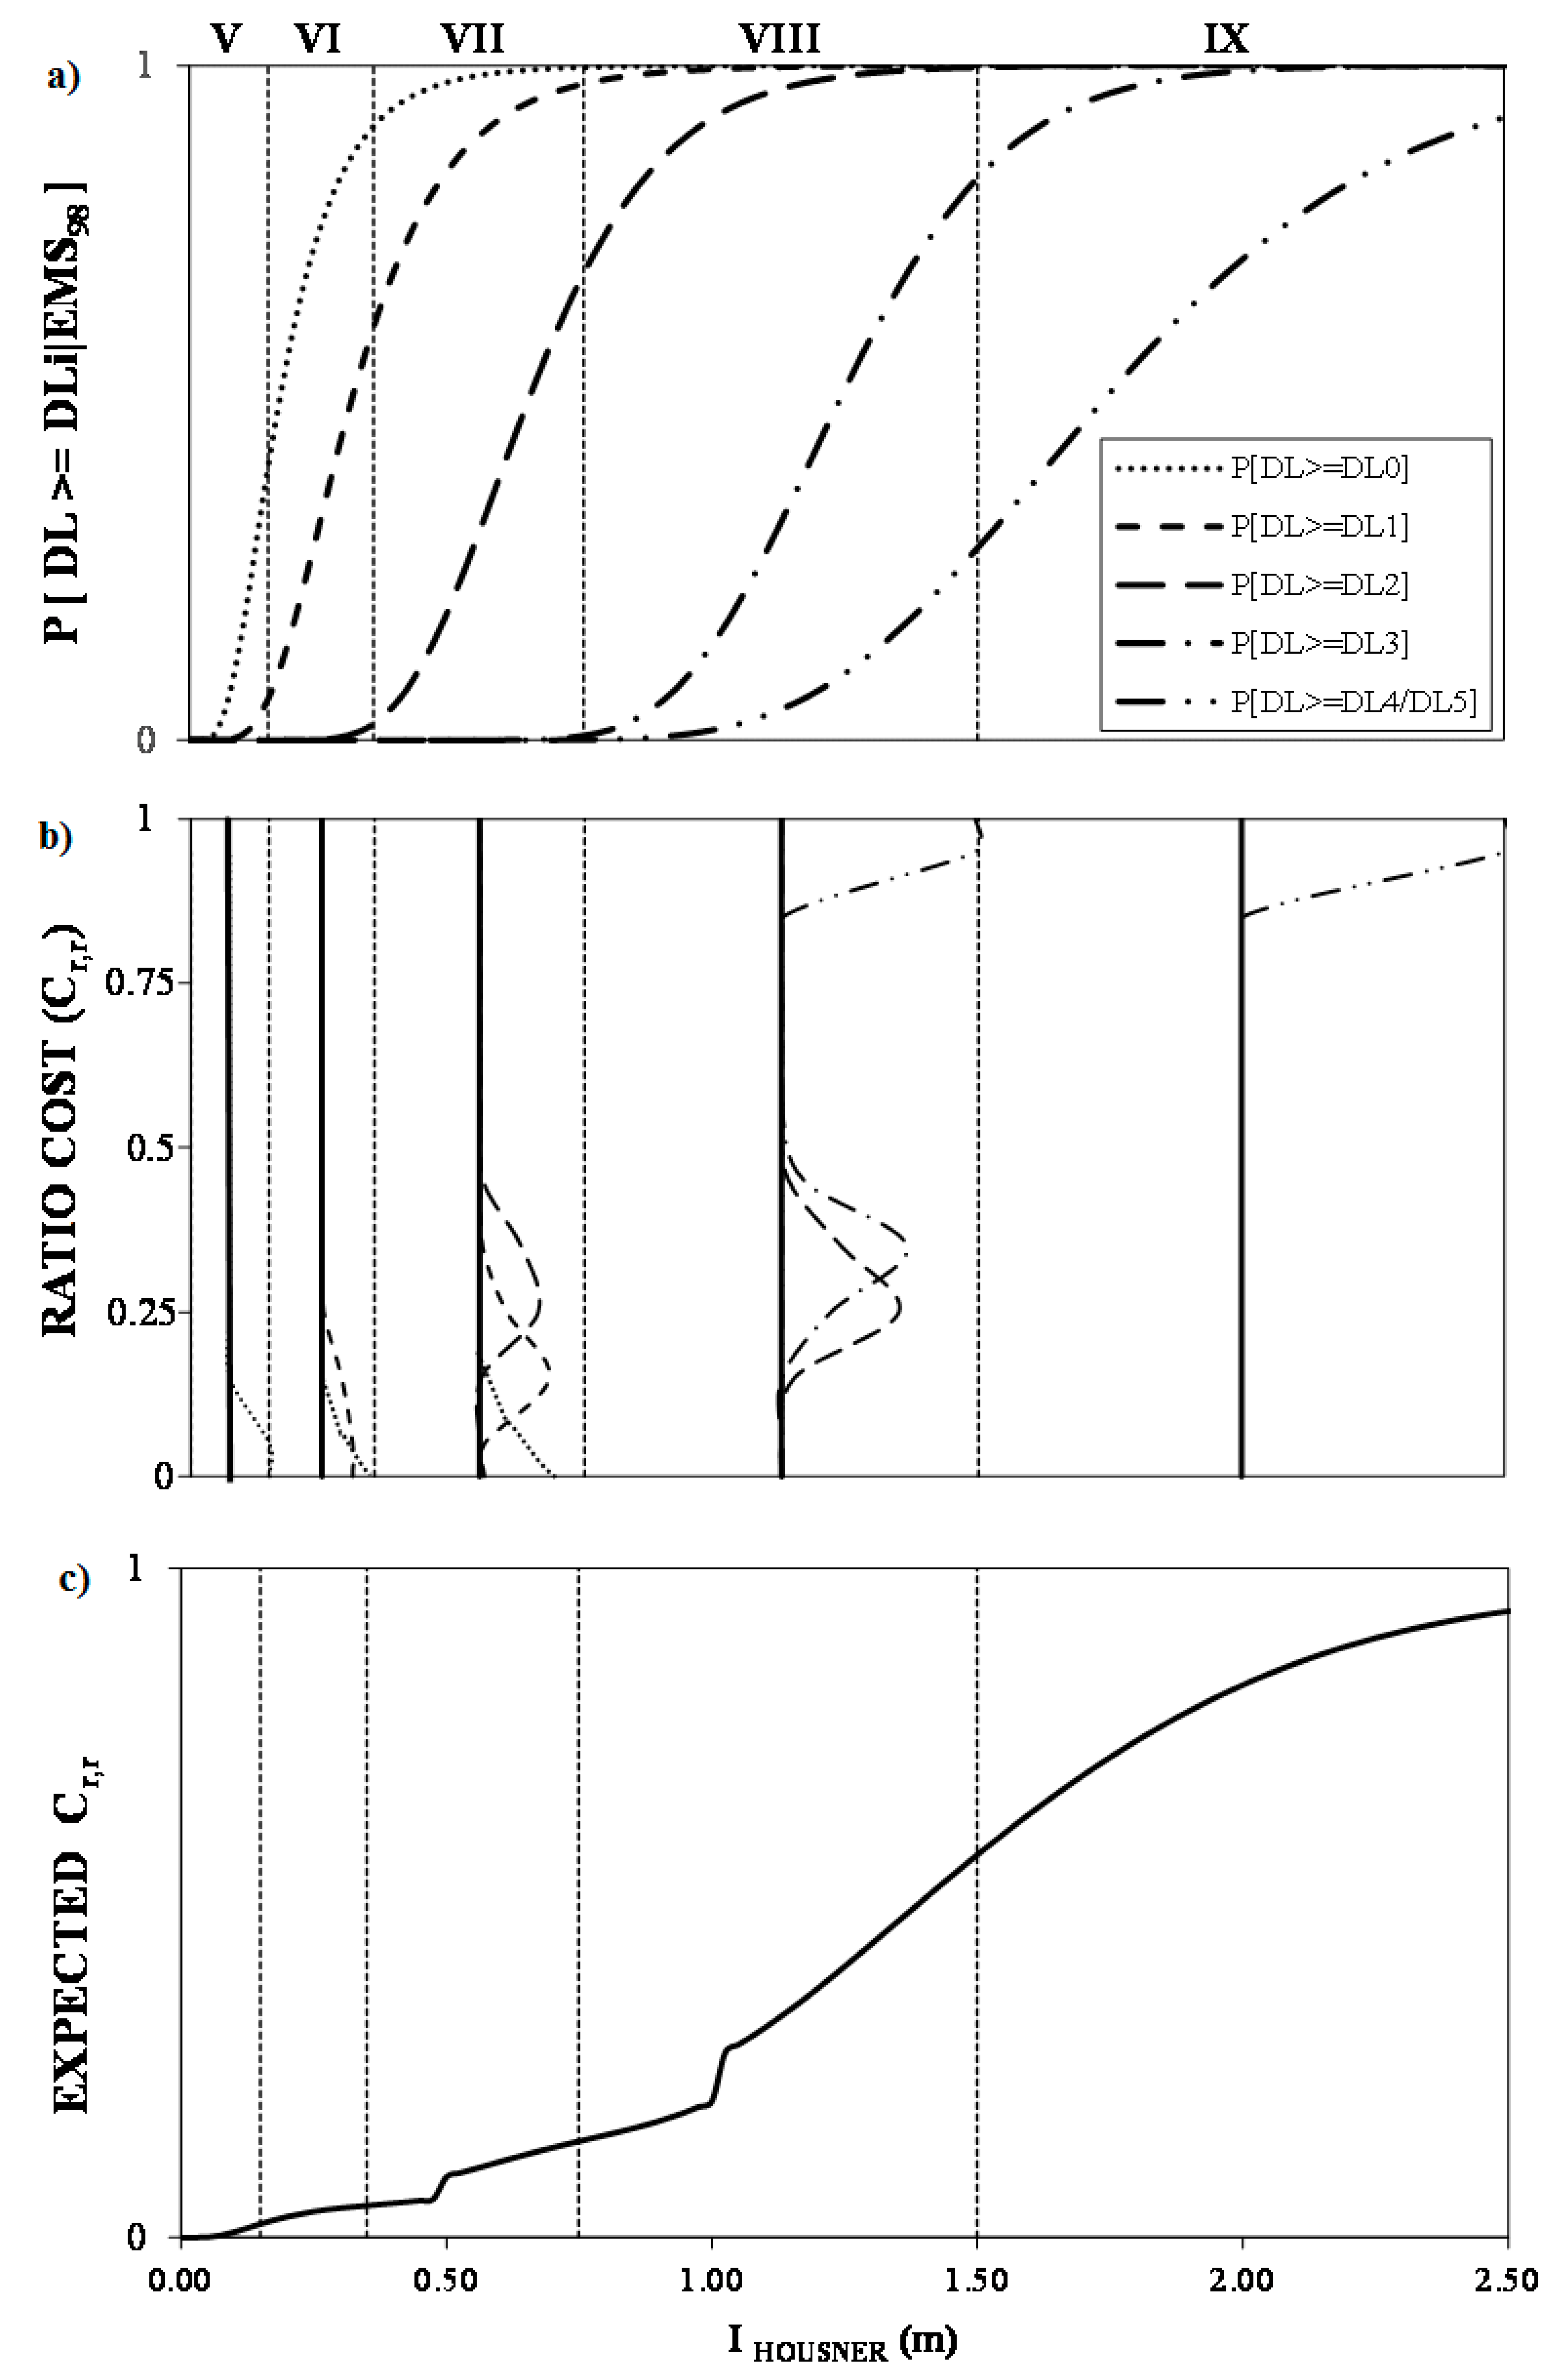
Finally, based on Equation (3), economic direct seismic loss models for each building type considered are proposed. As an example, for one building type, lognormal parameters of FCs and repair cost functions are reported in the
Appendix. In particular, the considered type is a reinforced concrete (RC) type with a moment-resistant frame (MRF), designed following the pre-code standard. For this type,
Figure 5a illustrates fragility curves according to the damage model while cost ratio functions for damage levels are reported in
Figure 5b. Finally, the convolution observed between the FCs and the cost ratio functions are reported in
Figure 5c.
The typological cost ratio functions obtained reveal significant differences in repair costs for the same performance and seismic intensity levels.
The differences found are mainly attributable to the intrinsic features of building types. In general, higher levels of deformation capacity (linked to the number of stories, to infill panel distributions and to their effectiveness) have economic effects that are more significant due to the presence of a large number of damaged structural and nonstructural elements independent of vulnerability levels.
For example, for PF types, the number and distributions of damaged structural and nonstructural elements are lower. They are mainly found on the first level and sometimes on upper levels. Under conditions of near collapse, other infill panels and structural elements are slightly damaged. Consequently, the repair costs are lower despite vulnerability levels being higher. On the other hand, BF types are characterized by higher cost ratios than IF and PF types, even when they are less vulnerable than the latter.
In this manner, the defined damage consequence models provide information about the monetary losses expected as a consequence of vulnerability and deformation capacity. The defined damage consequence models reveal the following:
For BF and PF types, similar economic losses are anticipated. The higher vulnerability of PF is balanced by lower levels of deformability and thus by lower repair costs; on the other hand, the moderate vulnerability of BFs combined with high levels of deformability imply high repair costs;
For IF, lesser monetary losses are evaluated from beneficial effects in terms of vulnerability levels and repair costs of effective and regularly distributed infill panels;
Economic losses decrease from PC buildings (designed for gravity loads) to OC buildings (designed with some anti-seismic criteria, but which are less effective); and
The number of stories seems to be less relevant to economic losses, as similar values are obtained for low-and high-rise buildings.
2.2. Validation of the Proposed Procedure
In the following section, the proposed means of defining cost ratio functions is validated from reconstruction data for the L’Aquila earthquake (2009) [
26,
27]. The validation phase was an interesting stage of this research project. It must be highlighted that the validation results are conditioned by the limited information about L’Aquila buildings that is available. Nevertheless, the results reflect a key step towards illustrating the accuracy of the proposed DCMs.
After the L’Aquila earthquake struck on 6 April, 2009, several codes and regulations [
47,
48] were issued to regulate the reconstruction process. According to the L’Aquila reconstruction plan, economic support is defined based on the building usability rate defined by in situ inspections. Statistics regarding the funded repair costs have been published for residential RC buildings of the town of L’Aquila located outside of the historical center [
26,
27]. In such works, repair costs are reported only in terms of the detected damage level (related to the usability rate) without any reference to construction times, infill panel distributions and their effectiveness, numberof stories, etc.
Based on the survey form for usability and damage (Ae DES), a correlation between Ae DES damage levels and EMS-98 damage grade (DG) levels [
36] was defined according to the maximum amount of damage detected from vertical structures and infill panels [
49].
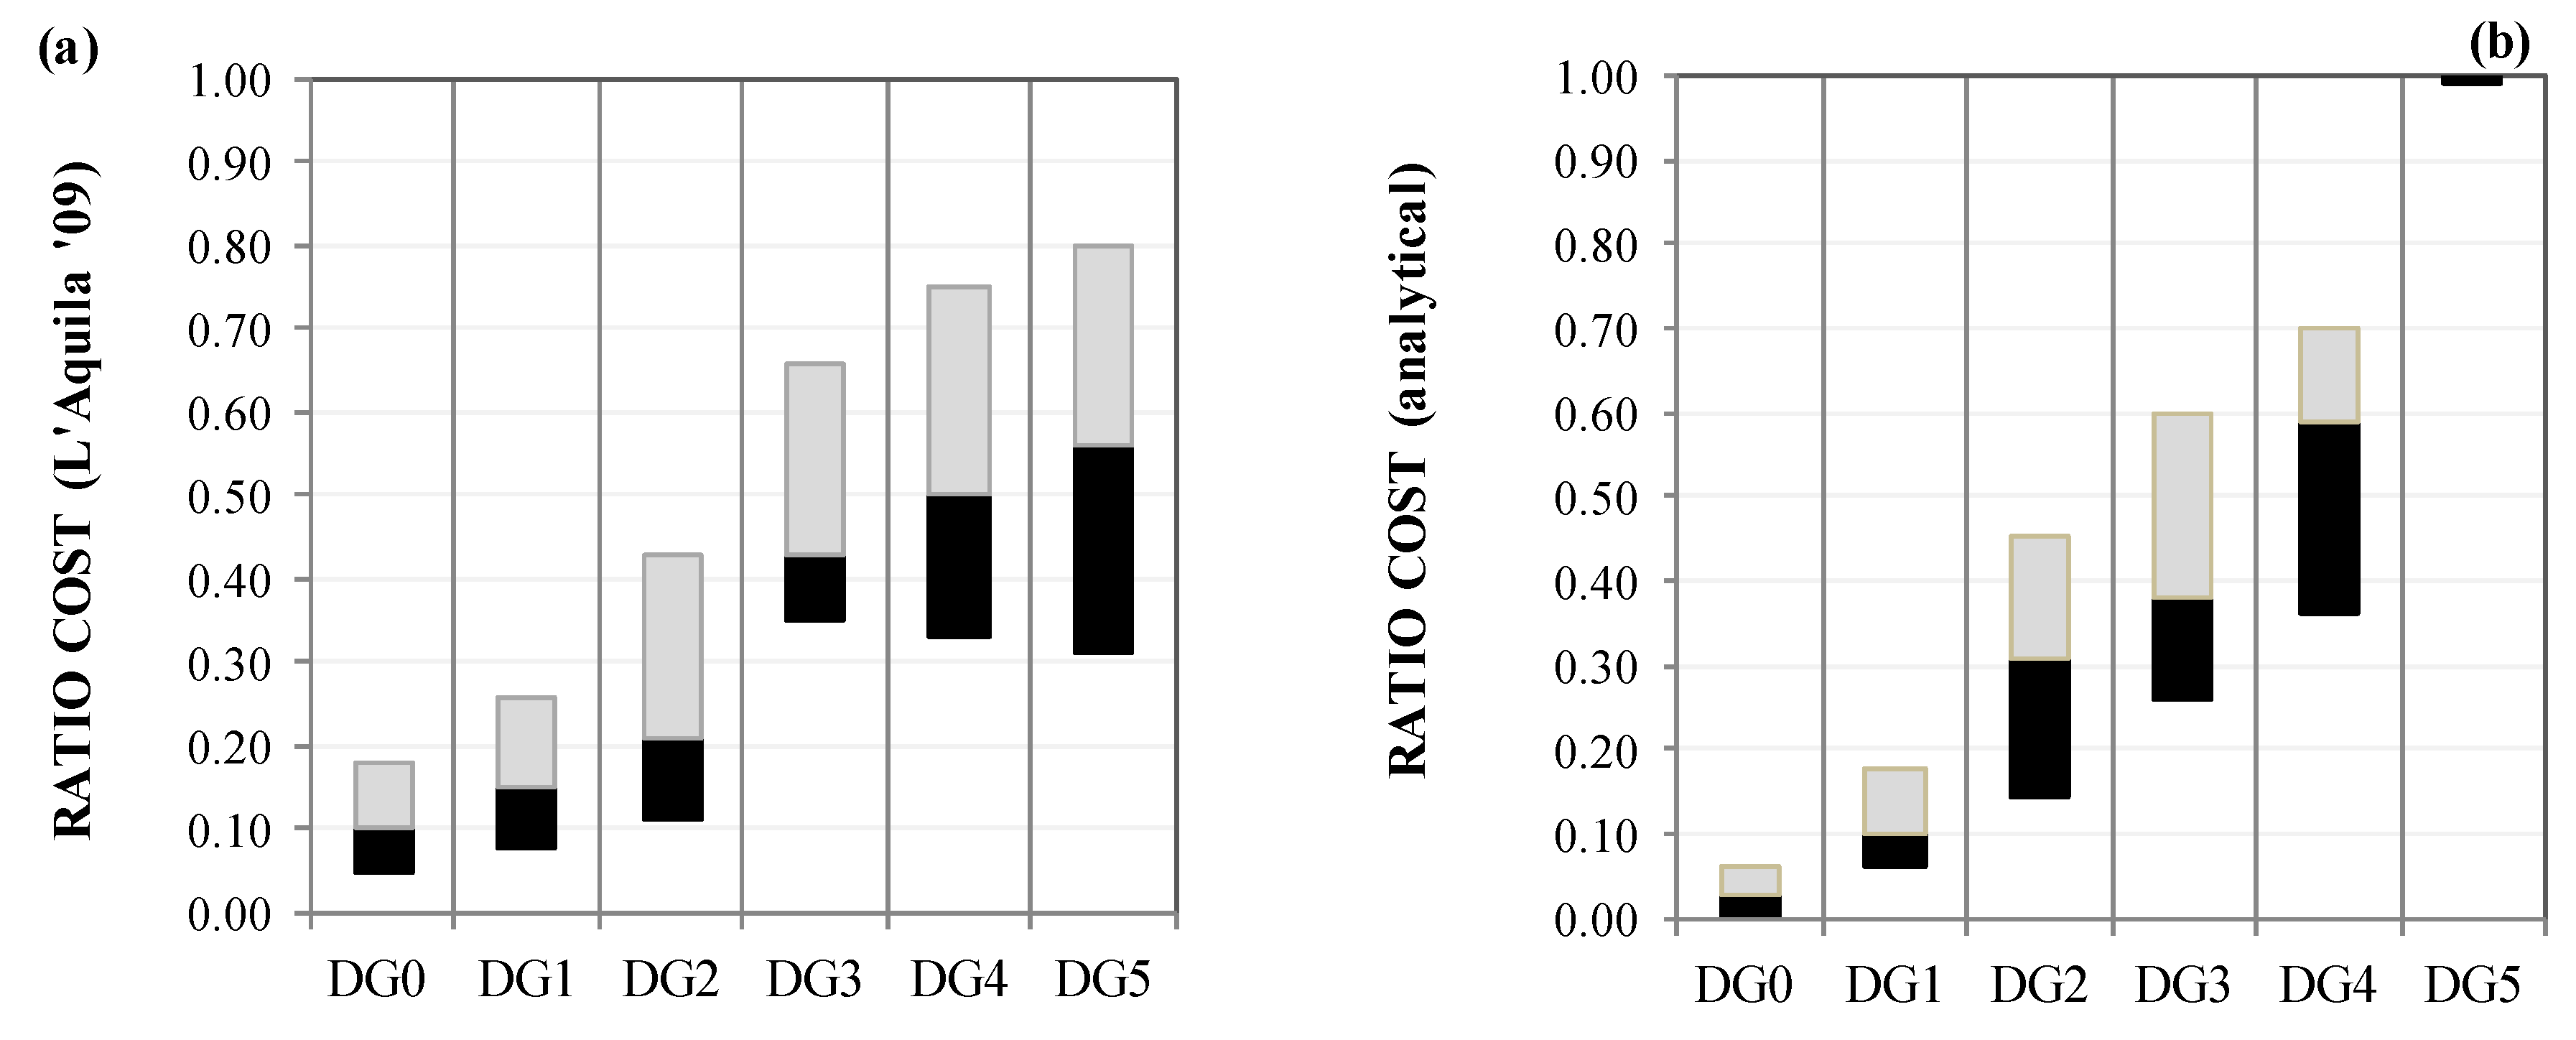
Figure 6a, based on data from De Martino et al., [
49], shows the median and the 16th and 84th percentiles of funded repair costs for the L’Aquila reconstruction process and for different EMS-98 damage grades.
For validation purposes, the same numerical results considered in the previous section are considered here. Thus, the above-described building types are considered representative of all RC building types of the building stock of L’Aquila outside of the historical center. This is an acceptable approximation that is coherent with information about L’Aquila’s building stock and with procedures used to define building types [
26,
27,
42].
Coherent with the L’Aquila data, the median (16th and 84th percentile values of analytically obtained cost ratios) is defined for each EMS-98 damage grade (DG). The corresponding results are reported in
Figure 6b. For this goal, a rational relation between the maximum IDR achieved and EMS-98 damage grades is established (DG0 0–0.5%, DG1 0.5–1%, DG2 1–1.5%, DG3 1.5–2%, DG4 2–2.5%, and DG5 > 2.5%).
Figure 6 shows good agreement between the cost of the proposed procedure and the L’Aquila data.
Some differences found may be attributed to the DM and DCM used in the above described fragility analysis. The DM employed relates EMS-98 damage grades to the maximum performance of the structural elements, whereas in the empirical data [
26,
27,
49], the same grades are related to the maximum damage level detached from the vertical structure or from infill panels.
The differences between the L’Aquila data and analytical cost ratios found for damage grades DG0, DG1, and DG2 are highlighted. For DG0, the L’Aquila data box-plot seems to provide values that are too high, given that DG0 should be associated with undamaged buildings. The analytical box-plot seems to be more effective; it is related to the cost of superficial repair operations applied to plaster and other furnishings. However, for DG0, DG1, and DG2, the box-plots show a similar trend. Furthermore, for DG3 and DG4, similar cost ratios are obtained.
For DG5, strong differences are found. The empirical box-plot appears to contrast with the standard definition of building collapse. In particular, the 16th and median values could be considered unacceptable for collapsed buildings. Conversely, the collapsed analytical box plot is based on a unitary cost ratio (demolition plus rebuilding). The analytical values appear to be more realistic, but in some cases, these values may be too conservative and very costly. According to seismic code previsions [
34], the collapse performance state is assigned when only a single structural element verifies the collapse condition (which in terms of rotation is
), although it does not provide an effective measure of building collapse.
The difference between empirical and analytical cost ratios is mostly dependent on differences between the building types compared. From the published data, L’Aquila building stock is known only in terms of structural typologies (RC structures), based on the number of stories and construction times. No information about material characteristics, structural configurations, infill panel distributions, etc. is provided. Moreover, other differences may be attributed to specific building characteristics that influence repair costs (e.g., positioning, work accessibility, interactions with other buildings, and maintenance patterns) not considered in this analytical study.
From these positive comparative results, the theoretically defined approach, when applied to an accurate set of numerical results, could be considered a valid tool for seismic risk mitigation from an economic point of view and on a broad territorial scale.
3. Application
To perform a first application of the proposed approach, the widely investigated town of Potenza is used as a test site. Potenza (located in the Basilicata region of Southern Italy) is studied due to the availability of a large dataset concerning building types for this particular town. Moreover, exposure levels and types of buildings characteristic of Potenza can be considered representative of most towns and villages of southern Italy. Like other southern cities and villages, Potenza has been affected by several destructive earthquakes (e.g., 1273, I
0 = VIII-IX MCS; 1561, I
0 = X; 1694, I
0 = XI; 1826, I
0 = IX; 1857, I
0 = XI) and by subsequent reconstruction processes. Moreover, Potenza has been the subject of several national and international projects [
28,
29,
50], especially projects focusing on building vulnerability. Consequently, though limited to RC buildings, this application on Potenza can be considered as an improvement of the previous studies. This improvement benefits of the validation.
A data base regarding residential buildings is used; it has obtained from the 1990 Basilicata post-earthquake survey [
50], a first level GNDT90 inspection of damage and vulnerability levels (GNDT Working Group, 1990). Through several recent research projects, the database has been significantly improved and upgraded to include buildings built after 1990, which are RC structures [
29]. The database lists geometric and quantitative characteristics of all buildings (i.e., heights, plan and elevation sizes, ages, and vertical and horizontal structures).
Given that the aim of this application is a simple and initial use of the proposed procedure, the data are employed in aggregate form.
Table 6 reports the total number of Potenza RC buildings considered, which are differentiated by the time of construction and the number of stories. The approach proposed for the estimation of expected direct seismic economic losses is applied to these RC building types.
According to relationships between the RC building types identified for Potenza and types analyzed in previous studies [
42,
43].
Based on an analysis of the levels of seismic performance achieved for each type, FCs for RC building types identified for Potenza, which differ in terms of construction age and number of stories, are defined and reported in
Figure 7. The FCs considered are developed in terms of Housner intensity levels and in accordance with the performance-level prescriptions of the Italian Seismic Code (NTC18).
Based on the proposed approach (Equation (3)) and from the correlation between Housner intensity levels and EMS98 reported in Chiauzzi et al., [
29], a single economic seismic loss scenario analysis is performed for
. For this first application, only the potential economic effects of the life safety performance level (LS-PL) and the collapse performance level (C-PL) on
macroseismic levels are evaluated. In this first application, operative performance level (O-PL) and damage performance level (D-PL) have not been considered.
Building types identified for Potenza are linked to types described in the previous section (
Figure 2): merging these types without considering the infill masonry panels, new FCs have been developed (
Figure 8). Probabilities of occurrence
for life safety and collapse performance levels are evaluated from FCs. A complete probabilistic characterization of building types is possiblein terms of exceedance probabilities for each performance level to vary the seismic intensity. It is to be noted that the hazard levels for each PL could be characterized by seismic intensities in different ways. More specifically, each hazard level can be characterized by a seismic intensity range (as typically occurs for macro seismic intensity or seismic regions), or by a single seismic intensity value. In this study, the performance level have been quantified in terms of probability, considering the macroseismic intensity (EMS) and its relationship with instrumental seismic measurement (Housner intensity). For each given performance level, an intensity range must be considered. Consequently, the obtained probability is
, as reported in
Figure 7 for considered performance level and corresponding seismic intensity range
.
Based on the above described procedure (
Section 2.1) and based on numerical damage distributions of the building types analyzed by means of the constructed DCMs, the LS-PL and C-PL repair costs for each building type are evaluated. In particular, for each type, the normalized global repair costs for LS-PL and C-PL (based on a rebuild cost of 1100 €/m
2) are evaluated. For each building type (
Table 6) the convolution between the probabilities of occurrence and the cost ratio functions is evaluated. Repair cost functions are also evaluated. The corresponding results are provided in
Table 7.
Finally, the total repair cost for each building type is evaluated based on the total building surface, weighting for the probability of different performance levels.
The evaluated expected seismic direct economic losses can be considered a lower limit. The real value of losses can be different due to peculiarities of building types, degradation, and obsolescence levels, structural irregularities, the number of buildings present, etc. These factors are not considered in this study. Moreover, the “actual” seismic input and its frequency must be considered to make a more realistic evaluation.
The application demonstrates how the proposed procedure can address specific practical needs, especially in the mitigation phase.
4. Conclusions
In this study, a procedure for the evaluation of directseismic economic losses is defined, validated, and tested. The proposed method is based on a building-based vulnerability assessment approach.
The present work provides fragility and cost analyses. FCs are derived from structural performance assessments according to a DM that characterizes damage levels of the EMS98 scale in terms of IDR threshold values corresponding to the achievement of specific structural element yield levels. The DM developed can be used to investigate existing MRF building types.
Regarding costs, new cost ratio functions based on an analysis of the performance of each structural and no-structural element are defined. These are a product of variability in building type damage distributions of the same performance level as a consequence of the probabilistic building characterization and of differences in seismic inputs applied. Moreover, they are defined for specific types, for global damage levels and for continuously-increasing ranges of seismic intensity based on the same level of damage. The cost ratio functions proposed constitute a valid alternative to predefined empirical values of mean repair costs. They can also be considered an alternative to structural and nonstructural component FCs. In defining repair cost functions, the performance of building components is related to the corresponding repair cost advanced and to new DCMs. In this work, DCMs for structural and nonstructural components typical of RC-MRF types are proposed.
The procedure developed and obtained results (FCs, DCMs, cost ratio functions, and economic seismic direct loss models for existing RC-MRF buildings) may be used to outline mitigation strategies applied on a broad territorial scale and in reference to similar buildings while avoiding expert judgments and predefined considerations about vulnerability levels and economic consequences.
Moreover, FCs and repair cost functions for seismic intensity allow one to perform evaluations on a broad seismic intensity spectrum. The engineering and validation approaches used ensure more reliable results than those obtained based on component vulnerability approaches and predefined component FCs.
The cost ratio functions and DCMs defined ensure reliable evaluations according to the engineering approaches employed and based on results of the validation process.
In this study, a first application of the procedure is reported. FCs have been defined considering some simple characteristics (age, number of stories, surface) that could be easily surveyed or obtained from the available information (for example census survey). Thus, the application is useful to show the role of proposed procedure to large-scale vulnerability studies based on EMS98 intensity. The level of economic losses is adequately captured based on the repair cost conditional upon the suffered damage level and the building type.
The results of FCs show the higher damage levels in pre-code PF types rather than in old-code types. Moreover, a significant difference between nonstructural damage and structural damage distribution must also be highlight. The synthetic results (shown in
Table 7) highlight the lower damage levels obtained in old-code types. As consequence, the total cost (repair and reconstruction cost, last column of
Table 7) for old-code types is significantly lower of those pre-code.
Decision makers can use the proposed approach in planning seismic risk mitigation strategies for minimizing the economic consequences of earthquakes through the effective spatial, temporal, and typological distributions of economic resources. Moreover, this approach may facilitate more accurate seismic vulnerability evaluations of individual buildings and may overcome simplified economic considerations regarding building fragility levels prescribed by recently developed codes. In future work, the proposed procedure will be used as a tool for lifecycle cost evaluations. In this domain, several applications may be developed [
51,
52,
53,
54].


