Abstract
Green roofs are one of the most extensively investigated roofing technologies. Most of the bibliographical studies show results of researches focused on the analysis of different configurations of green roofs, but only few researches deal with the calculation of the growing media thermal resistance using laboratory tests. From 2009 to 2013, ITC-CNR, the Construction Technologies Institute of the National Research Council of Italy, carried out a first laboratory experimental campaign focused on the definition of thermal performances curves of growing media for green roofs as a function of both density and percentage of internal moisture. During this campaign, the experimental results underlined some existing gaps, such as the absence of specific standards concerning the sample laboratory preparation, the absence of shared references concerning the compaction level reached by samples in real working conditions and the evaluation of the internal moisture content of growing media exposed to atmospheric agents. For this reason, the ITC-CNR has set up a second experimental campaign focused on the solution of the gaps underlined by the first phase concerning the preparation of samples for the laboratory calculation of the thermal resistance of growing media for green roofs. This paper proposes and presents methodological approaches, methods and new test devices implemented to solve these gaps, and the results obtained.
1. Introduction
Green roofs are one of the most extensively investigated roofing technologies, both in literature and in design practice, thanks to many peculiarities that make this building solution a sort of forefront from many points of views: energy saving [1,2,3], design both for new buildings [4] and retrofit interventions [1,5,6], reduction of climate-changing emissions [7], control and management of rain and run-off waters [7,8], sound and noise absorption [9,10], improvement of the air quality [11], only to name a few.
However, at the European level, there are no harmonized standards for the definition of methodological approaches to qualitatively and/or quantitatively evaluating most of these aspects. Delegating to single and fragmentary experimental experiences the burden of justifying and adequately supporting local funding campaigns to ensure a wider diffusion of the green roof technology.
The legislation currently in force in Italy, UNI 11235:2015 [12] titled “Criteria for design, execution, testing and maintenance of roof gardens”, defines the most important criteria for the design, execution, testing and maintenance of green roofs as a function of the intended use, the climatic context and the main characteristics of the surrounding built environment. This standard is divided into seven chapters and three appendixes. The seven chapters describe roof gardens as synergic systems and are focused on instructions for the design process, functional schemes and systems classification, project documentation, instructions for the execution and the installation, controls in working conditions and maintenance. The three appendixes, instead, are more specific: Appendix A describes the main design features of growing media, while Appendix B focuses on possible vegetation types. Finally, Appendix C, titled “Further information and test methods”, underlines some fundamental issues currently unclarified, such as control and management of thermal energy fluxes, dust control of pollutants dispersion, sound insulation and absorption, and experimental determination of inflow and outflow coefficients.
The Construction Technologies Institute of the National Research Council of Italy (ITC-CNR) has many years of proven experience in the laboratory measurement of the thermal characteristics (thermal resistance, thermal transmittance and conductivity) of building materials and components. This is the reason why, in the attempt to give a first answer to these outstanding issues, during the years from 2009 to 2013, some ITC-CNR researchers set up an experimental campaign focused on the thermal characterization of growing media for green roofs based on laboratory tests for the calculation of thermal conductivity [13].
The bibliographic review of both national and international research literature has highlighted that there are no standardized or harmonized references concerning the inclusion of growing media in the thermal calculation (thermal transmittance/resistance) of a green roof. For example, in the literature, the measurement of thermal conductivity and specific heat of growing media was carried out using the Dual Needle Probe System [14,15], while tests with heat flux plates, widely used due to their durability and simplicity, must be properly designed to take into account some variables typical of the real working conditions of green roofs, such as growing media water content [16].
The Italian standard UNI 11235:2015 [12] analyzes growing media from some different points of view, but it does not provide for any specific rule about thermal calculation. Conversely, the main characteristic layers of a green roof play a significant and sensitive role in the evaluation of the thermal performances of a green roof (growing medium [13], vegetative solutions [17]). Barozzi et al. [13] calculated the curves of thermal performances as a function of density (compaction levels) and internal moisture contents of eight different samples of growing media, of which four were intensive and four were extensive. The experimental results, which proved very interesting for both companies and researchers, underlined some existing gaps:
- the absence of specific standards concerning the sample laboratory preparation (the compaction level and internal moisture content);
- the absence of shared references concerning the compaction level reached by samples in real working conditions;
- the absence of reference standards concerning the application of methods and tools for the evaluation of laboratory thermal conductivity.
In 2014, the search for a solution to the mentioned issues pushed the ITC-CNR to start a second experimental phase. The paper describes and analyzes the experimental results obtained concerning:
- the analysis of the natural compaction of growing media;
- the definition of a methodological and practical approach to reaching the natural compaction level of growing media in laboratory;
- the study of the annual trend of the internal moisture content of growing media on a seasonal basis.
Even though the technical phenomena such as evapotranspiration [18] and shading [19] associated with vegetation are considered decisive for the calculation of the total thermal performance of a green roof stratigraphy, the present study overlooks, on the contrary, these issues both from the point of view of methodology and results.
This methodological choice is directly related to the main objective of the presented research, of which the first phase started in 2009 [13]: structuring a laboratory test path for the thermo-energy characterization of growing media for green roofs.
In this perspective, the definition of a methodological approach to the measurement in laboratory of the thermal conductivity of growing media for green roofs must certainly take into account the main parameters that directly influence its value, such as the operating density (or final compaction level) and internal moisture content.
However, it cannot and must not take into account parameters such as the choice of the plant species, the shading produced and the contribution of evapotranspiration that, on the contrary, must be accounted for in the subsequent calculation, with regard to the whole stratigraphy.
1.1. Goals and Objectives
The main goal of the present study was to consolidate the procedure for the preparation of samples for the laboratory evaluation of the thermal conductivity/resistance of growing media for green roofs.
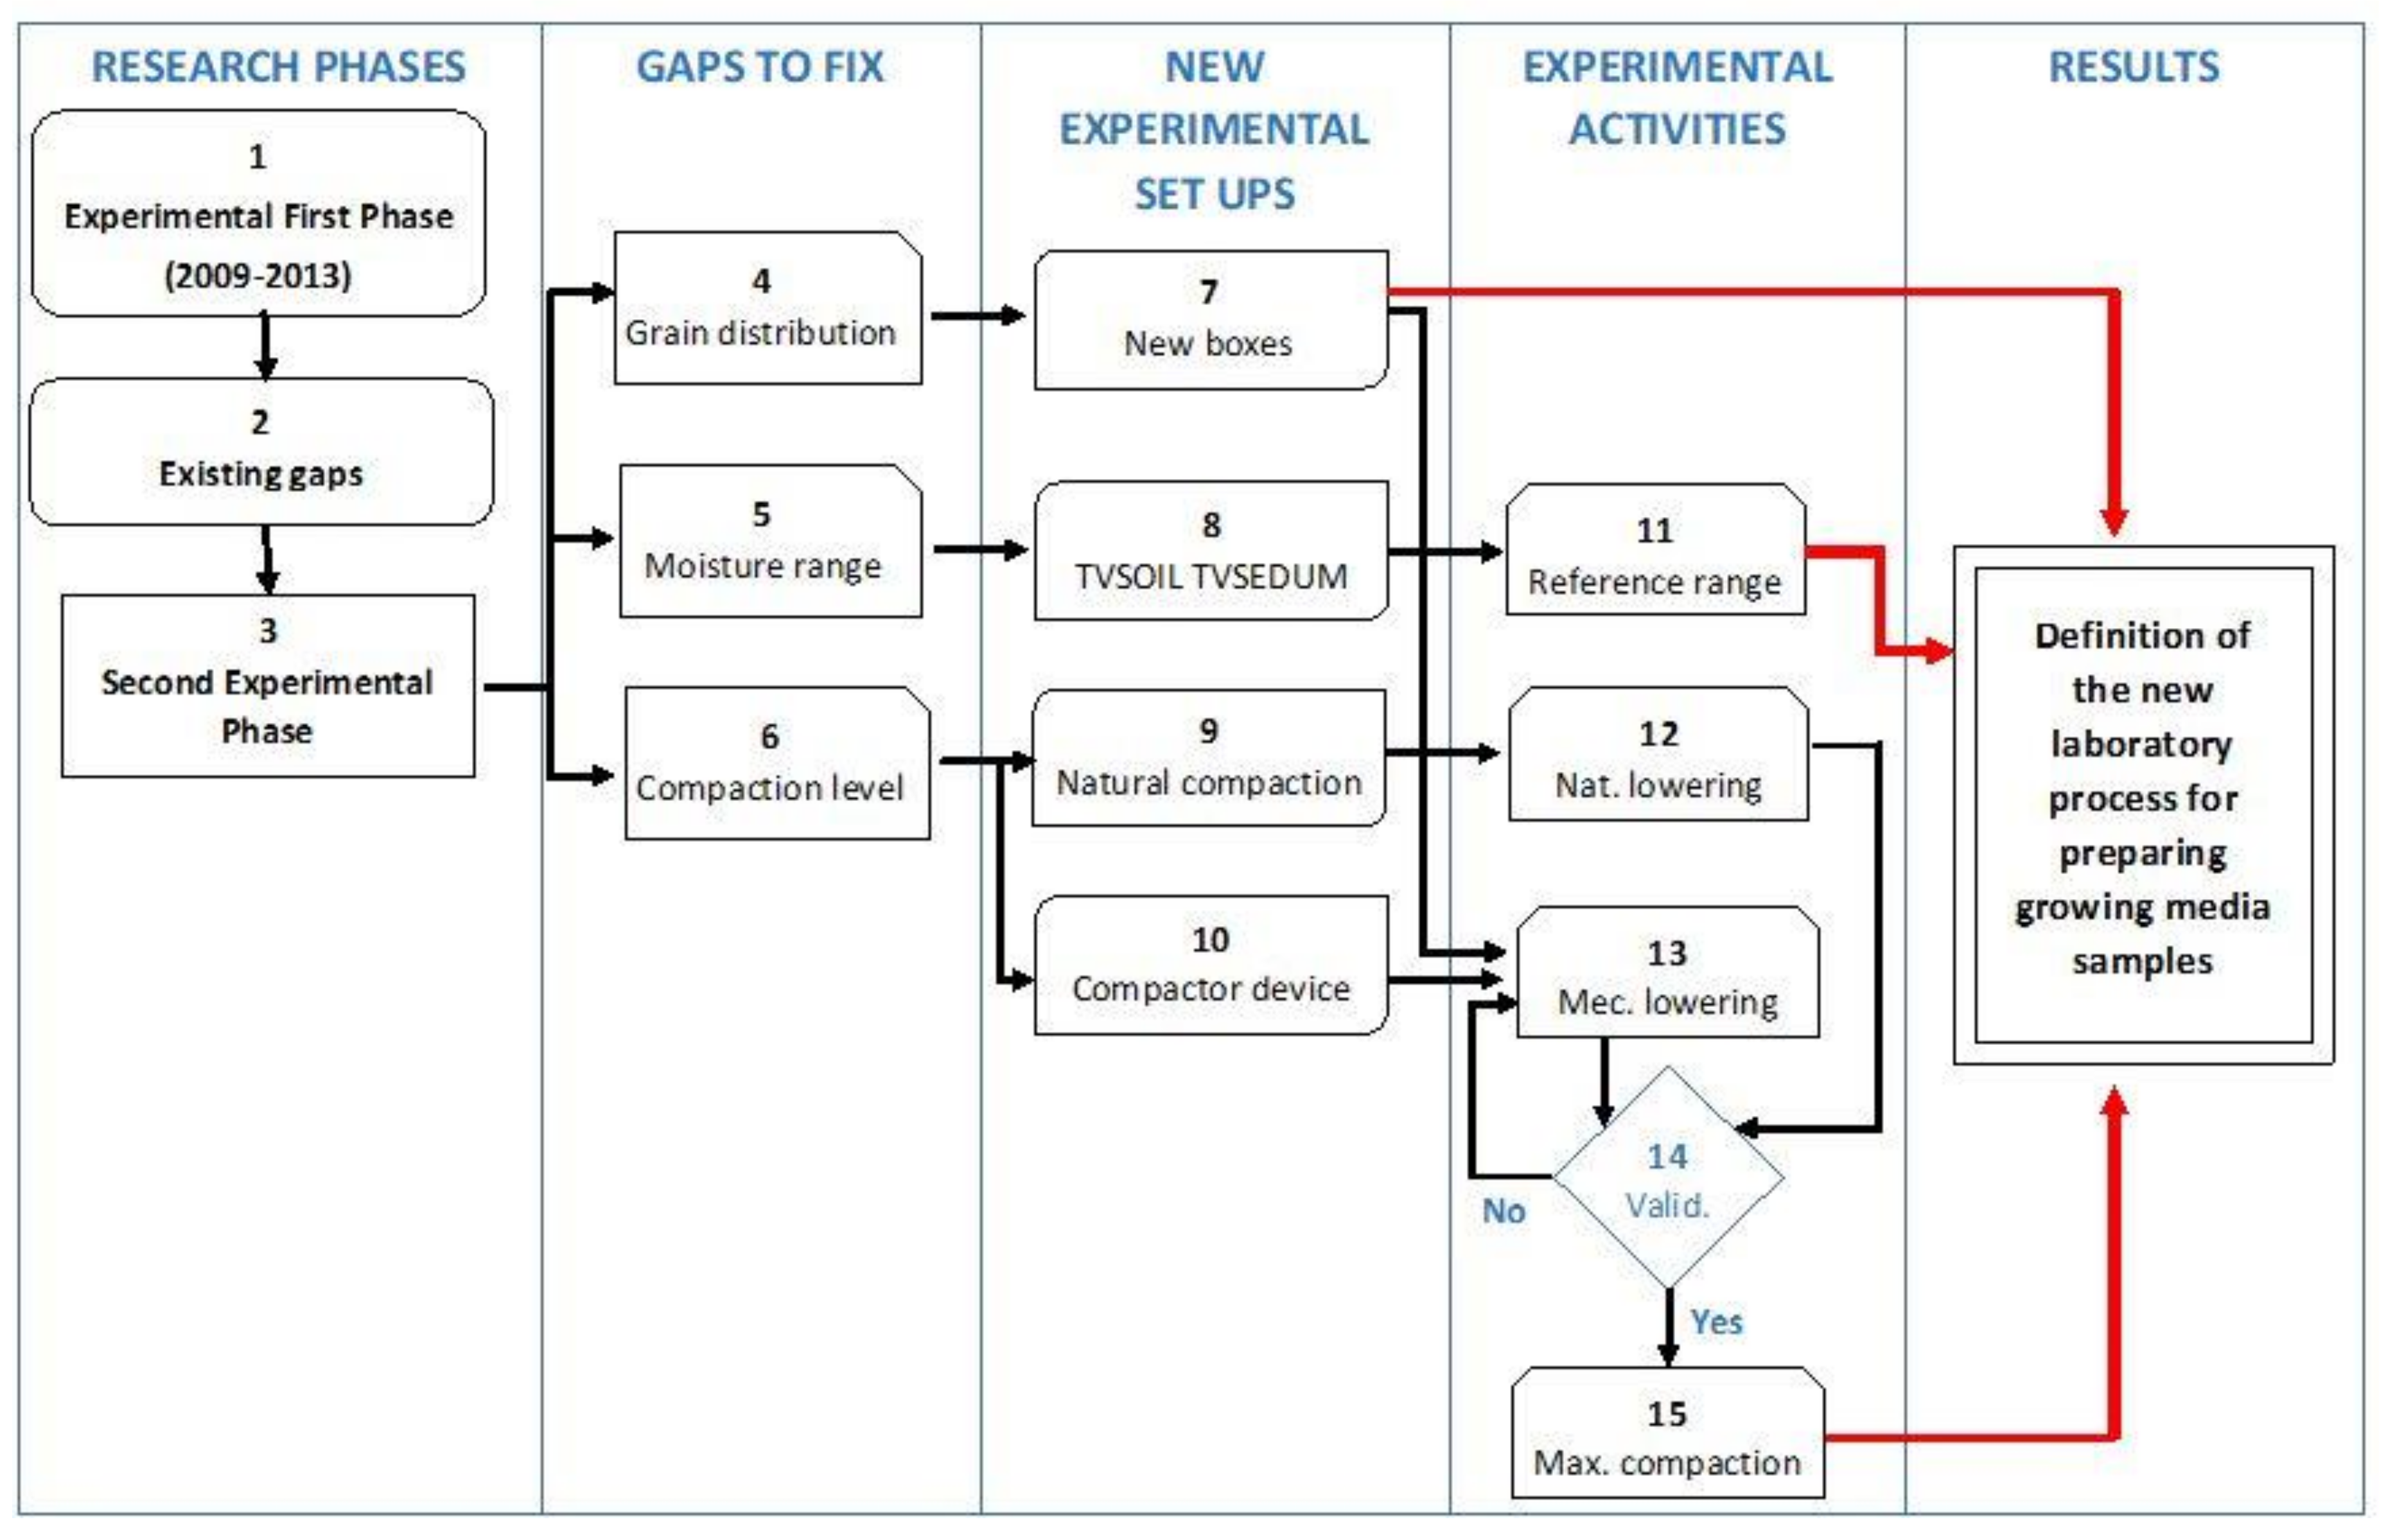
Figure 1 shows the flowchart of the proposed laboratory methodological procedure and the phases of the new test devices starting from the results of the first phase of the research (2009–2013): the thermal performances of growing media are strongly influenced by both the compaction level and the internal moisture content.
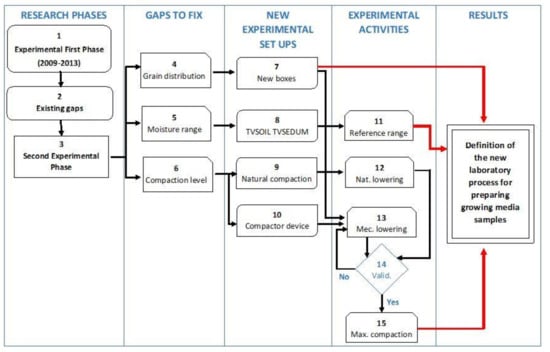
Figure 1.
Flowchart of the proposed methodological approach.
2. Experimental Set-up and Methods
The definition of a reference laboratory process for the thermal characterization of growing media for green roofs is based on the correct preparation of laboratory samples in order to describe their thermal behavior in real working conditions.
The proposed methodological approach, shown in Figure 1, and described in the following subsection, significantly reduces differences between theoretical calculations and performance in operation.
2.1. The Outdoor Set-up for the Calculation of the Natural Compaction of Growing Media
One of the most important aspects to consider, in order to make the thermal characterization process of growing media in laboratory as similar as possible to real working conditions, is the definition of the maximum compaction level reached by the substrates after exposure to natural outdoor conditions, because only in very rare and specific cases, growing media for green roofs are pneumatically compacted on the spot. The design of performance curves as a function of the internal moisture content, according to the maximum value of the possible natural compaction level reproduced in laboratory, ensures that designers are provided with an evaluation instrument of the thermal behavior of growing media that is really effective and matching the real working conditions in the long term. In this regard, some technical reference documents and international standards were preliminarily considered, such as: IEEE Guide for Soil Thermal Resistivity Measurements, IEEE Std 442-1981 [20]; ASTM D2049-69 titled “Standard Test Method for Relative Density of Cohesion less Soils” [21]; ASTM D2216-10 titled “Standard Test Methods for Laboratory Determination of Water (Moisture) Content of Soil and Rock by Mass [22]; DIN 18127 titled “Soil, investigation and testing—Proctor-test” [23].
The lapse of time necessary to reach the maximum natural compaction level is also very important. Considering that Reference [15] assumes five years from the laying of the growing media as the reference period to examine a green roof to measure the reached compaction level with a manual tester (Dickey-John model), a preliminary laboratory verification was necessarily carried out.
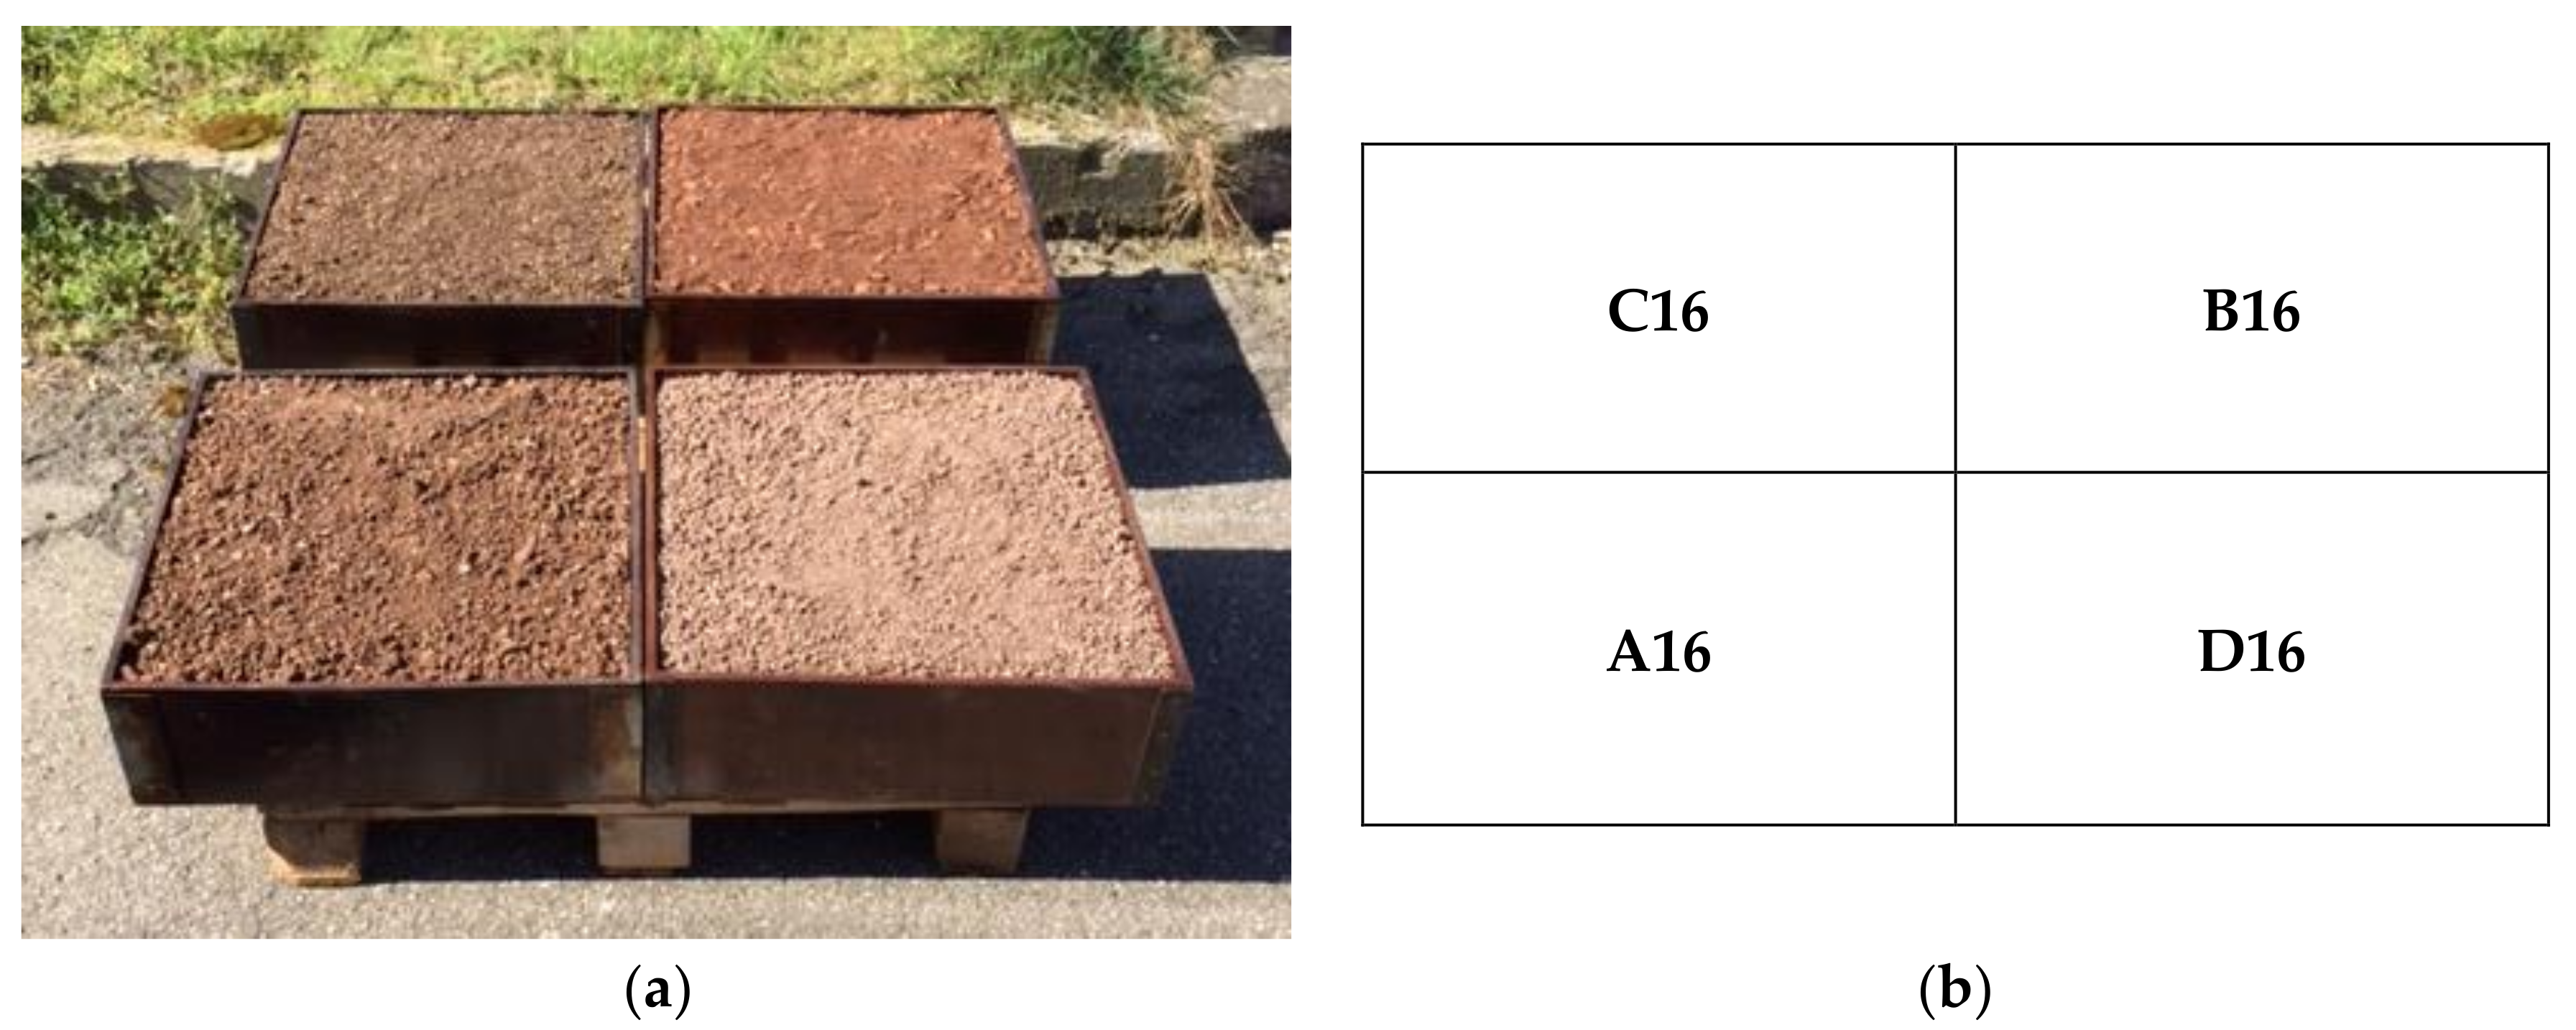
In this regard, at the beginning of 2014 Summer, four samples of growing media (Figure 2) for extensive green roofs, each supplied by a different partner company and hereafter referred to as A16, B16, C16 and D16, respectively, were laid in dedicated containment boxes made of marine plywood treated with waterproofing impregnating agents, dimension (length × width × height): 480 mm × 480 mm × 160 mm, drilled at the bottom for the percolation of the meteoric waters. Growing media samples filled the containment boxes up to the upper edge.

Figure 2.
Growing media samples exposed to natural compaction process (a) and schematic sample distribution (b)
The four samples were exposed to atmospheric agents, and following a specific tests schedule, their compaction was measured in terms of subsidence of the substrate with respect to the upper edge of the box.
The experimental setup was still exposed to natural outdoor conditions.
2.2. The Laboratory Set-up for the Compaction of Growing Media
The ITC-CNR has many years of proven experience in laboratory measurements of the main thermal characteristics of different kinds of building materials, according to the heat flow meter methodology. During the last few years, the ITC-CNR has studied and implemented some test devices, innovative and dimensionally suitable to test both natural occurring soils and growing media for green roofs. Two test devices, in particular, are necessary: suitable sample boxes and an automatic system for the soil compaction able to reproduce in laboratory the behavior of the material in working conditions and subjected to the natural compaction. The experimental campaigns carried out by ITC-CNR ex ante underlined that the sample compaction level has a significant impact on the final calculation of the thermal resistance. The implementation of thermal performance curves corresponding to real working conditions is currently strategic for both producers and designers.
2.2.1. Sample Containment Boxes
Some problems that emerged during the first experimental campaign [13] completed in 2013 had to be solved prior to the design and construction of the sample boxes, namely, the differentiated accumulation of material in the corners (design of the central ring), resistance to the impact of the pneumatic compactor, outflow of the excess water from saturated samples (micro holes at the base of the central containment ring), and durability to moisture (use of impregnating paint). The resistance of the central ring was obtained by applying a suitable embodiment technology for continuously circular superimposed lamellar layers.
Sixteen sample wood boxes were built to contain the different solutions of growing media for green roofs, according to the scheme shown in Figure 3.

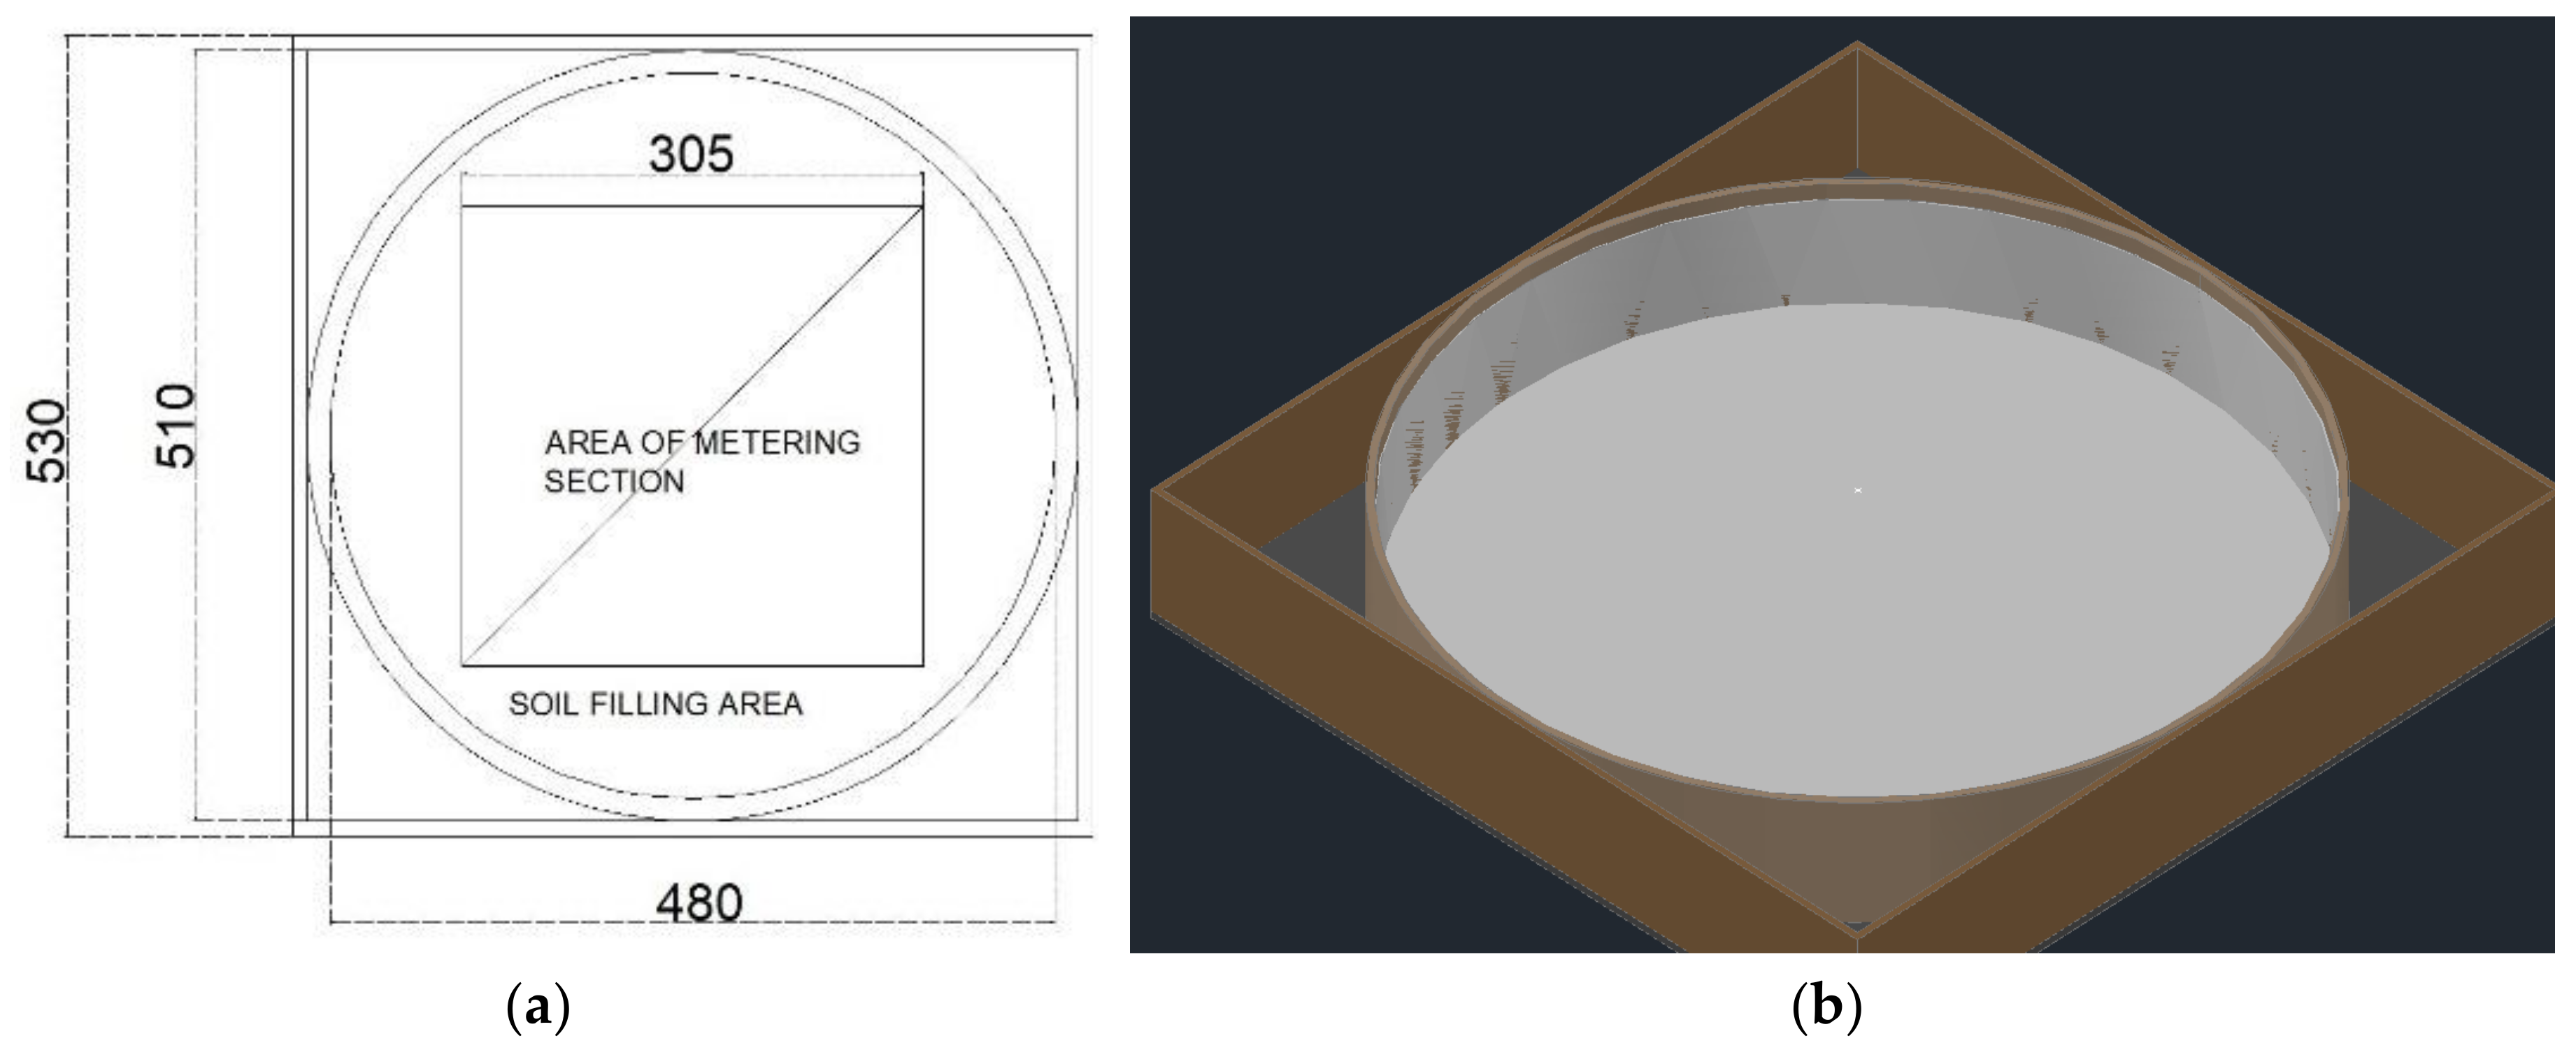
Figure 3.
Sample containment box: technical description (a, dimensions are expressed in mm) and 3D render (b).
The geometry of the sample boxes (Figure 3) was studied based on the main characteristics of the laboratory test device. The test device is a heat flow meter according to standard ISO 8301 [24], for the execution of tests based on standards UNI EN ISO 12667 [25] and UNI EN ISO 12664 [26].
The test device was made of two plates (dimensions: 600 mm × 600 mm), characterized by its minimum measurement area (dimension: 305 mm × 305 mm) and a separate heated side section that functioned as a guarded ring to avoid edge effects.
Therefore, the circular central design of samples (Figure 4a) was chosen according to both the standard DIN [23] and USGA, United States Golf Association–Green Section Staff, Guide Line [27], to solve problems related with the differentiated accumulation of material in the corners of square boxes underlined during the first experimental campaign.

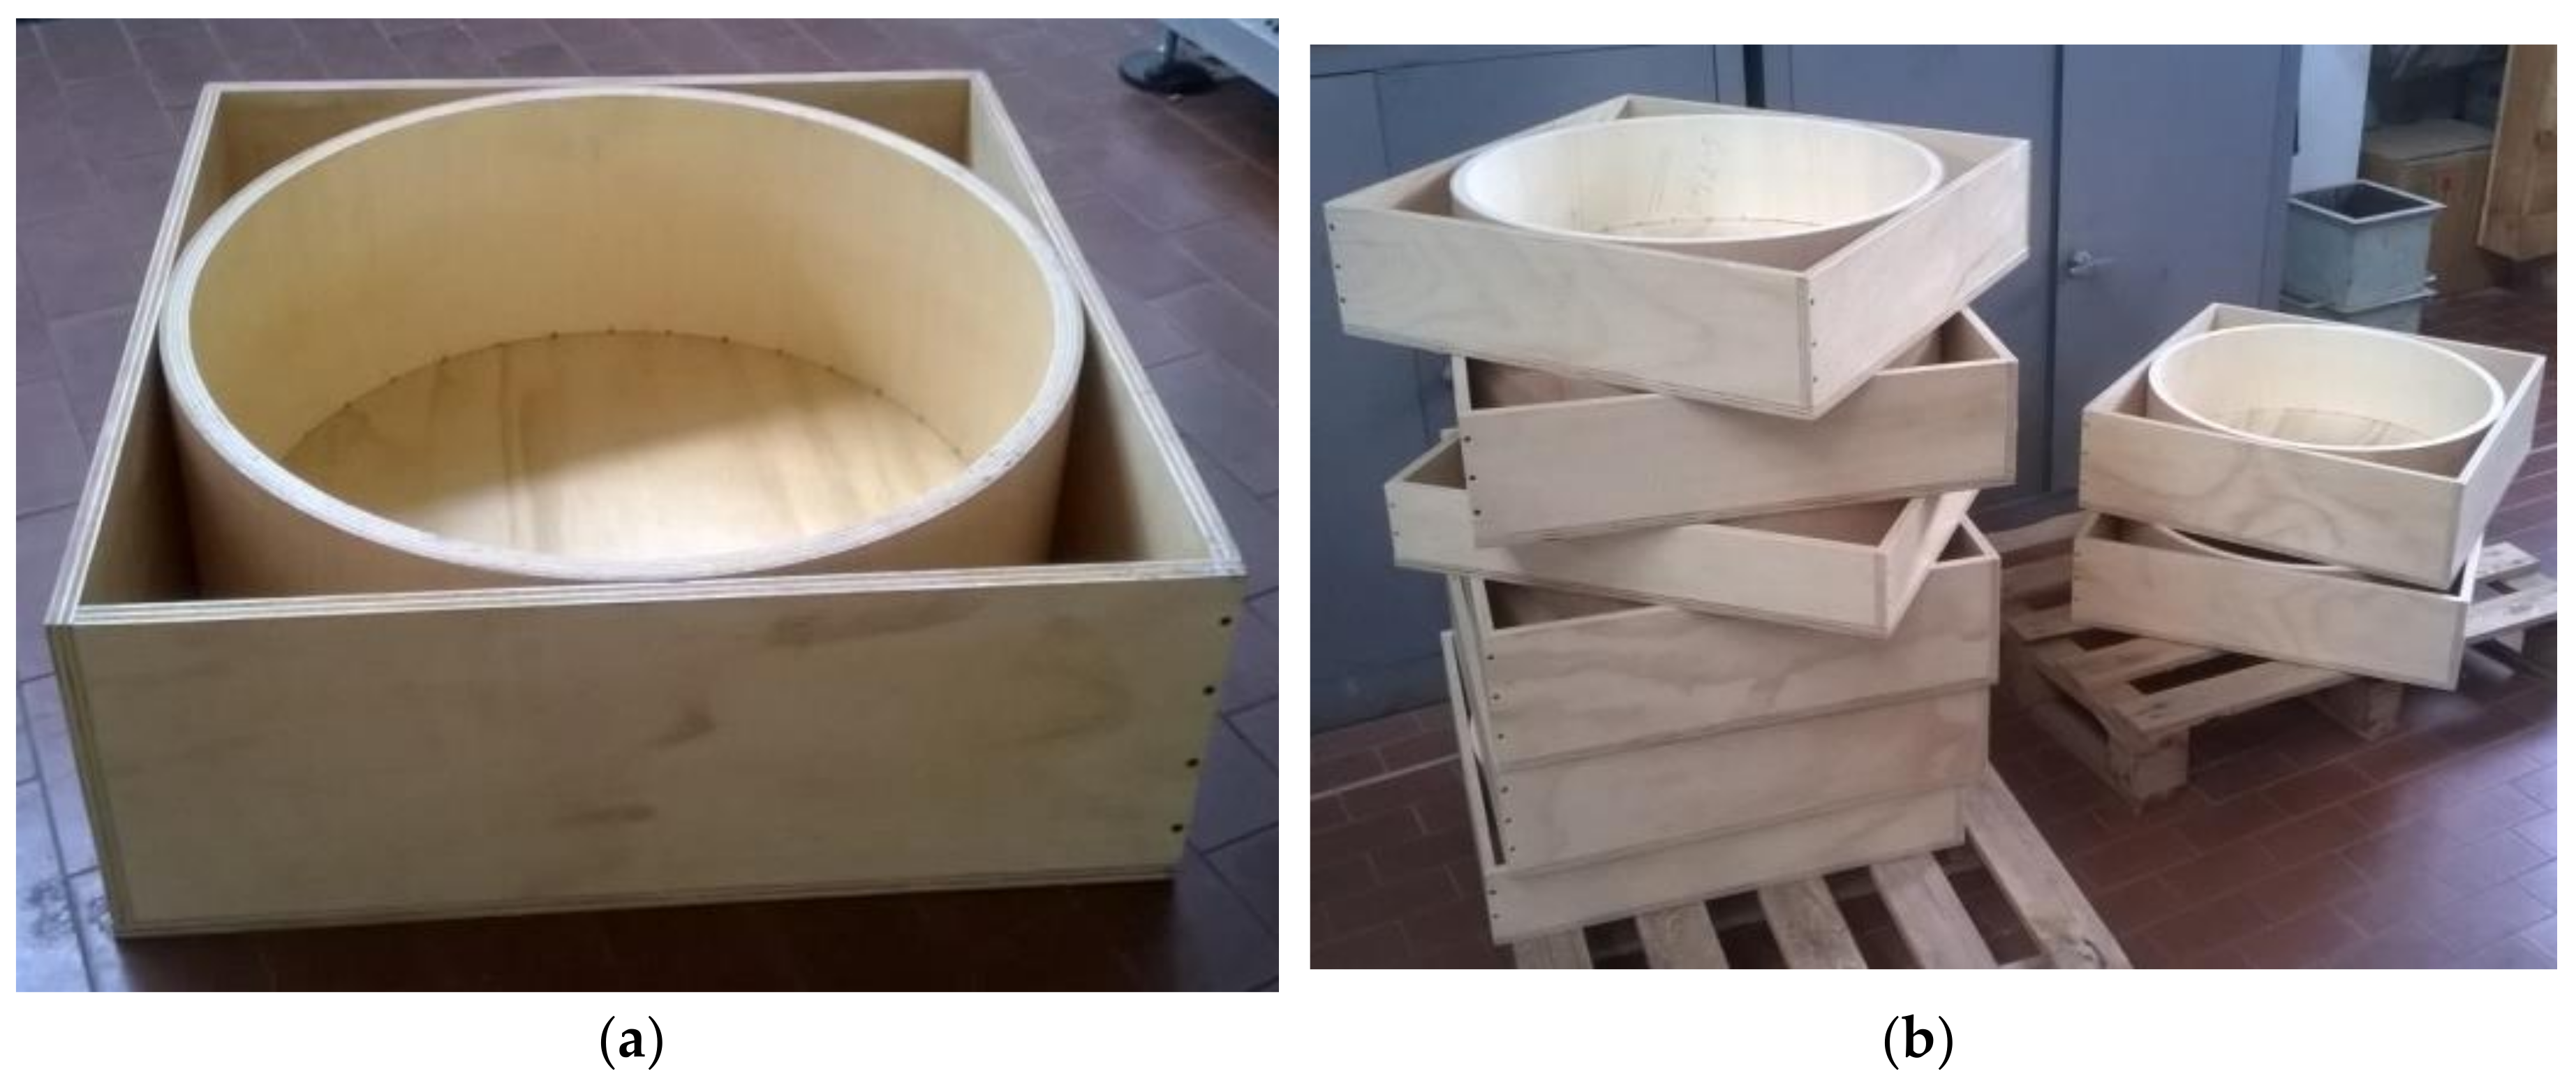
Figure 4.
Containment boxes for laboratory samples of growing media. (a) detail of the inner containment ring with drainage holes, (b) set of boxes of different thicknesses (80, 120, 140 and 180 mm).
The internal diameter was 480 mm because the dimensions of the growing medium sample needed to be greater than the minimum test area, to avoid edge effects and lateral dispersion of the thermal flux.
Some other characteristics, such as the thickness of the wood ring, total dimensions of sample boxes, etc., were chosen based on the need to provide adequate mechanical resistance to the impact of the compaction test and to some production constraints.
Sample boxes were built in four different heights (Figure 4b) (80, 120, 140 and 180 mm), in order to study the trend of thermal resistance of growing media as a function of the total thickness, so the behavior of different solutions of green roofs could be verified.
The main goal of the present study is not to compare results obtained at the end of the first phase of the research (2009–2013) with current ones but to propose both methodological approaches and new laboratory test devices. Therefore, researchers stated that it was not necessary to replicate the same height of the containment boxes used in the first experimental campaign. Moreover, considering that, in real working conditions, there were no growing media layers for green roofs of 3, 6, and 9 cm in depth.
Usually, extensive roofs are built by installing growing media layers of depths between 8 cm and 20 cm. The new dimensions of the laboratory containment boxes (80, 120, 140 and 180 cm) were chosen to provide a number of acceptable points in the range of real operating conditions for the definition of the thermal performance curves.
2.2.2. Pneumatic Compactor
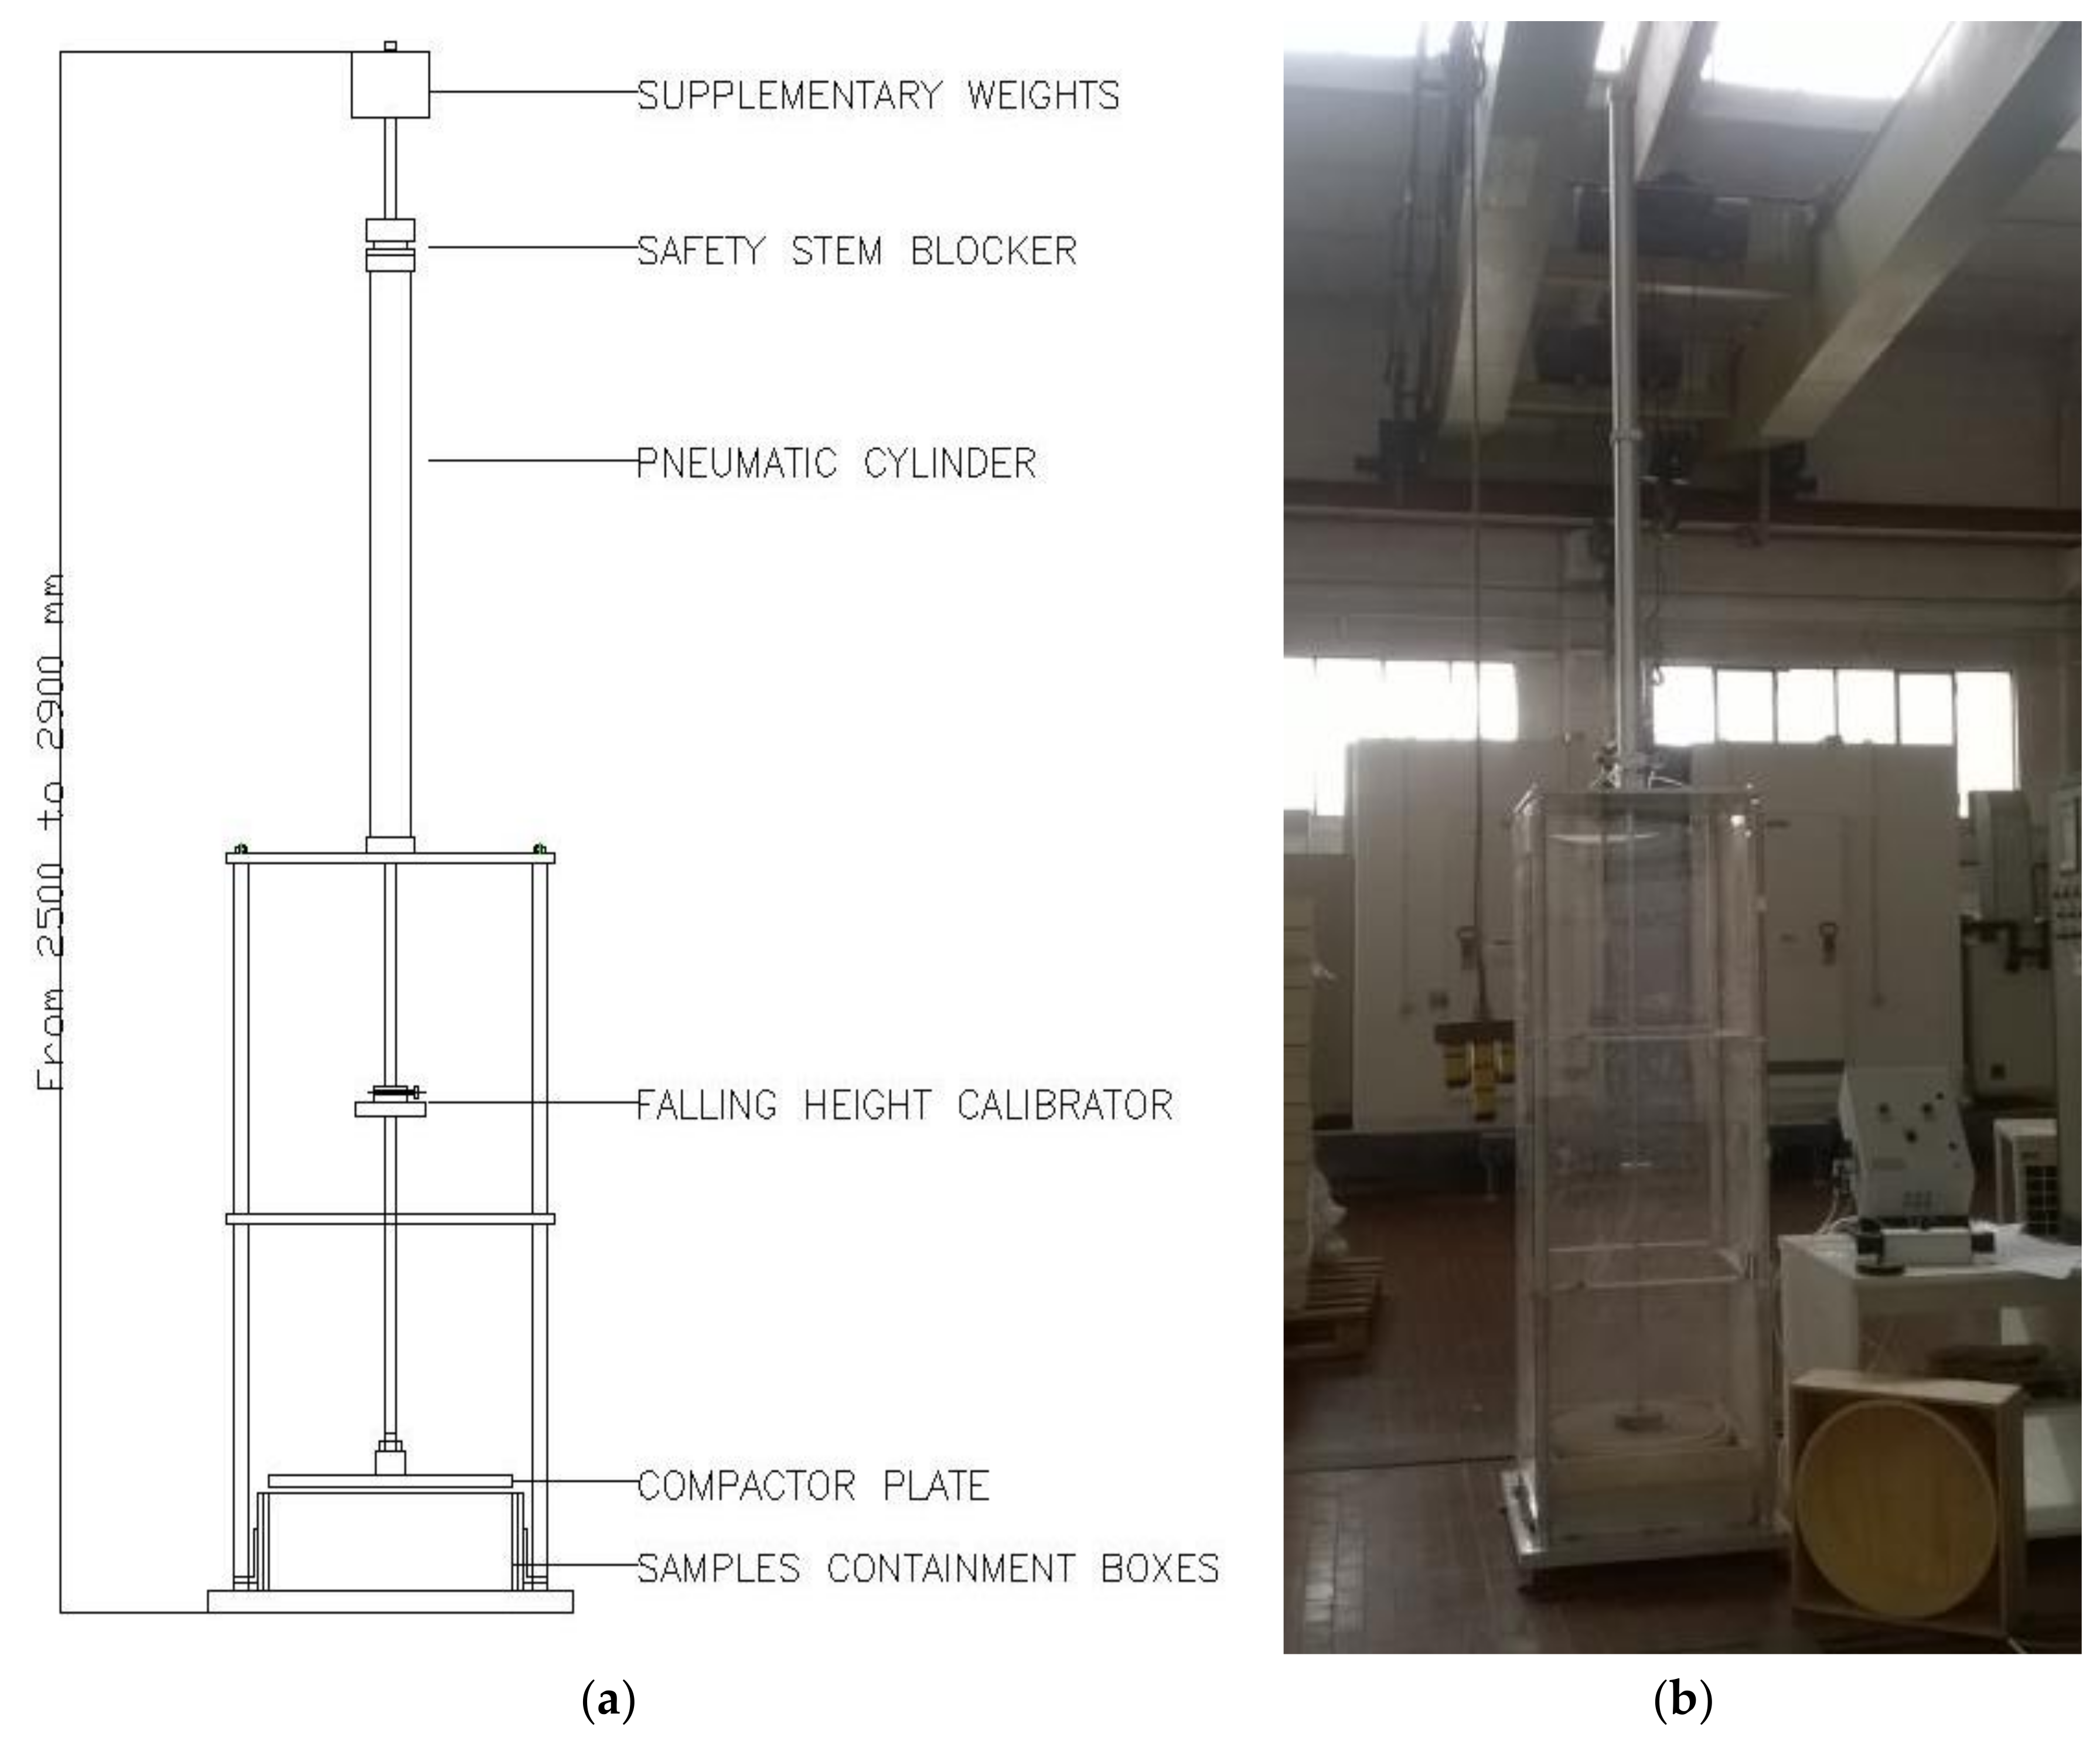
The pneumatic compactor (Figure 5) was conceived and designed according to the technical specifications of both standard DIN 18127 [23] and USGA Guide Lines [27], adapting dimensions and weights to the samples contained in the boxes. The most innovative aspect of this laboratory device compared to the state-of-the-art lies in the dimensions of the test samples was that standards referred to samples of very small dimensions with a maximum diameter of 50 mm. The prototypal plant was based on samples of greater dimensions, 530 mm × 530 mm, with a central section diameter for the compaction of 480 mm. This innovative device was designed based on the reference values established by standard DIN 18127 [23], which provides for an impact of about 0.2 J/cm2.

Figure 5.
Pneumatic compactor scheme (a) and laboratory prototype (b).
This compactor consisted of a circular plate that could fall freely on the samples (Figure 6a); weight and fall height could be changed to modify the final impact force. This system consisted of an automatic and pneumatic cylinder, fixed on a steel support structure, for lifting the plate that compacted the samples.
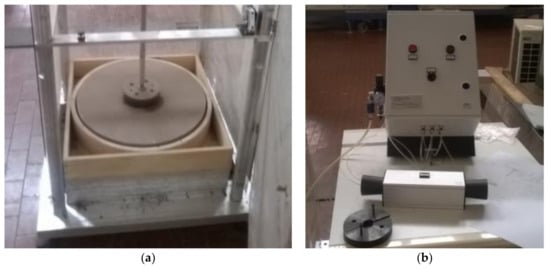
Figure 6.
Plate on sample after a compaction test (a) and two-hand tripping control system (b).
To avoid any contact between the central wood ring and the compaction plate, the plate was of smaller dimensions than the central ring, with a diameter of about 470 mm. This diameter corresponded to an impact surface of about 1735 cm3: according to the impact value of 0.2 J/cm2 as required by the standard, the system must apply a force to the growing medium equal to 355 J. The corresponding value of energy was obtained by allowing the 36 kg stainless steel plate to fall freely from 1.0 m. Some supplementary weights were installed on the plate in cases of different test ranges. The lifting system, equipped with a quick release thanks to a specific adjustable block system, allowed for a precise regulation of the fall height of the plate to better meet two different needs: creating the requested and necessary impact force, and adapting to boxes of different heights.
The prototype was equipped with a safety system to prevent the fall device from functioning during the positioning phases of the sample.
The main technical characteristics of the innovative compaction device were:
- semi-automatic device;
- low friction free fall system;
- possibility to change and adapt the fall heights of the plate in different positions;
- possibility of supplementary weights;
- guaranteed operator safety due to the following solutions:
- a mechanical block system of the lifted weight when operators were changing growing medium samples;
- possibility of a protection system that isolated boxes during the execution of the test;
- a two-hand tripping control system that prevented the accidental pressing of the command (Figure 6b);
- a safety control system that blocked the free fall of the plate when the box protection was open.
2.3. The Outdoor Set-up for Evaluation of the Internal Moisture Level of Growing Media in Real Working Conditions
The experiment was based on the monitoring in real working conditions of the variation of internal moisture level of growing media in two different configurations of green roof provided by DAKU ITALIA S.r.l., laid down on outdoor test cells (Figure 7), located at the headquarters of ITC-CNR in San Giuliano Milanese (Milan) (latitude: 45°23′42′′72 N and longitude: 09°17′34′′44 E).
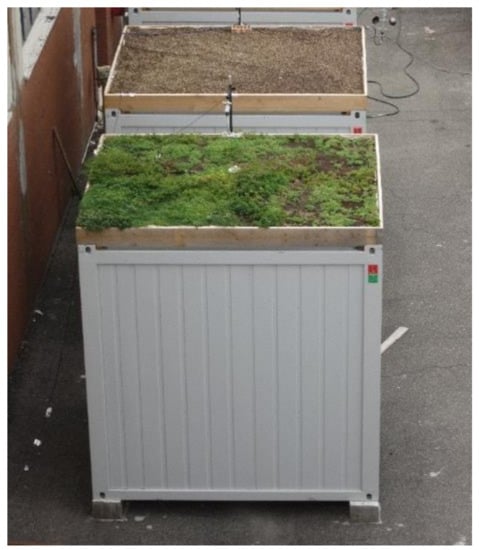
Figure 7.
Outdoor test cells (TVSOIL and TVSEDUM).
The three test cells consisted of three east-west oriented industrial containers without windows, (the entrance was an insulated door located on the west-oriented short side), and their external dimensions (length × width × height) were 300 cm × 250 cm × 300 cm.
The experimental set-up was conceived to study the thermal flux through a green roof in real working conditions, but the monitored data concerning the internal moisture level can also be used to understand its annual trend on a seasonal basis. The two different configurations of green roofs used for this purpose can be described according to the following scheme:
- TVSOIL: green roof without vegetated layer, consisting of a drainage panel with thermal insulation properties (DAKU FSD 20 SUPERDRAIN, thickness 82 mm), geotextile (DAKU STABIFILTER SFE, thickness: 1.3 mm), growing medium (DAKU ROOF SOIL 2, thickness: 80 mm);
- TVSEDUM: complete green roof, with the same stratigraphy as TVSOIL but with a Sedum mix for the vegetated layer.
No backup irrigation system was envisaged in considering the choice of the vegetated layer (mix of Sedum), which was able to positively adapt to the climates. Only during the first month after installation (2014 Summer), according to the installers’ recommendations, a manual irrigation was carried out to ensure a correct engraftment of the Sedum carpet in the growing medium.
Finally, the growing medium laid on TVSOIL and TVSEDUM was the same as that of sample C16 (Figure 2).
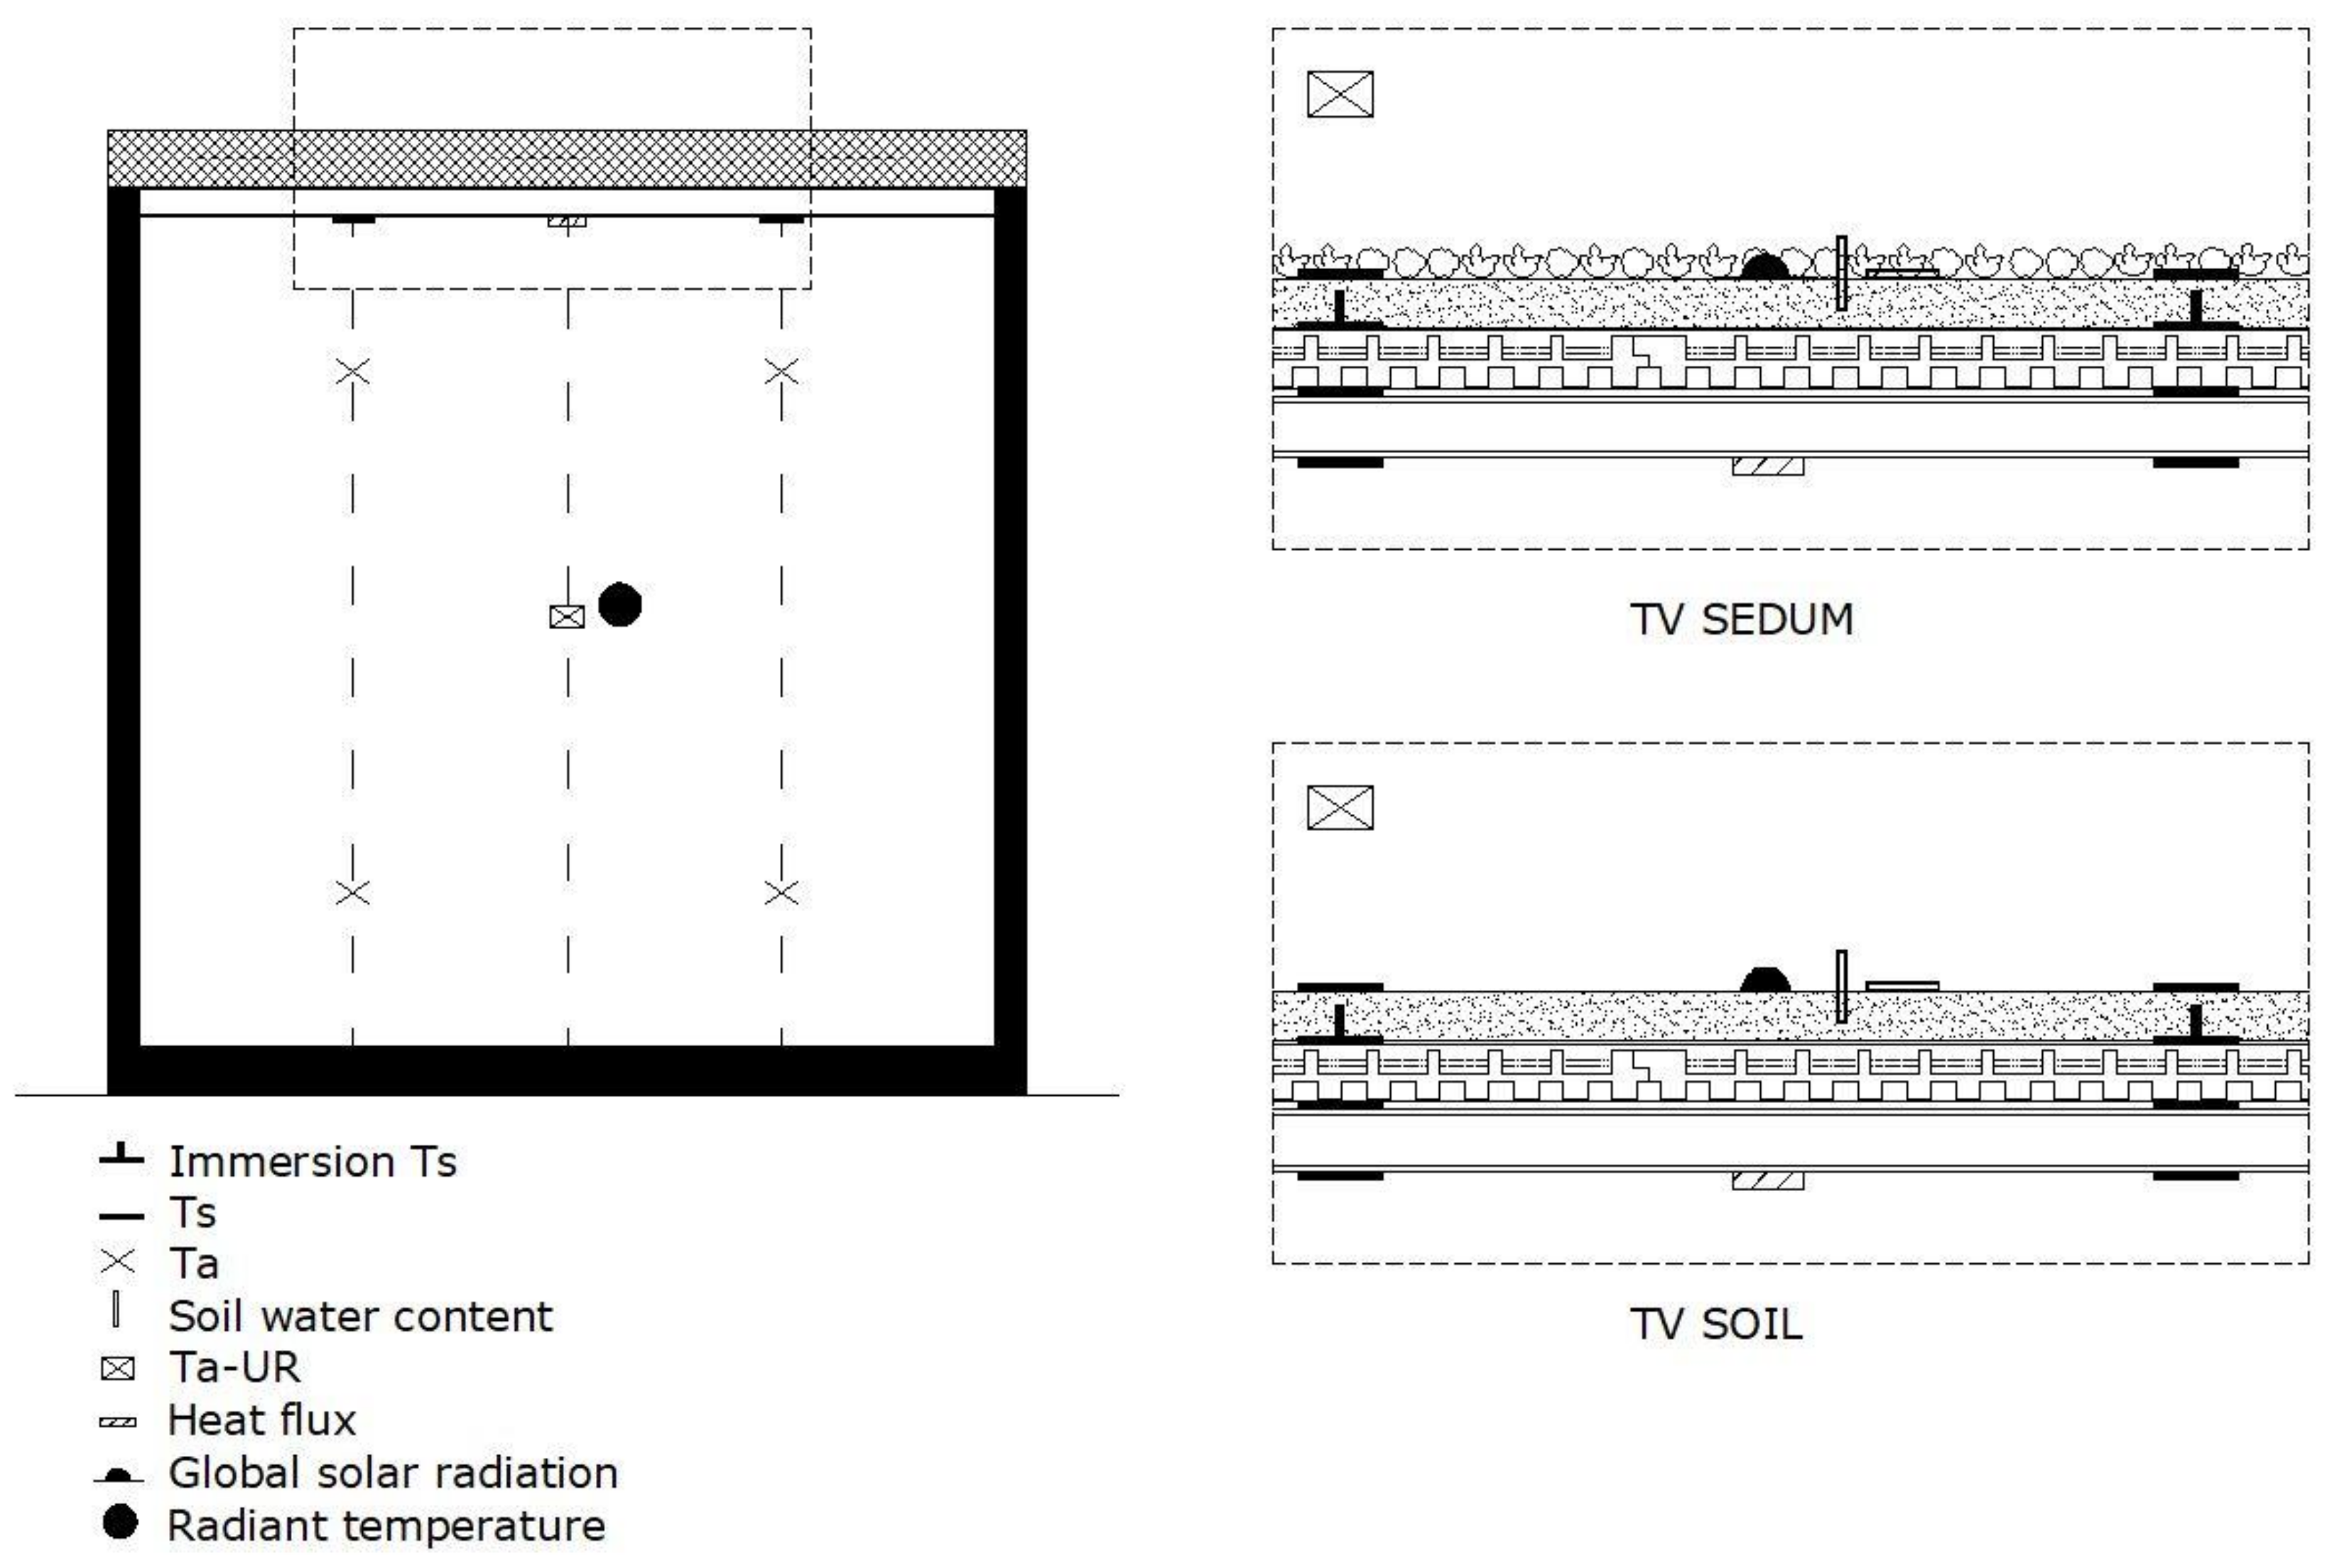
Figure 8 shows the scheme of the acquisition system for the two different roof solutions (TVSOIL and TVSEDUM). The following physical parameters were collected: surface temperature of each single layer of the stratigraphy, internal moisture content of the growing media, air temperature and relative humidity at a height of 30 cm from the growing medium plan (only in TVSOIL and TVSEDUM), and thermal transmittance of the roof systems using the heat flow meter method. In addition, indoor climatic conditions of each test cell were monitored and a meteorological station next to the experimental set-up collected the following parameters: outdoor temperature and relative humidity, global horizontal solar radiation, wind speed and direction and daily rainfall (unit: mm). Four data loggers of the TMF500 type recorded the data with a 30-s detection frequency and the calculated value was based on the five-minute average.
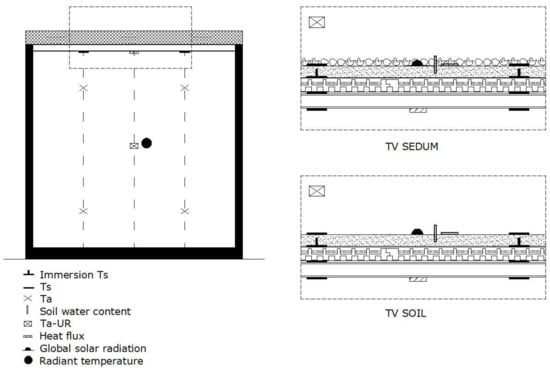
Figure 8.
Stratigraphy distributions of the sensors for the two different roof solutions (TVSOIL and TVSEDUM) for the monitoring of surface and air temperatures, relative humidity and moisture content.
3. Results
3.1. Natural Compaction of Growing Media
Tests were carried out during weeks characterized by similar meteorological conditions (rainfalls, sunny days, etc.), and results were considered reliable, confirmed by three successive measurements, ensuring the same value under the same weather conditions when the samples are exposed to the same weather agents. The values obtained over roughly one-year exposure led to the results summarized in Table 1.

Table 1.
Data measured during the first year of natural compaction: 1st measurement: 31.03.2014 (A); 2nd measurement: 08.05.2014 (B); 3rd measurement: 15.06.2014 (C); 4th measurement: 18.12.2014 (D).
Table 1 shows that, starting from December 2014 (period D), none of the four growing media samples suffered from any subsidence; therefore, after nine months of exposure to atmospheric agents, samples reached a constant level of compaction. This level corresponded to a subsidence variable between a minimum of 12% and a maximum of 15% as to the initial value.
With respect to five-year lapse of time cited in Reference [15], the experimental data concerning the maximum level of natural compaction reached by samples of growing media for green roofs exposed to natural agents confirm that one year of exposure can be considered a sufficiently conservative lapse of time to declare the corresponding compaction value as stable.
This assumption may also apply to the relationship between the compaction level of the substrate and the vegetative layer.
The root system of a newly planted vegetative layer is a rapidly developing variable that can lead to a delay in reaching the maximum level of soil compaction. From an agronomic point of view, a vegetated layer can be considered stable after one year from its first installation. Therefore, this datum confirms that assuming the one-year lapse of time after installation as the reference period to reach the maximum compaction level for the growing media is sufficiently conservative.
In theory, this assumption can be considered confirmed even when the vegetative layer has to be replaced after some years. In fact, in case of extensive green roofs, the vegetation layer is usually replaced by using vegetated carpets laid on the compacted substrate or through a new seeding that may only comprise the outer layer during the initial part of compaction,. In case of intensive green roofs, substitutions are generally only sporadic and punctual, and they cannot modify the compaction level reached by the whole roof.
3.1.1. Use of Natural Compaction Data for the Validation of the Pneumatic Compaction Device in the Laboratory
During the first research laboratory phase, compaction of growing media samples was carried out manually through a weight laid on samples for a given lapse of time [13]. Sailor et al. [14,15], stated that compaction sensibly and strongly influences the final thermal resistance of growing media; hence, the definition and design of a new laboratory device to control and assess the correct value of samples compaction become one of the most urgent and important aspects to address.
Therefore, a new laboratory device, i.e., the pneumatic compactor, was conceived (Figure 4).
When the prototype of the pneumatic compactor was ready, a test campaign was carried out on the same samples of growing media subjected to natural compaction, mostly to validate the use of the compactor with a preliminary comparison between the laboratory and natural compaction results.
Boxes with an internal height of 14 cm were used. Samples were weighted before and after compaction to verify that, during this process, the substrate spilling through the edge lines of the plate was not substantial.
The measurements of compaction in terms of subsidence of each of the four growing media samples were carried out after the first and the fifth free fall test. Table 2 shows the level subsidence of growing media measured in both absolute and percentage terms with respect to the initial full-filling conditions.
Table 2.
Results obtained during the test campaign on growing media samples to validate the use of the laboratory compaction device.
Table 3 compares the percentage decrease values of the samples between natural compaction and mechanical compaction tests in the laboratory, according to the following conditions: one free fall test, samples of 140 mm in depth, compared with one month of natural compaction with samples of 160 mm in depth; five free fall tests compared with three months of natural compaction (after nine months, the measurements carried out on 18 December 2014 did not underline any considerable material subsidence with respect to the measurement carried out on 15 June 2014, as shown in Table 1).
Table 3 shows that the orders of magnitude between natural compaction and pneumatic compaction after five subsequent free fall tests are comparable, validating the new laboratory test device.
The next step of the performed study consisted in using sensors to measure the internal moisture content of naturally compacted growing media that will be reproduced for laboratory samples subjected to pneumatic compaction, to verify the percentage variation between measurements in real working conditions and in laboratory with the required repeatability.
3.2. Annual Average of the Internal Moisture Level of Growing Media in Real Working Conditions
The preliminary study carried out by the ITC-CNR in the period between 2009 and 2013 [13] showed that both the compaction level of the growing medium and its internal moisture content significantly affect the thermal transmittance value taken as a reference. The first issue, which is the dependence of thermal transmittance on the compaction level of the growing medium, is considered solved because the considerations presented in the present study are related to the monitored data collected one year after the beginning of the experimental campaign; consequently, the compaction level reached one year after the TVSOIL and TVSEDUM installation in outdoor conditions can be considered constant.
Conversely, the considerations concerning the internal moisture content of the growing medium must be further investigated because they are strictly connected to the outdoor weather conditions and different climate regions. This is the reason why the ITC-CNR has carried out the monitoring of the internal moisture content of the growing media layer on two outdoor experimental set-ups, TVSOIL and TVSEDUM. The study of the annual performance on a seasonal basis of the internal moisture content of growing media in real working conditions allows the definition of the reference conservative value to be considered in the current geographical location.
The on-site monitoring of the stratigraphy configurations of the roofing systems layer on TVSOIL and TVSEDUM, using two moisture sensors for each of the mentioned test cells, allowed the acquisition of a considerable amount of data and the characterization of the annual performance of the internal moisture content (measured at a 5-cm depth) of growing media on a seasonal basis.
Regarding the summer season, the summer of 2016 was chosen as the only representative season, because data were monitored one year after the beginning of the experimental campaign, when both the growing media (Table 1) and the vegetative layer could be considered stable.
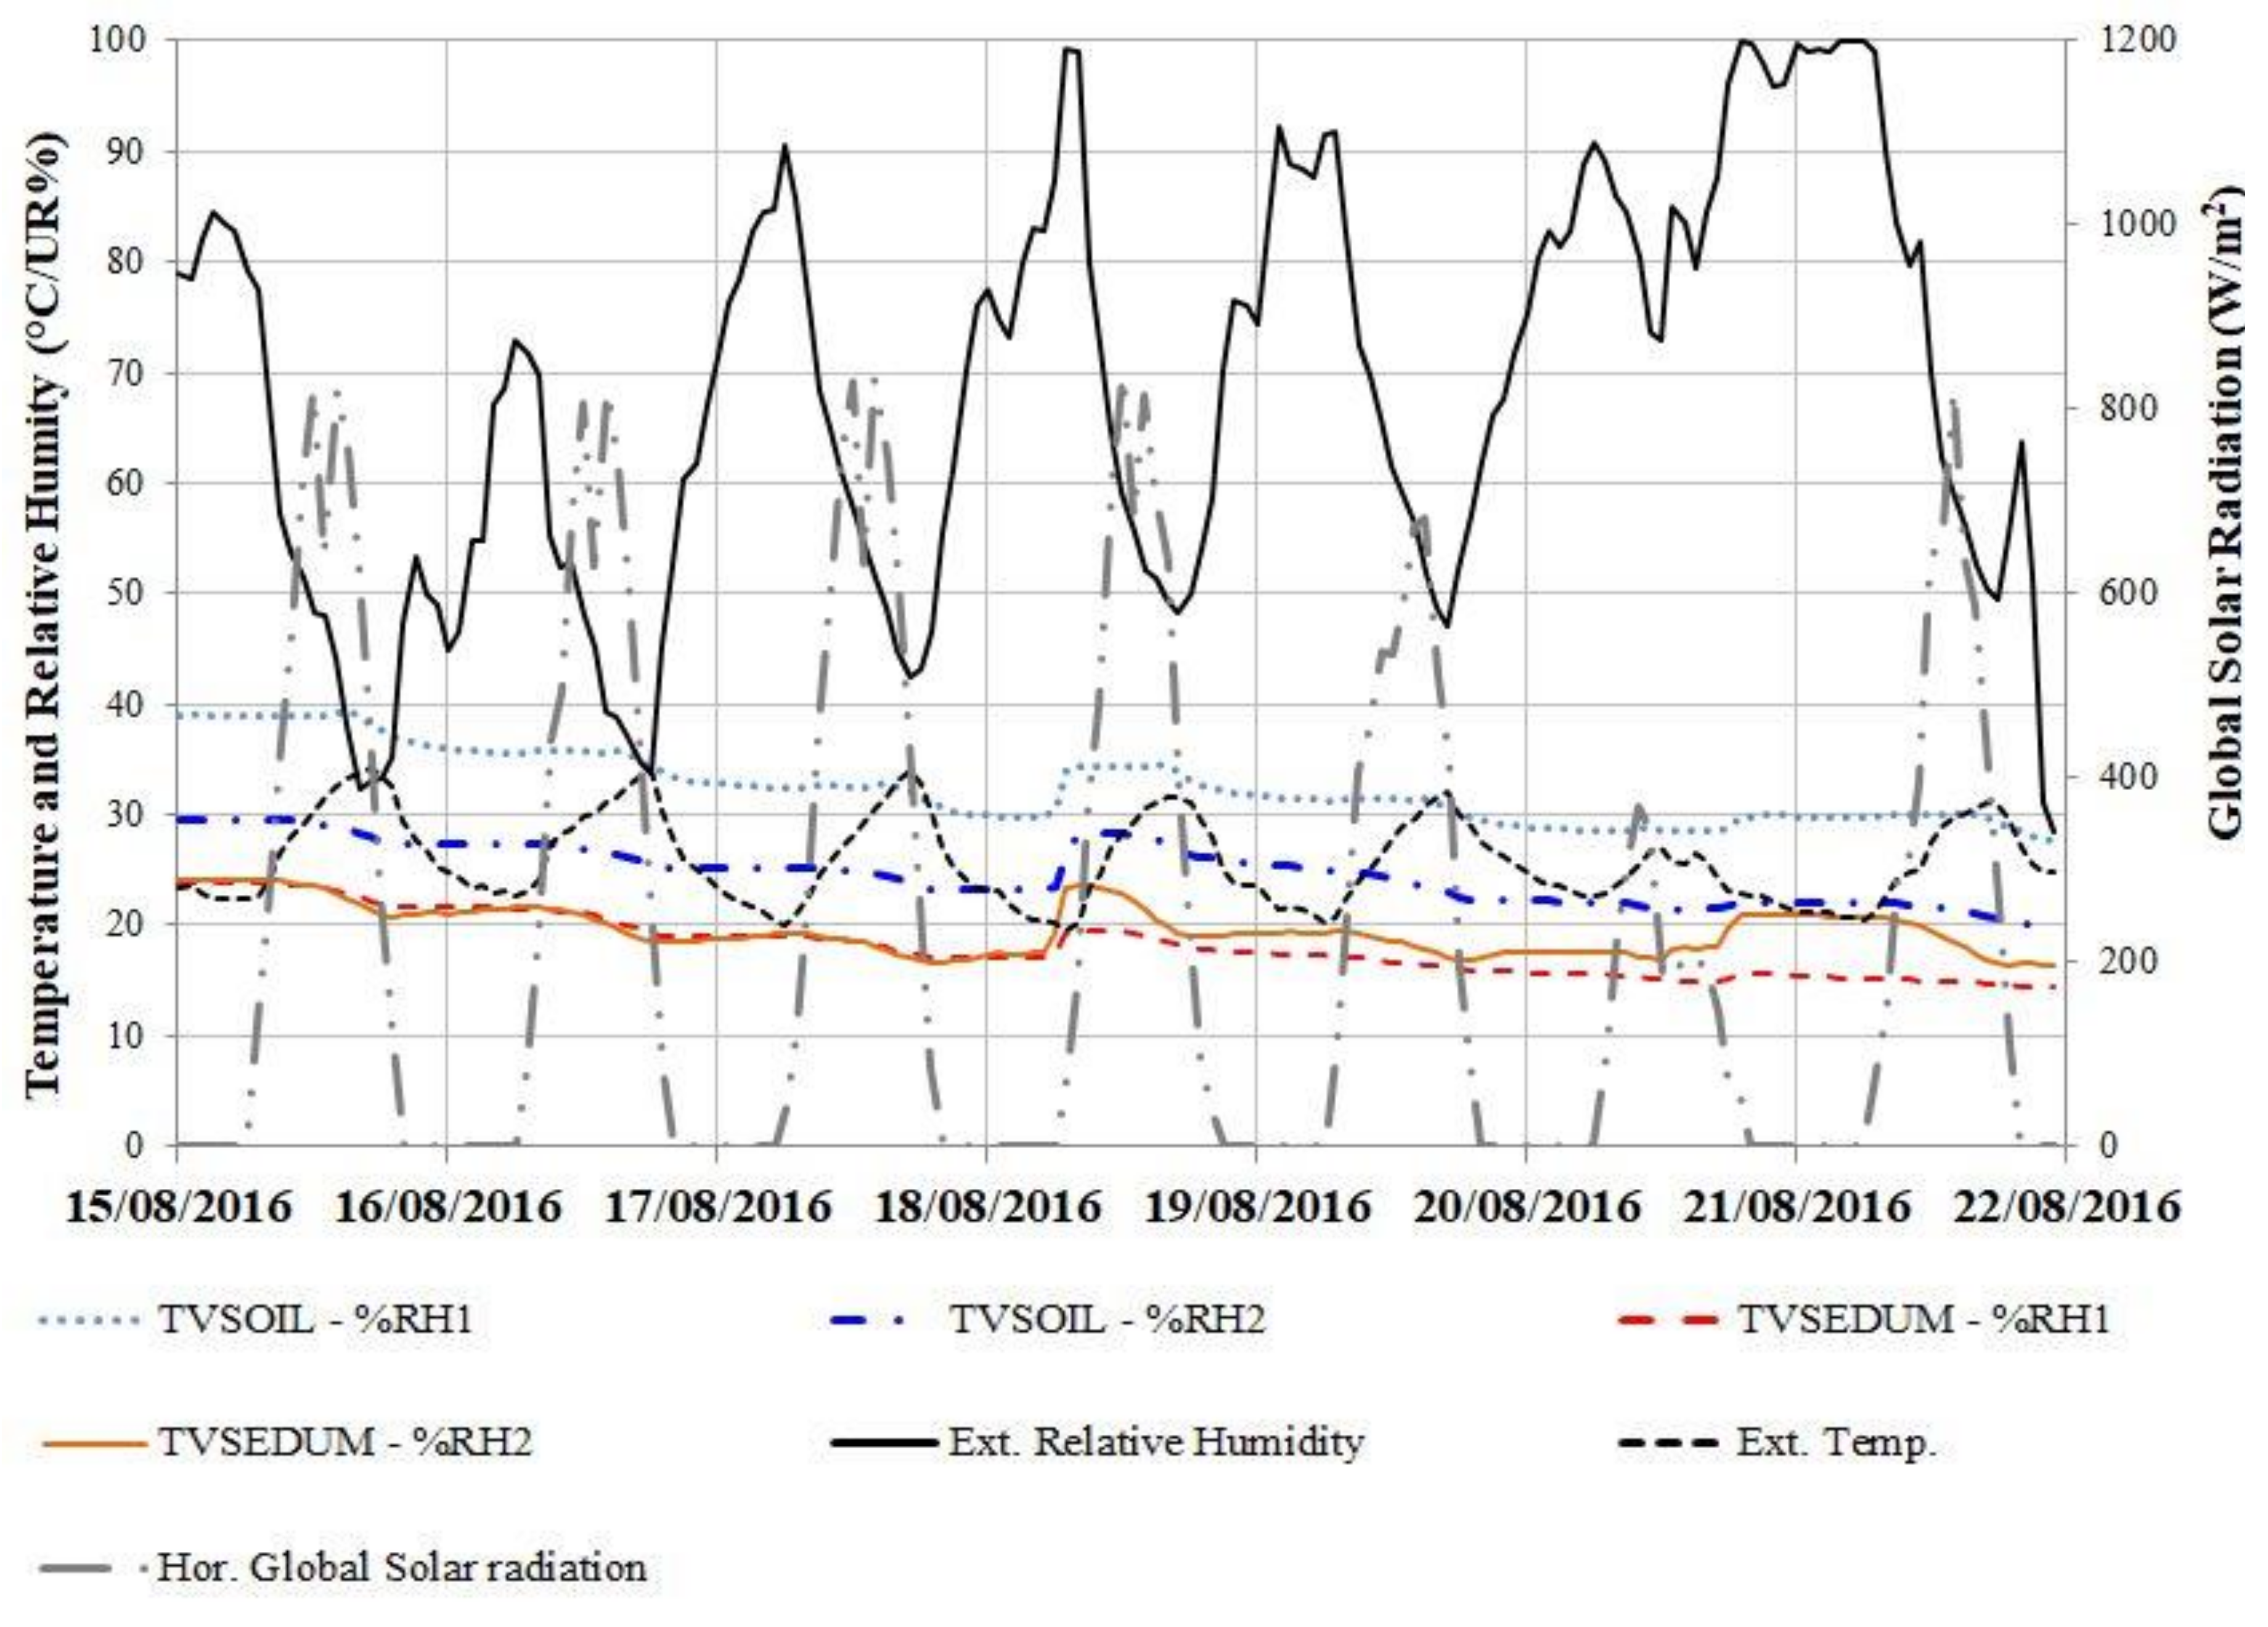
The summer of 2016 was characterized by stable weather conditions with almost no precipitation. Hence, the reference-monitoring period can be equally represented by one of the weeks between 1 August and 22 September 2016. For example, Figure 9 shows monitoring data during the period of 15–22 August, 2016.
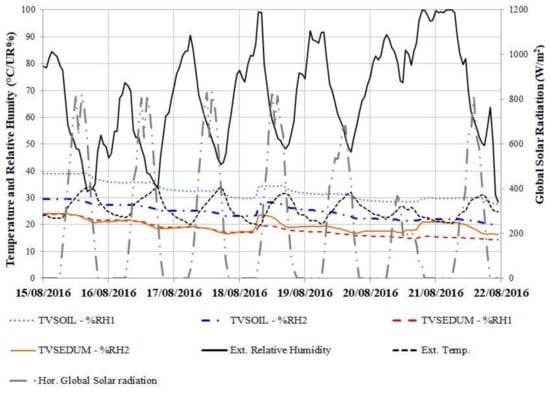
Figure 9.
Internal moisture content of growing media during the week from 15–21 August, 2016 with two different roof solutions (TVSOIL and TVSEDUM).
The analysis of Figure 9 leads to the following considerations:
- In the absence of precipitation, humidity of the substrates was between 20 and 40%;
- Moisture probes positioned towards the back (Figure 8, T2_%RH1, T3_%RH1), in general, revealed higher values than the probes towards the door (T2_%RH2 and T3_%RH2). This is mainly due to the East-West orientation of the cells, which resulted in direct sunlight hitting the front and the back of the cell at different times (during the day), and the shading effect of the shed located behind the cells (Figure 6), depending on the season.
- The moisture content of TVSOIL without sedum was higher than that of TVSEDUM due to the water absorption of the Sedum vegetation layer, both on the leaves and on the roots.
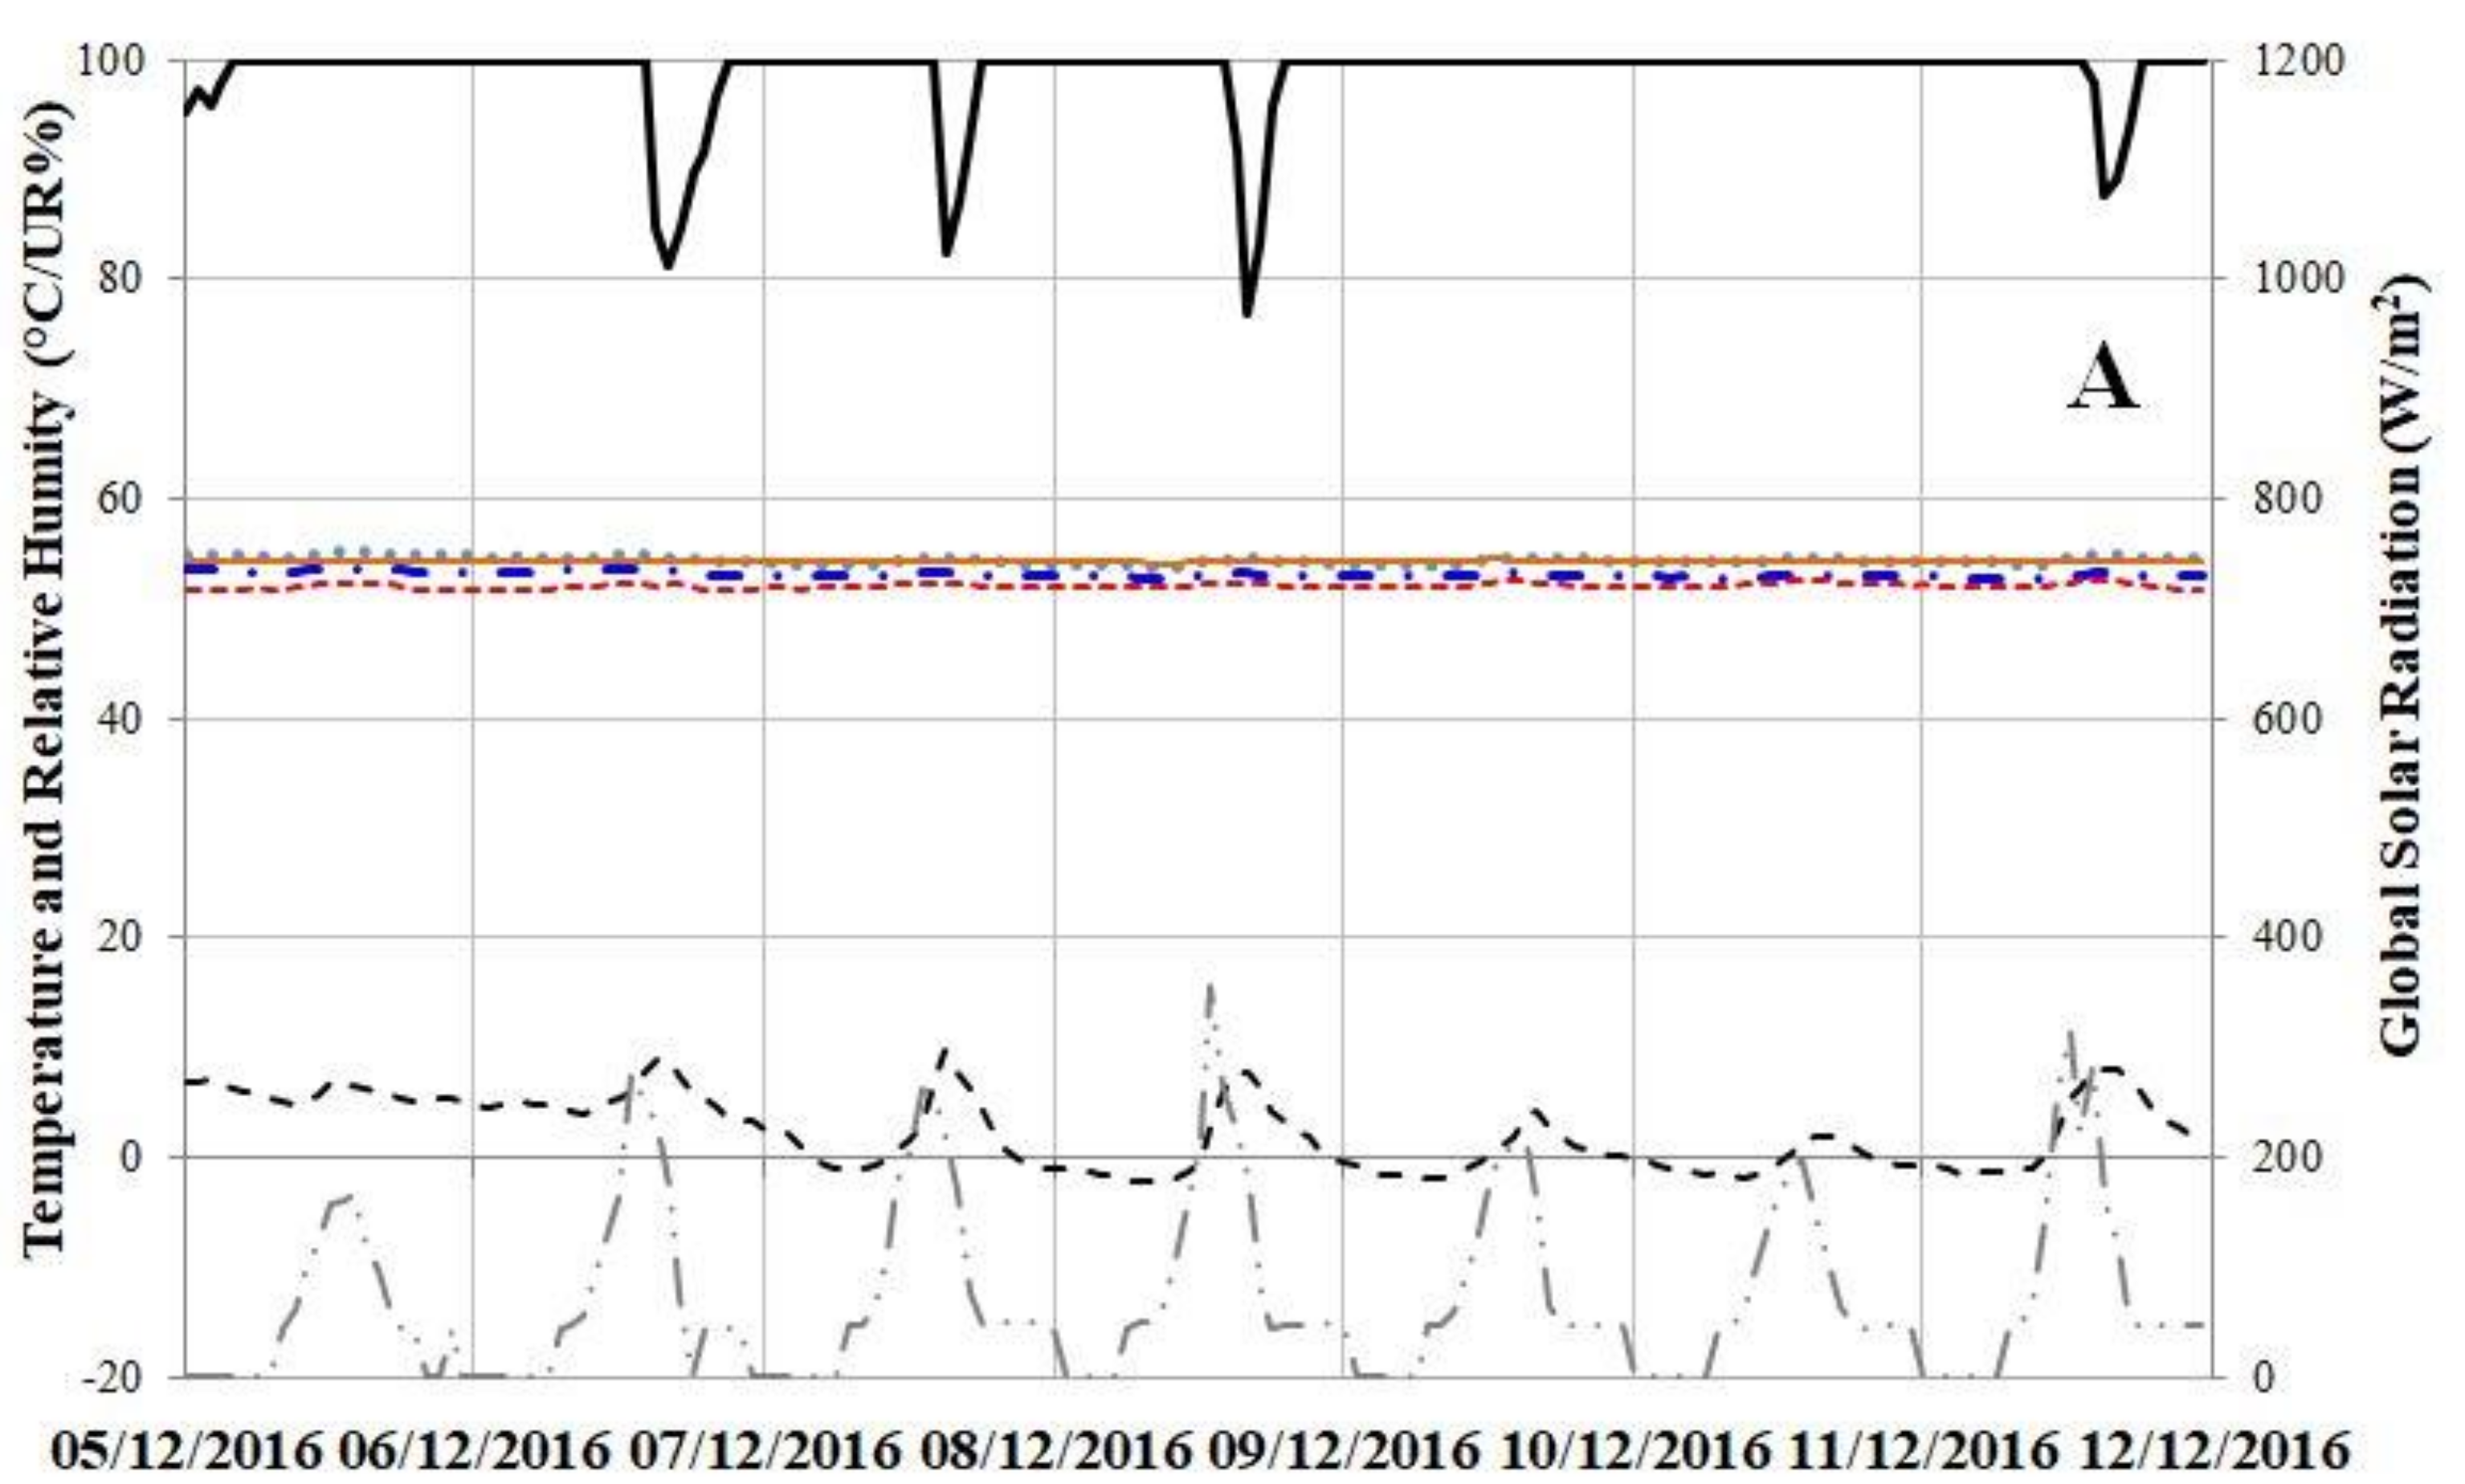
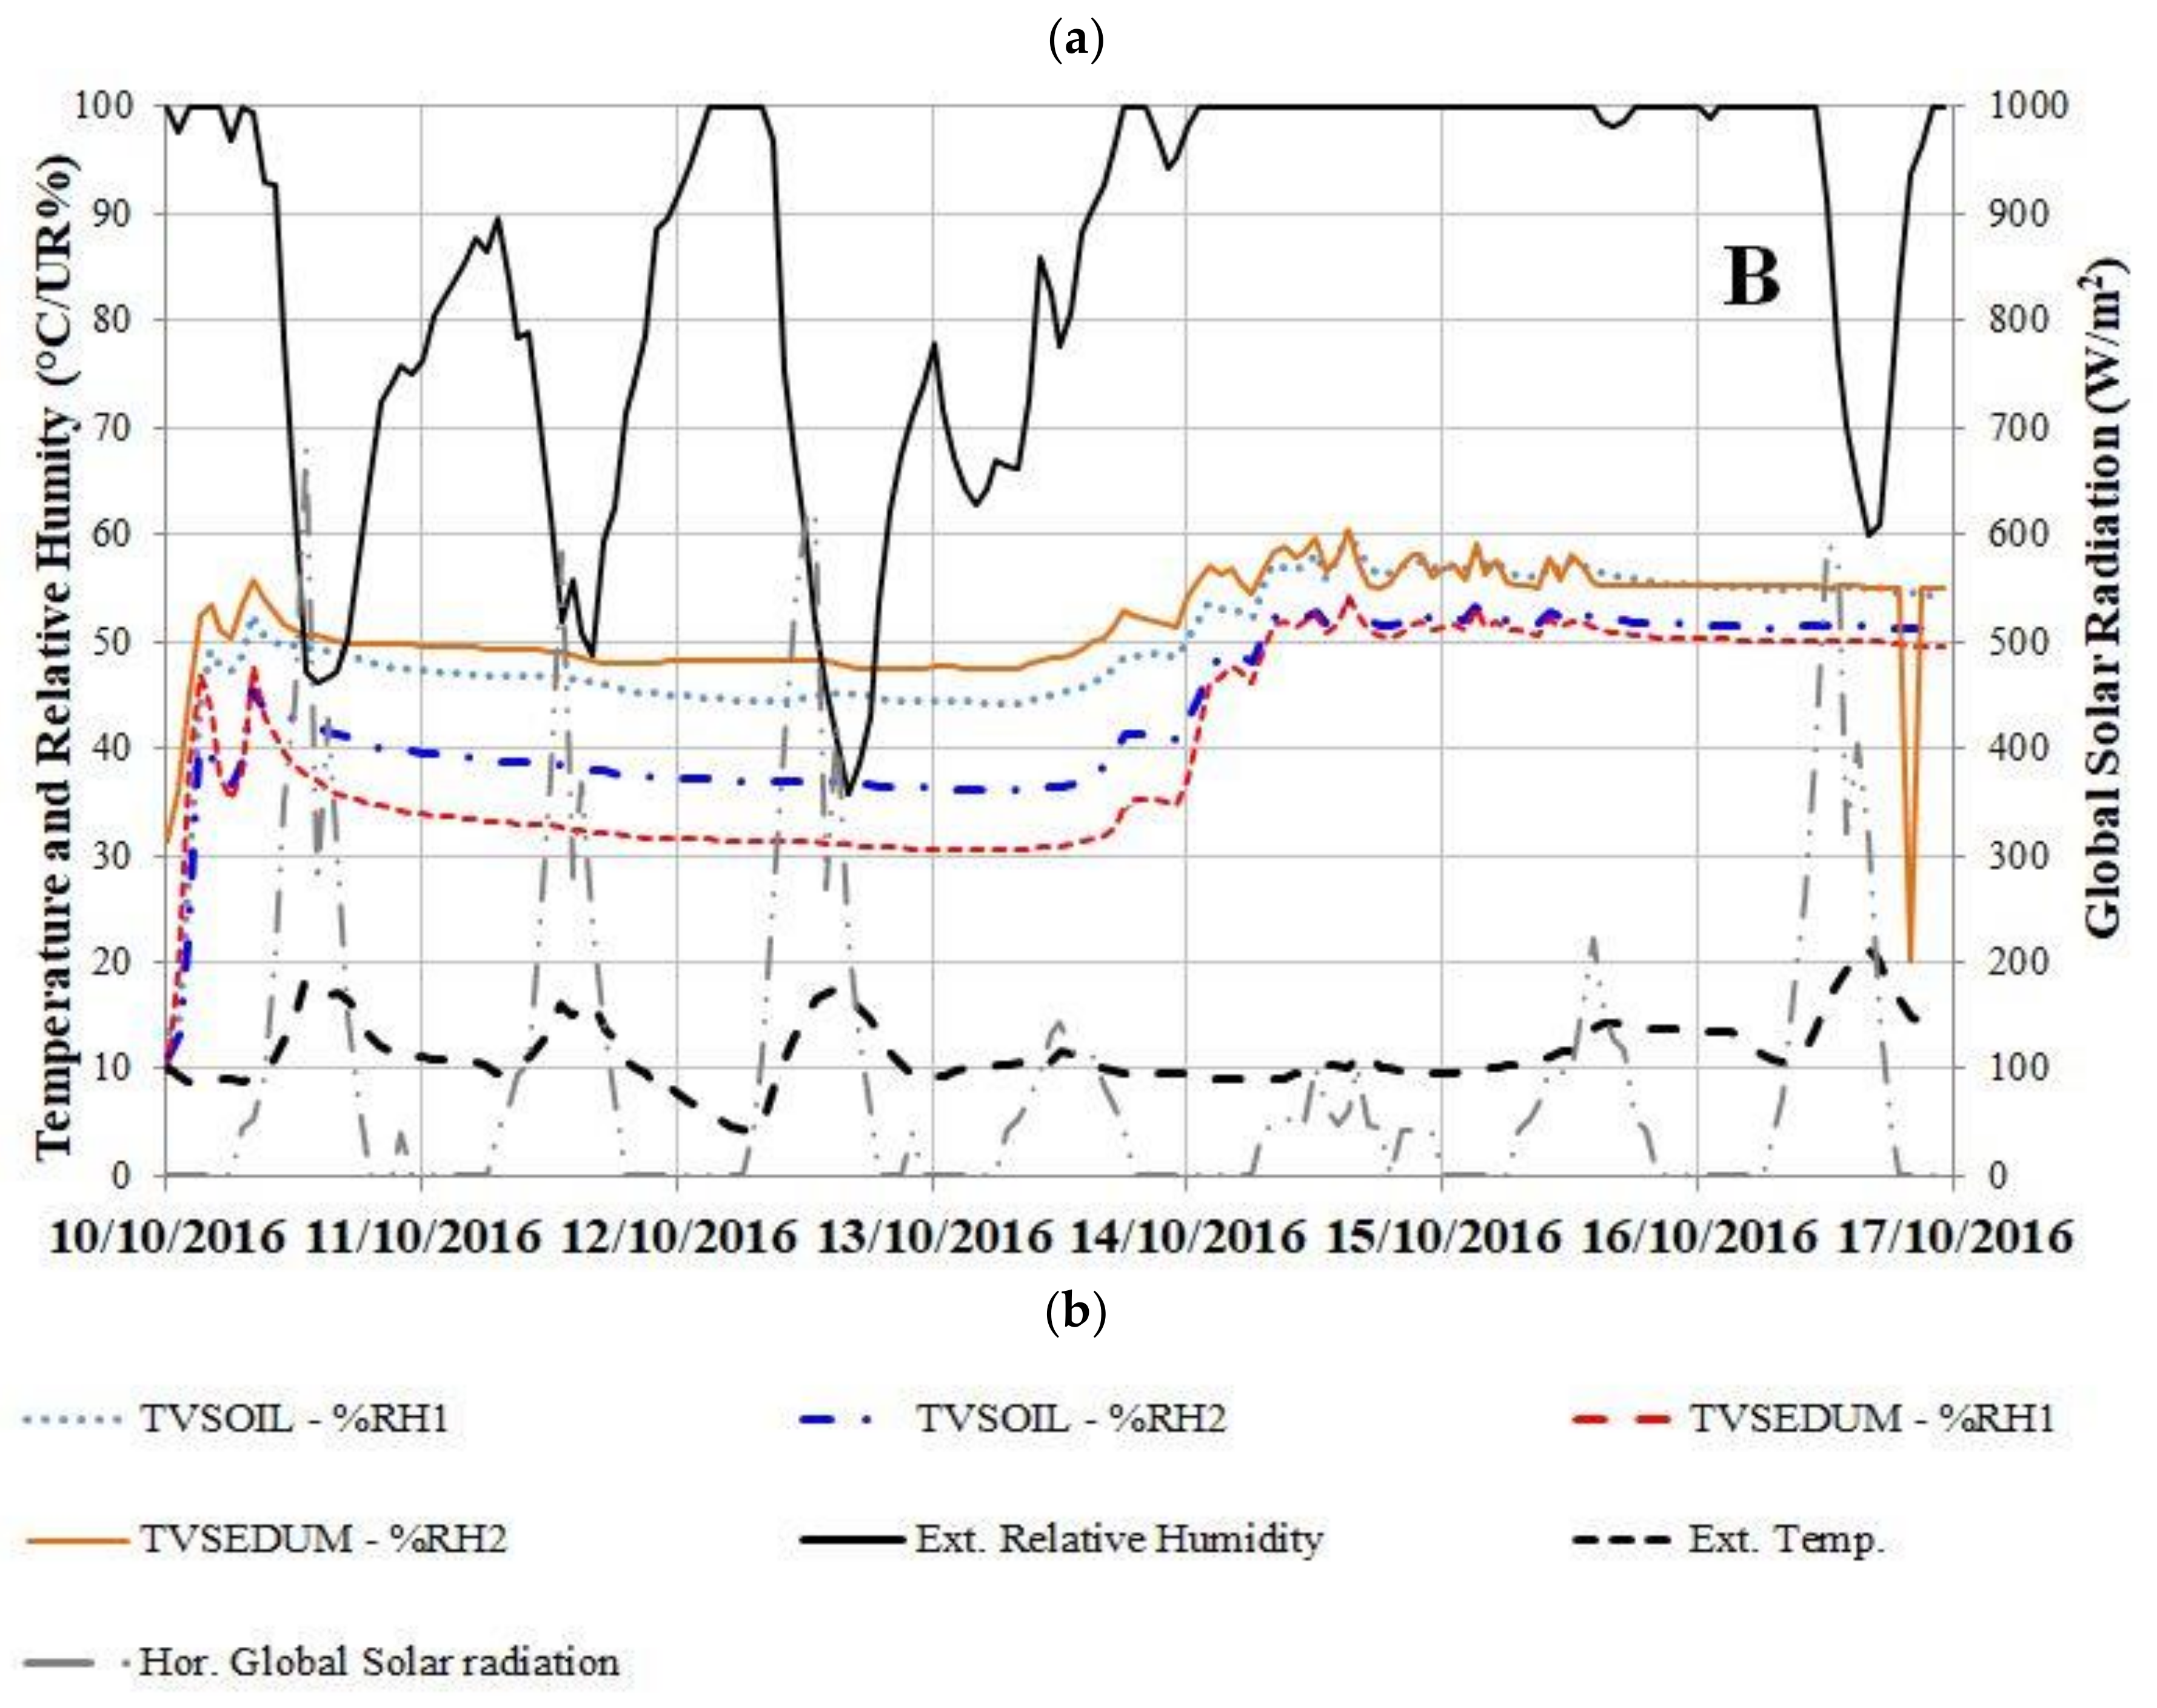
As far as the autumn season is concerned, for example, two reference weeks were taken into account: 5–11 December 2016 (A), a week characterized by the absence of direct solar radiation, scarce rainfall and an almost constant external relative humidity rate of the previous weeks were characterized by abundant rainfall up to 25 mm/day; and 10–16 October 2016 (B), a week characterized by an alternation of sunny and rainy days.
Table 4 summarizes the daily rainfalls of these two weeks (mm/day).
Table 4.
Cumulated daily rainfall (mm) for two weeks: week “A” and week “B”.
The analysis of Figure 10 leads the following considerations:
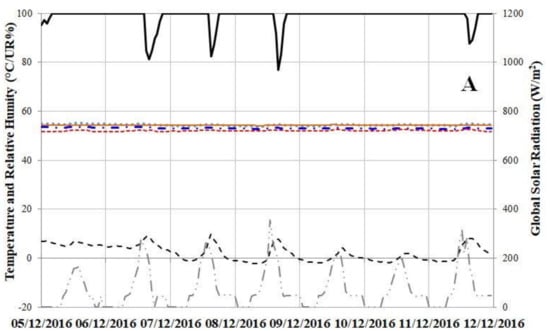
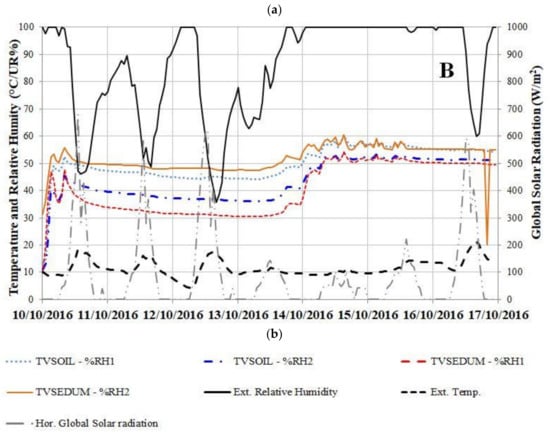
Figure 10.
Internal moisture contents of growing media for the week from 6 December to 12 December 2016 (a); and the week from 10 October to 16 October (b) with TVSOIL and TVSEDUM.
- With continuous rainfall, the humidity of the substrates was uniform between 50% and 60%;
- In the presence of alternating precipitation events and rain-free conditions, substrates moisture varied between 30% and 50% during the sunny days and between 50% and 60% during the rainy days;
- With variable meteorological conditions, the conservative trend of the probes towards the back with respect to the ones towards the door was also confirmed.
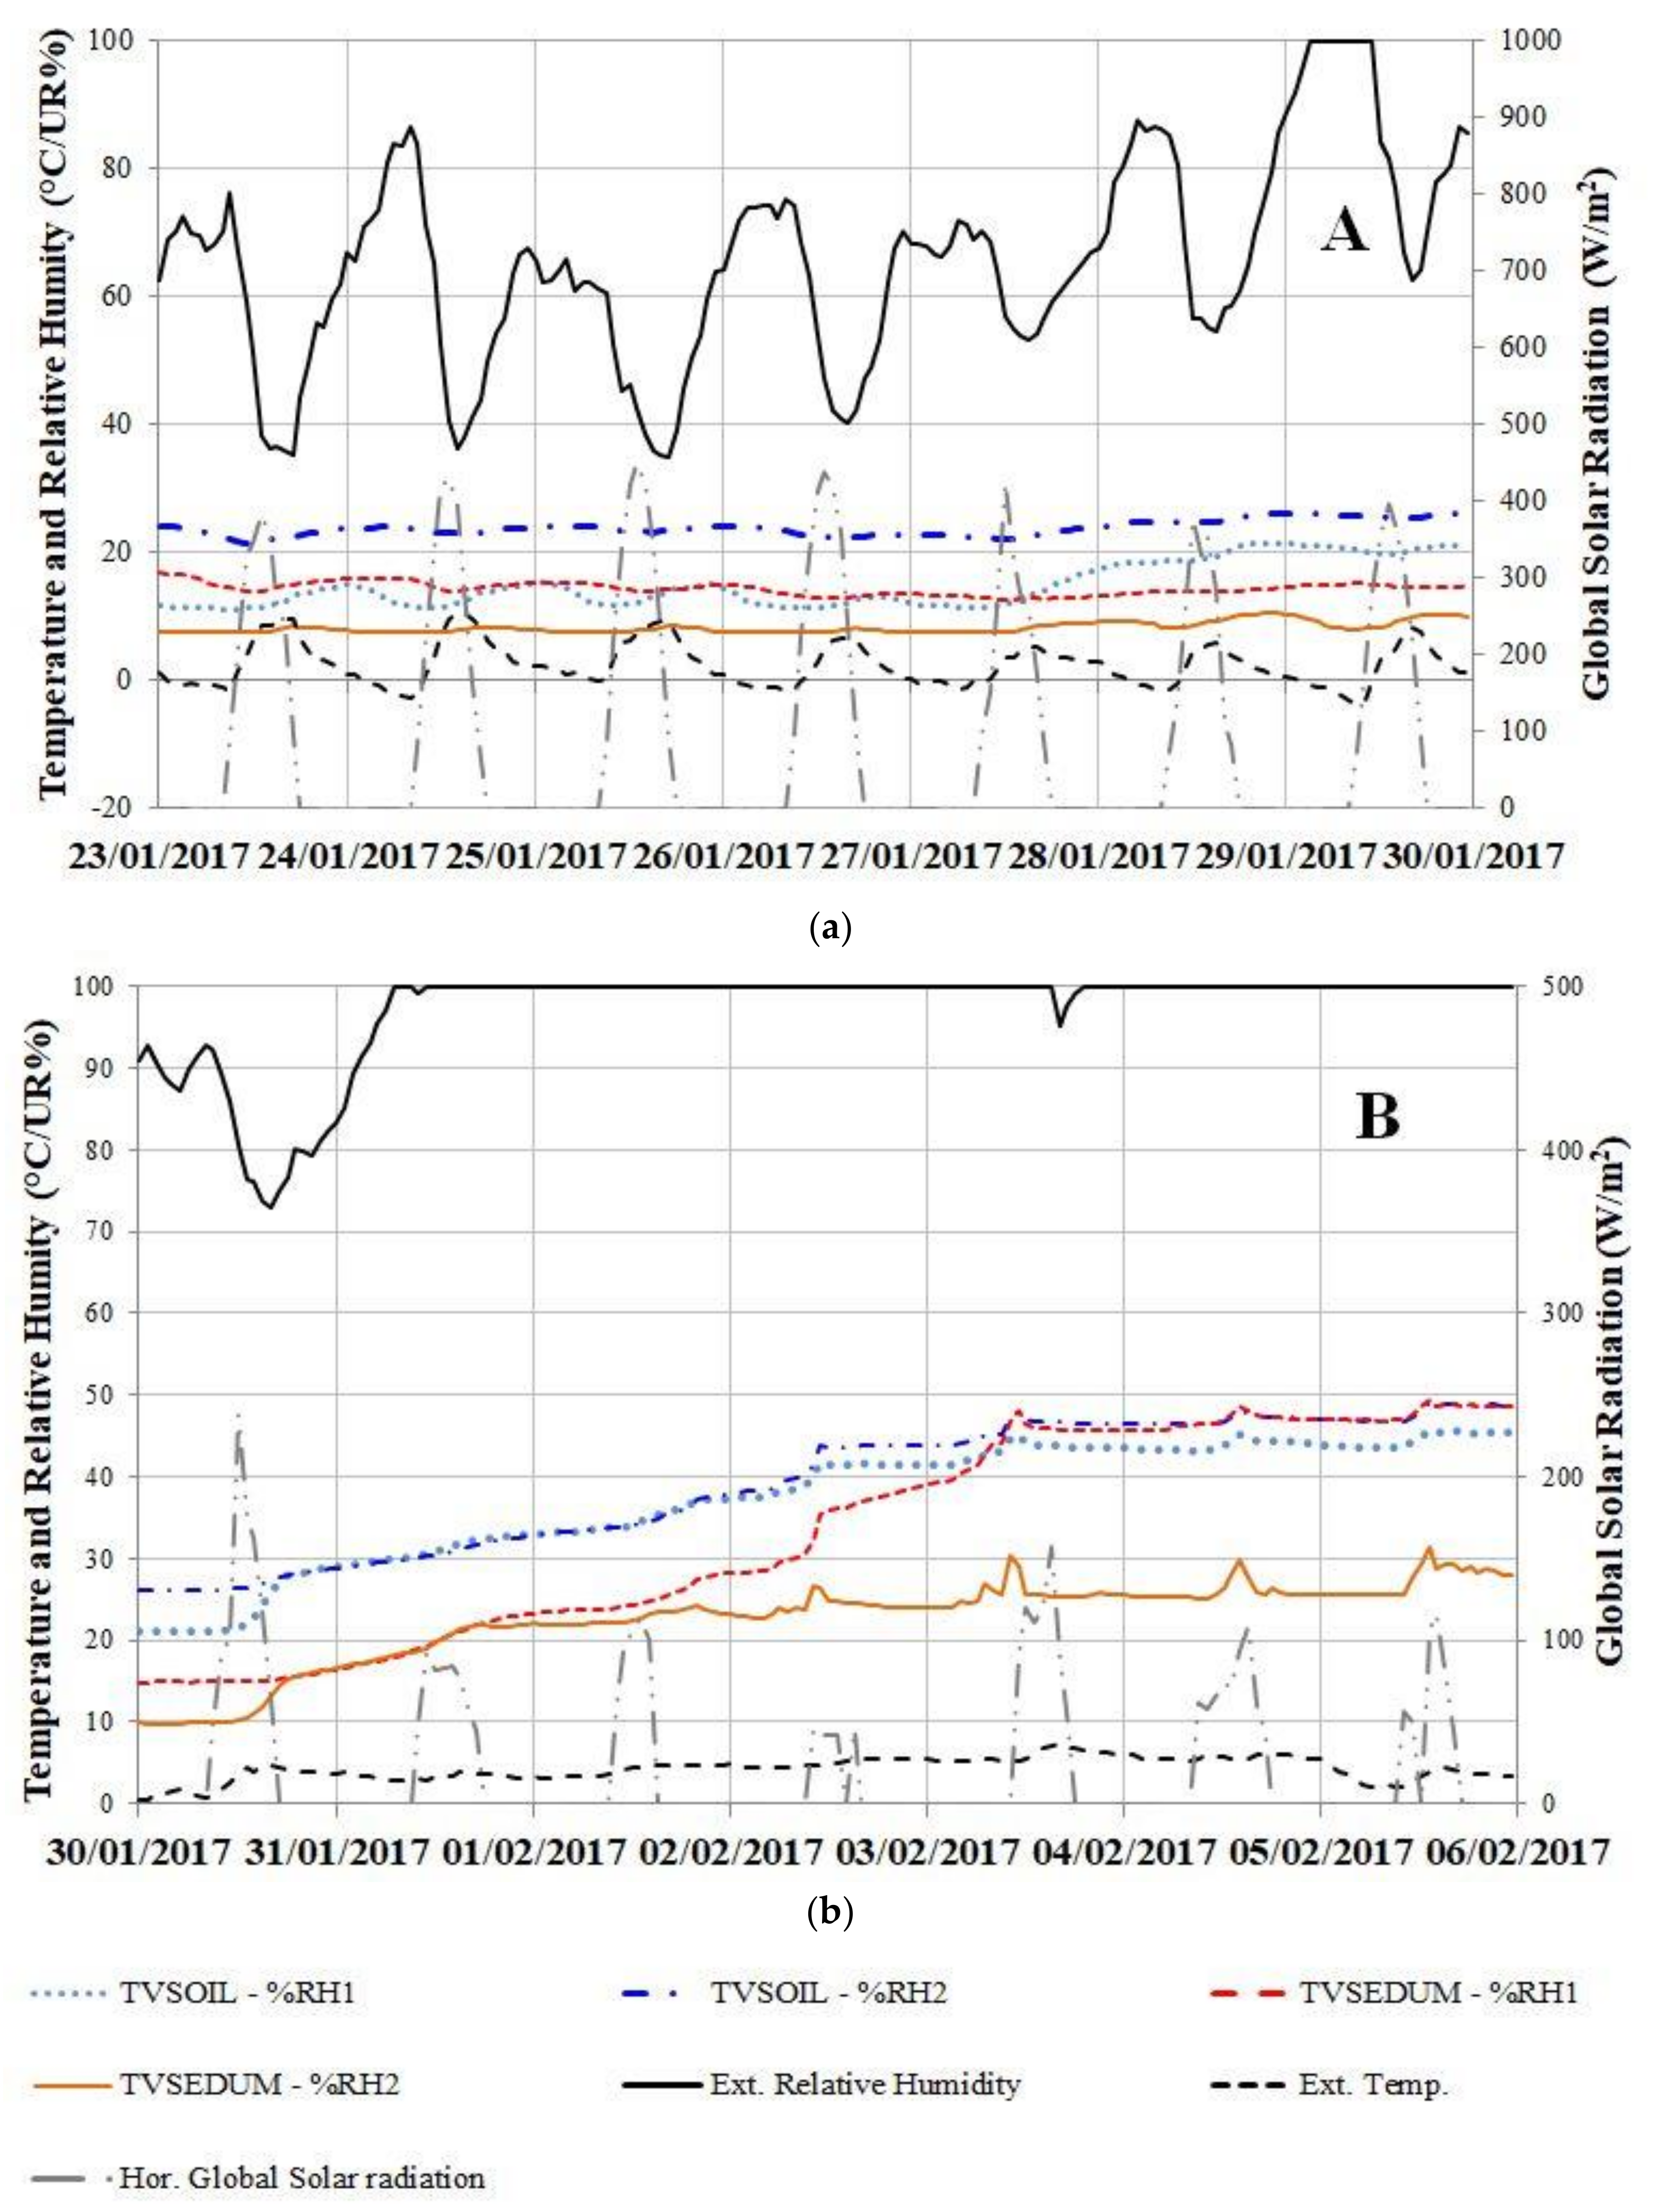
During the winter season, the following weeks were analyzed: from 23 January to 29 January 2017 (A), representative of constant weather conditions with low solar radiation and high external relative humidity, without rainfalls; from 30 January to 5 February 2017 (B), representative of unstable weather conditions with various precipitation events.
Table 5 analyzes and summarizes the daily precipitation (mm/day) during these two weeks.
Table 5.
Cumulated daily rainfall (mm) for two weeks: week “A” and week “B”.
The analysis of Figure 11 confirmed the trends relating to the summer and autumn seasons: apart from a further reduction in the levels of internal humidity (between 10% and 25%) with continuing stable weather conditions, with a high level of external relative humidity, after significant precipitation events, the substrate humidity was about 50%. From the analysis of the graphs in Figure 11 and the seasonal considerations, it is possible to assume an average internal humidity value equal to 50% on an annual basis as a conservative reference value.
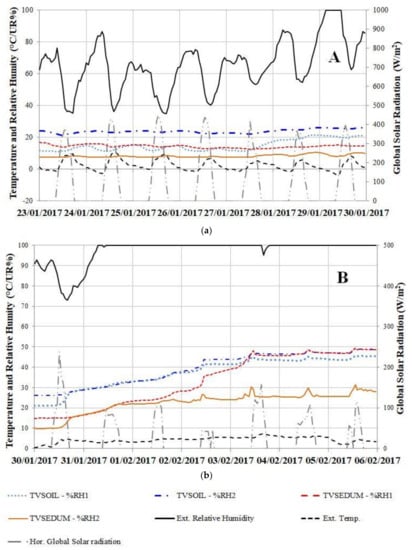
Figure 11.
Internal moisture content of growing media for the week from 23 January to 29 January 2017 (a); and the week from 30 January to 6 February 2017 (b) with TVSOIL and TVSEDUM.
4. Discussion
This paper presents the results concerning the research activity carried out in the last few years by the ITC-CNR to better define and solve some open issues after the first phase of laboratory tests described by Barozzi et al. [13] during the years from 2009 to 2013, which focused on the definition of thermal resistance curves for growing media as a function of density and internal moisture content.
Aspects that can significantly affect the final results, such as the compaction method, the shape of containment boxes or the internal moisture content of laboratory samples were considered
First, during the first research laboratory phase, compaction was carried out manually through a weight laid on samples for a given lapse of time. Sailor et al. [14,15] stated that compaction substantially influences the final thermal resistance of the sample; therefore, the ITC-CNR decided to design and prototype a new laboratory device, a pneumatic compactor, to control and assess the right value of samples compaction.
Moreover, during the first laboratory phase, the maximum compaction level of different growing media samples in real working conditions was unknown, even though, according to the bibliography [15], the reference exposure to natural environmental agents is five years.
The present experimental campaign demonstrated the following. First of all, the maximum natural compaction level of growing media could be considered stable after nine months of exposure to outdoor environmental agents, at least for small samples such as these used in the laboratory. Then, the laboratory activities carried out allowed determining how many times the pneumatic compactor were used to reach in laboratory the same compaction level of samples in real working conditions. Finally, using a pneumatic device rather than a manually system ensured repeatable, controlled and uniform results.
The shape of the containment boxes of laboratory samples was the second important issue to solve. During the first experimental campaign, containment boxes were square in shape, but after manual compaction, both dry and wet samples showed the accumulation of different grain sizes between the corners and the center of samples. The problem was overcome by using ad hoc boxes fitted with an internal containment ring.
The third issue concerns the internal moisture content of laboratory samples. Actually, the thermal resistance of growing media is strongly influenced by this physical quantity. However, during the first experimental laboratory campaign, no references of this parameter were available in real working conditions. This is the reason why Barozzi et al. [13] carried out laboratory tests with the heat flow meter device, hypothesizing five different levels of internal moisture content, from dry to saturated conditions.
The monitoring campaign carried out on TVSOIL and TVSEDUM outdoor test cells allowed collecting monitored data of the internal moisture content on an annual basis in real working conditions, and defining the reference range for laboratory tests as a function of seasons and climatic zones. During the monitoring campaign, the internal moisture content of the growing medium in real working conditions was about 50% only for few months, whilst for the rest of the year values, the internal moisture contents were between 20% and 30%, so the drainage layer could be considered not saturated for most of the year.
The results obtained allow the researchers’ team of ITC-CNR to better pursue the goal to define standardized laboratory tests for the thermal characterization of growing media for green roofs, aiming at the repeatability of tests on samples prepared in the same conditions and with the same characteristics.
Currently, with reference to the compaction of growing media samples, the research activity mainly focuses on both the improvement of the laboratory procedure using the new pneumatic device, and the definition of reference values of density for designers.
Instead, with reference to the internal moisture content of laboratory samples, the ITC-CNR is working on the monitoring of different case studies of green roofs in different national climatic zones [28] and contexts with a view to creating a database of reference values for designers.
Furthermore, one aspect not to be overlooked is the correlation existing between the internal moisture content of growing media and the choice of the vegetated layer plant species. The ITC-CNR has been still working on this issue after the first experimental campaign, focusing on three different vegetative solutions for extensive green roofs in temperate climates [17].
5. Conclusions
The article proposes experimental results obtained from the application of new methodological approaches and innovative laboratory test devices.
These solutions were specifically studied and prototyped to solve the problems and technological gaps underlined in the first phase of the research carried out by the ITC-CNR during the period 2009–2013 [13]. The aim was to define a laboratory test series for the thermo-energy characterization of growing media for green roofs.
Even though the available results were obtained based on a limited number of samples by the ITC-CNR, the main goals of the research are absolutely general.
Once the methodological approach is validated at the international level and becomes a standardized reference, it will be possible to apply them to different types of substrate for equally different configurations of green roofs.
Then, the impact on testing laboratories, building design, producers and building products market will be more rapid and extensive.
This is the specific perspective used by the ITC-CNR to plan future research issues and developments:
- promoting national and international round-robin tests to apply the methodology to different types of growing media;
- comparing results obtained from different climatic contexts and characterized by different levels of outdoor humidity (and corresponding internal moisture contents).
Author Contributions
The work presented in this paper is a collaborative effort by all of the authors. Conceptualization, Benedetta Barozzi and Claudio Maffè; Methodology, Benedetta Barozzi, Alice Bellazzi and Claudio Maffè; Validation, Claudio Maffè; Investigation and Resources, Benedetta Barozzi; Writing-Original Draft, Benedetta Barozzi, Alice Bellazzi and Claudio Maffè; Writing-Review & Editing, Benedetta Barozzi and Claudio Maffè; Supervision and Project Administration, Italo Meroni.
Funding
This research received no external funding.
Acknowledgments
Thanks to DAKU ITALIA SRL for supplying of materials and the collaboration in the preparation of the experimental setups.
Conflicts of Interest
The authors declare no conflicts of interest.
References
- Castleton, H.F.; Stovin, V.; Beck, S.B.M.; Davison, J.B. Green roofs: building savings and the potential for retrofit. Energy Build. 2010, 42, 1582–1591. [Google Scholar] [CrossRef]
- Ascione, F.; Bianco, N.; Rossi, F.D.; Turni, G.; Vanoli, G.P. Green roofs in European climates. Are effective solutions for the energy savings in air-conditioning? Appl. Energy 2013, 104, 845–859. [Google Scholar] [CrossRef]
- Gagliano, A.; Nocera, F.; Detommaso, M.; Evola, G. Thermal behaviour of an extensive green roof: numerical simulations and experimental investigations. Int. J. Heat Technol. 2016, 34(2), 226–234. [Google Scholar] [CrossRef]
- Wong, N.H.; Cheong, D.K.W.; An, H.Y.; Ong, C.L.; Sia, A. The effects of rooftop garden on energy consumption of a commercial building in Singapore. Energy Build. 2003, 35, 353–364. [Google Scholar] [CrossRef]
- Gagliano, A.; Detommaso, M.; Nocera, F.; Berardi, U. The adoption of green roofs for the retrofitting of existing buildings in the Mediterranean climate. Int. J. Sustain. Build. Technol. Urban Dev. 2016, 7, 116–129. [Google Scholar] [CrossRef]
- Gagliano, A.; Detommaso, M.; Nocera, F.; Patania, F.; Aneli, S. The retrofit of existing buildings through the exploitation of the green roofs—A simulation study. Energy Procedia 2014, 62, 52–61. [Google Scholar] [CrossRef]
- Garrison, N.; Horowitz, C. Looking Up: How Green Roofs and Cool Roofs Can Reduce Energy Use, Address climate Change, and Protect Water Resources in Southern California; Natural Research Defence Council: Los Angeles, CA, USA, 2012. [Google Scholar]
- Gregoire, B.G.; Clausen, J.C. Effect of a modular extensive green roof on stormwater runoff and water quality. Ecol. Eng. 2011, 37, 963–969. [Google Scholar] [CrossRef]
- Van Renterghem, T. Green Roofs for Acoustic Insulation and Noise Reduction. Nat. Based Strat. Urban Build. Sustain. 2018, 167–169. [Google Scholar] [CrossRef]
- Yang, H.S.; Kang, J.; Choi, M.D. Acoustic effects of green roof systems on a low-profile structure at street level. Build. Envion. 2012, 50, 44–55. [Google Scholar] [CrossRef]
- Rowe, D.B. Green roofs as a means of pollution abatement. Environ. Pollut. 2011, 159, 2100–2110. [Google Scholar] [CrossRef] [PubMed]
- UNI (Italian Standardisation Body) 11235:2015—Criteria for Design, Execution, Testing and Maintenance of Roof Garden; UNI: Milan, Italy, 2015; Available online: http://store.uni.com/catalogo/index.php/uni-112352015.html?josso_back_to=http://store.uni.com/josso-security check.php&josso_cmd=login_optional&josso_partnerapp_host=store.unicom (accessed on 14 September 2015).
- Barozzi, B.; Bellazzi, A.; Maffè, C.; Pollastro, M.M.C. Measurement of Thermal Properties of Growing Media for Green Roofs: Assessment of a Laboratory Procedure and Experimental Results. Buildings 2017, 7, 99. [Google Scholar] [CrossRef]
- Sailor, D.J.; Hutchinson, D.; Bokovoy, L. Thermal property measurements for eco roof soils common in the western U.S. Sci. Direct 2008, 40, 1246–1251. [Google Scholar] [CrossRef]
- Sailor, D.J.; Hagos, M. An updated and expanded set of thermal property data for green roof growing media Energy Build. Energy Build. 2011, 43, 2298–2303. [Google Scholar] [CrossRef]
- Peng, X.; Heitman, J.; Horton, R.; Ren, T. Field evaluation and improvement of the plate method for measuring soil heat flux density. Agric. For. Meteorol. 2015, 214–215, 341–349. [Google Scholar] [CrossRef]
- Barozzi, B.; Bellazzi, A.; Pollastro, M.C. The energy impact in buildings of vegetative solutions for extensive green roofs in temperate climates. Buildings 2016, 6, 33. [Google Scholar] [CrossRef]
- Jaffal, I.; Ouldboukhitine, S.-E.; Belarbi, R. A comprehensive study of the impact of green roofs on building energy performance. Renew. Energy 2012, 43, 157–164. [Google Scholar] [CrossRef]
- Kumar, R.; Kaushik, S.C. Performance evaluation of green roof and shading for thermal protection of buildings. Build. Environ. 2005, 40, 1505–1511. [Google Scholar] [CrossRef]
- IEEE 442-1981, IEEE Guide for Soil Thermal Resistivity Measurements. 1981. Available online: https://standards.ieee.org/findstds/standard/442-1981.html (accessed on 11 March 2011).
- ASTM D2049-69 Test Method for Relative Density of Cohesionless Soils; ASTM International: West Conshohocken, Pennsylvania, USA, 1969; Available online: https://global.ihs.com/doc_detail.cfm?document_name=ASTM%20D2049&item_s_key=00016255 (accessed on 11 March 2011).
- ASTM D2216-10 Standard Test Methods for Laboratory Determination of Water (Moisture) Content of Soil and Rock by Mass, (N.D.); ASTM International: West Conshohocken, Pennsylvania, USA, 2010; Available online: https://www.astm.org/Standards/D2216.htm (accessed on 15 March 2011).
- DIN 18127 Soil, Investigation and Testing—Proctor-Test; Deutsches Institut für Normung: Berlin, Germany, 2012. Available online: https://standards.globalspec.com/std/1539772/din-18127 (accessed on 15 April 2011).
- ISO 8301 Thermal Insulation—Determination of Steady-State Thermal Resistance and Related Properties—Heat Flow Meter Apparatus; International Organization for Standardization: Geneva, Switzerland, 1991; Available online: https://www.iso.org/standard/15421.html (accessed on 15 April 2011).
- Italian Organisation for Standardisation (UNI). Thermal Performance of Building Materials and—Determination of Thermal Resistance by Means of Guarded Hot Plate and Heat Flow Meter Methods—Products of High and Medium Thermal Resistance; UNI EN 12667:2002; UNI: Milan, Italy, 2002. [Google Scholar]
- Italian Organisation for Standardisation (UNI). Thermal Performance of Building Materials and—Determination of Thermal Resistance by Means of Guarded Hot Plate and Heat Flow Meter Methods—Dry and Moist Products of Medium and Low Thermal; UNI EN 12664:2002; UNI: Milan, Italy, 2002. [Google Scholar]
- USGRA Green Section Staff. USGRA Recommendations for a Method for Putting Green Construction; USGRA Green Section Staff: California, USA, 2004; pp. 1–12. Available online: https://www.usgra.org/green/coned (accessed on 15 April 2011).
- D.P.R. 26 August 1993, N. 412. Regulation on Standards for the Design, Installation, Operation and Maintenance of Heating Systems in Buildings in Order to Limit Energy Consumption, Implementing Art. 4, paragraph 4, Law 10, 9 January 1991. Available online: http://www.gassettaufficiale.it/eli/id/1993/10/14/093G0451/sg (accessed on 15 April 2011).


© 2018 by the authors. Licensee MDPI, Basel, Switzerland. This article is an open access article distributed under the terms and conditions of the Creative Commons Attribution (CC BY) license (http://creativecommons.org/licenses/by/4.0/).