Effect of Material Variability and Mechanical Eccentricity on the Seismic Vulnerability Assessment of Reinforced Concrete Buildings


Abstract
:1. Introduction
2. Centre of Strength and Centre of Stiffness
2.1. Generalities
2.2. Center of Stiffness and Eccentricity of Stiffness
- coordinates of the i-th column;
- stiffness of the i-th column in the coordinate directions, the function of the Young modulus E. Because of this definition, the center of the stiffness position is affected by material variability through E values. The elastic modulus is related to the concrete compressive strength with the following expression [20]:
- coordinates of centroid of the j-th floor;
- building length in x and y directions.
2.3. Centre of Strength and Eccentricity of Strength
- The strength of the concrete;
- The strength of steel bars;
- The position of the columns in the building;
- The geometry (length, restraints, and inertial characteristics) of the columns.
- compressive axial resistance of the i-th columns;
- coordinates of the i-th columns;
- number of columns at j-th level.
- failure bending moment of the R.C. section of the i-th column.
- The corresponding strength eccentricity is:
- coordinates of the center of strength, computed with Method 1 or Method 2;
- coordinate of the j-th column;
- building length in x and y directions.
3. A Benchmark Case-Study
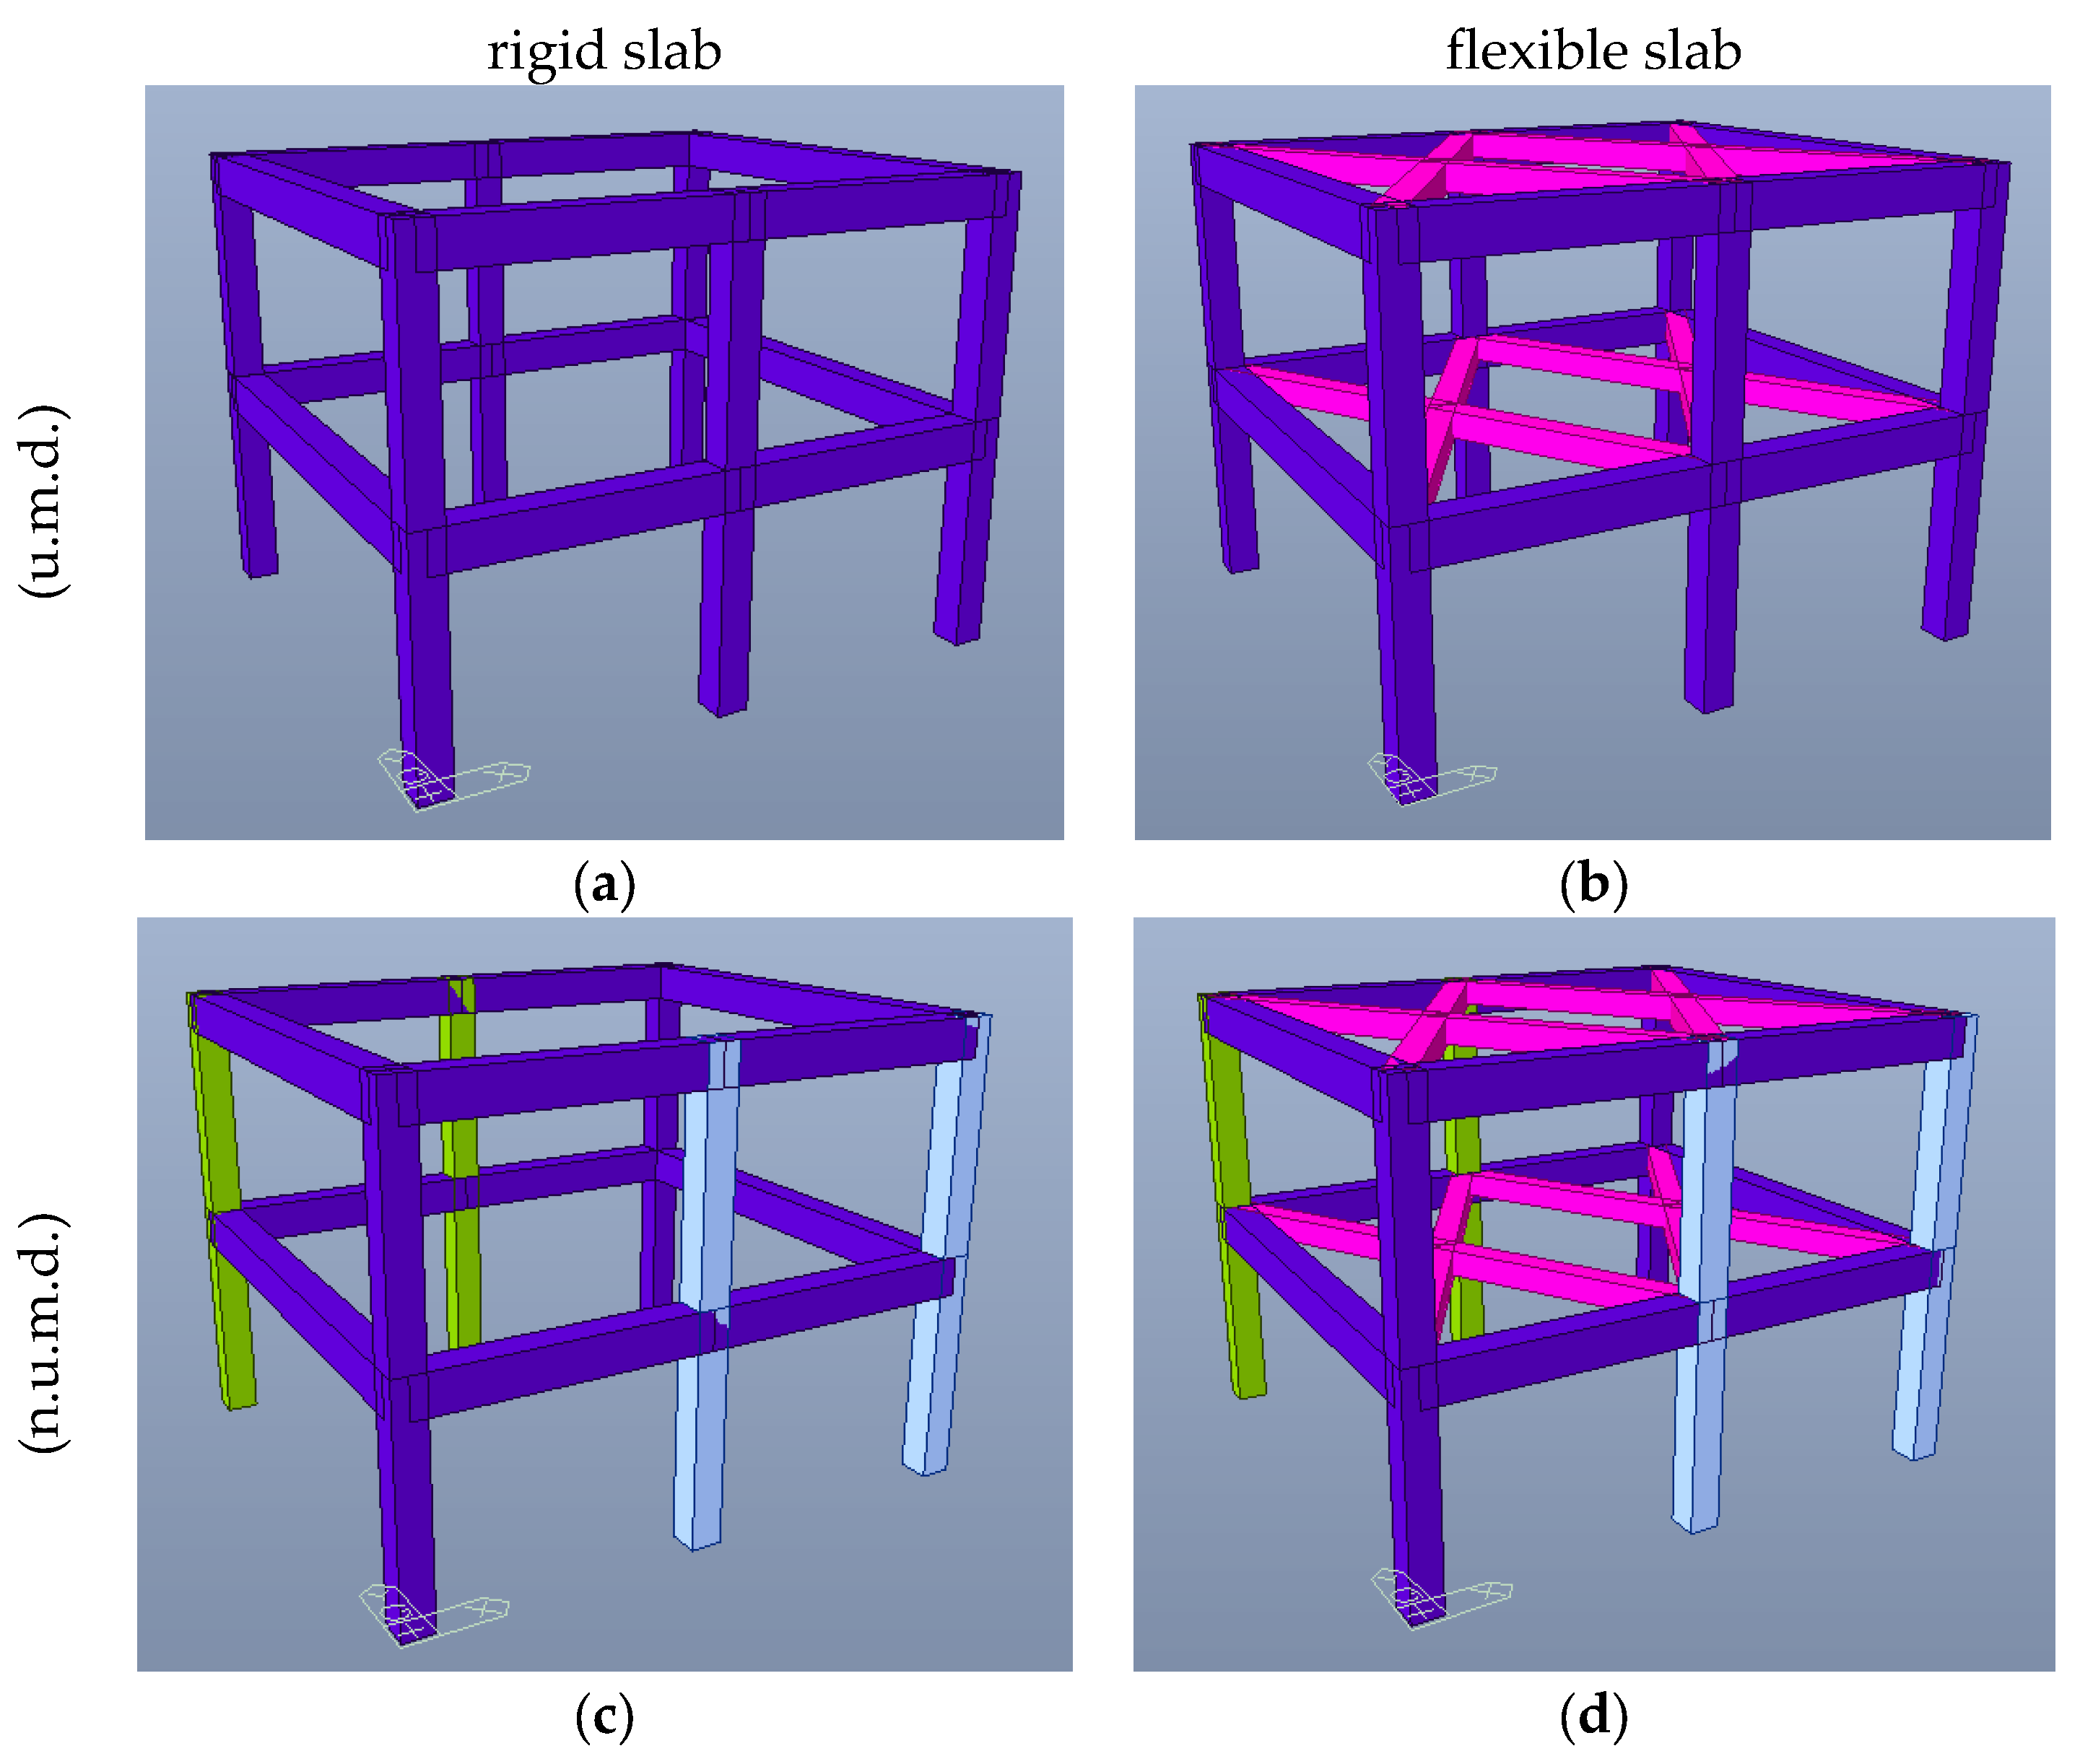
3.1. Description of the Benchmark Building
- Uniform material distribution (u.m.d.);
- Non-uniform material distribution (n.u.m.d.);
- Flexible slab, simulated by assuming equivalent bracing of axial stiffness ;
- Rigid slab, obtained through kinematic restraints at the diaphragm level.
3.2. Calculation of the Risk Index
- In-plane displacements and rotations are greater for (n.u.m.d.), inducing additional stresses on the external columns;
- The maximum ratio between capacity and demand decreases for (n.u.m.d.);
- The ultimate shear does not have relevant changes because it is related to the mean resistance of the structure, that does not sensitively vary in average terms;
- The ultimate displacement decreases for (n.u.m.d.) compared to (u.m.d.).
4. Effects of Material Variability on Collapse Mechanisms
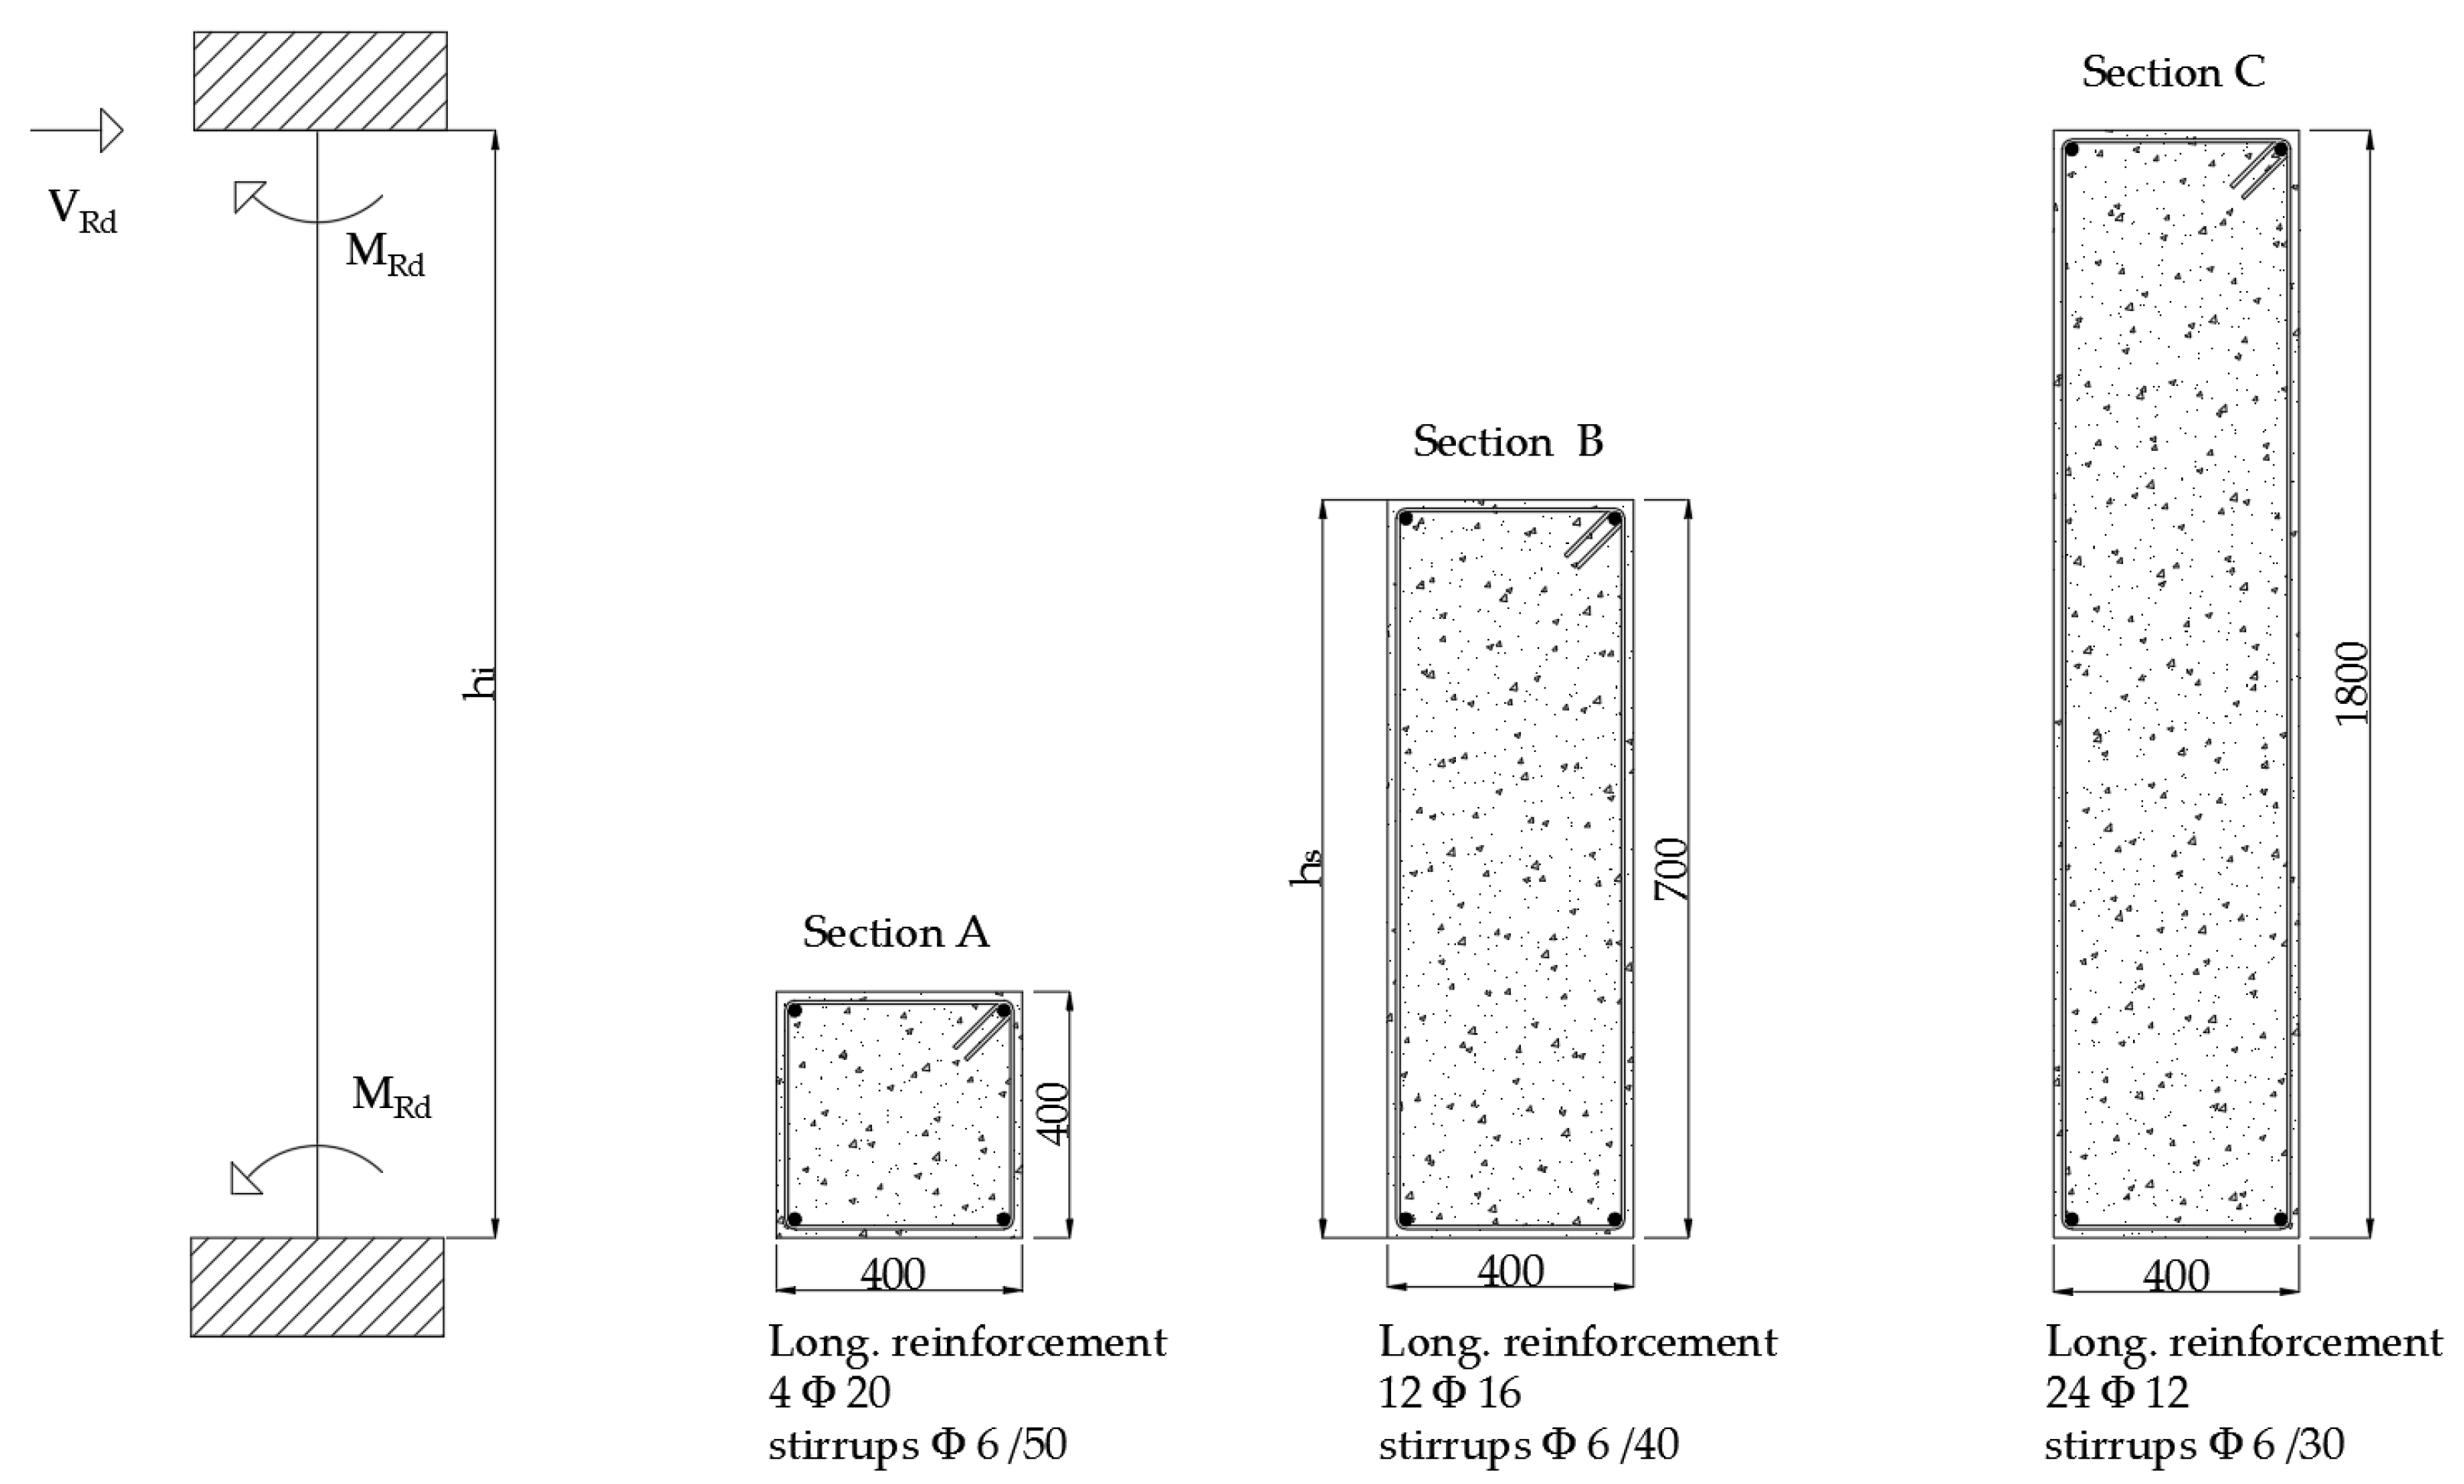
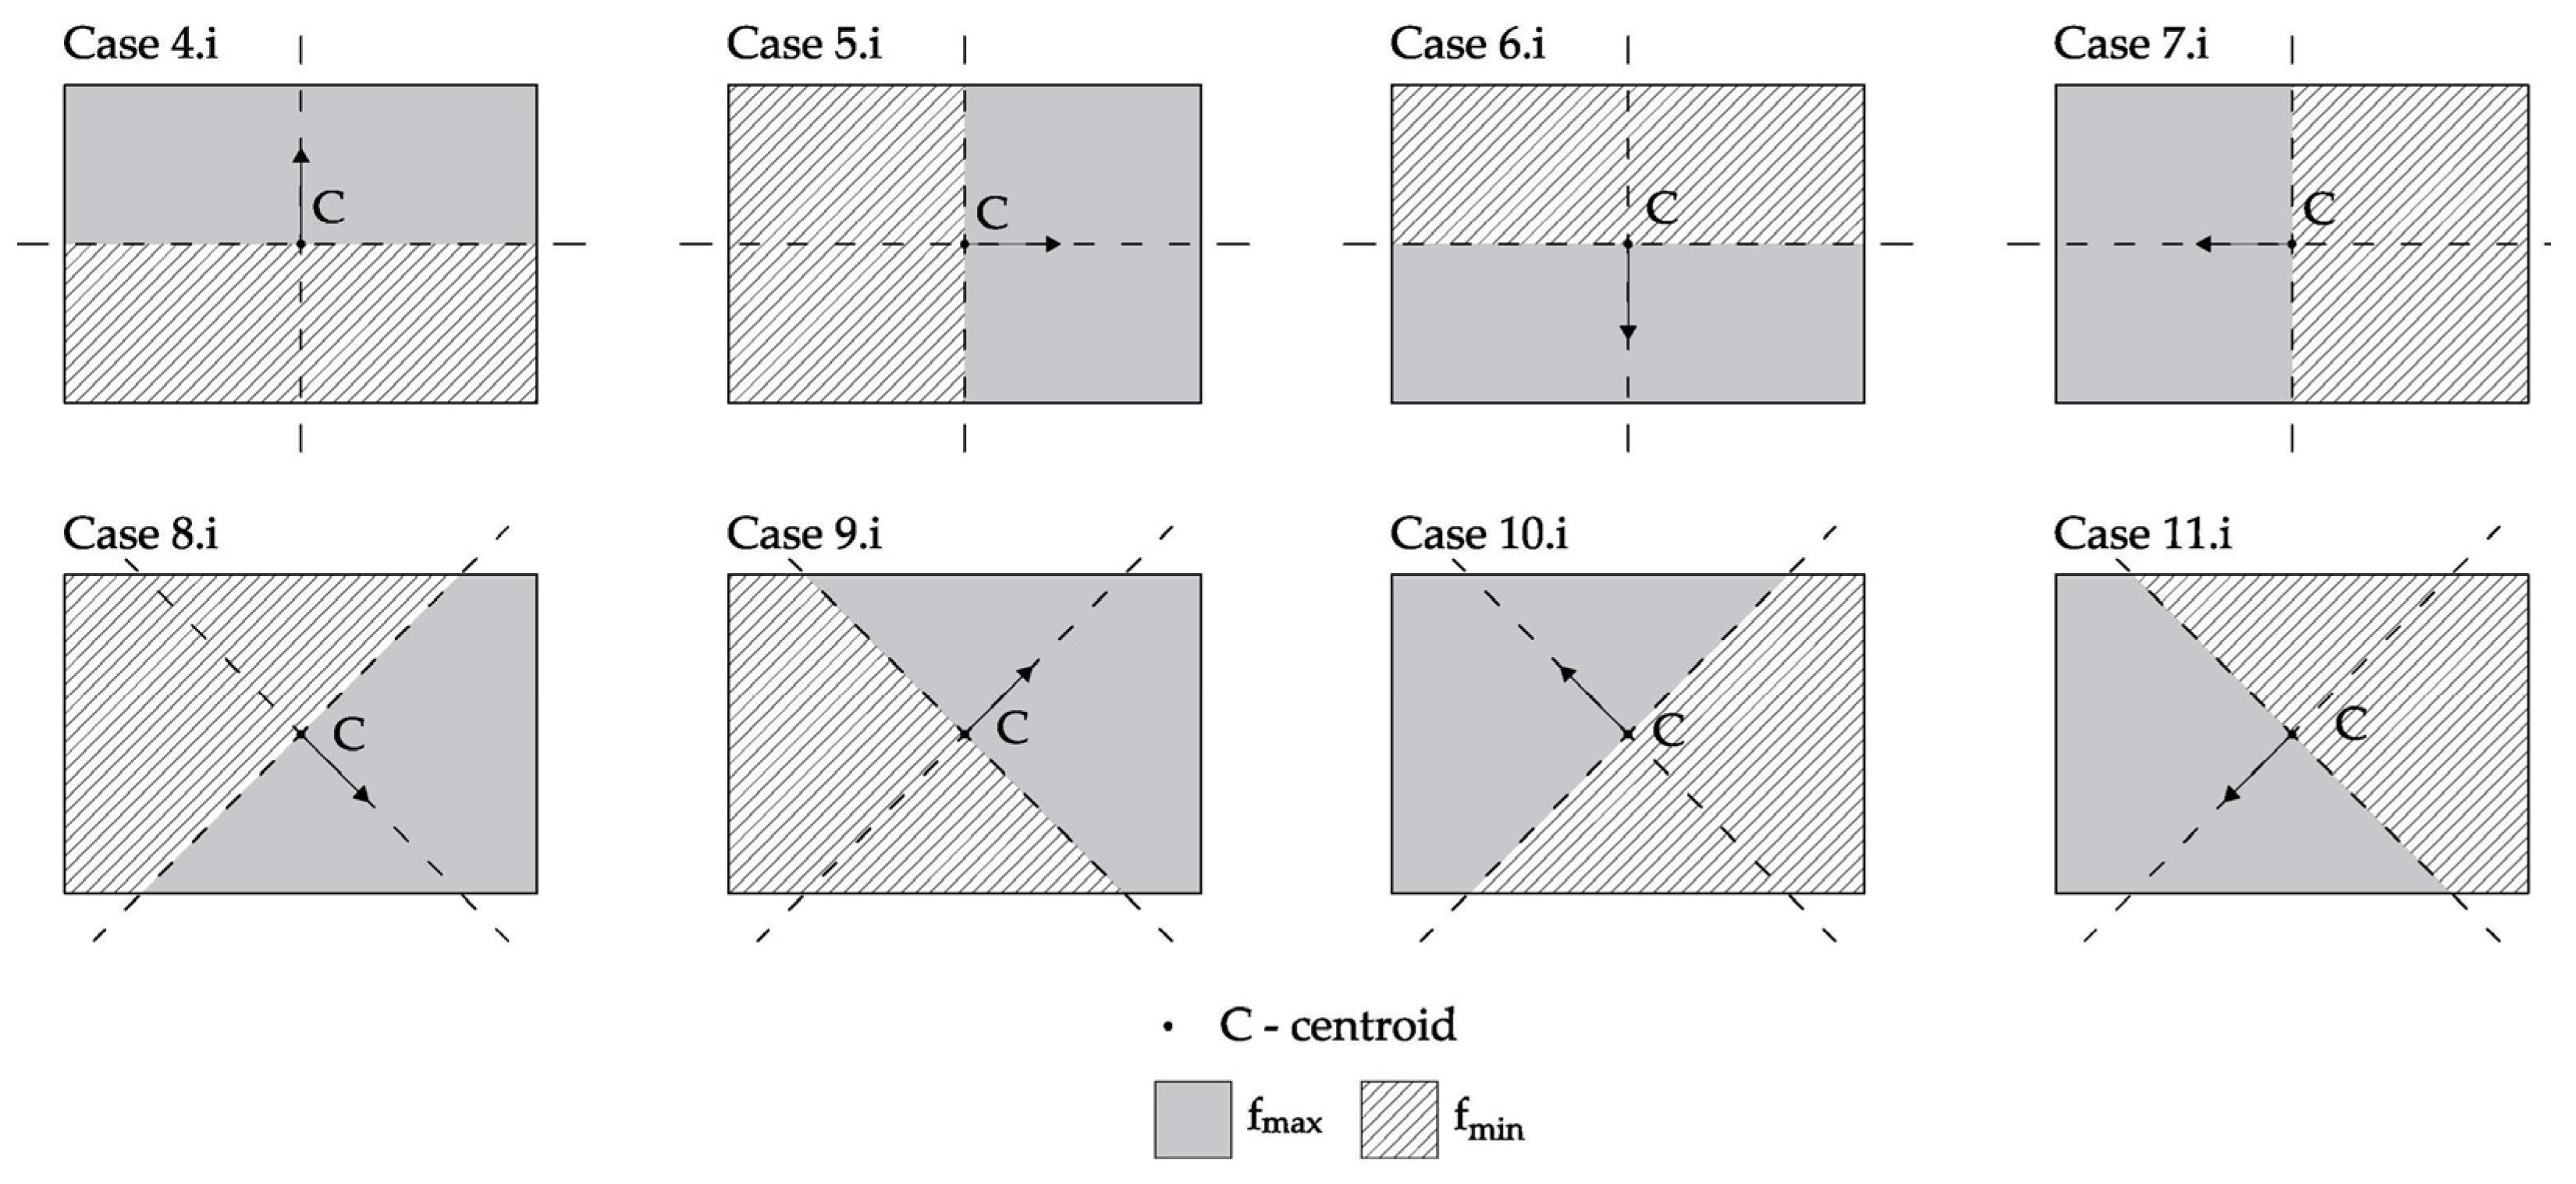
4.1. Input Parameters and Failure Mechanisms for Parametric Analysis
- is the height of the i-th column.
- is taken equal to 2 for slender elements and 1 for the squat ones (see Table 6). The slenderness is defined as:being the height of the cross section.
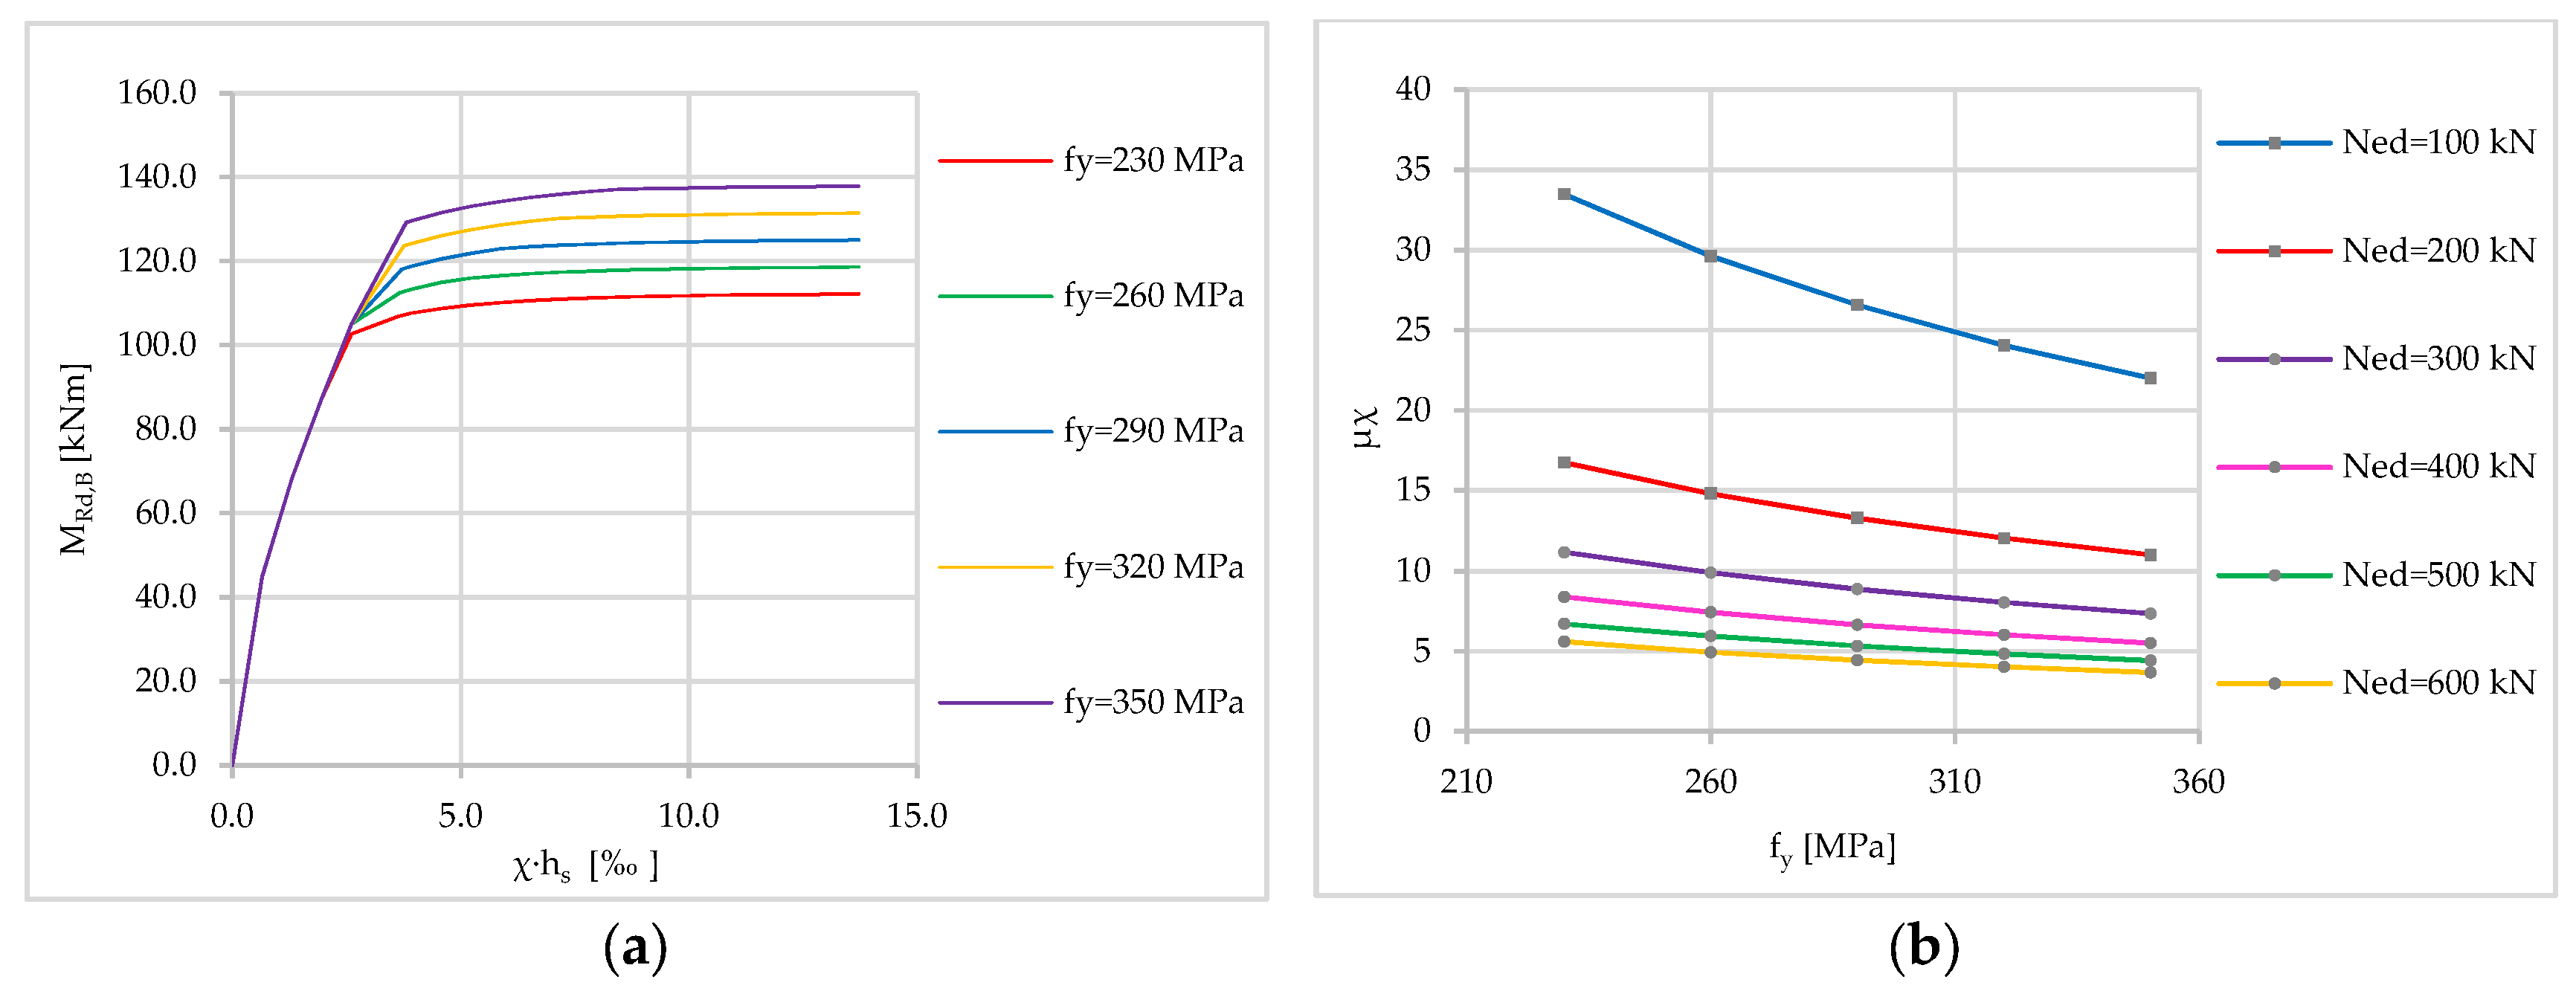
4.2. Results of Parametric Analysis
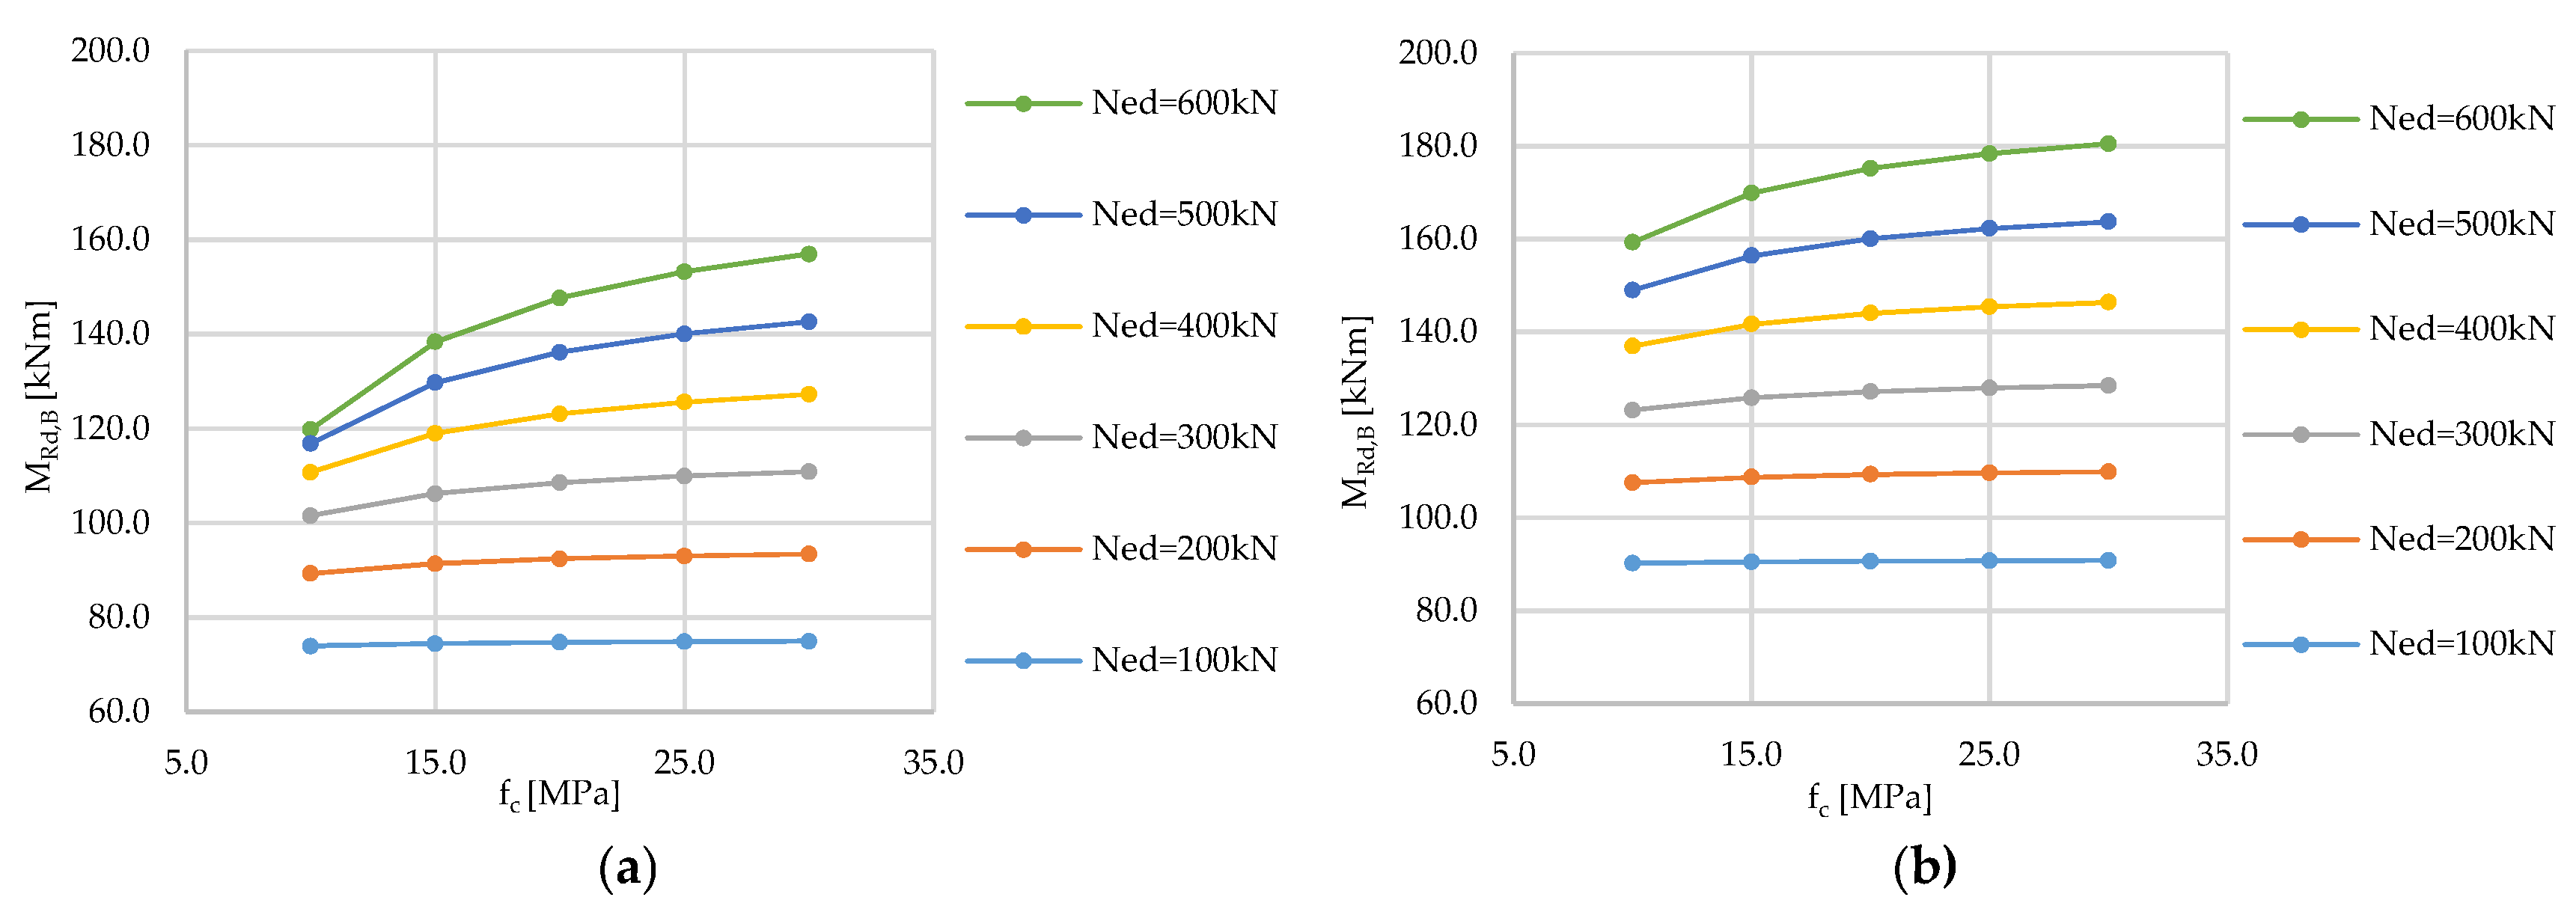
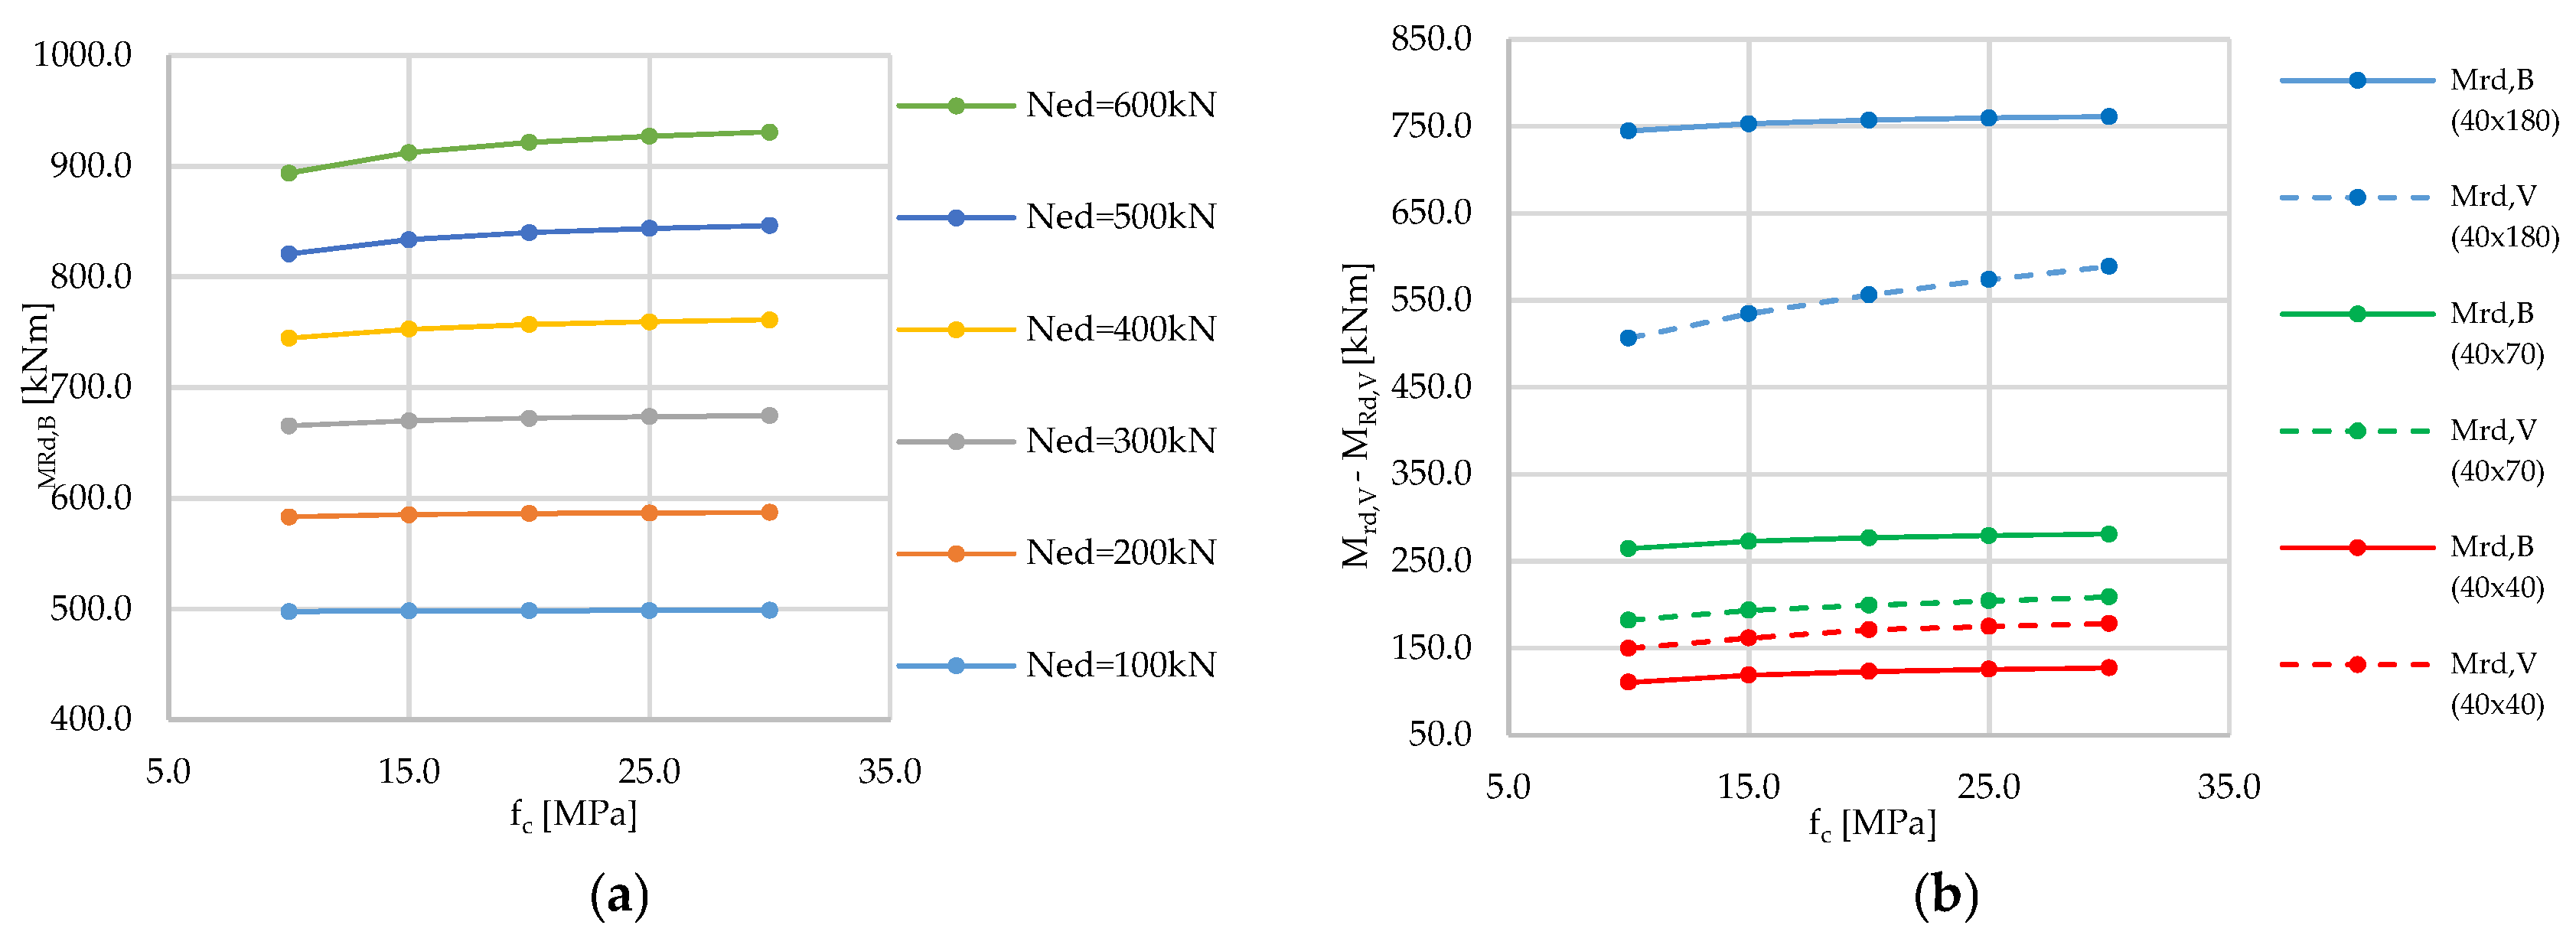
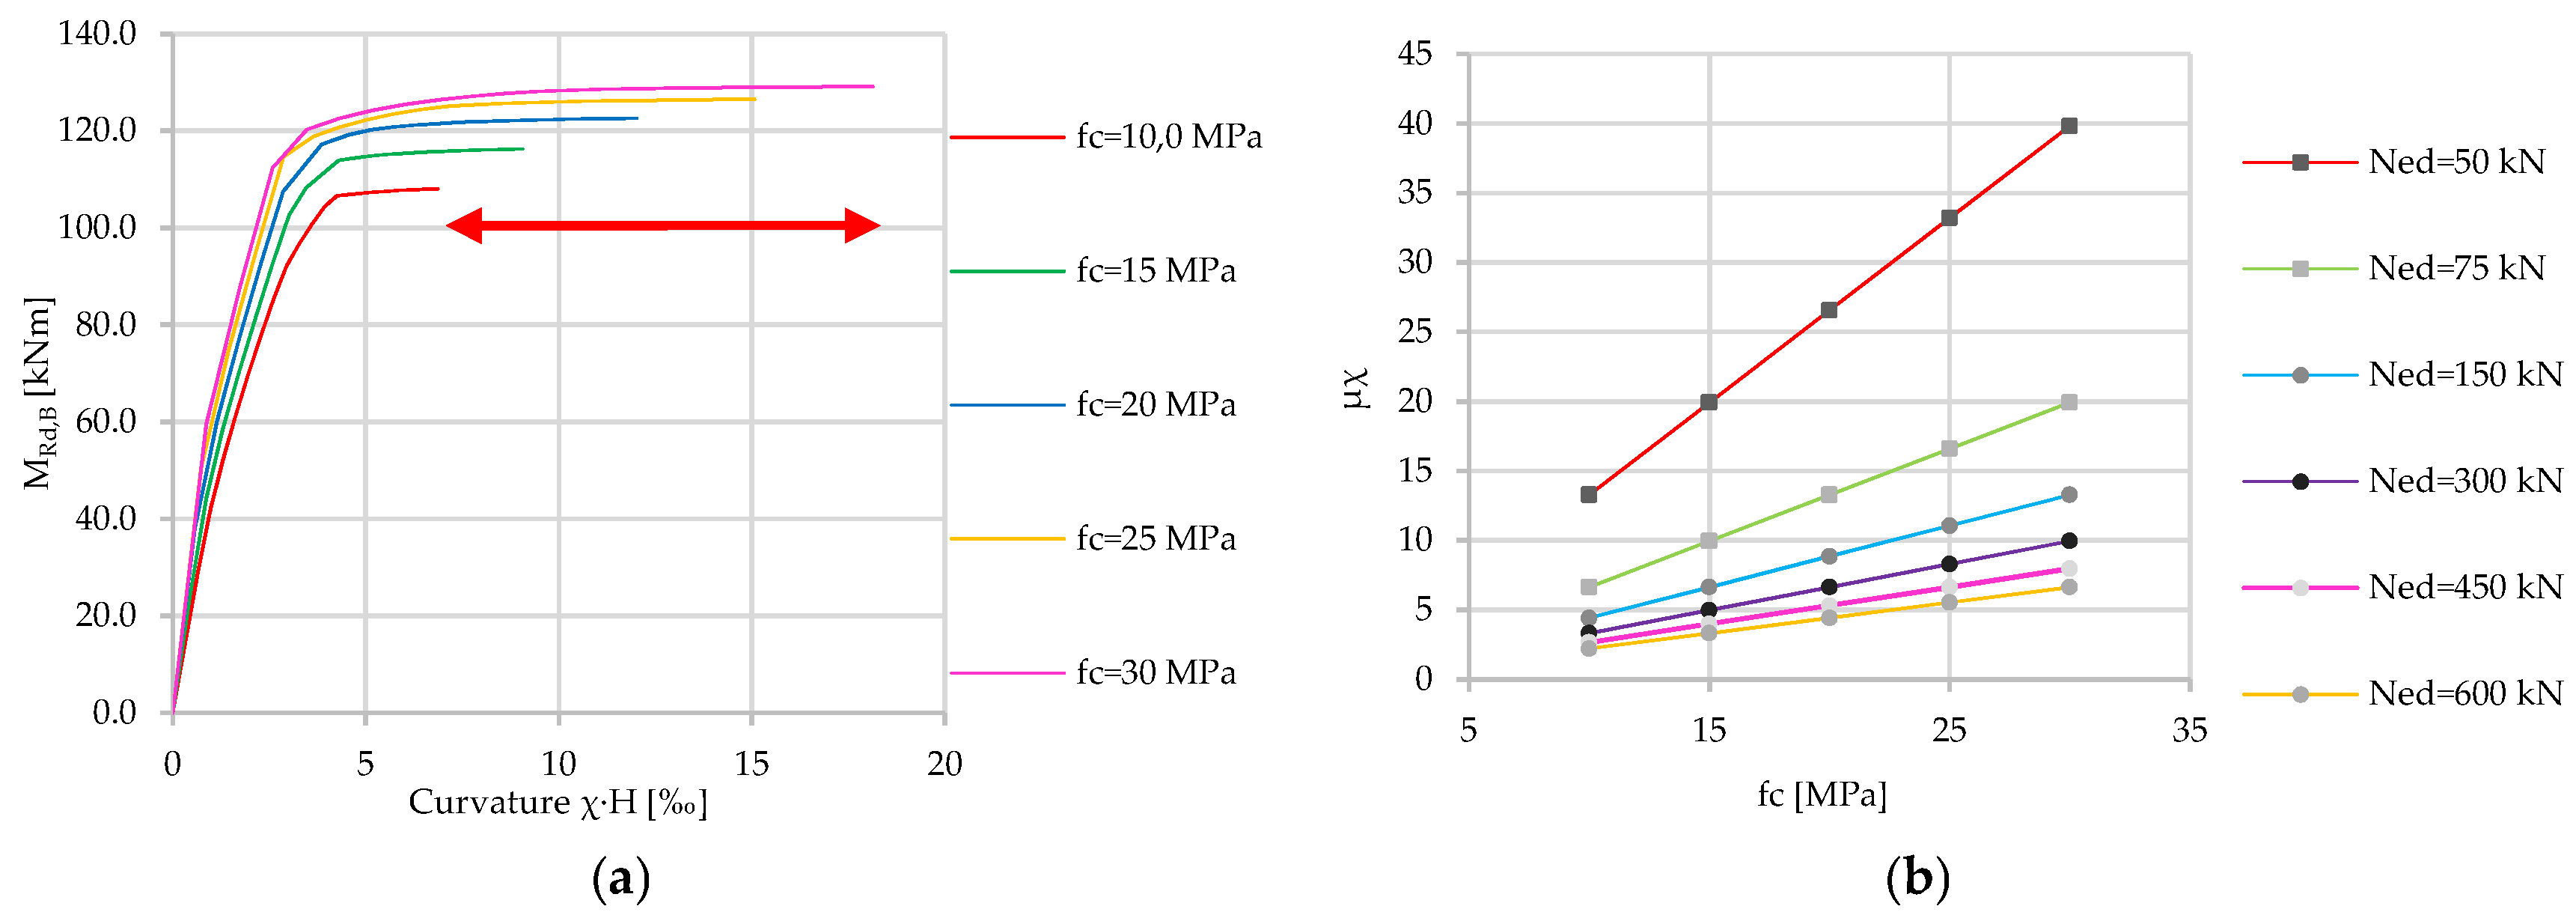
4.2.1. Concrete
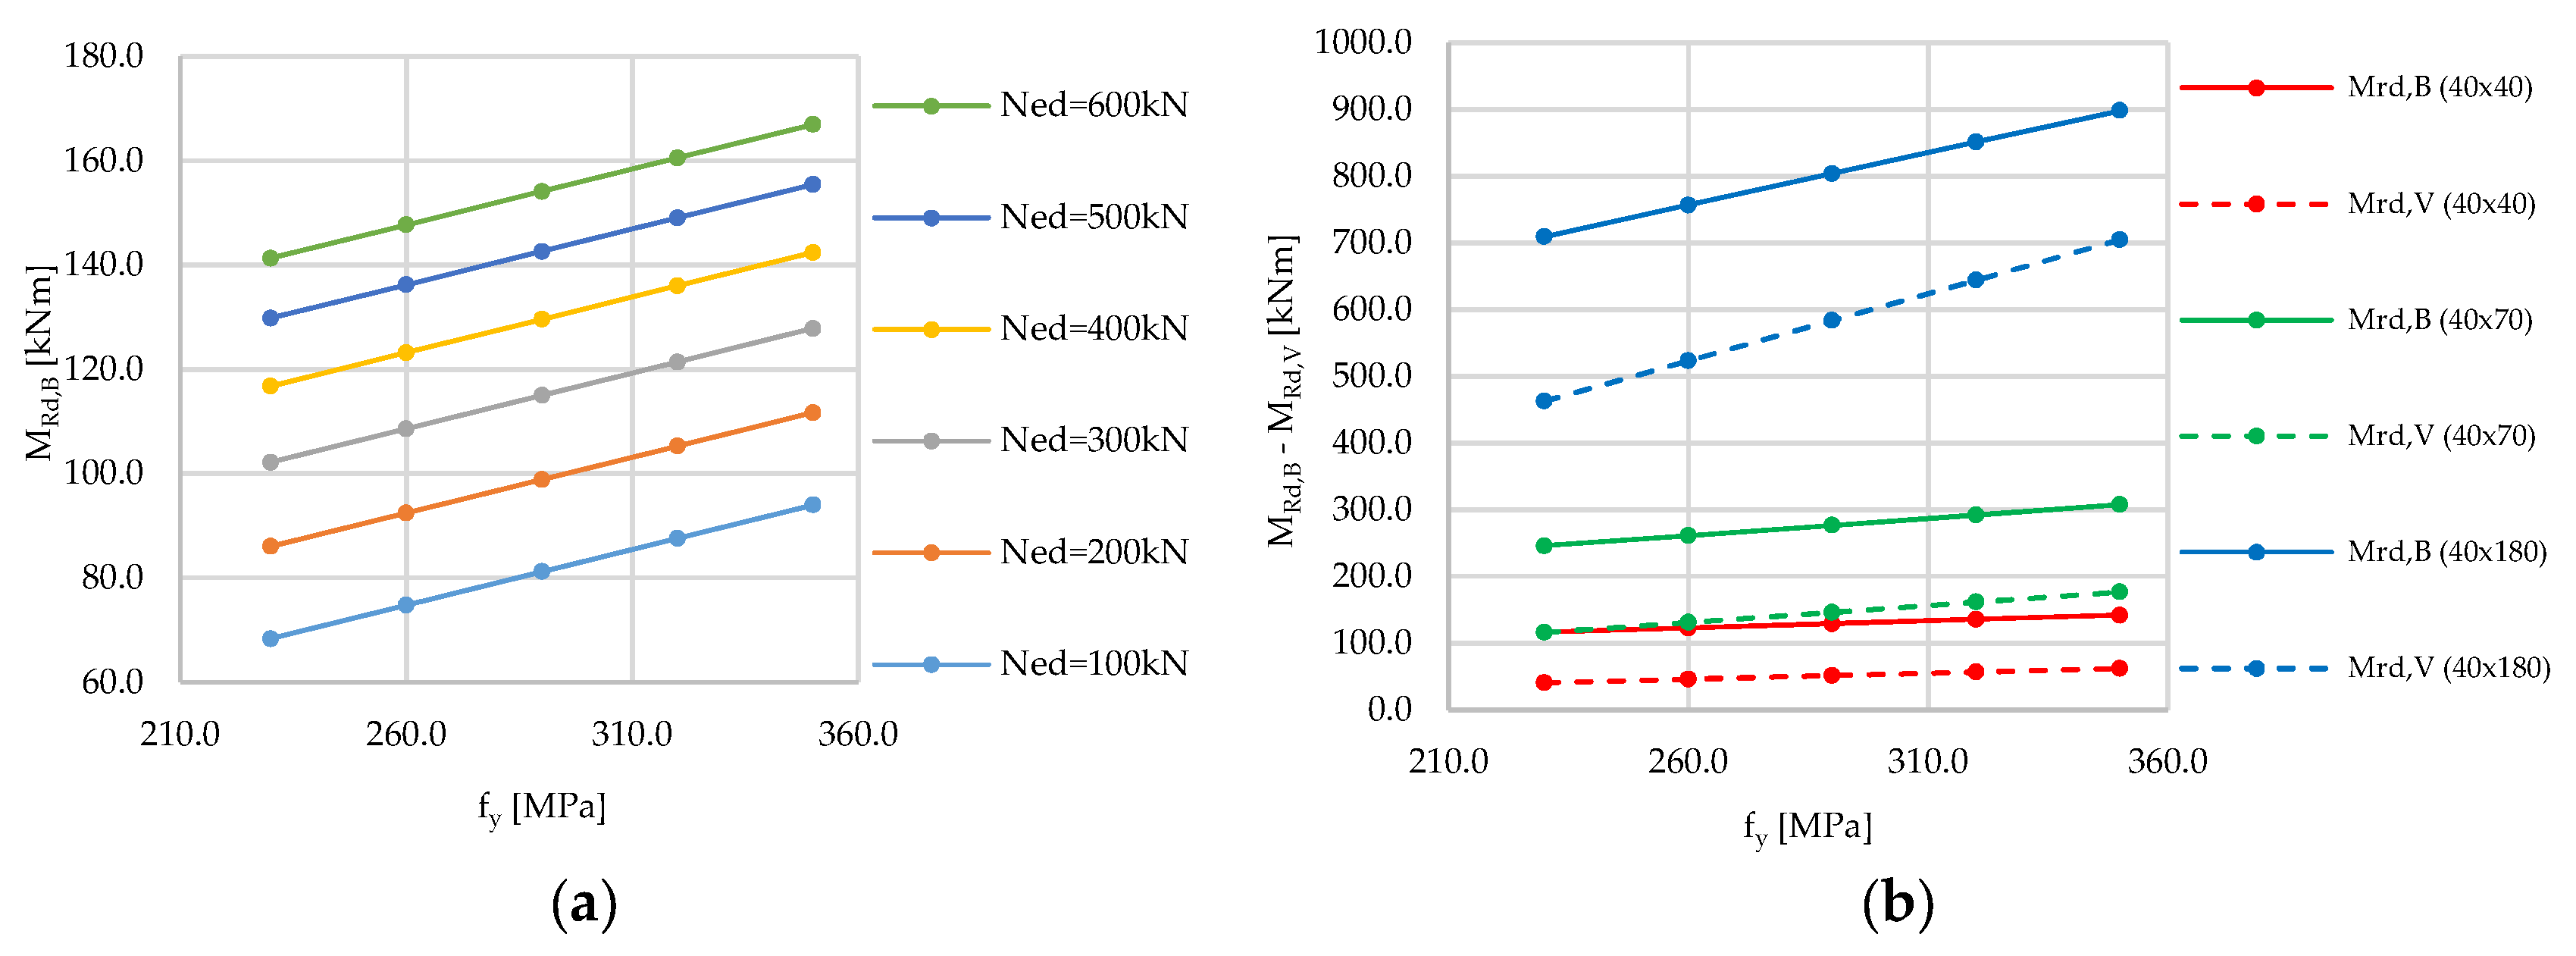
4.2.2. Steel
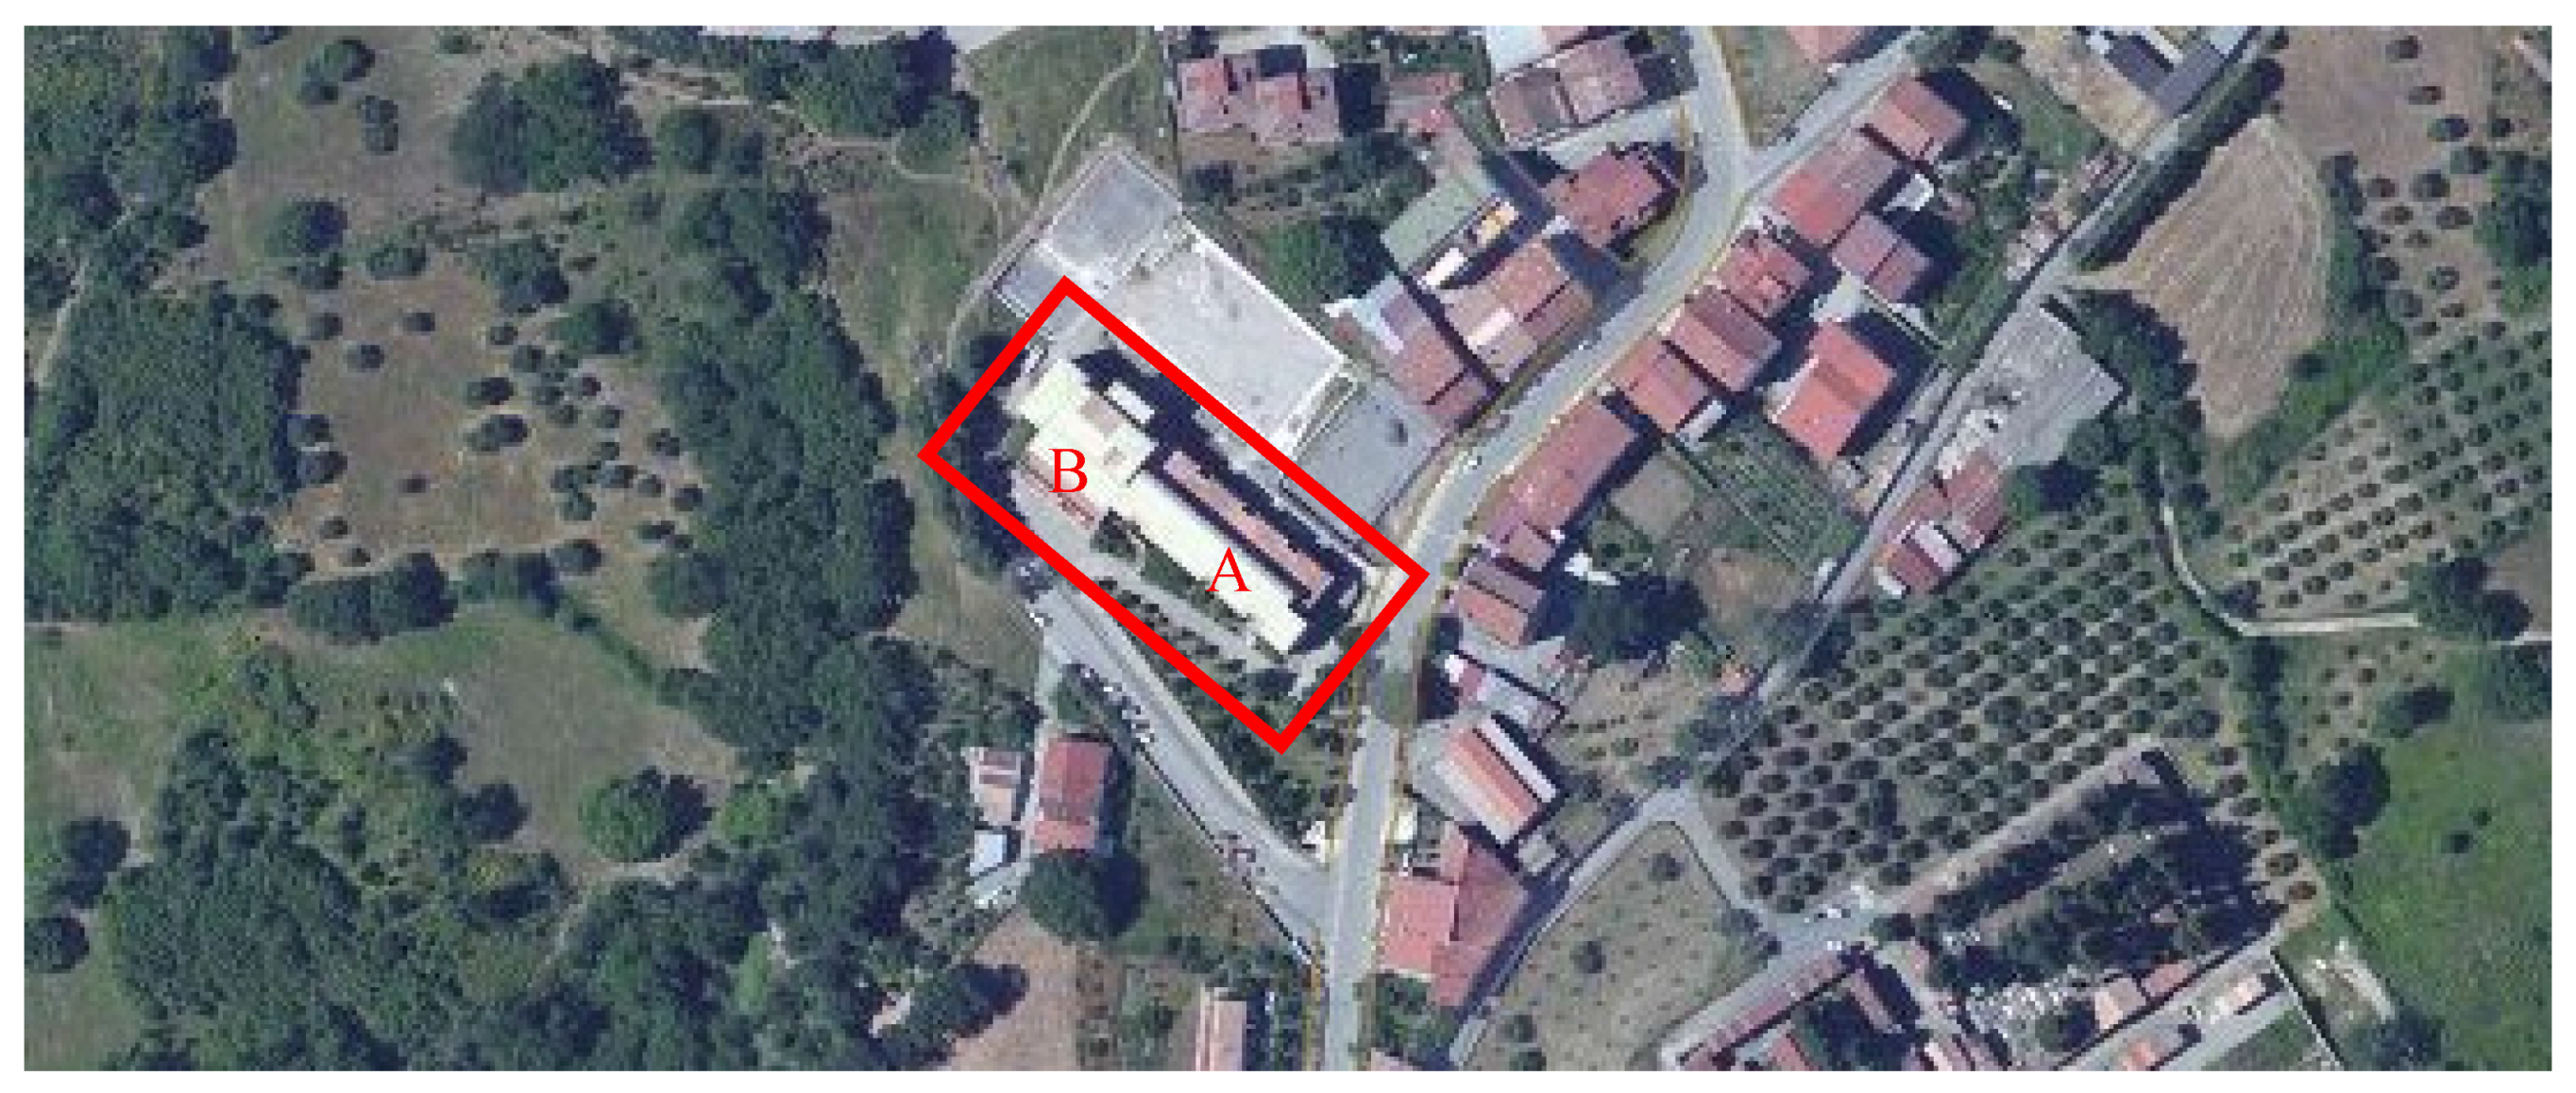
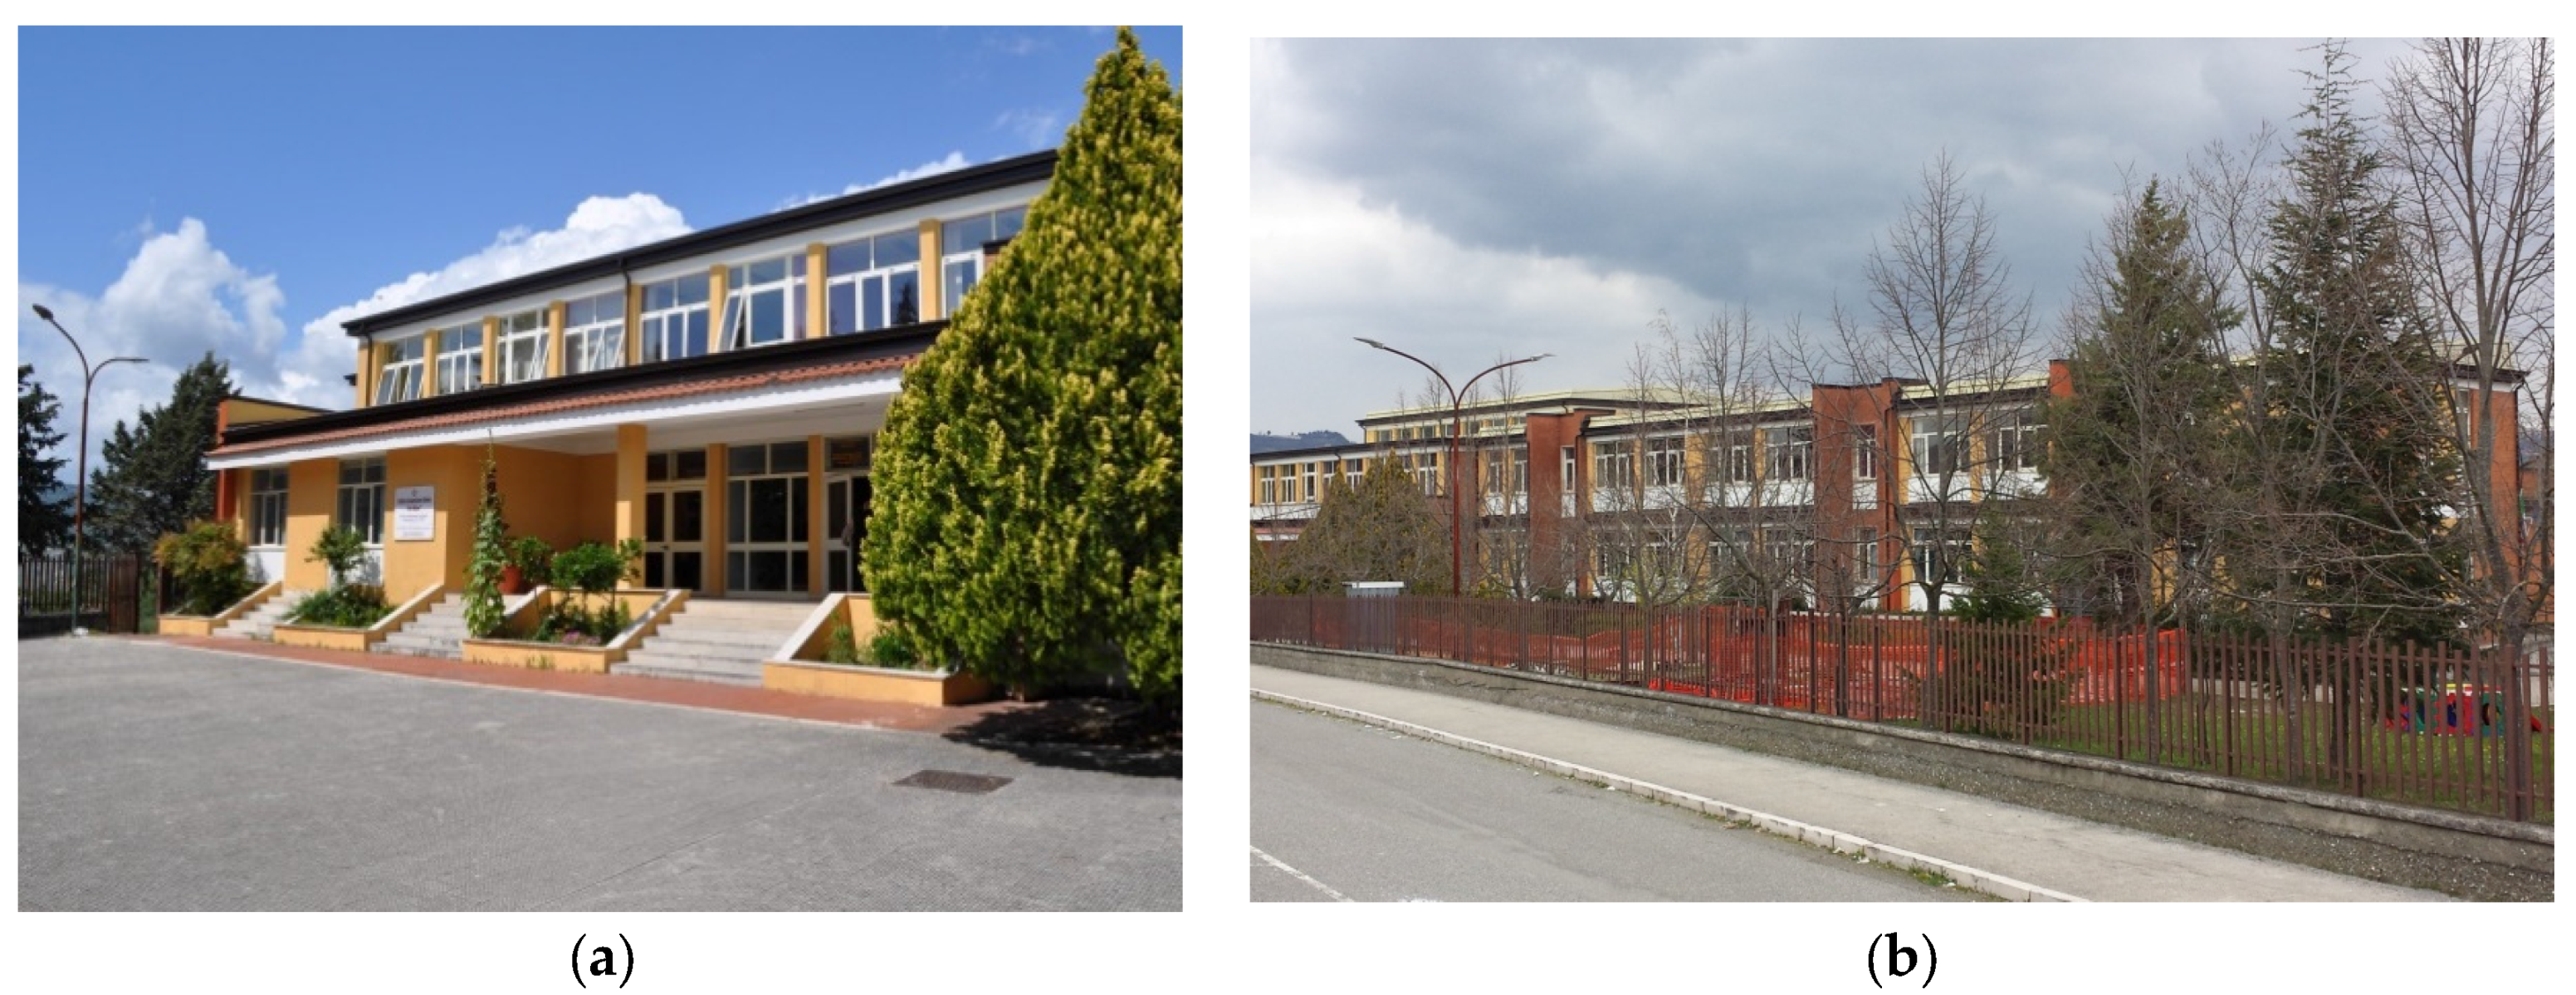
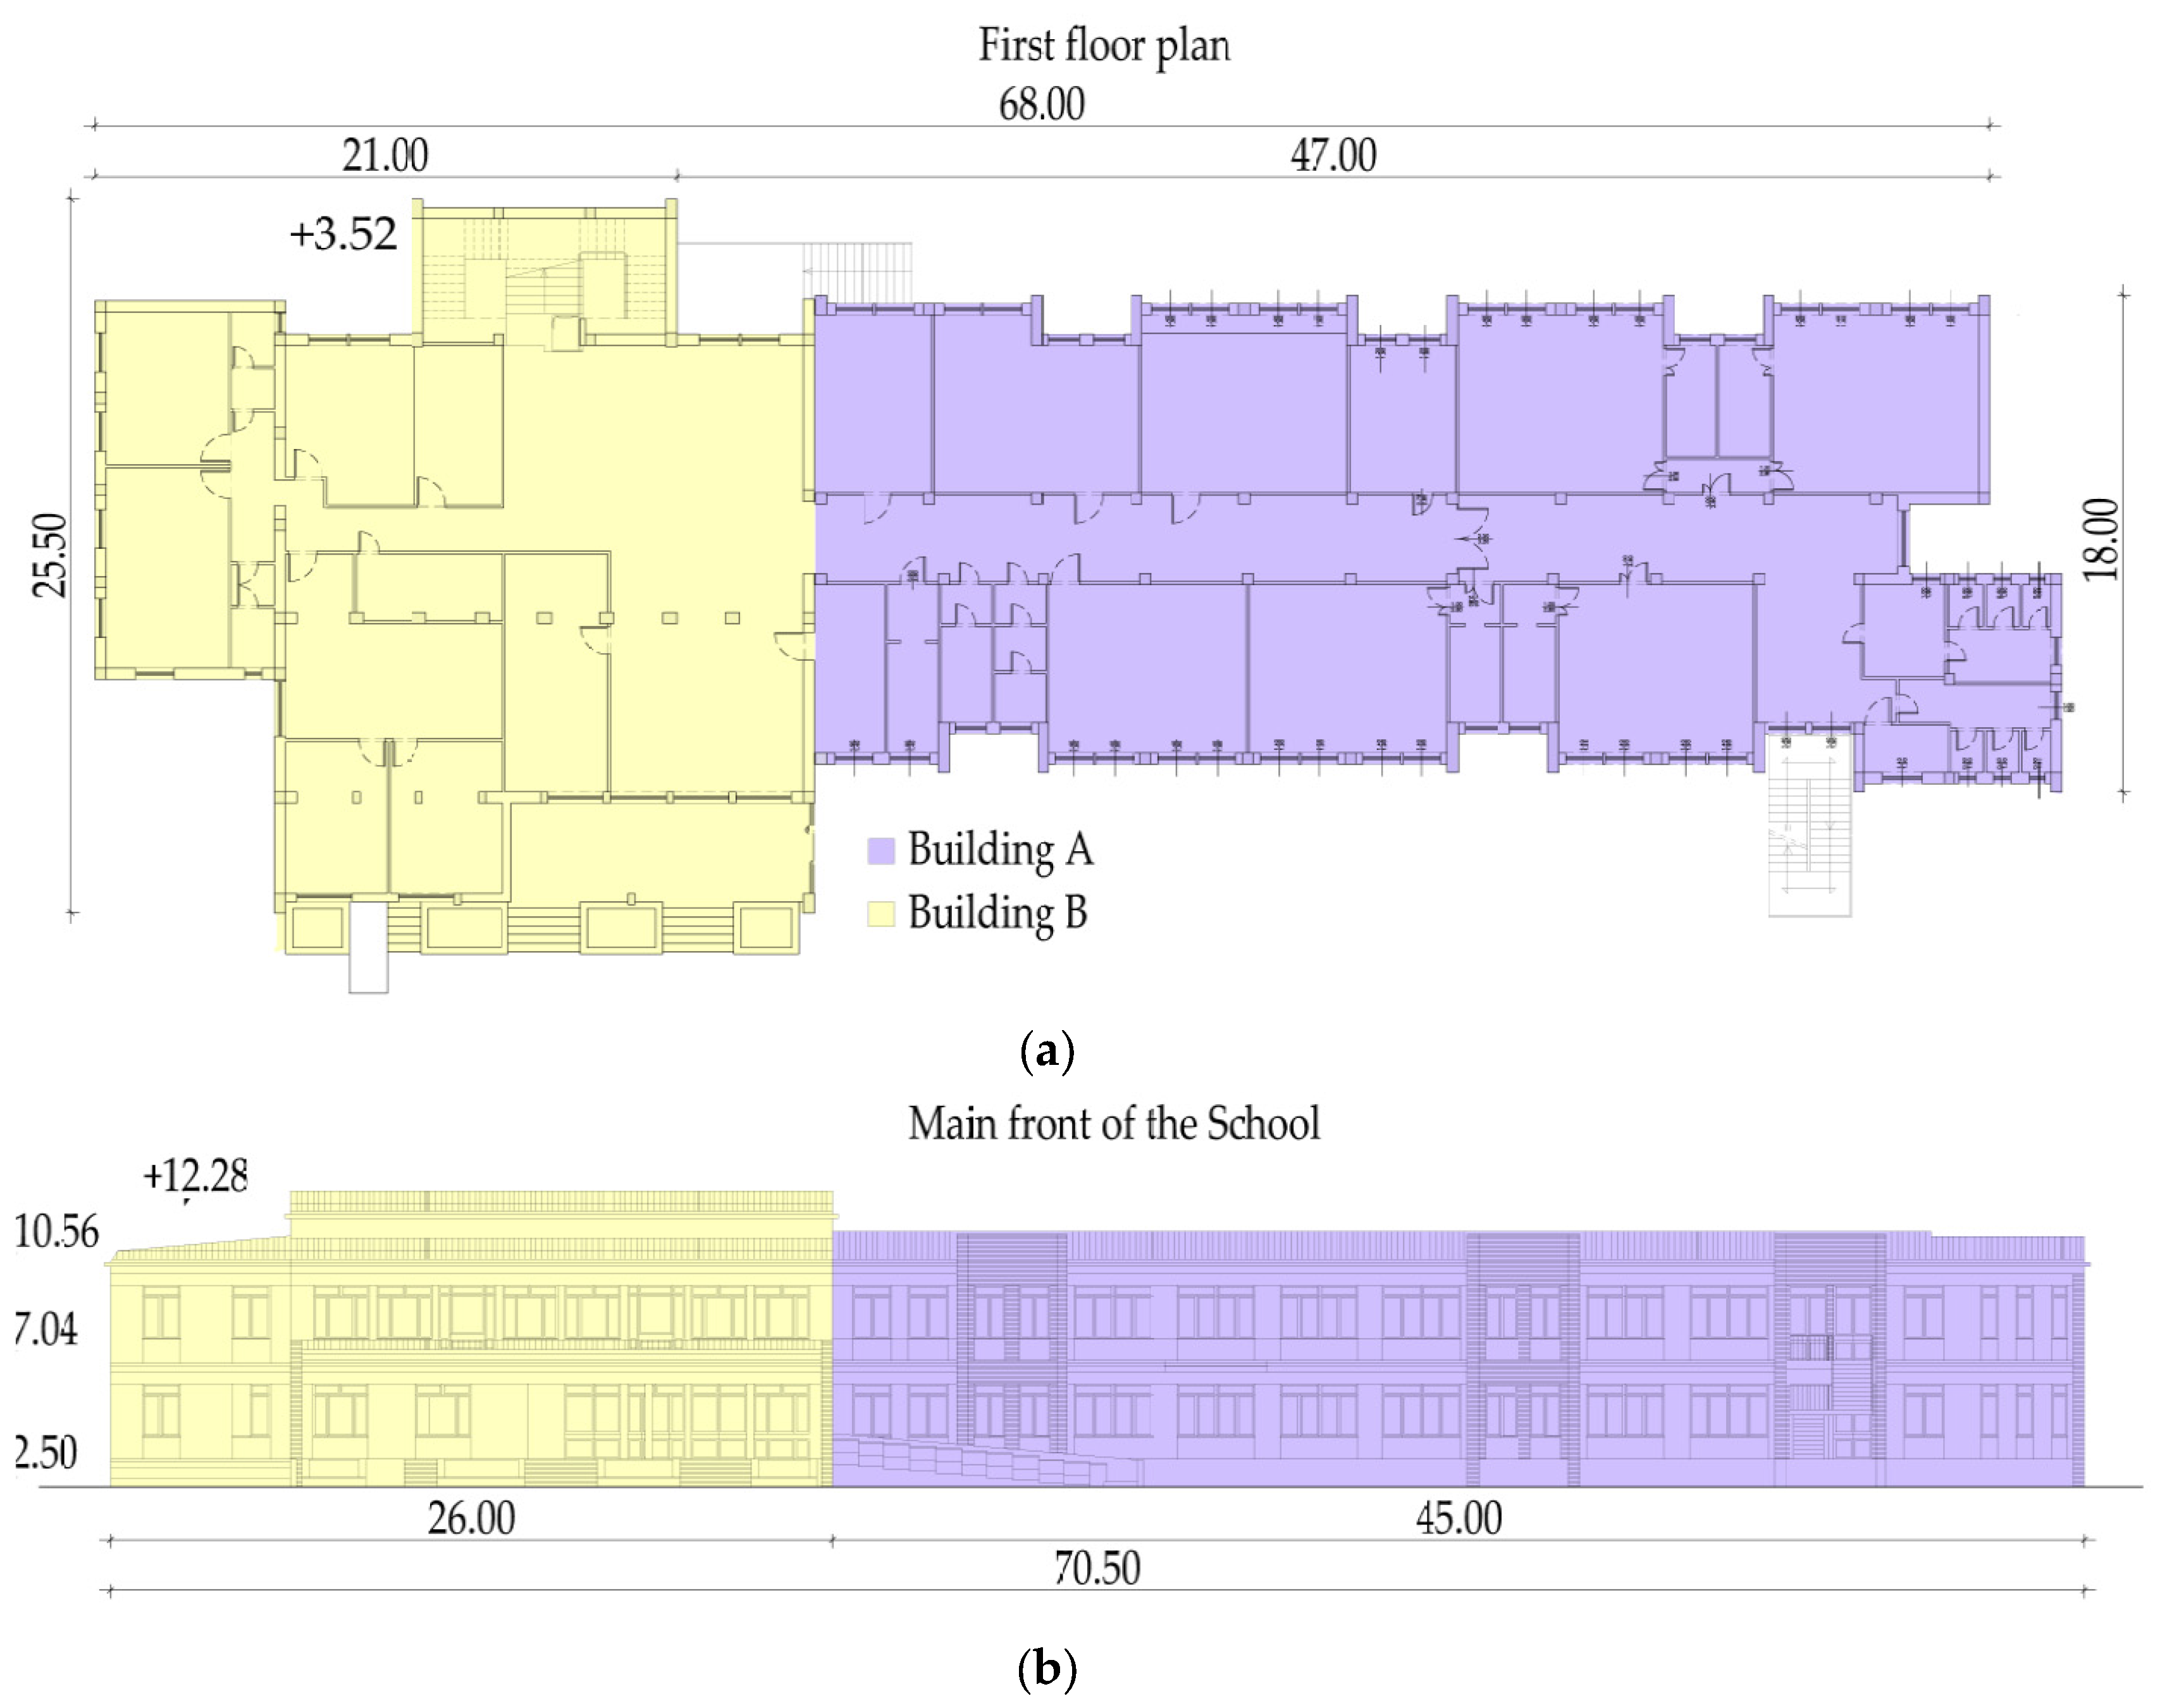
5. A Real Case-Study
5.1. Description of the Buildings
5.2. Parametric Analysis
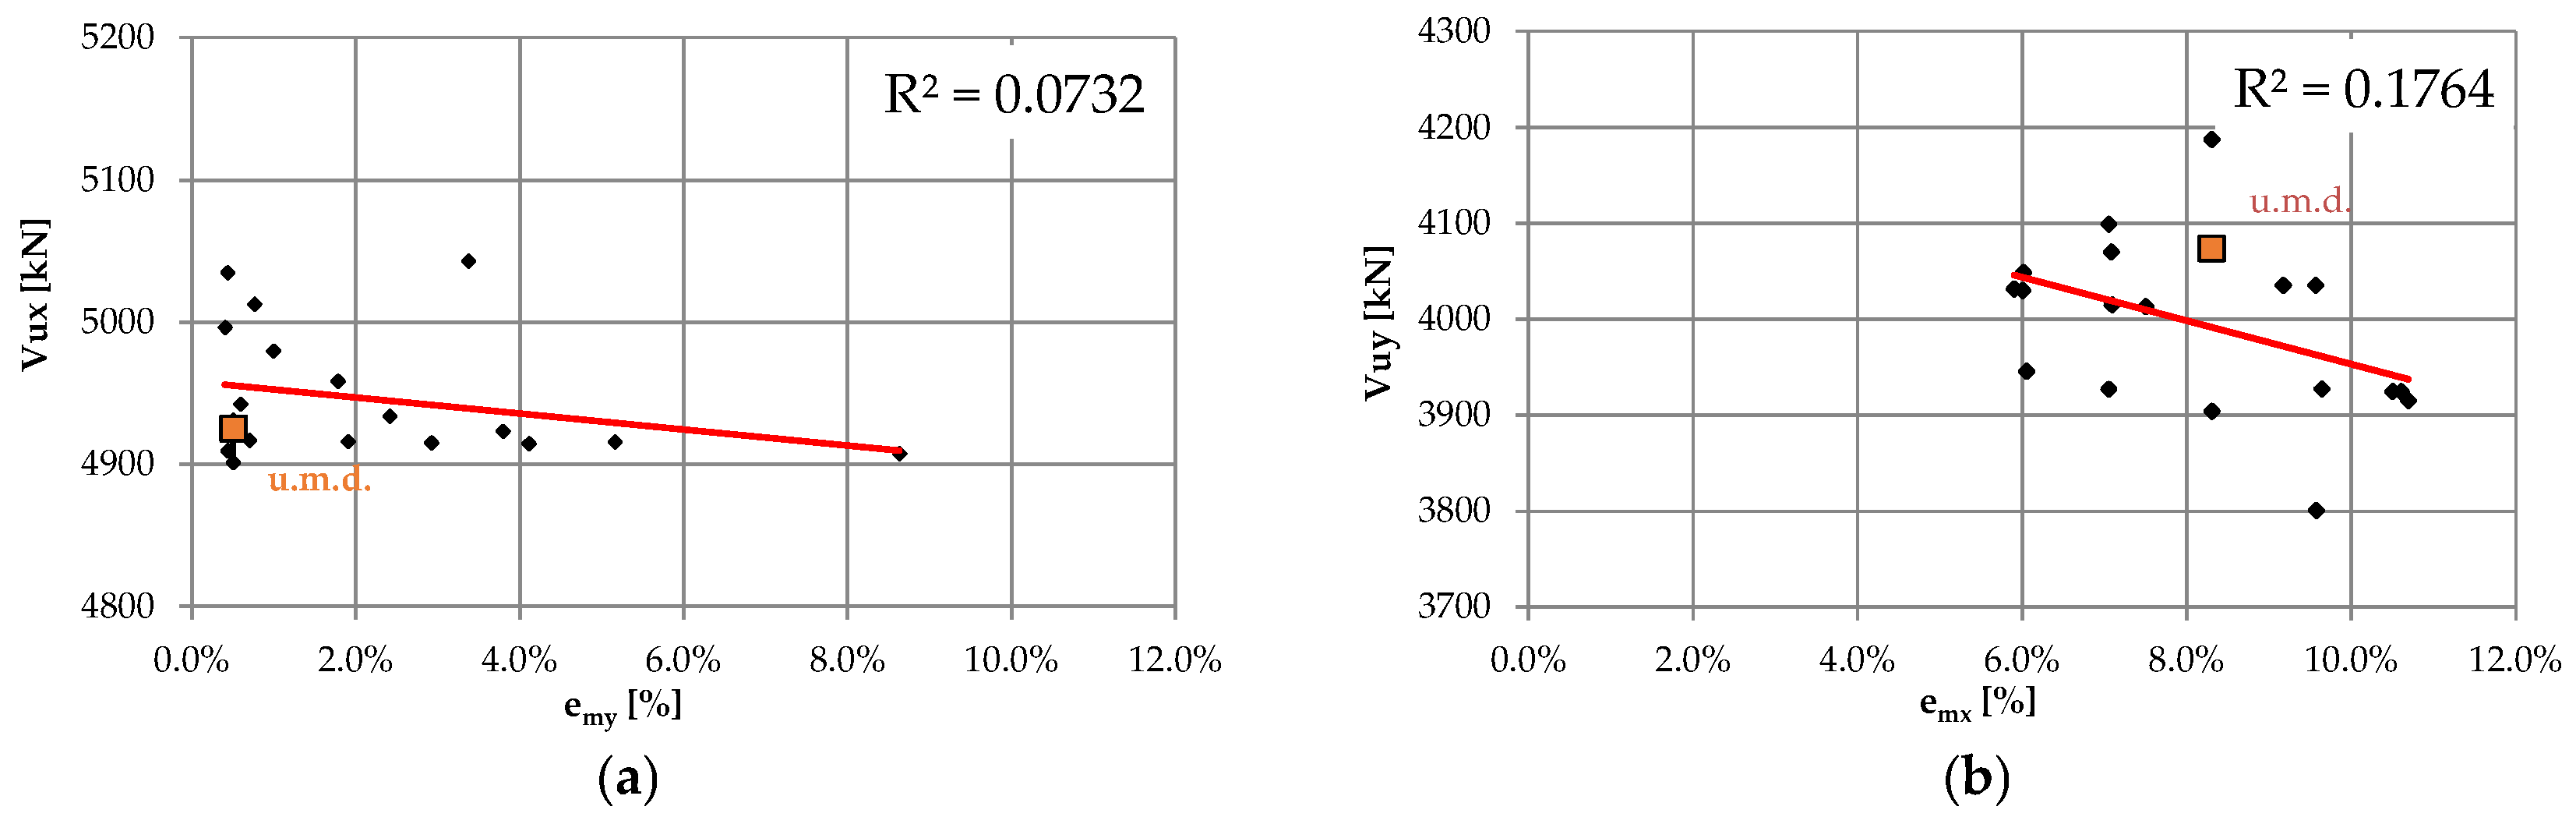
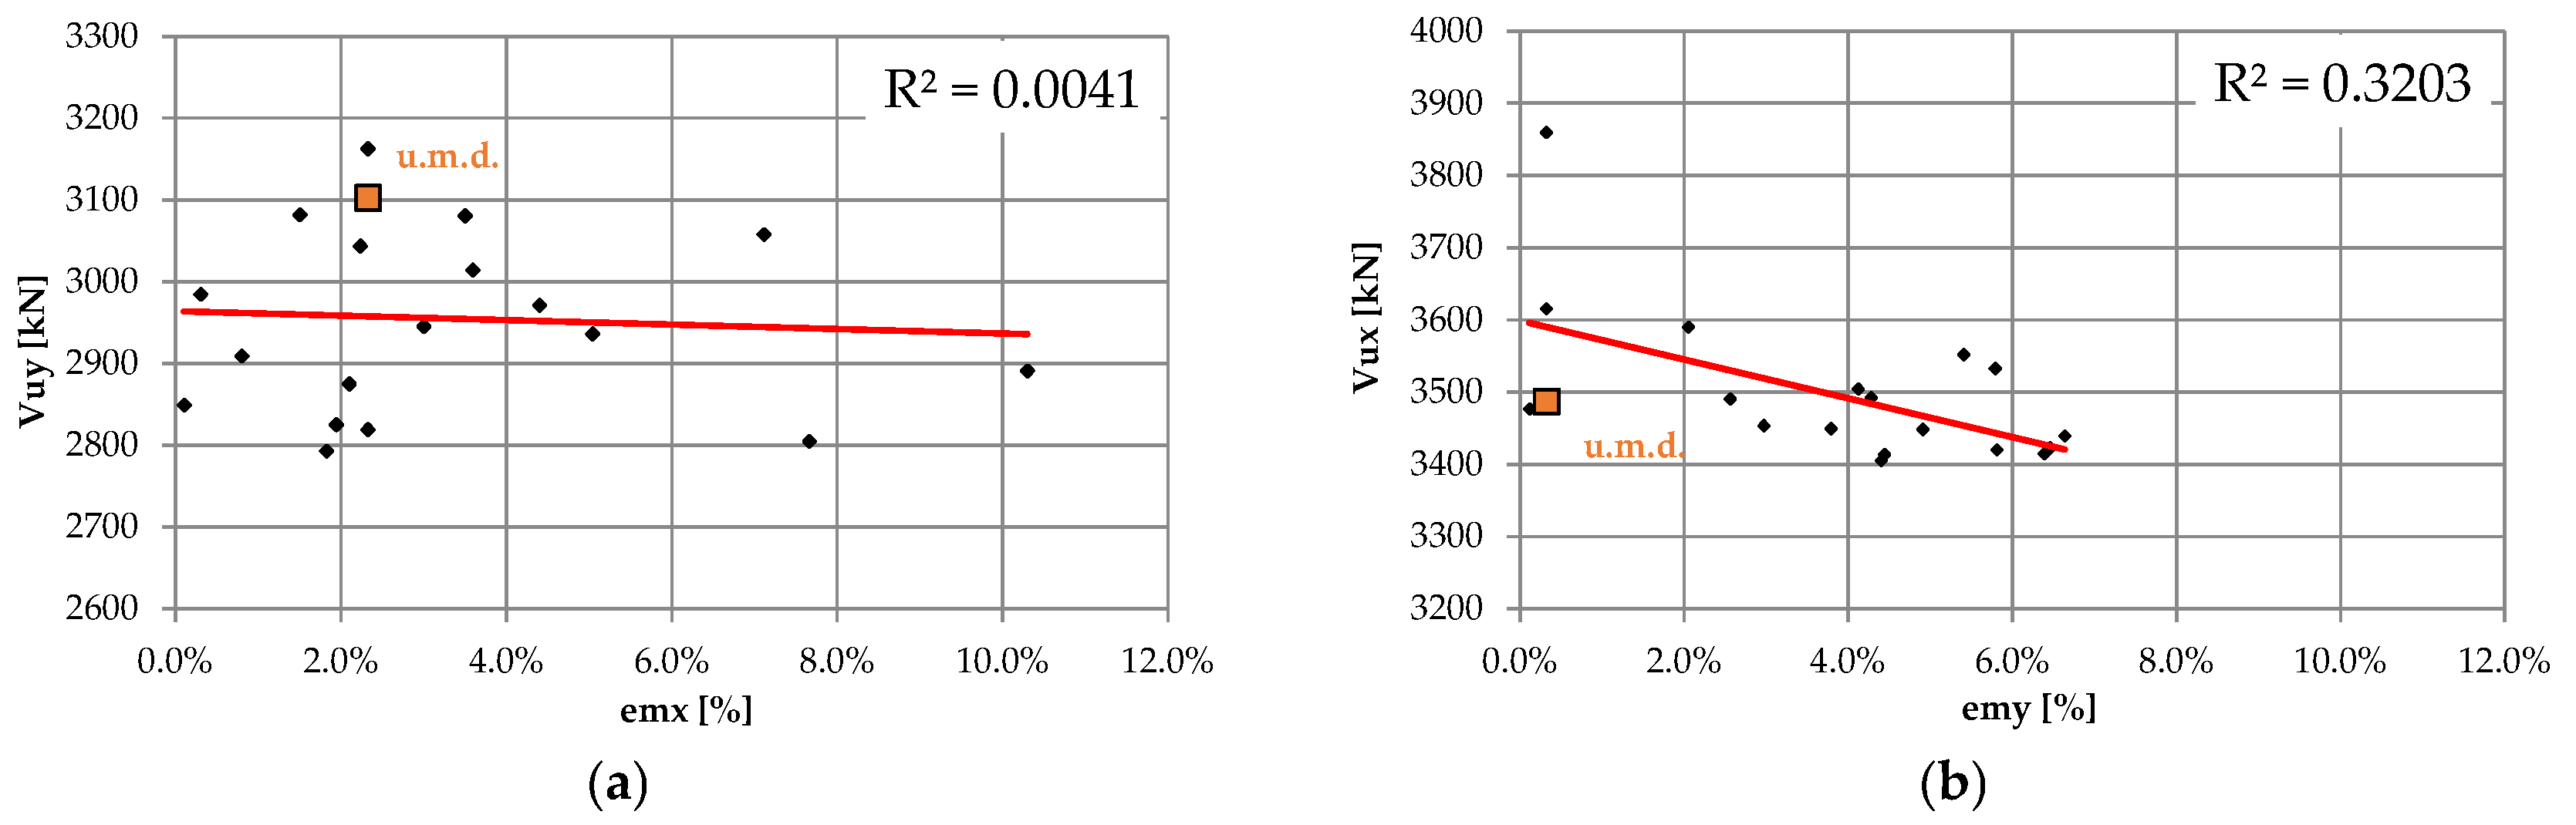
5.2.1. Extreme Strength Distribution
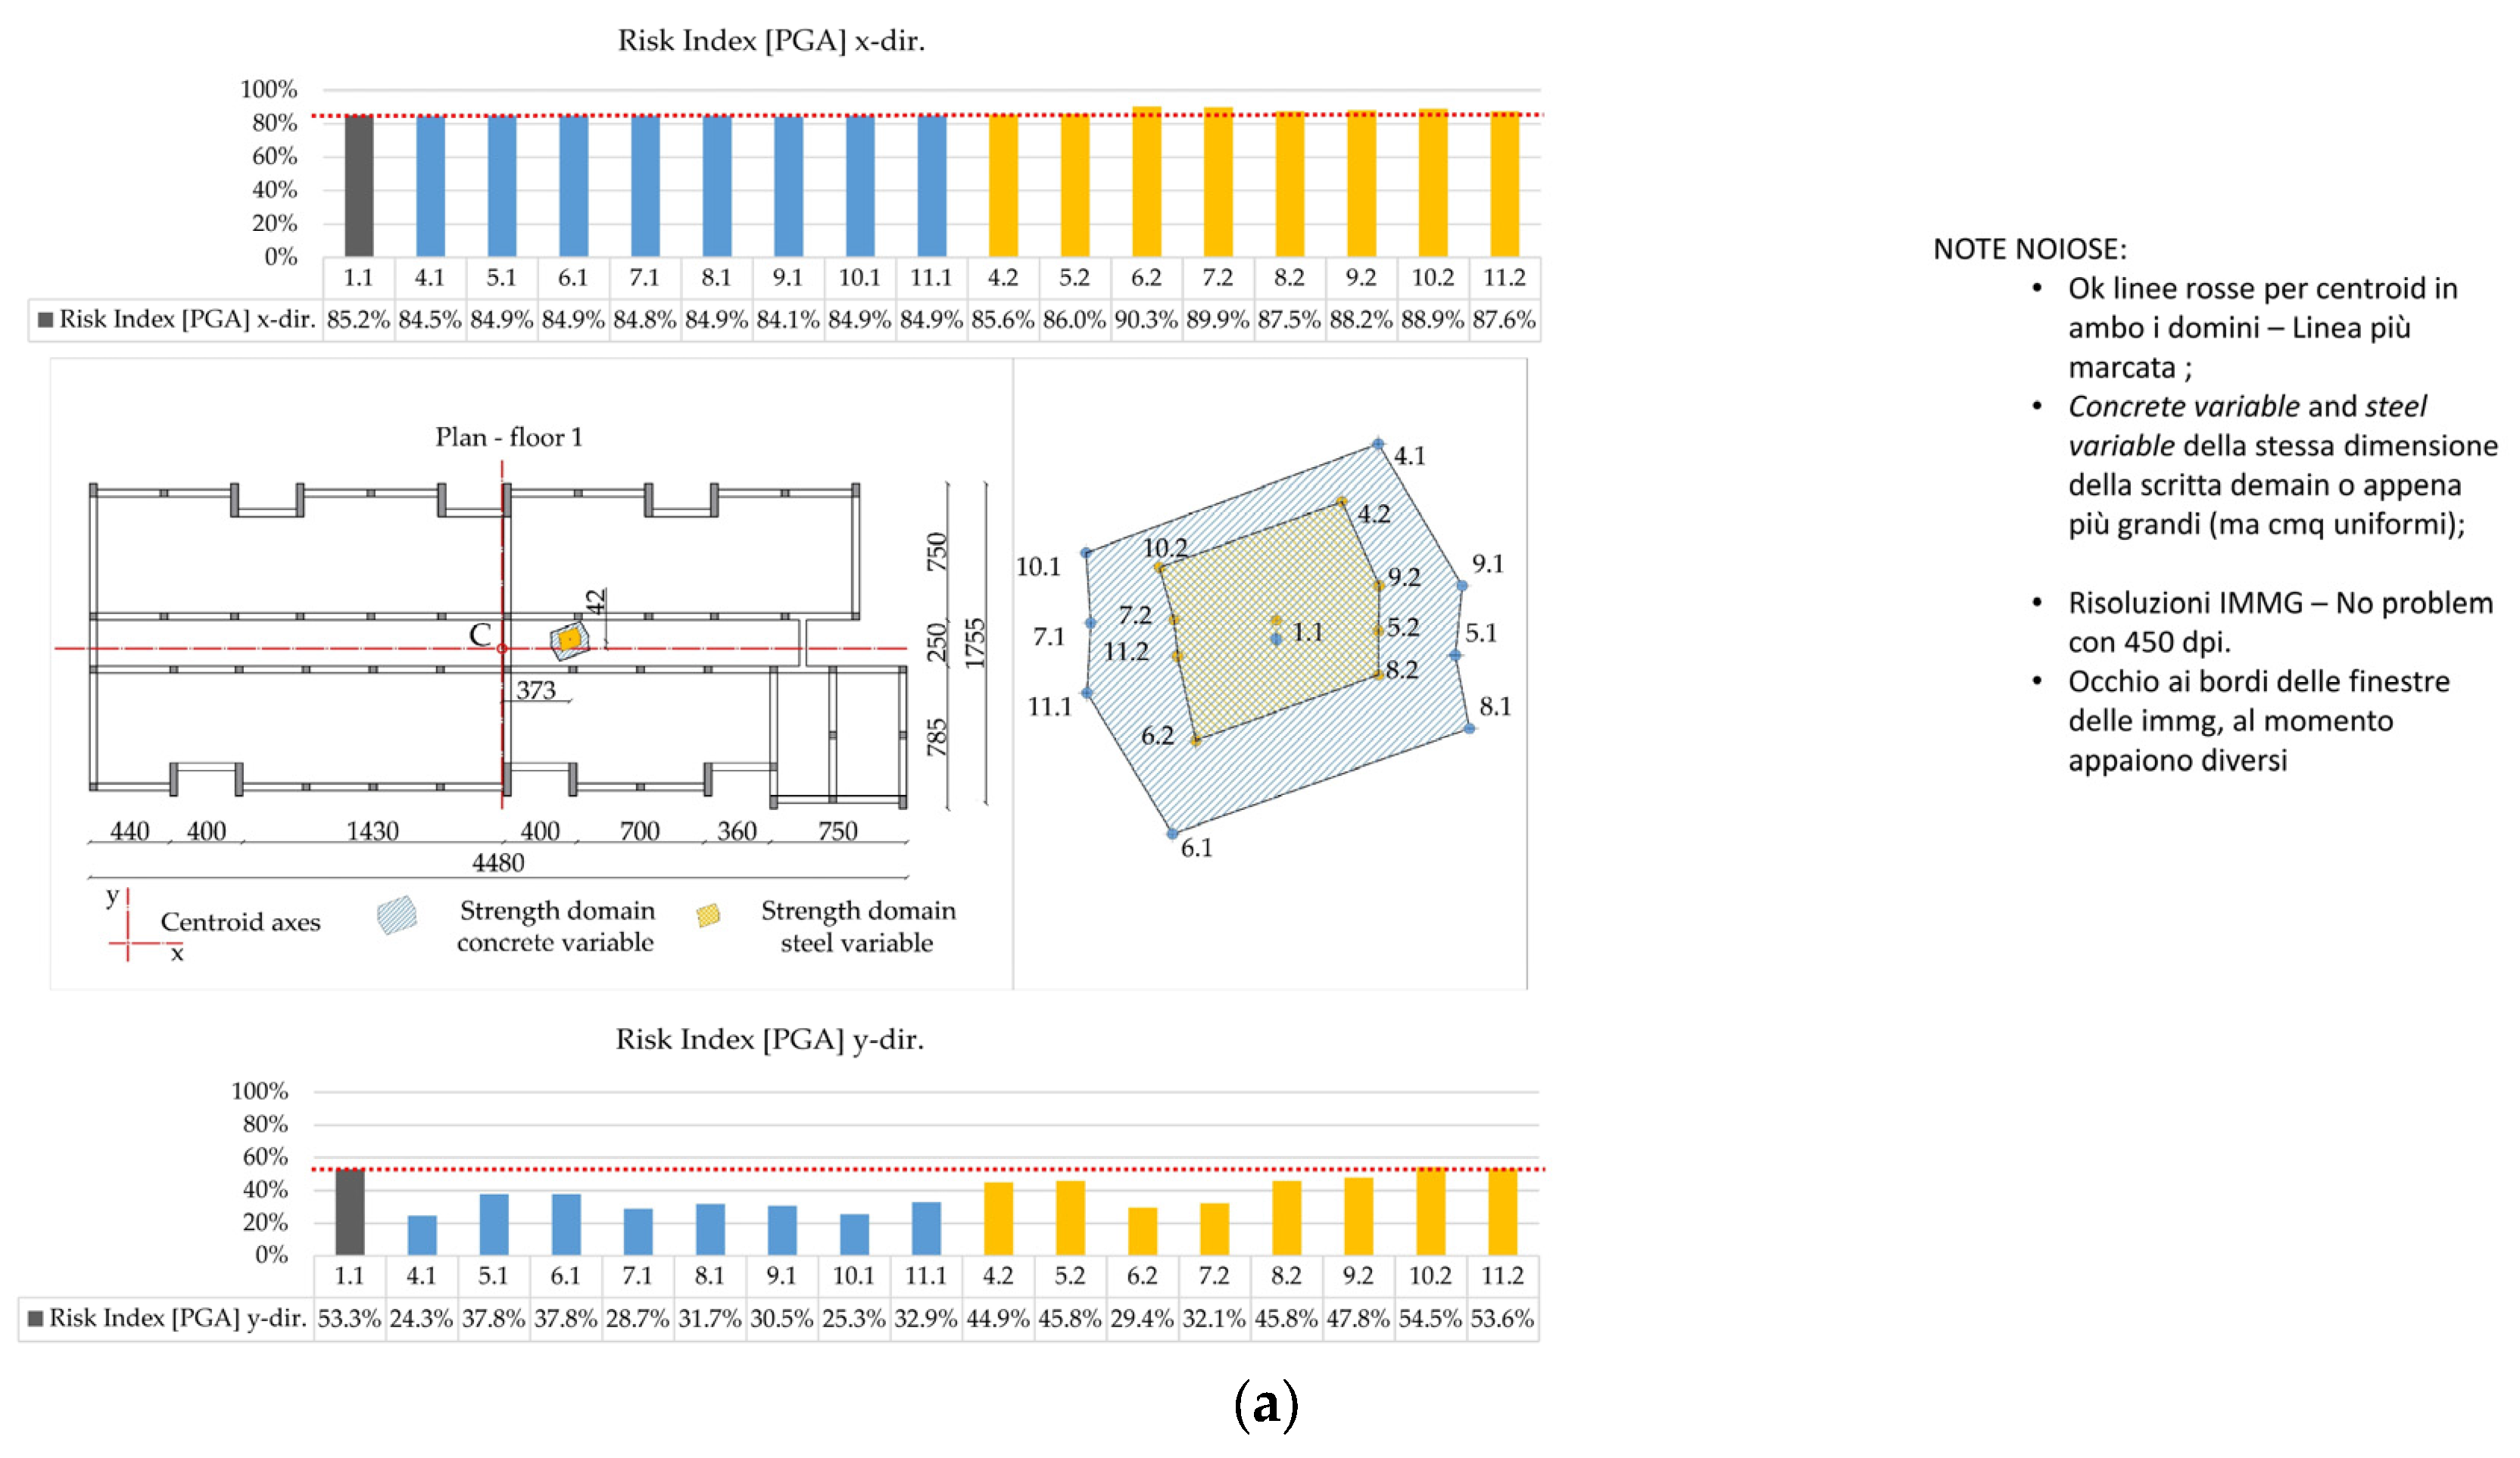
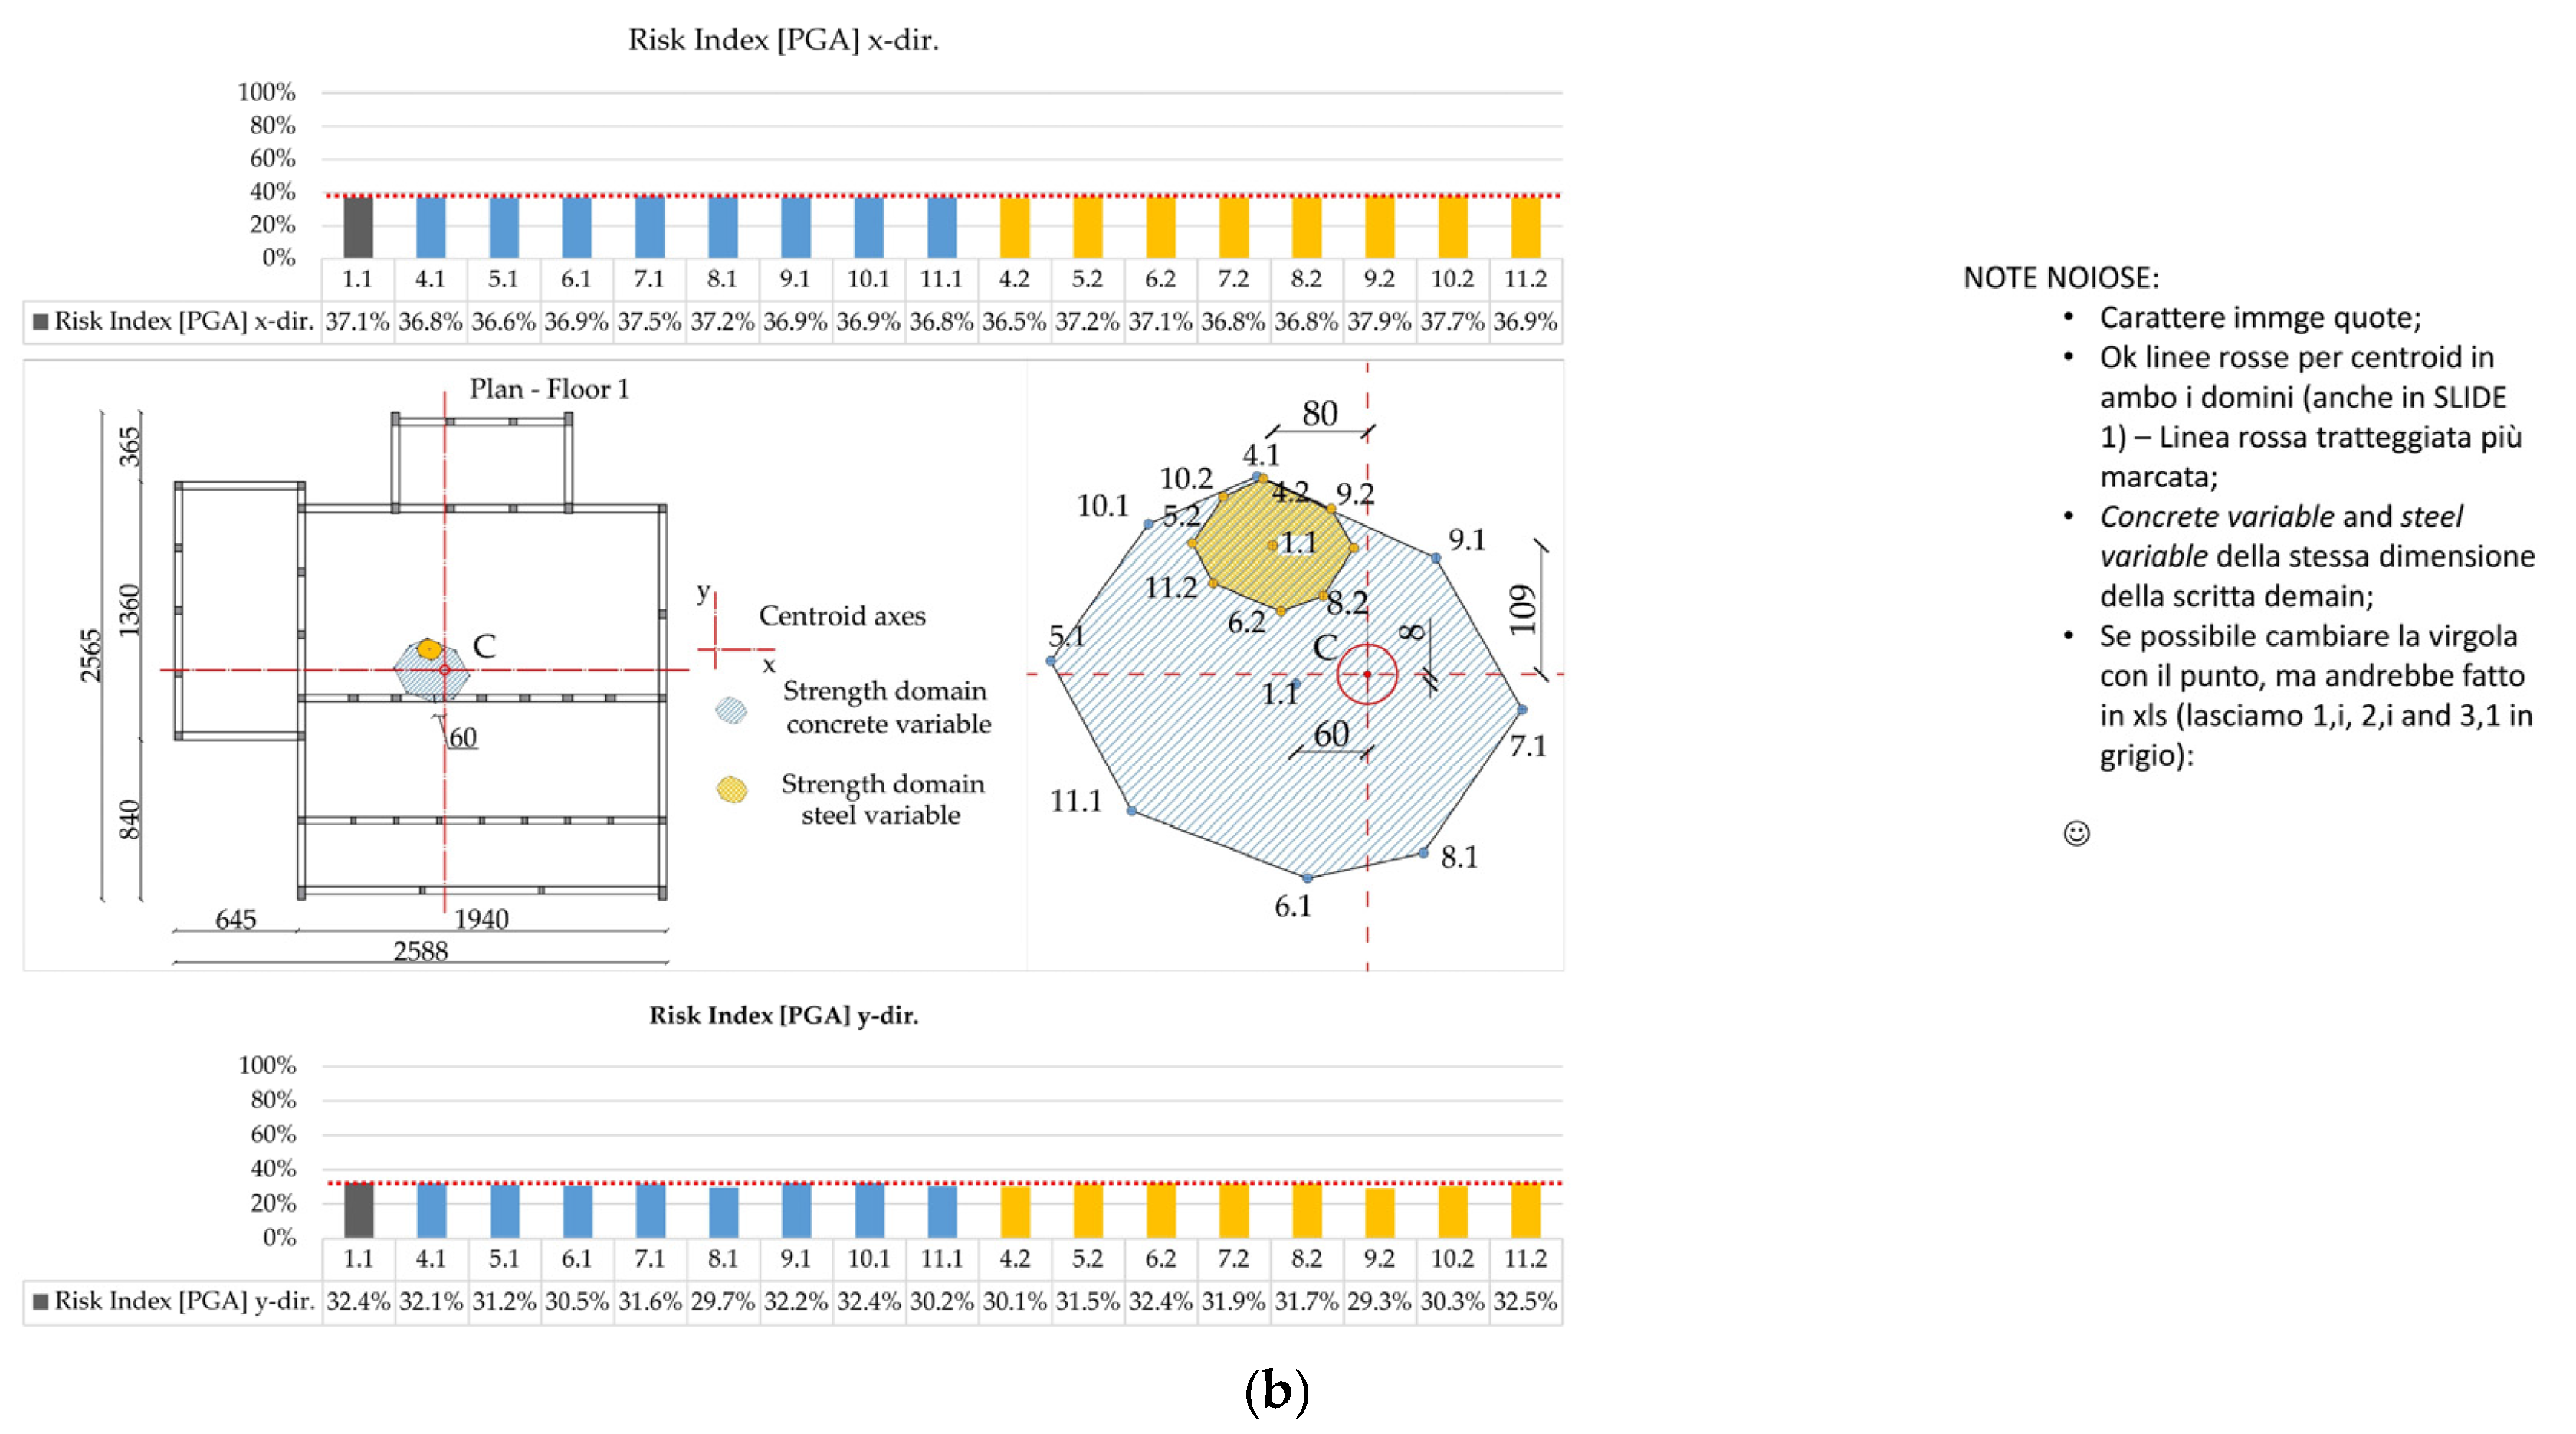
5.2.2. Strength Domain
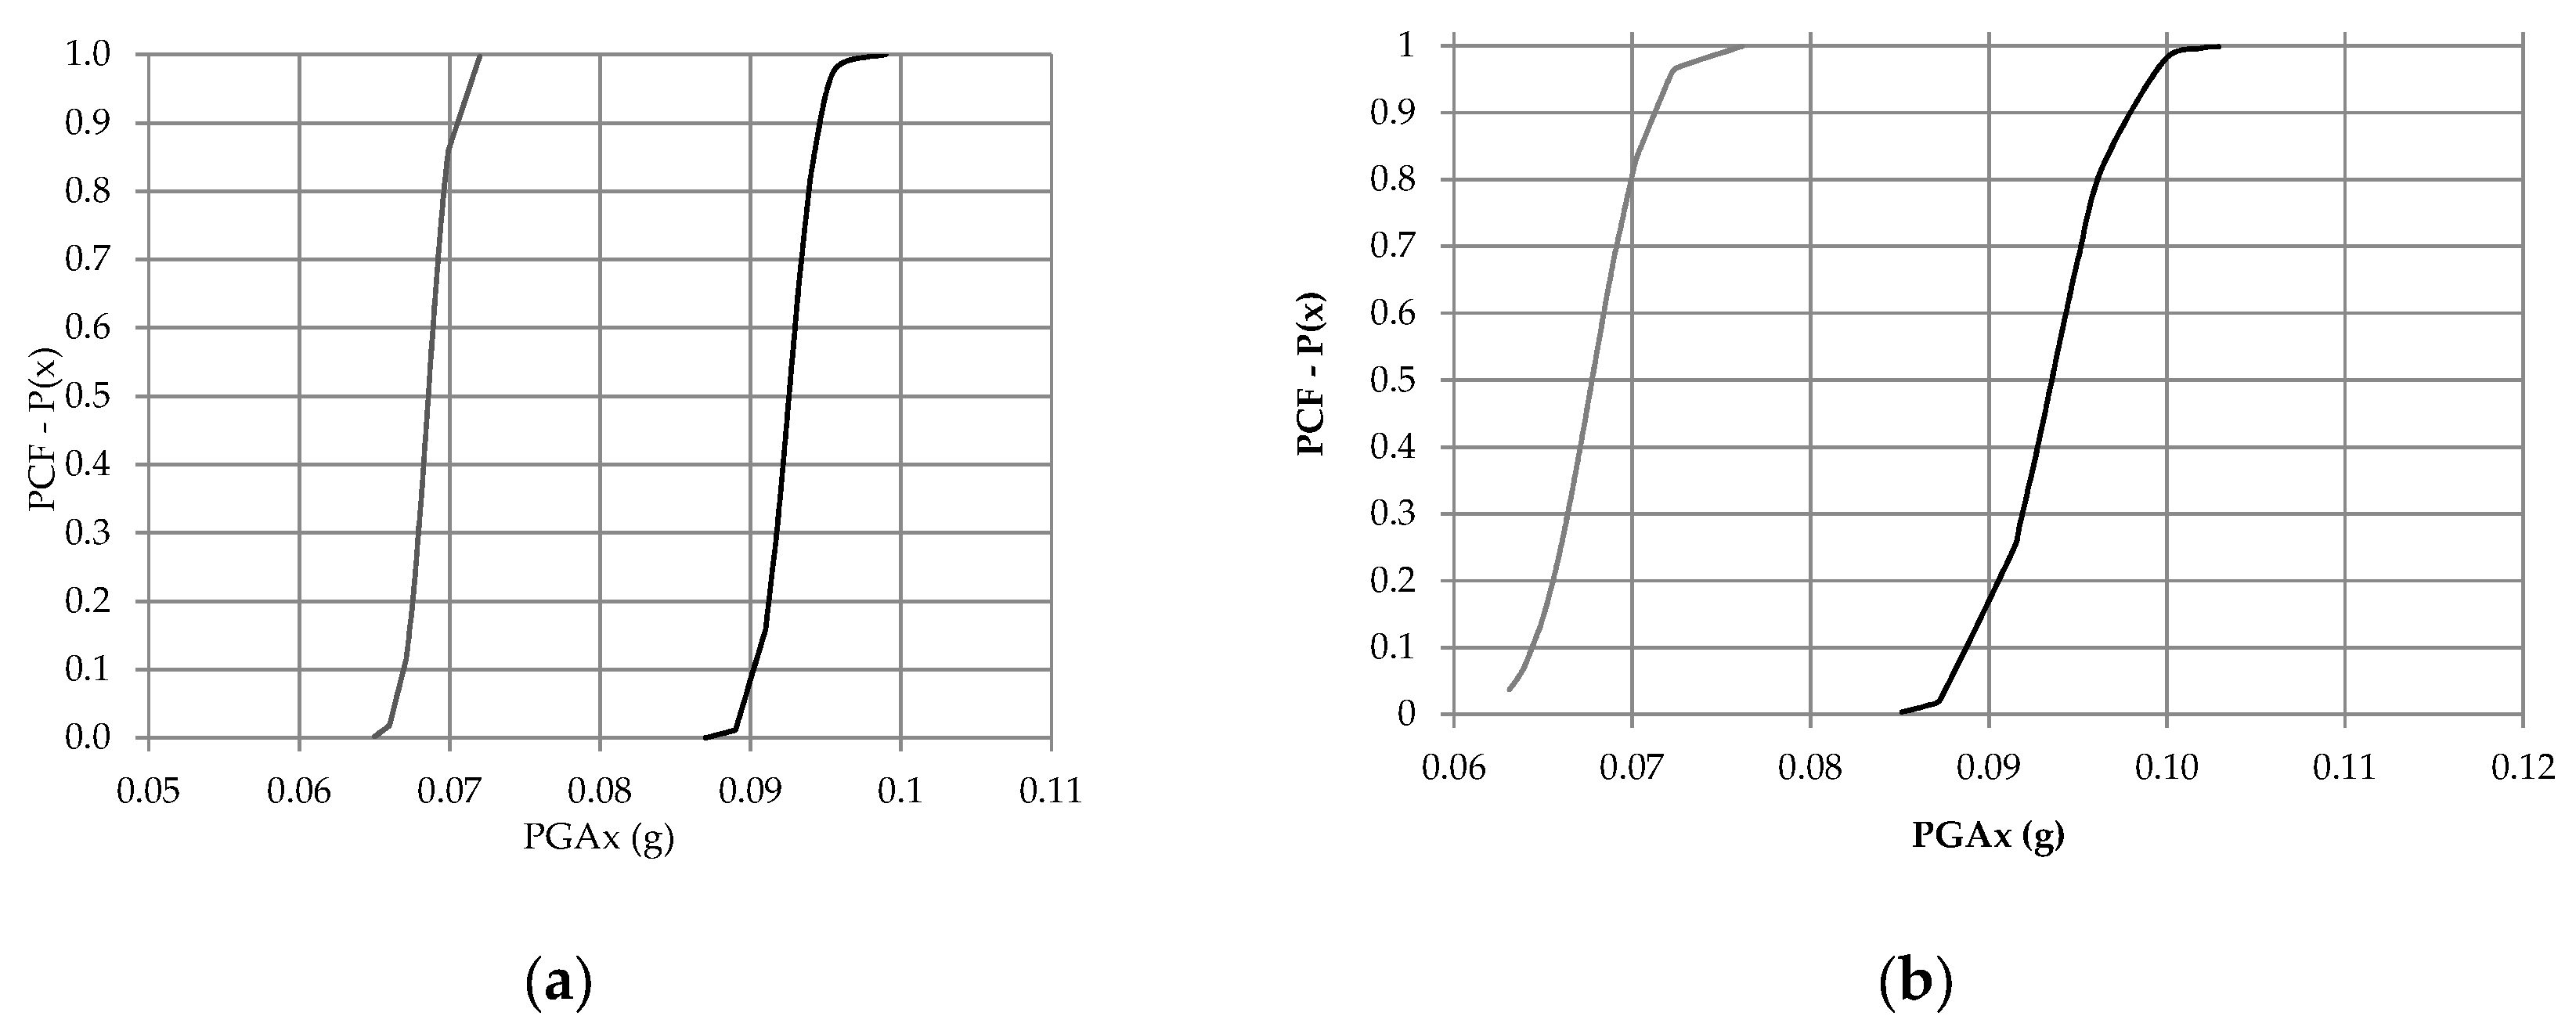
5.2.3. Fragility Curves
- -
- Non-Linear static analysis for each random case;
- -
- PGA for each random case;
- -
- Mean value and standard deviation of all calculated PGA;
- -
- Determination of the probability cumulative function (PCF) as:
6. Conclusions
Acknowledgments
Author Contributions
Conflicts of Interest
Appendix A
- coefficient equal to: 0.81;
- coefficient equal to: 0.83;
- width of the section;
- area of the longitudinal steel reinforcement;
- height of the section;
- filler tiles;
- ;
- ratio of longitudinal steel reinforcement;
- coefficient equal to: 0.15;
- mean compressive stress in the section due to axial force;
- minimum width of the section;
- internal height of the section;
- transverse area of the stirrups;
- spacing between the stirrups;
- moment arm;
- strength of the stirrups;
- inclination of the concrete struts;
- coefficient equal to: 1;
- .
References
- Marie-Victoire, E.; Cailleux, E.; Texier, A. Carbonation and historical buildings made of concrete. J. Phys. IV Fr. 2006, 136, 305–318. [Google Scholar] [CrossRef]
- Glasser, F.P.; Marchand, J.; Samson, E. Durability of concrete—Degradation phenomena involving detrimental chemical reactions. Cem. Concr. Res. 2008, 38, 226–246. [Google Scholar] [CrossRef]
- Parisi, F.; Augenti, N. Influence of seismic design criteria on blast resistance of RC framed buildings: A case study. Eng. Struct. 2012, 44, 78–93. [Google Scholar] [CrossRef]
- Parisi, F.; Augenti, N. Seismic capacity of irregular unreinforced masonry walls with openings. Earthq. Eng. Struct. Dyn. 2013, 42, 101–121. [Google Scholar] [CrossRef]
- Tubaldi, E.; Barbato, M.; Dall’Asta, A. Seismic Response and Vulnerability of Steel-Concrete Composite Bridges Accounting for Model Parameter Uncertainties. Struct. Congr. 2010 2010, 1840–1851. [Google Scholar] [CrossRef]
- Badalassi, M.; Braconi, A.; Cajot, L.G.; Caprili, S.; Herve, D.; Gundel, M.; Hjiaj, M.; Hoffmeister, B.; Karamanos, S.A.; Salvatore, W.; et al. Influence of variability of material mechanical properties on seismic performance of steel and steel–concrete composite structures. Bull. Earthq. Eng. 2016. [Google Scholar] [CrossRef]
- Zelaschi, C.; Monteiro, R.; Pinho, R. Parametric Characterization of RC Bridges for Seismic Assessment Purposes. Structures 2016, 7, 14–24. [Google Scholar] [CrossRef]
- Giresini, L.; Sassu, M. Tests Results and Simple Structural Analysis of the Main Lighthouse in the Harbor of Livorno (Italy). Adv. Mater. Res. 2013, 834–836, 1299–1303. [Google Scholar] [CrossRef]
- Rovero, L.; Alecci, V.; Mechelli, J.; Tonietti, U.; De Stefano, M. Masonry walls with irregular texture of L’Aquila (Italy) seismic area: validation of a method for the evaluation of masonry quality. Mater. Struct. 2015, 49. [Google Scholar] [CrossRef]
- Muller, D.; Forster, V.; Graunbner, C.-A. Influence of Material Spatial Variability on the Reliability of Masonry Walls in Compression. In Proceedings of the 13th Canadian Masonry Symposium, Halifax, NS, Canada, 4–7 June 2017. [Google Scholar]
- Viti, S.; Tanganelli, M.; De Stefano, M. Seismic performance sensitivity to concrete strength variability: A case-study. Earthq. Struct. 2015, 9, 321–337. [Google Scholar] [CrossRef]
- Alecci, V.; De Stefano, M.; Luciano, R.; Rovero, L.; Stipo, G. Experimental Investigation on Bond Behavior of Cement-Matrix–Based Composites for Strengthening of Masonry Structures. J. Compos. Constr. 2015, 20. [Google Scholar] [CrossRef]
- Alecci, V.; Focacci, F.; Rovero, L.; Stipo, G.; De Stefano, M. Extrados strengthening of brick masonry arches with PBO-FRCM composites: Experimental and analytical investigations. Compos. Struct. 2016, 149, 184–196. [Google Scholar] [CrossRef]
- Alecci, V.; Misseri, G.; Rovero, L.; Stipo, G.; De Stefano, M.; Feo, L.; Luciano, R. Experimental investigation on masonry arches strengthened with PBO-FRCM composite. Compos. Part B Eng. 2016. [Google Scholar] [CrossRef]
- Sassu, M.; De Falco, A. Legal disputes and building defects: some data from Tuscany (Italy). J. Perform. Constr. Facil. 2013, 28, 1–32. [Google Scholar]
- Alecci, V.; Briccoli Bati, S.; Ranocchiai, G. Study of Brick Masonry Columns Confined with CFRP Composite. J. Compos. Constr. 2009, 13, 179–187. [Google Scholar] [CrossRef]
- De Falco, A.; Froli, M.; Giresini, L.; Puppio, M.L.; Sassu, M. A proposal for the consolidation of a r.c. social housing by means of external hybrid steel-glass frameworks. Appl. Mech. Mater. 2014, 638–640, 3–8. [Google Scholar] [CrossRef]
- Alecci, V.; Briccoli Bati, S.; Ranocchiai, G. Numerical homogenization techniques for the evaluation of mechanical behaviour of a composite with SMA inclusions. J. Mech. Mater. Struct. 2009, 4, 1675–1688. [Google Scholar] [CrossRef]
- Alecci, V.; Bati, S.B.; Ranocchiai, G. Concrete columns confined with CFRP wraps. Mater. Struct. 2014, 1–14. [Google Scholar] [CrossRef]
- EN 1998-1 EN 1998-1: Eurocode 8—Design of structures for earthquake resistance. Part 1: General rules, seismic actions and rules for buildings. CEN 2004, 1, 1–229.
- Giresini, L.; Gioeli, A.; Sassu, M. Seismic Reinforcement of a r.c. Building with External Steel Frameworks: The Case of the Primary School XXV April of Arcola (Italy). Adv. Mater. Res. 2013, 834–836, 697–700. [Google Scholar] [CrossRef]
- Lavan, O.; de Stefano, M. Geotechnical, Geological and Earthquake Engineering. Geotech. Geol. Earthq. Eng. 2013, 24. [Google Scholar] [CrossRef]
- Biondini, F.; Bontempi, F.; Frangopol, D.M.; Malerba, P.G. Probabilistic service life assessment and maintenance planning of concrete structures. J. Struct. Eng. 2006, 132, 810–825. [Google Scholar] [CrossRef]
- Fajfar, P.; Marusic, D.; Perus, I. Torsional Effects in the Pushover-Based Seismic Analysis of Buildings. J. Earthq. Eng. 2005, 9, 831–854. [Google Scholar] [CrossRef]
- De-la-Colina, J.; Alberto González-Pérez, C.; Valdés-González, J. Accidental eccentricities, frame shear forces and ductility demands of buildings with uncertainties of stiffness and live load. Eng. Struct. 2016, 124, 113–127. [Google Scholar] [CrossRef]
- De Stefano, M.; Pintucchi, B. A review of research on seismic behaviour of irregular building structures since 2002. Bull. Earthq. Eng. 2008, 285–308. [Google Scholar] [CrossRef]
- de la Llera, J.C.; Chopra, A.K. Accidental torsion in buildings due to base rotational excitation. Earthq. Eng. Struct. Dyn. 1994, 23, 1003–1021. [Google Scholar] [CrossRef]
- De Stefano, M.; Pintuchi, B. Predicting torsion-induced lateral displacements for pushover analysis: Influence of torsional system characteristics. Earthq. Eng. Struct. Dyn. 2010, 39, 1369–1394. [Google Scholar] [CrossRef]
- Shibin, L.; Lili, X.; Maosheng, G.; Ming, L. Performance-based methodology for assessing seismic vulnerability and capacity of buildings. Earthq. Eng. Eng. Vib. 2010, 9, 157–165. [Google Scholar] [CrossRef]
- Chopra, A.K.; Goel, R.K. A modal pushover analysis procedure to estimate seismic demands for unsymmetric-plan buildings. Earthq. Eng. Struct. Dyn. 2004, 33, 903–927. [Google Scholar] [CrossRef]
- Chopra, A.K.; Goel, R.K. A modal pushover analysis procedure for estimating seismic demands for buildings. Earthq. Eng. Struct. Dyn. 2002, 31, 561–582. [Google Scholar] [CrossRef]
- Ricker, N. Further developments in the wavelet theory of seismogram structure. Bull. Seism. Soc. Am. 1943, 33, 197–228. [Google Scholar]
- Verderame, G.M.; Stella, A.; Cosenza, E. Le proprietà meccaniche degli acciai impiegati nelle strutture in c.a. realizzate negli anni ’60. In Proceedings of the X Congresso Nazionale “L’Ingegneria Sismica in Italia—ANIDIS, Potenza-Matera, Italy, 9–13 September 2001. [Google Scholar]
- Zhou, J.; He, F.; Liu, T. Curvature ductility of columns and structural displacement ductility in RC frame structures subjected to ground motions. Soil Dyn. Earthq. Eng. 2014, 63, 174–183. [Google Scholar] [CrossRef]
- Arslan, M.H. Estimation of curvature and displacement ductility in reinforced concrete buildings. KSCE J. Civ. Eng. 2012, 16, 759–770. [Google Scholar] [CrossRef]
- Biondini, F.; Camnasio, E.; Titi, A. Seismic resilience of concrete structures under corrosion. Earthq. Eng. Struct. Dyn. 2015, 44, 2445–2466. [Google Scholar] [CrossRef]
- Augenti, N.; Parisi, F. Learning from Construction Failures due to the 2009 L’Aquila, Italy, Earthquake. J. Perform. Constr. Facil. 2010, 24, 536–555. [Google Scholar] [CrossRef]
- Andreini, M.; De Falco, A.; Giresini, L.; Sassu, M. Structural damage in the cities of Reggiolo and Carpi after the earthquake on May 2012 in Emilia Romagna. Bull. Earthq. Eng. 2014. [Google Scholar] [CrossRef]
- Vona, M. Fragility Curves of Existing RC Buildings Based on Specific Structural Performance Levels. Open J. Civ. Eng. 2014, 4, 120–134. [Google Scholar] [CrossRef]
- Rota, M.; Penna, A.; Strobbia, C.L. Processing Italian damage data to derive typological fragility curves. Soil Dyn. Earthq. Eng. 2008, 28, 933–947. [Google Scholar] [CrossRef]


| Material Number | fc (MPa) | Ec (MPa) | fy (MPa) | Color |
|---|---|---|---|---|
| 1 | 10 | 22,000 | 230 | Ciano |
| 2 | 20 | 27,085 | 290 | Blue |
| 3 | 30 | 30,590 | 350 | Green |
| 4 | 20 | 13,542 | 290 | Magenta |
| Material Eccentricity | x | y | Units |
|---|---|---|---|
| 61 | 108 | cm | |
| 8.3 | 16.7 | % 1 |
| Types of Analysis | Rigid Slab | Flexible Slab | |||||||
|---|---|---|---|---|---|---|---|---|---|
| (uniform) | Linear | 0.722 | 0.000 | - | 0.45 | 0.72 | 0.000 | - | 0.45 |
| n-Linear | 7.840 | 0.000 | 0.82 | 0.76 | 7.96 | 0.000 | 0.82 | 0.76 | |
| (n-uniform) | Linear | 0.680 | 0.005 | - | 0.40 | 0.71 | 0.030 | - | 0.38 |
| n-Linear | 6.840 | 0.020 | 0.77 | 0.76 | 7.05 | 0.020 | 0.79 | 0.76 | |
| Steel Strength | AQ42 | AQ50 | AQ60 | Units |
|---|---|---|---|---|
| fy,min | 265.0 | 282.4 | 353.7 | N/mm2 |
| fy.med | 325.4 | 369.9 | 432.6 | N/mm2 |
| fy.max | 397.4 | 530.0 | 560.8 | N/mm2 |
| σ | 23.17 | 29.45 | 36.59 | N/mm2 |
| Cubic Compression Strength | Test A 1 | Test B 2 | Test C 2 | Units |
|---|---|---|---|---|
| Rc,min | 7.0 | 21.9 | 29.6 | N/mm2 |
| Rc.mean | 26.0 | 37.3 | 38.2 | N/mm2 |
| Rc.max | 45.0 | 40.1 | 46.7 | N/mm2 |
| Parameters | A | B | C |
|---|---|---|---|
| 8.75 | 5.00 | 1.95 | |
| 2.00 | 1.55 | 1.00 |
| Strength | 01 | 02 | 03 | 04 | 05 | Unit |
|---|---|---|---|---|---|---|
| 10 | 15 | 20 | 25 | 30 | MPa | |
| 230 | 260 | 290 | 320 | 350 | MPa |
| TEST | Hammer | Sonreb | Coring | Units |
|---|---|---|---|---|
| 1 | 29.0 | 14.9 | 17.2 | |
| 2 | 29.0 | 17.2 | 13.9 | |
| 3 | 22.0 | 9.4 | 10.4 | |
| 4 | 25.0 | 8.6 | 9.6 | |
| 5 | 33.0 | 11.7 | 12.3 | |
| 6 | 42.0 | 23.2 | 28.7 | |
| 7 | 45.0 | 28.9 | 31.3 | |
| 8 | 43.0 | 29.0 | - | |
| 9 | 38.0 | 27.5 | - | |
| 10 | 40.0 | 17.4 | - | |
| 11 | 43.0 | 22.8 | - | |
| 12 | - | 21.7 | 19.5 |
| Average Value and Standard Deviation of PGA | Low Damage (LD) | Severe Damage (SD) | |||
|---|---|---|---|---|---|
| PGAx | PGAy | PGAx | PGAy | ||
| Building A | 0.064 | 0.064 | 0.117 | 0.093 | |
| 0.003 | 0.002 | 0.003 | 0.002 | ||
| Building B | 0.062 | 0.006 | 0.133 | 0.093 | |
| 0.0007 | 0.002 | 0.134 | 0.003 | ||
© 2017 by the authors. Licensee MDPI, Basel, Switzerland. This article is an open access article distributed under the terms and conditions of the Creative Commons Attribution (CC BY) license (http://creativecommons.org/licenses/by/4.0/).
Share and Cite
Puppio, M.L.; Pellegrino, M.; Giresini, L.; Sassu, M. Effect of Material Variability and Mechanical Eccentricity on the Seismic Vulnerability Assessment of Reinforced Concrete Buildings. Buildings 2017, 7, 66. https://doi.org/10.3390/buildings7030066
Puppio ML, Pellegrino M, Giresini L, Sassu M. Effect of Material Variability and Mechanical Eccentricity on the Seismic Vulnerability Assessment of Reinforced Concrete Buildings. Buildings. 2017; 7(3):66. https://doi.org/10.3390/buildings7030066
Chicago/Turabian StylePuppio, Mario Lucio, Martina Pellegrino, Linda Giresini, and Mauro Sassu. 2017. "Effect of Material Variability and Mechanical Eccentricity on the Seismic Vulnerability Assessment of Reinforced Concrete Buildings" Buildings 7, no. 3: 66. https://doi.org/10.3390/buildings7030066
APA StylePuppio, M. L., Pellegrino, M., Giresini, L., & Sassu, M. (2017). Effect of Material Variability and Mechanical Eccentricity on the Seismic Vulnerability Assessment of Reinforced Concrete Buildings. Buildings, 7(3), 66. https://doi.org/10.3390/buildings7030066