1. Introduction
People have always striven to create a thermally comfortable environment in their settlements, regardless of culture and country. In recent years, thermal comfort has become even more important in building design, especially considering that people often spend more than 20 h per day in indoor environments [
1,
2].
Through collection of data from many different surveys in the field and in controlled laboratory environments, various theoretical, empirical and adaptive comfort models have been defined and, in some cases, included in international technical references. Indeed, ASHRAE Standard 55 [
3] and ISO 7730 [
4] are based on one of the most widely adopted models, the Fanger’s comfort model [
3,
5]. This model couples heat balance equations with empirical correlations in order to express the occupants’ thermal comfort sensation by means of a “Predicted Mean Vote” (PMV). Environmental factors, i.e., air temperature, relative humidity, mean radiant temperature and air velocity, and personal factors—namely, people’s metabolic rate and clothing insulation level—are accounted for. While the latter can be assessed, assumed or approximated, the environmental conditions in the space of interest have to be directly measured, often with an expensive set of probes, including thermometers, hygrometers, globe thermometers and anemometers. Moreover, measurement should be repeated in different positions in the conditioned space, making the analysis even more difficult.
For most people that are considered healthy, the body’s core temperature measures approximately 37 °C, regardless of physiological and psychological conditions. The two most important sensors controlling the body’s temperature are located in the skin and in the hypothalamus [
6]. In order to keep the thermal balance, the heat produced by human metabolism has to be equal to the amount of heat lost through convection, conduction, radiation, evaporation through the skin and respiration from the lungs [
3,
6,
7]. Except for the respiration, the rest of the heat exchange mechanisms have a direct impact on the skin temperature [
8]. For this reason, much research in the literature identified the skin temperature as an important factor in the assessment of the occupants’ comfort [
6,
9]. For example, Liu et al. [
10] observed that the time gradient of skin temperature can predict the thermal sensation in cold environments and the heat loss from skin is well correlated with it. Indeed, the temperature change rate of the skin is an input to thermal receptors [
11]. De Oliveira et al. [
12] claimed that the “skin temperature is a relevant and effective indicator for objective evaluation of human sensation and thermal states according to the surrounding thermal stresses”. This was confirmed also by Chen et al. [
13], who found that the skin temperature could be extensively used as a physiological indicator in the assessment of thermal stress and comfort.
As for the skin temperature, it is generally characterized as the mean temperature of the whole skin area of the body. However, there are several points on the skin, such as the forehead, that can be good indicators for evaluating the mean skin temperature [
14,
15]. The forehead skin has an almost uniform distribution of temperature, and it is usually exposed to the environment [
16,
17]. Moreover, the forehead together with cheeks and fingers is one of the skin regions losing the largest amount of heat by radiation, which is two-thirds of the total losses [
18]. Its temperature was also recognized as an accurate indicator of the core temperature, as long as a compensation of a couple of Celsius degrees is included [
19], and correlated with the overall thermal sensation [
16]. For this reason, some researchers such as Taniguchi et al. [
20] proposed a quantitative evaluation of the occupants’ thermal sensation in both steady and non-steady states by exploiting the face skin temperature and its rate of change.
Law [
21] observed that, while heat-sensitive neurons are equally distributed across the skin surface, there is a higher number of cold-sensitive neurons on the forehead, which has close to double the cold-sensitive neurons per area than the rest of the measured body’s parts [
22]. Cold thermal receptors are more sensitive to the skin temperature rate of change and closer to the skin surface than heat receptors: consequently, occupants’ discomfort is more easily detected when it is leaning towards the cold side [
23].
Commonly, when the skin temperature is used as a parameter for the human thermal sensation and comfort estimation, thermocouples [
9,
10,
24], infrared cameras or thermometers are used [
12,
16,
19]. However, thermocouples are an invasive approach for an everyday application. On the contrary, thermographic imaging has been shown to be a reliable method for a real-time and non-invasive monitoring of local cutaneous temperature over the body’s surface [
25] for many physiological functions [
12]. Nevertheless, standard thermal cameras are not practical due to size, price and potential positioning issues. To overcome these limitations, we designed and developed a small and cheap mechatronic device equipped with a miniature infrared camera that can recognize and track the occupant’s face and forehead area, and record its temperature. To assess this new device concept, some preliminary laboratory tests have been performed by comparing the comfort conditions elaborated on starting from the sensor measurements with the thermal comfort questionnaires given to the test subjects. The proposed technical and technological solutions are expected to be integrated in a new approach for the extensive monitoring of occupants’ comfort conditions through a non-invasive measurement of the forehead skin temperature.
3. Materials and Methods
In this section, methods, materials and experimental setup used for the tests are presented. After a description of the infrared camera sensor and its control systems, the characteristics of the climatic chambers and the experimental procedure are illustrated.
3.1. Infrared Camera Sensor
A smart sensor for the forehead temperature assessment must be as non-invasive as possible, and, thus, it should be small, easy to install and integrated in a small electronic card and controlled by a microprocessor. Furthermore, the device has to be economically convenient with respect to a full set of probes for the monitoring of thermal comfort, and, in this case, components have been selected considering a budget of 200 EUR.
In the proposed approach, a Lepton infrared camera by FLIR (FLIR
® Systems Italy, Limbiate, Italy) [
26], i.e., a complete long-wave infrared camera module designed to be easily interfaced with different consumer electronics, has been chosen. It is an un-cooled core camera, meaning that its internal core temperature changes over time depending on the temperature of the surroundings; its output is expressed relatively to its core temperature, which can be determined via an integrated function in the code. Its main dimensions and characteristics are reported in
Table 1 [
27].
The camera is not designed for temperature readings, but rather for pure thermal imaging. This means that there is no actual temperature output of a certain spot and additional calibration is needed in order to read the temperature. As the distance from a measured object is influencing the camera’s output, separate measurements have to be done to find a proper relationship between them. In order to do so, the calibration procedure has exploited a hot plate with a temperature-controlled system based on a Peltier unit. To calibrate the system properly, the coating unit has been chosen with an emissivity factor similar to that of the human skin, i.e., 0.98. The surface to be measured has been maintained at a constant temperature in a slightly bigger range of the regular human skin, and the measures have been compared with a certified and calibrated FLIR B360 thermal camera (FLIR® Systems Italy, Limbiate, Italy). Outputs from different distances have been collected and, after statistical analysis, a formula incorporating the distance factor has been obtained.
3.2. The Control System
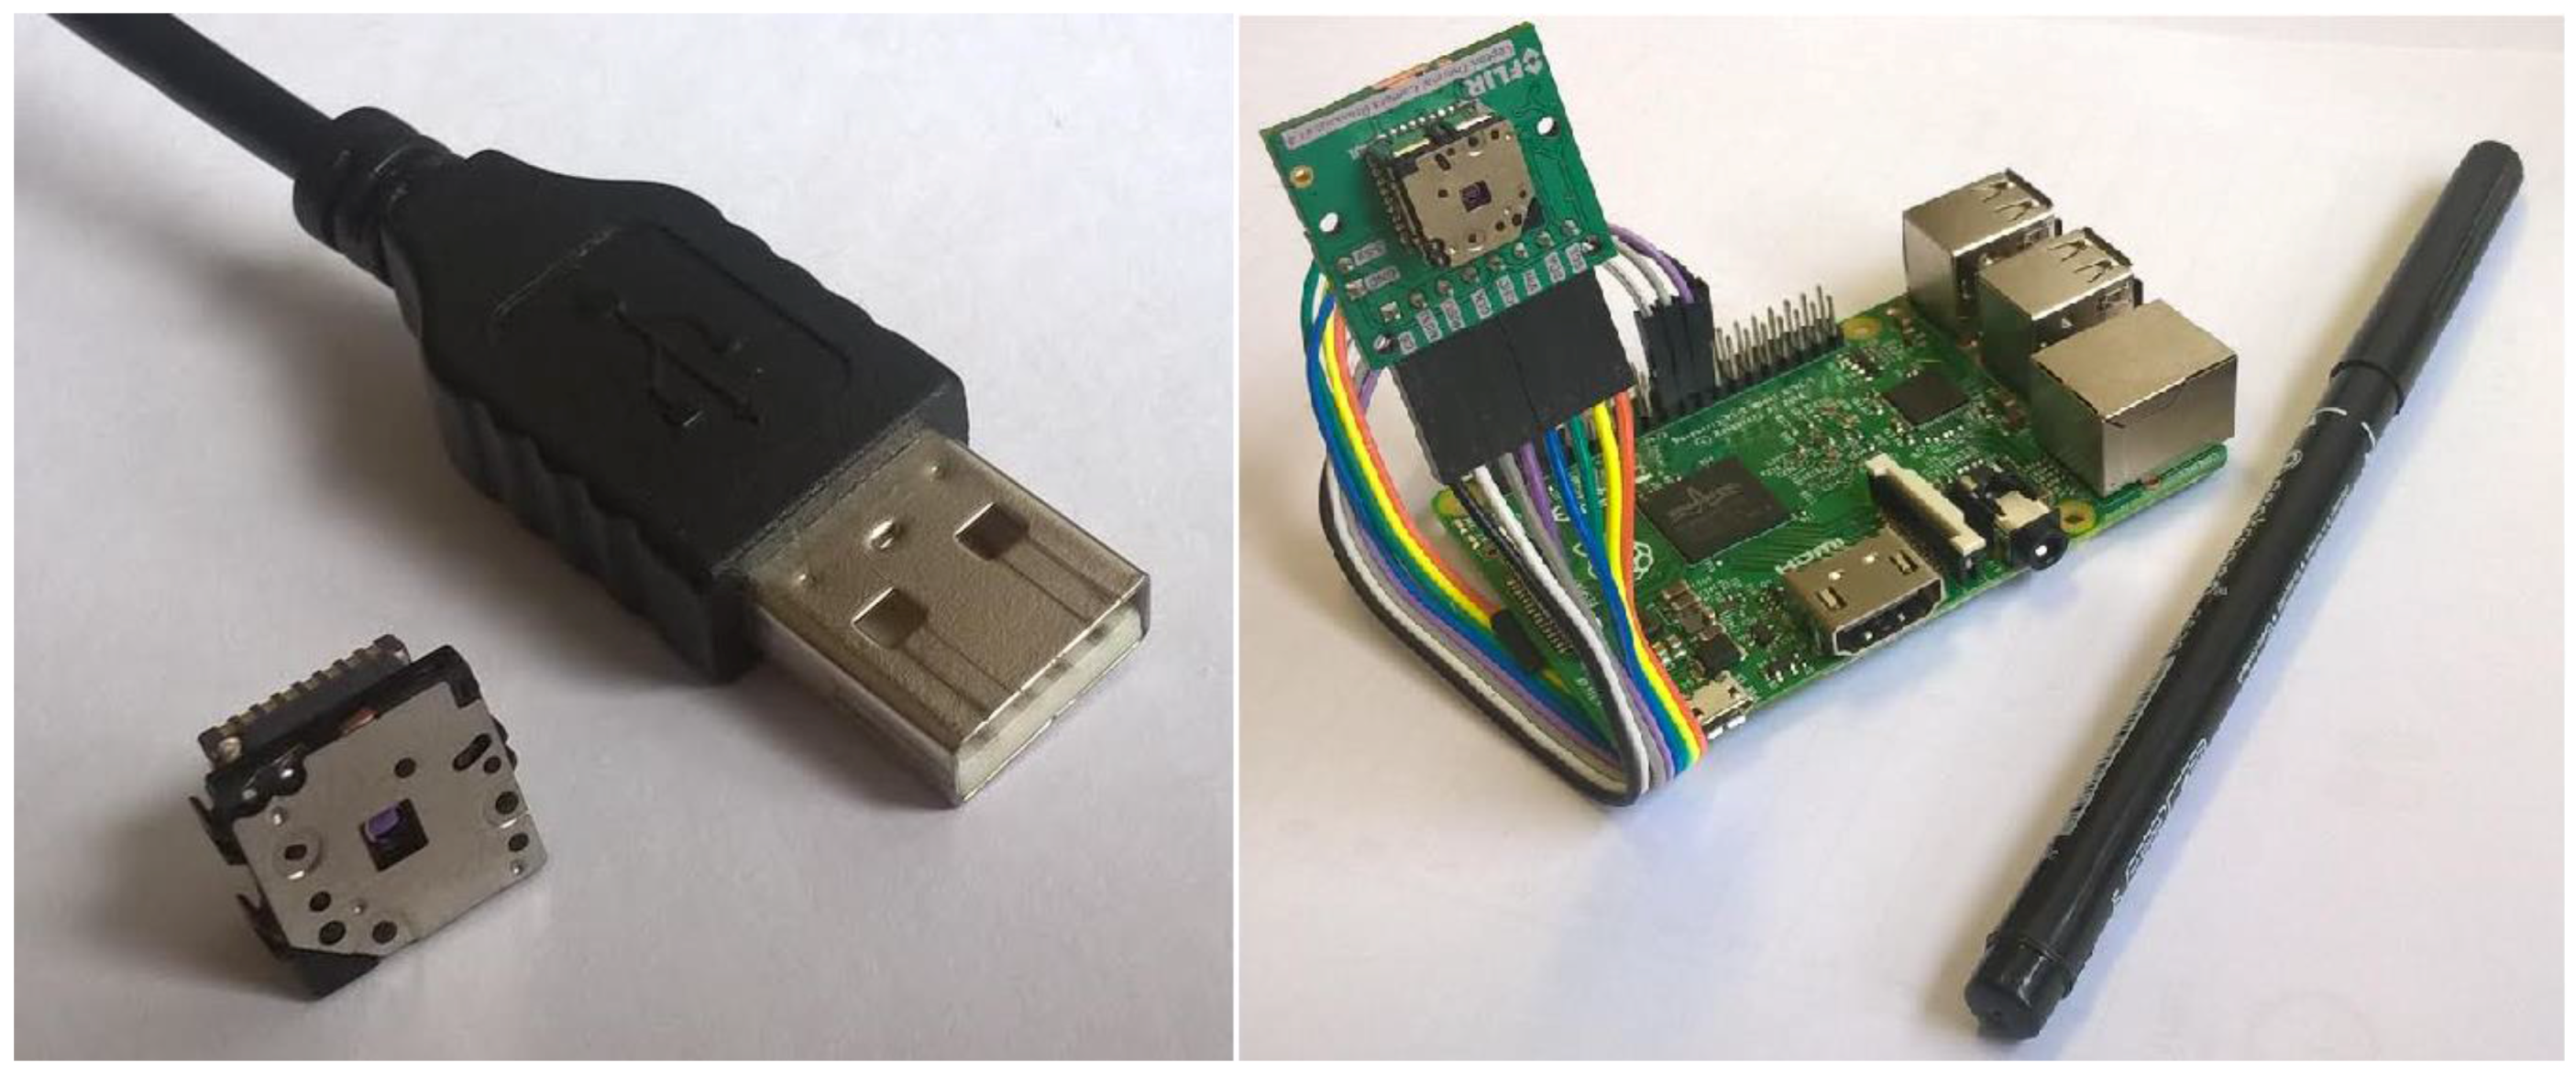
To operate and control the camera in an effective way by maintaining, in the meantime, small dimensions, the camera has been connected to a Raspberry Pi 2 (Raspberry Pi Foundation, Cambridge, UK), a small credit-card sized computer able to provide the proper power and do all the processing of data coming from the camera, as in
Figure 1. Furthermore, an ultrasonic sensor HC SR04 (Cytron Technologies, Pulau Pinang, Malaysia) for the distance assessment from the camera has been integrated into the mechatronic unit. In order to recognize if a person is in front of the camera, the system has been equipped with a passive infrared sensor for detecting the movement. Finally, to be able to also measure the ambient temperature and relative humidity, a DHT11 sensor (DFRobot, Shanghai, China) has been integrated into the setup. These measures, made at desk height, are closely related to the actual conditions at the forehead height. These data could be used to recognize sudden changes in surrounding conditions, which might trigger a specific body and forehead temperature reaction, but they are not strictly necessary for the approach.
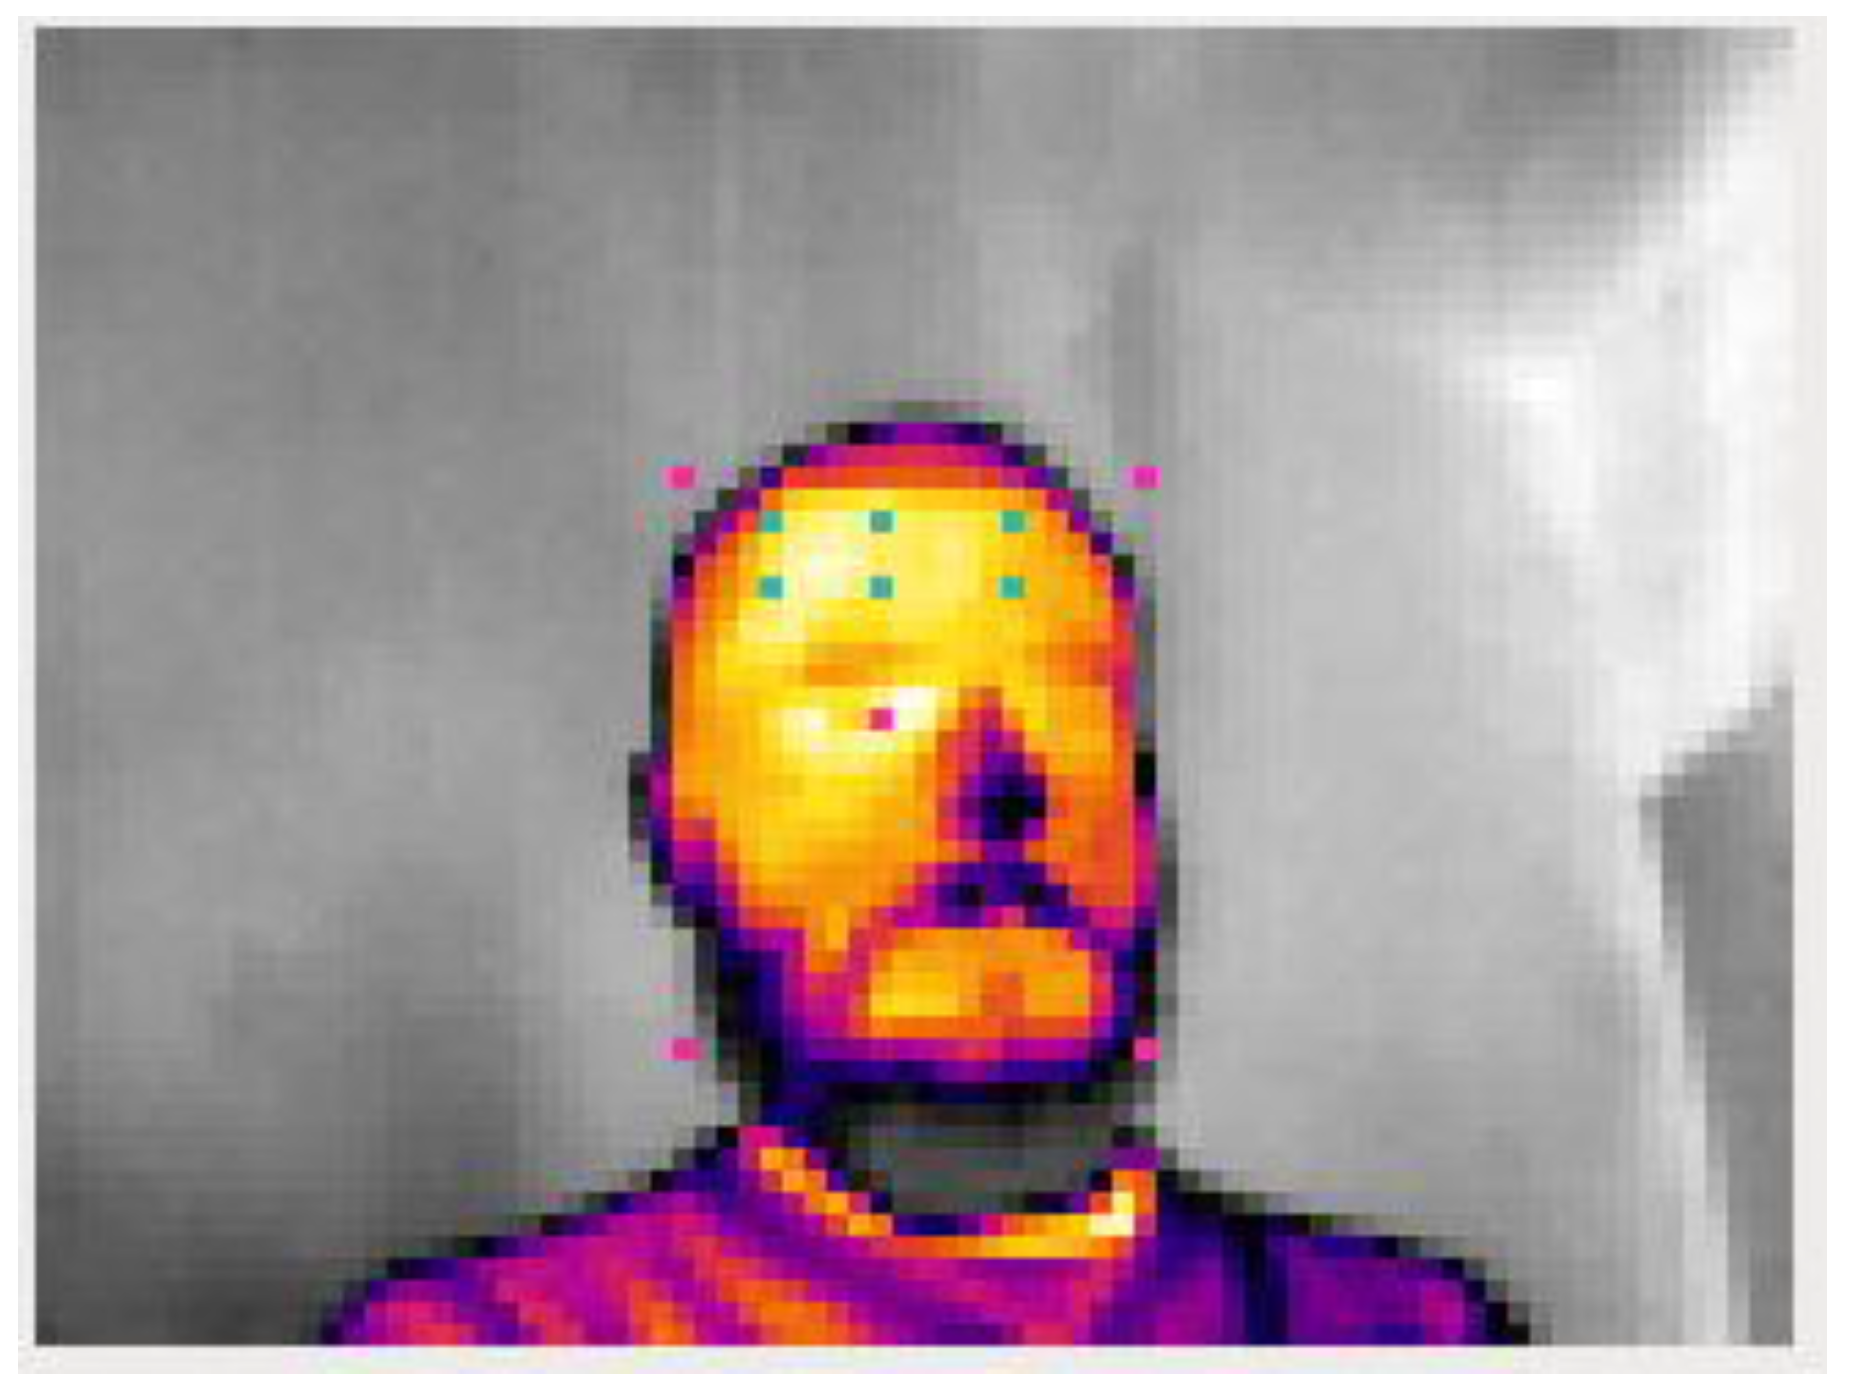
The code for acquiring the images and processing them has been implemented in Microsoft C++. For the image operations, i.e., face recognition, face position tracking and forehead area finding, the OpenCV open-source software is used. The output of the system is the measured temperature that is, in fact, the average value of all the measured pixels in the forehead area. Even if the size of the camera limits it in several ways, its low resolution causes grainy images with reduced precision, but the face is still recognizable and the temperature can be properly calculated.
Figure 2 shows an example of an image acquired with the camera where five pink dots, one on each corner of the imaginary frame surrounding the face and another one in the center over the eye, can be recognized. These are indicators of which area the algorithm recognizes as the head. Green colored dots represent the recognized forehead area, which is approximately perpendicular to the camera.
3.3. Experimental Setup Description
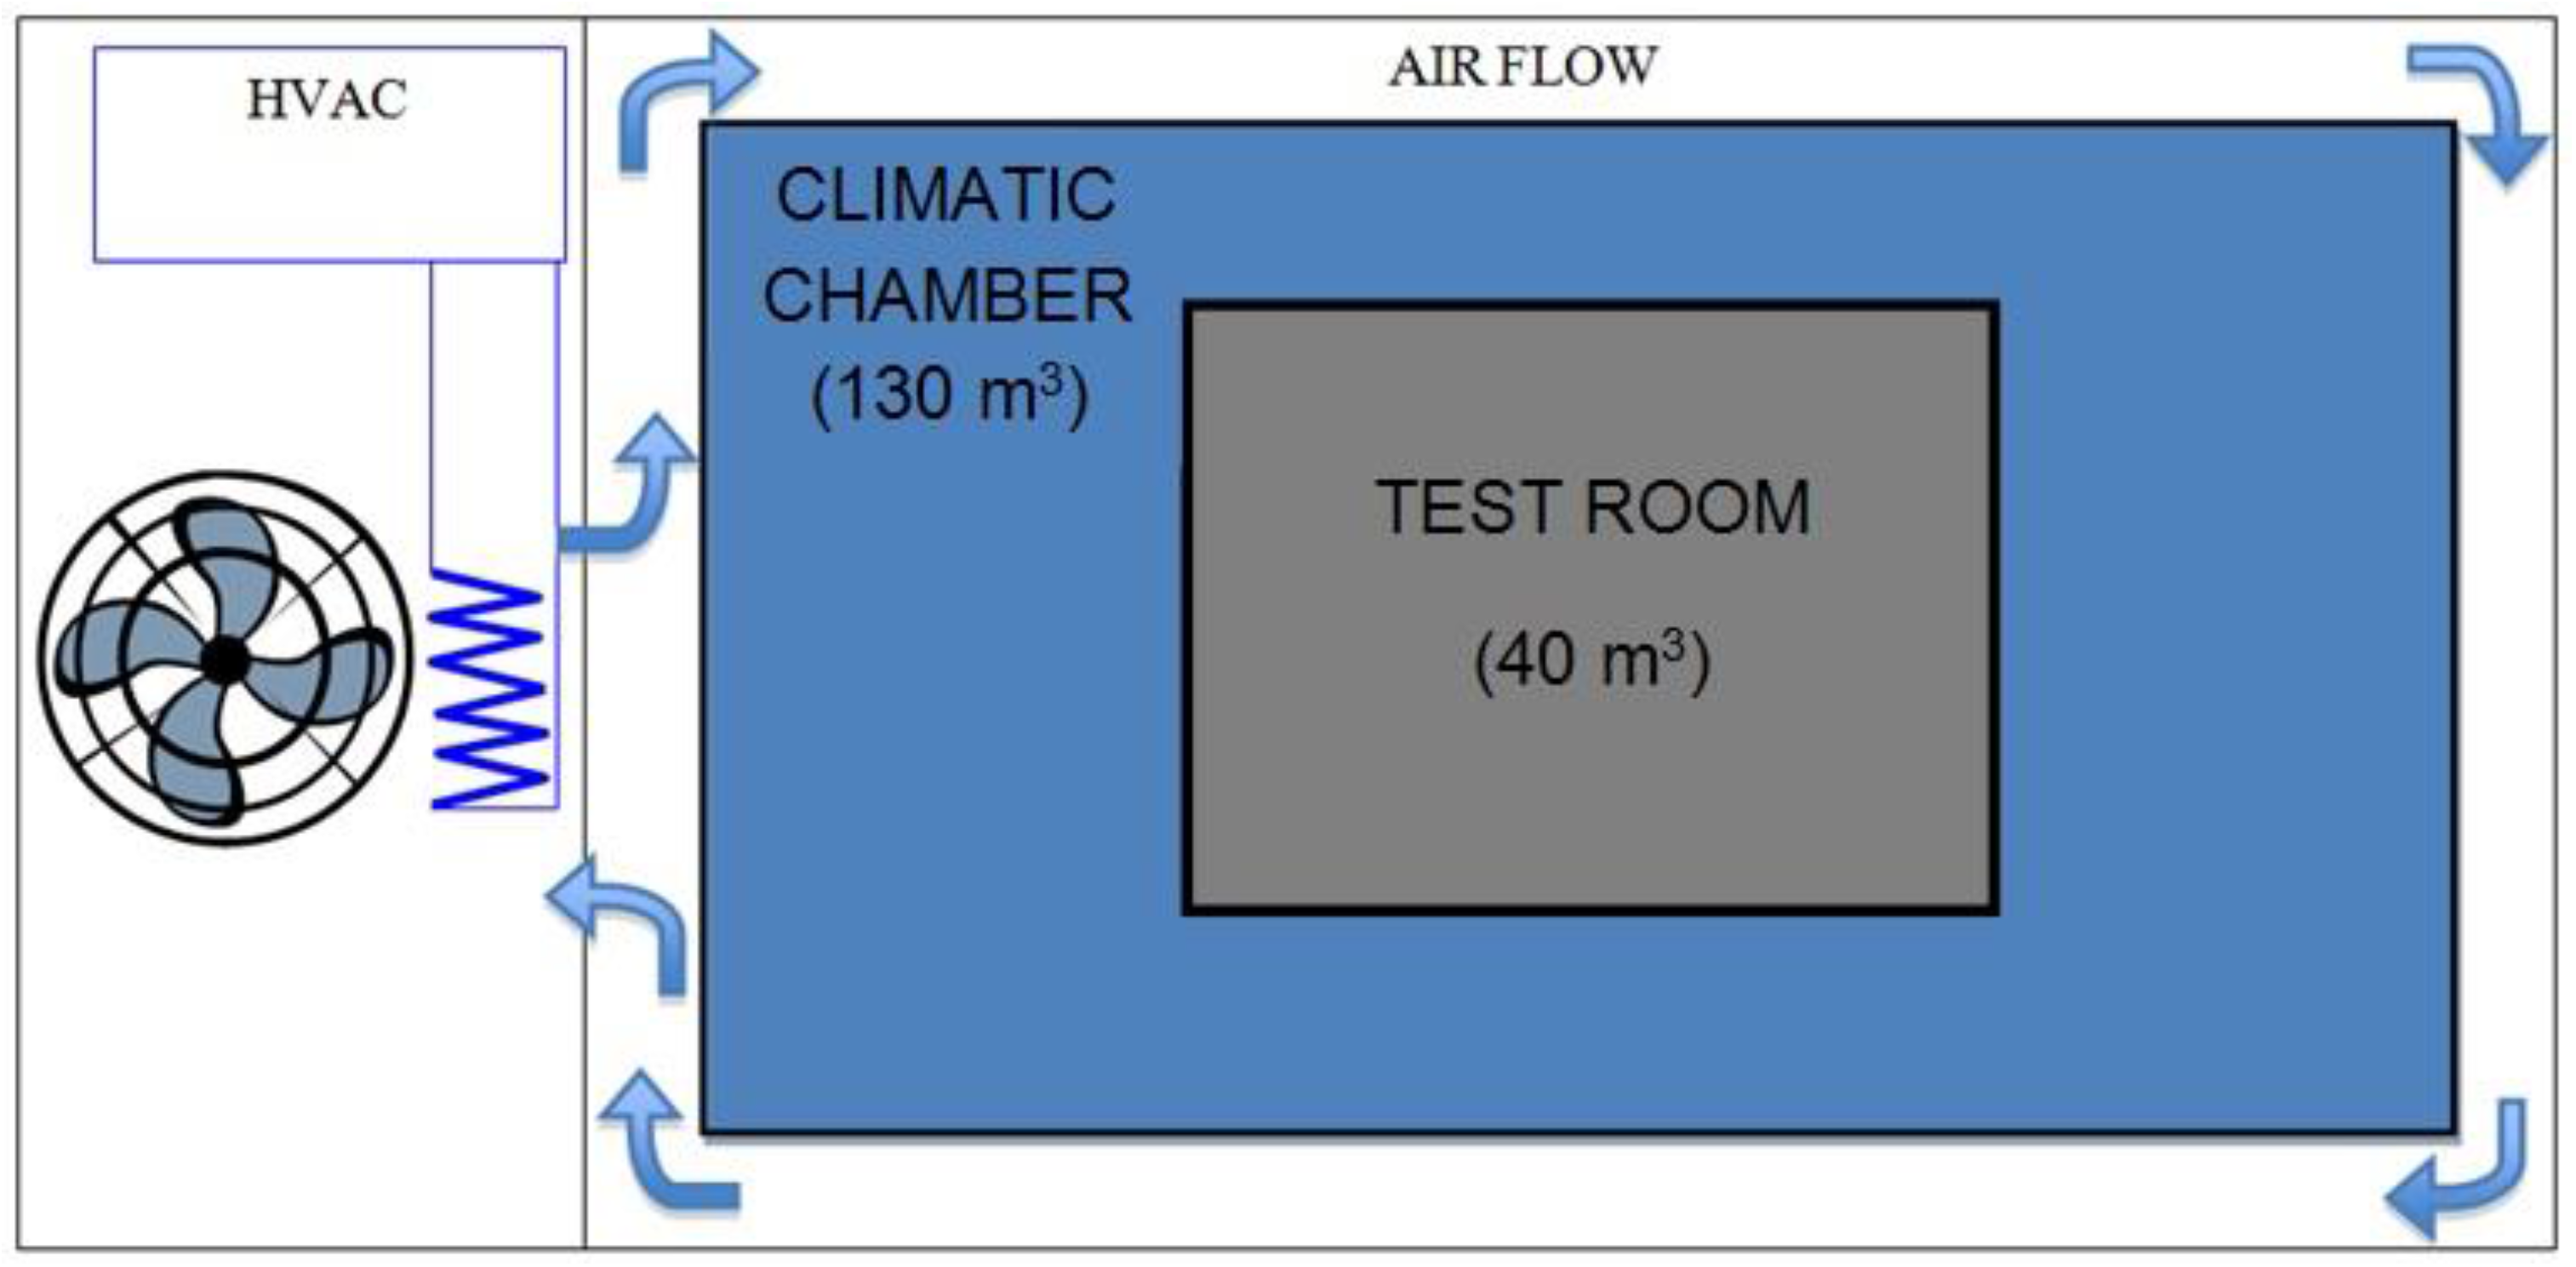
The experimental tests were conducted at the Institute for Construction Technology (ITC) facilities laboratories of the National Research Council of Italy (CNR) in Padova. Two well-insulated climatic chambers with different temperatures were employed and the conditions in them were kept as steady as possible. A jacket-type climatic chamber is present inside the ITC facilities. The controlled air volume, of around 130 m
3, was maintained at a desired temperature through a dedicated heating, ventilating and air conditioning (HVAC) unit. Inside this room, an insulated chamber is installed, with an inside volume equal to 40 m
3 as it can be seen in
Figure 3. The large climatic chamber was used as a “cold chamber” while the internal test room was exploited as a “hot chamber” during the experiments.
The inner test room is built from polyurethane (PUR) zinc-coated panels (U = 0.33 W·m
−2·K
−1), typical for a cold storage for the assessment of the performance of ceiling radiant systems according to the European technical standards EN 14240 [
28] and EN 14037-4 [
29]. Two radiant systems, one in the floor and another in the ceiling, and a set of ten thermal dummies enabled us to accurately set the air temperature of the room. A network of sensors, seen from
Table 2, was installed inside the rooms with a dedicated data-logging system developed in the Labview environment.
Four air temperature probes were positioned at different heights (0.1 m, 1.1 m, 1.7 m, 2.4 m from the floor) in the middle of the test room together with a globe thermometer. As the HVAC unit was employed only in the outer chamber, the air speed inside the test room has been monitored constantly below 0.03 m·s−1, thus having close to no impact on the thermal environment conditions. All the parameters were monitored in real time through a dedicated graphic interface. Three air temperature probes, positioned outside the test room, measured the air temperature of the outside insulated chamber. For measuring the other environmental parameters in the climatic chamber, the thermal comfort data logger INNOVA 1221 (LumaSense Technologies Inc.®, Santa Clara, CA, USA) was used.
3.4. Experimental Tests
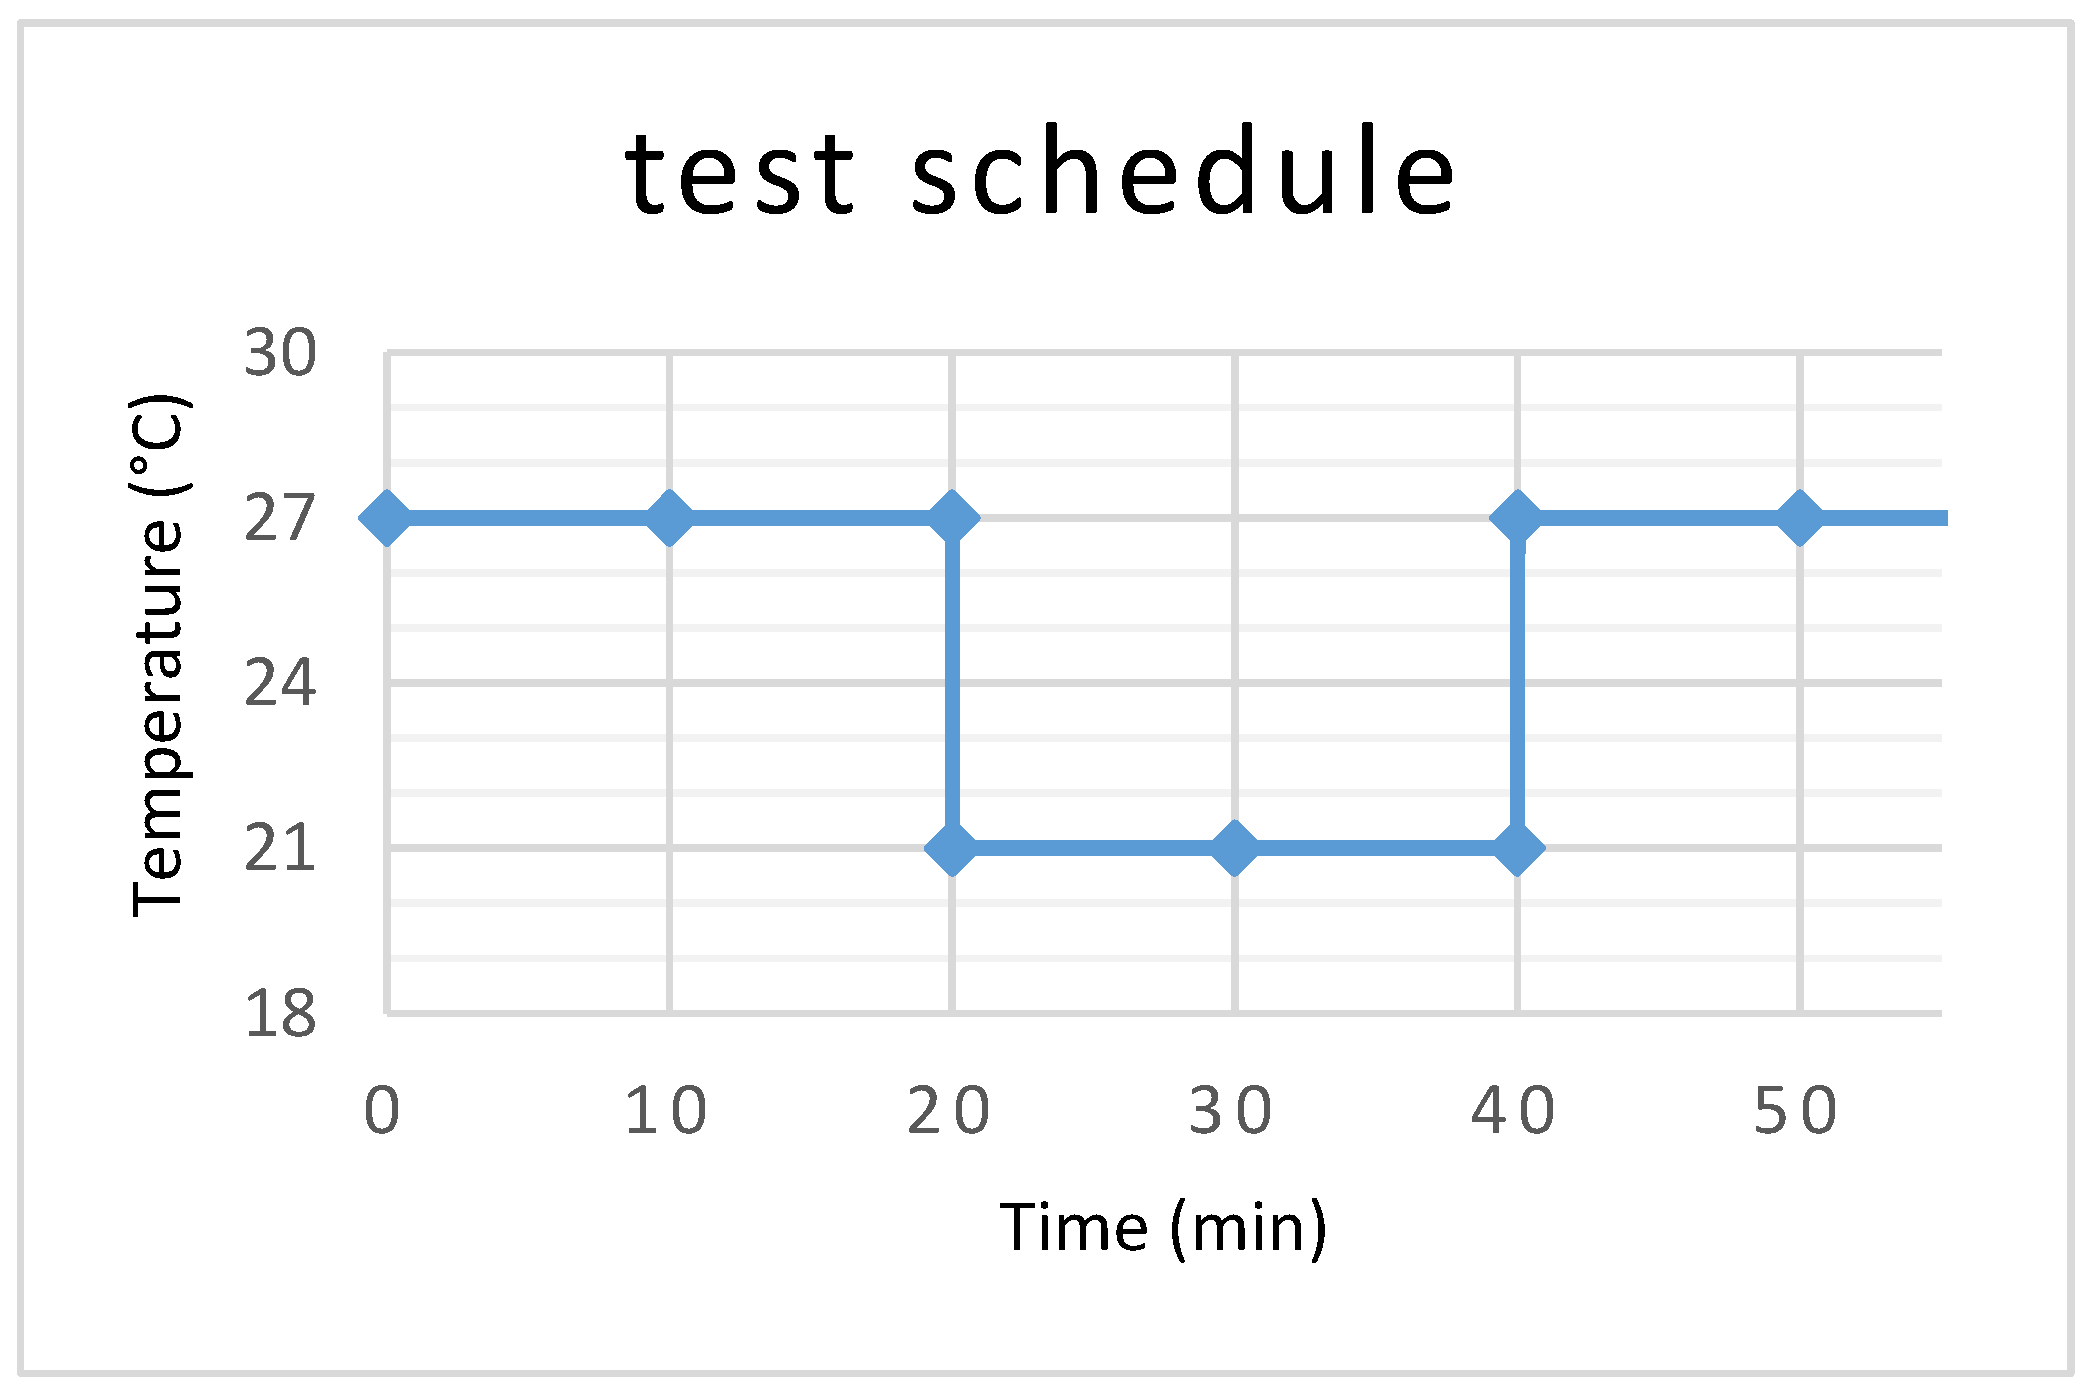
During the experimental tests, the HVAC unit kept a low air temperature inside the large climatic chamber, whereas thermal dummies in the test room was switched on in order to keep a suitable temperature difference of at least 5 °C between the two environments. More precisely, the “cold chamber” was kept at 21 ± 1 °C, while the “hot chamber” was at around 27 ± 1 °C. Considering the period of the year (i.e., July–September), the subjects’ clothing level and the average outdoor conditions in the seven days previous to the experiments (24.6 °C, 25.6 °C and 24 °C), as well as the characteristics of the facility, and these temperatures were selected to reproduce discomfort conditions because of both cold (i.e., a PMV value around −1) and hot sensations (i.e., a PMV value around +1). The humidity in both was averaging close to 60% with little variations. The subjects were asked to perform a sedentary activity, such as reading or working on a computer during the test, which lasted close to an hour. All subjects followed the schedule depicted in
Figure 4. The observed temperature step-changes, which can be found in many tests for thermal sensation and/or comfort evaluation in the literature [
10,
13,
19,
23,
24], allowed us to monitor the initial adaptation to the new thermal environment in order to have transient periods together with periods of constant temperature. As tests were performed in the warmer part of the year, the subjects were asked to spend some time in the “cold chamber” prior to the test starting until they felt thermally comfortable. They were then asked to enter the “hot chamber” and continue with their sedentary activity, while the IR camera started recording. After 20 min, the subjects were transferred to the “cold chamber”, where the camera kept recording them for additional 20 min. Lastly, they were asked to transfer back to the “hot chamber” for the last 15 min of the test, to assess the adaptation to the cold–hot step change. The last part was slightly shorter as we already observed the stabilized hot conditions and were interested to mainly see the transition, for which 15 min proved to be enough. The transition itself did not influence the metabolic rate much, as the two locations were less than 5 m away. Thermal Sensation Votes (TSV) and Thermal Comfort Votes (TCV) were collected every 5 min via a printed questionnaire where subjects were supposed to mark their experience. TSV were aimed at distinguishing hot and cold thermal sensations while TCV were used to record only the level of discomfort. TSV followed the same ASHRAE 7-point scale [
10,
13,
19,
23,
30], according to which −3, 0 and +3 indicate a very cold, neutral and very hot thermal sensation, respectively, while TCV ranged from −3 to 0 as in works of Zhou et al. [
31]. TCV index represents how much a person feels uncomfortable: 0 means he feels comfortable, −1 slightly uncomfortable, −2 uncomfortable and −3 very uncomfortable. While TSV represents a vote about the feeling of the thermal environment, TCV is a vote related to the people’s level of discomfort, referring to their own preferences: e.g., some people could feel more comfortable in the cold environment and some others could feel better in warm environments. The forehead temperature was taken from subjects every 2.5 s in order to precisely follow the changes in temperature.
The experiment was performed on one subject at a time on 10 different healthy subjects—8 males and 2 females. Subjects’ mean and median age were, respectively, 27.5 and 28.5 years old, in the range of 21–31, while the mean body mass index (BMI) was 21.12 ± 2.57 kg·m
−2. Tests were performed during the hot summer period and, consequently, all subjects were dressed in light summer clothes, mainly shorts and T-shirts, which resulted in a low mean clothing factor of 0.34 ± 0.06 clo, calculated according to the ASHRAE Handbook of Fundamentals [
32].
3.5. Analysis Methods
TSVs and TCVs collected through questionnaires were elaborated on, and, starting from environmental measurements, clothing and metabolic conditions of the subjects, the Predicted Mean Vote (PMV) was calculated according to Fanger’s model. Statistical tests were used to assess the correlations between the TSVs, TCVs, PMVs and the forehead temperatures (FTs). The aim was not to determine expressions for a general statistical inference but simply to detect the presence of relationships to be investigated further with larger samples.
A first analysis was performed to compare the time series of subjects’ votes and forehead temperatures through the three stages of the experiment. Thermal sensation votes and thermal comfort votes were collected every 5 min, and 15 in total for each series. As previously explained, forehead temperatures were recorded at higher rates, but, for this analysis, they were sampled in order to have the same 5 min discretization as TSV and TCV. Further post-processing on the forehead temperature profiles allowed for defining another derived series for the deviation with respect to the previous time-step, ΔFT
τ. The selected statistical test was the Kolmogorov–Smirnov test [
33], K–S test, which is a non-parametric test comparing the cumulative distribution functions (CDFs) of two series. According to the null hypothesis, two series have the same CDFs, while, for the alternative hypothesis, the opposite is true. A statistical significance α of 1% was chosen to reject the null hypothesis and accept the alternative one. For each subject, separate K–S tests were calculated and a frequency analysis was performed on the entire sample to draw global conclusions.
A second analysis focused on the data collected once the steady state conditions were reached. Observing the time evolution of the results in each phase, the forehead temperatures reached a steady condition within the first 5 min for all subjects. For this reason, the recordings and votes of the first 5 min of each experimental phase were discarded and average values were calculated for the remaining ones. In addition to TSV and TCV, the PMV was also included in this analysis. Correlations were assessed between the average values of TSV, TCV and those of the FT, and the absolute deviation of the forehead temperature with respect to the initial conditions of the experiment ΔFTabs and with respect to the reference temperature of 34 °C, ΔFT34. For the calculation of the latter, the 5-min sampled values of the first analysis were used, while, for the first one, the entire series of temperature after the steady state condition was reached. The Spearman non-parametric correlation test was used with a statistical significance of 1%.
4. Results
All subjects followed the described experimental schedule, doing the step-changes in thermal conditions in the manner warm-cold-warm. The difference between the warm and cold conditions was rated as slightly more than a two-point difference on the PMV 7-point scale.
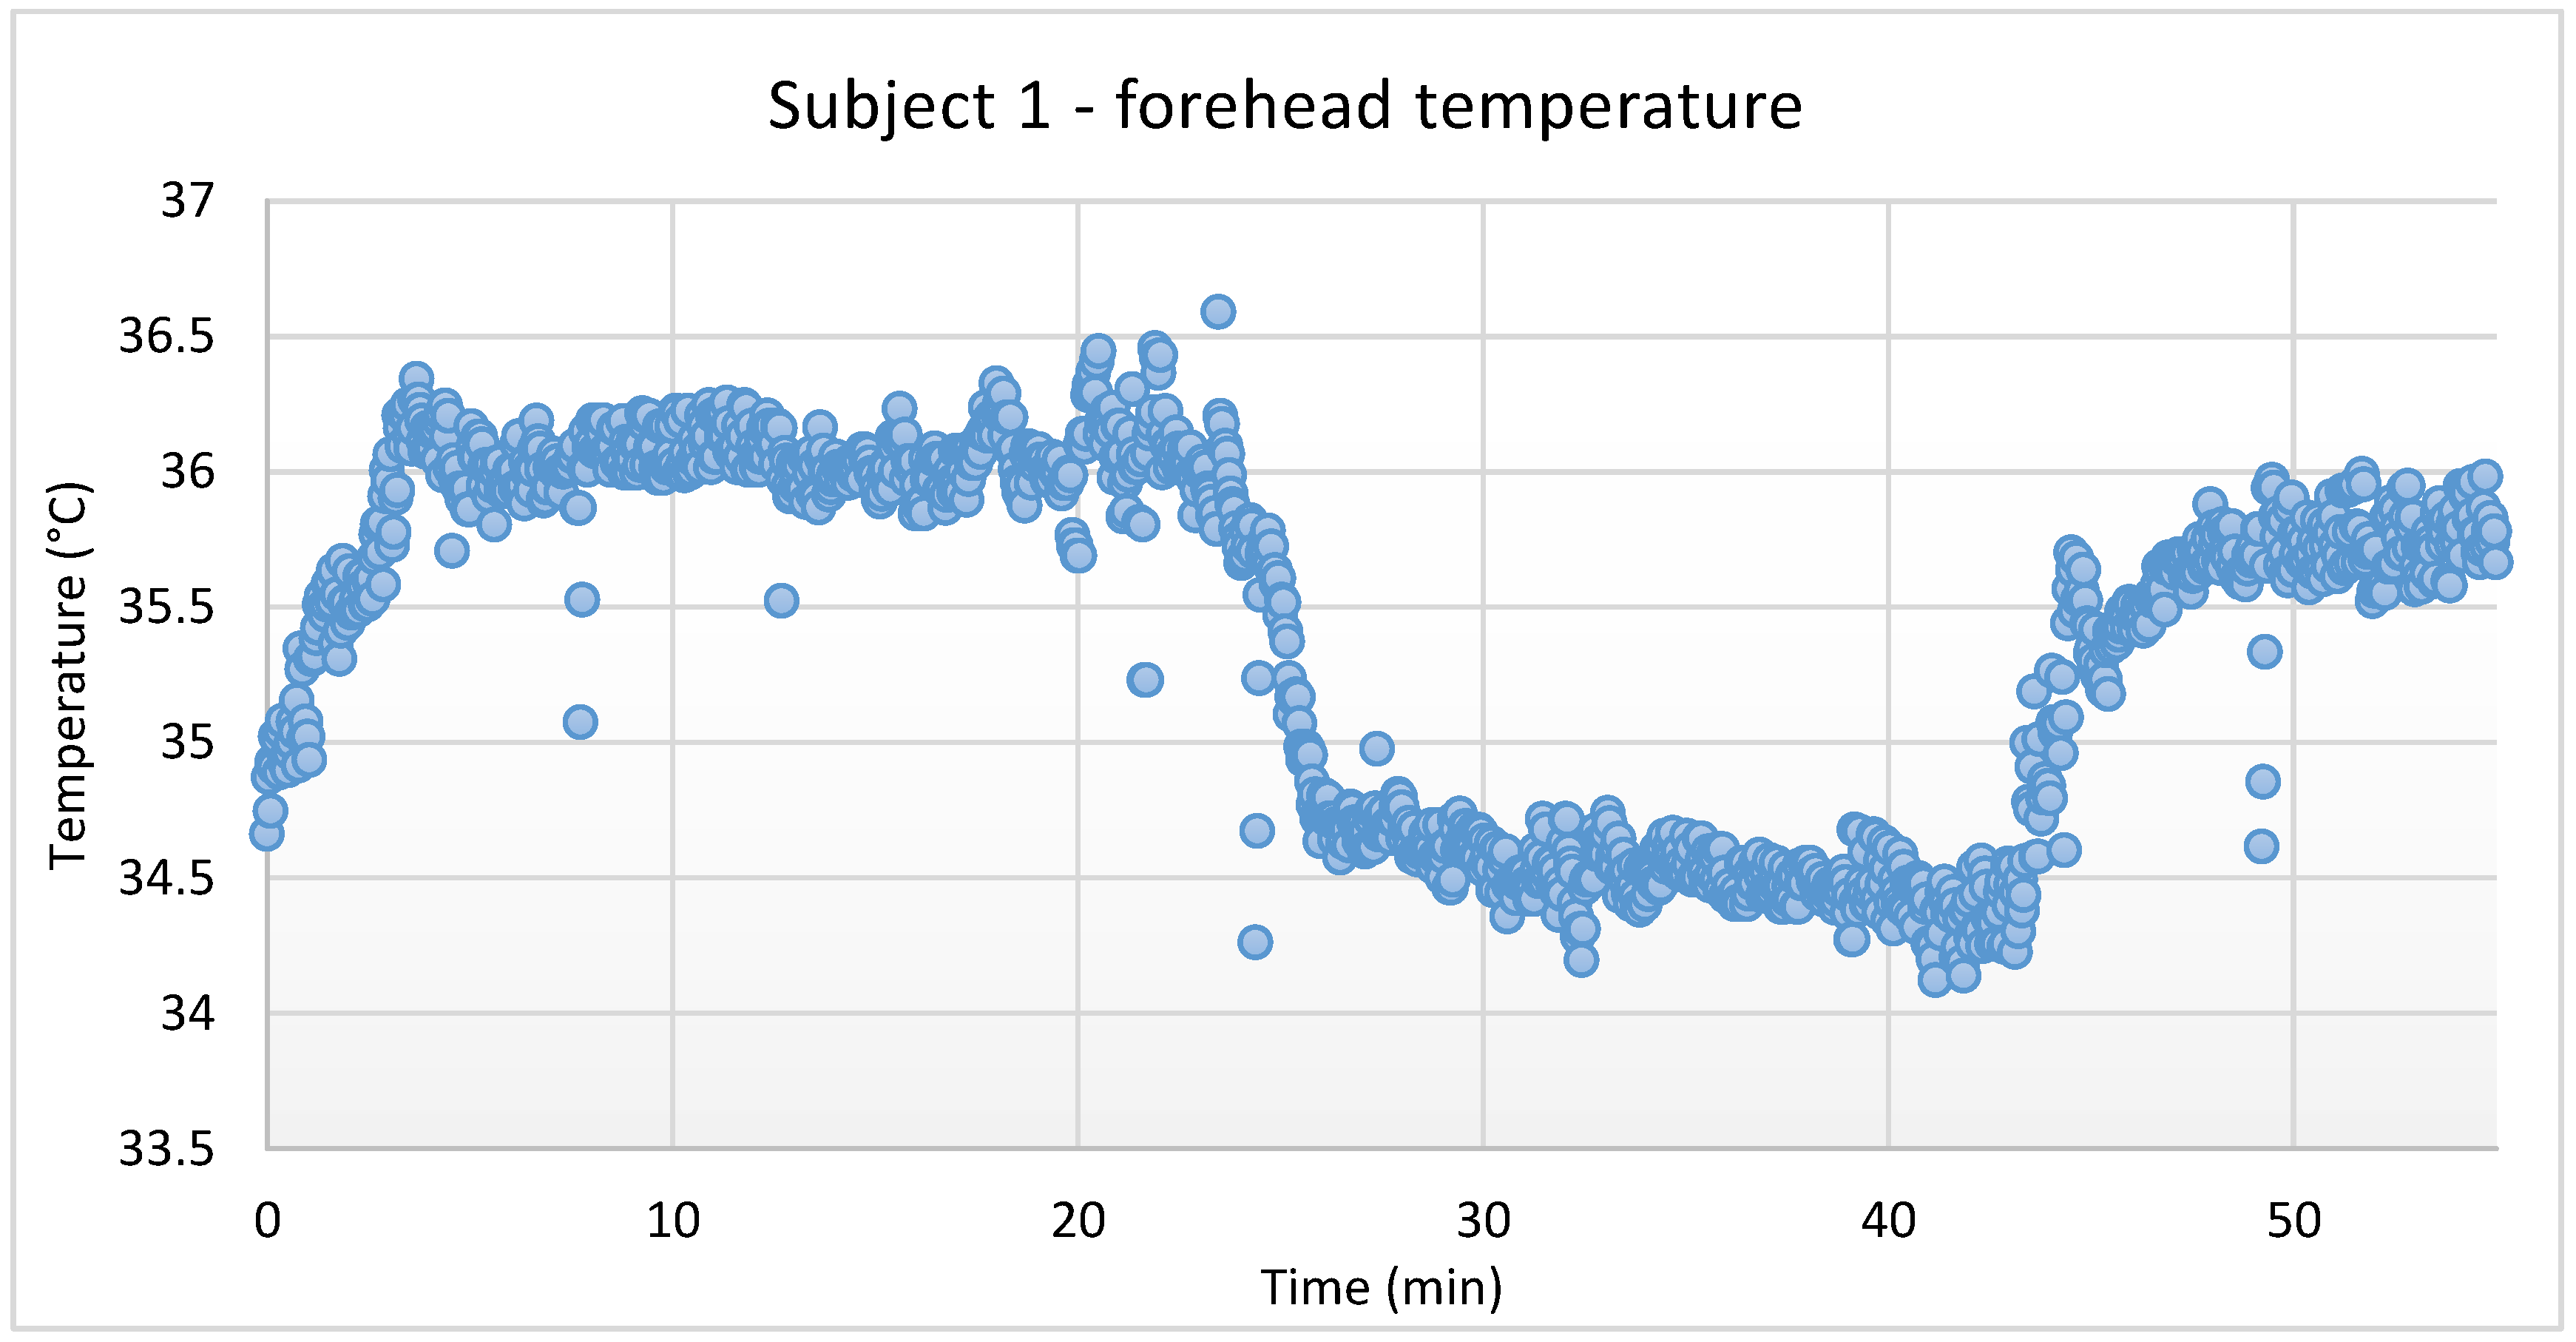
Figure 5 shows the changes in forehead temperatures of one of the subjects. Except for the slight variation in initial forehead temperatures (34.36 ± 0.46 °C), all the subjects followed a very similar pattern and reached the stable forehead skin temperature within the first 5 min after the exposure to the new environment; the biggest change happened within the first 5 min. Slight, but very consistent oscillations in temperature occurred due to the unstable core temperature of the camera and subject’s head movements.
A slight undershoot in the TSV values immediately after the change to cold conditions was observed in most of the samples, while the reported TCV values did not follow the same trend. Moreover, a gradual buildup of TCV values in warm periods was often observed, while they were quite stable in the cold period and correlated well with the forehead temperatures during that time.
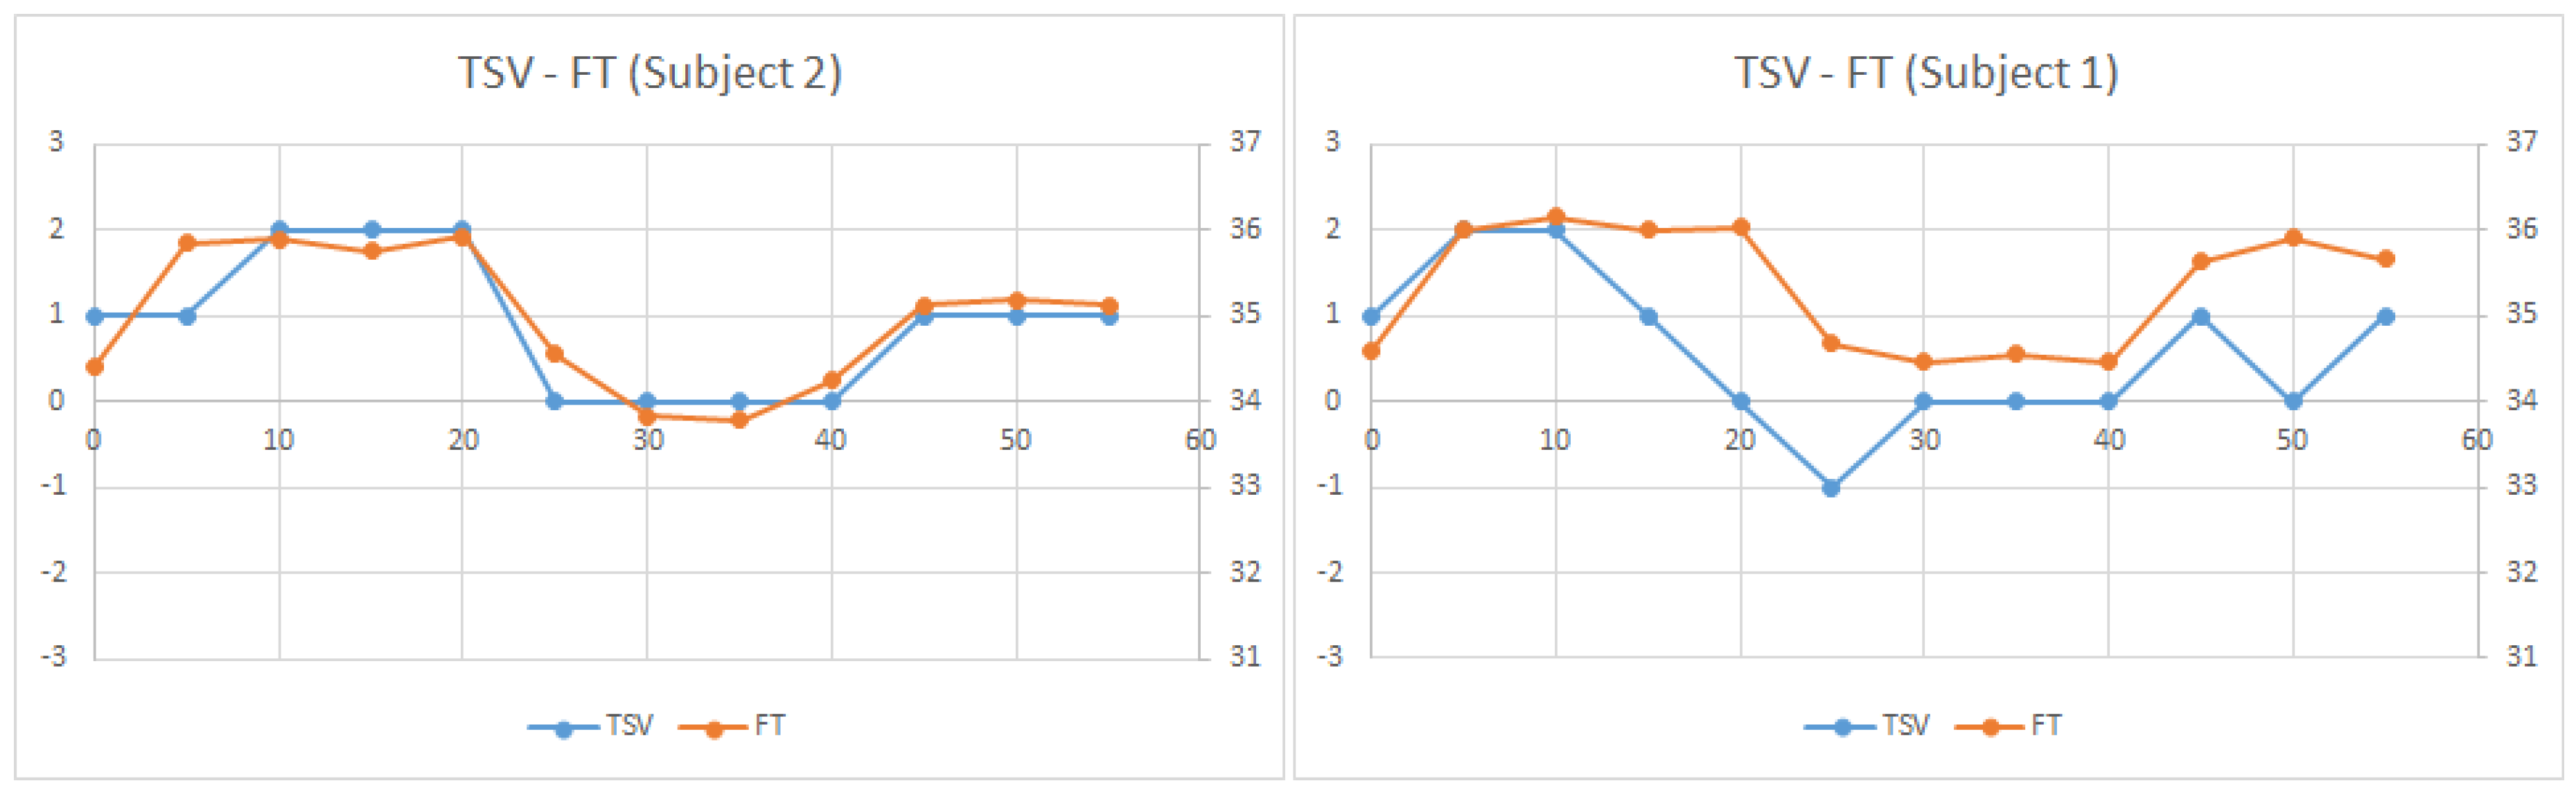
Figure 6 illustrates the values for the TSV and FT for a couple of test subjects using the same time discretization. According to the Fanger’s core model, the mean skin temperature should be close to 34 °C at the metabolic rate of sedentary activity. Therefore, TSV and forehead temperature axis were aligned to have the 34 °C corresponding to TSV = 0 in the graphs of
Figure 6. A good fit for linear comparison for most of the subjects can be observed.
Table 3 reports the
p-values of the K–S tests for the 10 subjects. Considering the relationship between TSV and FT, no subjects in the sample have statistically significant results with α = 1%, meaning that the forehead temperature can be an index of thermal perception. Adopting a statistical significance of 5%, i.e., increasing the risk of accepting an alternative hypothesis when it is false, and, for this context, stating that the forehead temperature CDF is different from the TSV one, the fraction of subjects with significant
p-values increases only to 10%. Analyzing the relationship between TSV and ΔFT
τ, the results are worse: tests are significant for 2 subjects with α = 1% and for 6 subjects with α = 5%. As a whole, the distribution of deviations of the forehead temperature is less representative than the forehead temperature itself in the view of characterizing the thermal sensation votes. About the TCV, the best correlation is found again with the forehead temperature. With α = 1%, for only 3 subjects, the FT is a poor index of comfort sensation. However, with α = 5%, this is true for 5 subjects out of 10. Regarding the deviation of the forehead temperature with respect to the previous step, tests are significant for 30% of the sample if α = 1% and for up to 70% if α = 5%, characterizing ΔFT
τ as a weaker index.
Table 4 reports Spearman’s correlations and their
p-values. Thermal sensation votes and predicted mean votes have statistically significant correlations. For TSV, all correlations are strong (i.e., ρ > 0.7) and the best one is found with ΔFT
34. For the PMV, the correlations are a bit weaker than for TSV, but still remarkably high; in this case, the best correlation is found with ΔFT
abs. Regarding the TCV, no statistical significant results are found. This can be explained by the lack of distinction between discomfort due to hot sensations and discomfort due to cold sensations.


 ,
, 


