
A Methodology to Support Decision-Making Towards an Energy-Efficiency Conscious Design of Residential Building Envelope Retrofitting

Abstract
:1. Introduction
2. Methodology
- Systematically organize different refurbishment measures
- Quantify retrofitting measures
- Create a roadmap to use the data during the design, based on a case-study refurbishment strategies design.
- Check the approach’s usability and combine all findings in the final database.
2.1. Systematically Organize Different Refurbishment Measures: Toolbox Compilation
2.2. Quantify Toolbox Options
2.3. Create a Roadmap to Use the Toolbox Data
2.4. Confirm the Approach’s Usability
3. The Façade Refurbishment Toolbox Approach
3.1. Compilation of Retrofitting Measures

| Building Envelope | Building Systems | ||||||
|---|---|---|---|---|---|---|---|
| Exterior Wall | Window | Balcony | Roof | Ground Floor | Ventilation | Heat Source | |
| Existing construction | Masonry/cavity wall no insulation | Single glazing | Continuous slab, no insulation | Pitched roof, timber rafters no insulation/occupied loft | Slab on ground, no insulation | Natural ventilation | Gas stove |
| Lightweight concrete/hollow brick, no insulation | Early, double-glazing | Separate slab no/little insulation | Pitched roof, timber rafters no insulation/unheated loft | Basement unheated. Concrete slab, no insulation | – | Fossil fuel boiler in each dwelling | |
| Outdated insulation | – | – | Concrete slab, no/little/outdated insulation | little/outdated insulation | Trickle ventilation | Fossil fuel boiler per block | |
| Retrofitting measures | Cavity insulation | Upgrade windows | Insulate balcony slab | Pitched roof, no insulation/unheated loft | Insulation on top of ground/first floor slab | Natural inlet/mechanical exhaust | Replace existing boiler in each dwelling, high efficiency |
| Internal insulation | Secondary glazing single | Cut off balcony | Pitch roof insulation | Insulation under existing floor | Mechanical inlet/natural exhaust | Replace existing boiler per block, high efficiency | |
| Exterior Insulation and Finishing Systems (EIFS) | Secondary glazing double | Balcony cladding—Single glazing | Insulation of top floor slab | – | Mechanical ventilation | CHP installation | |
| Ventilated façade | – | Balcony cladding—Double glazing | Flat roof | – | Ventilation system with heat recovery (HR) | Heat pump | |
| Timber-frame wall | Replace windows (Double pane) | – | Green roof | – | – | – | |
| Second Façade/Single glazing | Replace windows (Triple pane) | – | – | – | – | – | |
| Second Façade/Double glazing | Shading adjustable | – | – | – | – | Biomass boiler | |
| BIPV’s | – | – | Photovoltaic | – | – | Solar collectors | |
| Added space/Second façade integrated | Shading fixed | Integrated balcony | – | – | – | Geothermy | |
| Lift addition | Enlarged windows | New balcony | Additional floor/occupied loft | Additional floor/occupied basement | – | District/community heating | |
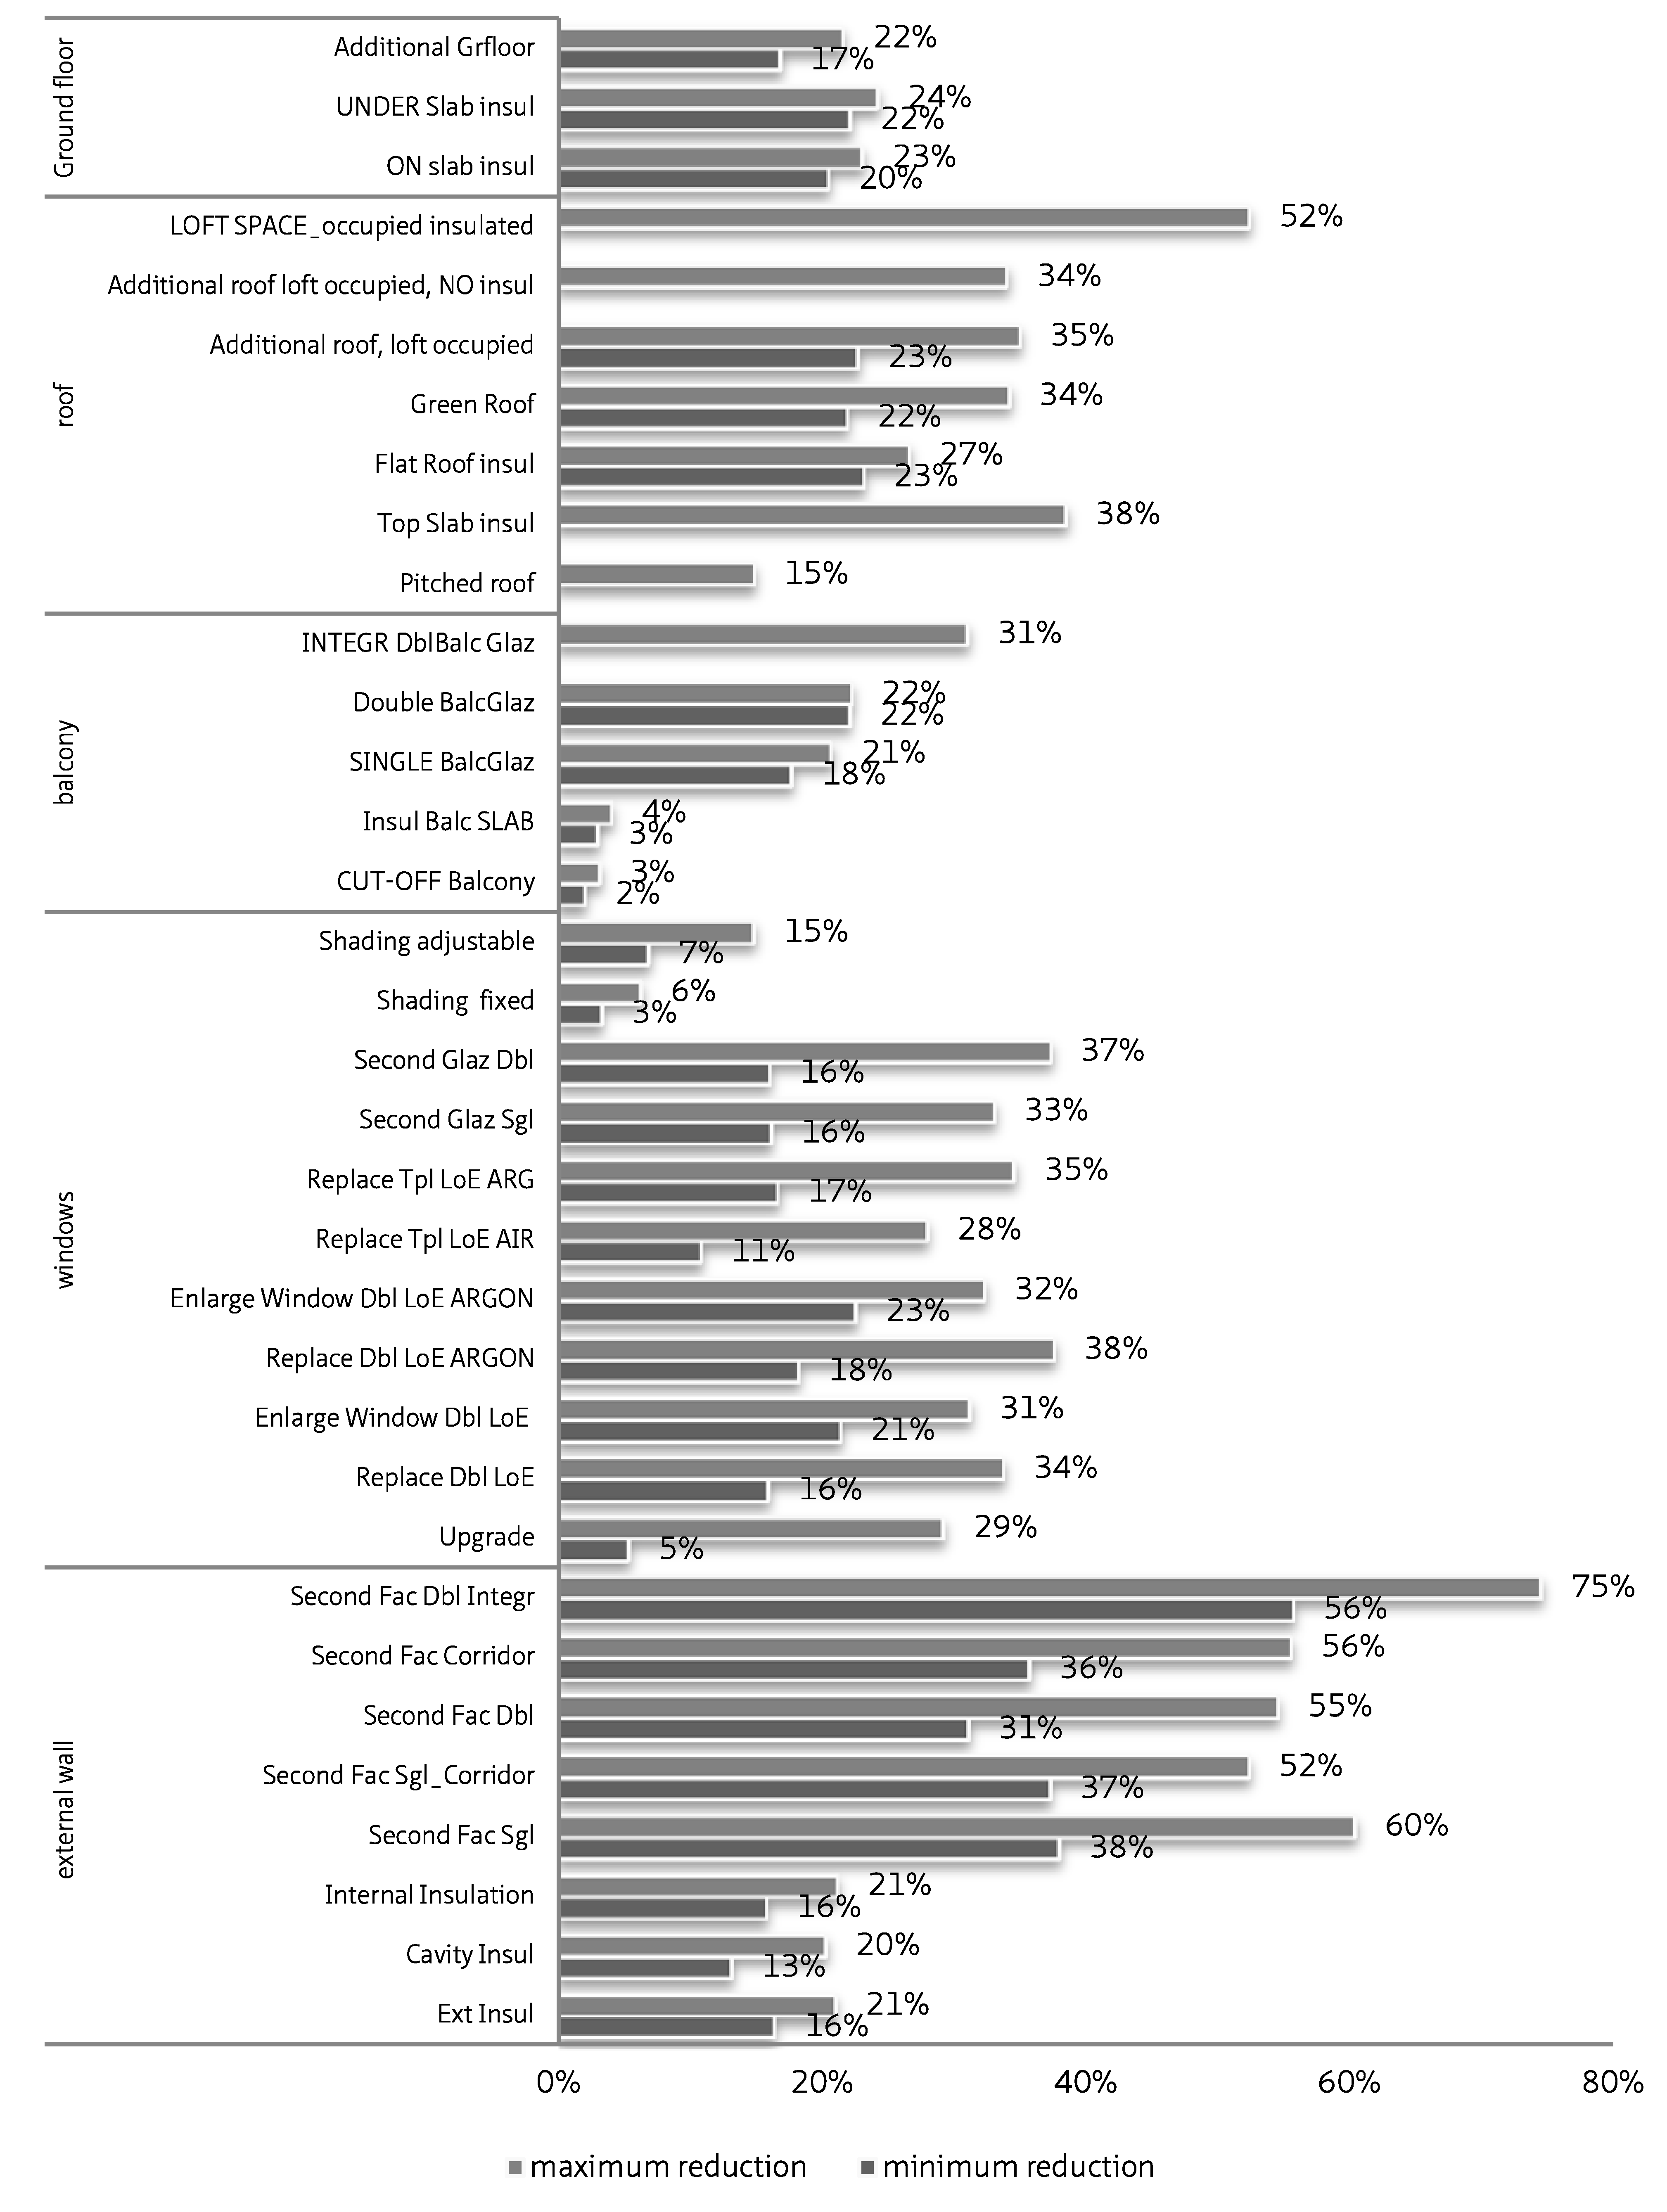
3.2. Quantification
| Component | Portugal (1) | Greece (1) | France (1) | Belgium (1) | Netherlands (2) | UK (1) | Germany (3) | Denmark (1) | Finland (1) | Toolbox Benchmark | |
|---|---|---|---|---|---|---|---|---|---|---|---|
| Wall | U-value (W/m2K) | 0.50 | 0.40 | 0.43 | 0.35 | 0.28 | 0.30 | 0.24 | 0.20 | 0.17 | 0.2 |
| Window | 3.30 | 2.60 | 2.00 | 2.20 | 2.20 | 2.00 | 2.00 | 1.8 | 1.00 | 2 | |
| Roof | 0.40 | 0.35 | 0.43 | 0.27 | 0.28 | 0.20 | 0.20 | 0.15 | 0.09 | 0.2 | |
| Floor | 0.40 | 0.70 | 0.43 | 0.35 | 0.28 | 0.25 | 0.30 | 0.12 | 0.16 | 0.2 | |


| Component | Existing Construction | Additional Parameter | Component U-Value (W/m2K) | WWR (%) |
|---|---|---|---|---|
| External wall | Masonry of solid brick or stone, 250–400 mm two leaves of masonry with air cavity (30–50 mm) | n/a | 2.5–1.4 | 10–45 |
| 45–80 | ||||
| Cavity. Inner leaf with lightweight masonry units | Single glazing | 1.4–0.6 | 10–45 | |
| Perforated brick masonry | 45–80 | |||
| Prefabricated concrete panels, insulation 50 mm | Double glazing | 10–45 | ||
| 45–80 | ||||
| Window | Single glazing | n/a | 6.5–5 | 10–45 |
| 45–80 | ||||
| Double glazing | 4.0–2.8 | 10–45 | ||
| 45–80 | ||||
| Balcony | Various construction (concrete slab, steel structure) with no insulation, inducing thermal bridges | n/a | 2.0–0.8 | 10–45 |
| 45–80 | ||||
| Roof | Pitched roof, Timber rafters, no insulation in cavity | n/a | 3.8–2.0 | all |
| Flat roof, plaster, 130–160 mm reinforced concrete slab, 20–40 mm insulation, screed | 0.6–1.0 | |||
| Ground floor | Various construction (concrete slab, steel, timber structure) with no insulation | External wall type 1 (masonry, cavity) | 2.0–0.8 | all |
| External wall type 2 (lightweight masonry) |
4. Usability of the Approach
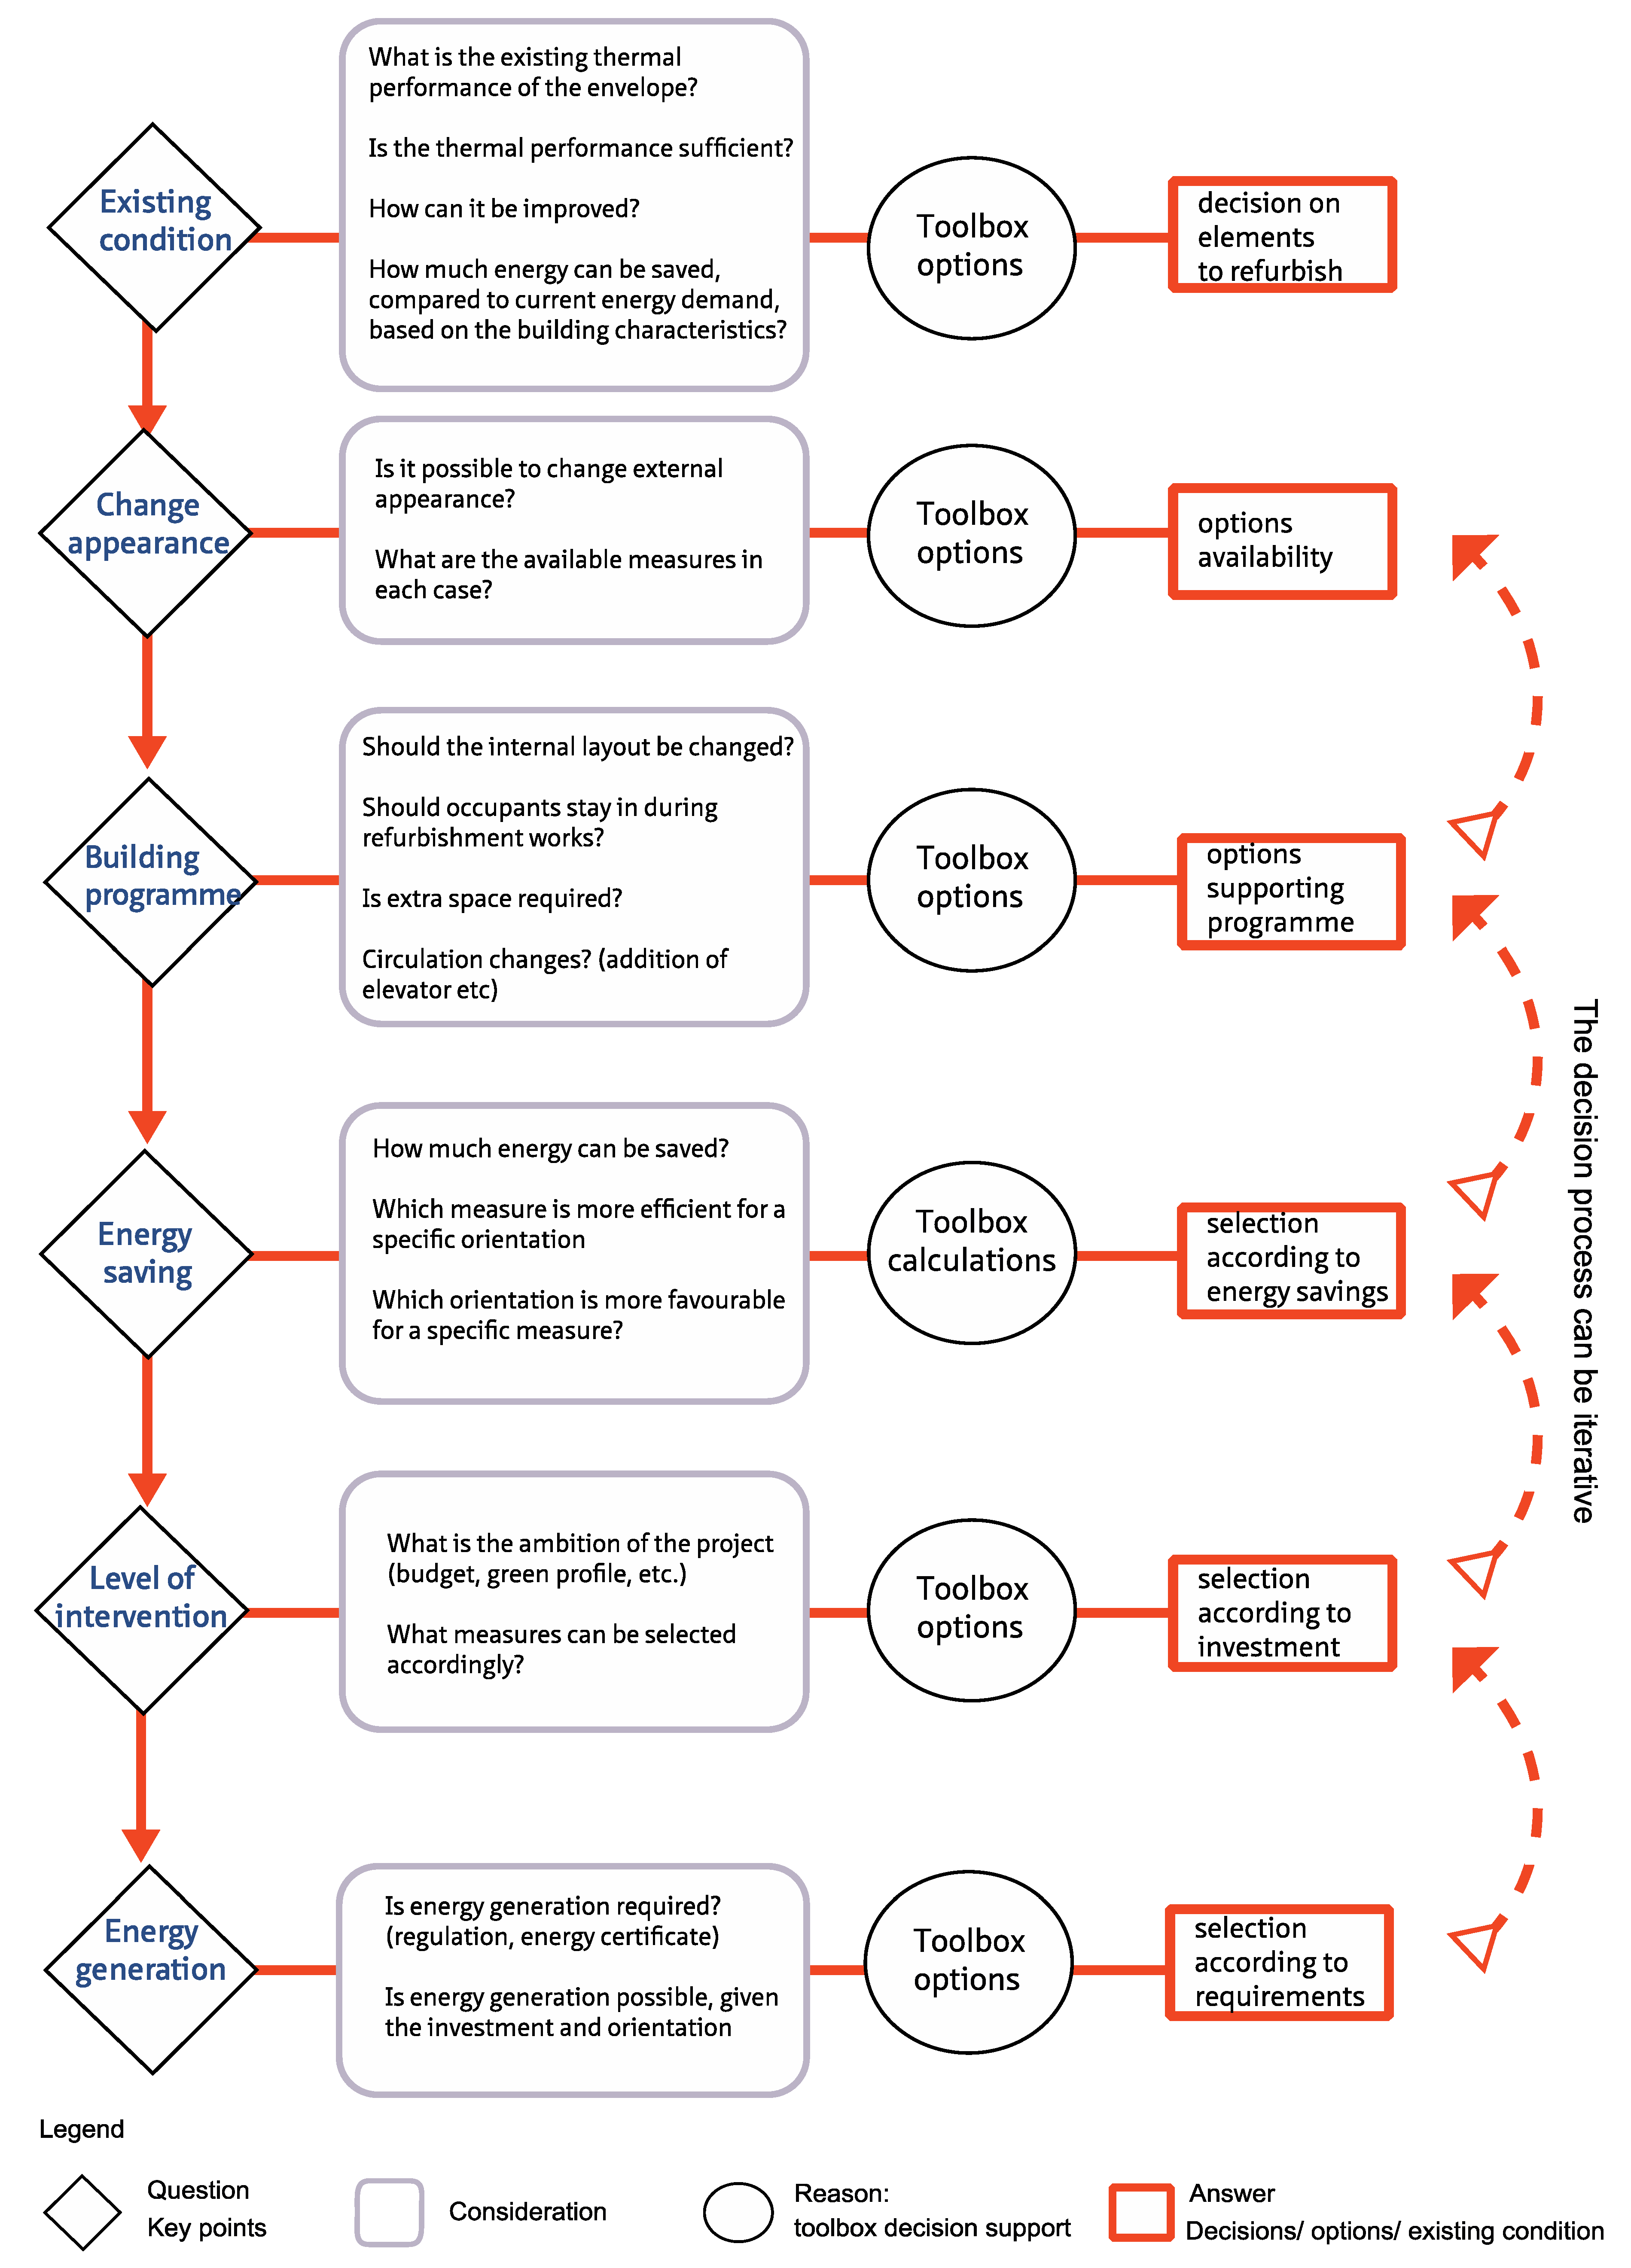
4.1. A Roadmap to Use the FRT Data

4.2. Endorsement Through Interview
| Respondents Group | No. Respondents | Influence on Design Decisions |
|---|---|---|
| Architectural students | 10 | Design development. Strategy concept. Combination of different parameters of function and performance |
| Architect/designers | 6 | |
| House owner/consumer | 2 | Initiator of refurbishment. Formulation of specification. Definitions of solution feasibility. Evaluation of final solution benefits for the user. |
| Housing association representatives | 4 | Initiator of refurbishment. Formulation of specification. Definitions of solution feasibility. Evaluation of added value of solution for the estate |
| Refurbishment contractors | 2 | Design execution. Definitions of solution feasibility |
| Energy consultant | 1 | Evaluation of energy performance. Influence on design development |
| Topic | Interview Questions | Answers/Remarks |
|---|---|---|
| Design process | 1. What are the parameters normally considered in t refurbishment project? | Improving collective spaces (entrances etc.), improve appearance, reduce vacancy of apartments. |
| Replace bathroom kitchen, interior finishing | ||
| Minimum required energy upgrade | ||
| Homeowners more concerned with energy reduction. | ||
| 2. What are the parties that take the decisions, in each phase? | Architect in design phase | |
| Client/Owner final decision | ||
| The design team provide options to the client | ||
| 3. Is the energy upgrade a requirement of the strategy? | Yes, but not the main motivation. | |
| The question of energy upgrade was not an “if” but more a “how” | ||
| Usually minimum compatibility with regulations is only needed | ||
| 4. At which point during the design process is the energy upgrade considered? | The requirement is there in the beginning and is considered again at late phase, when calculations are needed | |
| To make a decision, after several options were considered, an approximation of the effect is needed | ||
| Usability of FRT | 5. Are the approach and the information easily comprehensive? | The approach and the information are clear |
| The overview is detailed enough to provide an indication | ||
| More information about what each calculated measure means | ||
| 6. Does the toolbox database help in organizing possible options | The already known options that the toolbox confirmed | |
| Reminded of options and components to be addressed. | ||
| Helped in thinking why to do or not to do a measure. | ||
| Remind to consider the energy aspect | ||
| 7. Did you consider the overview and potential energy reduction provided by the FRT during the design phase of a current project? | Yes, for project at the early stages, e.g., in trying to convince clients to consider a measure because of the bigger potential saving | |
| 8. Regarding one of your past projects, do you believe the decisions taken would be changed due to the toolbox information? | Probably not. The selected measures have already been decided, based on specific reasons. After the concept design it is difficult to make changes in the principals of the strategy | |
| 9. What type of information would be useful for you? | The energy saving information are useful particularly if they were combined with cost | |
| 10. Do you think the information about the potential energy upgrade can help support your design decisions? | Useful arguments in discussion with the different parties involved (owners, users, constructors, services experts etc.) | |
| The energy savings need to be balanced against the cost of the measure | ||
| 11. Do the key points highlighted in the roadmap reflect considerations you have during the design process? | Can be used as a checklist to be reminded the aspect to consider. | |
| the key points are relevant., but come up with different order, not linear |
5. Conclusions
Acknowledgments
Conflicts of Interest
Appendix
A.1. Simulation Inputs
A.2. Simulation Outputs
| Living | Bedroom1 | Bedroom2 | Kitchen | Bathroom | Hall | Basement | Roof | |||||
|---|---|---|---|---|---|---|---|---|---|---|---|---|
| Zone type | Standard, conditioned | Standard, conditioned | Standard, conditioned | Standard, conditioned | Standard, conditioned | Standard, conditioned | Semi-exterior, uncondit. | Semi-exterior, uncondi. | ||||
| m2 | 19.5 | 18.4 | 13 | 7 | 5.2 | 11 | 0 | 0 | ||||
| Occupancy(nr of people) | 4 | 2 | 2 | 2 | 1 | 2 | – | – | ||||
| Density (people/m2) | 0.2 | 0.1 | 0.15 | 0.28 | 0.19 | 0.181 | 0 | 0 | ||||
| Schedule | 15–23 | 22–9 | 22–9 | 24/0.2 | 24/0.1 | 24/0.2 | n/a | |||||
| Metabolic | 0.8 | 0.8 | 0.8 | 0.8 | 0.8 | 0.8 | 0 | 0 | ||||
| Environmental Control (1) | ||||||||||||
| Heating Set-point °C | 20 | 20 | 20 | 18 | 18 | 18 | n/a | n/a | ||||
| Cooling Set-point °C | 26 | 26 | 26 | 26 | 26 | 26 | n/a | n/a | ||||
| Natural Ventilation °C | 23 | 23 | 23 | 23 | 23 | 23 | n/a | n/a | ||||
| Mechanical Ventilation | low | low | low | low | low | low | n/a | n/a | ||||
| Minimum Fresh Air (2) | ||||||||||||
| fresh air (L/s/person) | 7 | 7 | 7 | 10 | 15 | 7 | 0 | 0 | ||||
| Mechanical ventilation per area (L/s/m2) | 0.42 | 0.42 | 0.42 | 0.42 | 0.42 | 0.42 | 0 | 0 | ||||
| Lighting | ||||||||||||
| Lux (3) | 200 | 100 | 100 | 500 | 200 | 100 | ||||||
| W/m2 (4) | 9 | 9 | 9 | 9 | 9 | 4.5 | ||||||
| Equipment intern. gain W/m2 (5) | 5 | 5 | 5 | 30 | 5 | 0 | 0 | 0 | ||||
| Airtightness | ||||||||||||
| Infiltration rate m3/h per m2 ex. surface (6) | 5 | 5 | 5 | 5 | 5 | 5 | 5 | 5 | ||||
References
- Building Performance Institute Europe. Europe’s Buildings under the Microscope; Building Performance Institute Europe: Brussels, Belgium, 2011. [Google Scholar]
- European Commission. A Roadmap for Moving to a Competitive Low Carbon Economy in 2050; European Commission, DG for Energy: Brussels, Belgium, 2011. [Google Scholar]
- Gaterell, M.R.; McEvoy, M.E. The impact of climate change uncertainties on the performance of energy efficiency measures applied to dwellings. Energy Build. 2005, 37, 982–995. [Google Scholar] [CrossRef]
- Eurostat. “Consumption of Energy”—Statistics Explained. Available online: http://epp.eurostat.ec.europa.eu/statistics_explained/index.php/Consumption_of_energy (accessed on 4 August 2015).
- Rademaekers, K.; Boonekamp, P.; Harmsen, R.; Boeve, S.; Sijm, J. The Energy Efficiency Investment Potential for the Building Environment: Two Approaches; Ecorys for DG Energy: Rotterdam, The Netherlands, 2012. [Google Scholar]
- European Directive 2010/31/EU. In On the Energy Performance of Building; The European Parliament and of the Council: Brussels, Belgium, 2010.
- European Commission. Financing the Energy Renovation of Buildings with Cohesion Policy Funding; European Commission, DG for Energy: Brussels, Belgium, 2014. [Google Scholar]
- Ma, Z.; Cooper, P.; Daly, D.; Ledo, L. Existing building retrofits: Methodology and state-of-the-art. Energy Build. 2012, 55, 889–902. [Google Scholar] [CrossRef]
- Ferreira, J.; Pinheiro, M.D.; Brito, J.D. Refurbishment decision support tools: A review from a portuguese user’s perspective. Constr. Build. Mater. 2013, 49, 425–447. [Google Scholar] [CrossRef]
- Cooper, R.; Aouad, G.; Lee, A.; Wu, S.; Fleming, A.; Kagioglou, M. Process Management in Design and Construction; Blackwell Publishing Ltd: Oxford, UK, 2005. [Google Scholar]
- Industrial Advisory Ad-Hoc. Energy-Efficient Buildings PPP beyond 2013: Research & Innovation Roadmap; Energy Efficient Buildings Association: Brussels, Belgium, 2012. [Google Scholar]
- Attia, S.; Gratia, E.; de Herde, A.; Hensen, J.L.M. Simulation-based decision support tool for early stages of zero-energy building design. Energy Build. 2012, 49, 2–15. [Google Scholar] [CrossRef]
- Riether, G.; Butler, T. Simulation space. In eCAADe 2008: Architecture “in Computro”, Integrating Methods and Techniques Education and Research in Computer Aided Architectural Design in Europe; The Higher Institute of Architectural Science: Antwerp, Belgium, 2008; pp. 133–142. [Google Scholar]
- Attia, S. A Tool for Design Decision Making Zero Energy Residential Buildings in Hot Humid Climates; Université catholique de Louvain: Louvain, Belgium, 2012. [Google Scholar]
- DesignBuilder. Designbuilder; 3.0.0.064; DesignBuilder Software Ltd.: Stroud, UK, 2012. [Google Scholar]
- Flourentzou, F.; Genre, J.-L.; Roulet, C.-A. Epiqr-tobus: A new generation of refurbishment decision aid methods. In Towards Sustainable Building; Maiellaro, N., Ed.; Springer Science+Business Media: Dordrecht, The Netherlands, 2001; Volume 61, pp. 161–169. [Google Scholar]
- Typology Approach for Building Stock Energy Assessment. Typology approach for building stock energy assessment. Main results of the TABULA project—Final project Report. In First TABULA Synthesis Report; Tabula, P.T. (Ed.) Institut Wohnen und Umwelt Gmb: Darmstadt, Germany, 2012.
- Häkkinen, T. Systematic method for the sustainability analysis of refurbishment concepts of exterior walls. Constr. Build. Mater. 2012, 37, 783–790. [Google Scholar] [CrossRef]
- Sdei, A.; Tittelein, P.; Lassue, S.; McEvoy, M.E. Dynamic Thermal Modeling of Retrofitted Social Housing in England and France. In Proceedings of the CLIMA 2013: 11th REHVA World Congress and the 8th International Conference on Indoor Air Quality, Ventilation and Energy Conservation in Buildings, Prague, Czech Republic, 16–19 June 2013; Karel Kabele, M.U., Suchý, K., Lain, M., Eds.; Society of Environmental Engineering (STP): Prague, Czech Republic, 2013; p. 6882. [Google Scholar]
- Nemry, F.; Uihlein, A.; Colodel, C.M.; Wetzel, C.; Braune, A.; Wittstock, B.; Hasan, I.; Kreiflig, J.; Gallon, N.; Niemeier, S.; et al. Options to reduce the environmental impacts of residential buildings in the european union—Potential and costs. Energy Build. 2010, 42, 976–984. [Google Scholar] [CrossRef]
- Konstantinou, T.; Knaack, U. An approach to integrate energy efficiency upgrade into refurbishment design process, applied in two case-study buildings in northern european climate. Energy Build. 2013, 59, 301–309. [Google Scholar] [CrossRef]
- Building Energy Software Tools Directory. Available online: http://apps1.eere.energy.gov/buildings/tools_directory/subjects.cfm/pagename=subjects/pagename_menu=whole_building_analysis/pagename_submenu=energy_simulation (accessed on 11 March 2015).
- EN 15251 Indoor Environmental Input Parameters for Design and Assessment of Energy Performance of Buildings Addressing Indoor Air Quality, Thermal Environment, Lighting and Acoustics; European Commitee for Standardization (CEN): Brussels, Belgium, 2007.
- Itard, L.; Meijer, F. Towards a Sustainable Northern European Housing Stock; IOS Press: Amsterdam, The Netherlands, 2008; Volume 22, p. 213. [Google Scholar]
- Hegger, M.; Fuchs, M.; Stark, T.; Zeumer, M. Energy Manual: Sustainable Architecture; Birkhäuser: Basel, Switzerland, 2008. [Google Scholar]
- Boermans, T.; Petersdorff, C. U-Values for Better Energy Performance of Buildings; Ecofys by order of Eurima—European Insulation Manufacturers Association: Cologne, Germany, 2007. [Google Scholar]
- Bouwbesluit: Artikel 5.3 Thermische Isolatie. Available online: http://www.bouwbesluitonline.nl/Inhoud/docs/wet/bb2012_nvt/artikelsgewijs/hfd5/afd5-1/art5-3 (accessed on 5 June 2015).
- Anforderungen bei Änderung von Außenbauteilen und bei Errichtung Kleiner Gebäude; Randbedingungen und Maßgaben für die Bewertung Bestehender Wohngebäude. Available online: http://www.enev-online.org/enev_2009_volltext/enev_2009_anlage_03_anforderungen_aenderung_aussenbauteile.htm#Anlage 3_Nr_7._Anforderungen (accessed on 9 November 2015).
- Konstantinou, T. Facade Refurbishment Toolbox: Supporting the Design of Residential Energy Upgrades. Ph.D. Thesis, Delft University of Technology, Delft, The Netherlands, 2014. [Google Scholar]
- Lee, J.H.; Kim, H.-I.; Phaal, R. An analysis of factors improving technology roadmap credibility: A communications theory assessment of roadmapping processes. Technol. Forecast. Soc. Chang. 2012, 79, 263–280. [Google Scholar] [CrossRef]
- EN 14788 Ventilation for Buildings—Design and Dimensioning of Residential Ventilation Systems; European Standarisation Comitee (CEN): Brussels, Belgium, 2006.
- The Chartered Institution of Building Services Engineers. Guide A: Environmental Design; CISBE: London, UK, 2006. [Google Scholar]
- Peel, M.C.; Finlayson, B.L.; McMahon, T.A. Updated world map of the köppen-geiger climate classification. Hydrol. Earth Syst. Sci. 2007, 11, 1633–1644. [Google Scholar] [CrossRef]
- Kottek, M.; Grieser, J.; Beck, C.; Rudolf, B.; Rubel, F. World map of the Köppen-Geiger climate classification updated. Meteorol. Z. 2006, 15, 259–263. [Google Scholar] [CrossRef]
- ASHRAE Standard 55-2004 Thermal Environmental Conditions for Human Occupancy; American Society of Heating, Refrigerating and Air-Conditioning Engineers, Inc.: Atlanta, GA, USA, 2004.
- ISO 7730 Ergonomics of the Thermal Environment—Analytical Determination and Interpretation of Thermal Comfort Using Calculation of the PMV and PPD Indices and Local Thermal Comfort Criteria; International Organisation for Standarisation: Geneva, Switzerland, 2005.
- EN 12464-1 Light and Lighting—Lighting of Work Places—Part 1: Indoor Work Places; European Commitee for Standardization (CEN): Brussels, Belgium, 2011.
- EU GPP Criteria for Street Lighting & Traffic Signals. Available online: http://ec.europa.eu/environment/gpp/eu_gpp_criteria_en.htm (accessed on 16 November 2015).
- EN 15242 Ventilation for Buildings—Calculation Methods for the Determination of Air Flow Rates in Buildings including Infiltration; European Commitee for Standardization (CEN): Brussels, Belgium, 2007.
© 2015 by the authors; licensee MDPI, Basel, Switzerland. This article is an open access article distributed under the terms and conditions of the Creative Commons Attribution license (http://creativecommons.org/licenses/by/4.0/).
Share and Cite
Konstantinou, T. A Methodology to Support Decision-Making Towards an Energy-Efficiency Conscious Design of Residential Building Envelope Retrofitting. Buildings 2015, 5, 1221-1241. https://doi.org/10.3390/buildings5041221
Konstantinou T. A Methodology to Support Decision-Making Towards an Energy-Efficiency Conscious Design of Residential Building Envelope Retrofitting. Buildings. 2015; 5(4):1221-1241. https://doi.org/10.3390/buildings5041221
Chicago/Turabian StyleKonstantinou, Thaleia. 2015. "A Methodology to Support Decision-Making Towards an Energy-Efficiency Conscious Design of Residential Building Envelope Retrofitting" Buildings 5, no. 4: 1221-1241. https://doi.org/10.3390/buildings5041221
APA StyleKonstantinou, T. (2015). A Methodology to Support Decision-Making Towards an Energy-Efficiency Conscious Design of Residential Building Envelope Retrofitting. Buildings, 5(4), 1221-1241. https://doi.org/10.3390/buildings5041221