1. Introduction
The Indonesian Standardization Board (BSN) issued one of its national standards on Building Energy Conservation, SNI 6390:2011 [
1], contains a standard for thermal comfort. This standard states a single comfort temperature should be applied in any building throughout the whole country. The designed comfort temperature is 25.5 °C
Ta, with the range of +1.5 °C
Ta, and relative humidity of 60% + 5% for a workplace. For semi outdoor spaces, like lobbies or transient areas, the designed comfort temperature is 28.5 + 1.5 °C
Ta and relative humidity (RH) 60% + 10%. This standard neglects some results of previous comfort studies in Indonesia, which showed that people lived in the big cities, such as Jakarta, were comfortable at temperatures of about 27 to 28 °C, with a comfort range more or less between 1 and 2 °C higher and lower than the comfort temperature. These figures show that the current Indonesian standard has provided lower temperatures, and this could lead to a higher cooling energy in the building and creating a cool uncomfortable indoor environment. Finding a more appropriate standard or a guideline for Indonesian comfort temperature will help any air conditioning (AC) building in this country to minimize its cooling energy.
As a big country with various ambient temperatures, Indonesia needs an appropriate comfort temperature predictor, which can predict comfort temperature requirements of a group of people in any given location across the country. Towns and cities in Indonesia are mostly located either in the lowlands (coastal area) or in the highlands. In the lowland areas, the monthly mean temperature is about 28 °C with the mean of RH of about 78%, while in the highland, the monthly mean temperature is around 24 °C, or even lower, with the mean of RH of about 82% [
2].
Recent comfort studies conducted in different buildings and in different coastal cities, which were conducted by Alfata
et al. in 2012 [
3], Sulistiawan in 2014 [
4], Sri in 2014 [
5], and Triswanti in 2014 [
6], showed that subjects’ neutral (comfort) temperatures were about 27 to 28 °C. These figures were about 1.5 to 2.5 °C higher than the current Indonesian comfort standard. However, recent studies by Karyono
et al. in 2014 [
7], showed that two groups of subjects of Jakarta university students were comfortable at lower temperatures of 24.3 °C and 24.9 °C, respectively, and it was predictably caused by the human adaptation of being exposed to the AC buildings for quite a long time.
Previous thermal comfort studies in various locations and in various ambient temperatures in the world showed some differences in subject comfort temperatures due to bodily adaptation to the surrounding climates. The difference seems to have a correlation with the ambient temperatures where the people live. The Jakarta’s comfort study done by Karyono [
8,
9,
10] showed that subjects felt comfortable in higher indoor temperatures than those recommended by the Western standards such as ISO 7730 [
11]. On average, Jakarta’s subjects felt comfortable at about 2 °C higher than the temperature suggested by Fanger’s predicted mean votes (PMVs) model [
9,
12] and 1 °C higher than the current Indonesian standard. The lower temperatures standardized by the current Indonesian standard would affect to the increase of energy consumption in the building. Putting the indoor temperature of 1 to 2 °C higher than the current Indonesian standard [
1] or ASHRAE-55 1992 [
13], in which many of the Indonesian building engineers are still applying this standard, would reduce the building’s cooling energy by about 10%–20%, while, at the same time, helping buildings to improve their indoor thermal environment. Assessing some studies conducted by a number of researchers in some South East Asian countries, Karyono found that the comfort range of all the subjects living in this region was between 20 and 31 °C, which is higher than the average comfort range of people living in temperate (cold) climates [
14].
de Dear and Brager established a new adaptive ASHRAE thermal comfort standard by reanalyzing data of thermal comfort studies across the world [
15,
16]. From the analyses, it was found that comfort temperatures tend to have a correlation with the average monthly temperature at any given location. Some studies by Humphreys and Nicol [
17] showed that there is a correlation between comfort temperature and the mean outdoor temperature. Humphreys [
18] derived a linear relationship between comfort temperature and mean outdoor temperature for NV buildings as:
where
Tc is the comfort temperature and
To is the mean outdoor temperature.
This study is an initial attempt to find a better comfort temperature predictor for Indonesia. Rather than using the current static standard of the SNI 6390:2011 [
1], this paper proposes an adaptive approach to improve the Indonesian comfort standard. The proposed thermal comfort predictor is expected to be more appropriate and reliable in predicting the comfort temperature of Indonesian people living in various locations with various average daily temperatures.
Other than air temperature (Ta), a number of comfort indices, which are commonly used to express the degrees of warmth in any thermal environment, are Effective Temperature (ET), Corrected Effective Temperature (CET), operative temperature (To), Standard Effective Temperature (SET), and humidex (Humidity Index).
Houghton and Yaglou [
19] developed the thermal index of ET as a combined effect of air temperature, humidity, and air velocity; they improve the reliability of the index by introducing CET, as a combined effect of the mean radiant temperature, humidity and air velocity. These indices produce a better and more accurate value of warmth compared to air temperature. Operative temperature (
To), a combination effect of air temperature, meant radiant temperature and air velocity, is commonly used as a thermal index today, particularly by some widely-known comfort standard organizations like the International Organization for Standardization (ISO), European Standard (EN) and American Society of Heating, Refrigerating and Air-Conditioning Engineers (ASHRAE).
However, SET is perhaps the most reliable index to express the warmness of a thermal environment since it takes into account all six parameters affecting the thermal sensation: air temperature, meant radiant temperature, humidity, air velocity, metabolic rate, and clothing value. On the other hand, the humidex, the lesser-known thermal index, is a temperature–humidity index, which takes into account the combination effect of air temperature and humidity. This index was introduced in 1979 by Masterson and Richardson and was initially used for weather forecasting in Canada [
20].
Although it is less comprehensive, in general, air temperature is the most common index to be used in practice to express the warmness of the environment, as it is easy to measure and is directly associated with the warmth. Moreover, amongst others thermal indexes, air temperature is the most comparable index, as a number of previous thermal comfort studies used it to express comfort temperatures of a group of people in many parts of the world.
2. Methods
A comfort temperature in any given location in Indonesia is predicted to be a function of its average daily ambient temperature, as many studies show [
15,
16,
17].
A comfort equation is derived from a regression line of comfort temperatures on the average daily temperatures from previous studies. By correlating comfort temperatures found in the previous comfort studies, and the average daily temperatures in which the studies were taken place, a simple linear regression equation is derived from it. The average daily temperature, which is fairly close to the average monthly temperature, is used as an independent variable, which will affect the value of the predicted comfort temperatures (PCT) at any given location.
By correlating the comfort temperatures and the average daily temperatures of the previous studies, a predicted comfort temperature is derived. A table which depicts the average daily temperature and its comfort temperature in a particular location (town) is drawn and used to construct a regression line of the Indonesian thermal comfort predictor.
To find out the PCT, a linear regression analyses were conducted by using Microsoft Office Excel 2007, while the statistical test were analyzed by SPSS version 17 (IBM, Armonk, New York, USA).
Located on the equator belt between 6° North and 11° South latitudes, the mean temperature variation throughout time is, relatively, very small. Using daily temperature rather than the monthly or running temperature as the independent variable is easier. People commonly use daily air temperature as a parameter to express the degree of warmth in a particular place and time.
The proposed comfort predictor is likely to have a limitation on its application since there is a limited variation of the average daily temperatures covered by the previous comfort studies. All of the previous comfort studies were mostly done in the big cities, which are mostly located in lowland or coastal areas, with high average daily temperatures. The only exception was the comfort study in Bandung, a city located in the highlands, in which the average daily temperature is relatively low.
The proposed thermal comfort predictor is likely to be applicable only to predict comfort temperatures of people living in the region, with average daily temperatures of between 24 and 29 °C, where previous comfort studies have been conducted. However, this study is only an initial step to develop a further broad range of air temperature variations in Indonesia, so that more places and towns across the country will be covered. Below are brief discussions on some previous thermal comfort studies that are used to construct a comfort predictor equation.
2.1. Thermal Comfort Studies of Office Workers in Multi-Story Office Buildings in Jakarta, Indonesia
This study was done in 1993 [
8], involving some of 596 office workers working in seven office buildings, namely AG (Agama building), BP (BPPT building), BC (BCA building), EC (Education and Culture Ministry building), LI (LIPI building), PA (Pajak building) and WI (Widjojo building), as subjects. Thermal responses, based on the seven-point scale: cold (−3), cool (−2), slightly cool (−1), neutral (0), slightly warm (+1), warm (+2) and hot (+3), were collected from all the subjects. While subjects were given comfort votes questionnaires, indoor climatic parameters,
i.e., air temperature (
Ta), operative temperature (
To), and relative humidity (RH), were measured by means of Thermal Comfort Meter BK 1212 and a thermo-hygrometer. All the measurements were carried out during the office hours between 10:00 a.m. and 4:00 p.m. The neutral (comfort) temperature of the subjects was found to be 26.4 °C
Ta [
8].
2.2. Thermal Comfort Studies in Jogja, Indonesia
Feriadi [
21] conducted a comfort study in a number of settlements in the town of Jogja between 2000 and 2001. Some 525 comfort votes were collected from the same number of people living in these settlements. The average daily temperature in this town was 29 °C and the comfort temperature of the subjects was 29.1 °C
Ta.
2.3. Thermal Comfort Studies of College-Aged Students in Bandung, Indonesia
This study was carried out in October 2005 at the School of Architecture, Institute of Technology Bandung (ITB). Bandung is located at 7° South Latitude and situated at about 700 m above sea level. Twenty participants, ten males and ten female students, were voluntarily studied for their subjective thermal responses. A longitudinal thermal comfort survey was conducted, providing two hundred sets of data. A number of instruments were used to measure indoor climatic parameters during the study. Results from the study showed that subjects’ neutral temperature was 24.7 °C in terms of air temperature, which was about 1.7 °C lower than Jakarta’s comfort temperature (26.4 °C). In terms of comfort range (based on 80% satisfaction), subjects were still comfortable between 21.3 °C and 28.2 °C, which was about 2 °C lower than Jakarta (between 23.3 °C and 29.5 °C) [
22].
2.4. Thermal Comfort Studies of Office Workers in Medan, Jakarta, Surabaya, and Makassar, Indonesia
In 2012, Alfata
et al. [
3] of the Research Centre for Building and Settlement, the Indonesian Ministry of Public Works, conducted a thermal comfort study in four different office buildings in four Indonesian major cities: Medan, Jakarta, Surabaya, and Makassar. All of these cities are located in the coastal area, having temperatures of between 24 and 34 °C, with an average of 28 and 28.5 °C. Four climatic parameters: air temperature, globe temperature, relative humidity, and air velocity were measured using Fortemp equipment and a digital anemometer. Subjects’ comfort votes were measured with the seven-point scale thermal sensation vote.
This comfort study was done in a government building. Comfort votes were collected from 111 office workers. With an average daily temperature of 28 °C, subjects’ thermal comfort was found to be 27.9 °C Ta. The next study was done in Jakarta, involving 169 subjects, who were office workers. With an average daily temperature of 28 °C, the subjects were comfortable at 26.6 °C. The following study was in Surabaya, involving 110 office workers, working in a government building. With an average daily temperature of 28.5 °C, subjects were comfortable at 28.9 °C. The last study was done in Makassar. 109 office workers were involved in this study. With an average daily temperature of 28.5 °C, subjects were comfortable at 27.7 °C.
2.5. Thermal Comfort Studies of Students in Tarumanagara University (Untar), Jakarta, Indonesia
This thermal comfort study was conducted by Karyono and Heryanto in Untar in 2013, using a classroom, which was slightly modified to resemble a climate chamber. Using a longitudinal method of surveys, 468 comfort votes were collected from 54 subjects; consisting of 30 male and 24 female undergraduate students. The comfort temperature of the subjects was found to be 24.1 °C. The average daily temperature in this area is about 28.5 °C [
7].
2.6. Thermal Comfort Studies of Students in Mercu Buana University (UMB), Jakarta, Indonesia
This thermal comfort study at UMB was conducted by Faridah and Karyono in 2013. This study used a classroom as a climate chamber, as in Untar, in which 36 undergraduate students, 20 males and 16 females were involved as the subjects. Some of 432 thermal votes were collected during the longitudinal surveys. Subjects were comfortable at 24.9 °C [
7].
2.7. Thermal Comfort Studies of Visitors at Mandiri Bank Museum, Jakarta, Indonesia
A thermal comfort study was conducted by Sulistiawan and Karyono in a free running museum building of Mandiri Bank in Jakarta in 2014. There were 77 visitors to the museum, consisting of 36 males and 41 females, involved as subjects in this study. The comfort temperature of the subjects was found to be 27.7 °C [
4].
2.8. Thermal Comfort Studies of Visitors at Jakarta Cathedral, Indonesia
Another thermal comfort study was conducted by Sri and Karyono in a free running Chatedral building in Jakarta in 2014. There were 70 Cathedral attendees, consisting of 35 males and 35 females, involved as subjects in this study. The comfort temperature of the subjects was found to be 27.7 °C [
5].
2.9. Thermal Comfort Studied of Market Users in West Jakarta, Indonesia
A thermal comfort study was conducted by Triswanti and Karyono in a naturally ventilated (NV market building in West Jakarta in 2014. There were 72 market customers, consisting of 23 males and 49 females, involved as subjects in this study. The comfort temperature of the subjects was found to be 27.3 °C [
6].
3. Results and Discussion
Table 1 shows detail of thermal comfort studies, which have been recorded in Indonesia. It is predicted that there is a correlation between the values of comfort temperature and the average daily temperature at every location or town where the study was conducted. In order to see whether there is a correlation between the above variables a regression line is constructed.
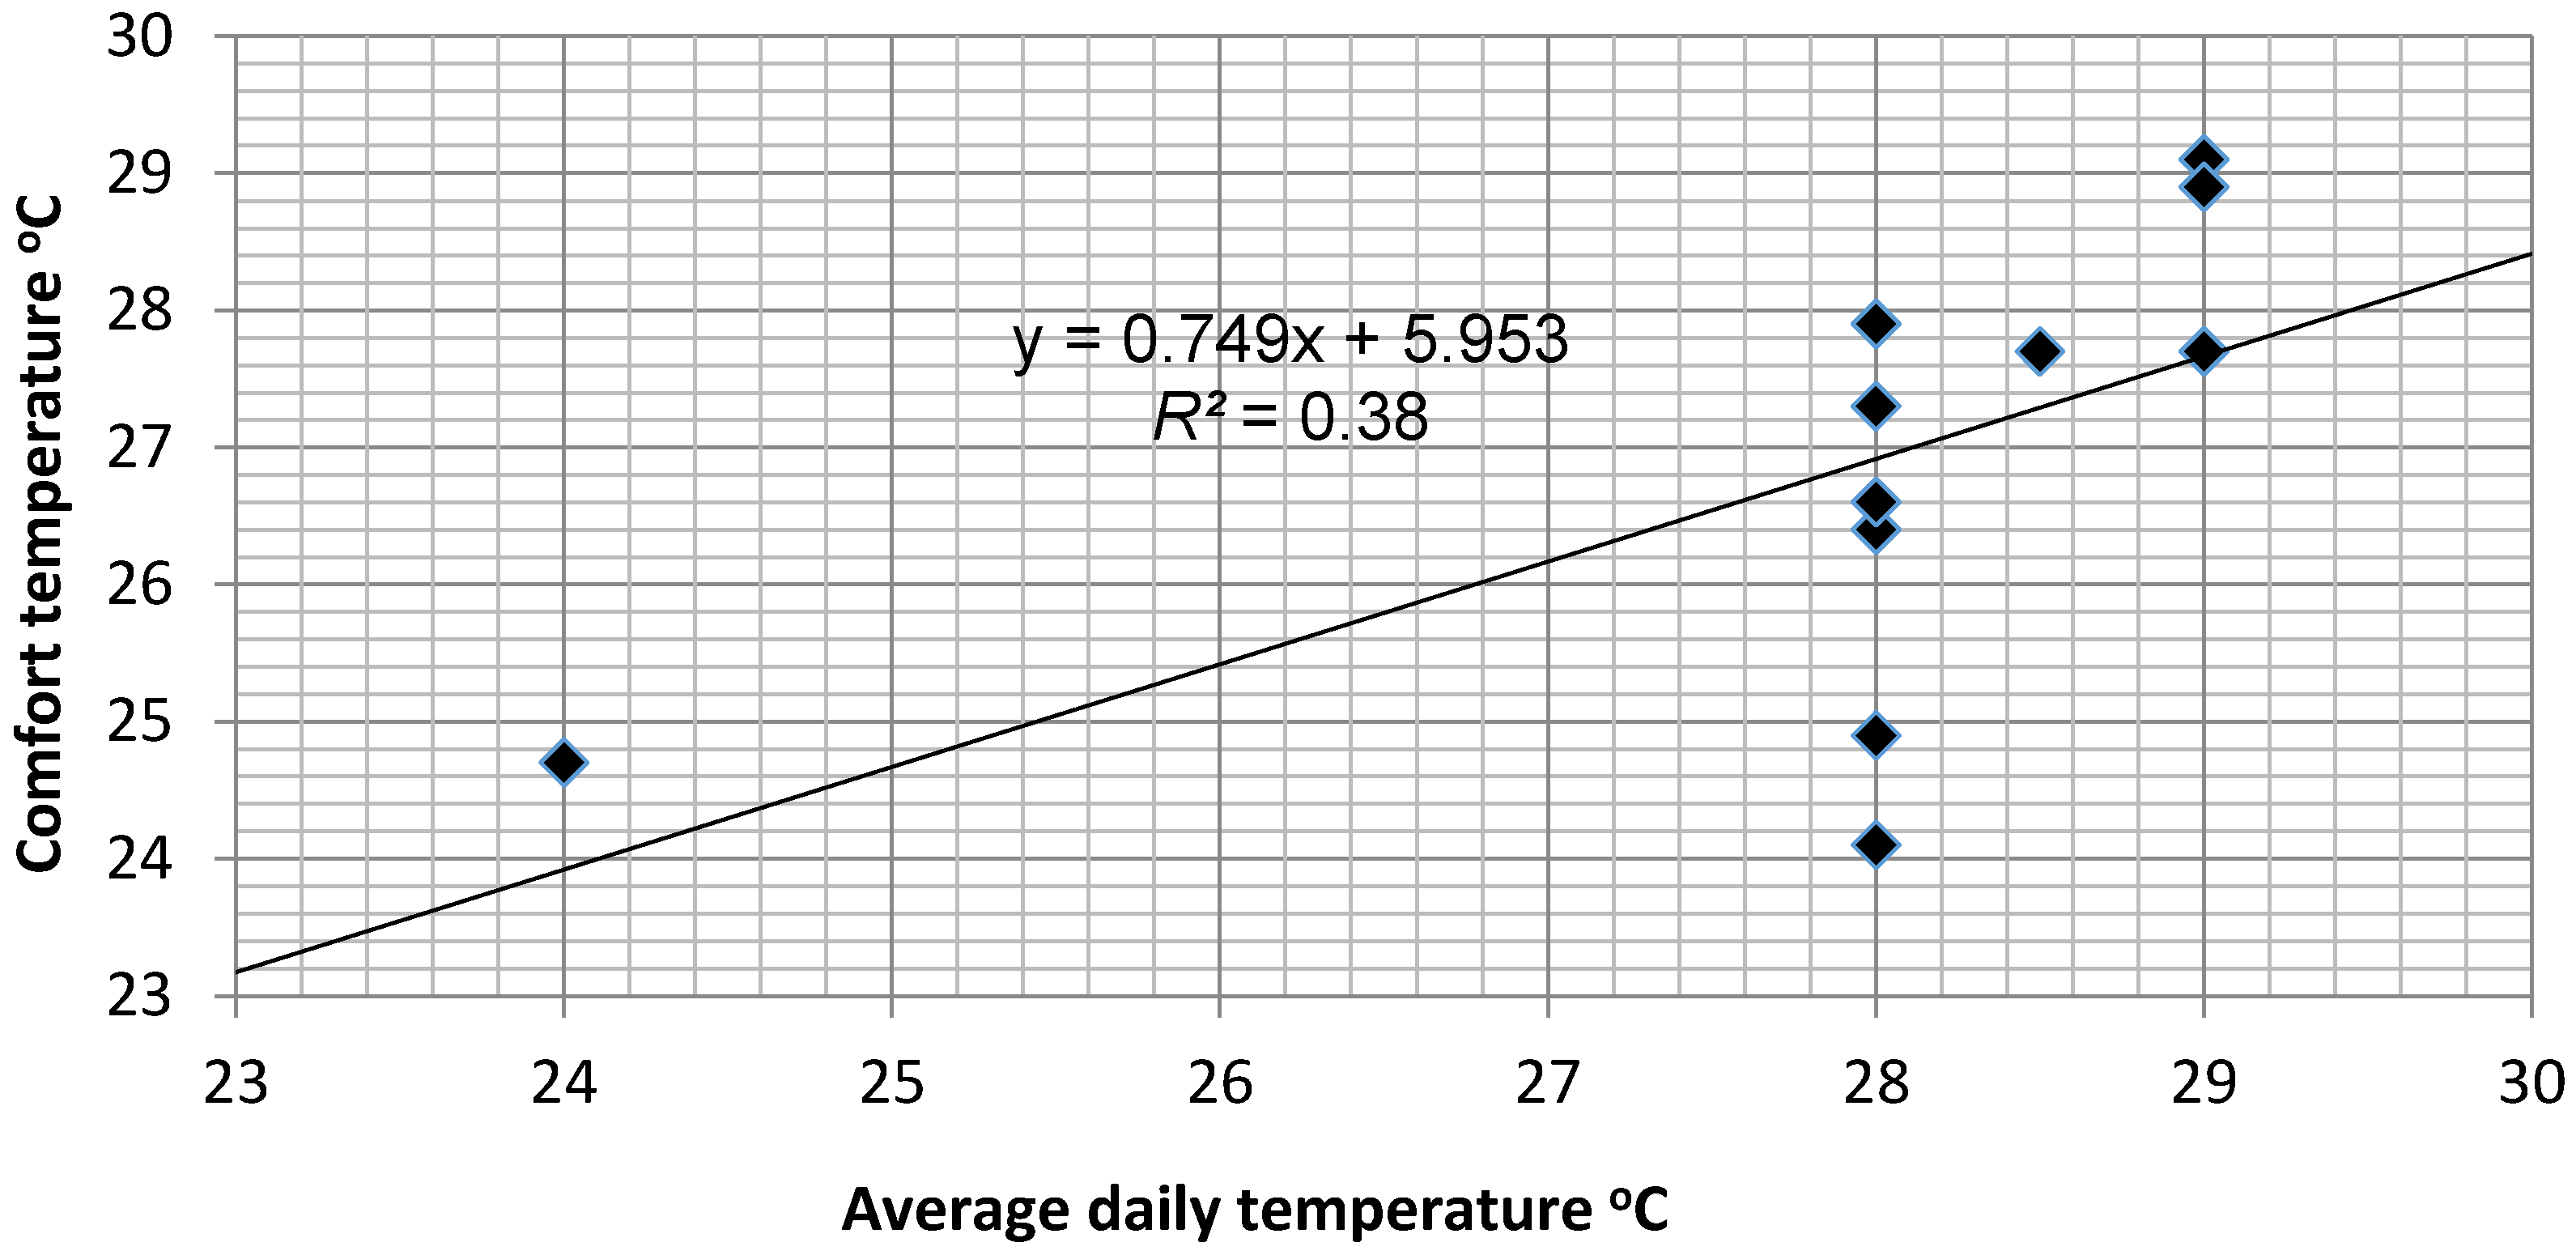
Figure 1 shows that by plotting comfort temperatures on the mean daily outdoor temperature from some previous comfort studies (
Table 1), a regression equation of predicted comfort temperature (PCT) on the mean daily outdoor temperature was found to be:
PCT is the predicted comfort temperature and Td is the average daily outdoor temperature. The coefficient determination of R2 = 0.38 (r = 0.61), and the regression is significant at a 95% confidence level.
Table 1.
Data from previous thermal comfort studies done in Indonesia.
Table 1.
Data from previous thermal comfort studies done in Indonesia.
| No | Year of study | Researcher (s) | Location | Type of building | Data collection technique | Type of subject | No of subject | No of thermal comfort vote | Mean daily temp. ( °C) | Comfort temp. ( °C Ta) |
|---|
| 1 | 1991–1993 | Karyono | South Jakarta | Offices | Transverse | Office workers | 596 | 596 | 28 | 26.4 |
| 2 | 2000–2001 | Feriadi-Wong | Yogya | Dwellings | Transverse | Dwellers | 525 | 525 | 29 | 29.1* |
| 3 | 2005–2006 | Karyono | Bandung | Classroom | Longitudinal | Students | 20 | 200 | 24 | 24.7 |
| 4 | 2012 | Alfata, Sujatmiko-Widyahantari | Medan | Office | Transverse | Office workers | 111 | 111 | 28 | 27.9 |
| 5 | 2012 | Alfata, Sujatmiko-Widyahantari | South Jakarta | Office | Transverse | Office workers | 169 | 169 | 28 | 26.6 |
| 6 | 2012 | Alfata, Sujatmiko-Widyahantari | Surabaya | Office | Transverse | Office workers | 110 | 110 | 29 | 28.9 |
| 7 | 2012 | Alfata, Sujatmiko-Widyahantari | Makassar | Office | Transverse | Office workers | 109 | 109 | 29 | 27.7 |
| 8 | 2013 | Karyono-Heryanto | West Jakarta | Classroom | Longitudinal | Undergraduate students | 54 | 468 | 28 | 24.1 |
| 9 | 2013 | Faridah-Karyono | South Jakarta | Classroom | Longitudinal | Undergraduate students | 36 | 432 | 28 | 24.9 |
| 10 | 2014 | Sulistiawan-Karyono | North Jakarta | Museum | Transverse | Various | 77 | 77 | 28.5 | 27.7 |
| 11 | 2014 | Sri-Karyono | Central Jakarta | Cathedral | Transverse | Various | 70 | 70 | 28.5 | 27.7 |
| 12 | 2014 | Triswanti-Karyono | West Jakarta | Market | Transverse | Various | 72 | 72 | 28 | 27.3 |
Figure 1.
Comfort temperature line generated from some previous comfort studies in Indonesia.
Figure 1.
Comfort temperature line generated from some previous comfort studies in Indonesia.
In general, the variations of the average daily temperatures from the previous studies’ locations were limited as 24 °C (Bandung), 28 °C (South and West Jakarta), 28.5 °C (Central and North Jakarta), and 29 °C (Makassar, Surabaya, Yogya). Therefore, the equation generated in this study tends to be limited in its application. The PCT tends to be reliable to be used for locations with a range of average daily temperature of between 24 and 29 °C. Although it is unlikely that there is a town in Indonesia with an average daily temperature higher than 29 °C, it is not yet known whether the proposed PCT equation would work properly for people living in a lower temperature than 24 °C.
Some areas of Indonesia possess average daily temperatures lower than 24 °C (Bandung). As with some villages in the Dieng Plateau, Central Java, they have quite low average daily temperatures of about 13 to 15 °C [
23]. There would be a question regarding the comfort temperature of these people living in this area. Since adaptation involves the way people wear their clothes, a lower temperature would make people wear thicker clothes. In addition to the metabolic rate adaptation, clothing adjustment would help people to be comfortable at a lower temperature.
Using the comfort equation of PCT = 0.749
Td + 5.953, a comfort temperature for any given location with any given average daily temperature of between 24 and 29 °C can be predicted. For example, in a location where the average daily temperature is 28 °C,such as Southern Jakarta (the range of daily temperatures is between 24 and 32 °C or between 23 and 33 °C), the comfort temperature in this location would be 26.9 °C. In some of the big Indonesian coastal cities, the average daily temperature is 28.5 °C (the range of daily temperatures is between 24 and 33 or 23 and 34 °C), the comfort temperature of people living in this location would be 27.3 °C. On the other hand, some cities in the highland areas, such as Bandung and Malang, the average daily temperature is 24 °C (the range of daily temperatures is between 20 and 28 °C or 18 and 30 °C), the comfort temperature would be 23.9 °C.Although the application of the initial PCT would be limited to a particular range of temperatures, between 24 and 29 °C, this comfort predictor is likely still a better tool in predicting a comfort temperature in a certain location than the current Indonesia comfort standard [
1]. The current Indonesian standard was formulated without any scientific base. It was derived from the previous standard, which was purely adopted from the old American standard [
10] by adding the value from 24 °C to 25.5 °C, considering the wide range of critics that believe Indonesians should have a higher comfort temperature than stated in the American standard.
Comparing the predicted comfort equation with a Humphreys’ equation for NV buildings (Equation (1)), this equation has a higher slope with a lower intercept. Since the equation is derived from mix-mode buildings it is likely that the effect of the average daily temperature (Td) on the comfort temperature is stronger than if the equation were derived from the NV buildings only.
Some comfort studies discussed the importance of humidity in establishing a thermal comfort environment in buildings, particularly in warm and humid climates [
24]. Combining the effect of air temperature and humidity, humidex is used to measure human thermal comfort. This proposed comfort temperature predictor, however, does not take into account the effects of humidity on predicting comfort temperature. Almost all Indonesian regions have no significant difference in their humidity levels, as they are in a warm and humid tropical climate, regardless of locations, whether in the coastal or mountainous areas. The only differences regarding the thermal environment are the air temperature and, slightly, the air velocity. Since the air velocity very much depends on the enclosure of the space, in a building, the difference would be mainly caused by the size of wall openings. Moreover, providing air temperature as a unit of thermal measurement scale would be easier to use for anybody concerned, as it is easy to find the equipment used to measure it in any location, and it is quite common for people to use it.
Compared to the Japanese recommendation of setting indoor temperature to 28 °C in the hot and humid summer season [
25], the Indonesian comfort temperature prediction is lower. There is no report regarding if the Japanese are comfortable enough with this temperature since there has been no field survey conducted in this matter. In order to minimize the energy expenditure in buildings in hot climate or hot weather, setting a high indoor temperature would be a good strategy. This proposed comfort temperature predictor is not only concerned with reducing the building energy, but also considering the thermal satisfaction of the buildings’ occupants.
4. Conclusions
A simple equation is formulated as a means to predict the comfort temperature of people in any given location, with the range of the average daily temperature of between 24 and 29 °C. The equation is constructed based on the linear regression of comfortable temperatures on the average daily temperature in a number of towns in Indonesia.
As an initial step to build a more reliable and appropriate comfort-temperature predictor in a wider range of air temperature variations in Indonesia, this proposed,simple comfort predictor is limited in its application to a certain range of average daily temperatures, between 24 and 29 °C. A further study will be conducted in locations with more extreme conditions, such as warmer and cooler. Since there might be no towns with a daily average temperature higher than 29 °C, a further study might be focused on a location with a mean daily temperature of below 24 °C. In this case, the regression line is predicted to not be perfectly linear, as the capability of the human body to adapt to the surrounding climate is limited. Below a certain degree of extreme temperatures, the human body might not be able to adjust naturally, without additional means, to their surrounding environments; therefore, in this case, the comfort temperature may no longer be a linear function of the daily temperature.


