1. Introduction
A considerable proportion of European Union (EU) policies in recent years is focused on addressing and supporting effective strategies in response to the long term challenges of climate change and resource constraints which involve and will involve the built environment much more in the future as Directive 2012/27/EU and Sustainable Development Commission (2010). As reported in the European Council conclusions of 10 June 2011 on the Energy Efficiency Plan 2011, “buildings represent 40% of the EU’s final energy consumption” at EU level. If added to the energy consumption from industry then the aggregated energy demand and related greenhouse gas (GHG) emissions for the built environment rise at two-thirds of the total.
In order to meet the energy demand and carbon reduction target envisaged by EU Directives, intensive and strategic renovation and retrofit actions are required to support the transition of the built environment to low carbon according to the principles and goals of Roadmap to 2050. Unfortunately, the current average rate of turnover of the building stock across EU is very slow, under 2% [
1] while renovation and refurbishment rates are between 3% and 5% in housing stock and between 3% and 8% for commercial buildings (depending on the sector with a very different distribution across the Member States). The largest part (46%) of the EU housing stock was built between the end of the Second World War and the 1970s. Being more than 40 years old, it is starting to show the effects of its material and structural obsolescence as well as the limits of out-dated construction solutions [
2]. If the housing stock built during the 1980s and the 1990s is also considered, then around 80% of the total housing stock is totally or partially inadequate in meeting the current standards in terms of thermal behaviour, energy efficiency, quality and comfort [
3] (It has to be noted the considered studies provide a picture of the building stock at EU level, however, at construction time, there were remarkable differences in Europe especially for what concerns the Eastern European Countries and the former Communist bloc nations). For these reasons, the study will focus on residential buildings and will not include non-residential buildings whose energy demand is quite different and requires contrasting approaches. Not surprisingly, there has been much research addressing this issue. The majority of work to date focuses on innovative technological solutions and retrofit strategies aimed at improving the quality and the performance of existing buildings by integrating a range of active and passive techniques to facilitate energy reduction in buildings [
4]. In addition there have been a wide range of policies and measures to support the transition at an urban scale [
5], but relatively little attention has been given to the connections between the achievable energy savings and the energy investment needed to pursue the renovation process and to how technological choices can impact on the energy balance according to a multi-criteria perspective. Comprehensive studies comparing the effects of material choices on different energy components and on related expected indoor and outdoor environmental conditions are still limited in the literature [
6,
7,
8]. On the whole, both research and policy have been mostly focused on the development of very specific solutions to a stated question rather than on the emerging connections between interrelated factors.
It could also be argued that most retrofitting techniques are aimed at reducing thermal dispersion through the building envelope in order to optimise indoor comfort conditions and reduce the energy demand for heating during winter time: less attention has been paid to what happens during the summer [
9] when overheating usually requires the use of cooling systems for ensuring optimal indoor conditions [
10]. In order to avoid overheating during summer, while optimising performances and passive gains during winter, a number of over-cladding options can be adopted as thermal buffer zones which require very specific assessment and calculation methods to measure the impacts on energy demand and related impacts.
As external urban environments become warmer, more work will be required to deal with envelope performance in hot conditions but also the connected effect on external urban environments [
11]. These are impacted by a number of anthropogenic activities, including air conditioning units and the performance of cladding. These effects will become more acute with change of climate [
12] and the “urban heat island” (UHI) effect. UHI is a climatic phenomenon where urban areas have higher air temperature than their rural surroundings as a result of anthropogenic modifications of land surfaces, pattern of urban fabric, building arrangement, significant energy use and its consequent generation of waste heat [
11]. A UHI can be visualized as a dome of stagnant warm air with a steady but weaker horizontal gradient of increasing temperature towards the heavily built-up areas of cities [
13]. As UHI and the effects of climate change on urban fabric become ever more evidenced, it is increasingly important to see the imperative of retrofit as less of a singular technical solution to individual buildings or envelope conditions, and more of a problem that calls for holistic technical solutions for long-term environmental solutions to existing building stock and their surrounding external spaces.
The focus of the authors’ research deals with coupling the energy efficiency goals, typical of building refurbishment, and a wider approach to energy balance in the expected life cycle of renovated buildings capable to consider both the running energy topic and the required energy investment for delivering the renovation. The study aims at investigating how alternative design criteria, technological or infrastructure solutions and material choices influence the energy balance and the environmental conditions. The main goal is to illustrate one way to bring together a small number of the interconnected issues that contribute to long-term environmental solutions to urban environments in a warming world. It challenges other methodologies that prioritise the singularity of disciplines. Central to the approach is a comparison of the energy components with an evaluation of the impacts that each retrofit option has on indoor and outdoor environments.
2. Methodology, Analysis and Results
This paper reports the methodology and the findings of an ongoing study into adaptive-mitigative strategies in renovation at building and urban scale. Climate change is assumed as a key driver for addressing transition processes and this study particularly focuses on the notion of changing during the time, considering the buildings will potentially be required to adapt to different climate scenario [
14,
15] in the future. Therefore the investigated renovation options are preferentially based on dry and assembled construction in order to over-clad existing buildings and to allow future upgrade or downgrade according to the boundary conditions.
When a retrofitting intervention is under evaluation, the main goal of the design phase is usually to find out the most effective solutions according to the specific site conditions and to the building under renovation in order to obtain the expected energy savings and significant improvements in terms of energy behaviour during operation. This study assumes the achievement of specific energy performance target as constant (fitting at least to a pre-defined level of 25 kWh/(m2·year), that fulfil a top rating threshold in several national regulations) while exploring how different technologies and design solutions to building envelopes contribute to the reduction of the heat gains in urban environments and how appropriate adaptive strategies can impact in terms of required energy investment (The study focuses on the energy investment and on embodied energy and doesn’t include the related CO2 that is according to the energy grid or system by each country). The study focuses on the technical solution to be adopted for achieving high energy performance working on the building envelope cross section but it doesn’t include the definition of the power unit, the heating unit, the mechanical ventilation and other equipment or devices that contribute to potentially achieve the passive house standards.
As the results may be very different according to the sites and the climatic conditions, the study focuses on defining a methodology suitable to be adopted in different built environments; adapting its structure according to some recurring parameters that are the main objective of the investigation.
The developed methodology is based on the following sections:
Case study set up and boundary conditions assumed: The first stage of the process is aimed at setting up the main features of the site, climate conditions, orientation and exposure, wind directions, pattern and arrangement of the involved buildings and at defining current building performance level before renovation in order to draft a clear picture of the context and of boundaries conditions. All the collected data, are used for modelling each specific case study to obtain a reliable tool where the different scenarios can be simulated and envisaged technological solutions and retrofitting strategies can be tested.
Renovation options, technological choices and energy savings: Once baseline and boundaries conditions are defined, a number of technological solutions can be adopted to pursue the retrofitting action and specifically to implement the building envelope. Some alternative renovation options are outlined combining different materials and patterns according to an expected lifespan in order to achieve optimal service conditions and the targeted energy savings.
Energy investment evaluation and amortization time: In order to have a wider vision of the energy balance, the amount of energy invested to obtain each technological option is assessed: an energy life cycle analysis is performed. An expected lifespan after renovation is defined in order to estimate the amortization quota per year and compare the yearly energy investment rate with the obtained yearly energy savings during operating.
Impacts of technological choices on microclimate: Each technological option produces different effects in terms of outdoor conditions depending on the materials used for the building envelope surface, their features and their pattern. Therefore the impacts of each envisaged renovation option are discussed.
Financial evaluation: As budget constraints usually influence the choice of materials and components in addition to technological solutions, an adequate payback time is a key factor in driving the development of each strategy. Therefore a financial evaluation is needed to assess and compare the feasibility of each option.
The description of this multi-criteria methodological approach is supported by a case study, developed in order to provide an example of inter-relation and interaction among the different factors involved in the renovation process.
2.1. Case Study Set up and Boundary Conditions Assumed
Several urban sites across Europe were considered and an extensive literature review was performed in order to select a number of potential case studies to test the proposed methodology. Among them some categories, including typological, morphological and technological criteria, environmental conditions, etc., were defined to point out the most recurring situations and the key elements to be investigated. A case study based on the specific condition of London was set up to perform some simulations and analysis aimed at exploring how different technologies and design solutions for building envelopes; contribute to the reduction of the heat gains in urban environments and how appropriate adaptive strategies can further mitigate against accelerated greenhouse emissions. The case study reproduces very standard and common conditions as one of the main goals of the study is to test its viability in the ordinary market in order to support design and decision- making processes according to real and frequent situations.
The study focuses on a portion of a large neighbourhood composed of a great number of buildings arranged according to a sequence of rows including a number of typologies aggregated in order to create some courts and small green areas. Most of the surfaces of containment, mainly referred to the building façades and the paved streets, are made of waterproof materials such as concrete or asphalt (that negatively contributes to the outdoor microclimate). The main geographical and climatic data summarised in
Table 1 are assumed for the purpose of this study.
Table 1.
Geographical data and boundaries conditions assumed.
Table 1.
Geographical data and boundaries conditions assumed.
| Geographical Data |
| Location | Altitude | Latitude | Longitude |
| London | 29 m | 51°32′ | 0°7′ |
| Winter Condition Data |
| Reference outside temperature: −5.0 °C | Winter min temperature: −10.0 °C |
| Average low temperature: 7.7 °C | Average heating period temperature: 6.2 °C |
| Average solar radiation on an horizontal plane during the heating period: 9.36 MJ/m2 |
| Summer Condition Data |
| Month of max solar radiation: July | Summer max temperature: 37.5 °C |
| Average monthly summer max temperature: 23.2 °C | Difference in temperature during the hottest day: 12.0 °C |
| Solar radiation on an horizontal plane during the month of max daylight exposure: 320.83 W/m² |
| Projection of Changes in Average Winter Temperature | Projection of Changes in Average Summer Temperature |
| Medium emission scenario 2020s: +1.3 °C | Medium emission scenario 2020s: +1.6 °C |
| Medium emission scenario 2050s: +2.2 °C | Medium emission scenario 2050s: +2.7 °C |
| Medium emission scenario 2080s: +3.0 °C | Medium emission scenario 2080s: +3.9 °C |
The assumed data are coherent with
The Draft Climate Change Adaptation Strategy for London a study from the Greater London Authority where the climate evolution of the city is documented in order to draft the possible adaptation scenarios. Despite the considerable uncertainness about future climate change, the projection of potential increasing of average temperature, based on Intergovernmental Panel on Climate Change (IPCC) emission scenario A1B, at 2020, 2050, 2080 [
16,
17], suggested to carefully define the performance thresholds to be achieved by the renovation options.
The case study is placed in the dense urban fabric of London and the neighbourhood suffers the effect caused by UHI with increased air temperature up from 4 to 7 °C during summer time in the city compared to measurements outside the city [
17,
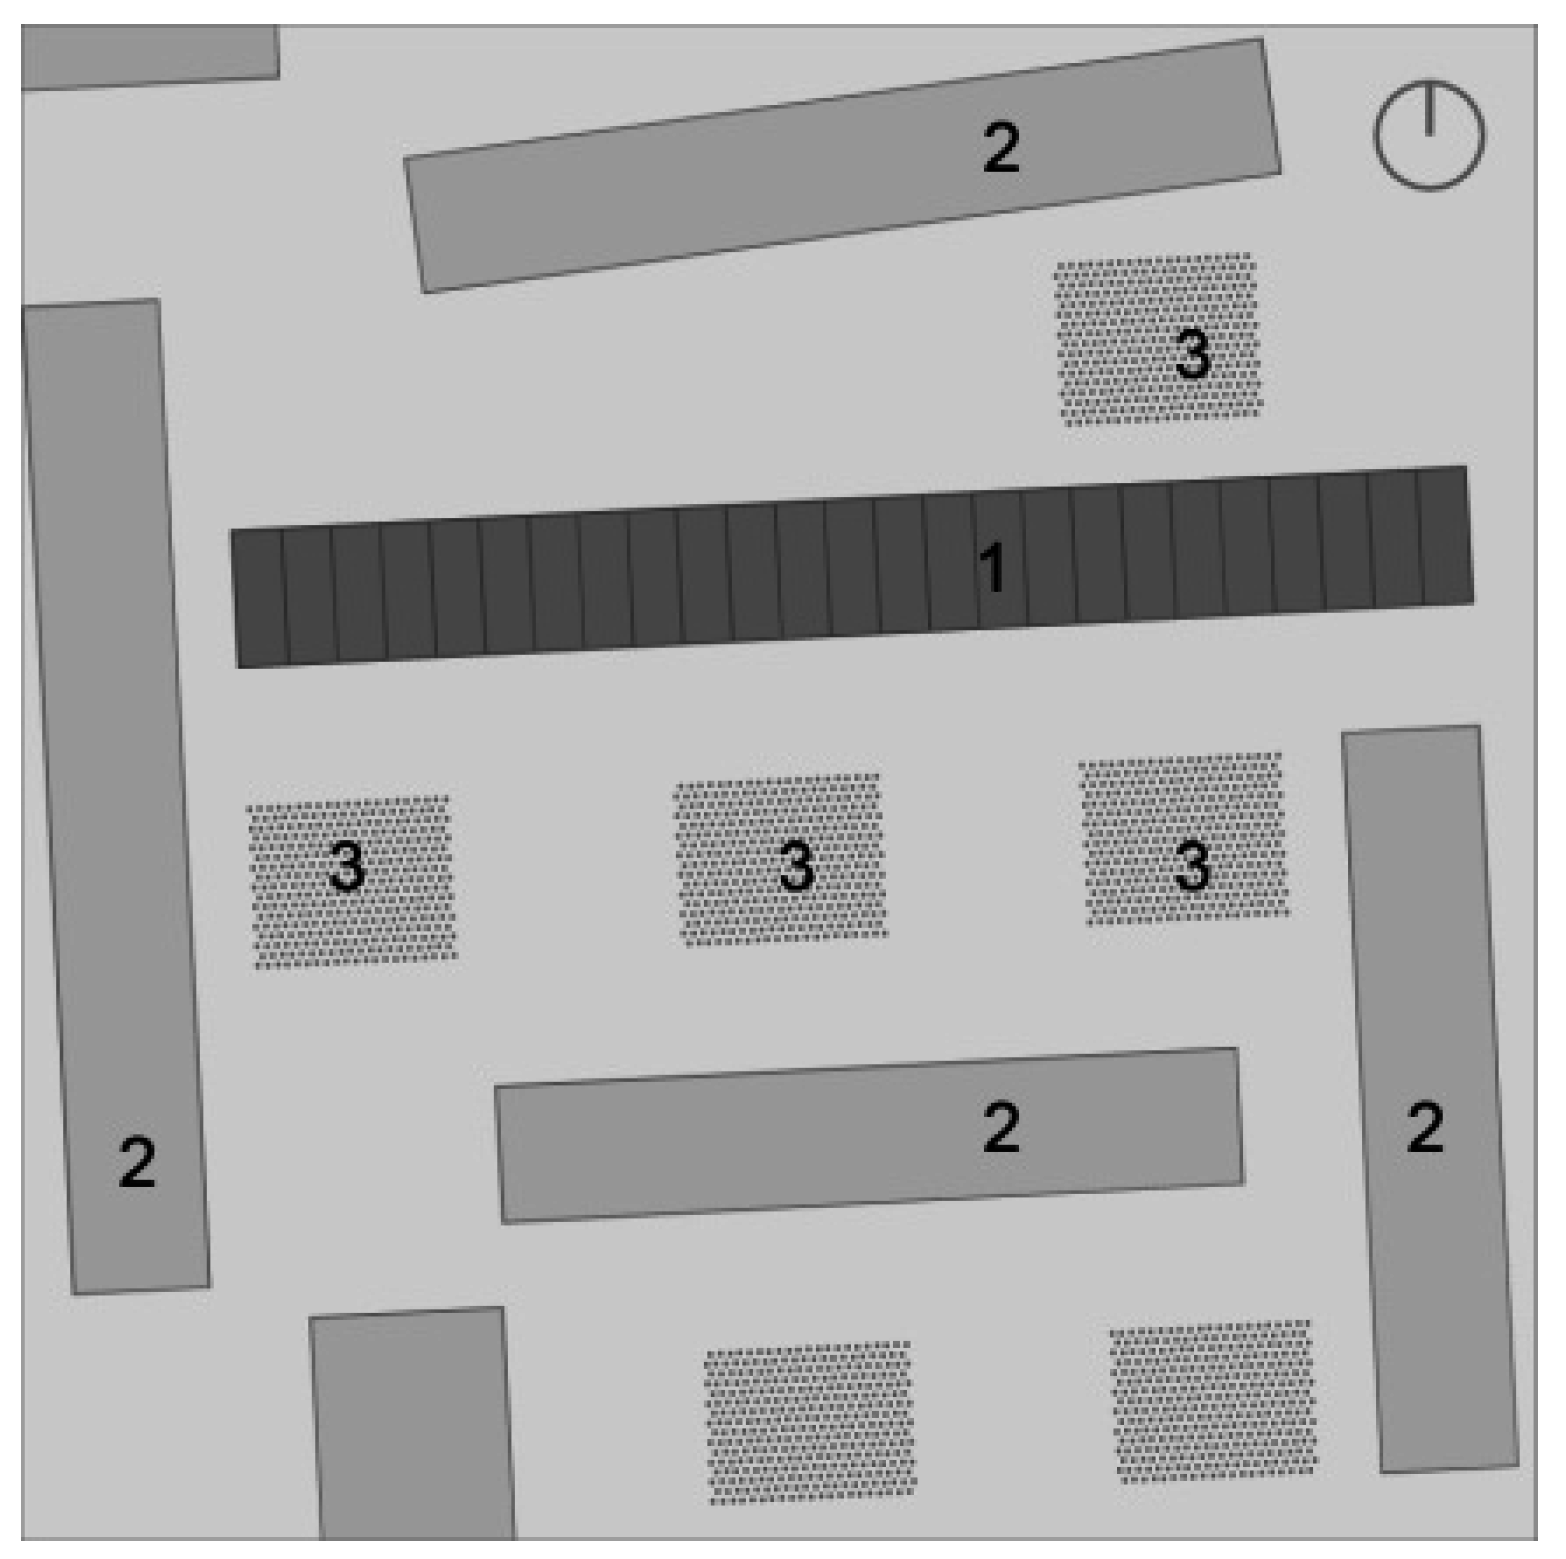
18]. A limited number of residential buildings were selected for this study and modelled according to the site arrangement and features. The model includes five buildings, arranged as
Figure 1 shows, and focuses on the central one, mainly north–south oriented with a length of approximately 100 m, a height of around 22 m and a width of around 11 m. The bearing structures of the buildings are made of concrete and brick walls with concrete floor slabs (4.00 m span), while the building envelope combines pre-casted concrete modules with glazing (aluminium frame with single glass layer and no thermal break). It is assumed that the façade modules are layered as follows: render (1.5 cm), concrete wall (15 cm) with integrated expanded polystyrene (EPS) insulation (3 cm), plasterboard (1.5 cm). The building envelope is 40% opaque with a glazing fraction of 60%. The first floor slab (separating the units from the ground floor open entrance and deposits) is insulated with a glass-wool layer (2 cm) and with a plasterboard finishing one. The roof slab (flat roof) is insulated with a concrete cell of 12 cm, protected by a waterproof membrane and a top coat of metal sheet.
Figure 1.
Building arrangement in the site. 1: investigated building; 2: surrounding buildings; 3: existing green areas.
Figure 1.
Building arrangement in the site. 1: investigated building; 2: surrounding buildings; 3: existing green areas.
For the purpose of this analysis, the building model has a volume of approximately 14,000 m
3 and a net floor area of 5200 m
2 serviced by a centralised heating system. These constraints are assumed so that the model characteristics result very closely to real operating conditions and that actual data on energy demand for heating could be used as a benchmark for the results of the performed thermal analysis. The model assumes that the building, as well as the surrounding ones was built in the 1960s and it is approximately 50 years old suffering from persistent thermal bridges due to the geometrical layout of its envelope and to the lack of suitable insulation layers and measures, especially around joints and floor slabs. However, there are no structural problems (it is expected the bearing structures will last for further 50 years at least) and all the main pre-cast elements of the façades are not affected by severe deterioration. The principal pathologies assumed are:
- ▪
Deterioration of render (about 35% of the surface);
- ▪
Condensation and moisture due to thermal bridges;
- ▪
Condensation and moisture around windows;
- ▪
Air and water infiltration through the windows.
The indoor environment presents uncomfortable thermal conditions during both winter and summer. Thermal transmittance of the windows is estimated to be 5.5 W/(m
2·K) while the thermal specs of the opaque surfaces are summarised in
Table 2.
Table 2.
Thermal characteristics of main elements.
Table 2.
Thermal characteristics of main elements.
| Technical Element | Thermal Transmittance (U) (W/(m2·K)) | Time Shift (φ) | Decrement Factor (-) | Periodic Thermal Transmittance (Y) (W/(m2·K)) |
|---|
| typical slab over open ground floor | 1.12 | 5 h 38 min | 49.97 | 0.558 |
| typical wall | 1.11 | 6 h 42 min | 24.55 | 0.273 |
| typical roof slab | 0.62 | 8 h 23 min | 21.05 | 0.131 |
The Energy Performance index (EP) of the building was investigated taking into account the different properties and conditions of the elements making up the building envelope as well as the ones of the heating system and of equipment. Three different situations are identified:
- ▪
The first floor above the open ground floor is affected by severe dispersals on three sides (the two façades and the floor slab);
- ▪
The typical floor (from the second to the sixth level) whose dispersals are limited to the façades;
- ▪
The last floor under the roof which is exposed to dispersals on three sides (the two façades and the roof).
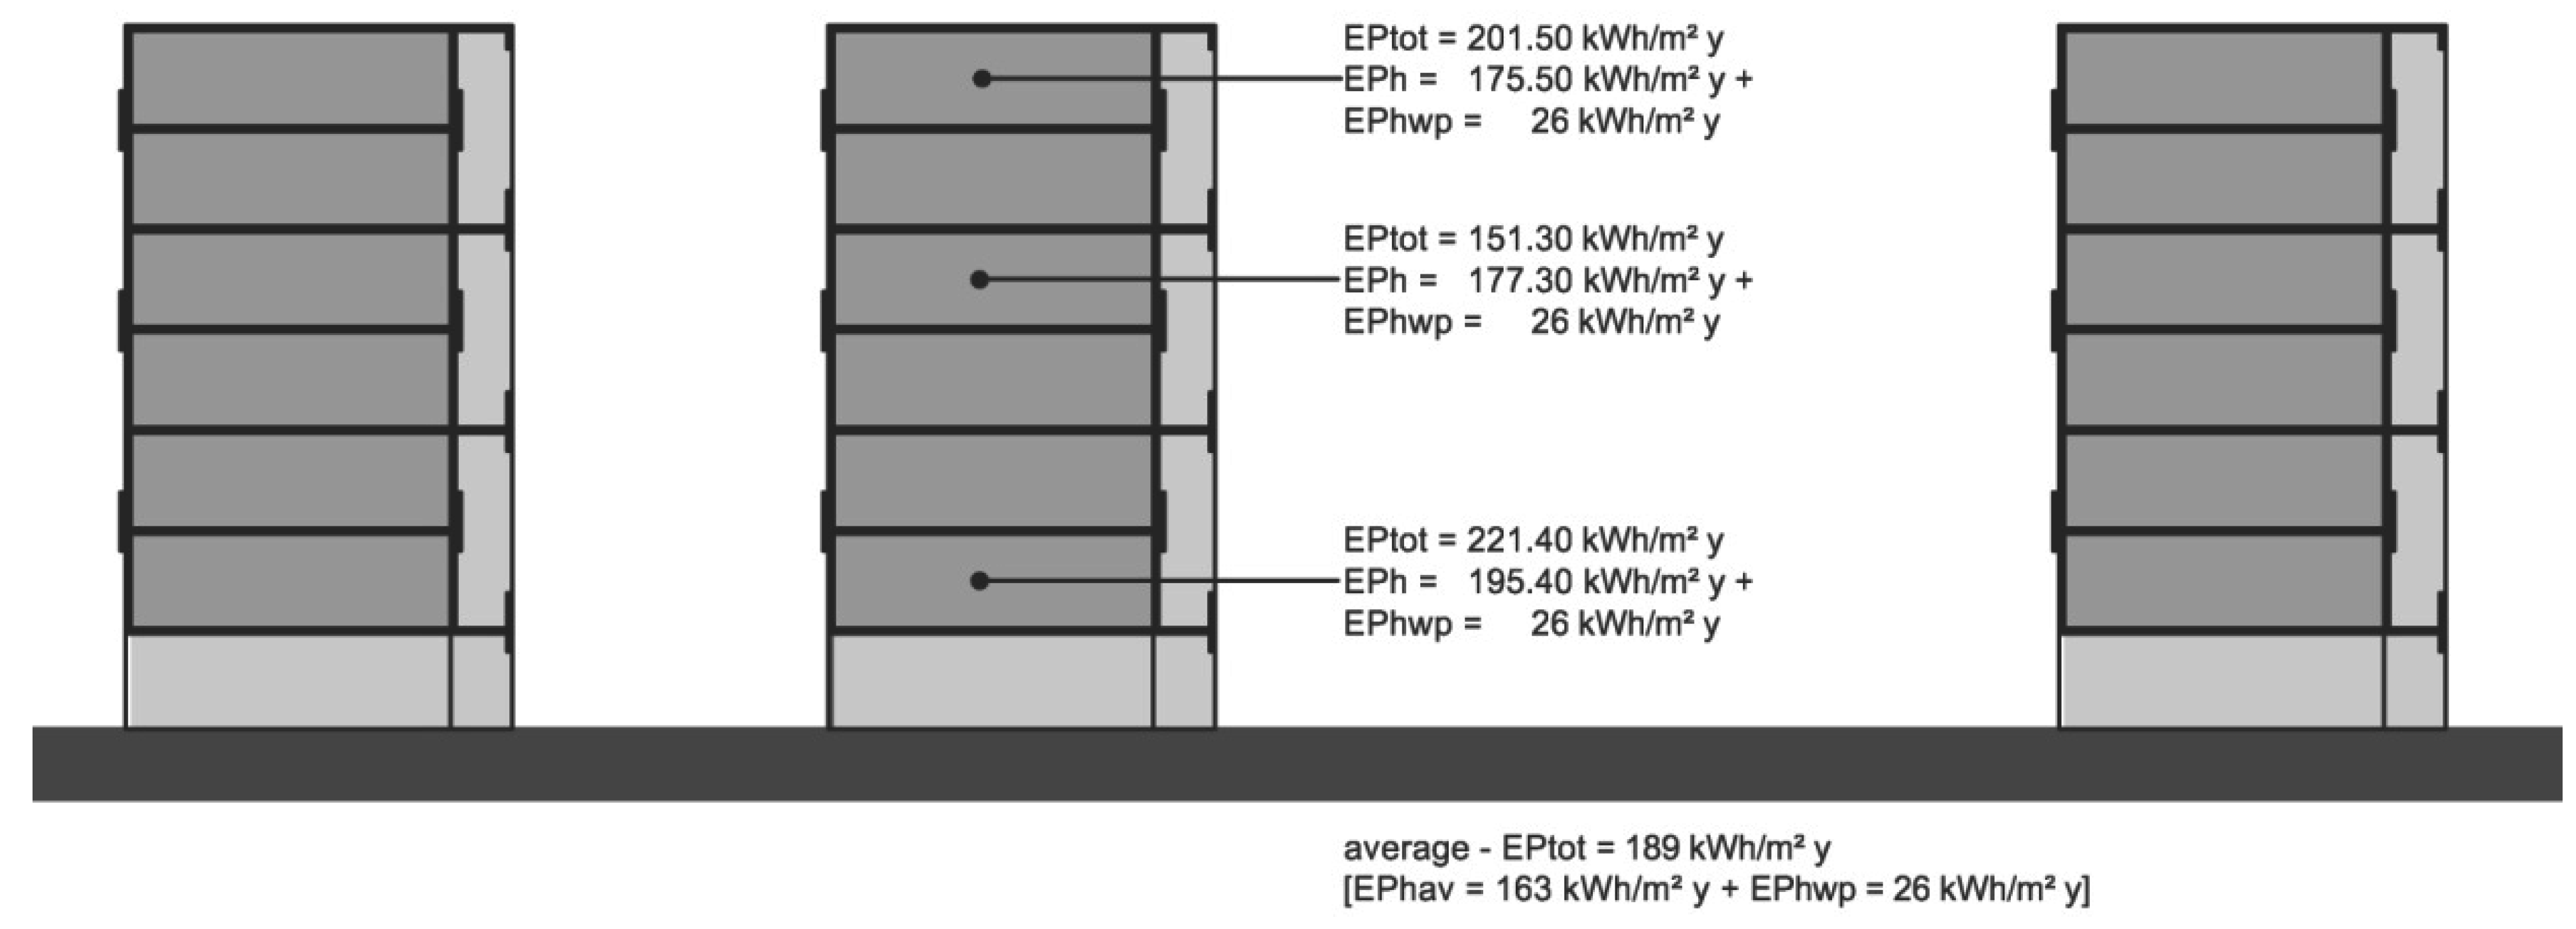
Therefore the total EP index is the result of a weighted mean between these three conditions and takes into account the different influence of the first (EPh = 195.40 kWh/(m
2·year)) and the last floor (EPh = 175.50 kWh/(m
2·year)) in relation to the typical floor (EPh = 151.30 kWh/(m
2·year)) as
Figure 2 shows. The analysis is performed using the software Termolog EpiX 2 and the energy demand for hot water production is estimated at 26 kWh/(m
2·year). No cooling system was provided at construction time. The average (weighted mean) EPh-av is 163 kWh/(m
2·year) and the total EPtot is 187 kWh/(m
2·year) (EPh-av = 163 kWh/(m
2·year) + EPhwp = 26 kWh/(m
2·year)).
Figure 2.
The Energy Performance index (EP) of the three identified conditions.
Figure 2.
The Energy Performance index (EP) of the three identified conditions.
Since most of the deficit is due to the building envelope, retrofit options are mainly focused on this part of the building. Electrical equipment update or interventions regarding finishes or internal arrangement of the units are assumed, as part of the ordinary or extraordinary maintenance actions and are not included in the analysis.
2.2. Renovation Options, Technological Choices and Energy Savings
Most deficits and a remarkable quota of dispersion are concentrated on the main façades, therefore the renovation actions are mainly focused on improving their performance. Four alternative renovation options are considered: each of them envisages the same technological solutions to upgrade the first and last floor slab, to integrate equipment and services and to integrate thermal collectors on the roof, while they differ from that which concerns the building envelope implementation. This consists in over-cladding the four existing façades which still remain behind the new added layers. Hence the implications due to technological variations on the building envelope can be investigated while keeping the other parameters fixed. The first and uppermost floor slab insulation layers are both thickened to 16 cm, reaching a thermal transmittance of 0.19 W/m2·K with a time shift of 12 h and 46 min and a decrement factor of 0.075.
Renovation Option 1 (RO1) envisages an onsite over-cladding of the existing pre-cast concrete façade modules with a new fiber-wood insulation layer, 14 cm thick, render finishing. In order to increase performances and avoid condensation, moisture, air and water infiltration, the existing windows are replaced with new double-pane ones [mm (4 + 4)/12/4] with high quality wooden frames (thermal transmittance of the windows moves from 5.5 to 1.5 W/m2·K). As a north–south orientation of the main façades is set in the model, a horizontal brise-soleil representing the most effective solution to reduce solar radiation from the south, is positioned on the upper part of the windows of the south façade to reduce overheating on glazing during summertime.
Renovation Option 2 (RO2) foresees an onsite over-cladding of the existing pre-cast concrete façade modules with a new fiber-wood insulation layer, 14 cm thick, and ceramic elements supported by a metal substructure. In order to reduce time and construction cost a dry assembling technology currently adopted for ventilated façade is used. The existing windows are replaced according to RO1. The brise-soleil is integrated in the cladding pattern and structure of the south elevation.
Renovation Option 3 (RO3) foresees an onsite over-cladding of the existing pre-cast concrete façade modules with a new fiber-wood insulation layer, 14 cm thick, and Glass Reinforced Concrete (GRC) panels with cool coloured coating. The existing windows are replaced according to RO1 and the brise-soleil added according to RO2.
Renovation Option 4 (RO4) aims at achieving comparable results to the other options while reducing time and costs of interventions. The over-cladding is pursued using pre-assembled modules, obtained by coupling a fiber-wood insulation panel (14 cm thick) with GRC panels which are integrated into a metal frame and provided with hooked edges allowing it to be hung on top of the existing pre-cast concrete panels. Each side of this element is provided with a special joint overlapping the ones next to it in order to prevent thermal dispersion. This module can be placed on the façade by using a mobile crane, thereby speeding up the building process and reducing time and costs. When these pre-assembled elements are positioned, the brise-soleil element can be installed from inside in addition to new wooden windows. In this option, the facade pattern is also re-arranged reducing the glazing fraction to 30% in order to reduce dispersions as well as overheating phenomena.
As summarized in
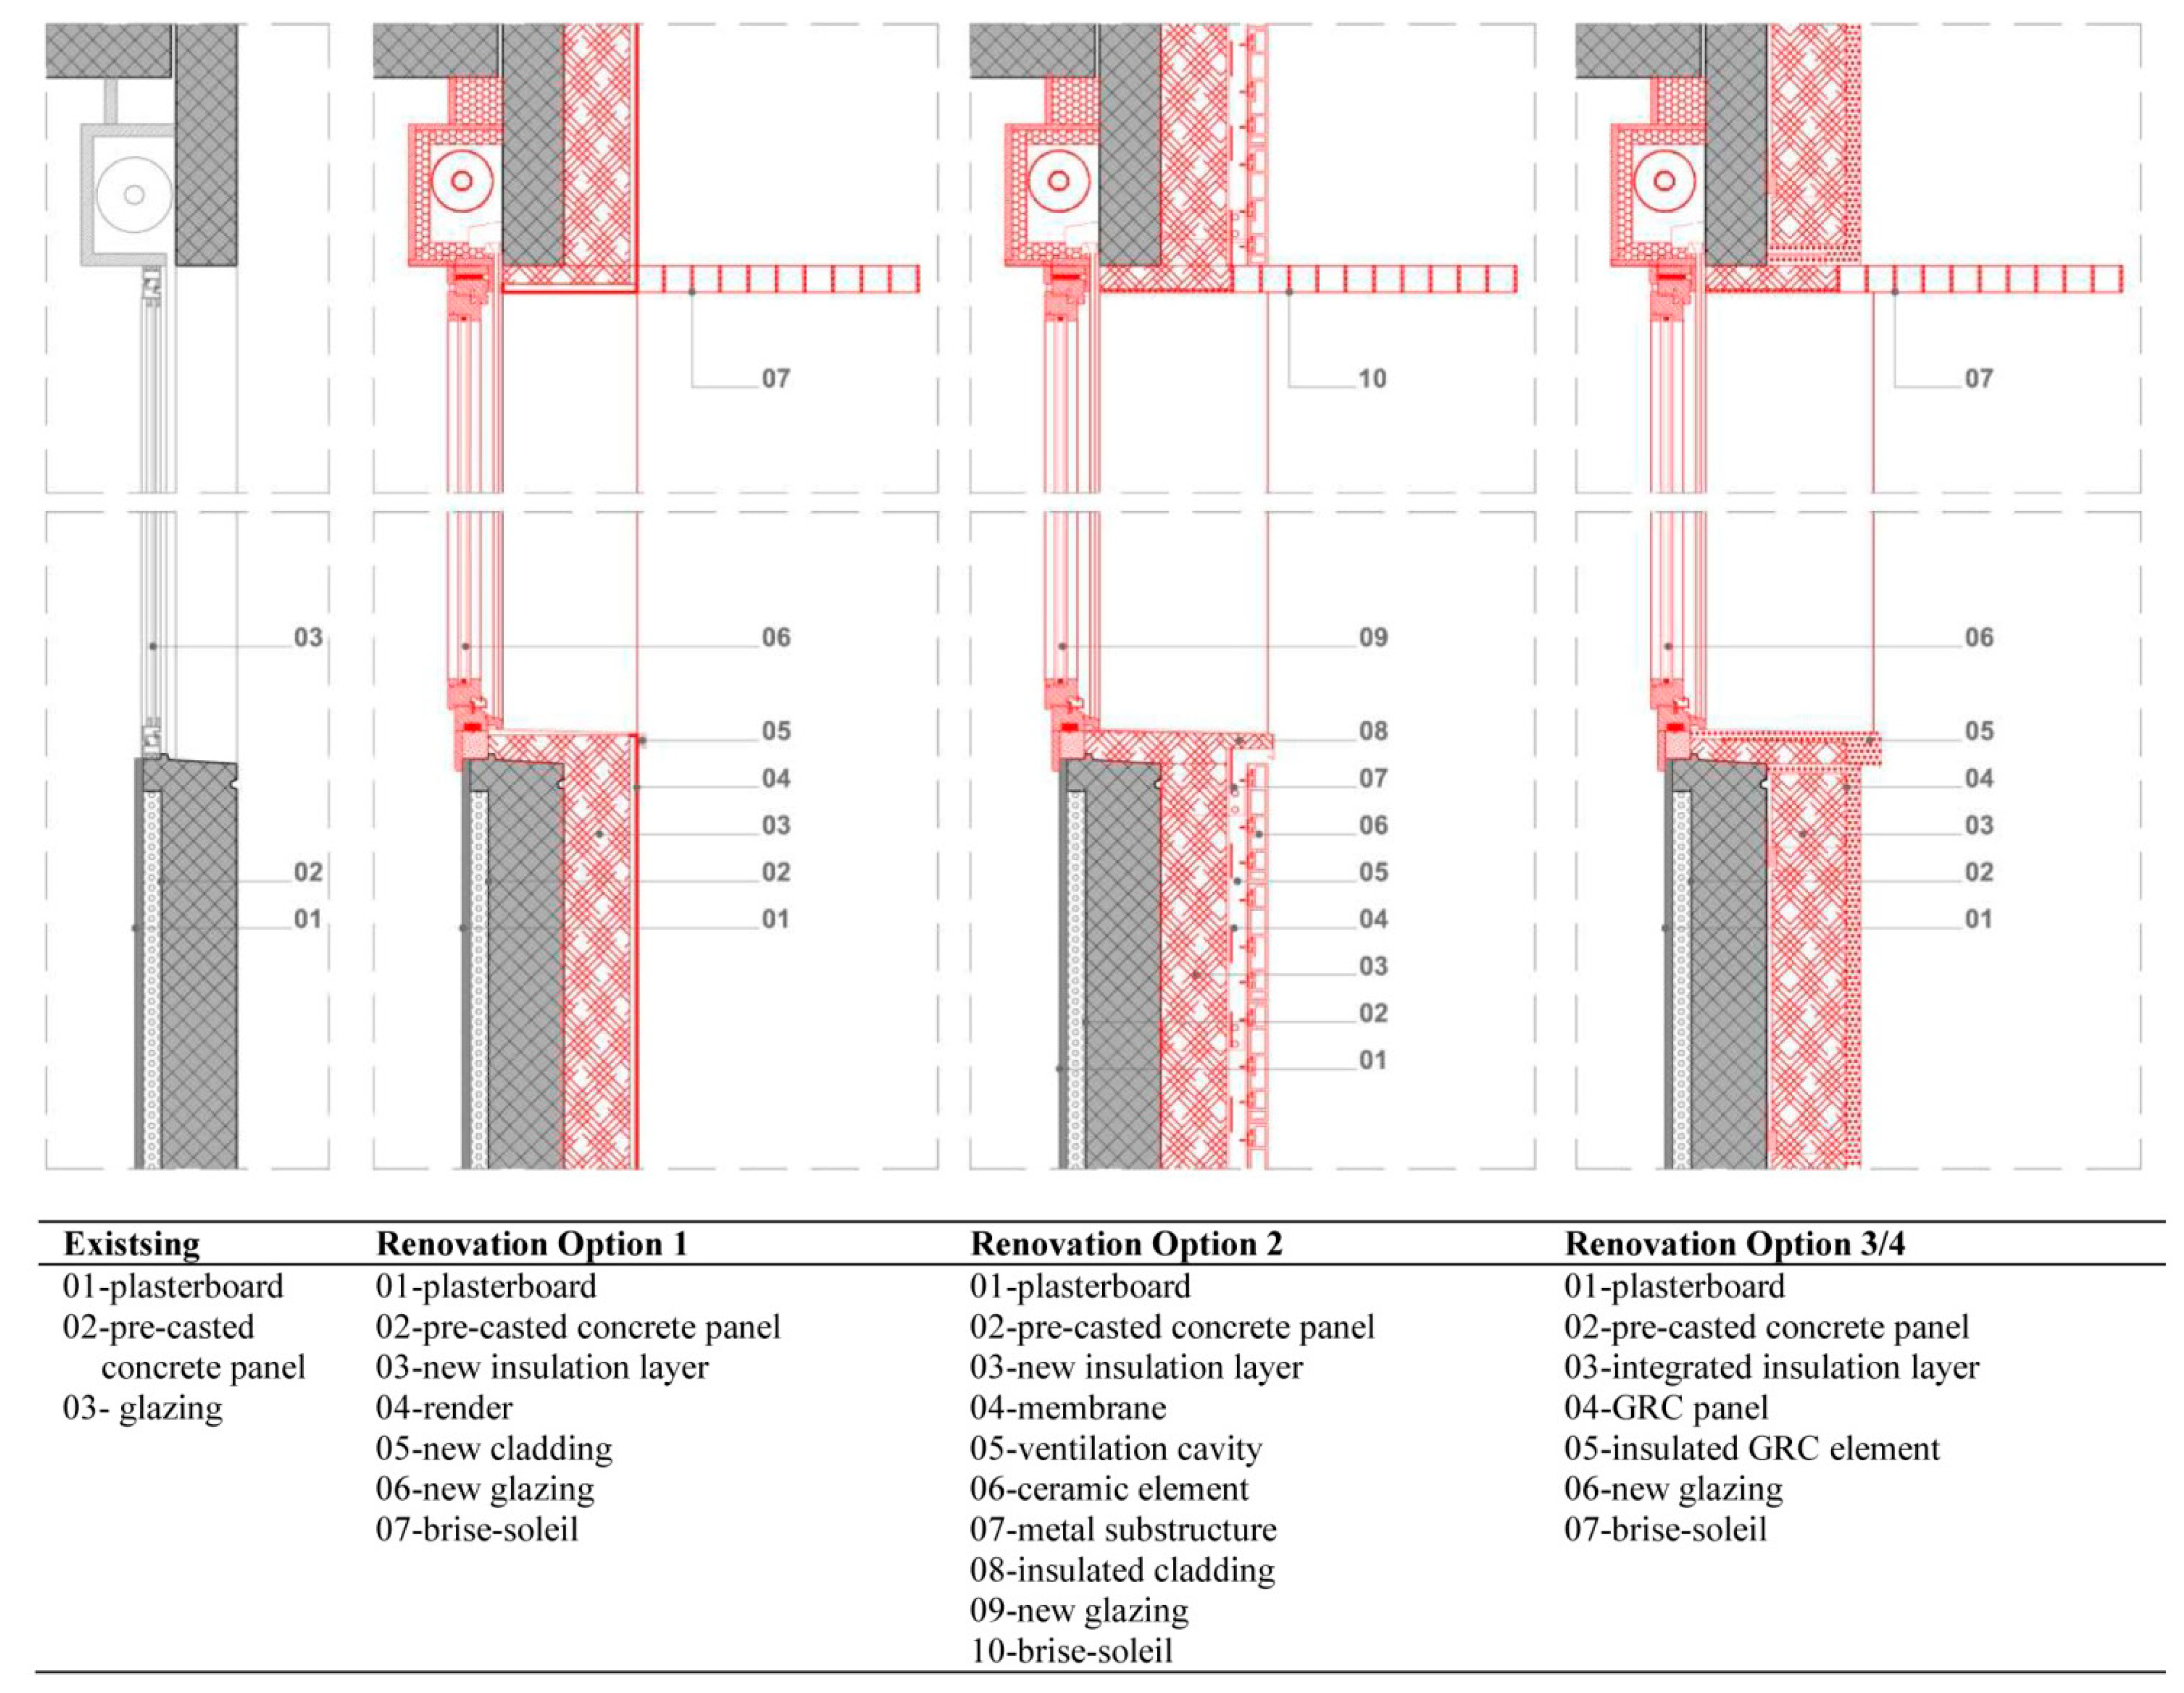
Table 3, the main characteristic of the typical wall section envisaged by each renovation option are very similar and this is intentionally aimed to obtain equivalent energy performances and behaviours during operating so that the implications involving other parameters on which the study is focused become more evident. Details of the envisaged solutions are provided in
Figure 3.
Table 3.
Thermal characteristics of main elements after renovation.
Table 3.
Thermal characteristics of main elements after renovation.
| Technical Element | Thermal Transmittance (U) (W/(m2·K)) | Time Shift (φ) | Decrement Factor (-) | Periodic Thermal Transmittance (Y) (W/(m2·K)) |
|---|
| typical slab over open ground floor | 0.193 | 12 h 46 min | 0.075 | 0.014 |
| RO1 typical wall section | 0.193 | 14 h 32 min | 0.085 | 0.016 |
| RO2 typical wall section | 0.191 | 15 h 18 min | 0.082 | 0.016 |
| RO3 typical wall section | 0.194 | 14 h 49 min | 0.085 | 0.017 |
| RO4 typical wall section | 0.194 | 14 h 49 min | 0.085 | 0.017 |
| typical roof slab | 0.193 | 12 h 46 min | 0.075 | 0.014 |
Figure 3.
Details of the investigated solutions.
Figure 3.
Details of the investigated solutions.
Each technological solution is tested through an energy assessment, an evaluation of the thermal transmittance and of the index of thermal performance. The final EPtot index after each RO varies between 10 and 20 kWh/m
2 according to the different equipment introduced during the simulations and it is in all the considered cases less than 25 kWh/(m
2·year) (including 9 kWh/(m
2·year) needed for hot water production) which was set as a pre-defined target, achieving a saving of almost 86% compared to current energy demand for operating before intervention. RO4 adopts the same solutions as RO3 but performs better since it reduces the glazing extent and pattern. It is expected that the service life of the technological solutions adopted in each RO is between 30 and 50 years according to literature [
19].
However the main goal of the study is not limited to energy needed during operational and service life but aims to the appraisal of the effects of technological choices on microclimate and of their role in terms of energy balance, expressed in embodied and process energy needed for achieving the relevant retrofitting action.
2.3. Energy Investment Evaluation and Amortization Time
In conventional buildings, operational energy currently accounts for 70% (or more) of the total, while embodied and process energy accounts for 30%. When energy efficiency during operation is increased, these shares shift to 50% each or, in very efficient buildings to 30% or less and 70% or more for embodied and process energy respectively [
20]. Recent EU Directives promoting the “zero energy building” standard are expected to produce further and higher energy savings during service life, consequently increasing the relevance of the “hidden” embodied and process energy in the environmental balance. This is the reason why an evaluation of the “energy investment” required to achieve the retrofitting actions (as well as the construction of a new building) has to be carefully taken into account [
21].
Literature provides a wide range of methods [
22] in listing inventory data necessary for an embodied energy analysis or a full life-cycle energy assessment of building; from computer models based on tons of oil equivalent (toe) conversions [
23] to commonly-used process analysis and the economic input-output methods [
24,
25], as well as hybrid ones. The process analysis assessment method takes into account the direct and indirect upstream energy flows of a product but due to the complexity of the upstream processes, it is hard to know how much the remaining paths contribute to the total process and consequently how much energy is omitted in the obtained results [
26]. The input-output (I-O) approach is based on national statistical tables and figures of monetary value for assessing energy inputs and outputs of specific goods or services. These results are then converted into energy values expressed as energy per national currency [
27]. Despite these limitations [
28], the main advantages of this method are: its capability in detecting high energy intensity sectors and in correctly estimating the industrial sectors of any given economy [
29]. To obtain the advantages of both these methods and minimise weaknesses in addition to attaining more reliable results, a number of hybrid methods are still being studied [
30].
For the purpose of this research, the embodied energy of the building components was assessed by resorting to a hybrid method based on process analysis where Inventory of Carbon & Energy (ICE) is used for inventory dataset and Simapro life cycle assessment (LCA) software tool to collect, analyze and monitor the environmental impact of products and systems across all life cycle stages. Boundary conditions correspond to the EU socio-economic context and the same for the cost of primary energy. Cradle to gate (and cradle to site, where available) boundaries were assumed for the processes and then transportation and construction contributions were added, accepting the approximations derived by doing so.
The energy investment of each RO was evaluated as follows: an Embodied Energy Analysis (EEA) was performed per each building’s elements used for implementing the envelope and then aggregated per technological unit consistent with the arrangement and quantification explained in
Table 4.
Table 4.
Aggregated elements and units considered.
Table 4.
Aggregated elements and units considered.
| Units | Aggregated Elements | Quantities |
|---|
| first floor slab implementation | vapor barrier | 1150 m2 |
| mineral wool insulation layer | 1150 m2 |
| suspended plasterboard ceiling | 1150 m2 |
| Façade implementation | new double-pane windows with high quality wood frame | 2640 m2 |
| horizontal brise-soleil | 350 m2 |
| (a) fiber wood insulation layer + render | 1760 m2 |
| (b) fiber wood insulation layer + ceramic cladding elements | 1760 m2 |
| (c) pre-assembled façade panel (insulation layer + GRC) | 1760 m2 |
| roof slab implementation | vapor barrier | 1150 m2 |
| wood panels + waterproofing membrane | 1150 m2 |
| metal sheet cladding | 1150 m2 |
The total energy investment for retrofitting the building according to each RO is obtained as the product of the total embodied energy of each technological unit and the related quantities. The energy involved for transportation, disposal of the existing elements and for setting up the construction site is included according to the boundaries set in the LCA processed by the used software tools. The results per unit involved and the total amounts are summarized in
Table 5.
Table 5.
Embodied Energy (EE) per considered units and total amount per RO.
Table 5.
Embodied Energy (EE) per considered units and total amount per RO.
| Option Range | Unit Involved | EE (MJ) |
|---|
| RO1-4 | (1) Integration of insulation on the first floor slab | 857,891 |
| RO1-4 | (2) Integration of insulation on the roof slab | 649,281 |
| RO1-3 | (3a) New double-pane windows | 2,415,442 |
| RO4 | (3b) New double-pane windows | 1,207,721 |
| R01-4 | (3c) Brise-soleil (south elevation) | 109,200 |
| RO1 | (4a) Façade implementation (fiber wood insulation layer + render finishing) | 386,306 |
| RO2 | (4b) Façade implementation (fiber wood insulation layer + ceramic cladding elements) | 1,056,754 |
| RO3 | (4c) Façade implementation (pre-assembled façade panel) | 892,924 |
| RO4 | (4d) Façade implementation (pre-assembled façade panel) | 1,562,617 |
| RO1-4 | (5) Thermal collectors | 286,650 |
| total amount RO1 ((1) + (2) + (3a,c) + (4a) + (5)) | 4,704,769 |
| total amount RO2 ((1) + (2) + (3a,c) + (4b) + (5)) | 5,375,217 |
| total amount RO3 ((1) + (2) + (3a,c) + (4c) + (5)) | 5,211,387 |
| total amount RO4 ((1) + (2) + (3a,c) + (4d) + (5)) | 4,673,359 |
In each scenario, a remarkable amount of the total energy investment is accounted for by replacement windows. The existing windows however are responsible for extensive energy dispersions and are the main weakness of the building envelope. This quota is therefore an unavoidable investment if an effective renovation action is pursued. A constant quota is due to the first floor and roof slab implementation. A small constant quota is related to the thermal collectors included in each scenario for hot water provision. The residual quota varies according to the technological choices and materials adopted. The total amount of RO4 is very narrow to RO1 due to the reduced glazing fraction where weight in terms of EE is higher than the typical wall one. This is despite the EE quota referred to façade implementation itself being higher in RO4 compared to RO1 due to the adoption of the pre-assembled panels (more framing materials and more process energy).
However the total embodied energy amount per each RO has a limited significance if not compared with the yearly energy demand for operating, therefore a normalisation of the energy investment referred to the net usable area is needed and a reference time horizon for amortization has to be defined [
31]. Choosing the reference time horizon is a key point of this task: technological choices and materials adopted not only influence the amount of energy investment but also the durability and reliability of the system and the deriving maintenance actions (which would require an additional quota of energy investment). As set in
Section 2, two options are considered: 30 and 45 years. The amortization time is obtained as the ratio between the normalised energy investment and the reference time horizons as
Table 6 summaries.
Table 6.
Energy investments amortization quota for each RO according to assumed time horizons.
Table 6.
Energy investments amortization quota for each RO according to assumed time horizons.
| Energy Investment (EE)-Normalized Energy Investment | Time Horizon 2050 | Time Horizon 2065 | Time Horizon 2080 |
|---|
| Renovation Option | Energy value | Energy value per area | Amortization quota 1 | Amortization quota 2 | Amortization quota 3 |
|---|
| MJ | kWh | MJ/m2 | kWh/m2 | kWh/(m2·year) | MJ/(m2·year) | kWh/(m2·year) | MJ/(m2·year) | kWh/(m2·year) | MJ/(m2·year) |
|---|
| RO1 | 4,704,769 | 1,306,880 | 905 | 251 | 7.2 | 25.9 | 5.0 | 18.1 | 3.9 | 13.9 |
| RO2 | 5,375,217 | 1,493,116 | 1034 | 287 | 8.2 | 29.5 | 5.7 | 20.7 | 4.4 | 15.9 |
| RO3 | 5,211,387 | 1,447,608 | 1002 | 278 | 8.0 | 28.6 | 5.6 | 20.7 | 4.3 | 15.4 |
| RO4 | 4,673,359 | 1,298,155 | 899 | 250 | 7.1 | 25.7 | 5.0 | 18.0 | 3.8 | 13.8 |
The annual energy investment amortization quota is around one third of the energy demand for operating (25 kWh/(m
2·year)) with reference to the time interval of 35 years, assumed to fit the climate change projection to 2050, and about one fifth with reference to the time interval of 50 years according to 2065 projections. These time intervals also fit with the expected service life of adopted solutions. Despite a time horizon to 2080 would provide better results the deriving time interval of 65 years may exceed the average service life according to literature [
32] and would probably require some maintenance actions causing additional energy investments which have to be eventually taken into account. So this is considered an extraordinary condition.
It has also to be remarked that if the temperature will increase according to projection (see
Table 1) or worse an increasing of energy demand for operation (mainly due to cooling) may occur for tuning acceptable comfort condition, a consequence of this will be the balance between energy investment and operational energy will shift. However the proposed methodology can be used to simulate different scenarios according to a range of projections.
It has to be stated that the total amount of energy investment–and the amortization time as a consequence–varies according to the materials adopted and to the manufacturing processes required in addition to the boundary conditions assumed as well as to the user’s behaviour. Totally different results can be therefore obtained by assuming different technological choices (Considerable differences in terms of reflectance and impacts on indoor and outdoor temperature can derive by the adoption of special coatings and paints which are usually studied separately as a very specific field), while following the same structure breakdown, steps and process.
2.4. Impacts of Technological Choices on Microclimate
In order to analyse the influence of technological choices on the urban microclimate and the building’s energy demand, several factors, such as multiple radiative reflections, reduced convective heat losses and the UHI, have to be taken into account. The complex patterns of urban surfaces influence air temperatures both reducing mean annual wind speeds (30%–40% lower than the one in the countryside) inhibiting evaporative cooling and changing the urban radiation budget due to vertical canyon walls that trap short-wave radiation [
33]. This is also influenced by the properties of materials: urban albedos are, on average, 5%–10% lower than rural values [
34], contributing in greater diurnal absorption. According to Oke [
35,
36] the great number of different and combined causes contributing to the development of a UHI and more generally uncomfortable environments can be grouped as follows:
- ▪
Anthropogenic heat including lighting, cooling and heating buildings which warm the urban atmosphere by conduction, convection, and radiation, influencing the energy balance in function of latitude and season of the year;
- ▪
Air pollution, due to transportation and emissions, which influences the urban net all-wave radiation;
- ▪
Surface waterproofing, referring to the predominance of impermeable surface especially for paved streets and public spaces which contributes to creating an evaporation deficit in the city;
- ▪
Thermal properties of fabric, referring to the heat capacity, and consequently thermal inertia, of construction materials which absorb and retain more solar radiation than do rural soils and vegetation;
- ▪
Surface geometry and buildings arrangement which influence wind speeds and urban radiation budget.
A number of studies investigated the main factors influencing the urban microclimate and their impacts on buildings energy demand according to different levels of complexity with relation to the adopted data source and set. Significant variation in UHI effect was outlined [
37] by using meteorological data measured at a specific location and also investigating radiative heat fluxes with relation to the density of the neighbourhood [
38], however an accurate modelling of the microclimate around and between buildings would require a great number of factors at different scale (city, district, street canyon, building) to be considered at the same time.
For the purpose of this study, the building arrangement and geometry, described in
Figure 1, were modelled (using the software Termolog and ENVI-met) according to site and climate condition taking into account that most ground surfaces and street pavements are made of asphalt and/or concrete and no significant tall vegetation is located between the opposite façades of the involved buildings. Geographical data and boundaries conditions are the ones provided in
Section 1 by
Table 1. With reference to the surface geometry of the building envelope, the four following alternative renovation options are considered:
- ▪
RO1 with a glazing fraction of 60% and a 40% render finishing with light grey coloured coating;
- ▪
R02 with a glazing fraction of 60% and a 40% clear ceramic cladding element;
- ▪
R03 with a glazing fraction of 60% and a 40% GRC panels with cool coloured coating;
- ▪
R04 with a glazing fraction reduced to 30% and GRC panels with cool coloured coating increased to 70%.
Table 7 provides the properties [
39] of the building envelope and ground surface and sub-surface materials.
Table 7.
Building envelope and ground material properties by layer.
Table 7.
Building envelope and ground material properties by layer.
| Material Layer | Conductivity (W/(m·K)) | Density (kg/m3) | Specific Heat (kJ/(kg·K)) | Solar Absorptivity | IR Emissivity |
| Asphalt | 0.75 | 2110 | 0.920 | 0.40 | 0.9 |
| Ceramic | 1.30 | 2083 | 0.835 | 0.80 | 0.9 |
| Concrete | 1.51 | 2400 | 0.880 | 0.65 | 0.9 |
| Crushed rock | 0.95 | 2000 | 1.050 | - | - |
| Drywall | 0.17 | 800 | 1.090 | 0.65 | 0.9 |
| Insulation | 0.038 | 140 | 1.100 | - | - |
| Double-Pane Window | Conductivity (W/(m·K)) | Density (kg/m3) | Specific Heat (kJ/(kg·K)) | Solar Absorptivity | IR Emissivity |
| Glass | 0.74 | 2500 | 0.840 | - | 0.9 |
| Air | 0.026 | 1.205 | 1.005 | - | - |
| Glass | 0.74 | 2500 | 0.840 | - | 0.9 |
| Incident angle (°) | 0 | 10 | 20 | 30 | 40 | 50 | 60 | 70 | 80 | 90 | diffuse |
| SHGC | 0.777 | 0.776 | 0.774 | 0.769 | 0.756 | 0.725 | 0.656 | 0.509 | 0.261 | 0 | 0.676 |
| Absorptance * | 0.08 | 0.081 | 0.082 | 0.085 | 0.089 | 0.094 | 0.101 | 0.110 | 0.117 | 0 | 0.093 |
| Absorptance ** | 0.064 | 0.065 | 0.066 | 0.068 | 0.070 | 0.071 | 0.071 | 0.065 | 0.049 | 0 | 0.067 |
| Transmittance | 0.727 | 0.726 | 0.723 | 0.716 | 0.702 | 0.669 | 0.599 | 0.455 | 0.215 | 0 | 0.623 |
Evaluations are focused on the central building domain while the surrounding buildings provide appropriate boundary conditions [
40]. Building and system characteristics are coherent with the renovation options and the amounts of internal loads are listed in
Table 8 according to
Section 2 description.
Table 8.
Internal gain for residential building [
41].
Table 8.
Internal gain for residential building [41].
| Internal Gain | Persons (W/m2) | Devices (W/m2) | Lights (W/m2) |
|---|
| Radiative | 0.6 | 0.4 | 6.58 |
| Convective | 0.9 | 1.6 | 2.82 |
The most relevant mechanism influencing the microclimate of the in-between spaces is the radiation exchange between surfaces as in dense urban situations the net radiation on the building façades is higher than in the one of stand-alone volumes due to multiple reflections [
41]. Furthermore the cooling potential by night ventilation is significantly reduced by UHI [
42]. Daytime temperatures near and on the involved façades could rise from 3 to 6 °C above the reference air temperature due to thermal confinement, while during the night, the air temperature could be about 0.5–1.5 °C higher on the top of the façades than on the roofs, and even 0.75–2 °C higher in the bottom of the streets coherently with the trends outlined by Doya [
43]. The increasing of temperature involving the façades and the reduction of night ventilation effect contribute in higher cooling demand (which renovation has eventually to provide) making clear the relation between microclimate and energy balance. The cooling demand of the investigated building, during the overheating summer period is estimated between 1.8 and 2.1 kWh/(m
2·year) (6.5–7.5 MJ/(m
2·year)) varying according to the technological solutions adopted for renovating. Due to the mass provided by the existing façades layers and to the addition of a medium-high density insulation layer, the building envelope provides a thermal inertia which ensure a positive behaviour in terms of indoor condition, while most part of the effects on the outdoor depends on the properties of the external layers [
44,
45]. RO2 offers a more mitigative solution as the ceramic cladding elements for ventilated façades contributes in heat extraction and in evapo-transpiration effect, while RO3 adopts a more performing cool coating [
46] compared to the conventional one of RO1.
However, most of the heat gains are derived by the glazing surface, and therefore RO4 combines the mitigative effects of RO3. The reduction of the glazing fraction produces the lowest cooling demand, explained by the lower heat gains through the insulated walls.
Existing literature provides many examples of how the vegetation or the replacement of paved surface effectively contributes to reduce the UHI effect. This study does not intend to elaborate on this understanding: it is rather focused on the impacts of technical and material alternatives for the building envelope.
2.5. Financial Evaluation
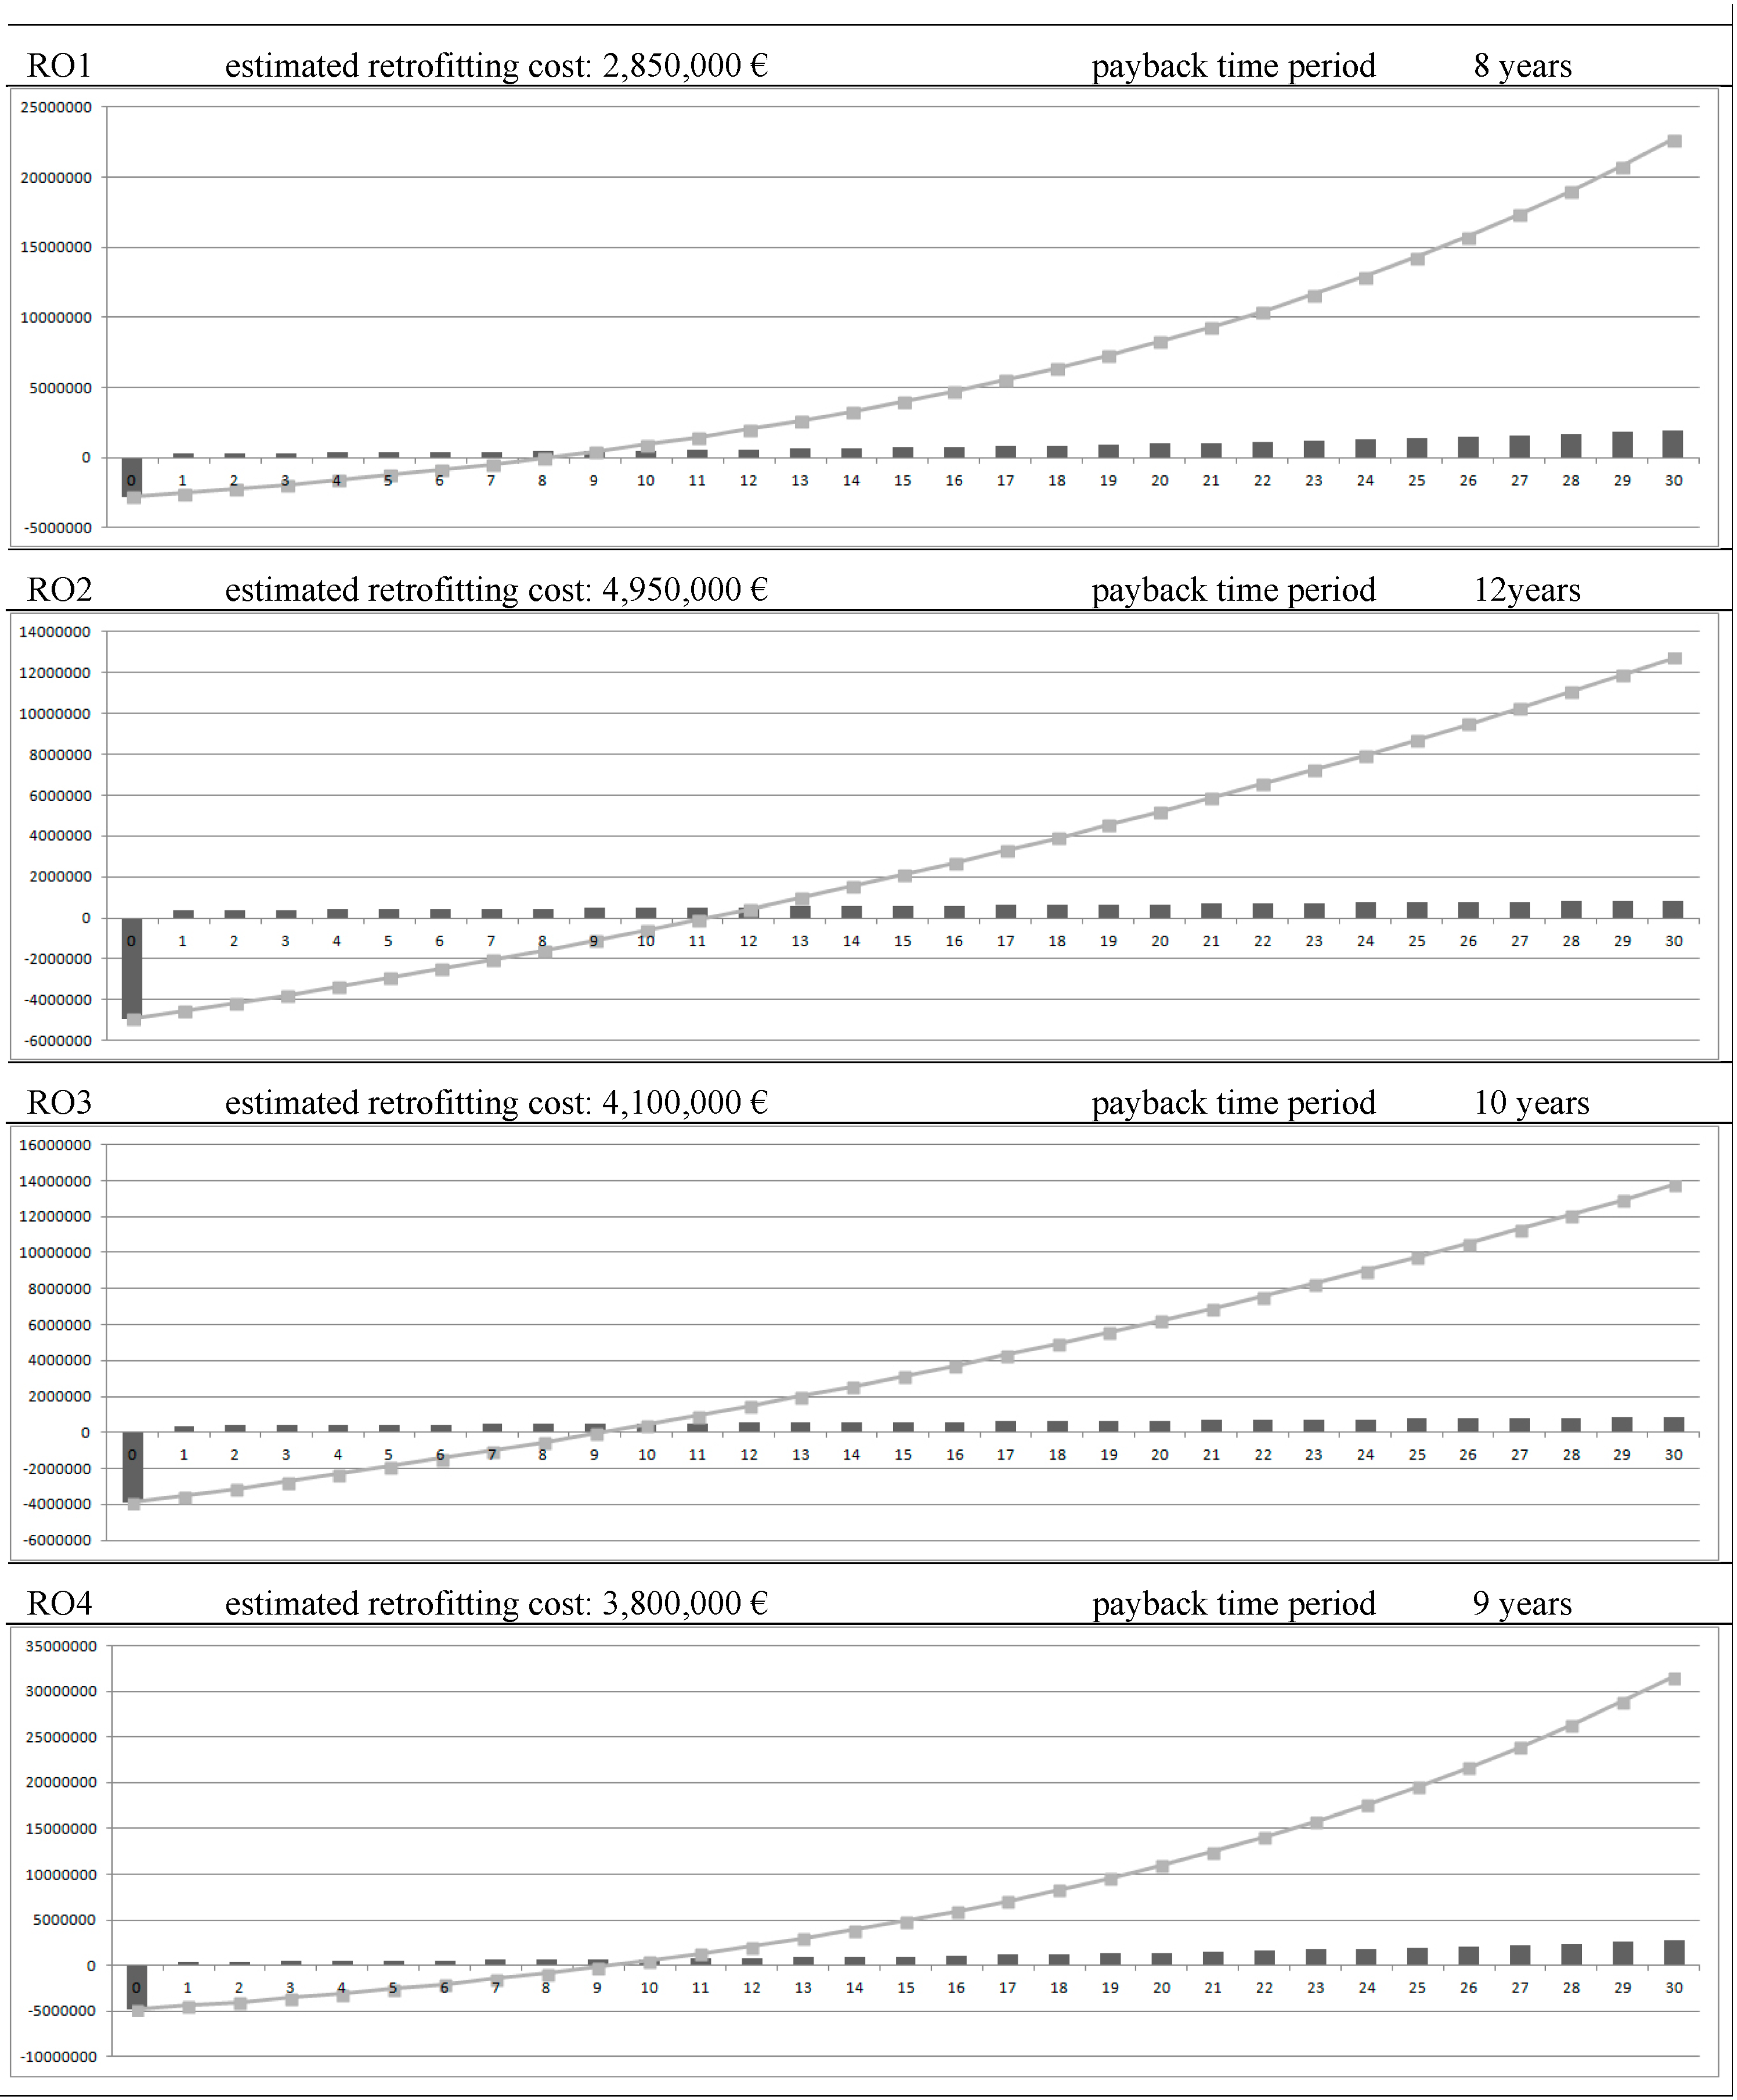
For the purpose of assessing the financial feasibility of the different ROs, a cost effectiveness analysis was performed, setting the period of analysis in 30 years and using the Discounted Cash Flow (DCF) method, where all the present and future inflows and outflows are discounted to obtain the Net Present Value (NPV), the Internal Rate of Return (IRR) or the discounted payback period (DPBP). The NPV, IRR or payback time period can vary in relation to the effectiveness criteria the evaluation is based on [
47]. Regarding annual management and maintenance costs, it is expected a growth of 3.3% per year while the discount rate was assumed at 5%. The calculation model takes into consideration the forecasted trend in inflation equal to 7% for factors related to energy supplies and energy costs, provided by the Electricity and Gas Board.
Figure 4 compares the discounted payback time period for each RO. The expected payback time period is usually under 10 years [
48], therefore with the exception of RO2, which with 12 years is still closed to the preferred threshold, all the investigated actions can be perceived as viable solution. The key discussion consequently revolves around technical and material choice rather than economic factors.
Figure 4.
Discounted payback time period of each RO.
Figure 4.
Discounted payback time period of each RO.
3. Discussion and Conclusions
The study focuses on comparing alternative renovation options for over-cladding building façades as these are the elements that in most cases are responsible for thermal dispersion and high operational energy demand. For achieving effective results and mitigating interventions, roof treatments (such as a cool roof or green roof) have significant impacts but they are not assumed as a key parameter of investigation in this study in which a conventional well-insulated option is envisaged. Roof treatments are widely studied in literature [
49,
50,
51] while the developed methodology aims at connecting issues concerning indoor and outdoor spaces mainly involving buildings façades. In the specific case study, the roof covers a limited surface compared to the one derived by the sum of elevations.
Preliminary analysis showed that due to the a large proportion of glazing in the case study, windows are the place where most deficits and pathologies causing uncomfortable conditions are concentrated and they are also strongly involved in contributing to the overheating effect. Therefore the replacement of the existing windows represents an unavoidable element to achieve effective renovation actions. However the choice of other opaque cladding materials also has a significant impact on microclimate, increasing or mitigating the heat exchange between the building and its surroundings. This phenomenon is acquiring a growing importance due to the average increase of air temperature and to UHI which makes the urban environment uncomfortable and contributes to a higher cooling demand [
52]. Simulations and analysis evidenced that RO2 and RO4 demonstrate the most mitigating impacts despite them being based on different strategies. The first adopts a high performance cladding which exploits the properties of ceramic, while the second reduces the proportion of glazing benefits by the adoption of “cool coating”. Offering equivalent indoor comfort conditions and remarkable operational energy savings (−86% compared to starting conditions), the Renovation Options significantly differ in terms of energy investment required. An increase of approximately 15% compared to the energy investment needed for RO1 is required for RO2, mainly due to the EE quota deriving by the adoption of the ceramic cladding elements, while an increasing of 11% is required by RO3 due to the different process and own EE of the insulated GRC panels. RO2 produces the highest energy amortization quota and it is also the most expensive choice with a financial payback time of 12 years, despite being the one with the best mitigating impact. RO3 represents a competitive choice in terms of performance, despite being more expensive compared to RO1.
Unlike the previous options RO4 is very close to RO1 in terms of energy investment, primarily because it reduces the amount of glazing, whose weight in terms of EE is significant higher than the increased EE quota derived by using the pre-assembled façade panels. The adoption of this solution has also positive impacts on costs in that it reduces construction time and process which make the final payback time comparable to RO1.
At this stage, the methodology is applied to conventional over-cladding options with the declared purpose to test technological solutions that could be regularly adopted in the current market of renovation but it could be applied to more radical options including innovative materials, solar chimney, Trombe wall. A wider range of retrofit options will be considered in the further development of this research including new components such as phase changing materials or glass films, whose feasibility is often conditioned by budget constraints, with the aim of increasing the understanding of their significance in the energy balance and their impact on façade performance level.
The study focuses on the evaluation of the energy investment as a tool to compare the effects of technical and material choices on indoor comfort and their impacts on the built environment as a complex system. Indoor comfort is linked to energy use and to end users’ behaviour with relevant impacts on outdoor conditions. Further studies are needed to obtain a clearer and more complete picture, the proposed case study offers a simplified demonstration of how a multiple-perspective approach, coupling tools and strategies coming from different and very specific sectors, can be applied to quite ordinary conditions.
In order to outline the links between the development of low-emission strategies and climate-resilient approaches in renovating the built environment, the study will also focus on impacts of materials and technological choices on the external spaces considering the interactions with vegetation and other relevant elements characterising the urban fabric. Following the multiple perspective assumed for this research, landscape and vegetation have to be considered both for their contribution in terms of mitigating effects and for their impact on end users well-being.
It can be finally argued that understanding the processes of sustainable urban retrofit, at a district or a city scale, starts the analysing of the relation between buildings as well as the spaces they create, and requires an investigation of complex interrelations between different technical sectors in order to establish the basis for an integrated perspective on socio-technological systems innovation [
53].


