1. Introduction
Much of the energy consumed within buildings arises from the requirement to produce comfortable environments for human occupation, principally taking account of thermal and lighting needs. As a result of concerns about the earth’s limits of non-renewable energy resources and for the global warming potential associated with consumption of fossil fuels; research into building environments has been directed for many years towards optimizing design parameters to reduce energy consumption. However, in order to produce ideal conditions of thermal comfort, the amount of energy required for heating and cooling in many work environments remains significant, even when improved building fabric design is used together with efficient space conditioning systems. This leads to the conclusion that new initiatives and modifications to the way in which occupants experience, use, and interact with buildings will be necessary in order to exploit other options for energy use reduction in the future.
One area in which the author has been active for a number of years with a range of collaborators has been research into less critical spaces of buildings: that is, those spaces which act as ancillary or transition spaces rather than those which are at the heart of the work environment (and which would thus have needs for a distinct level of comfort for productivity). These can be identified as: entrance canopies; foyers; lift lobbies; corridors; stairwells; circulation spaces; atria; and other spaces which act as links between indoor rooms or between the interior and the exterior.
Often such spaces have a stronger thermal connection with the exterior environment compared to the interior because of the location of opening doors and the use of glazing between those spaces and the exterior, thus creating weaker thermal separation. Conversely, it is more often the case that walls are placed between transition spaces and the interior rooms, creating a greater degree of thermal separation from the inside. And yet the same overall building service systems and comfort standards are frequently, if not always, applied to such transition spaces as to the interior, and at greater potential energy cost.
The purpose of this paper is to draw together research undertaken over several years which has investigated the environmental conditions found in such transition spaces along with surveys into occupant reaction. Such spaces cannot be treated simply as extensions to the interior environment since they are plainly used and thought of differently by occupants, and they therefore require their own research, and ultimately, design standards. Transition spaces can also be used to help modify the expectations of occupants for environmental conditions about to be encountered moving around a building. The research supports a view that in order to optimize energy use in buildings and thus benefit broader sustainability concerns, social factors and personal reactions as well as environmental factors need to be taken into account in the analysis.
2. Comfort Standards
Thermal comfort can be defined as “that condition of mind that expresses satisfaction with the thermal environment” [
1]; from this widely used definition flows an immediate recognition that comfort cannot be defined in absolute terms and that there will always exist person-to-person variations. Since it is a condition of mind, not only physical parameters of the environment but also social, cultural and psychological issues have influences.
The majority of comfort standards and assessment tools currently in use around the world owe their credibility to a prolonged history of research and development through the middle part of the 20th Century resulting in many publications and including the seminal work of Fanger [
2]. This period of research establish a method for determination of human comfort based on heat balance of the human body, and taking account of six parameters: air temperature; mean radiant temperature; relative air velocity; relative humidity; clothing level; and metabolic rate. Algorithms were developed which combined the six parameters’ values in order to predict average occupant response on a sensation scale: the “predicted mean vote” (PMV). The numerical scale for the vote being representative of sensations according to the following range: +3 = hot; +2 = warm; +1 = slightly warm; 0 = neutral; −1 = slightly cool; −2 = cool; −3 = cold. Deviations from the neutral state would incur a greater proportion of occupants expressing their dissatisfaction with their thermal environment. Of course because of person-to-person variations, even at an average neutral condition, some occupants will be dissatisfied, however the predicted percentage dissatisfied (PPD) increases quickly as conditions move away from neutral. If the PMV is kept within the range +0.5 to −0.5, then the predicted percentage dissatisfied should be no more than 10%; operating within this range is normally regarded as an acceptable measure of comfort.
More than this however, comfort standards and definitions in wide usage assume that occupants will have to experience an environment for some period of time in order to ascertain a valid reaction. The ASHRAE standard [
1] states a period of occupation of at least 15 minutes is required. ISO 10551 [
3] suggests a stay of at least 30 minutes is required. ISO 7730 [
4] indicates that predictions of comfort for occupants should relate to steady-state conditions of the internal environment with time-weighted averages of variables over an hour-long period being used, as well as suggesting limits of variability for key parameters for application in use. The reason for this time period is explained as arising from the irregular impact of transient conditions on comfort feelings of occupants.
For some transition spaces the period of time spent there is very short and might therefore be disregarded by designers as having little or no meaningful influence. In fact the opposite can be true because there are impacts both on energy use for space conditioning and also in terms of affecting perceptions and expectations of occupants. The periods of time over which thermal conditions are experienced will naturally interact with psychological effects as well as physiological ones.
Questions may therefore arise as to the overall applicability of comfort standards and conventional means of assessing environmental conditions, as well as occupant sensation and reaction. In almost all cases the time period over which an occupant will experience the transition space is unlikely to be as long as an hour and may frequently be less than the shortest time period identified in standards of 15 minutes. It is also unlikely that positions of measurement points or control sensors will be exactly co-located with the occupant unless actually attached to the person. Despite the misgivings, methods of design such as described in BS EN 15251 [
5] would currently suggest that analysis of building comfort should include transition spaces, however there is the potential to consider building space categorization or type of space as allowing a degree of leeway in the strictness with which comfort standards could be applied.
Table 1 indicates the definitions for categories and corresponding PMV and PPD values from two related standards. Although the standards explicitly refer to the use of the categories within mechanically heated or cooled buildings, they give a basis for a more general understanding that not all internal environments may require the same prescriptive criteria.
Table 1.
Building categorizations used in comfort standards.
Table 1.
Building categorizations used in comfort standards.
| Category of thermal environment | Thermal state |
|---|
| ISO7730 [4] definition | BSEN 15251 [5] definition | Range of PMV | PPD (%) |
| A | I | −0.2 < PMV < +0.2 | <6 |
| B | II | −0.5 < PMV < +0.5 | <10 |
| C | III | −0.7 <PMV< +0.7 | <15 |
| n/a | IV | PMV < −0.7 or +0.7 < PMV | >15 |
A further opportunity to adjust the framework of design standards comes from the use of adaptation opportunities. In both European and North American standards there is scope for application of alternative approaches for free-running buildings and naturally ventilated buildings—generally classified as those in which there is no artificial/mechanical heating or cooling (though natural ventilation can be encouraged and simple mechanical means for circulation of ambient air may be allowed). There are some modest variations between European and North American Standards in the definition of buildings and sorts of environmental conditioning systems for which adaptive comfort evaluation can be used, however in both cases they are classed as significantly different to the archetypical heated and cooled, and often closely controlled, office building. In more naturally conditioned spaces there is an assumption of adaptive opportunity; that is the potential for occupants to modify: their clothing, their position within the building, window opening, shading devices, and possibly even their activity level, all in relation to their climatic experiences. Researchers, notably Nicol and Humphreys, have in recent years been able to establish these alternative approaches to comfort determination to a reasonable degree of sophistication [
6,
7]. It could also be argued however that transition spaces, although attached to, and in some cases, part of the heated and/or cooled building, have a function which is more akin to a free-running space because of aforementioned issues (
i.e., stronger thermal connection to the exterior environment).
In the free-running buildings the comfort requirements are based on broader limits and upon temperatures derived from analysis of mean monthly outdoor temperatures. Clearly part of the reasoning for using a different approach is that in such buildings the environmental conditions which might be encountered will be influenced to a significant degree by external conditions, and also that occupants will be prepared for those environments and adjust such things as their clothing to match.
The majority of comfort assessments reported in the literature and referred to by approved standards concern indoor environments in which occupants are likely to be engaged in largely sedentary activities and wearing typical indoor clothing ensembles. For example metabolic rate levels of between 1.0 and 1.3 met, and clothing levels of approximately 0.5 to 1.0 clo, depending upon season. However in transition spaces the activity level will normally be higher because the occupants could be moving around (met values of 1.7 to 2.0 may be more appropriate), and also because they may be wearing clothing related to the environment from which they have just emerged (e.g., outdoors) with clo values ranging 1.0 to 1.8 or higher, (information taken from [
1]).
An additional element of a number of surveys which have been carried out is the investigation of the role of expectation; in other words what kinds of comfort conditions building occupants were expecting to find in the space they are experiencing. Transition spaces clearly affect this perception and pre-condition expectation. This has been acknowledged in a range of earlier studies. McIntyre [
8] stated that “a person’s reaction to a temperature which is less than perfect will depend very much on his expectations, personality, and what else he is doing at the time”. It can also be argued that though it is the case that psychological adaptation is the least studied of adaptive mechanisms that it could play the most significant role in explaining differences between observed and predicted thermal responses [
9]. It would also appear that expectation has a significant role in causing differences between occupant reaction to environmentally controlled and more free-running naturally ventilated buildings; and expectation was advanced by Fanger and Toftum as an element to explain variations in their analysis of comfort studies [
10].
All of these various issues concerning the application of comfort standards indicate that transition spaces deserve investigation and treatment from a different position when attempting to establish design parameters and ranges of acceptability. Clearly if design standards are interpreted more liberally than those advised in the main design guides, then there may be opportunity to reduce the size and operation of building space conditioning systems with consequent potential to reduce energy consumption and energy costs.
3. Types of Transition Space
Three broad types of transition space can be identified: entrance areas and other spaces with strong connections to the exterior; interior circulation spaces with greater compartmentalization and separation from the exterior; and semi-occupied spaces with secondary uses in which it can be assumed occupants will gather for a longer period of time. The proportional area of a building which could be associated with transition spaces is of the order of 25% but can be significantly higher if large atrium spaces are included (range of between 10% and 45%) [
11]. The key features of each space type can be identified as follows:
Entrance Zones: metabolic rate likely to be of walking pace level or above 1.7–2.0 met, but within wider range 1.2–2.6 met, depending on what might be being carried or speed of movement; clothing insulation value likely to be representative of external conditions—may therefore vary from approximately 0.5–2.0 clo or higher; in general likely to be above indoor values; time period of residence likely to be short, typically 5 minutes.
Circulation Zones: metabolic rate likely to be of slower walking pace or standing 1.2–1.7 met, occasionally higher or lower 1.0–2.0 met; clothing insulation value likely to close to indoor standards 0.5–1.0 clo, though occasionally more for persons entering building; time period of residence variable but typically 5–10 minutes.
Longer-term Occupancy Zones (such as atria): metabolic rate variable depending on activity and function—may be similar to circulation zone but more likely to be lower at about 1.0 met when seated; clothing insulation value likely to be similar as for circulation zones 0.5–1.0 clo; time period of residence depends on mode of use and can be as for circulation space, but should be allowed to be much longer, typically 10–30 minutes.
4. Entrance Zones
Entrance zones are particularly important in modifying thermal expectations as well as thermal experiences for occupants; though residence time may be short such spaces reduce the thermal shock of changes in conditions, allowing time for adaptation. They also correspond to the psychological adjustment associated with the change between the openness of the exterior and the enclosure of the interior.
In warm climates there is a strong tendency to specify energy intensive air-conditioning as the all-encompassing solution to provision of comfort in indoor environments, however there have been a number of studies which have concerned adaptation in more free-running environments [
12,
13]. There has also been research into differences between naturally ventilated and air-conditioned spaces in warm climates [
14]. Arising from noticeable variations in the way occupants understood the environmental conditions in their buildings in a hot humid climate, a further detailed investigation of transition spaces in Bangkok was carried out [
15]. Four groups of building users were considered; those moving inwards and outwards from both air-conditioned and naturally ventilated indoor environments. The specific areas investigated included entrance halls, lobby areas, foyers and canopies which were encountered at building perimeters.
The field survey involved 1143 occupants (593 in the cool season of December/January and 550 in the warm season in April), and these were split into the following sub-groups: group 1—those moving from outdoors to air-conditioned indoors 254; group 2—those moving from outdoors into naturally ventilated environments 315; group 3—those moving from air-conditioned indoor environments to the outdoors 281; and group 4—those moving from naturally ventilated indoor environments to the outdoors 293. Metabolic rates were estimated for each group in each season along with clothing values; metabolic rates varied from 1.0 to 1.9 met and clothing from 0.53 to 0.65 clo with the higher clo values attributable to occupants of the air-conditioned spaces who typically wore an extra garment or one with more insulative value. Along with measurements of the environmental parameters (air temperature, radiant temperature, humidity and air movement) the subjects provided responses to questions about sensation and expectation on the seven-point scale mention above and to a preference question using a three-point scale (−1 = cooler; 0 = no change; +1 = warmer).
Figure 1,
Figure 2 and
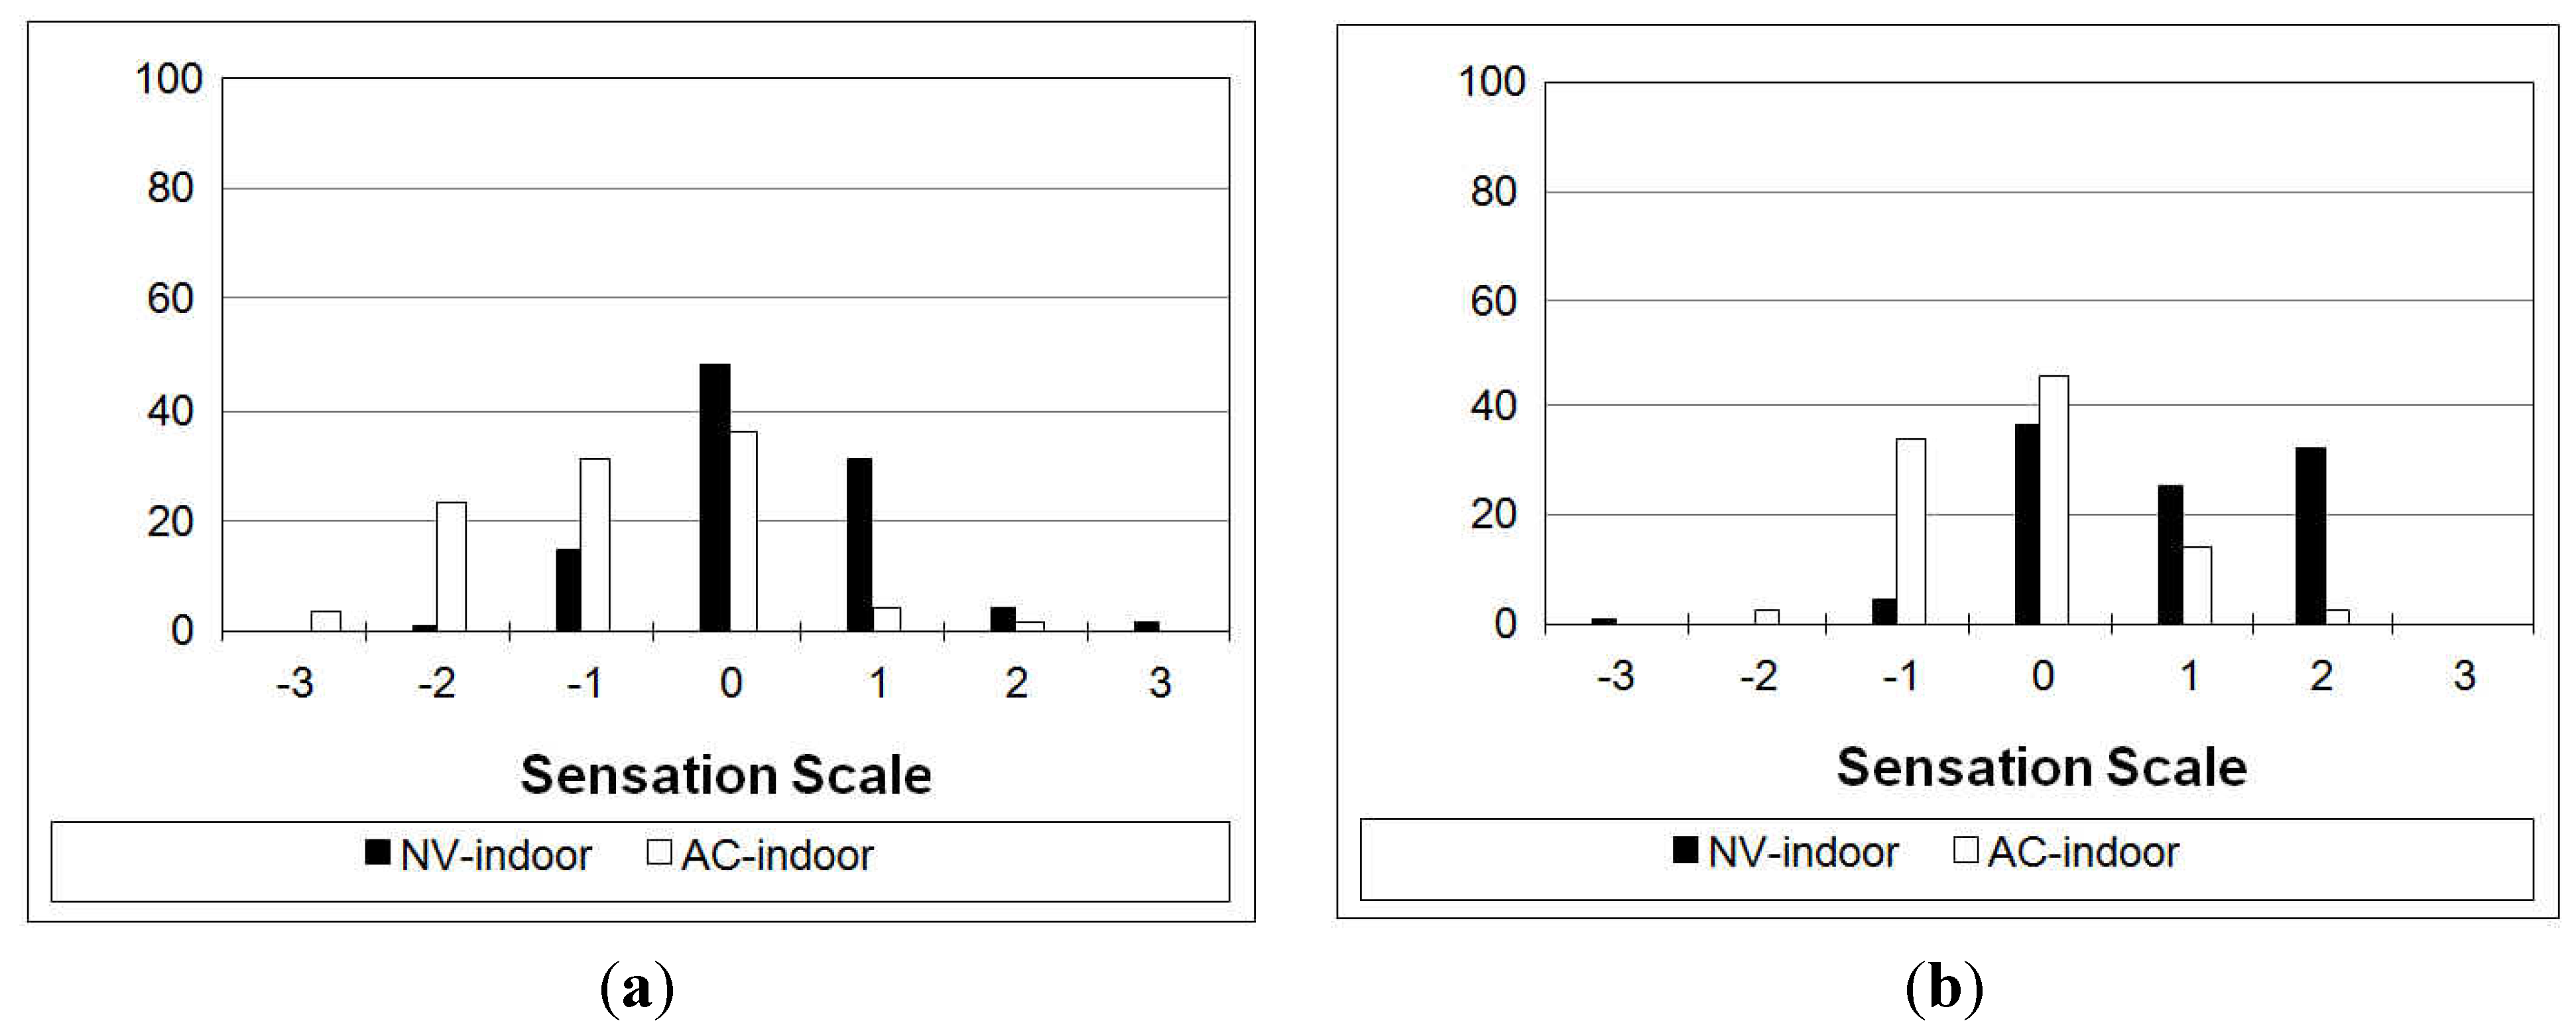
Figure 3 summarize the voting patterns from the occupants in relation to sensation, expectation and preference for those entering naturally ventilated (NV) and air-conditioned (AC) environments.
Focusing on the groups going into the building through the transition space entrance the following key information can be distilled:
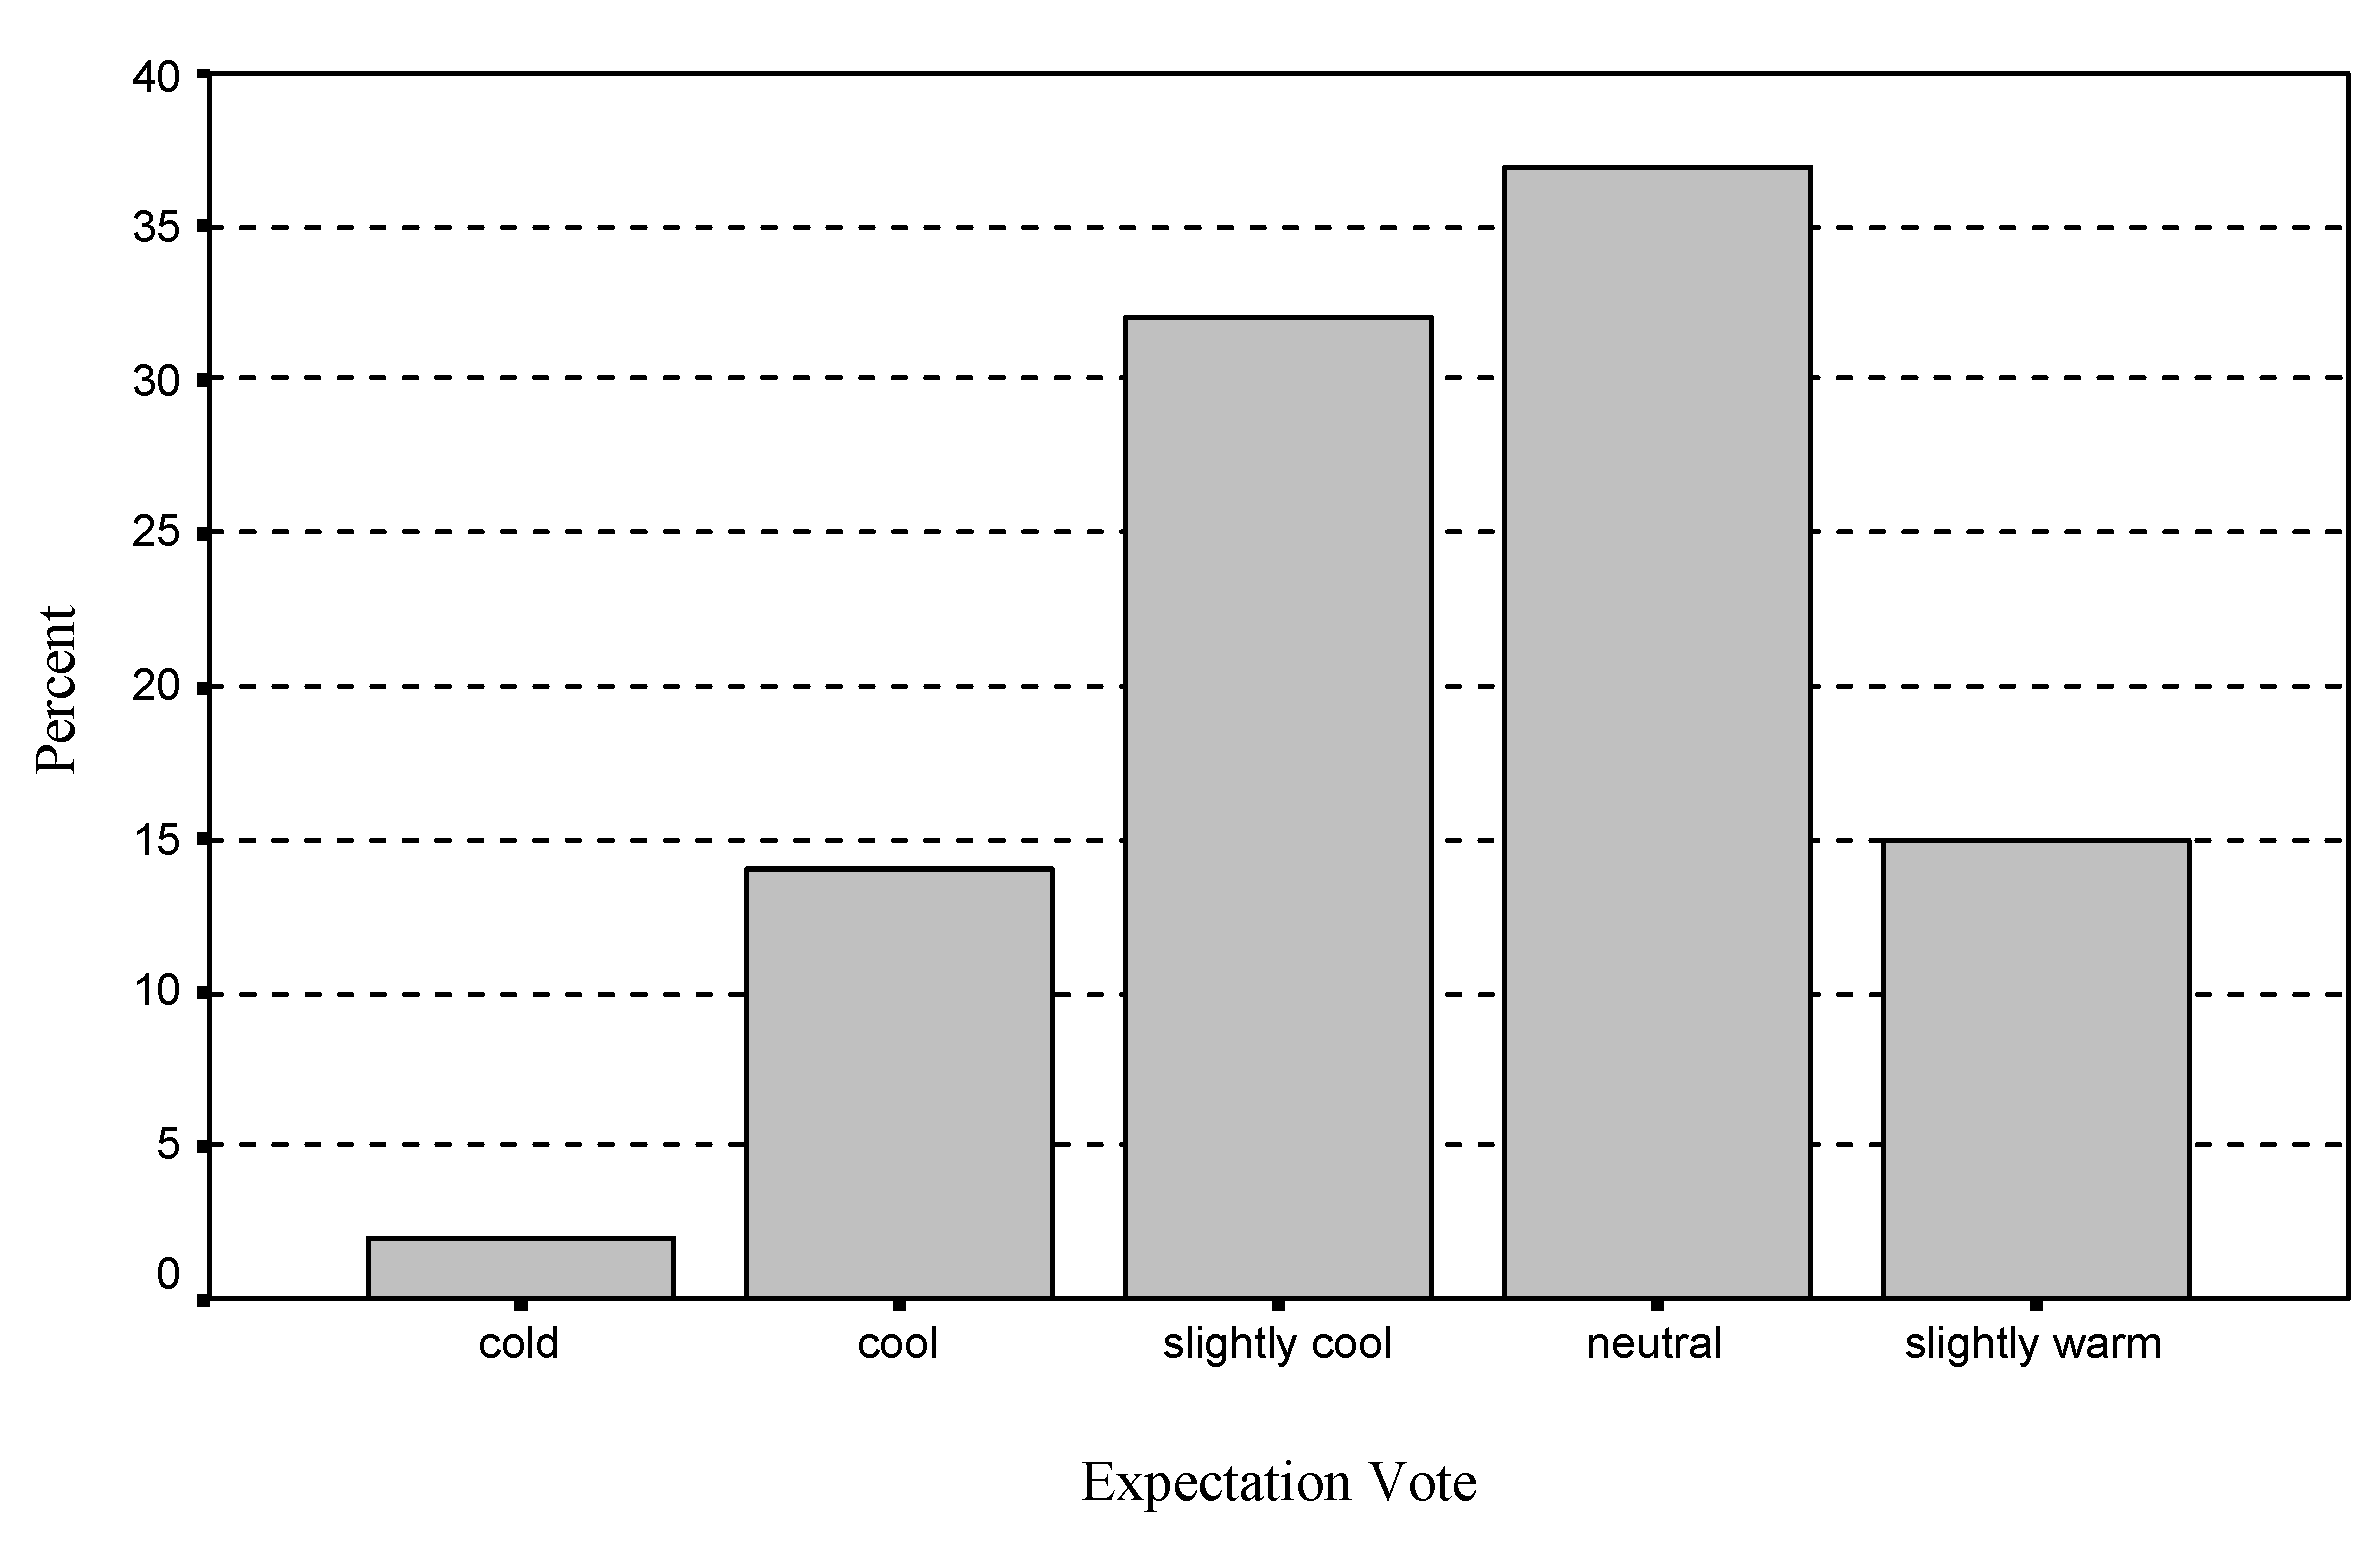
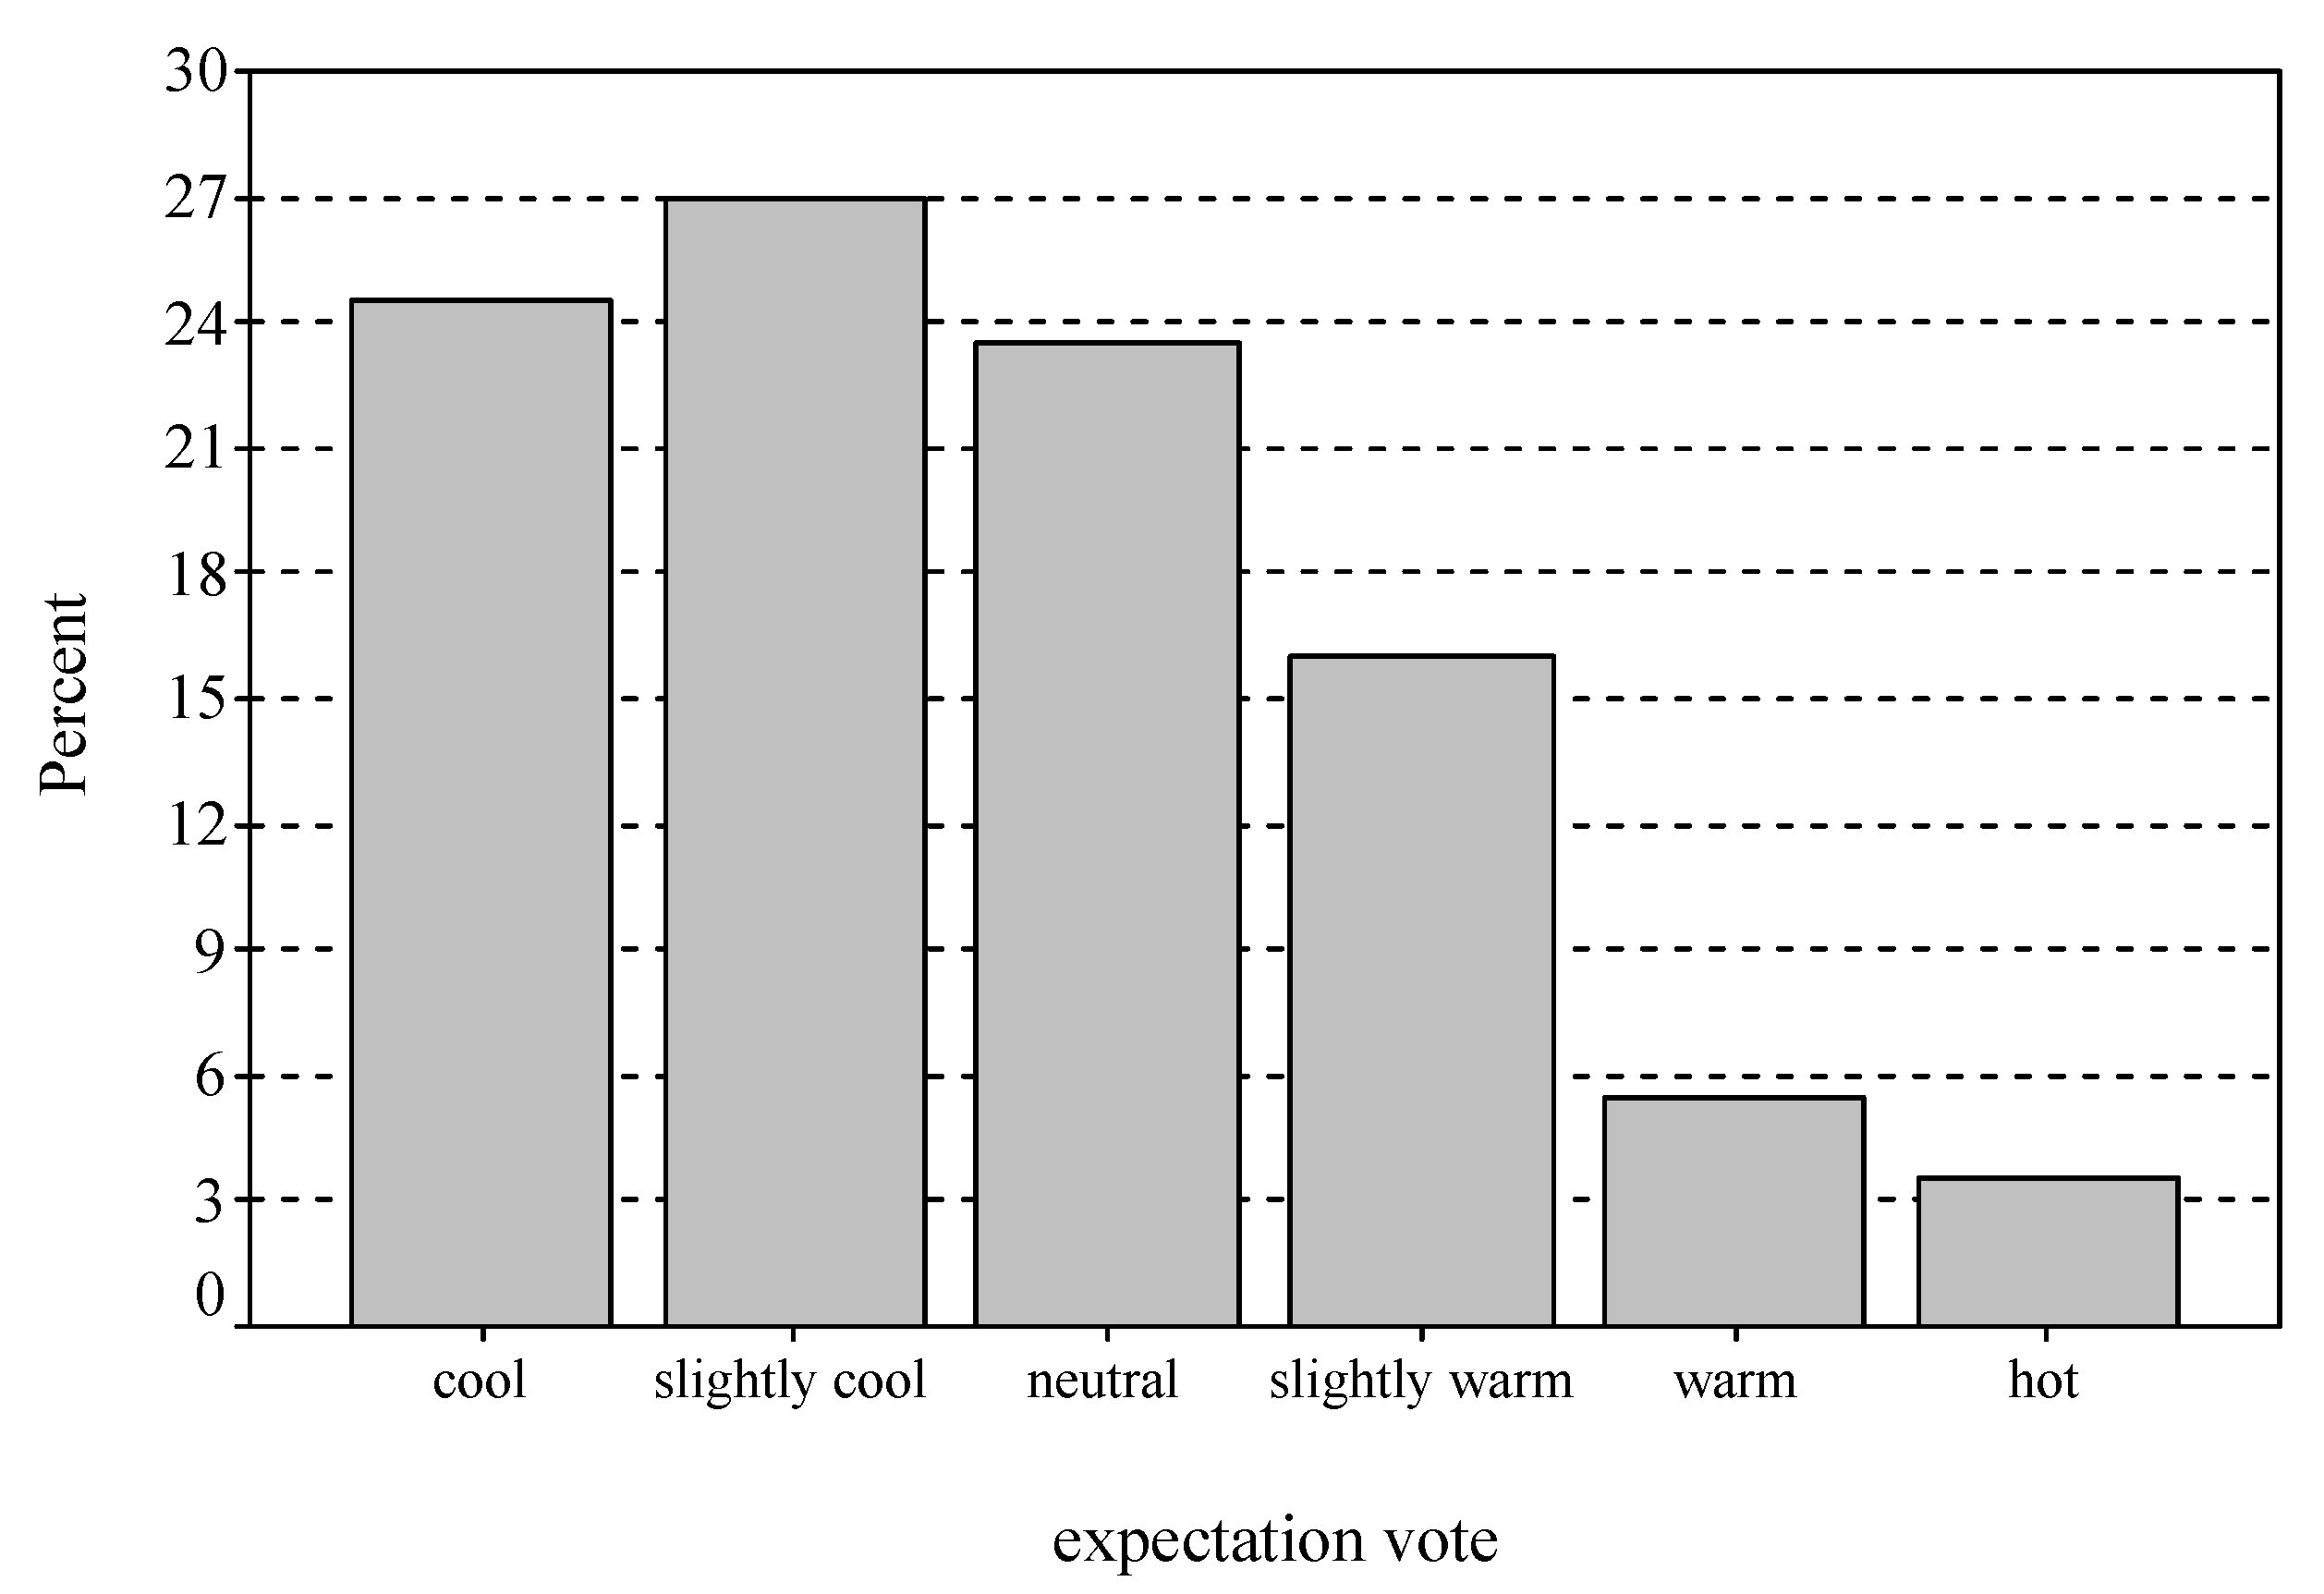
Those entering air-conditioned environments tended to have both sensations and expectations biased towards the cool side of the scale;
Those entering air-conditioned environments although sensing and expecting to feel cool did not have a preference for warmer conditions as might be inferred, and in fact still wanted to be cooler still;
Those entering naturally ventilated environments had relatively balanced sensations during the cool season, but warm sensation in the warm climatic period, and with expectations of warmth in that season too;
Those entering naturally ventilated environments had a preference for cooler conditions in both cool and warm seasons.
Figure 1.
Relative frequency distribution (%) of thermal sensation votes in (a) the cool season; and (b) the warm season (NV = naturally ventilated; AC = air-conditioned).
Figure 1.
Relative frequency distribution (%) of thermal sensation votes in (a) the cool season; and (b) the warm season (NV = naturally ventilated; AC = air-conditioned).
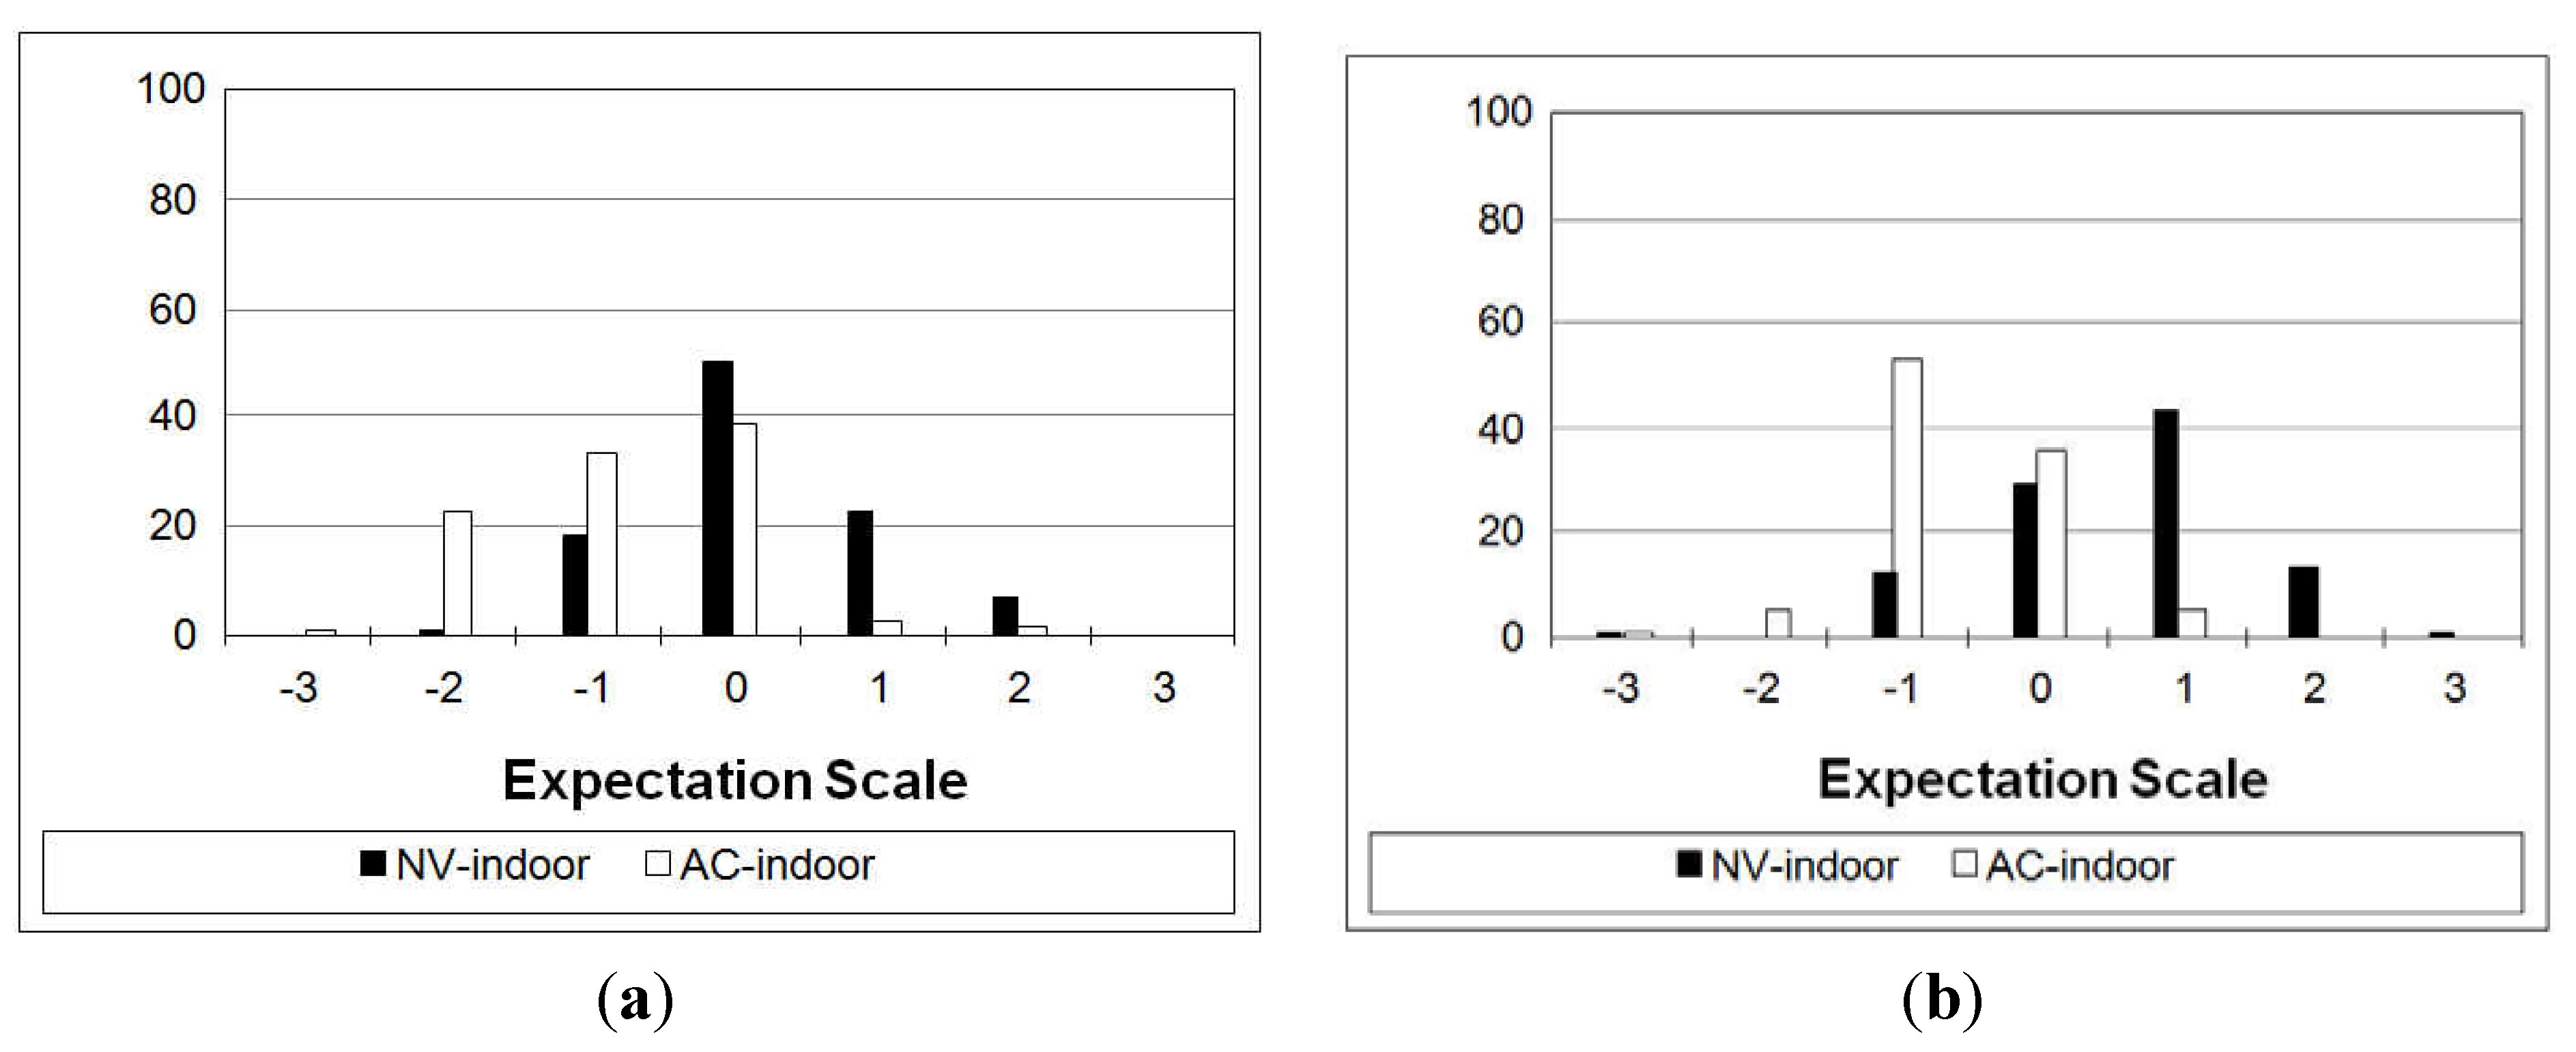
Figure 2.
Relative frequency distribution (%) of thermal expectation votes in (a) the cool season; and (b) the warm season (NV = naturally ventilated; AC = air-conditioned).
Figure 2.
Relative frequency distribution (%) of thermal expectation votes in (a) the cool season; and (b) the warm season (NV = naturally ventilated; AC = air-conditioned).
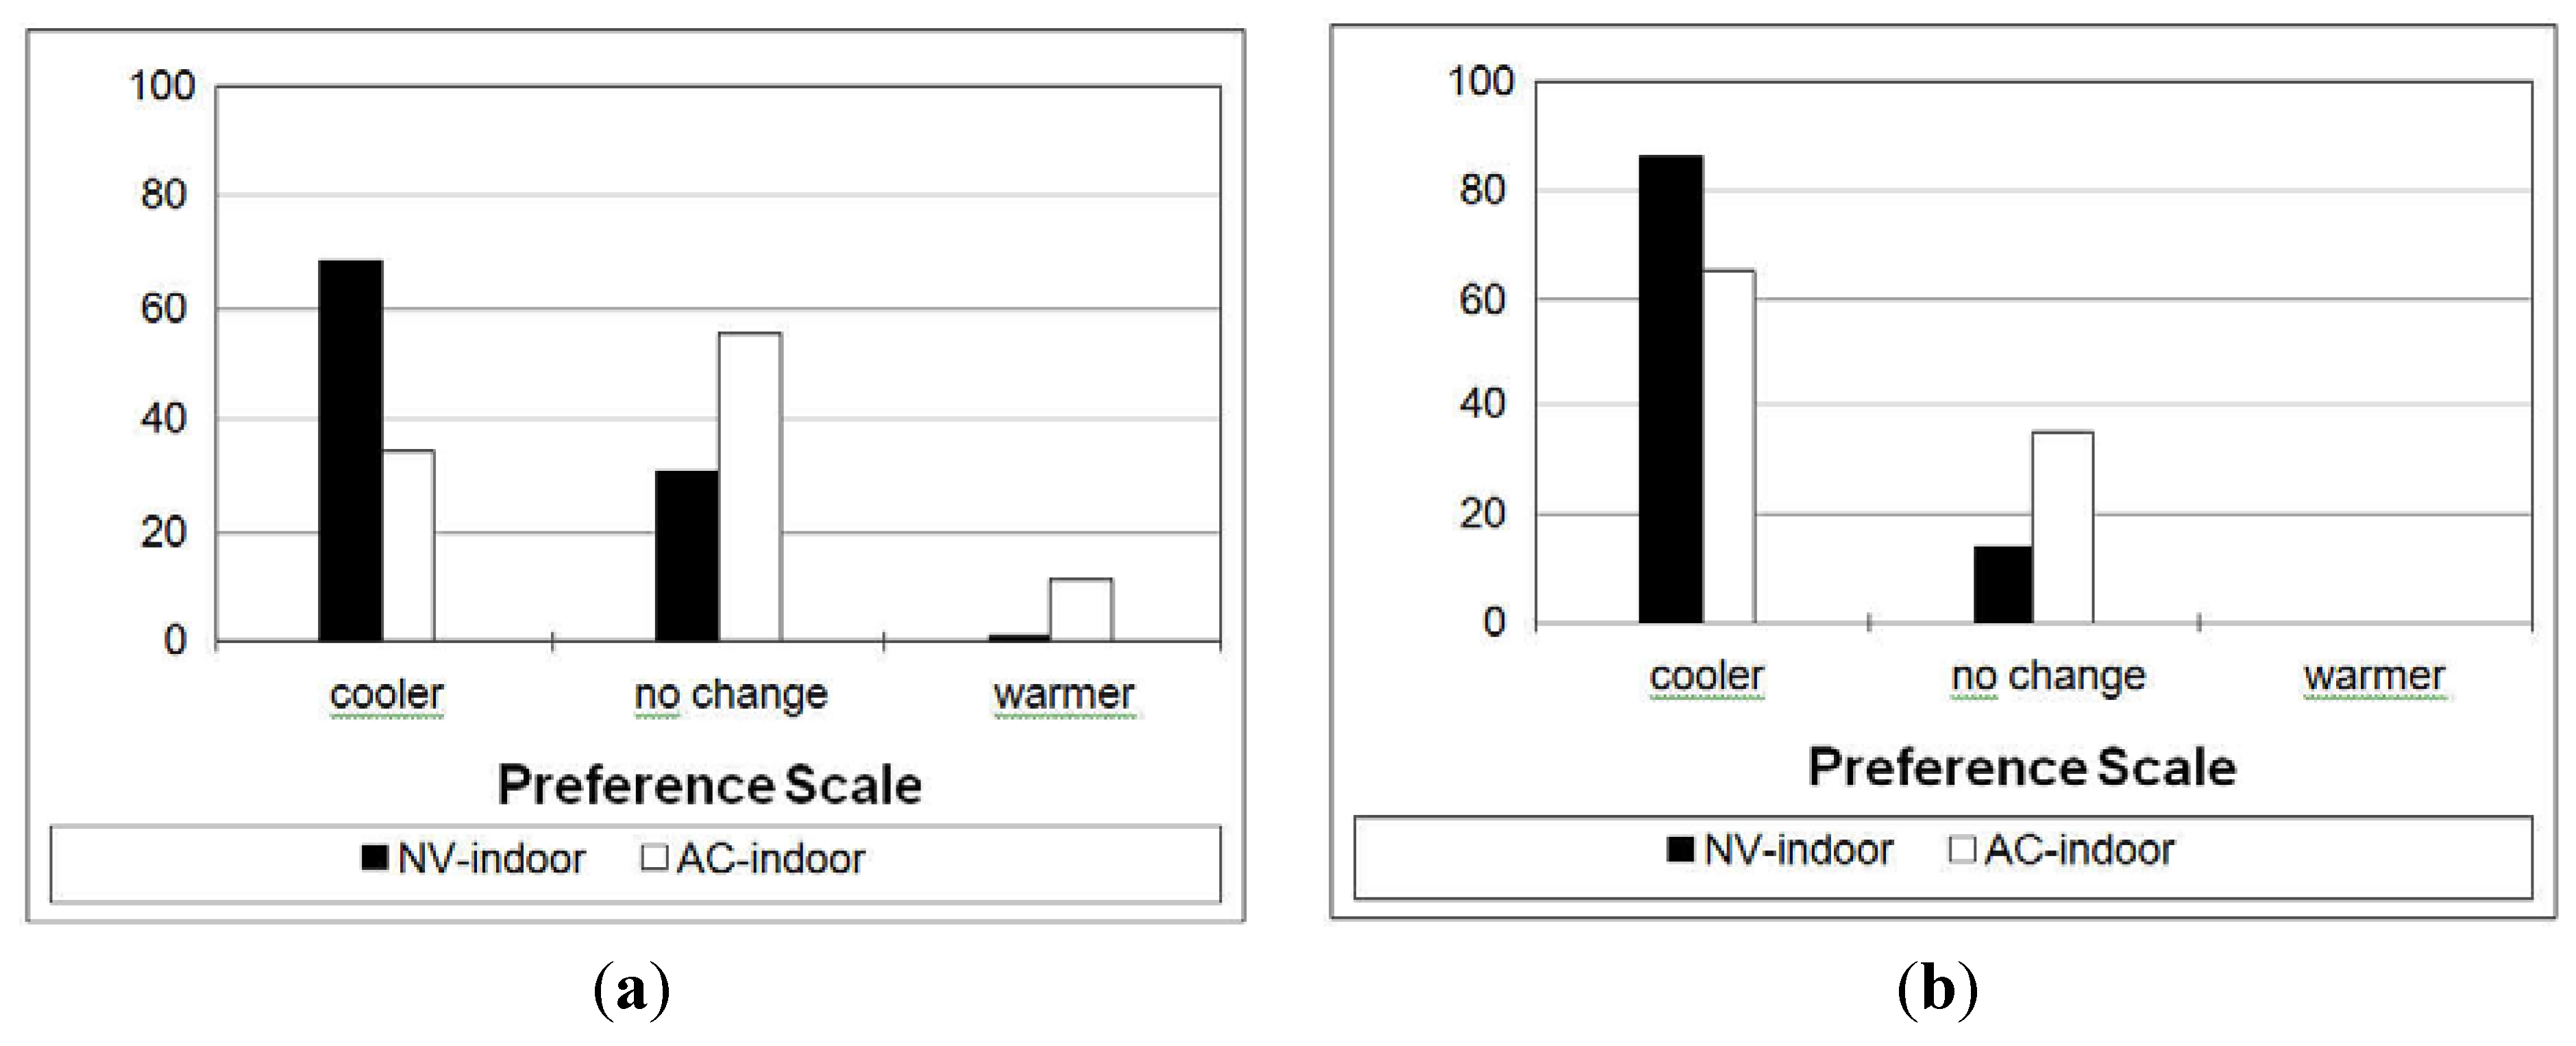
Figure 3.
Relative frequency distribution (%) of thermal preference votes in (a) the cool season; and (b) the warm season (NV = naturally ventilated; AC = air-conditioned).
Figure 3.
Relative frequency distribution (%) of thermal preference votes in (a) the cool season; and (b) the warm season (NV = naturally ventilated; AC = air-conditioned).
The evidence for the air-conditioned environments might therefore suggest that the provision of air-conditioning encourages occupants to want more of it; something which does not generally produce reductions in energy consumption. The evidence does not suggest that those entering naturally ventilated spaces can be satisfied by the transition space conditions however. And yet, the percentage voting ‘hot’ in sensation was remarkably low and the data show 90% voting in the central three categories of comfort for the cool season and 67% for the warm season, which might indicate that at least in the cool season the perceived need for air-conditioning could be reduced. The mean values of sensation, expectation and preference are shown in
Table 2.
Table 2.
Thermal responses for Bangkok study (adapted from [
15]).
Table 2.
Thermal responses for Bangkok study (adapted from [15]).
| Mean of actual thermal response votes | Subjects entering air-conditioned space | Subjects entering naturally ventilated space |
|---|
| Cool period (December/January) | Sensation vote | −0.80 | 0.27 |
| Expectation vote | −0.76 | 0.17 |
| Preference vote | −0.23 | −0.67 |
| Warm period (April) | Sensation vote | −0.20 | 0.84 |
| Expectation vote | −0.61 | 0.58 |
| Preference vote | −0.65 | −0.86 |
In the report of the Bangkok study [
15] there was discussion about interpretation of the relationship between neutral (or comfort) temperatures and the preference for conditions expressed by the subjects surveyed. There seemed to be a contradiction between thermal sensation and thermal preference however this could be explained by the conflict arising from connotation as discussed by Fisk [
16] and also supported by a study in Pakistan [
12] which could imply that in hot climates the preferred temperature is below the comfort temperature. McIntyre [
8] also noted the connotation of words that in a cool climate people describe their preferred state as ‘warm’, whereas in warm climates the desirable state is “cool”. These points of view therefore suggest that interpretation of the results should be undertaken carefully however there does seem to be case that opportunity to reduce air-conditioning use, whilst still allowing occupants to feel comfortable, exists, particularly in the cooler season. The Bangkok study identifies potential to improve occupant comfort by using transition zones to temper reaction to changes in environmental conditions.
5. Circulation Zones
In contrast to the warm humid climate in which the entrance zone study above was performed, an investigation into the wider range of circulation spaces used in buildings was carried out in the UK [
11]. Six different spaces were investigated in and around educational buildings, they consisted of: the entrance foyer of a library; a mezzanine circulation space set above the principal entrance to a large building; an open circulation area adjacent to a café and staircase; a lift lobby circulation space; a library turnstile area; and a linking covered walkway between two buildings.
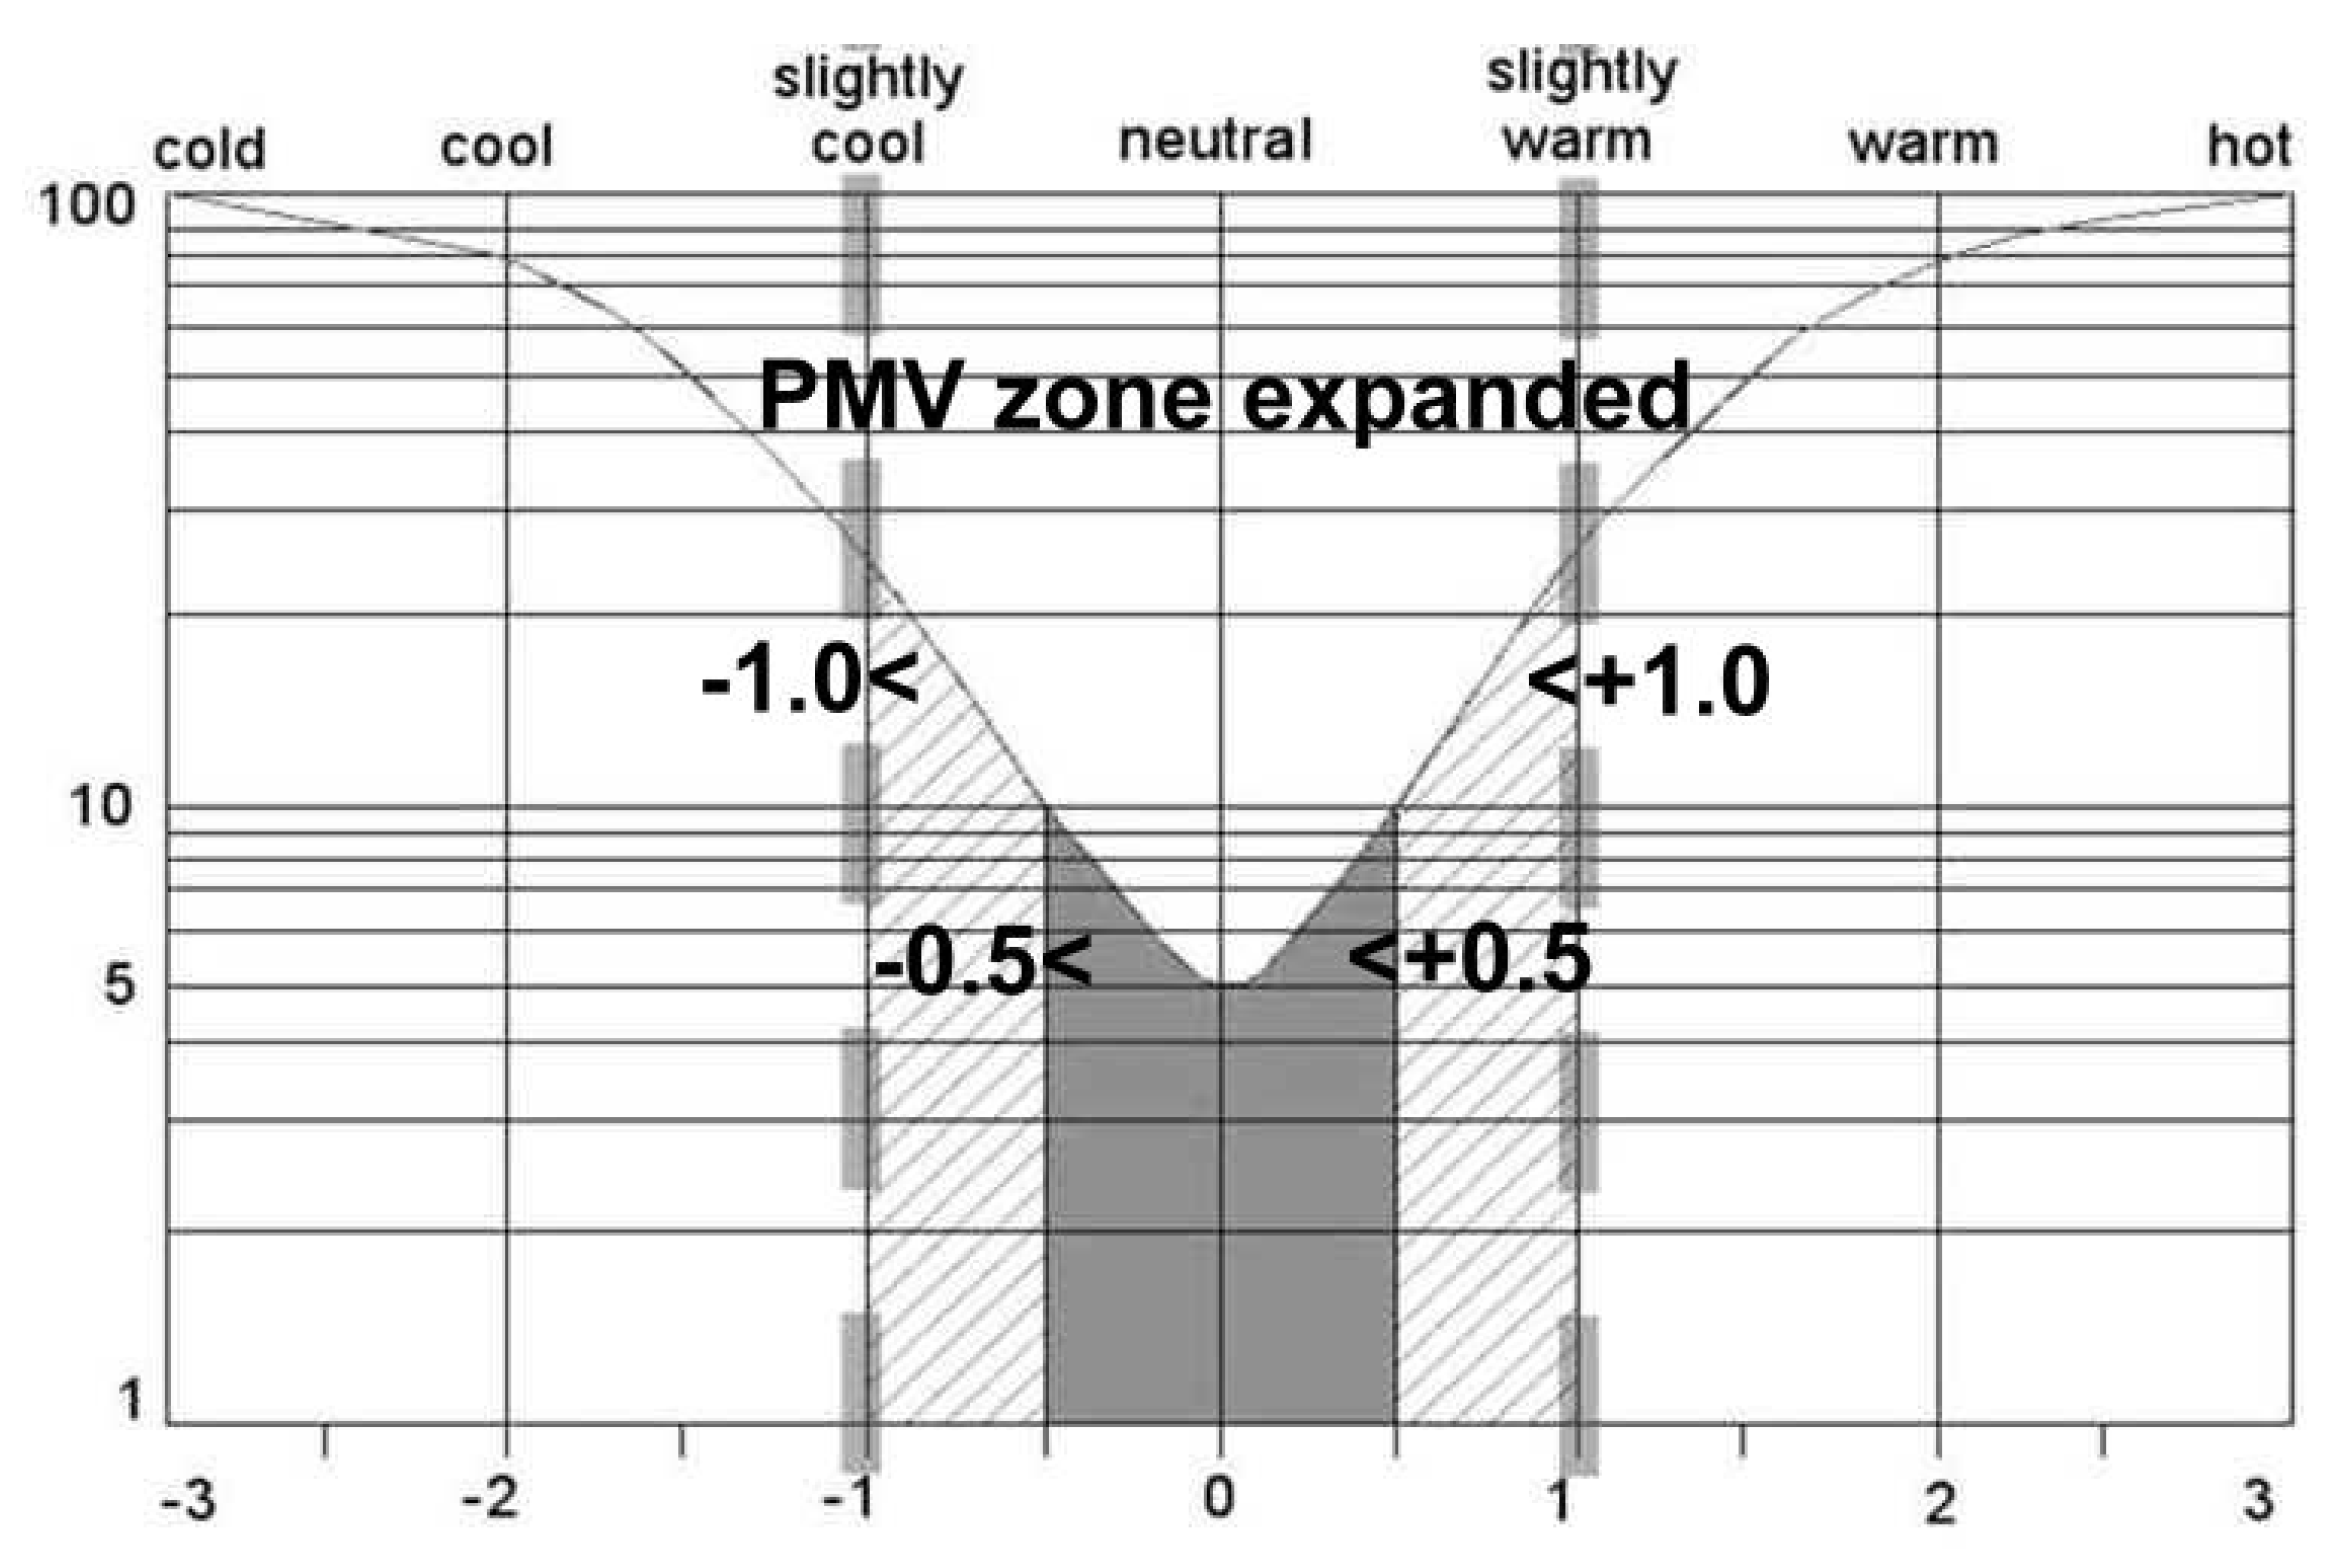
The study collected and correlated data from environmental measurements in the circulation spaces together with occupant reactions and in particular linked subjective responses to predicted bands of comfort sensation. An investigation of the widening of the comfort standards associated with the PMV values as shown in
Table 1 and expressed in
Section 2 above was tested. Rather than expecting PMV to lie in the range ± 0.5 or ± 0.7, the suggestion was advanced to consider ± 1.0 as being a possible option.
Figure 4 illustrates the relationship between PMV (x-axis) and PPD (y-axis).
Figure 4.
Predicted Percentage Dissatisfied (PPD) compared to Predicted Mean Vote (PMV) showing the impact of extending the comfort standard range (adapted from [
11]).
Figure 4.
Predicted Percentage Dissatisfied (PPD) compared to Predicted Mean Vote (PMV) showing the impact of extending the comfort standard range (adapted from [
11]).
One hundred and twenty-three participants took part in the surveys; approximately 20 in each location identified above. Since the numbers were low, cross comparisons between the different types of space were not carried out, rather the totals were used to inform understanding. Thermal sensation was assessed using the seven-point scale and a five-point scale for preference was used (a preference to be one of the following: much warmer; slightly warmer; no change; slightly cooler; much cooler). In addition a further scale of “comfortability” was introduced with options of: not comfortable; slightly comfortable; and comfortable. This is not a prescribed scale derived from standards but was thought of as offering some potential to extract additional information for comparison and also to exclude some aspects of word connotation identified in the previous section.
Since the focus of the study was to examine the PMV banding and its place in comfort standards the data arising from this investigations was collated in a different way: comparing PMV banding with the percentage responding with a sensation of neutral.
Table 3 shows the results and indicates that fewer occupants than might have been expected voted for neutral in low deviations of PMV from zero; even though conditions indicated that this was the appropriate sensation. Perhaps more interestingly the data also show that it is possible for occupants to find comfort even when the predicted sensation is rather different: 28.1% in the range ± 0.5 to ± 1.0 and a further 28.4% of occupants experiencing even more significant variations in PMV.
Table 4 shows the results comparing against the thermal preference votes of the occupants. This also shows that even when the PMV is some way outside the conventional standards for comfort that occupants are sufficiently satisfied that they request “no change”, including up to a PMV of ± 2.5.
Table 3.
Thermal sensation votes compared to PMV bands for the circulation zone study (adapted from [
11]).
Table 3.
Thermal sensation votes compared to PMV bands for the circulation zone study (adapted from [11]).
| PMV bands based on measured conditions | Number of subjects in this band | % in each band responding “neutral” |
|---|
| 0 to ±0.5 | 42 | 43 |
| ±0.5 to ±1.0 | 32 | 28 |
| ±1.0 to ±1.5 | 10 | 0 |
| ± 1.5 to ± 2.0 | 23 | 13 |
| ±2.0 to ±2.5 | 13 | 15 |
| ±2.5 to ±3.0 | 3 | 0 |
Table 4.
Thermal preference votes compared to PMV bands for the circulation zone study (adapted from [
11]).
Table 4.
Thermal preference votes compared to PMV bands for the circulation zone study (adapted from [11]).
| PMV band based on measured conditions | Number of subjects in this band | % in each band responding “no change” |
|---|
| 0 to ±0.5 | 42 | 43 |
| ±0.5 to ±1.0 | 32 | 47 |
| ± 1.0 to ±1.5 | 10 | 10 |
| ±1.5 to ±2.0 | 23 | 13 |
| ±2.0 to ±2.5 | 13 | 62 |
| ±2.5 to ±3.0 | 3 | 0 |
Table 5 shows the final comparison, that of the comfortability value using the same PMV banding as in the previous two questions/tables. This includes perhaps the most unexpected range of results showing that occupants can be comfortable in a very wide range of conditions including those far from PMV values of neutrality.
Table 5.
Comfortability compared to PMV bands for the circulation zone study (adapted from [
11]).
Table 5.
Comfortability compared to PMV bands for the circulation zone study (adapted from [11]).
| PMV band based on measured conditions | Number of subjects in this band | % in each band responding comfortable |
|---|
| 0 to ±0.5 | 42 | 81 |
| ±0.5 to ±1.0 | 32 | 78 |
| ±1.0 to ±1.5 | 10 | 30 |
| ±1.5 to ±2.0 | 23 | 61 |
| ±2.0 to ±2.5 | 13 | 85 |
| ±2.5 to ±3.0 | 3 | 33 |
Conclusions which arose from these surveys included:
That occupants of transition/circulation zones react differently to thermal stimuli to what would be predicted by the standard algorithms;
That PMV ranges beyond the ± 0.5 range and indeed beyond the ± 0.7 limits can be considered as potentially acceptable even taking account of the different activity and clothing levels which occupants of transition spaces might be likely to exhibit.
6. Atrium Environments
The atrium has a special place in modern architectural design; ubiquitous yet with individual characteristics which vary according to design and climate. Though the term was initially associated in ancient times with an open courtyard, in modern buildings atria are almost universally enclosed spaces, normally incorporating a glazed roof and often one or more glazed walls. The envelopes of such atria can be formed from the walls of adjacent buildings or by glazed walls to the exterior; occasionally the envelope will be incomplete such as with the omission of end walls and in such cases the atrium will naturally have much stronger environmental connection to the exterior. The occupancy time for atrium type environments is often rather longer than for the two categories of space discussed in the previous sections. Atria often have such features as reception desks; cafés, information centers, and access to IT facilities as part of their set-up, thus encouraging a greater residence time.
One definition of atria espoused in the cooler climes of Northern Europe or of North America, is that an atrium should create similar conditions found outdoors in a temperate Mediterranean climate. Of course this is an ideal which does not always represent reality. Studies contributing to this paper have been carried out in two atrium environments—one set in Northern Europe and the other in Southern Europe (in other words, already in a Mediterranean setting).
Though atria are often enclosed their mode of environmental conditioning is frequently free-running or with modest mechanical heating or cooling installations. For the atrium in Southern Europe no mechanical heating or cooling was used (though surrounding buildings were environmentally conditioned according to the season) and as such the atrium ought to be placed in the adaptive category for comfort evaluation. The Northern Europe atrium had limited underfloor heating and mechanical air extraction, leaving open to some degree the categorization which would normally be applied.
6.1. Southern Europe Study
This investigation took place in a building which was part of a University in Northern Greece: it included measurement of environmental conditions inside and outside the building over an extended period together with shorter-term detailed investigations during which occupant reaction was surveyed.
The atrium in this case had been retrofitted into what had originally been an open courtyard about 700 m
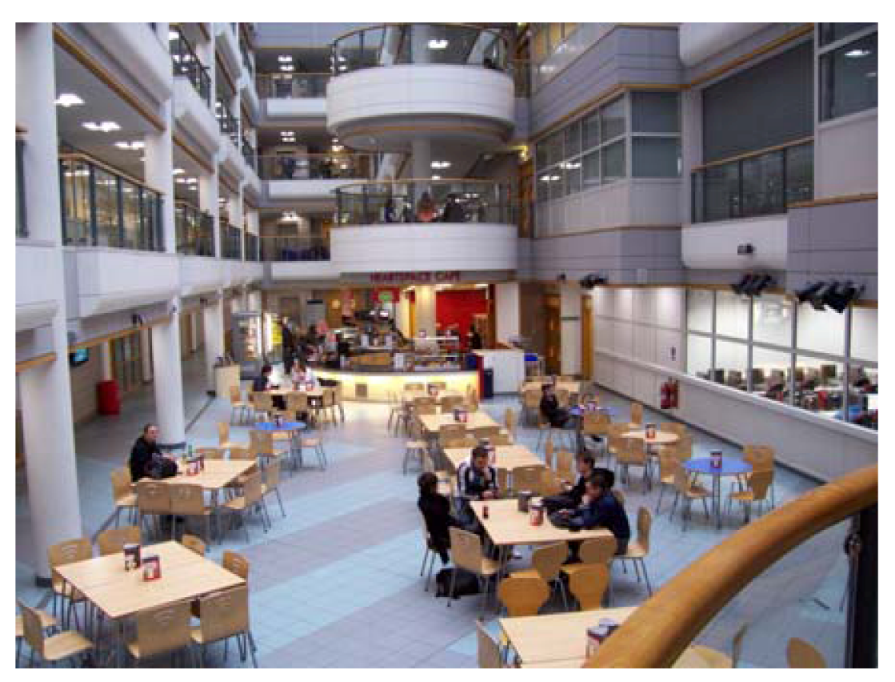
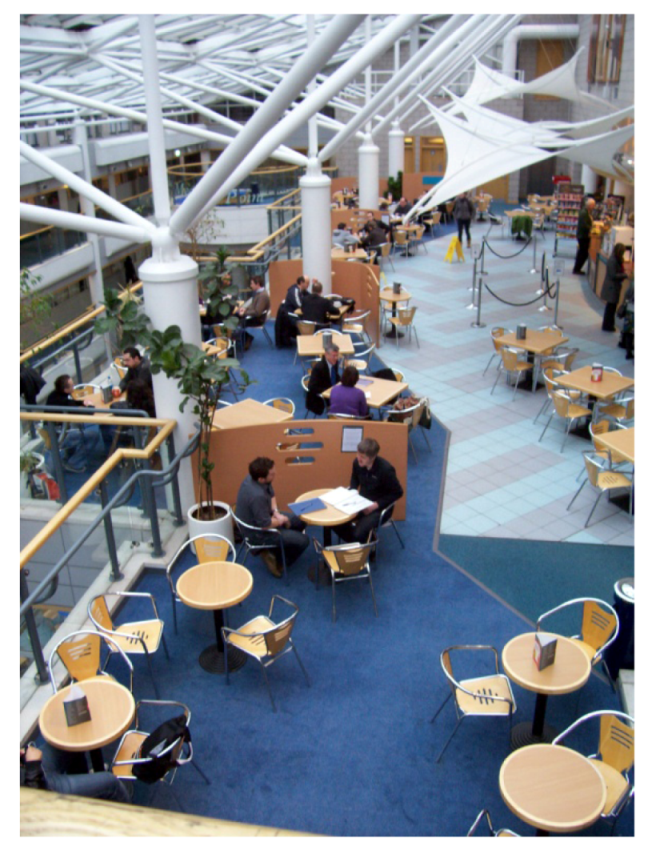
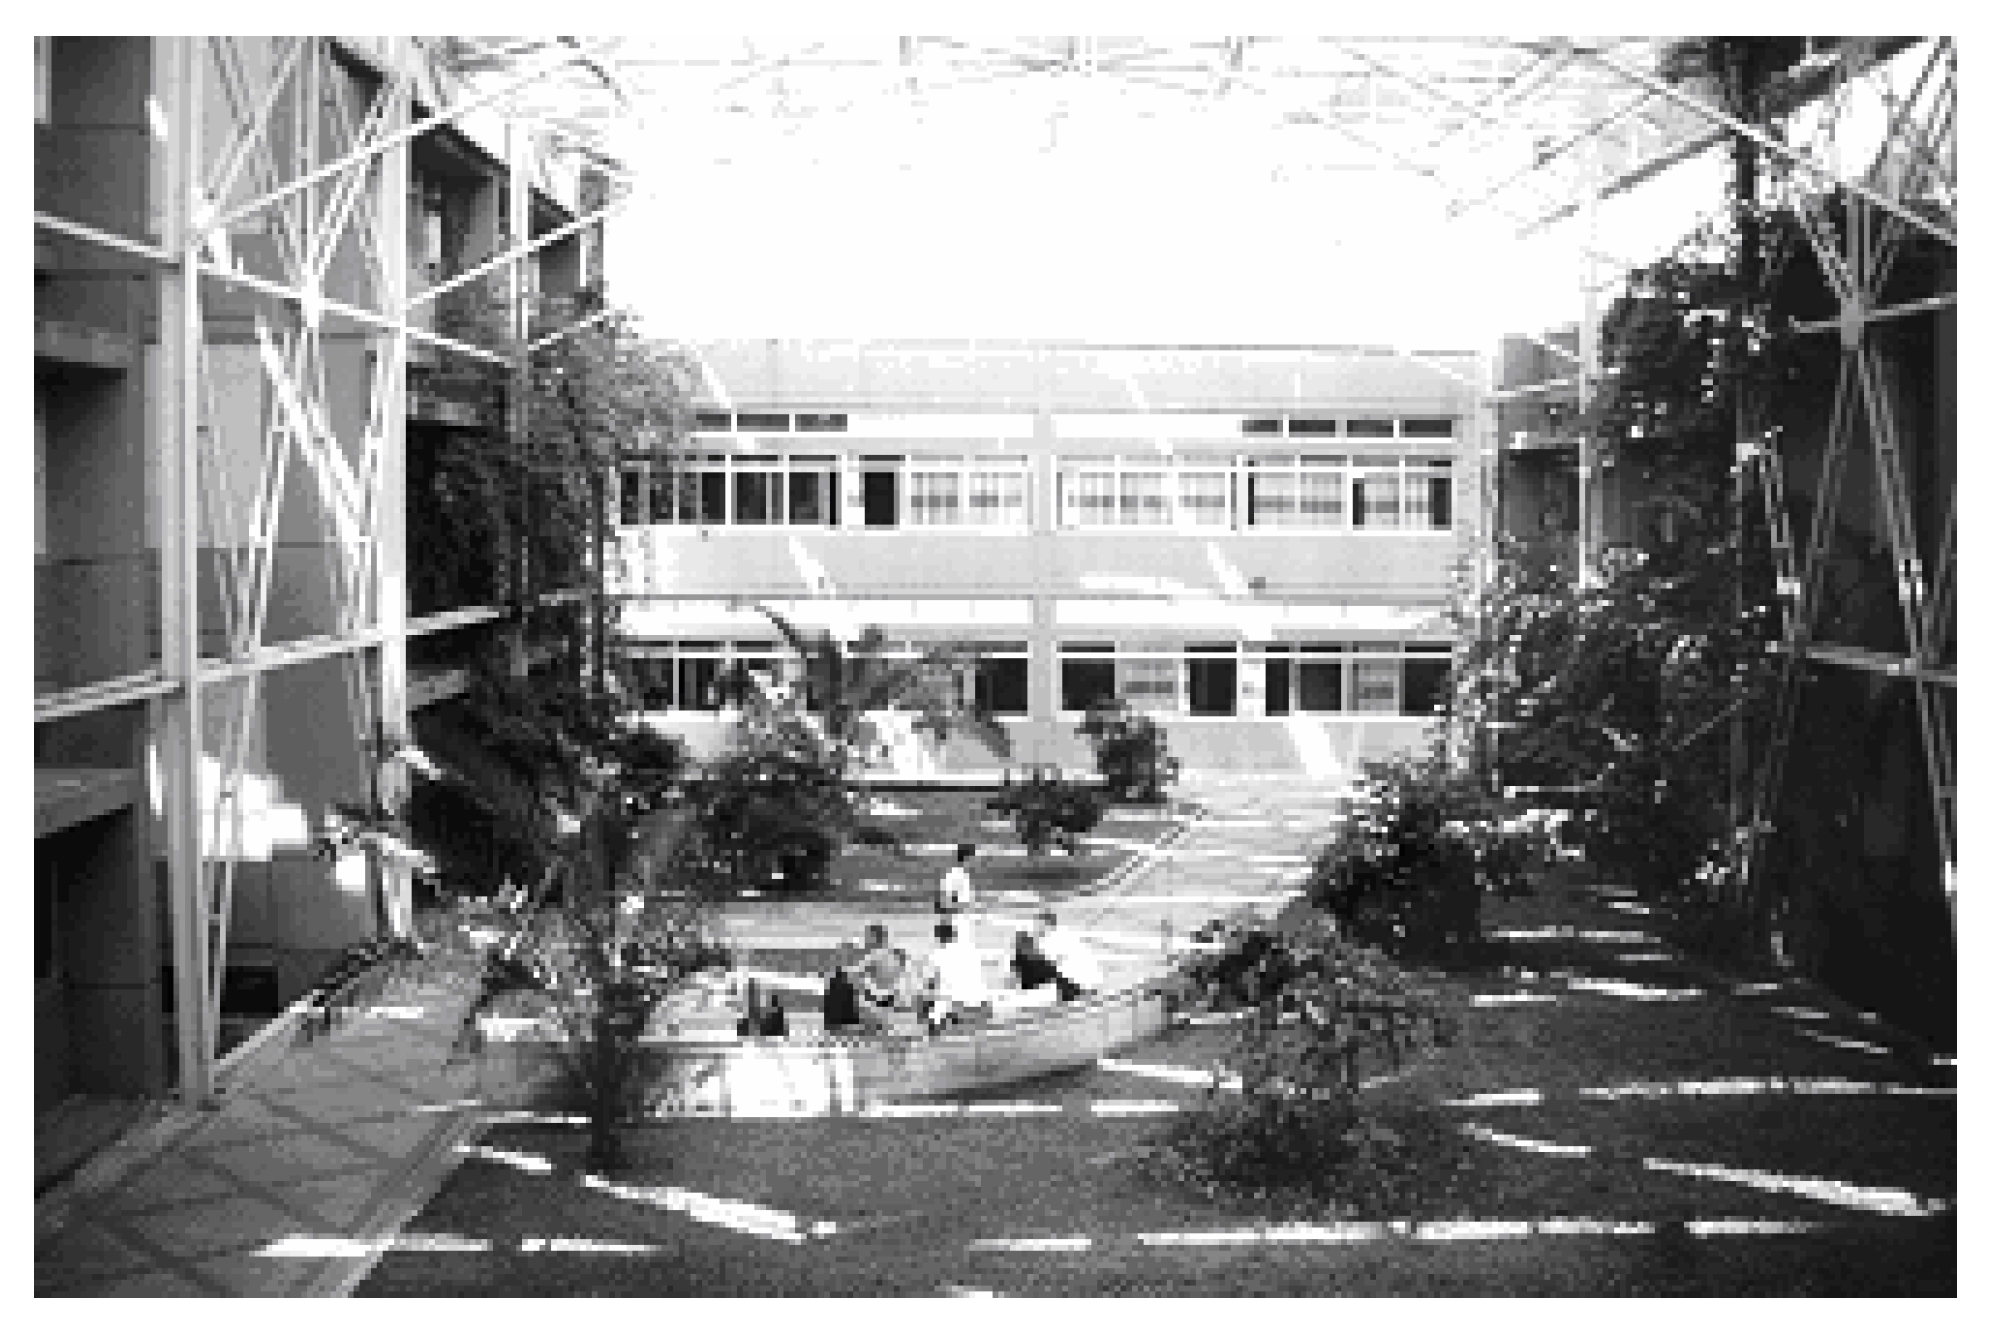
2 in area (19.6 m × 36 m). Buildings which surrounded the atrium housed lecture rooms, staff offices, a library, meetings rooms, and a café; temperatures in these surrounding buildings was maintained to 20 °C–22 °C in winter and 20 °C–24 °C in summer. The roof was composed of a number of glazed and opaque elements designed to give shading in summer and allow solar heat gain in winter. External environmental conditions were generally humid with temperatures ranging from an average maximum of 31 °C (extreme value of 35 °C) in summer to an average minimum of −1 °C (extreme value of −11 °C) in winter. A view of the atrium is shown in
Figure 5. The only occupied level of the atrium was at ground floor though surrounding buildings were of two or three storeys in height.
Figure 5.
Photograph showing the interior of the Southern Europe atrium.
Figure 5.
Photograph showing the interior of the Southern Europe atrium.
The occupants of the atrium were surveyed in both summer and winter with over 300 questionnaires completed. The questions included: seven-point sensation scale vote; seven-point expectation vote; three-point preference scale vote; information on the space occupants were entering from; clothing level; activity level; and length of time spent in the atrium. The expectation vote measures how the occupants were expecting to feel before actually entering the space.
Further information on the studies is available in [
17,
18]. In addition to the surveys environmental conditions were recorded in two forms: a longer term set of hourly records (three months in summer and in winter seasons) and detailed shorter-term data for the environment being experienced by the occupants during the survey period. Measurement instruments were of suitable quality and were calibrated before and after use.
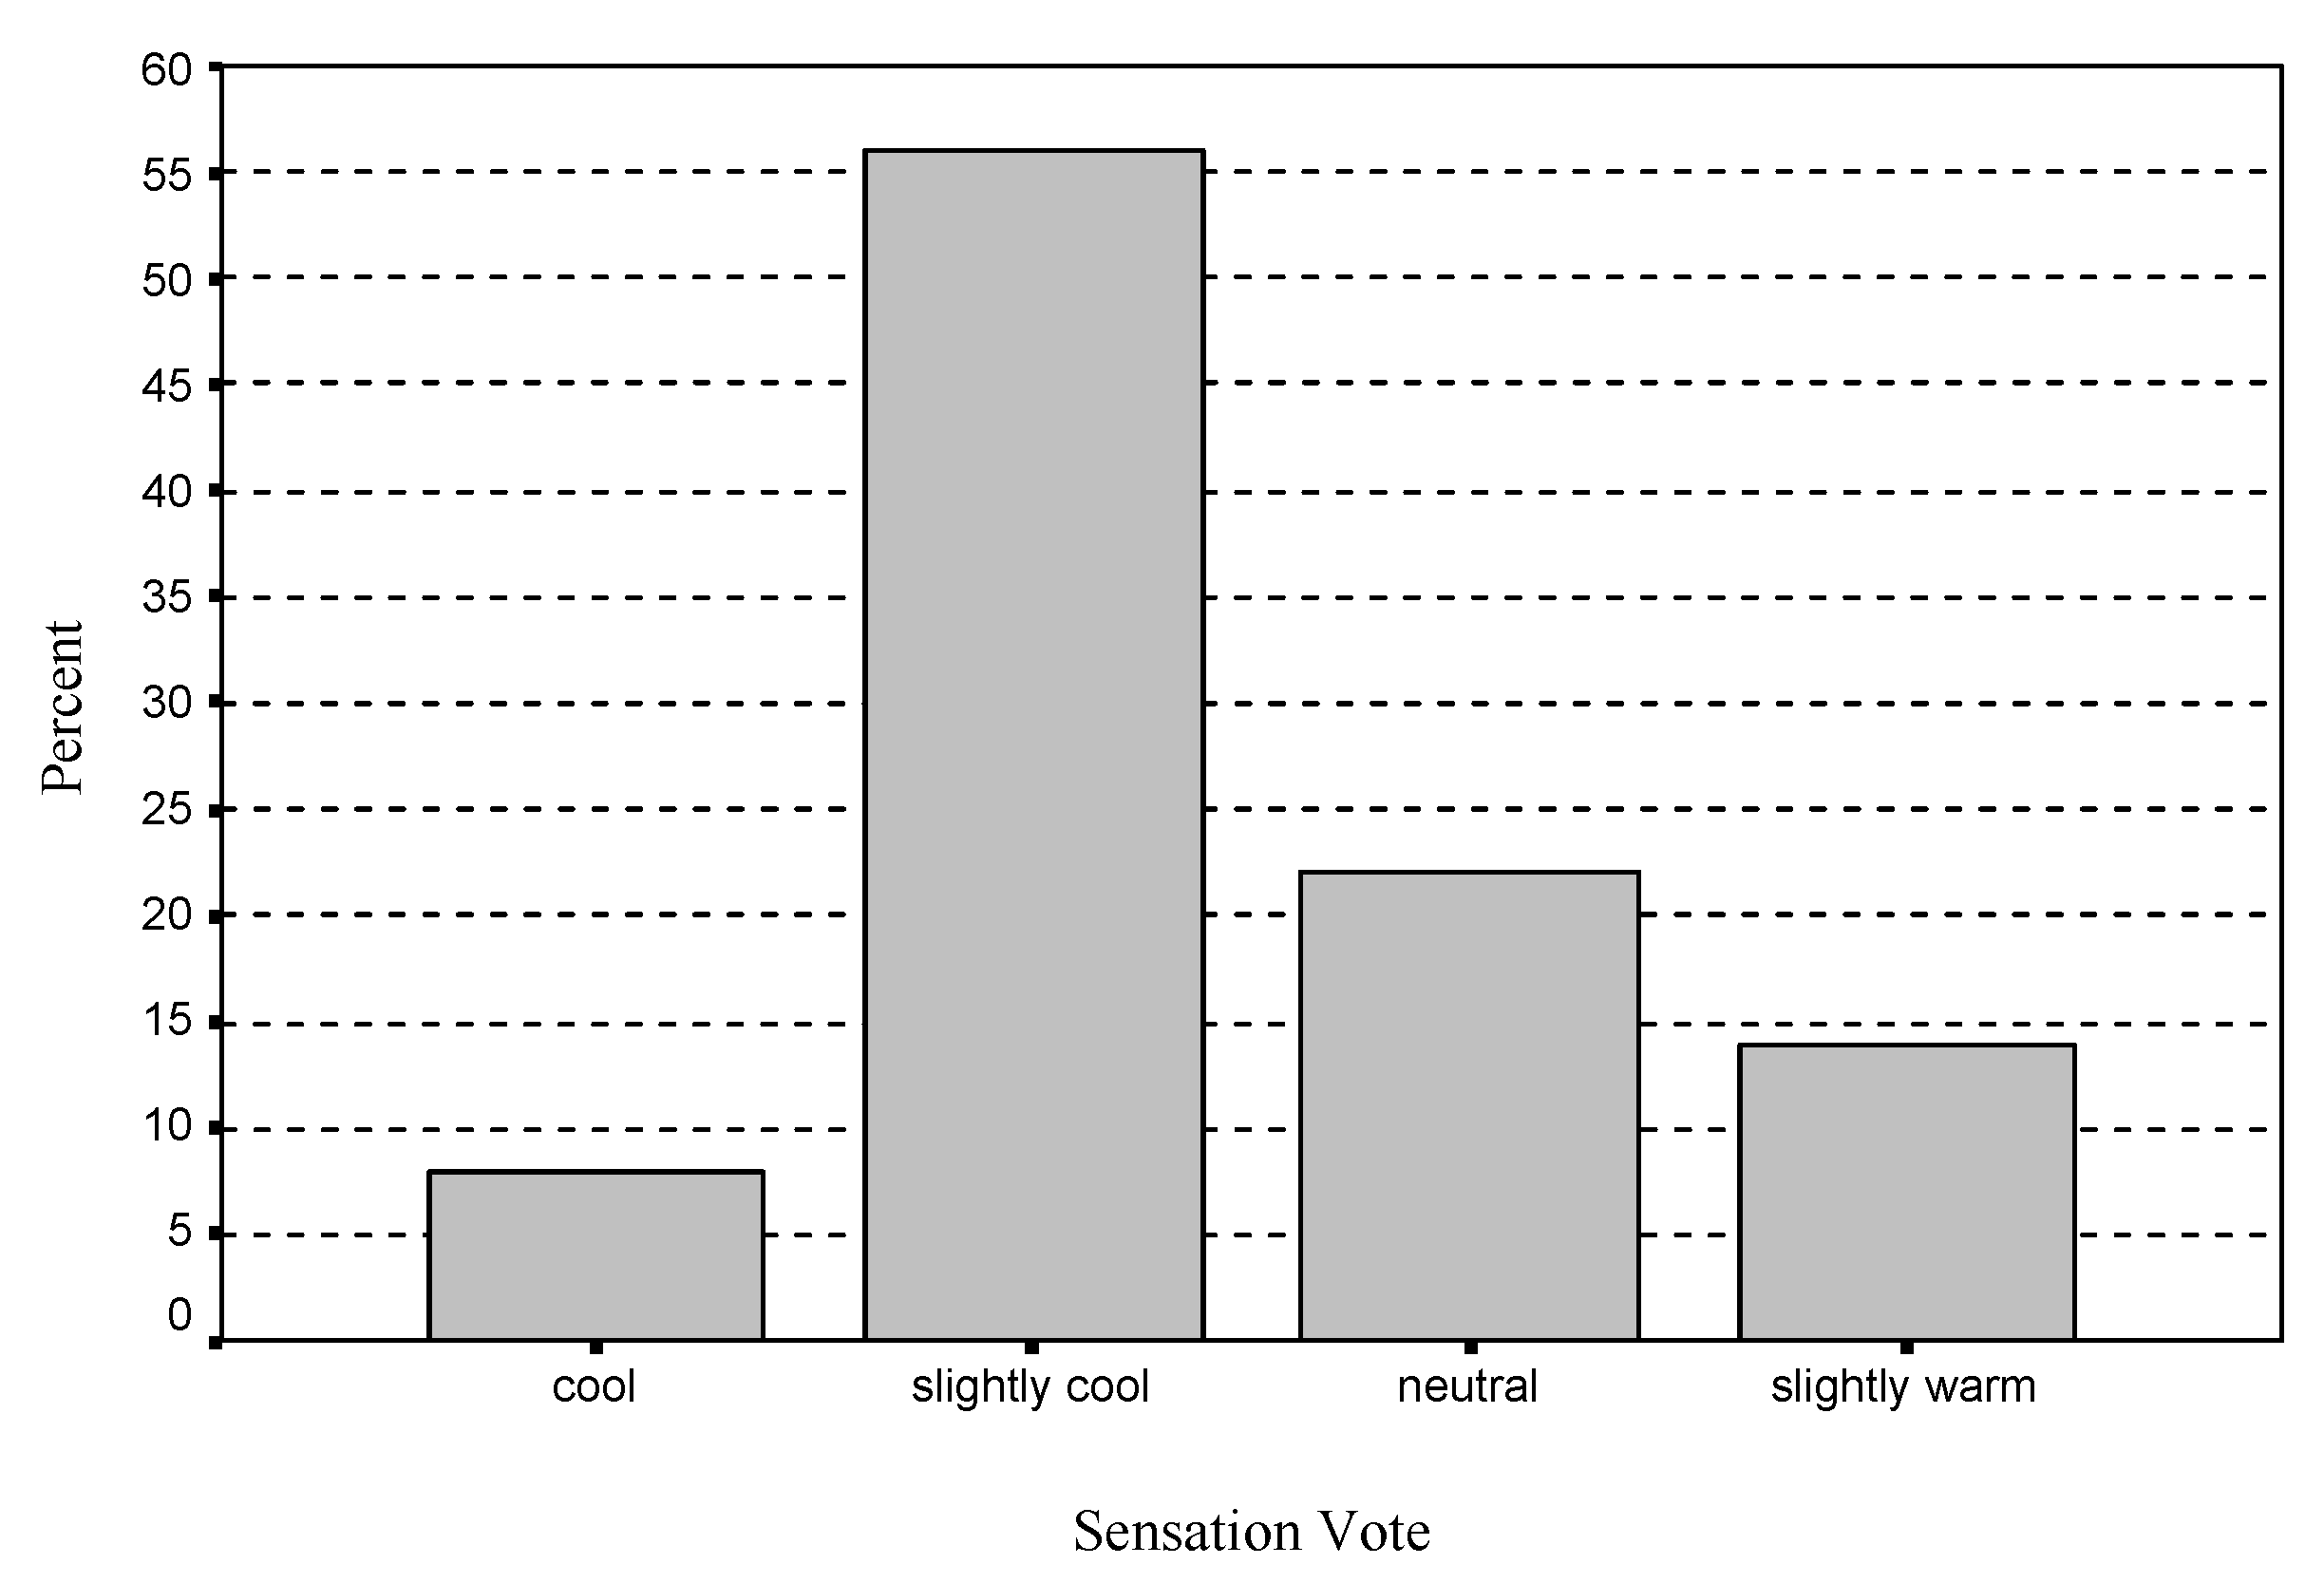
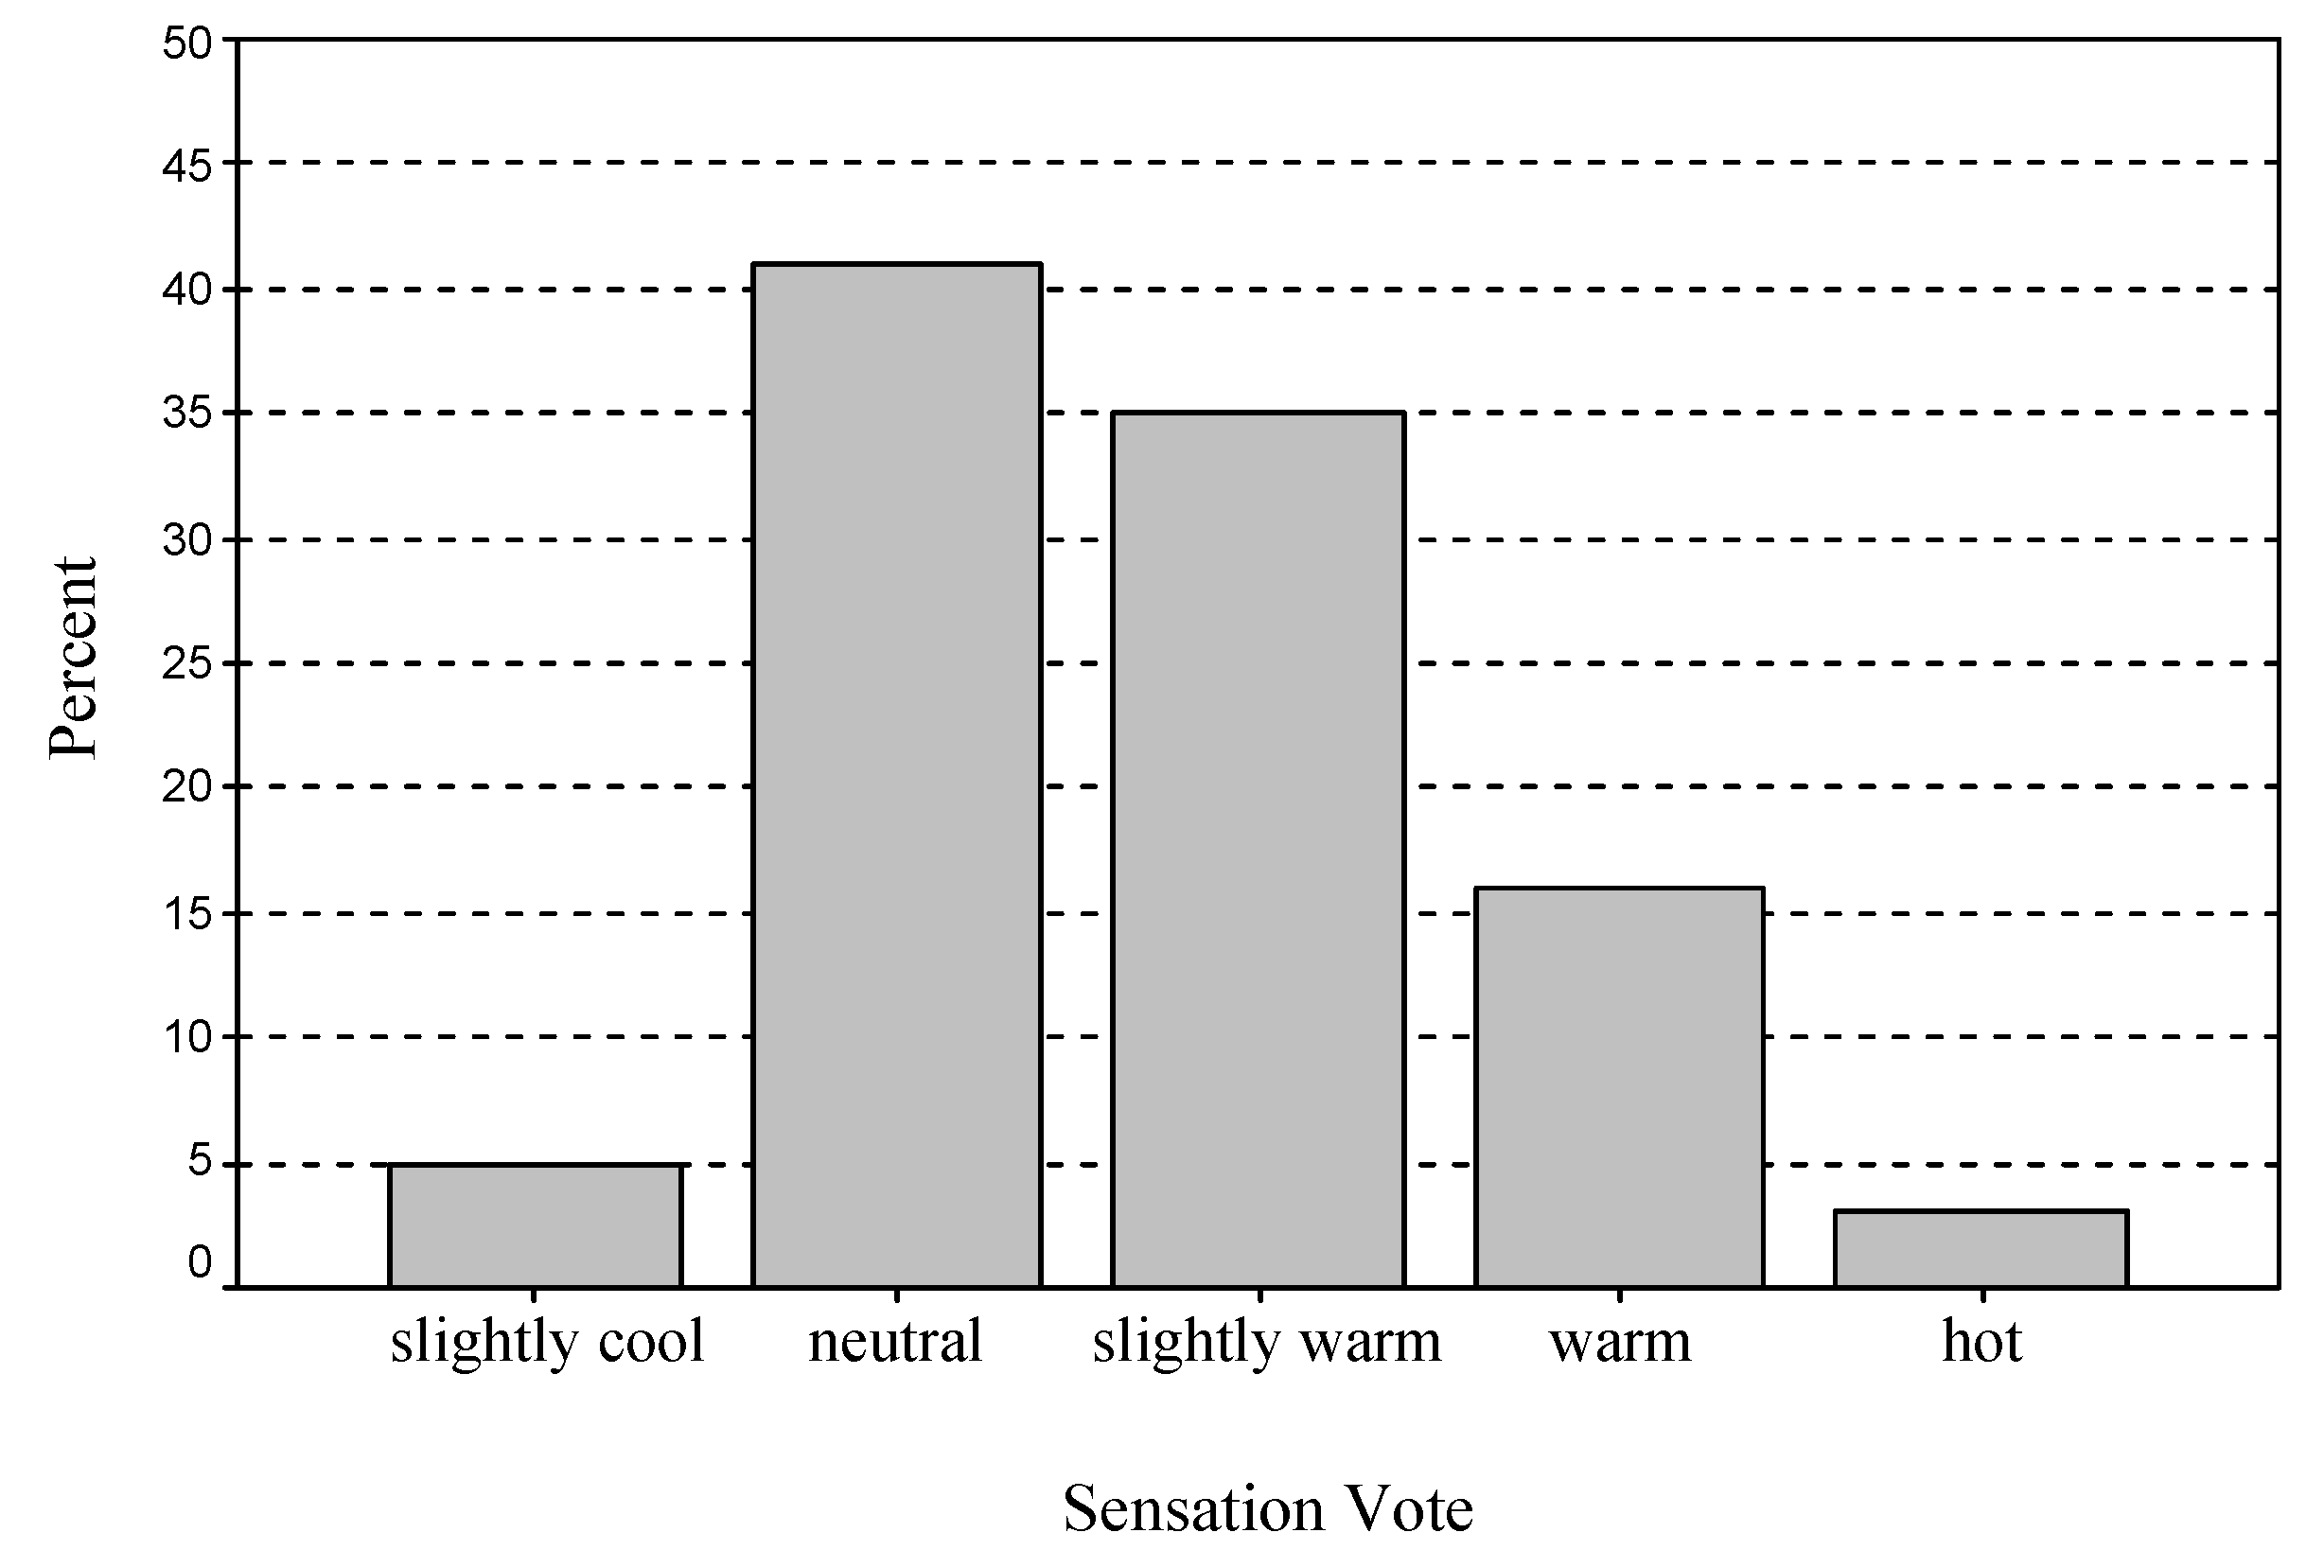
Measured air temperatures ranged from 10.2 °C to 16.6 °C (mean 13.33 °C) in the cool season and from 19.0 °C to 29.1 °C (mean 26.37 °C) in the warm season. In the detailed surveys, the average predicted mean vote (PMV) was −0.9 for the cool season and +1.3 for the warm season. The sensation votes are shown in
Figure 6 for the cool season and
Figure 7 for the warm season. It is interesting to note that for the cool season 90% of the actual sensation votes were in the central three categories closest to neutrality (mean actual sensation vote = −0.58); and for the warm season that over 80% of votes were in the central three categories (mean actual sensation vote = +0.71).
Figure 6.
Southern Europe atrium sensation votes in the cool season.
Figure 6.
Southern Europe atrium sensation votes in the cool season.
Figure 7.
Southern Europe atrium sensation votes in the warm season.
Figure 7.
Southern Europe atrium sensation votes in the warm season.
The mean expectation vote from the occupants on the seven point scale was −0.51 for the cool season and −0.39 for the warm season.
Figure 8 and
Figure 9 show the information collected in more detail. Preference voting on the three point scale produced average votes of +0.6 for the cool season and −0.67 for the warm season.
Perhaps the most noticeable individual feature of the data collected is that the expectation of occupants for a cooler environment in the atrium during the warm season was not met. This could indicate that they expected to be coming into a building which had some improved environmental space conditions compared to the exterior. On a more general level is clear from the comparisons of predicted and actual mean votes that the occupants did not express sensations as extreme as those predicted; that is, they felt less cool than predicted in the winter and less warm than predicted in the summer. Adaptation is taking place and neutral (or comfort) temperatures were calculated according to the method of Griffiths as adapted by Nicol and others (see for example [
7]); neutral temperatures being the temperature to which the subject is adapted at the time of voting. The neutral temperature for the cool season was determined as 14.98 °C, and 24.22 °C in the warm season; a range of almost 10 °C between seasons.
Figure 8.
Southern Europe atrium expectation votes in the cool season.
Figure 8.
Southern Europe atrium expectation votes in the cool season.
Figure 9.
Southern Europe atrium expectation votes in the warm season.
Figure 9.
Southern Europe atrium expectation votes in the warm season.
Adaptive behavior observed by the researcher at the time of the study included: modification of clothing; consumption of hot or cold drinks; and adjusting conditions experienced by moving position. Further understandings gained from the study were that the atrium appeared to have two different roles: in the summer the space was occupied for longer by occupants but in the winter time spent in the space was more transient with use more as a means of moving between other interior spaces.
6.2. Northern Europe Study
A comparative but not identical study was undertaken in a Northern European climatic context; also an atrium and also an atrium inserted between existing university buildings (but with some new additions) in the North of England [
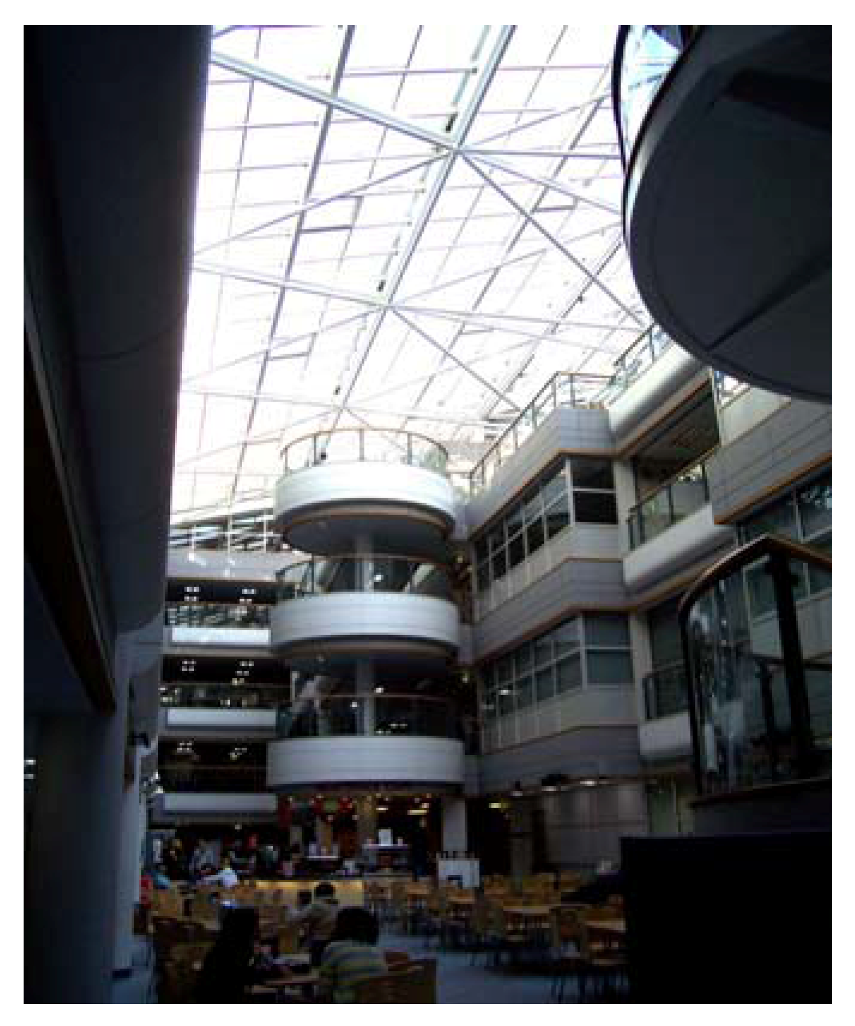
19]. The main functions of the space were to act as a circulation space, including stairs and as social space with the provision of two café areas; one on the lowest floor and one near to the top underneath the glazed roof. The atrium was not as free-running at that in Greece: some modest underfloor heating was installed at ground floor level and there was some mechanical air movement at other levels. The building was predominantly naturally ventilated however and since the height extended over five floors, the heating had limited impact once doors were opened in the morning. Summer temperature control consisted only of ventilation, afforded predominantly by the opening of glazed elements in the roof. A view of the atrium can be seen in
Figure 10.
An interesting feature of this atrium was the evolving use over time, with greater emphasis on it as a social space, and not just as a circulation route. Conditions varied from place to place in the atrium and a year-long survey was carried out to record temperatures outside, and at five positions within the atrium separated both in plan and in height.
Table 6 shows the minimum, maximum and mean average temperatures recorded over the survey period. Anecdotal evidence suggested that the café areas were occupied by significant numbers even at times when the environmental conditions appeared to be outside the comfort range. The lower level café suffered from the ingress of external air flowing from a nearby entrance, and the upper café was exposed to radiant heat gain and glare from the sun from the glazed roof directly overhead.
Figure 10.
Northern Europe atrium—interior view.
Figure 10.
Northern Europe atrium—interior view.
Table 6.
Northern Europe atrium—temperatures at different positions in the atrium over the year (data adapted from [
19]).
Table 6.
Northern Europe atrium—temperatures at different positions in the atrium over the year (data adapted from [19]).
| Temperature (°C) | Outside | Entrance | Corridor | Lower cafe 1 | Lower cafe 2 | Upper cafe |
|---|
| maximum | 31.1 | 28.1 | 26.1 | 26.3 | 27.4 | 33.7 |
| average | 12.2 | 18.9 | 20.1 | 20.9 | 21.5 | 22.0 |
| minimum | −3.0 | 8.8 | 14.9 | 13.7 | 15.9 | 14.9 |
Four surveys were initially carried out on the occupants of the atrium space and because the major concern was for cold discomfort (the atrium being in Northern Europe), the surveys took place during the cooler part of the year. Seventy-two respondents were involved split between the two café areas.
Figure 11 shows the lower café zone and
Figure 12 the upper level cafe. The majority of those surveyed were either socializing with friends or waiting between lectures. In and around the atrium space are many other areas in which staff and students could sit, many of which were located in more conventionally controlled spaces. In addition a further social/café space was available just one floor removed from the higher café so opportunities for occupants to make themselves more comfortable were possible.
Figure 11.
Northern Europe atrium—lower café area.
Figure 11.
Northern Europe atrium—lower café area.
Figure 12.
Northern Europe atrium—upper café area.
Figure 12.
Northern Europe atrium—upper café area.
It was felt that the most appropriate investigative comparison to be made for the spaces and their occupants would not be between actual and predicted mean votes, but rather to consider the proportions dissatisfied, actual percentage and as predicted from the PMV. A key question was also the number of people moving position to become more comfortable.
A summary of the key information from the surveys is as follows: the expected percentage dissatisfied based on the actual mean vote was 28.3%; the percentage of occupants responding as “not comfortable” was 23.6%; and the percentage of occupants prepared to change position according to the conditions was 12.6% (all data adapted from [
19]). This indicates a significant difference between the expected dissatisfaction compared to that reported as not comfortable by the occupants and also a remarkably small percentage of occupants willing to change their location because they were uncomfortable. These are the averaged data however more extreme differences could be found in individual samples.
Further questions asked of respondents attempted to illicit information on why they chose to sit and remain in the given area, even if it was not thermally comfortable. The key findings in terms of percentages of occupants choosing each of the following responses was as follows: “it is close to the activity I have been doing or will be doing’ 48.6%; ‘the food/drinks are good quality or there is a good range” 15.2%; “the people I am with chose to come/meet here” 38.8%; “there is a pleasant well-designed environment here” 23.6%; and “I always sit here out of habit” 9.7% (data adapted from [
19]).
A further study was carried out at a later date to investigate the range of responses and actions during a more warm summer period [
20]. In this work a more qualitative questionnaire was utilized and one in which additional factors such as lighting level, glare, noise environment, and air freshness were investigated. Conclusions were in-line with the previous study and found a significant number of occupants prepared to continue using the warmest café location even when both measured and expressed data would indicate substantial heat discomfort. The summary of that study was:
Occupants were more prepared to accept uncomfortable conditions than move location.
Acoustic discomfort occurred but as was noted as a normal phenomenon in public places and occupants were prepared to accept higher levels of noise than might expected from standards.
Occupants were prepared to accommodate high temperatures (in excess of 30 °C air temperature on a number of occasions).
Occupants used adaptive strategies such as removing clothing and taking drinks.
Occupants in the atrium space were more sensitive to, and disturbed by, the amount of daylight/glare than to thermal discomfort (however the radiant heat from the sun would have an impact since in this response the lighting and thermal environment impacts cannot be disaggregated).
The conclusions to be drawn from the studies in the Northern European atrium were that despite considerable levels of discomfort (both actually reported and also predicted) occupants continued to use the atrium space on a regular basis and that only a small fraction were prepared to leave the atrium space to find elsewhere to sit. A number of environmental and social factors can be identified as having an impact. One must therefore conclude that thermal comfort alone does not determine overall reaction and likely outcomes to use of an atrium space and that the normal thermal comfort design standards may be inappropriate.
7. Energy Saving Potential for Transition Spaces
The theme of the argument advanced in this paper is that conventional comfort standards may not be appropriate for use in assessing the space conditioning systems and their utilization for transition spaces could be modified. In particular by applying conventional standards to transition zones, more energy may be consumed than is necessary to meet basic requirements for comfort for occupants who occupy such spaces. Research has therefore been conducted to establish the potential for reducing energy consumption if a modest relaxation in design standards is permitted [
21].
Rather than expecting PMV to lie in the range ±0.5 or ±0.7, the suggestion was advanced to consider ±1.0 as being a possible option.
Figure 4 illustrates the relationship between PMV (x-axis) and PPD (y-axis) and indicates a possible increase in dissatisfied occupants from 10% to 26% under such a scenario, however as indicated by the various studies such an increase may not occur in practice and in any case occupants of transition spaces seem to be less critical of such comfort deficiencies.
For the energy analysis, buildings comprising of transition zones and core zones were created to match four different styles of layout, each applied to a rectilinear building in which its length was twice its width. Style A had the transition zone located along just one side of the building; style B had a transition zone in the middle of a façade and enveloped on three sides by the core building; style C had a transition zone running through the centre of the building; and style D had a transition zone forming a complete perimeter around the external façade of the building.
Internal conditions for the building core zone were assumed to be at or close to conditions which would produce a neutral sensation (air temperature = mean radiant temperature = 23 °C; relative humidity = 50%; mean air velocity = 0.1 ms−1; metabolic rate = 1.0 met; clothing insulation = 1.0 clo). The transition zones were allowed to vary from this condition however but took into account the differences in some parameters including higher activity level and greater air movement. In these circumstances the values which follow produce a PMV of neutrality (air temperature = mean radiant temperature = 21 °C; relative humidity = 50%; mean air velocity = 0.3 ms−1; metabolic rate = 1.4 met; clothing insulation = 1.0 clo).
Isolating the data variations to adjusting only the transition space temperature it was possible to examine the variations in energy consumption using a standard computer simulation technique for the UK climate. A set of standard occupancy and use profiles were utilized, and to eliminate the effect of orientation the data were averaged across orientations to north, south, east and west. If PMV in the transition zone was allowed to vary between two limits ±0.5 PMV and ±1.0 PMV, then the range of internal temperature which can be accommodated is between 18 °C and 24 °C for ±0.5 PMV and 16 °C and 26 °C for ±1.0 PMV. The reductions in energy consumption for the transition zone alone and then as a percentage of the whole building energy consumption were computed; the summary outcomes are shown in
Table 7 and
Table 8.
Table 7.
Reductions in annual heating energy use for transition zone study (data adapted from [
21]).
Table 7.
Reductions in annual heating energy use for transition zone study (data adapted from [21]).
| Space style | Transition space alone | Effect on whole building |
|---|
| transition space temperature | 18 °C (−0.5 PMV) | 16 °C (−1.0 PMV) | 18 °C (−0.5 PMV) | 16 °C (−1.0 PMV) |
| Style A | 22% | 35% | 7% | 11% |
| Style B | 19% | 31% | 3% | 4% |
| Style C | 18% | 29% | 4% | 7% |
| Style D | 22% | 36% | 20% | 33% |
Table 8.
Reductions in annual cooling energy use for transition zone study (data adapted from [
21]).
Table 8.
Reductions in annual cooling energy use for transition zone study (data adapted from [21]).
| Space style | Transition space alone | Effect on whole building |
|---|
| transition space temperature | 24 °C (+0.5 PMV) | 26 °C (+1.0 PMV) | 24 °C (+ 0.5PMV) | 26 °C (+1.0 PMV) |
| Style A | 5% | 8% | 1% | 2% |
| Style B | 3% | 5% | <1% | 1% |
| Style C | 3% | 5% | <1% | <1% |
| Style D | 5% | 9% | 4% | 6% |
In each case the core area of the building is planned to be heated or cooled to meet required conditions. The opportunities for energy saving come from allowing a less stringent set of required environmental conditions to be permitted in the transition zones. There is a risk with style D that occupants would come to expect the perimeter to be conditioned to a higher level of comfort because of its surrounding nature; however for the savings to be achieved this would have to be avoided both as a design option offered to the occupants, and as an option achieved through occupant use of thermostats and other controls.
The tabulated data show that the most successful style in terms of reducing overall energy consumption was the transition zone which wraps around the whole building perimeter (style D), effectively providing a buffer space on all four sides. The impact on reducing cooling energy requirements is less than on heating because the transition zone alone cannot reduce heat gains arising from solar and internal heat sources which are the predominating feature, rather than ambient temperature. This is not the case with heating requirements where the building fabric and ventilation heat flows predominate. In all cases however, a meaningful reduction in energy consumption results, a reduction which is significantly larger when the wider comfort design standards are applied.
8. Proposed Design Standards for Transition Spaces
The evidence presented in the foregoing sections indicates that transition spaces should be considered differently to other components of buildings when addressing the standards for comfort that should be applied. Clearly setting standards and categories according to the existing PMV boundaries as expressed in
Table 1, means that potentially advantageous energy demand reduction is being ignored. A proposal is therefore advanced to create the equivalent of additional categories of space to include firstly, the transitional zones associated with atria and spaces use over a longer residence time, and secondly, transitional zones which are internal circulation spaces such as lift lobbies, corridors and stairwells. These are shown in
Table 9.
Table 9.
Proposal for revised building categorizations used in comfort standards.
Table 9.
Proposal for revised building categorizations used in comfort standards.
| Category of thermal environment | Range of PMV | PPD (%) |
|---|
| Highest category of comfort for indoor spaces | −0.2 < PMV < +0.2 | <6 |
| Standard category of comfort for indoor spaces | −0.5 < PMV < +0.5 | <10 |
| Extended category of comfort for indoor spaces | −0.7 < PMV < +0.7 | <15 |
| Longer residence time transitional zones (atria) | −1.0 < PMV < +1.0 | not applicable |
| Circulation zones | −1.5 < PMV < +1.5 | not applicable |
| Entrance zones | use adaptive algorithm | not applicable |
In atrium spaces and similar environments the clothing level of occupants is likely to be more representative of indoor rooms because of the nature of the use of those spaces. Activity level is also likely to be more sedentary since the opportunity to sit and relax is greater. However the evidence of the studies presented clearly shows occupants of atrium type spaces to be willing to accept a degree of thermal discomfort which is balanced by other factors such as social and psychological issues.
In circulation zones such as corridors and lift lobbies, occupants might expect to find some space conditioning but time of residence is short, and therefore a more relaxed PMV limit can be set, but one is still needed because of the proximity to the working space.
Added to the above categories is a final option, the main entrance foyers or canopied areas which are encountered as an occupant enters or leaves a building. These types of transition zone are so much more connected to the exterior ambient environment that they should be considered as fee-running spaces, and therefore be categorized as such, and use of adaptive algorithms should be applied (that is based upon external conditions).
There are a number of limitations to the study as a whole which arise from the nature of the specific studies carried out and which collectively contribute to the suggestions being made. Although a substantial number of building occupants have been surveyed the number of locations and types of environments is limited. In thermal comfort research this is not uncommon given the limitations of research staff and equipment availability; however the pattern of responses does support the conclusions drawn. In order to assure compatibility with a broader generic set of circumstances further testing would be required, and before the implementation of changes to design guidelines and standards could be considered, a more systematic and larger scale piece of research would be warranted. However the research documented here clearly indicates potential for this development to occur, and with the prospect of engineering energy and cost efficiencies.
9. Conclusions
This paper has addressed the important sub-set of building spaces identified as transition zones. Three categories or types of transition zone have been suggested, each of which is distinguished by differences in residence time, in likely activity, and also potentially by differences in clothing level of their occupants. It has been demonstrated that occupants both react differently in transition zones and have different thermal expectations of them. As a result the application of strict design standards for comfort can result in unnecessary use of building space conditioning systems (heating, cooling and ventilation) and which potentially consumes significant amounts of energy.
By adopting alternative standards it should be possible to maintain basic levels of comfort but take advantage of the differences in expectations as well as social and psycho-social influences which mean occupants either do not notice or have a lower regard for close control of thermal comfort when in such spaces.
More research is required to investigate the exact influence and proportion of different non-physiological stimuli on perceptions of comfort in transition zones; research which might permit further refinement of the proposed alternative standards. A further broad scale parametric study of occupant reaction is also justified as a prelude to consideration of changes to design guidelines and standards.


