Abstract
Recent Italian earthquakes have underlined the need for wide monitoring and safety assessment of architectonical heritage. This has emerged also from requirements of the new Italian Technical Recommendations for buildings. Within this subject the paper investigates the seismic vulnerability of a specific monumental masonry building: the Vicarious Palace (Palazzo del Vicario) in Pescia, a small town near Florence. The structural behavior of the Palace was investigated using a finite element model in which the non-linearities of the masonry were considered by proper constitutive assumptions. The seismic behavior was evaluated by the pushover method, according to the Italian Technical Recommendations. The results were compared with the ones obtained by a simplified approach based on the kinematic theorem of limit analysis. Comparisons of the expected seismic demand vs the seismic capacity of the Palace confirm the weakness of this type of building to suffer extensive damage under earthquakes, as frequently observed in similar construction typologies. Additionally, the comprehension of the structural behavior under seismic loading allows the identification of a proper retrofitting strategy.
1. Introduction
The Italian earthquakes of Umbria and Marche in 1997 [1] and Abruzzo in 2009 [2], have highlighted the need for an extensive monitoring and safety assessment of historic Italian construction heritage. Following the debate developed in the scientific community, new Italian Technical Recommendations for buildings have been drawn up: first after 2003 [3,4] and later, after 2008 [5,6]. As is known, ancient masonry buildings, although perfectly able to bear vertical loads, usually are not adequate to sustain the horizontal forces produced by earthquakes. So, they are particularly prone to severe damage under seismic loading. In addition, historic built heritage represents an economic concern especially in contexts where tourism has become one of the major sources of wealth. Therefore, preserving historic constructions is a cultural requirement and an economic and developmental demand [7].
The structural analysis of a new masonry building is a relatively simple task, whereas the assessment of the seismic vulnerability of an ancient masonry building is a challenging task, because of several uncertainties affecting the geometrical and the mechanical characteristics of the structural elements [8]. Each masonry building is characterized by its own history and the actual configuration is the result of fusions, additions and replacements of many structural elements. Thus, a correct structural analysis of an historic building requires a deep knowledge of: (a) the building history and its evolution; (b) the geometry; (c) the structural details; (d) the cracking pattern and the damage map; and (e) the masonry construction techniques [9,10].
The characterization of the material properties is required to develop a proper structural analysis. This knowledge can be achieved combining in-situand laboratory experimental tests. Due to the difficulties in obtaining all information to be used for a proper definition of a numerical model, in some cases it is necessary to perform simplified, often iterative, procedures for evaluation of the static and the seismic reliability. Hence, the structural engineers should be able to address the relevant aspects of the problem and provide guidance in analyses and experiments [11].
Maintenance of historic buildings has become a relevant scientific issue that has attracted the interest of researchers all over the world as demonstrated by the growing number of researches presented in recent decades. These studies represent a wide state-of-the-art of the engineering approach for evaluation of safety of historic buildings. Among the various researches in this field there is the work of Lourenço et al. [12]. The authors discuss the case of the Monastery of Jerónimos in Lisbon (Portugal) and show that it is possible to understand the behavior and the damage of a complex historic construction providing valuable information in designing in-situtests and monitoring. The relevance of proper numerical strategies has been pointed out by Cardoso et al. [13,14]. These authors discuss the aseismic provisions included in old masonry buildings in downtown Lisbon, after the Lisbon earthquake in 1755. They propose an iterative method for the seismic assessment in which the damage to the structural elements or connections is identified and the stiffness of the structural model is changed accordingly. Each iteration comprises a linear elastic analysis, so the procedure is useful for current design practice. Betti and Vignoli [15] discussed the seismic vulnerability of the Basilica of Santa Maria of Impruneta (Italy), and proposed the combination of a finite element model of the building with a simplified approach based on the kinematic theorem of limit analysis. The results suggest that the comparison between different techniques of analysis is mandatory to cover the unknowns affecting the mechanic properties of the materials. Relevance of a wide spread analysis approach has been pointed out also by Mallardo et al. [16]. The authors discuss the seismic behavior of a Renaissance Palace in Ferrara (Italy). Firstly, a 3D nonlinear model of the Palace is considered in order to understand the large-scale structural performance. Next, a detailed study of the main façade of the Palace is presented, by means of three reduced 2D nonlinear models. The authors show that the use of different modeling strategies allows a critical evaluation of the seismic vulnerability of the main elements. An integrated multilevel approach that combines laboratory and non-destructive testing methods with monitoring systems has been recently presented by Anzani et al. [17] to evaluate the state of conservation of historic structures. They discussed the cases of some damaged towers in Italy and suggested an investigation procedure to be adopted for safety assessment of historic towers.
This paper presents an evaluation of the seismic vulnerability of the Vicarious Palace (Palazzo del Vicario) in Pescia, a small town near Florence. In the first part, the geometrical and mechanical descriptions of the building are presented, together with a brief report of its history. Then, the seismic assessment approach is illustrated.
Firstly, a structural analysis of the Palace was made using a finite element model. Specific assumptions of the material properties and the nonlinear behavior of the masonry were considered. Static analysis under vertical loads (dead and live loads), and pushover analyses were performed, according to the Italian Technical Recommendations [3,4]. Next, a simplified approach based on the kinematic theorem of limit analysis was applied. With reference to the failure mechanisms activated in similar buildings during past earthquakes [18,19], some macro-elements were individuated and analyzed.
The results provide a description of the building response under seismic loading and offer a representative case which is fruitful in extending the comprehension of the structural behavior of this building typology.
2. The Vicarious Palace in Pescia
2.1. Historic Notes
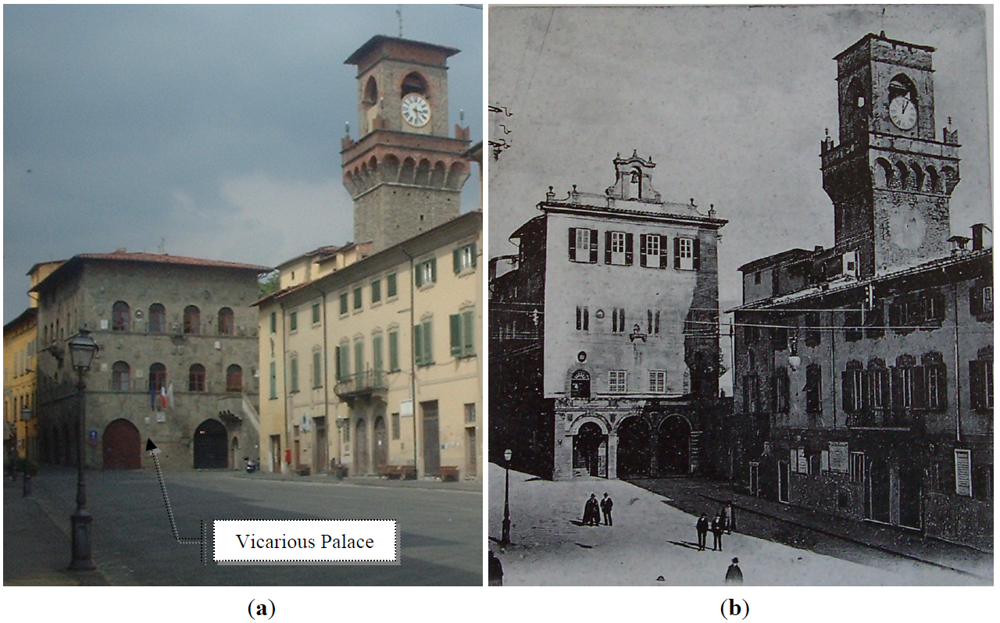
The Vicarious Palace is located in the main square (Piazza Mazzini) of the city of Pescia. Figure 1a shows the front view of the building. The research started with the analysis of historic data. The material was found in the archive of the Ministry Institution for Environmental and Architectural Heritage of Florence, Prato and Pistoia (the institution employed to preserve the cultural heritage in the Florence metropolitan area).
The original structure of the Palace dates back to the twelfth or thirteenth century, when the Holy Roman Emperor Frederick II of Swabia (Jesi, Italy, 1194–Fiorentino di Puglia, Italy, 1250) created the institution of the Imperial Vicar, a prince charged with administering part of the Holy Roman Empire on behalf of the Emperor. Soon after its construction the Palace was used for the administrative control of territory and for residence of the local governor. Thus, the history of the Palace intersects with the local history of the city.
Along the centuries the Palace was subjected to several modifications. Some of them were aimed at renewing the building according to the necessities of the time, such as changes in shape, in number of levels, etc., other interventions were aimed at retrofitting the building. In the middle of the fourteenth century a new level was added, so the Palace became a three storey building [20,21].
A further level was added during retrofitting started in 1617, so the Palace then became a four storey building [22]; at the same time a new portico was added. This configuration of the Palace remained almost unchanged until the early years of the twentieth century (Figure 1b) when the building was subject to the final modifications. In the thirties of the twentieth century the original medieval configuration of the Palace was reconstructed, according to the propagandistic styles of Fascism to celebrate the history of Italy. So, the fourth floor was eliminated and the portico was demolished [21]. Interested readers can refer to [20,21,22] for more details.

Figure 1.
Figure 1. (a) The Vicarious Palace as is today; (b) the Vicarious Palace at the beginning of XX century.
Figure 1.
Figure 1. (a) The Vicarious Palace as is today; (b) the Vicarious Palace at the beginning of XX century.
2.2. Geometrical and Material Data
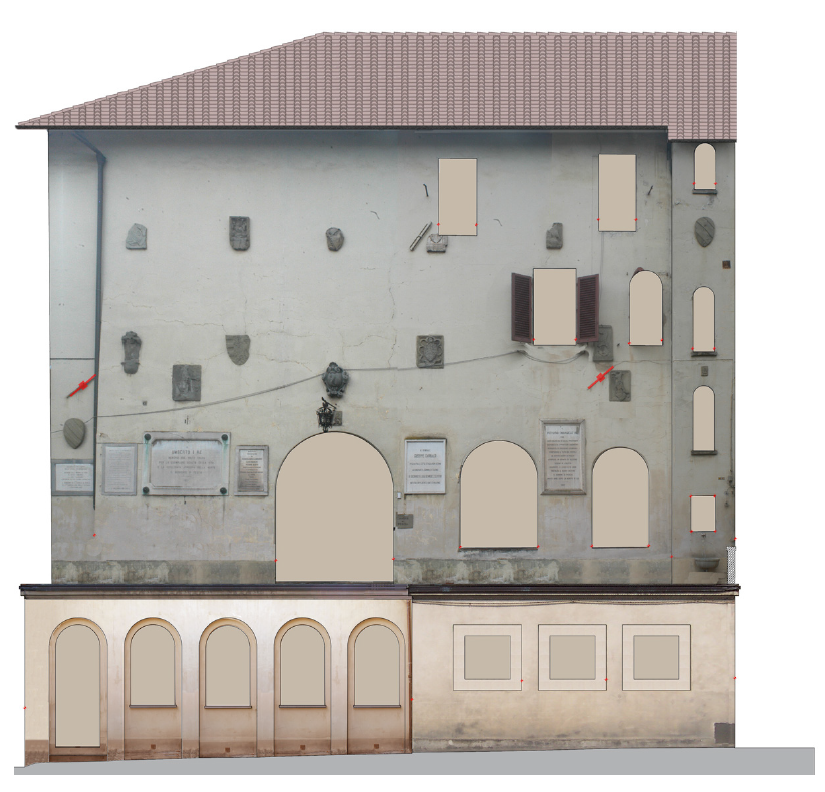
The plan layout of the ground floor of the Palace is reported in Figure 2. It is possible to recognize the original medieval square nucleus, delimited by the walls indicated with AB, BC, CD and DA, whose dimensions are about 18 m × 15 m. In particular, the wall CD probably corresponded to the main city walls [20]. This square ground floor was an open space (as a loggia) used for public administrative activities. The adjoining walls EE, EF and FF were added during the last intervention in the thirties of the last century. The actual height of the Palace, after the demolition of the fourth storey, is about 17 m as reported in the section represented in Figure 3. The horizontal structures of the first floor are made of masonry vaults, while the upper floors and the roof are timber structures. Views of the main façades of the building are reported in Figures 4, 5 and 6.
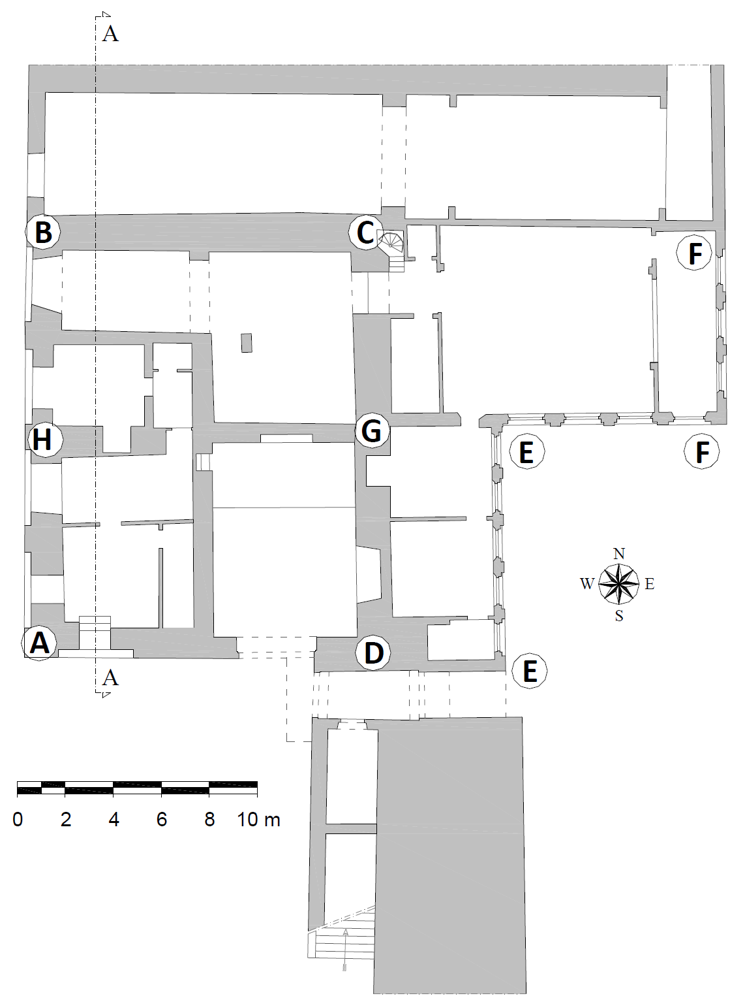
Figure 2.
Figure 2. Plan layout of the ground floor (ABCD is the original medieval square nucleus; EE-FF is a twentieth century addition).
Figure 2.
Figure 2. Plan layout of the ground floor (ABCD is the original medieval square nucleus; EE-FF is a twentieth century addition).


Figure 3.
Figure 3. Section A-A of the Palace.
Figure 3.
Figure 3. Section A-A of the Palace.
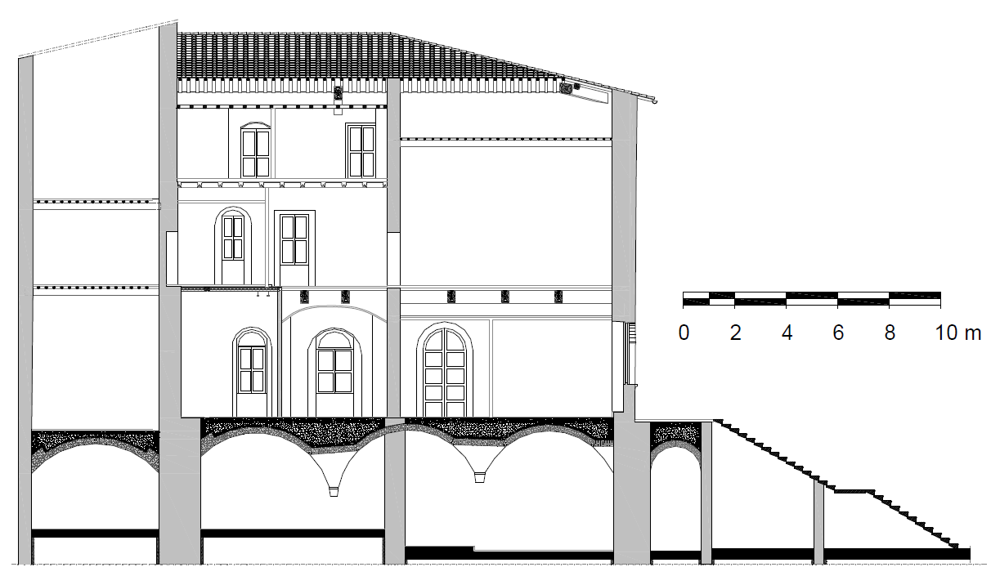

Figure 4.
Figure 4. View of the Southern façade.
Figure 4.
Figure 4. View of the Southern façade.
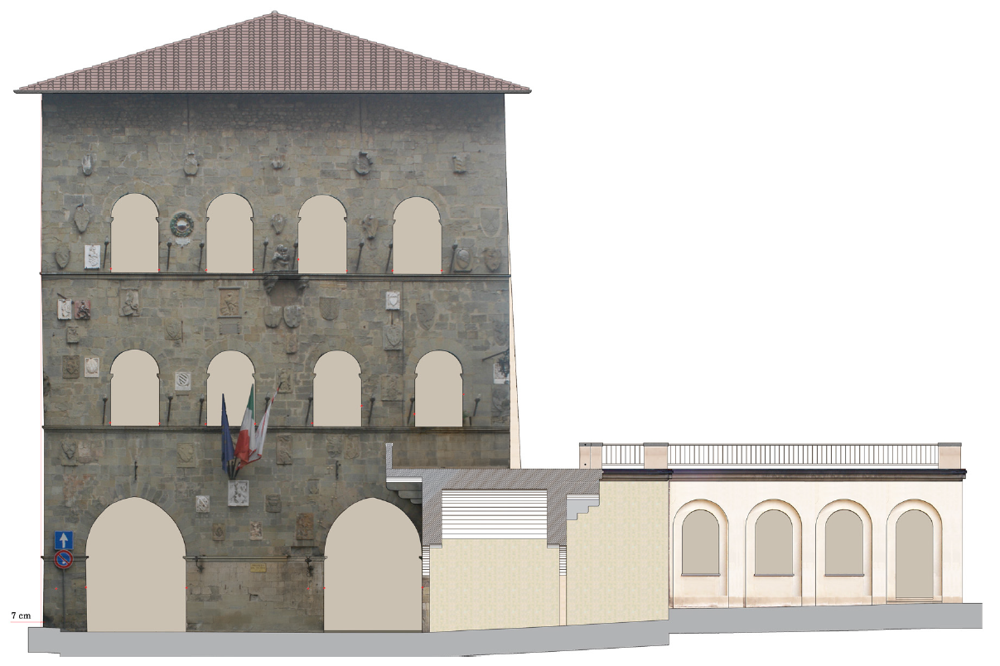
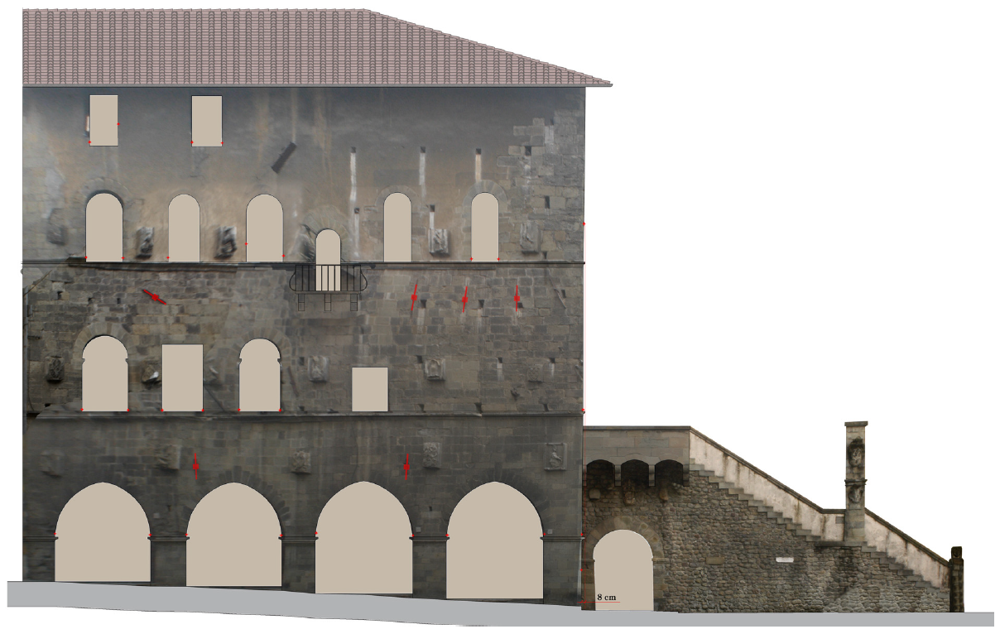
Figure 5.
Figure 5. View of the Western façade.
Figure 5.
Figure 5. View of the Western façade.


Figure 6.
Figure 6. View of the Eastern façade.
Figure 6.
Figure 6. View of the Eastern façade.
The walls of the oldest nucleus at the first level are stone masonry walls (local sandstone) and have a thickness of about 1 m. The walls of the upper levels are built with bricks and their thickness decreases as the level increases. Masonry was also used for the construction of the walls of the twentieth century addition. A specific plan of in-situtests to assess the mechanical properties of the masonries was not possible in this case. Hence, the strength and deformability of the walls were evaluated considering the Technical Recommendations [3,6] and the results of in-situ and laboratory tests on similar masonry materials [23,24], see Table 1. These parameters are conservative estimations of the average values for existing buildings.

Table 1.
Table 1. Mechanical parameters of the masonries.
| Stone walls | Brick walls | ||
|---|---|---|---|
| γ (kN/m3) | Specific weight | 21 | 18 |
| fm (N/mm2) | Compressive strength | 2.5 | 3.0 |
| ft (N/mm2) | Tensile strength | 0.12 | 0.12 |
| τ0 (N/mm2) | Shear strength | 0.093 | 0.100 |
| E (N/mm2) | Longitudinal elastic modulus | 1740 | 2100 |
| G (N/mm2) | Tangential elastic modulus | 290 | 350 |
| υ (-) | Poisson coefficient | 0.2 | 0.2 |
3. 3. Finite Element Model
The structural analysis of the Palace was approached by a 3D finite element model based on the concepts of homogenized material and smeared crack modeling using the ANSYS code v.11.0 [25]. The masonry walls were discretized with Solid65 elements (isoparametric three-dimensional eight node elements), whereas the ground floor vaults were discretized with Shell63 elements (isoparametric two-dimensional four node elements). The wooden floors and timber roof were not considered in the model and their own weights were applied on the bearing walls by means of vertical concentrated loads.
An in-situ survey of the building was made to accurately reproduce the geometry, the structural details and the irregularities of the Palace. This investigation consisted of a geometrical relief aimed at characterizing the masonry texture and to check up the quality of wall-to-wall, wall-to-floors and wall-to-roof connections. The 3D model is represented in Figure 7. It consists of 37,402 nodes, 36,557 Solid65 elements and 813 Shell63 elements, corresponding to 108,399 DOFs.
The nonlinear behavior of the masonry was represented by combining plasticity with a smeared crack approach. The perfectly-elastic plastic behavior with the Drucker-Prager (DP) yield surface was used to reproduce the plasticity properties, whereas the Willam-Warnke (WW) failure surface was considered for model crush and cracking [26].
Both DP and WW models were been extensively used to simulate the inelastic behavior of masonry. Discussing the homogenization approach for masonry, Zucchini and Lourenco [27] adopted the DP model to simulate the plastic deformation in masonry cells. They showed that it is possible to account for degradation of masonry mechanical properties in compression. Cerioni et al. [28] adopted the DP criterion to investigate the seismic behavior of the Parma Cathedral Bell-Tower. The WW criterion was used by Adam et al. [29] for model cracking and crushing capabilities of masonry materials; comparison between numerical and experimental results shows good agreement. Chiostrini et al. [23] combined the DP and the WW criteria to reproduce the results of several diagonal tests on masonry specimens, obtaining good agreement with experimental values. Betti and Vignoli combine the DP and the WW criteria to discuss the seismic vulnerability of a masonry church [15,30].
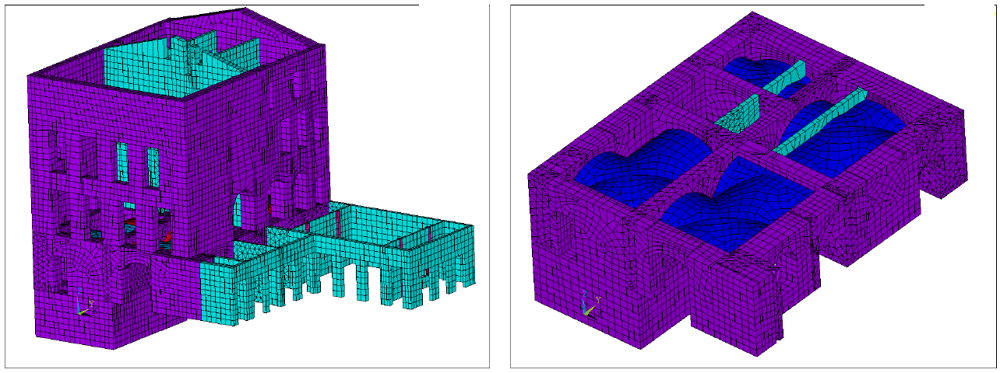
Figure 7.
Figure 7. Finite element model of the Vicarious Palace.
Figure 7.
Figure 7. Finite element model of the Vicarious Palace.

The cohesion c and the internal friction angle φ are the two material parameters required to define the DP yield surface. The Willam-Warnke (WW) failure surface is defined by two material constants, i.e. the uniaxial compressive strength fcWWand the uniaxial tensile strength ftWW of the masonry. A proper selection of these values allows the introduction of a cut-off to the tensile strength and an upper limit to the biaxial compressive strength. So, the model reproduces effectively the small tensile strength of the masonry, the plasticity behavior in regime of average compression and the crushing phenomenon for high compressive stresses. Table 2 collates the values of the nonlinear material parameters.
Table 2.
Table 2. Constitutive parameters of the masonries adopted for nonlinear FEM analyses (DP = plasticity criterion and WW = failure surface).
| DP yield surface | ||
|---|---|---|
| c (N/mm2) | Cohesion | 0.09 |
| φ (°) | Friction angle | 38° |
| δ (°) | Dilatancy angle | 15° |
| WW failure surface | ||
| fcWW (N/mm2) | Uniaxial compressive strength | 4.00 |
| ftWW (N/mm2) | Uniaxial tensile strength | 0.12 |
| βc(-) | Shear transfer coefficient for closed cracks | 0.75 |
| βt(-) | Shear transfer coefficient for open cracks | 0.25 |
Firstly, the 3D model was used to evaluate the stresses in the masonry walls produced by the vertical loads i.e.,: the dead weights, the live floor loads (2.0 kN/m2) and the snow load on the roof (1.1 kN/m2). The whole structure was analyzed in the nonlinear range to identify the weak points of possible failure, assuming fixed base restraint conditions.
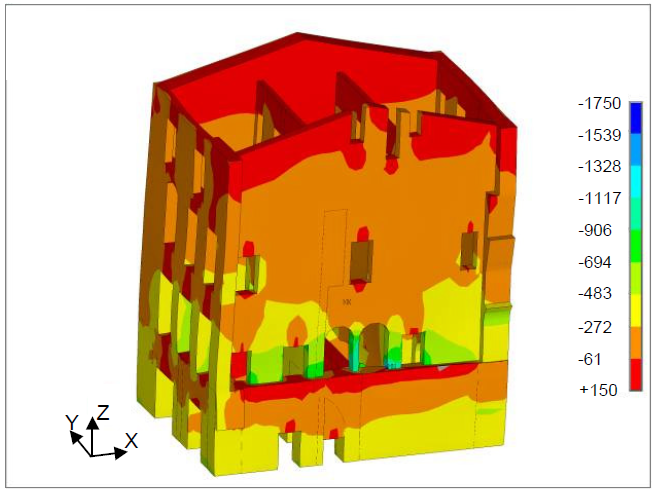
Results in terms of vertical stresses are reported in Figures 8 and 9. The average compressive stress at the base of the walls is about 0.5 N/mm2 with small tensile stresses located on the top surface of the walls. These tensile stresses are produced by the local numerical effect depending on the concentrated loads of the roof. The maximum compressive stress (about 1.7 N/mm2) is reached in a column close to an arch opening in the internal wall (Figure 9). Even if this value is high it is much less than the crushing limit of the masonry (local sandstone). Results of the analysis illustrate that the Palace is adequate to withstand the vertical loads under exercise conditions. This is a common result for this typology of buildings designed by skilled manufacturers.
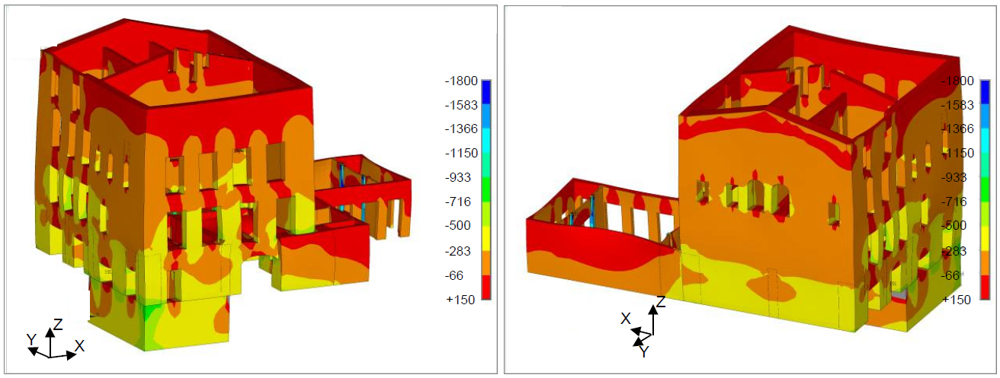
Figure 8.
Figure 8. Static analysis: vertical compressive stresses (units are kN/m2).
Figure 8.
Figure 8. Static analysis: vertical compressive stresses (units are kN/m2).


Figure 9.
Figure 9. Static analysis: vertical compressive stresses, detail of the internal wall (units are kN/m2).
Figure 9.
Figure 9. Static analysis: vertical compressive stresses, detail of the internal wall (units are kN/m2).
4. Seismic Analysis
4.1. Kinematic Analysis
The main assumptions of the kinematic method are: (a) masonry is a no-tension material (although this hypothesis may be considered conservative, only very small tension forces are transferred across the mortar joints); (b) masonry has infinite compressive strength (this hypothesis is not conservative, but in most cases collapse of masonry is due to cracks opening rather than to compression failure); and (c) structures are considered as assemblages of macro-elements (rigid bodies). The assessment of these macro-elements is based on structural geometry, shape (i.e., whole façades), details (i.e., the quality of existing connections between walls), and by examining collapses and damages consequent to past earthquakes in similar buildings [11,31].
Each allowable mechanism has a single degree of freedom and it is characterized by the formation of linear hinges among the single macro-elements. The seismic loads are assumed to be static horizontal forces amplified by a kinematic multiplier α ; the gravity loads are stabilization forces. Given an allowable mechanism, the corresponding kinematic multiplier at collapse α 0 is evaluated by the Virtual Work Theorem (V.W.T.).
The mechanisms considered in this study concern partial and global overturns of the main façades,
and the collapse multipliers α 0 are evaluated according to Eq. (1) (see the general scheme reported in Figure 10; A, B, C and D identify different mechanisms):
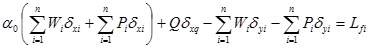
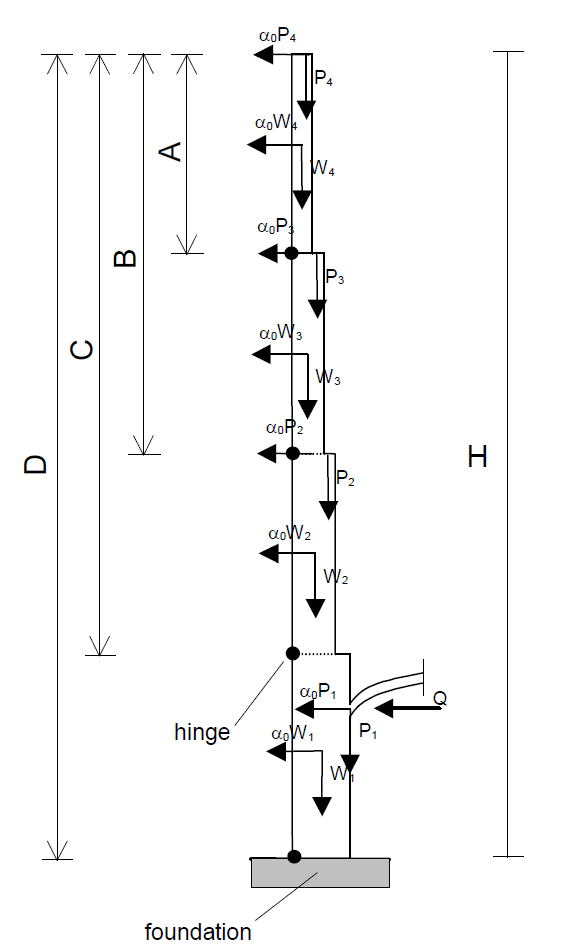
Figure 10.
Out-of-plane mechanisms; Pi are the vault or the floor vertical loads; Wi are the own weights of the walls; α 0Pi and α 0Wi are the seismic loads.
Figure 10.
Out-of-plane mechanisms; Pi are the vault or the floor vertical loads; Wi are the own weights of the walls; α 0Pi and α 0Wi are the seismic loads.

In Equation (1) Wi are the dead weights of the elements involved in the mechanism; Pi are the weights transmitted at the selected macro-element by vault, floors or roof; δxi are the horizontal virtual displacements of the points of application of Wi and Pi; δyi are the vertical virtual displacements of the points of application of Wiand Pi; Q is the static drift of the vault; δxq is the corresponding horizontal virtual displacement and Lfi is the virtual work of the internal forces, here assumed equal to zero. After the evaluation of the collapse multiplier α 0, the corresponding seismic spectral acceleration a0* is given by:
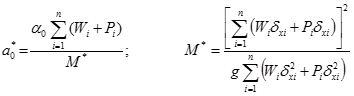
where M* is the effective participating mass and g is the gravity acceleration. According to [3] the analyzed
mechanism will not be possible under design earthquake if:
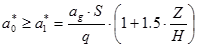
where agS is the design elastic spectral acceleration at T = 0, q is
the behavior factor (assumed equal to 2.0), Z is the height to the ground of the linear hinge of the mechanism and H is the total height of the façade. Each macro-element, i.e., each masonry façade, was analyzed considering first the overturning of the last floor only (the fourth floor, case A), then the overturning of the fourth and the third floor (case B), until in the last case where the overturning of the whole façade was analyzed (case D). The results are summarized in Table 3. The more vulnerable walls are the DA, the AH and the HB in which the vulnerability indexes a1*/a0* are higher. In all cases the overturning minimum collapse multipliers are obtained when the whole façade mechanism is considered; this suggests proper strengthening techniques.
Table 3.
Table 3. Vulnerability indexes obtained with kinematic analysis (α 0 = collapse multipliers; a0*= seismic spectral accelerations corresponding to α 0; a1*= seismic spectral accelerations demanded for ultimate limit state).
| Wall | Mechanism | α0 | a0* (m/s2) | (m/s2) | Check (a0*≥ a1*) | |
|---|---|---|---|---|---|---|
| 1-DA | A | 0.48 | 4.75 | 2.62 | 0.55 | YES |
| B | 0.08 | 0.78 | 1.99 | 2.55 | NO | |
| C | 0.06 | 0.60 | 1.62 | 2.70 | NO | |
| D | 0.03 | 0.33 | 1.10 | 3.33 | NO | |
| 2a-AH | A | 0.36 | 3.52 | 2.60 | 0.74 | YES |
| B | 0.09 | 0.84 | 2.01 | 2.39 | NO | |
| C | 0.06 | 0.56 | 1.58 | 2.82 | NO | |
| D | 0.03 | 0.27 | 1.10 | 4.07 | NO | |
| 2b-HB | A | 0.08 | 0.81 | 2.37 | 2.93 | NO |
| B | 0.06 | 0.62 | 1.94 | 3.13 | NO | |
| C | 0.05 | 0.49 | 1.53 | 3.12 | NO | |
| D | 0.04 | 0.36 | 1.10 | 3.06 | NO | |
| 3a-DG | A | 0.44 | 4.32 | 2.60 | 0.60 | YES |
| B | 0.11 | 1.12 | 2.02 | 1.80 | NO | |
| C | 0.08 | 0.83 | 1.60 | 1.93 | NO | |
| D | 0.05 | 0.47 | 1.10 | 2.34 | NO | |
| 3b-GC | A | 0.15 | 1.49 | 2.46 | 1.65 | NO |
| B | 0.12 | 1.13 | 2.00 | 1.77 | NO | |
| C | 0.09 | 0.91 | 1.55 | 1.70 | NO | |
| D | 0.08 | 0.83 | 1.10 | 1.33 | NO | |
| 4-BC | A | 0.22 | 2.14 | 2.46 | 1.15 | NO |
| B | 0.10 | 1.00 | 2.05 | 2.05 | NO | |
| C | 0.07 | 0.70 | 1.55 | 2.21 | NO | |
| D | 0.07 | 0.70 | 1.10 | 1.57 | NO |
4.2. Pushover Analysis
The seismic behavior of the Palace was also investigated by a non linear static analysis. The FE model was subject to constant gravity loads and, subsequently, to monotonically increasing horizontal forces (pushover analysis [32,33]). Specifically, the effects of the seismic action were evaluated by applying two systems of horizontal forces, not acting simultaneously, perpendicular to one another. The distribution of these forces is directly proportional to the masses by the displacements of the first modal shape in the pertinent direction (modal load).
Soon after its introduction in the late seventies, the pushover analysis became very attractive in earthquake engineering due to its relative simplicity (e.g., it requires quite simple material models, which do not account for progressive damage accumulation) and its reduced computational effort, compared with nonlinear dynamic analysis. Nevertheless, the method is not devoid of disadvantages and critical points, as highlighted by the scientific community. A comprehensive review of criticisms, advantages and disadvantages, together with the theoretical basis of the method, is reported in [34,35]. In this study a conventional pushover is performed, i.e., distribution of the horizontal forces does not change with progressive structural degradation occurring during an earthquake. This means that the analysis does not account for the progressive changes in modal frequencies due to crushing and cracking phenomena. This is a critical point for the application of conventional pushover to historic masonry buildings, because it is predictable that damaging of the building leads to a period elongation. Therefore, different spectral amplifications and modal load distributions should be considered [36,37]. The hypothesis of invariance of the distribution of the horizontal loads could cause an overestimation of the building seismic capacity, especially when non uniform damage or high level of cracking are expected. Yet, also in its conventional form pushover provides an efficient alternative method to expensive computational inelastic dynamic analyses and offers effective information on the damage state.
Results of pushover analysis in terms of displacements and crack and crushing patterns are reported in Figures 11 to 14. Figures 11 and 12 report the final configuration of the Palace for seismic loading acting in the transversal direction (+X and –X). In both cases there is a remarkable out-of-plane deformation of the wall AH, that confirms the results obtained with the kinematic analysis. Figures 13 and 14 show the Palace configuration for seismic loading acting in the longitudinal direction (+Y and –Y). Again it is possible to find a good agreement in terms of failure process between pushover and kinematic analysis, both confirming the overturning of the wall DA.
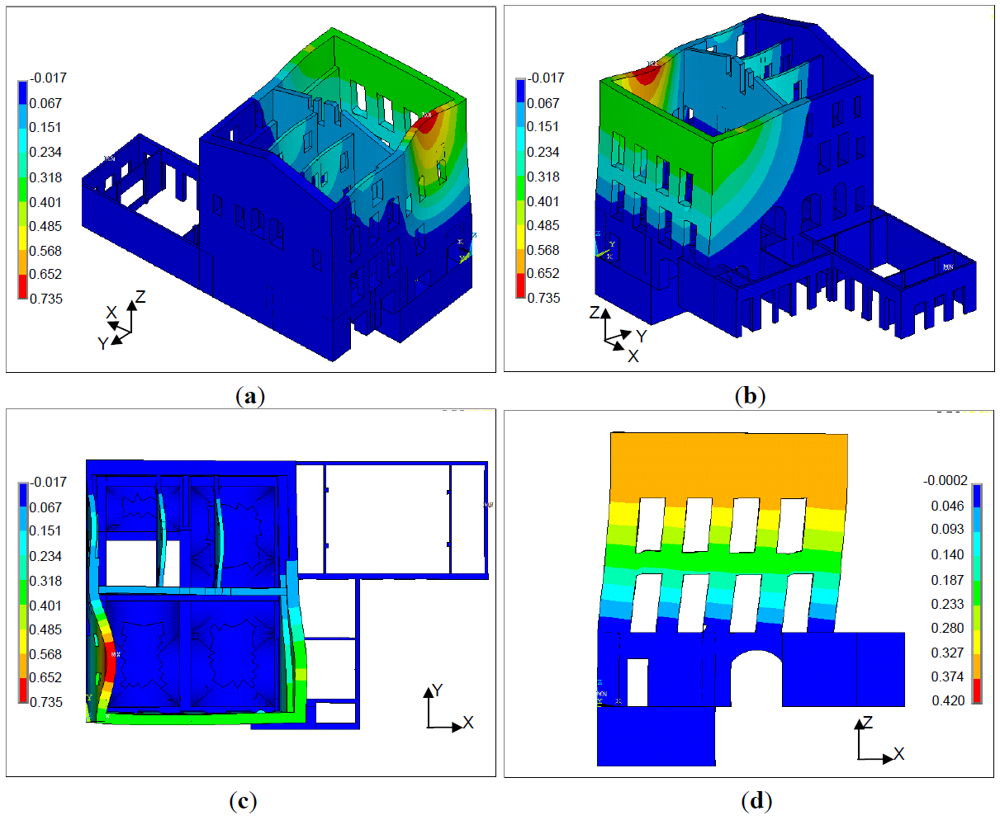
Figure 11.
Figure 11. Pushover analysis results (+X direction): (a), (b), (c) and (d) horizontal displacement in X direction (units are m).
Figure 11.
Figure 11. Pushover analysis results (+X direction): (a), (b), (c) and (d) horizontal displacement in X direction (units are m).

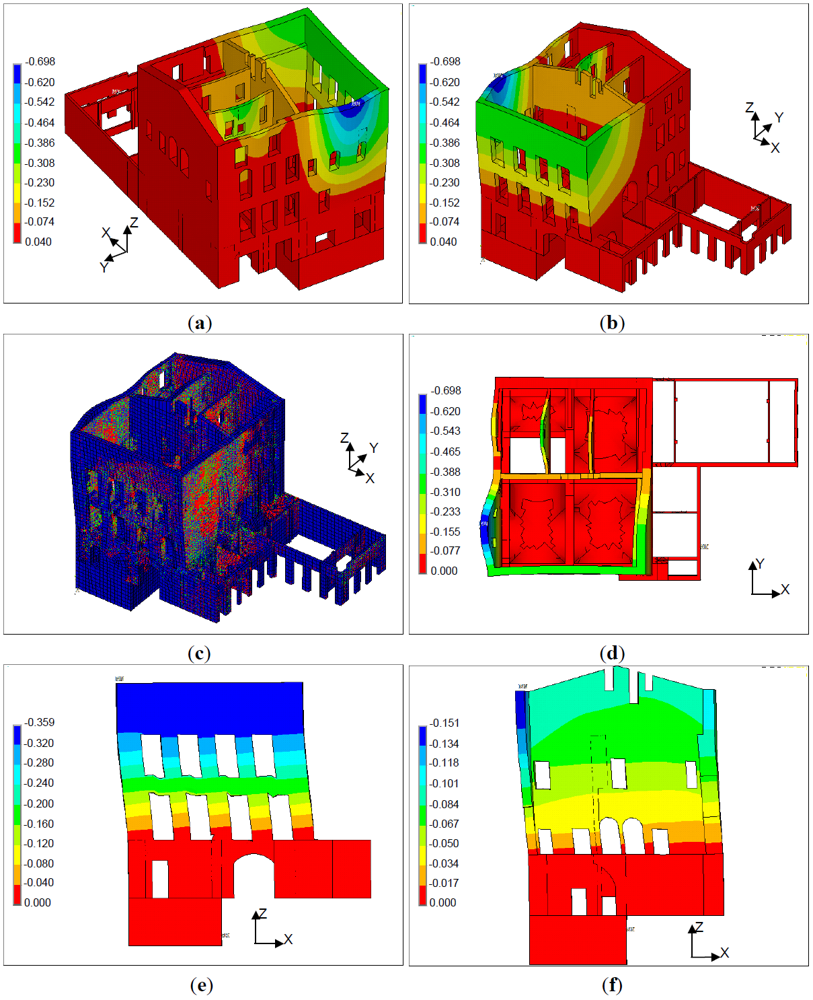
Figure 12.
Figure 12. Pushover analysis results (–X direction): (a), (b), (d), (e) and (f) horizontal displacement in X direction (units are m), (c) final cracking and crushing patterns.
Figure 12.
Figure 12. Pushover analysis results (–X direction): (a), (b), (d), (e) and (f) horizontal displacement in X direction (units are m), (c) final cracking and crushing patterns.

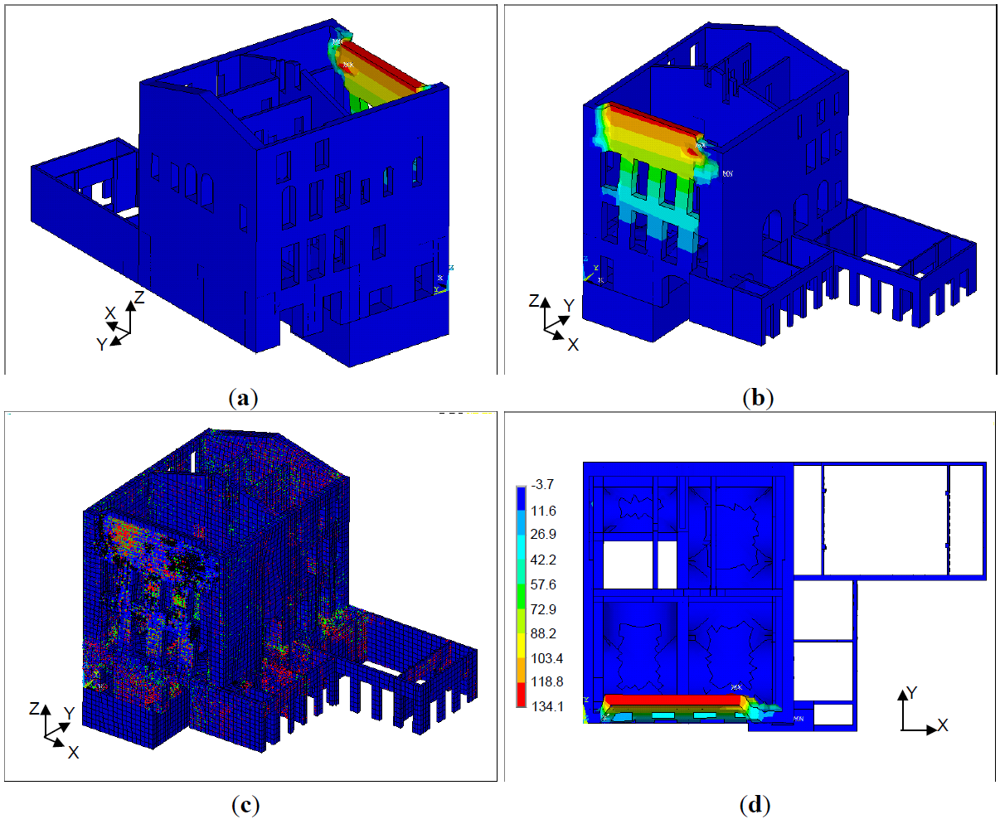
Figure 13.
Figure 13. Pushover analysis results (+Y direction): (a), (b) and (d) horizontal displacement in Y direction (units are m), (c) final cracking and crushing patterns.
Figure 13.
Figure 13. Pushover analysis results (+Y direction): (a), (b) and (d) horizontal displacement in Y direction (units are m), (c) final cracking and crushing patterns.

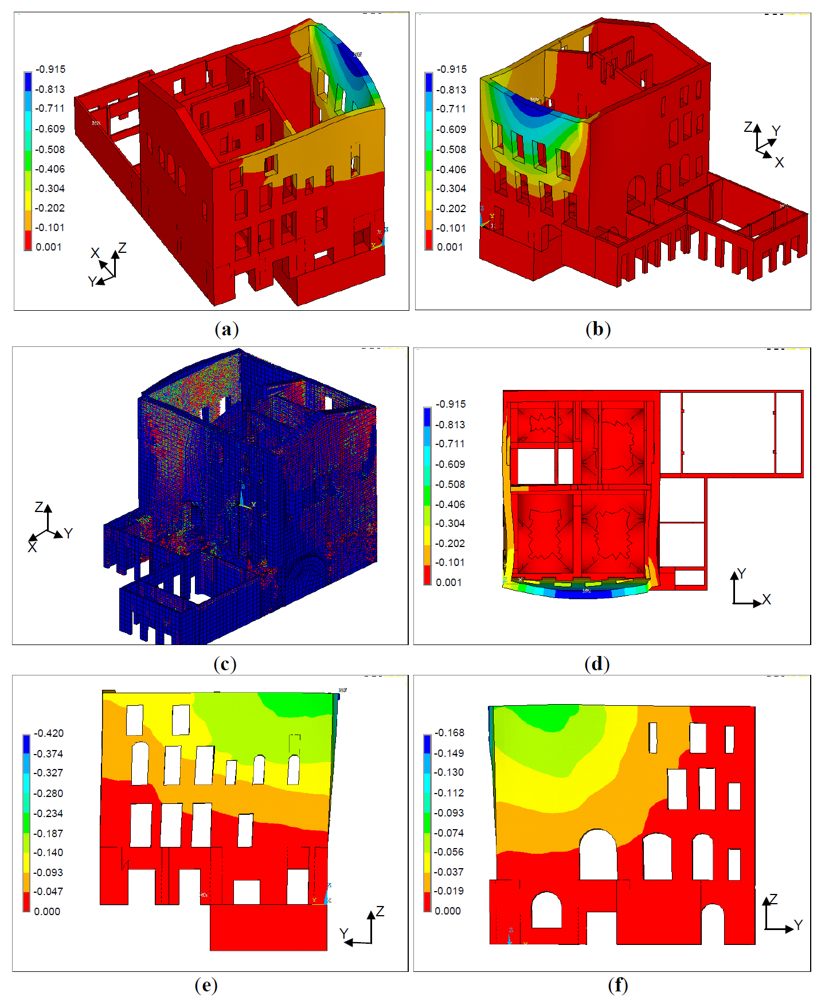
Figure 14.
Figure 14. Pushover analysis results (−Y direction): (a), (b), (d), (e) and (f) horizontal displacement in Y direction (units are m), (c) final cracking and crushing patterns.
Figure 14.
Figure 14. Pushover analysis results (−Y direction): (a), (b), (d), (e) and (f) horizontal displacement in Y direction (units are m), (c) final cracking and crushing patterns.

In case of seismic loading acting in the transversal direction (+X and –X) the analyses stop at a horizontal load corresponding to about 28–30% of the overall weight of the Palace; in case of seismic loading acting in the longitudinal direction (+Y and –Y) the analyses stop at a horizontal load corresponding to about 35–37% of the overall weight of the Palace.
Results obtained by analyses agree well with those obtained by the macro-element approach. The vulnerability of the Palace is mostly due to the absence of adequate connections between the opposite walls of the building due to the typology of the floors and the roof made of wooden beams. This has been already highlighted by other authors [38]. Absence of effective connections between structural components leads to overturning collapses of the perimeter walls under seismic loading due to the lack of box-behavior. Results suggest a proper strategy to improve the strength of the Palace against horizontal loads. A traditional retrofitting by means of steel chains and the creation of effective connections between wooden floors and masonry walls will prevent overturning of the façades [39].
5. Concluding Remarks
The paper has presented a multidisciplinary approach for structural analysis of historic buildings. Engineers involved in the study of monumental heritage are frequently asked to cover a great number of unknowns (materials properties, structural geometry, connections between structural and non-structural elements, stiffness of the horizontal diaphragms, existing damages, etc.). The combination of simple but not computationally expensive instruments (e.g., kinematic method) with more sophisticate ones (e.g., finite element approach) can offer proper indications for a subsequent in-situ investigation and for preliminary retrofitting solutions. The study on the Vicarious Palace in Pescia leads to the following conclusions. The static analysis confirms that the structural configuration of the Palace is adequate to withstand the vertical loads, as is usual for historic masonry buildings. The seismic analysis was approached by combining a global pushover analysis with a simplified approach based on the kinematic method. Results of the two types of analysis suggest that the more vulnerable parts of the Palace are the walls corresponding to the Southern and the Western façades. Overall, the study offers a screening of the most vulnerable elements of the Palace, suggesting that retrofitting should be planned to improve the connection between macro-elements by means of traditional techniques such as steel chains. Furthermore, connections between wooden floors and masonry walls should be also provided.
Acknowledgements
The authors would like to thank Eng. Paolo F. Bertini and Eng. S. Fiorindi for their contribution to numerical analyses.
References
- Valluzzi, M.R.; Saisi, A.; Cardani, G.; Binda, L. Vulnerability analysis of the historical buildings in seismic area by a multilevel approach. Asian J. Civil Eng. (Build. Hous.) 2006, 7, 343–357. [Google Scholar]
- Paganoni, S.; D’Ayala, D. Assessment and analysis of damage in L’Aquila historic city centre after 6th April 2009. Bull. Earthquake Eng. 2011, 9, 81–104. [Google Scholar] [CrossRef]
- O.P.C.M. 3274 del 20 Marzo 2003. Primi elementi in materia di criteri generali per la classificazione sismica del territorio nazionale e di normative tecniche per le costruzioni in zona sismica, G.U. n. 105, 8 Maggio 2003, S.O. n.72 e O.P.C.M. 3431 del 3 Maggio 2005, Ulteriori modifiche ed integrazioni all’O.P.C.M. 3274.
- D.M. del Ministero delle Infrastrutture e dei Trasporti 14 Settembre 2005. “Norme tecniche per le costruzioni”, G.U. n. 222.
- D.M. del Ministero delle Infrastrutture e dei Trasporti del 14 Gennaio 2008. Nuove Norme Tecniche per le Costruzioni, G.U. n. 29.
- Circolare del Ministero delle Infrastrutture del 2 Febbraio 2009. Istruzioni per l’applicazione delle “Nuove norme tecniche per le costruzioni” di cui al D.M. del 14/01/2008, G.U. n. 47.
- Ibenholt, K.; Bowitz, E. Economic impacts of cultural heritage—Research and perspectives. J. Cult. Herit. 2009, 10, 1–8. [Google Scholar] [CrossRef]
- Modena, M.; Casarin, F. Structural assessment and seismic vulnerability analysis of the Reggio Emilia Cathedral, Italy. In Proceeding of Structural Analysis of Historical Constructions, New Delhi, India, 6–8 November 2006.
- Foraboschi, P.; Barbieri, A.; Siviero, E. Lettura Strutturale Delle Costruzioni (in Italian); 1997; CittàStudiEdizioni: Milano, Italy. [Google Scholar]
- Lourenço, P.B. Computations on historic masonry structures. Prog. Struct. Eng. Mater. 2002, 4, 301–319. [Google Scholar] [CrossRef]
- Orlando, M.; Bartoli, G.; Betti, M. Evaluation study on structural fault of a Renaissance Italian Palace. Eng. Struct. 2010, 32, 1801–1813. [Google Scholar] [CrossRef]
- Ramos, L.F.; Fernandes, F.M.; Krakowiak, K.J.; Lourenço, P.B. Failure analysis of Monastery of Jerónimos, Lisbon: How to learn from sophisticated numerical models. Eng. Fail. Anal. 2007, 14, 280–300. [Google Scholar] [CrossRef]
- Bento, R.; Lopes, M.; Cardoso, R. Seismic evaluation of old masonry buildings. Part I: Method description and application to a case-study. Eng. Struct. 2005, 27, 2024–2035. [Google Scholar] [CrossRef]
- Bento, R.; Lopes, M.; Cardoso, R. Seismic evaluation of old masonry buildings. Part II: Analysis of strengthening solutions for a case study. Eng. Struct. 2005, 27, 2014–2023. [Google Scholar] [CrossRef]
- Vignoli, A.; Betti, M. Numerical assessment of the static and seismic behaviour of the Basilica of Santa Maria all’Impruneta (Italy). Construct. Build. Mater. 2011, 25, 4308–4324. [Google Scholar] [CrossRef]
- Milani, G.; Milani, E.; Malvezzi, R.; Mallardo, V. Seismic vulnerability of historical masonry buildings: A case study in Ferrara. Eng. Struct. 2008, 30, 2223–2241. [Google Scholar] [CrossRef]
- Carpinteri, A.; Binda, L.; Anzani, A.; Invernizzi, S.; Lacidogna, G. A multilevel approach for the damage assessment of historic masonry towers. J. Cult. Herit. 2010, 11, 459–470. [Google Scholar] [CrossRef]
- Saisi, A.; Binda, L. Research on historic structures in seismic areas in Italy. Prog. Struct. Eng. Mater. 2005, 7, 71–85. [Google Scholar] [CrossRef]
- Giuffrè, A. Sicurezza e conservazione dei centri storici. Il caso Ortigia; 1993; Laterza: Bari, Italy. [Google Scholar]
- Salvagnini, G. Pescia, una città. Proposta metodologica per la lettura di un centro antico; 1975; La Valdera: Firenze, Italy. [Google Scholar]
- Merlo, A. La loggia nella città medioevale. Genesi, rilievo e ricostruzione dei processi di trasformazione: l’esempio di Pescia. In Tesi di dottorato, Sezione Architettura e Disegno; 2001; Firenze, Italy. [Google Scholar]
- Salvagnini, G. Pescia, una comunità nel Seicento (1563–1738). 1989; Granducato Edizioni: Firenze, Italy. [Google Scholar]
- Vignoli, A.; Galano, L.; Chiostrini, S. A. In-situ tests and numerical simulations on structural behaviour of ancient masonry. In Proceedings of Monument-98, Workshop on Seismic Performance of Monuments, Lisbon, Portugal, 12–14 November 1998.
- Vignoli, A.; Galano, L.; Chiostrini, S. Mechanical characterization of stone masonry panels and effectiveness of strengthening techniques. In Proceeding of the 4th International Symposium on Computer Methods in Structural Masonry, London, UK, 3–5 September 1997.
- ANSYS v.11.0. ANSYS Manual Set; 1998; ANSYS Inc: Canonsburg, PA, USA.
- Willam, K.J.; Warnke, E.P. Constitutive model for the triaxial behaviour of concrete. In. In Proceedings of the IASBE Seminar on Concrete Structures Subjected to Triaxial Stresses, Bergamo, Italy, 17–19 May 1974; International Association for Bridge and Structural Engineering; Zurich, Switzerland; 19, pp. 1–30.
- Lourenço, P.B.; Zucchini, A. Mechanics of masonry in compression: Results from a homogenisation approach. Comput. Struct. 2007, 85, 193–204. [Google Scholar] [CrossRef]
- Donida, G.; Brighenti, R.; Cerioni, R. Use of incompatible displacement modes in a finite element model to analyze the dynamic behavior of unreinforced masonry panels. Comput. Struct. 1995, 57, 47–57. [Google Scholar] [CrossRef]
- Calderón, P.A.; Giménez, E.; Pallarés, F.J.; Ivorra, S.; Adam, J.M. Axially loaded RC columns strengthened by steel caging. Finite element modelling. Construct. Build. Mater. 2009, 23, 2265–2276. [Google Scholar] [CrossRef]
- Vignoli, A.; Betti, M. Modelling and analysis of a Romanesque church under earthquake loading: Assessment of seismic resistance. Eng. Struct. 2008, 30, 352–367. [Google Scholar] [CrossRef]
- Speranza, E.; D’Ayala, D. Definition of collapse mechanisms and seismic vulnerability of historic masonry buildings. Earthquake Spectra 2003, 19, 479–509. [Google Scholar] [CrossRef]
- Penna, A.; Lagomarsino, S.; Falasco, A. On the use of pushover analysis for existing masonry buildings. In Proceeding of the 1st European Conference on Earthquake Engineering and Seismology, Geneva, Switzerland, 3–8 September 2006.
- D’Amore, E.; Kim, S. Push-over analysis procedures in earthquake engineering. Earthquake Spectra 1999, 15, 417–434. [Google Scholar] [CrossRef]
- Amr, S.E.; Vassilis, K.P. Evaluation of conventional and adaptive pushover analysis I: Methodology. J. Earthquake Eng. 2005, 9, 923–941. [Google Scholar]
- Vassilis, K.P.; Amr, S.E.; Juan, F.P. Evaluation of conventional and adaptive pushover analysis II: Comparative results. J. Earthquake Eng. 2006, 10, 127–151. [Google Scholar]
- Antoniou, S.; Pinho R., *REPLACE*. Advantages and limitations of adaptive and non adaptive force-based pushover procedures. J. Earthquake Eng. 2004, 8, 497–522. [Google Scholar]
- Goel, R.K.; Chopra, A.K. A modal pushover analysis procedure to estimate seismic demands for unsymmetric-plan buildings. Earthquake Eng. Struct. Dyn. 2004, 33, 903–927. [Google Scholar] [CrossRef]
- Ramos, L.; Lourenço, P.B. Modeling and vulnerability of historical city centers in seismic areas: A case study in Lisbon. Eng. Struct. 2004, 26, 1295–1310. [Google Scholar] [CrossRef]
- ICOMOS. Recommendations for the analysis, conservation and structural restoration of architectural heritage, International Scientific Committee for Analysis and Restoration of Structures of Architectural Heritage, 2001.
© 2012 by the authors; licensee MDPI, Basel, Switzerland. This article is an open-access article distributed under the terms and conditions of the Creative Commons Attribution license (http://creativecommons.org/licenses/by/3.0/).