1. Introduction
A typical precast concrete sandwich panel (PCSP) consists of inner and outer concrete wythes, an insulation layer, and connectors, integrating structural load-bearing capacity with thermal insulation and architectural functionality [
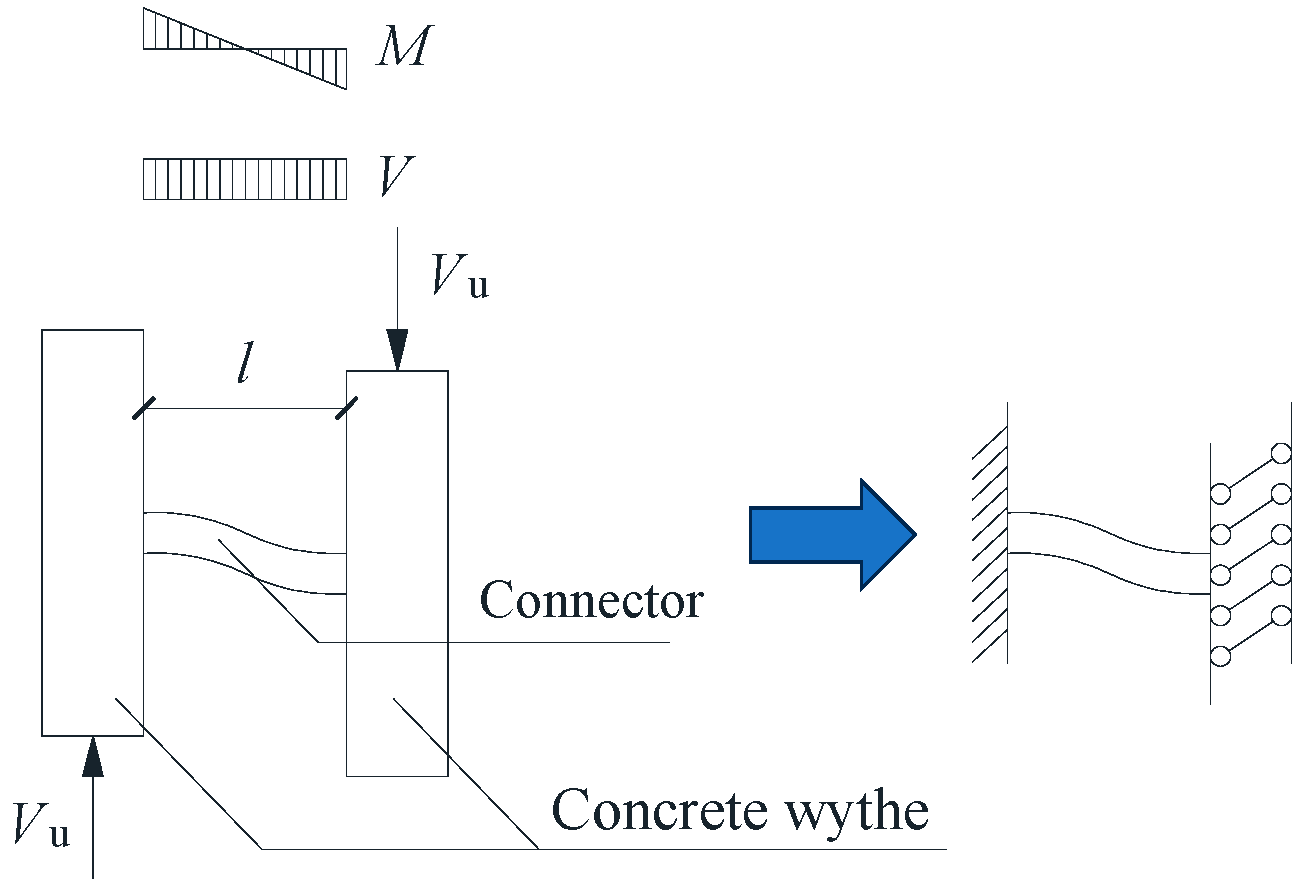
1]. Owing to these advantages, PCSPs are widely employed as exterior enclosure walls in both public and residential buildings. PCSPs are primarily designed to resist out-of-plane loads, including wind pressures and seismic actions. Under such loading conditions, shear forces developed between the wythes are transferred predominantly via the connectors. Consequently, the shear performance of these connectors plays a pivotal role in the structural safety and overall performance of PCSPs.
Early applications of PCSPs commonly utilized solid concrete zone between the two wythes as connectors, which provided high stiffness and strong load-bearing capacity [
2]. However, the concrete penetrating the insulation layer creates thermal bridges, significantly reducing the thermal insulation performance of the wall system. By the 1980s, steel connectors became the predominant choice for insulated sandwich walls [
2,
3,
4,
5]. Nevertheless, on account of the elevated thermal conductivity of steel, thermal bridges at the connector locations remained a persistent issue, making it difficult to meet increasingly stringent energy efficiency standards. Additionally, the limited corrosion resistance of steel connectors could give rise to long-term durability concerns. Over the following decade, fiber-reinforced polymer (FRP) connectors gained widespread adoption in PCSPs owing to their superior thermal efficiency [
4]. Characterized by low thermal conductivity, excellent durability, and high strength, FRP connectors effectively mitigate thermal bridging at the connections, thereby enhancing both the energy efficiency and long-term safety of the wall system. These advantages make FRP connectors a highly promising solution for broad application in the construction industry.
The existing literature provides substantial experimental data on the shear performance of FRP connectors. Einea [
4], Natio [
6], Woltman [
7], Hodicky [
2], Huang [
8], Chen [
9], and Liu [
10] performed shear tests on different types of FRP connectors and compared their performance with that of the steel connectors. These studies indicated that the shear strength of FRP connectors was lower than that of both steel connectors and the pure shear strength of the FRP material itself, while their shear stiffness was also inferior to that of steel connectors. This phenomenon occurs due to connectors in PCSPs experience a combination of shear forces, bending moments, and axial forces arise from the slip between the two wythes. As a result, their ultimate load-carrying capacity cannot be directly predicted using the pure shear strength of FRP materials. Moreover, because FRP materials lack a yield plateau, the connectors are unable to undergo internal force redistribution, further limiting their shear performance. Natio [
6] investigated the shear behavior of FRP connectors with various geometric configurations. The results showed that FRP rod connectors exhibited shear capacities ranging from 1.5 kN to 8.4 kN, whereas plate connectors achieved a capacity of 11.9 kN, and grid connectors reached 40.3 kN/m. The study further indicated that connector geometry has a pronounced influence on shear stiffness, with plate connectors and grid connectors demonstrating substantially higher stiffness than rod connectors. Meng et al. [
11] conducted shear tests on U-shaped and V-shaped FRP connectors. Their results showed that U-shaped connectors exhibited higher shear strength, whereas V-shaped connectors demonstrated smaller ultimate displacement. Furthermore, both the embedment depth and the insulation layer thickness significantly influence the shear performance of the connector. An increase in insulation layer thickness leads to a reduction in the shear capacity of the connector and shifts the failure mode from connector fracture to concrete anchorage failure [
12,
13,
14,
15]. Conversely, an increase in the embedment depth enhances the shear capacity [
16,
17]. As demonstrated in Choi’s study, a truss-type GFRP connector with an embedment depth of 30 mm failed due to anchorage failure, whereas a connector with a 40 mm embedment depth failed by fracture [
16]. Generally, increasing the orientation angle of connectors also increased their stiffness and ultimate capacity, while the most effective orientation angle observed by Fahmy et al. was 45 degrees from tested specimens [
18]. However, it is difficult to precisely control this installation angle during construction. Furthermore, the out-of-plane shear performance of connectors at such an angle has not been validated.
With regard to theoretical studies on the shear behavior of connectors, prior research has primarily focused on developing computational models for shear capacity and shear–slip relationships. Woltman et al. presented a calculation model for the shear resistance of FRP rod connectors [
7]. This model analyzed the bending and shear actions separately without considering the material failure criteria under their combined effect, leading to an overestimation of the connector’s shear capacity. Bunn [
19] suggested that the shear capacity of connectors is influenced by factors such as the type of insulation layer, insulation thickness, connector spacing, and orientation. He introduced a calculation formula for the shear capacity of CFRP grid connectors, in which various correction coefficients were fitted based on limited experimental data, thus lacking general applicability. Liu et al. proposed a model for shear capacity of BFRP bar connectors based on a quartic polynomial response surface model and cross-validation error analysis method [
10]. This model fits the shear capacity of the connectors using the angle and span-to-height ratio as variables; however, it lacks a solid theoretical foundation. Based on shear tests of 14 types of connectors, Natio et al. [
6] developed a tri-linear shear–slip model consisting of elastic, plastic, and unloading phases. In this model, the plastic phase initiates when the shear force reaches 75% of the connector’s shear capacity, and the ultimate slip is taken as the slip at which the shear force has dropped by 50%. Nonetheless, no analytical approach was provided to determine the characteristic slip points required for practical use of the model. In practice, the slip between concrete wythes can be decomposed into two components: the slip at the anchored end of the connector, and the slip due to connector deformation within the height of the insulation layer. To date, no study has separately considered these two slip components to propose a comprehensive calculation model for the whole shear–slip response of FRP connectors.
The International Code Council Evaluation Service (ICC-ES), an internationally recognized professional evaluation agency based in the United States, published the AC320 in 2015 [
20]. This standard specifies requirements for testing methods, performance evaluation, quality control, and certification for FRP connectors. Subsequently, the Chinese standard JG/T 561-2019 [
21] stipulates the material properties, mechanical performance, durability, pull-out and shear performance requirements, and corresponding test methods for FRP connectors. However, current standards provide neither a unified calculation method for the shear capacity nor a definitive shear–slip model for connectors.
In summary, FRP connectors are capable of meeting the design requirements of PCSPs. Experimental studies on connectors with various geometric configurations have shown that geometry significantly affects shear behavior: plate connectors and grid connectors exhibit relatively high load-bearing capacity and stiffness under in-plane shear, whereas their out-of-plane shear performance is considerably lower. In contrast, rod connectors provide bidirectional shear resistance. With reasonable structural design to improve their shear capacity, they can serve as excellent insulated connectors. Furthermore, the shear performance of connectors is also affected by factors such as the embedment depth and insulation thickness; however, the specific influence of these factors on shear performance still remains insufficiently understood. In terms of theoretical research, no calculation model for shear capacity or shear–slip model has been established considering the shear-bending interaction within the connector. To address the above issues, this study develops a novel FRP rod connector with a cruciform cross-section. An experimental program of shear tests was carried out to investigate the effects of embedment depth, outer-wythe thickness, and insulation thickness on connector’s shear capacity and shear–slip response. Based on the test results and the Hashin criterion for composite materials, a calculation method for shear capacity and a shear–slip model for the proposed connector are established.
2. Connector Design and Development
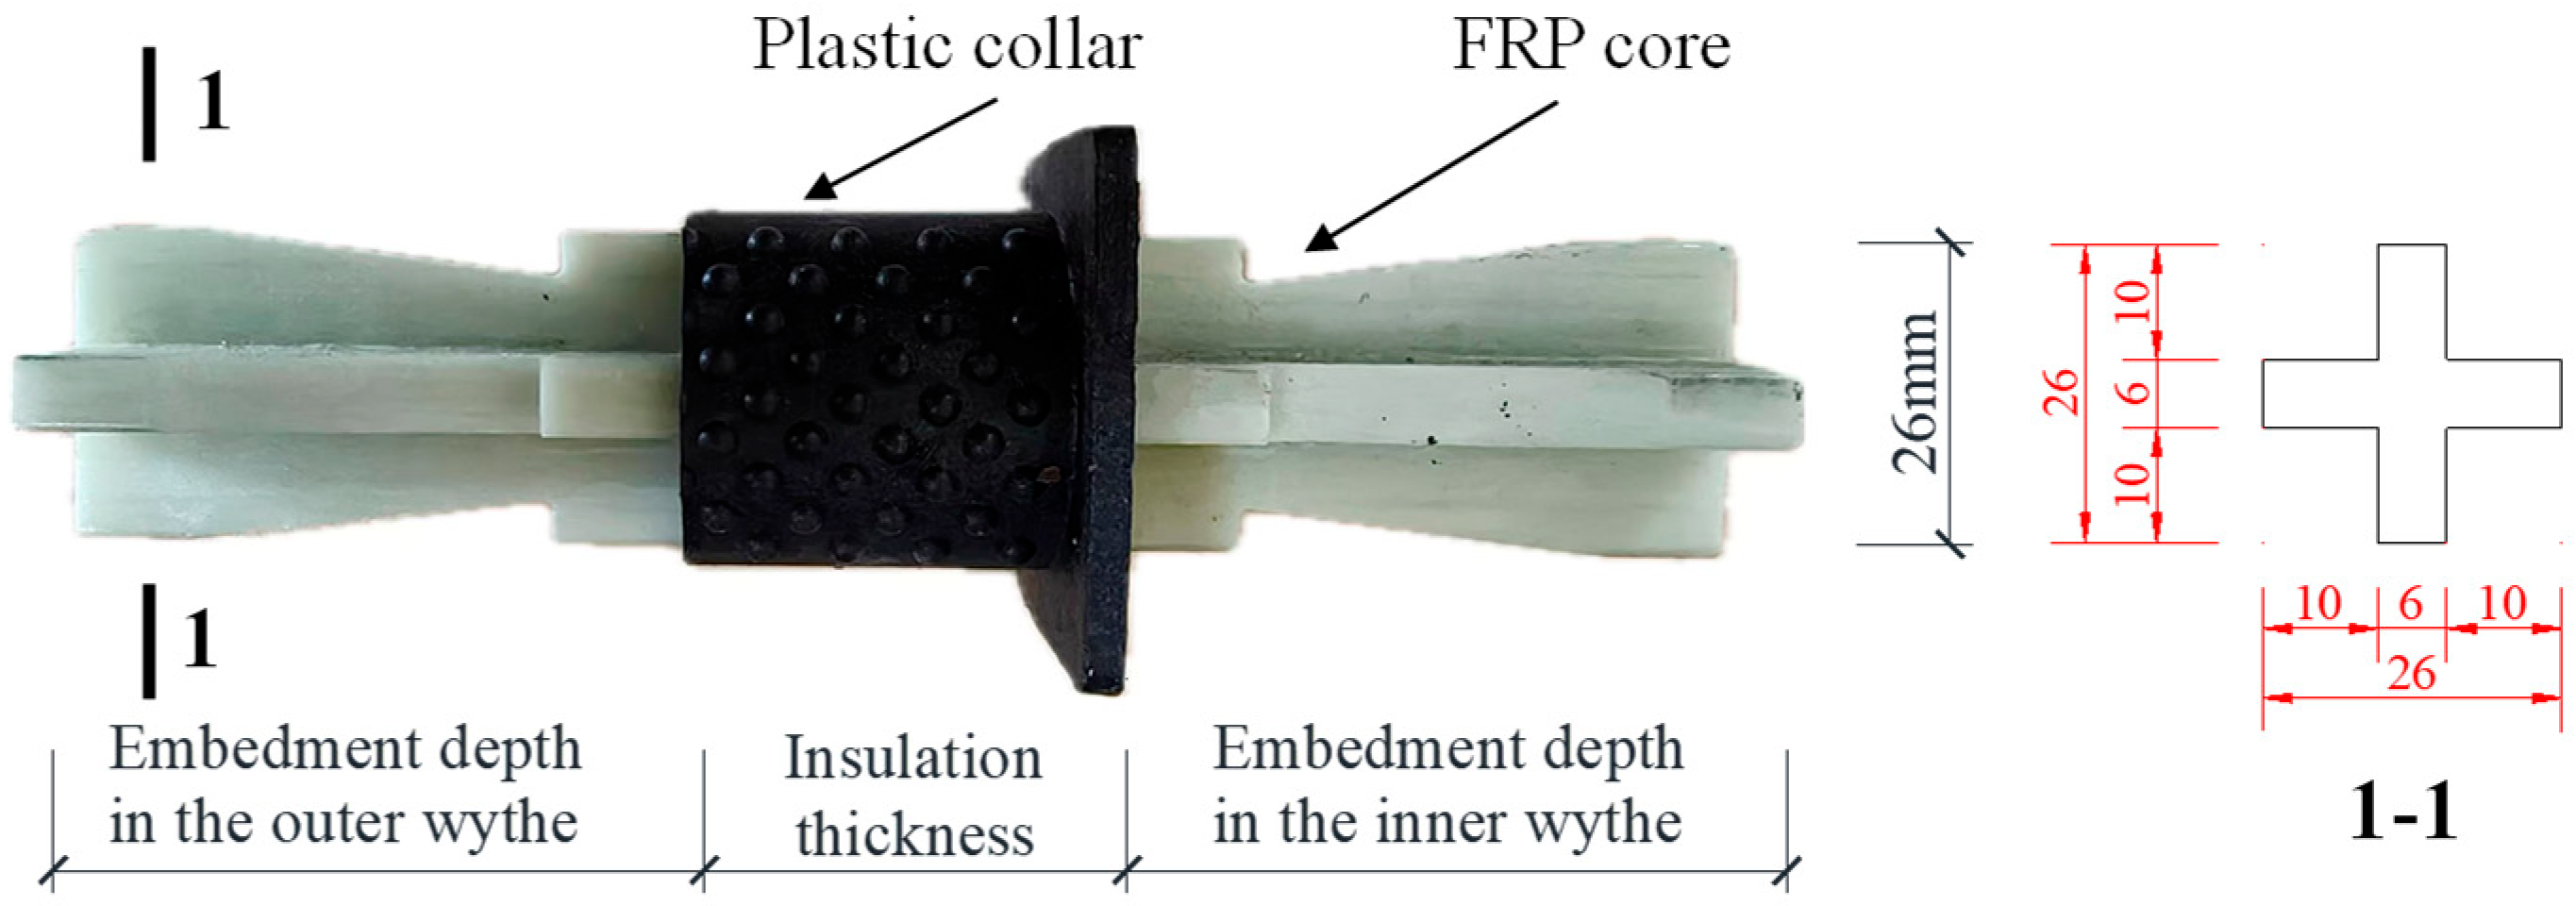
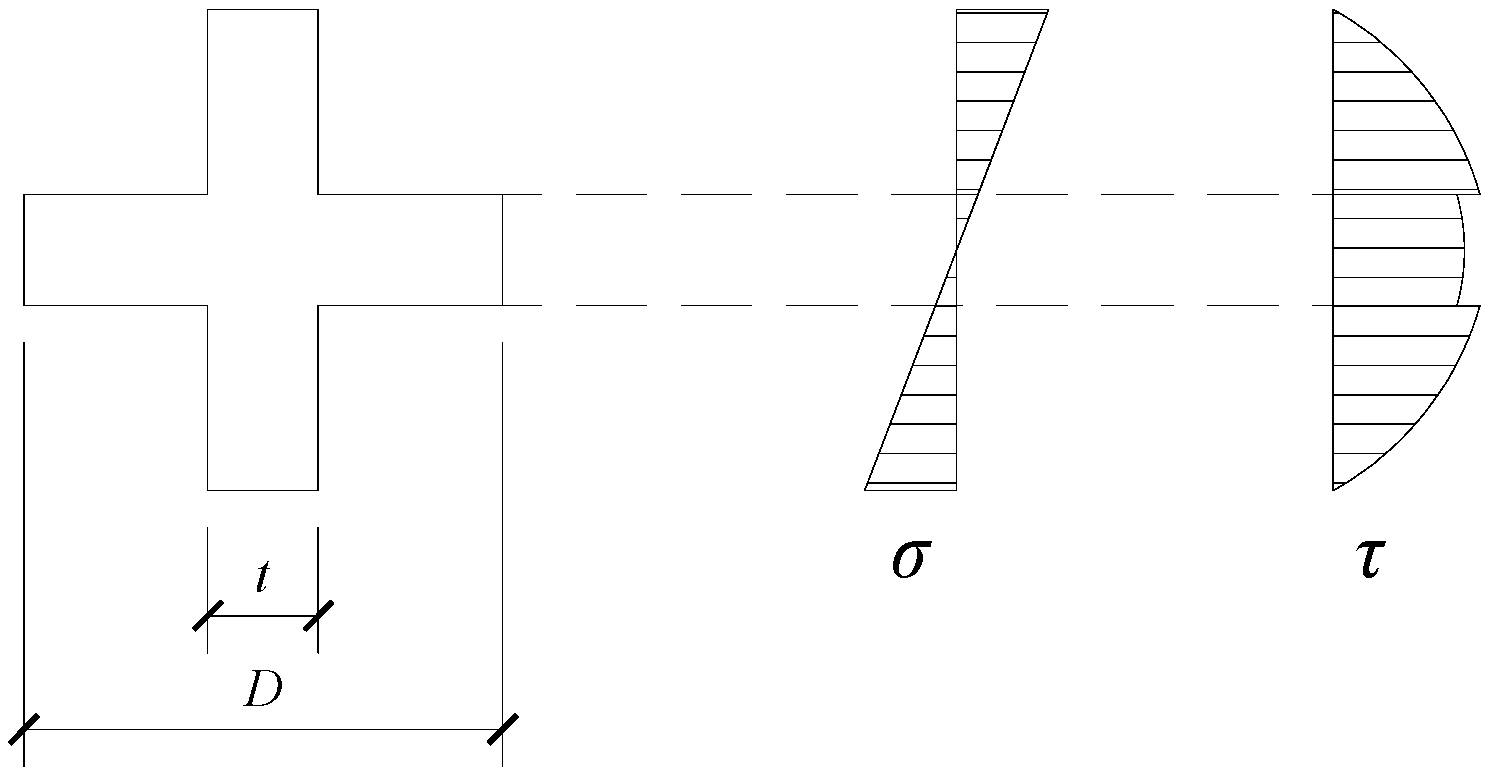
Beginning in 2007, our team has developed a cross-shaped FRP rod connector to meet the connection needs of PCSP. The connector comprises two primary components: an FRP core and a plastic collar. The FRP core is designed to transfer inter-wythe shear, while the plastic collar ensures accurate positioning within the insulation layer and fixity during concrete casting. For improved anchorage, triangular grooves are cut into the concrete-embedded portions at the ends of each flange of the FRP core (see
Figure 1). The FRP core was made of unidirectional continuous TM-glass fibers impregnated in a vinyl ester resin matrix using the pultrusion process. Compared to conventional E-glass fiber, TM-glass fiber has higher tensile strength, tensile modulus, alkaline resistance and acid resistance. The volume fractions of fibers, resin, and other ingredients are presented in
Table 1. Subsequently, triangular grooves were created on both ends of each flange within the region to be anchored in concrete. Finally, a plastic collar was formed around the exterior of the FRP core via injection molding. The material of the collar is a copolymer of acrylonitrile, butadiene, and styrene (ABS), which exhibits excellent thermal efficiency, heat resistance, low-temperature resistance, chemical resistance, impact resistance, and electrical properties, along with good processability and cost-effectiveness.
To evaluate the mechanical properties of the connector, tensile tests and short-beam shear tests were conducted. The tensile tests were performed in accordance with the Chinese national standard GB/T 1447-2005 [
22], while the short-beam shear tests followed ASTM D2344-22 [
23]. The measured material properties are summarized in
Table 2.
4. Experimental Results
4.1. Overall Responses and Failure Mode
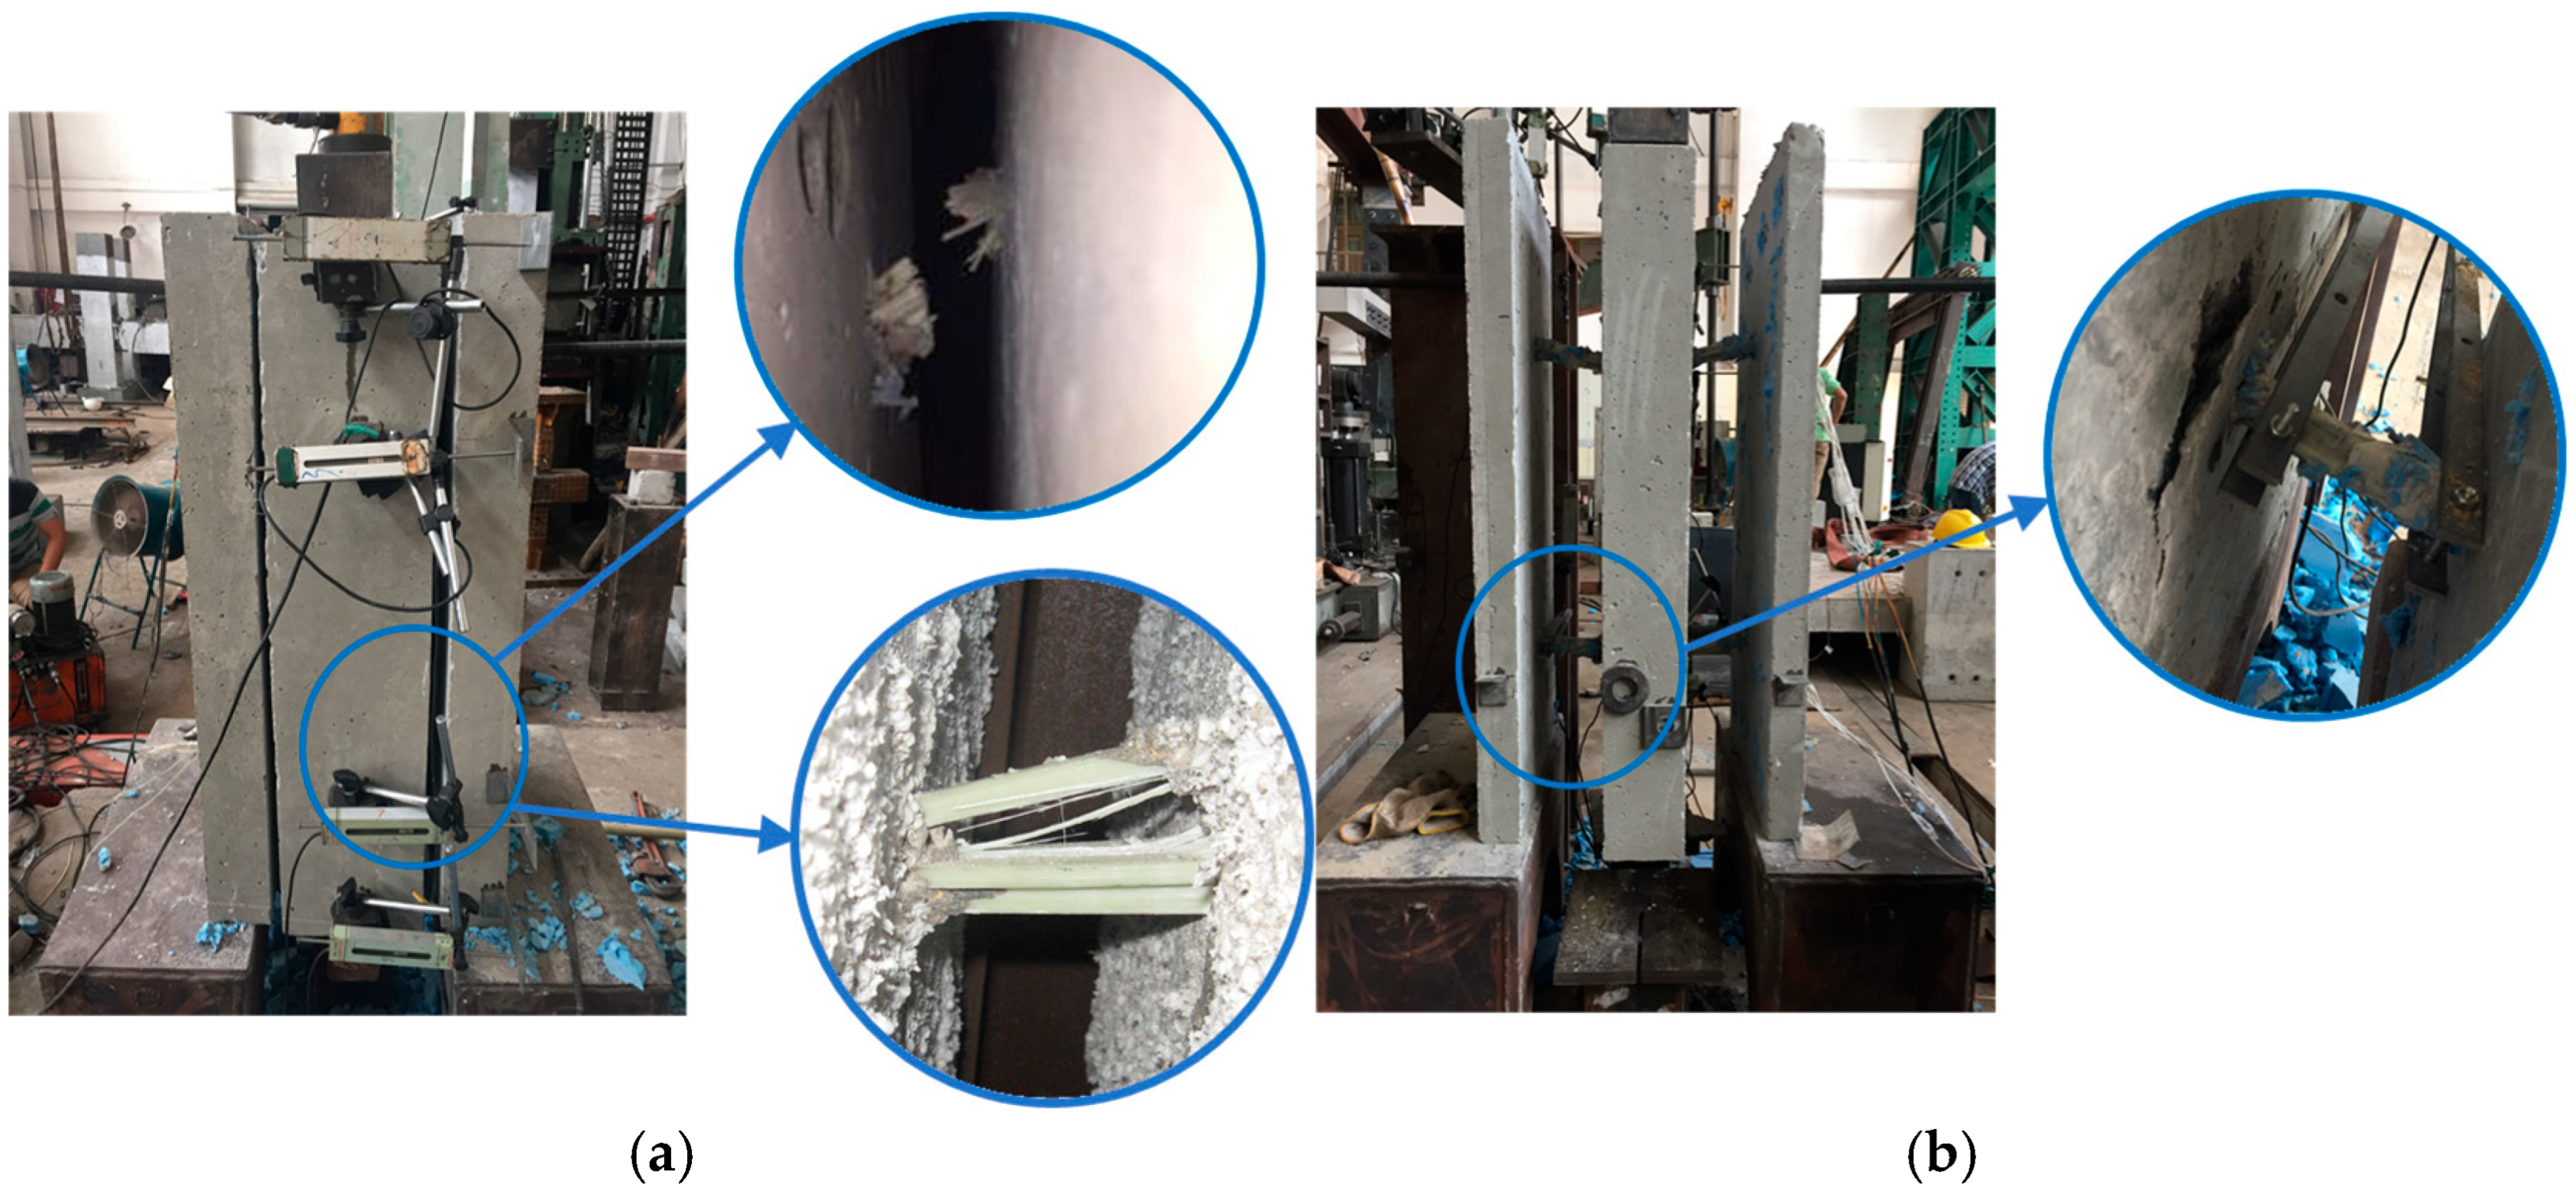
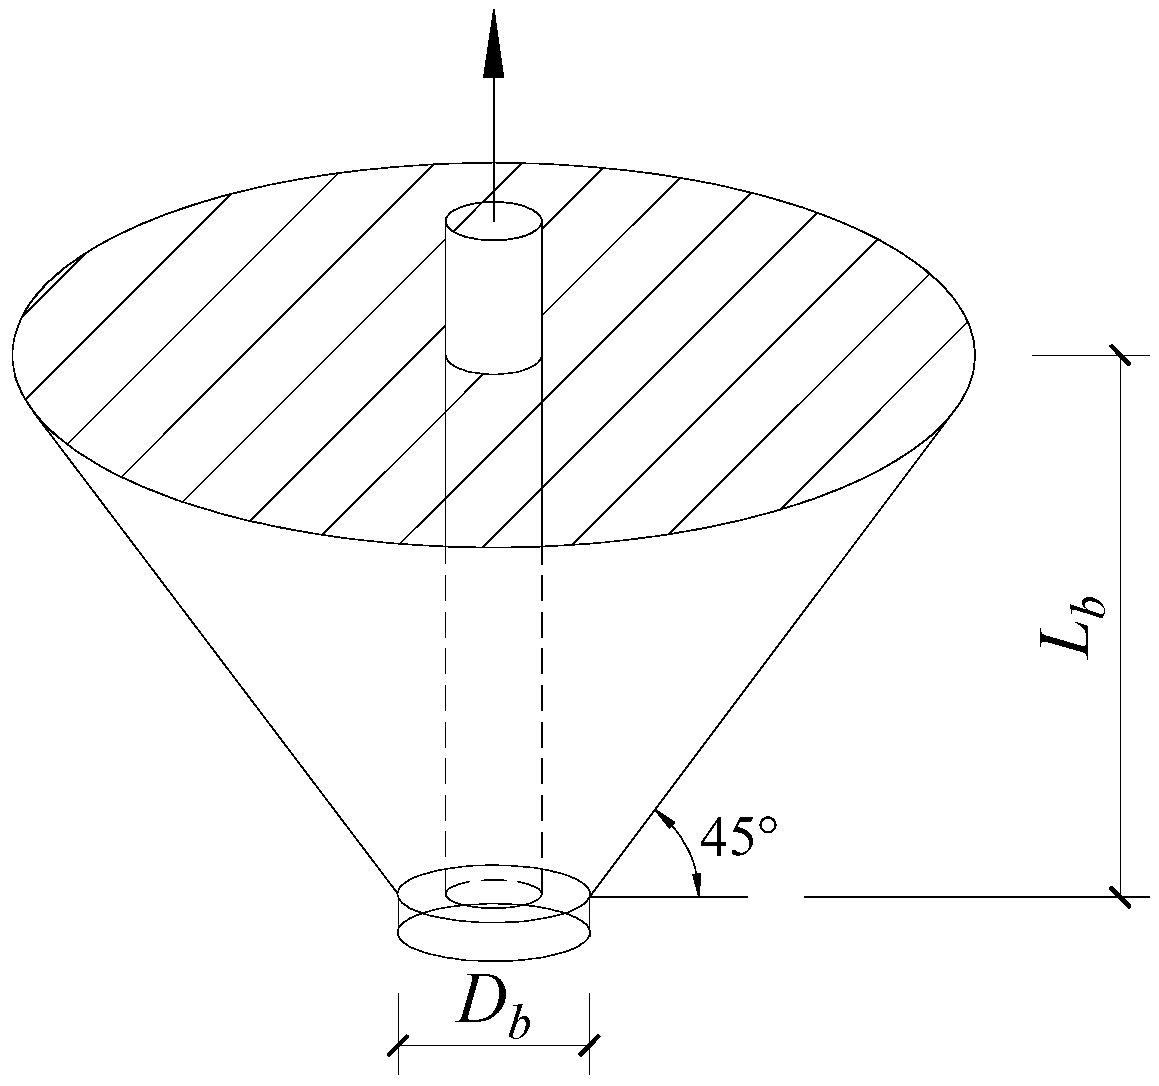
As the applied load increased to about 50% of the peak load, fiber-tearing sounds were observed in the connectors, indicating the initiation of damage and accompanied by noticeable tilting. At later loading stages, significant relative displacement developed between the wythes. In some specimens, the connectors failed abruptly in shear. In others, splitting cracks first appeared in the concrete near the anchorage zone of the connectors and rapidly propagated to form a circumferential crack. This was followed by concrete anchorage failure, characterized by a conical pull-out mode with a failure surface inclined at approximately 30–35° relative to the concrete surface. In both failure modes, the specimens exhibited a relatively sudden loss of load-carrying capacity.
When the insulation layer thickness ranged from 30 mm to 90 mm, the predominant failure mode was connector fracture (
Figure 7a). In contrast, 120 mm thick insulation specimens exhibited concrete anchorage failure (
Figure 7b).
The connector strain increased nearly linearly up to specimen failure. The strain parallel to the connector axis was relatively large, whereas the strains perpendicular to the axis and at the 45° direction were considerably smaller. This indicates that the transverse shear forces acting on the connector generated substantial normal stresses within the member. In addition, the axial strains measured at the upper and lower sections were essentially symmetrical.
4.2. Load–Slip Curves and Shear Capacities
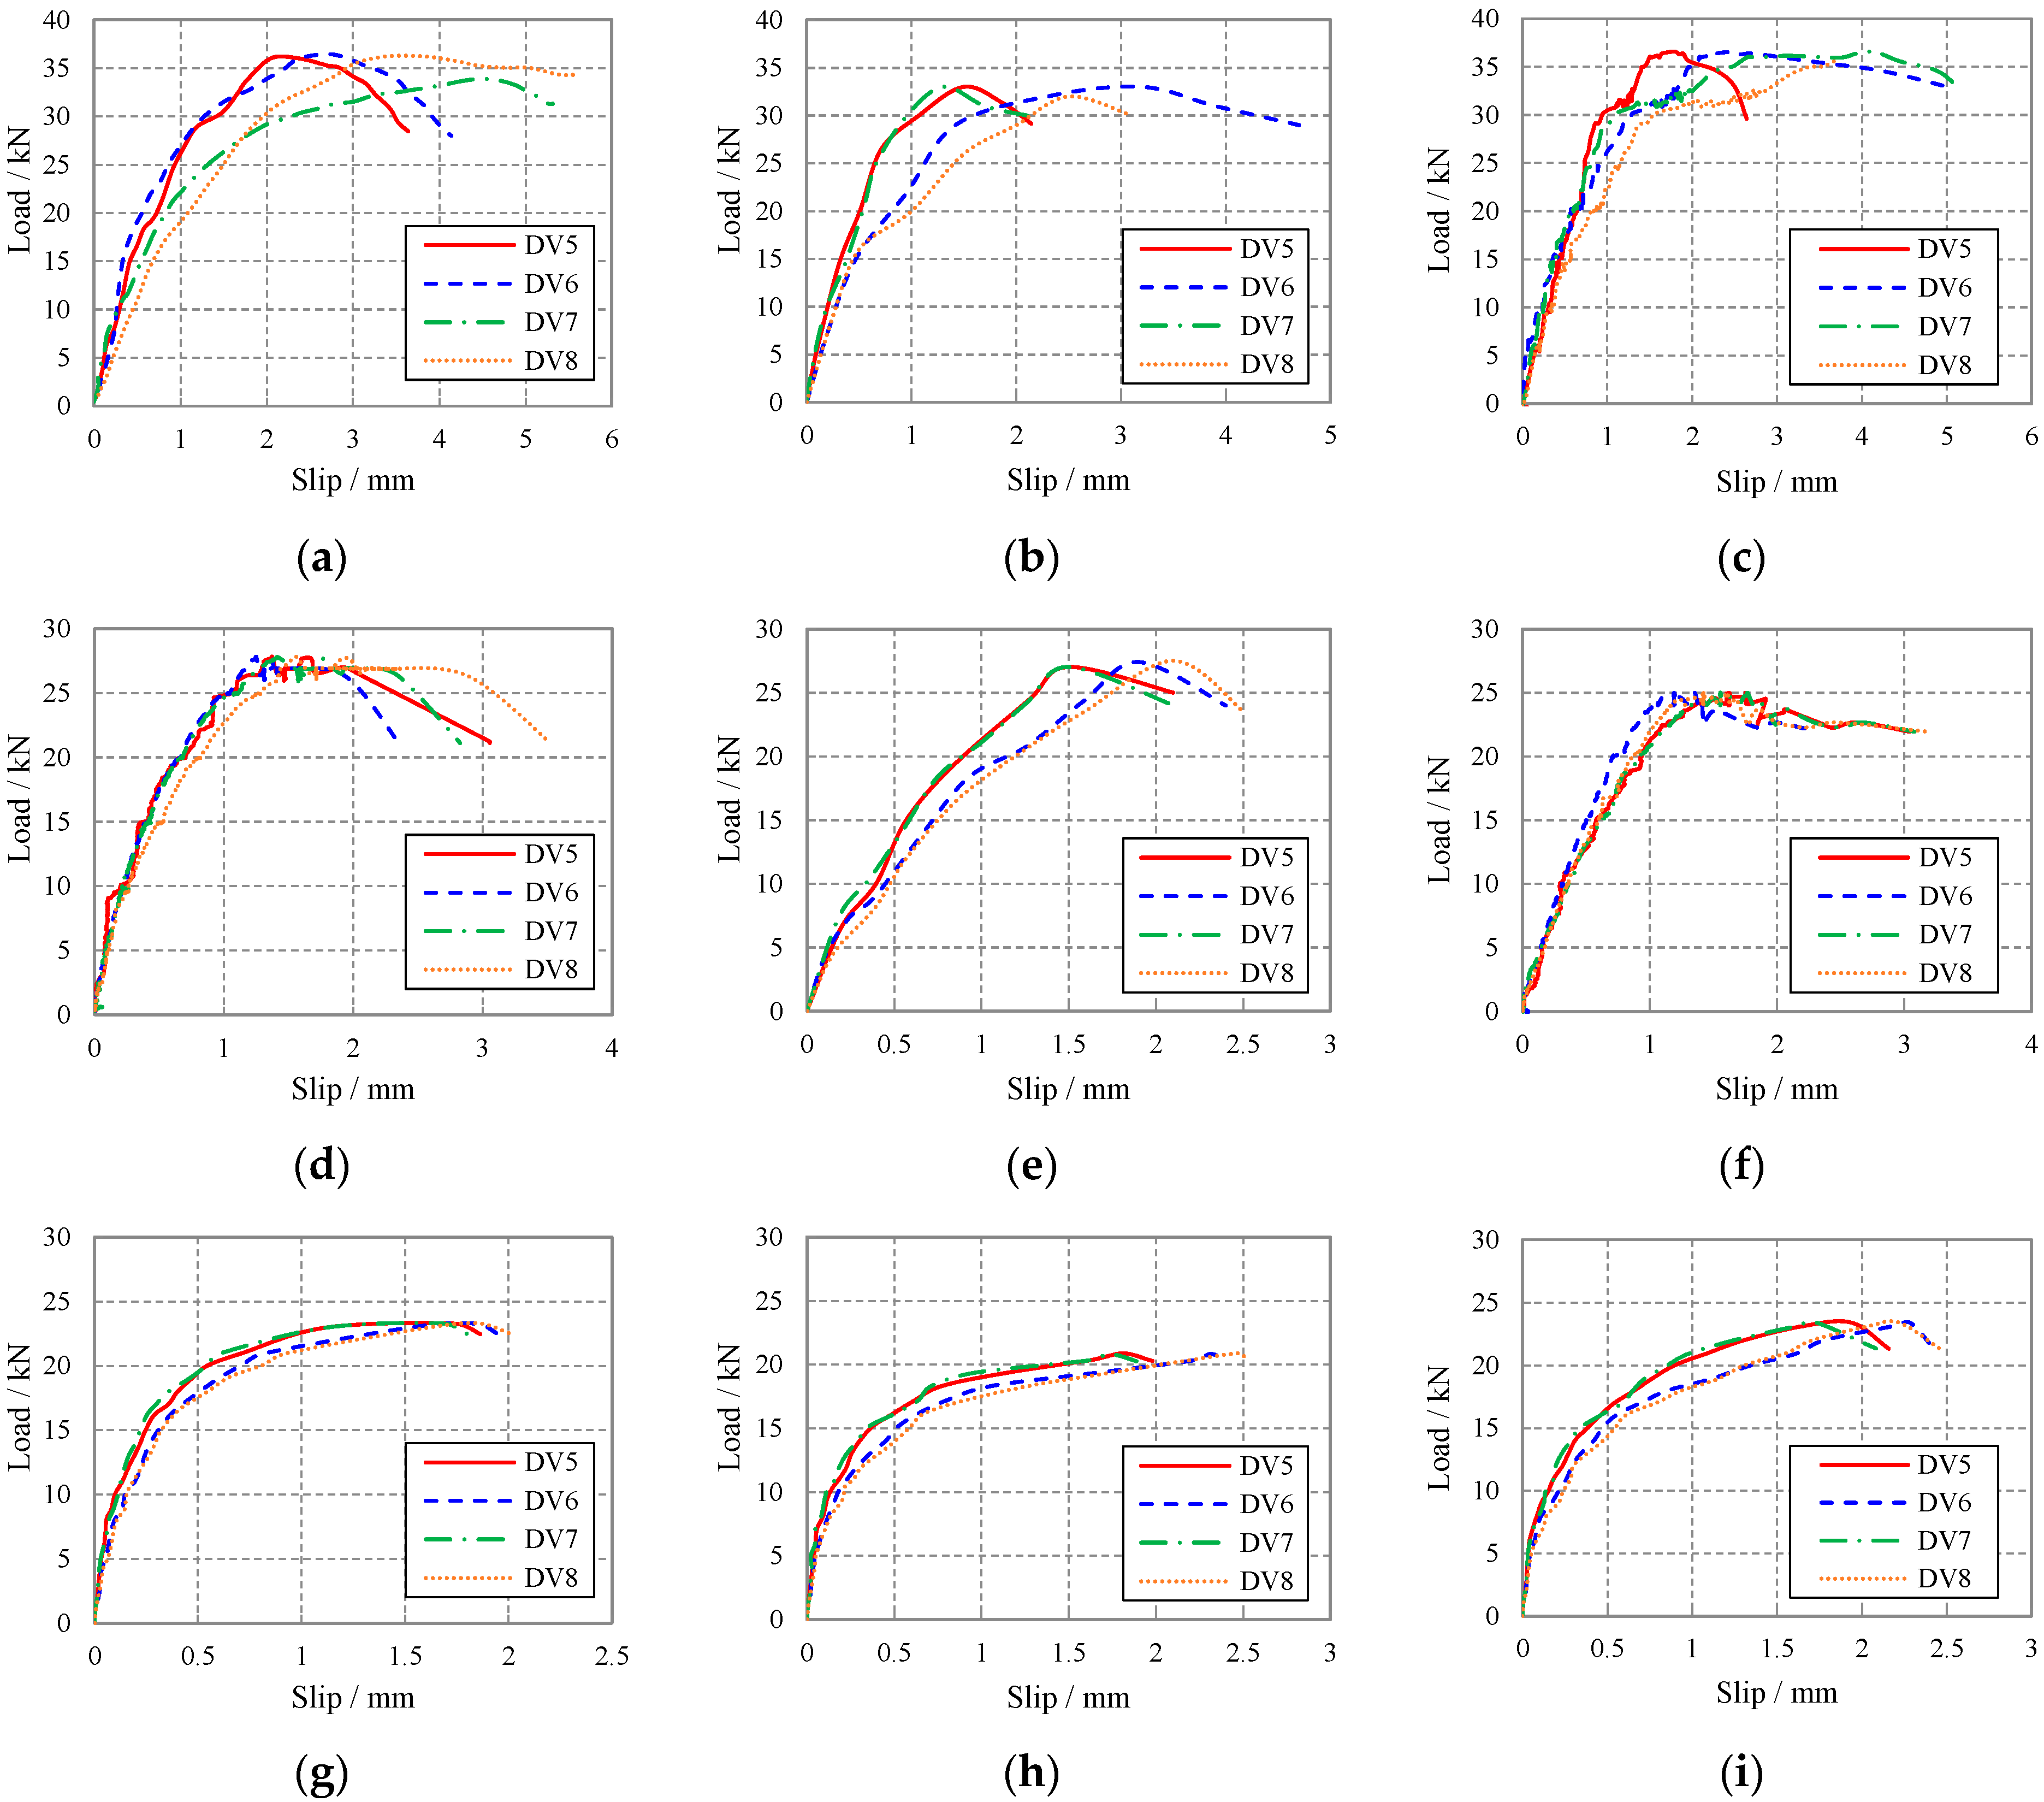
Push-out test results, in the form of load–slip curves (
Figure 8 and
Figure 9), characterize the full-range shear stiffness of the connectors. Specifically,
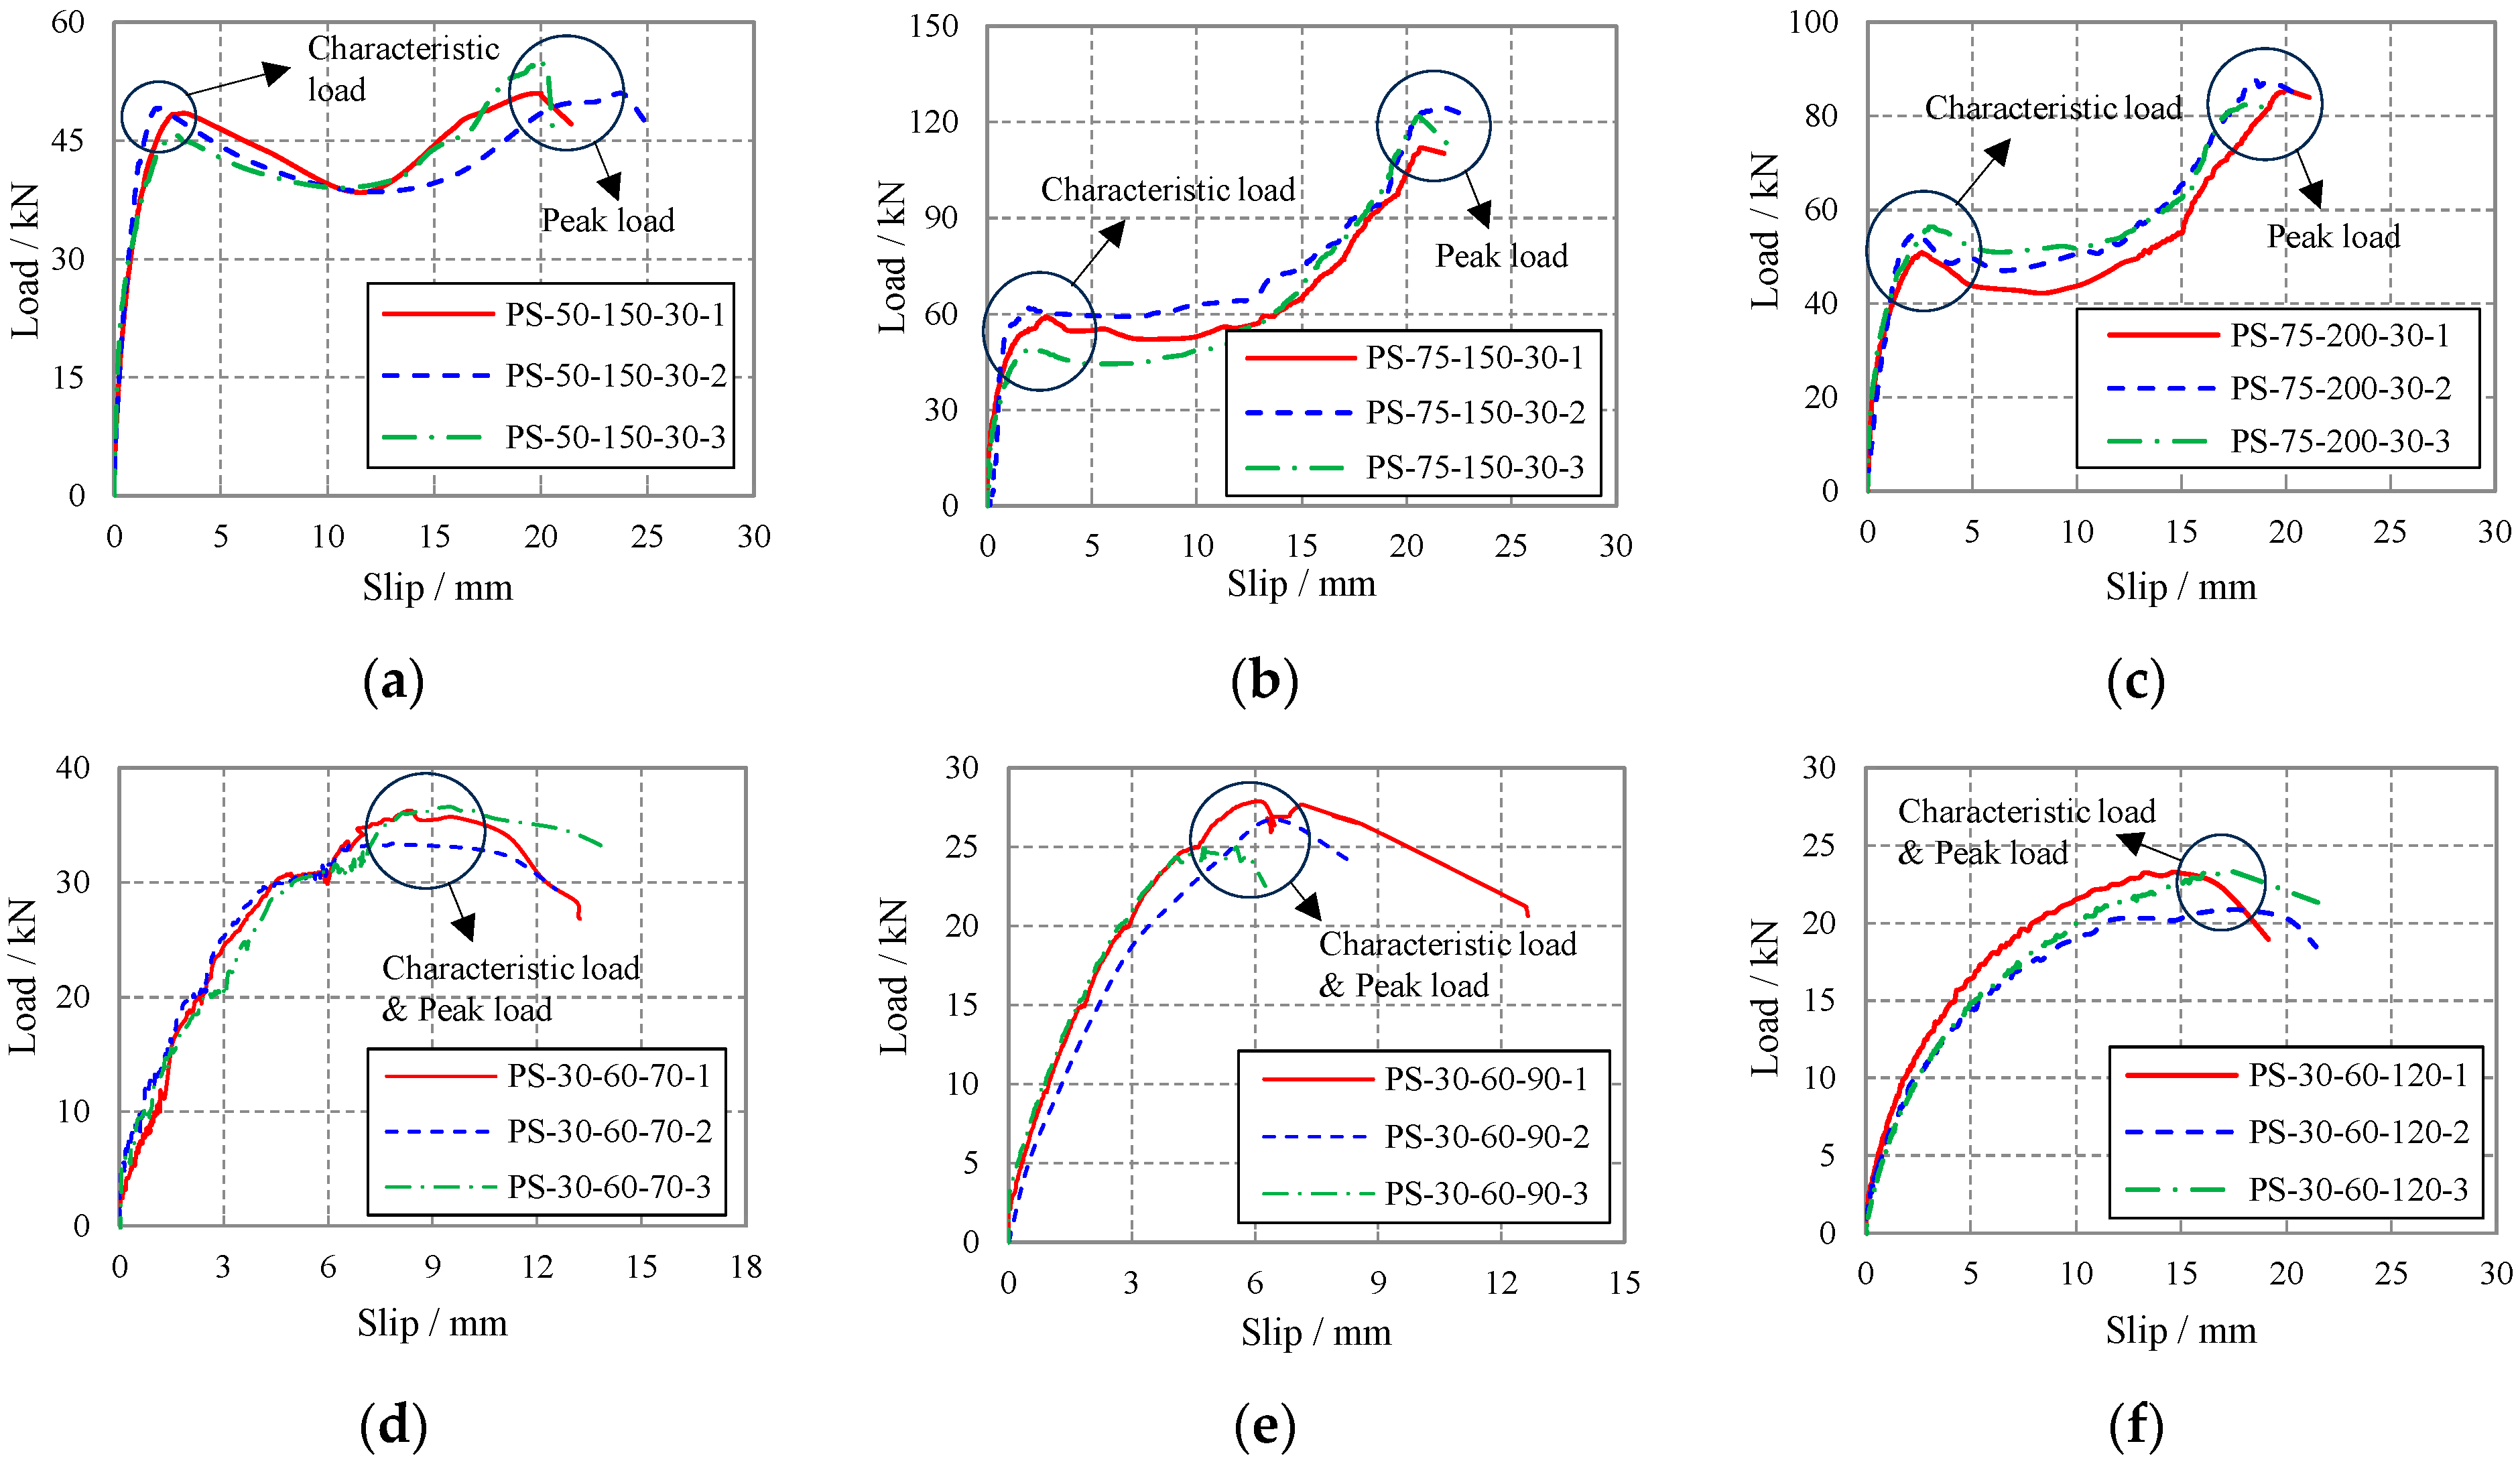
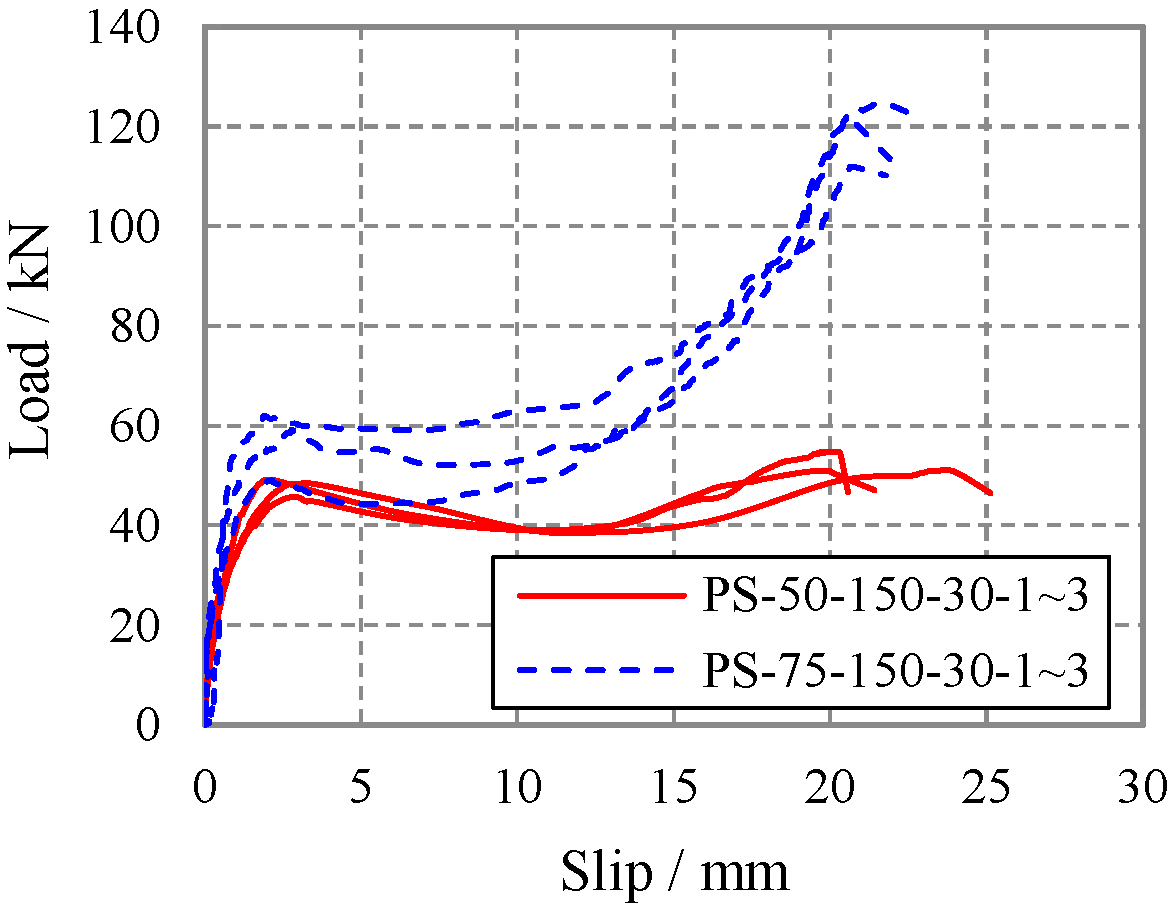
Figure 8 presents the load–slip curves between the concrete wythes, providing an overall assessment of the shear transfer performance of connectors.
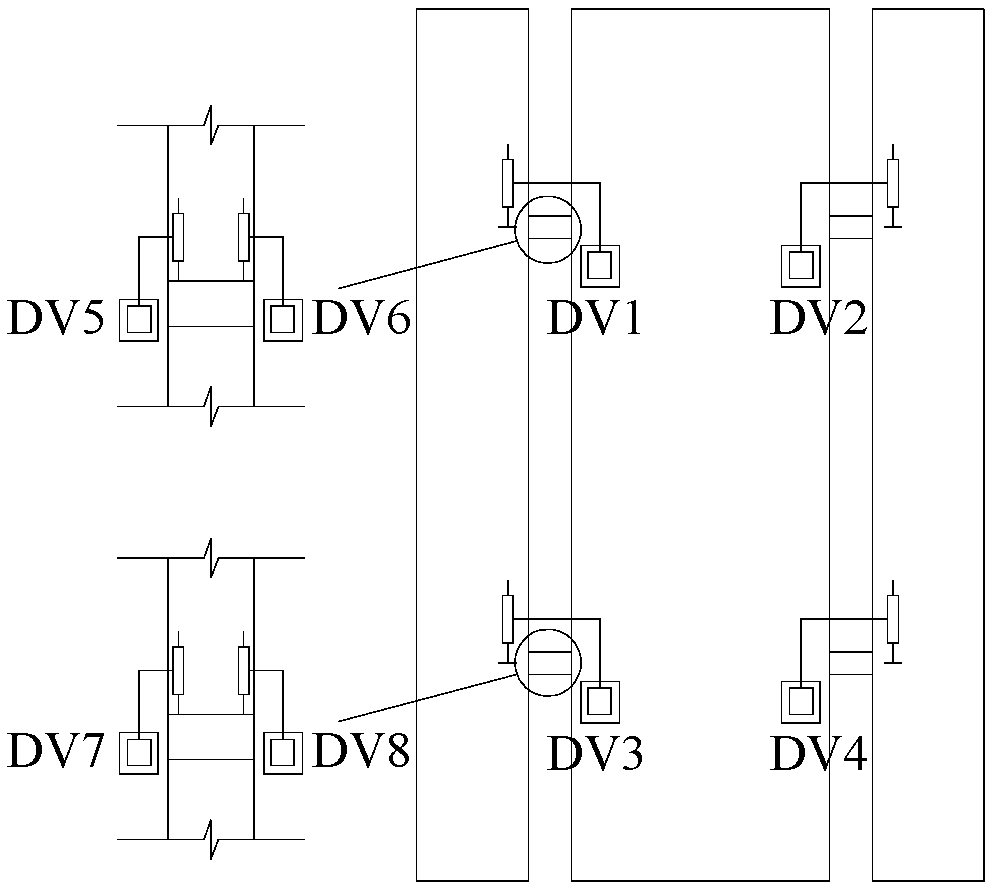
Figure 9, on the other hand, shows the load–slip curves at the connector anchored ends, illustrating the anchorage behavior and interaction between the connectors and the surrounding concrete.
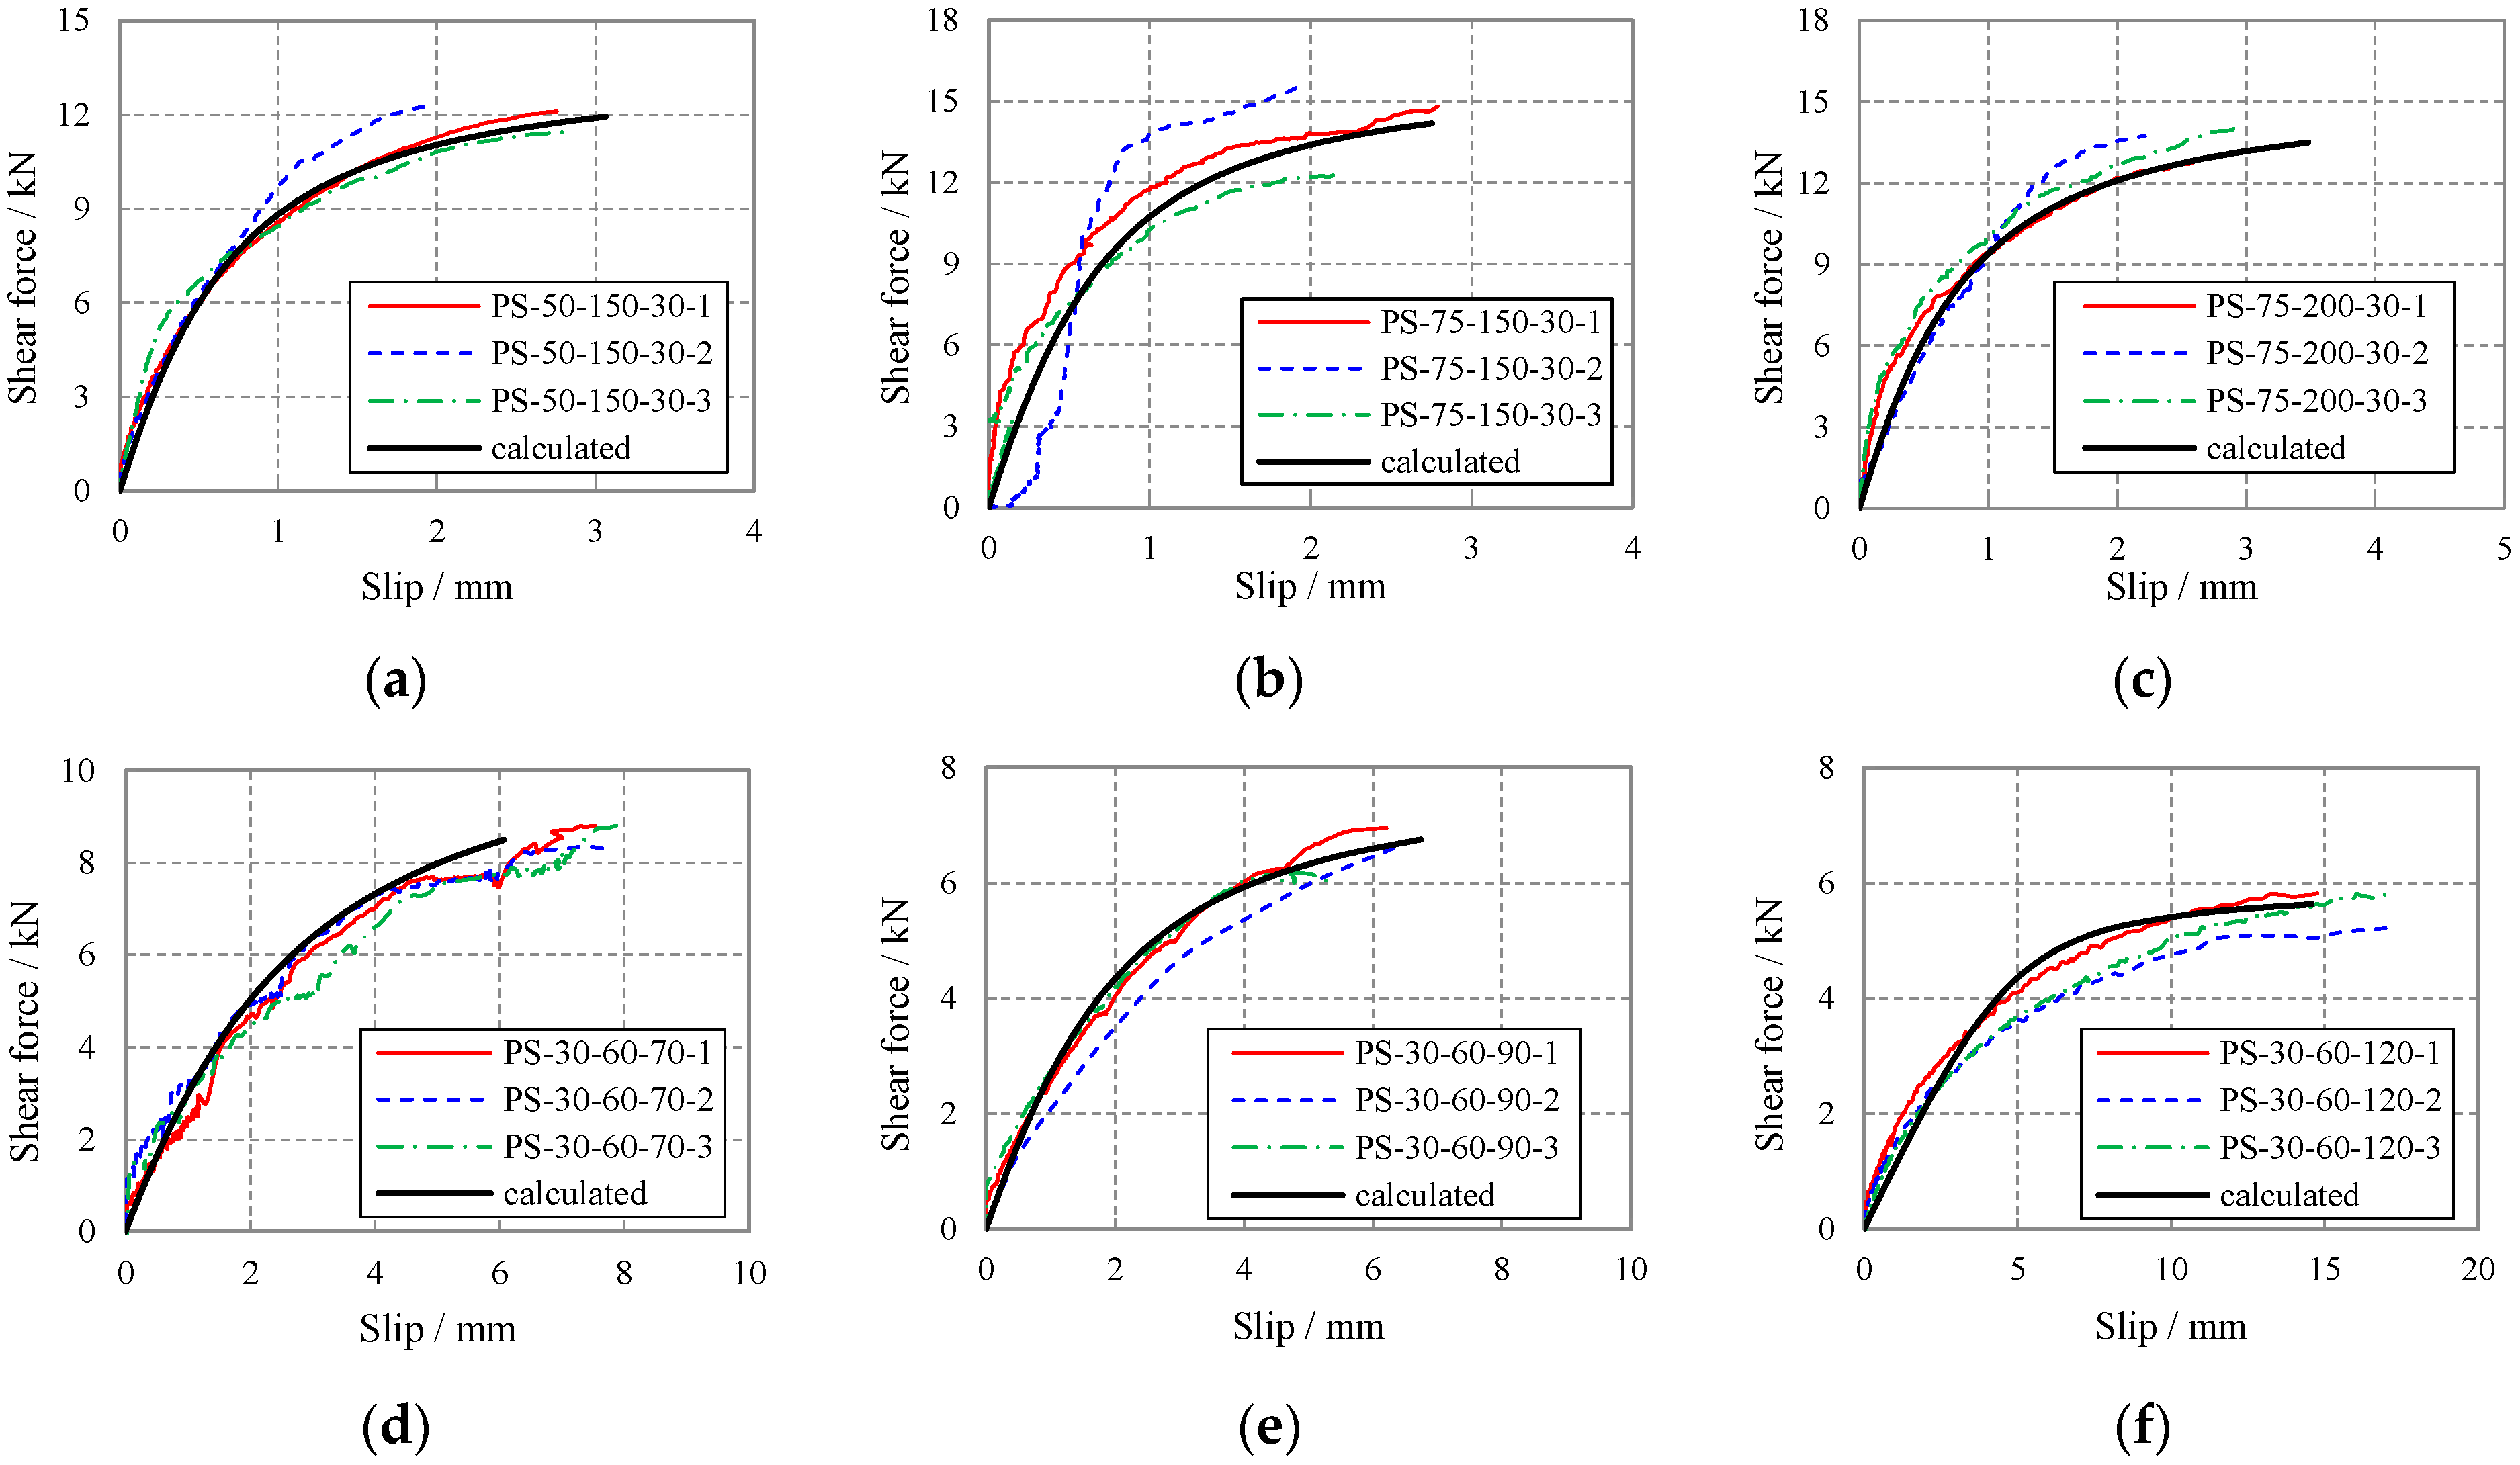
Based on the load–slip curves, the specimens with a 30 mm insulation layer exhibited a sharp reduction in stiffness after reaching a certain load level, followed by an extended plateau region. As slip continued to increase beyond this plateau, the load began to rise again until shear failure of the connectors. Because the shear stiffness within the plateau region is zero or even negative, the maximum load attained prior to entering this stage is defined as the characteristic load, which is subsequently used to determine the shear capacity per connector. The peak load (
Pmax), characteristic load (
Pchar), and the corresponding slip between the wythes for each specimen are summarized in
Table 6, along with the average values for each specimen group.
(1) At the onset of loading, specimens PS-50-150-30-1 to 3 exhibited an approximately linear load–slip response between the wythes, with only minor slip. After the applied load reached approximately two-thirds of Pmax, the stiffness decreased markedly, accompanied by longitudinal splitting cracks (delamination) developing along the connector. Following the appearance of these cracks, the load–slip curve exhibited a descending branch. Subsequently, the loading mechanism of the connector shifted to a combined tension-shear action dominated by tension. When the slip increased to around 15 mm, the load began to rise again until final failure occurred.
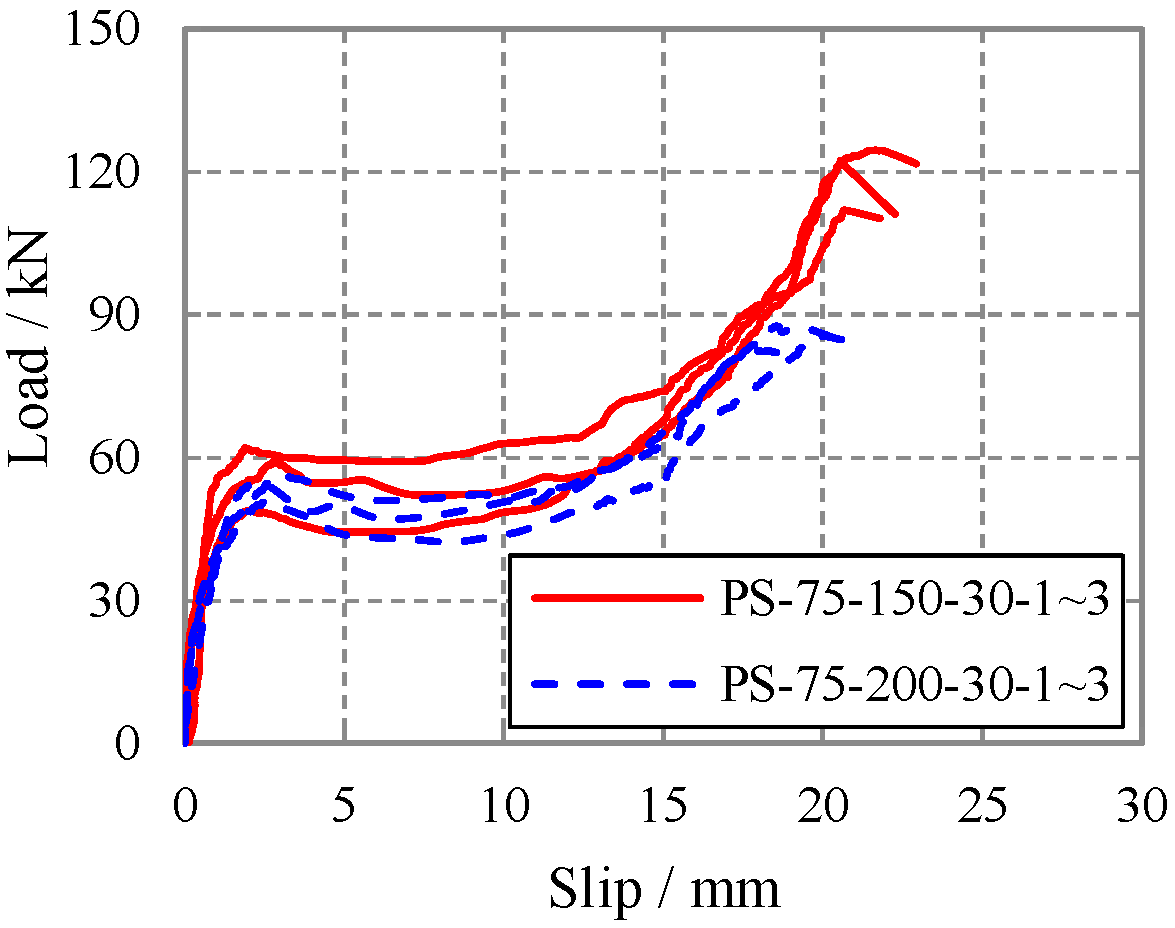
(2) Specimens PS-75-150-30-1 to 3 and PS-75-200-30-1 to 3 showed load-slip curves similar in form to those of PS-50-150-30-1~3. All exhibited relatively high initial stiffness, followed by a pronounced reduction in stiffness after the load reached approximately 0.5–0.9 Pmax, during which noticeable shear deformation of the connectors was observed. With further slip, the load increased again until failure.
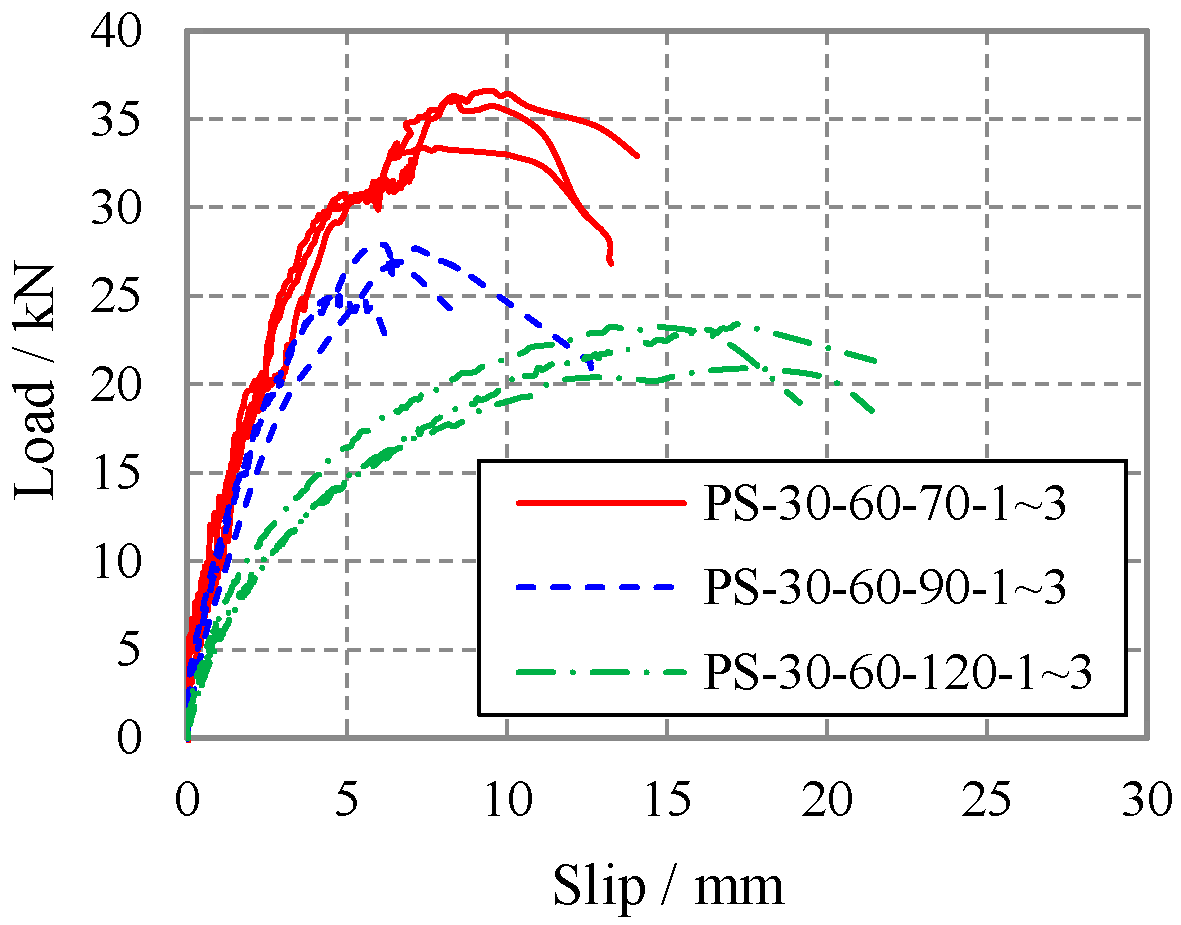
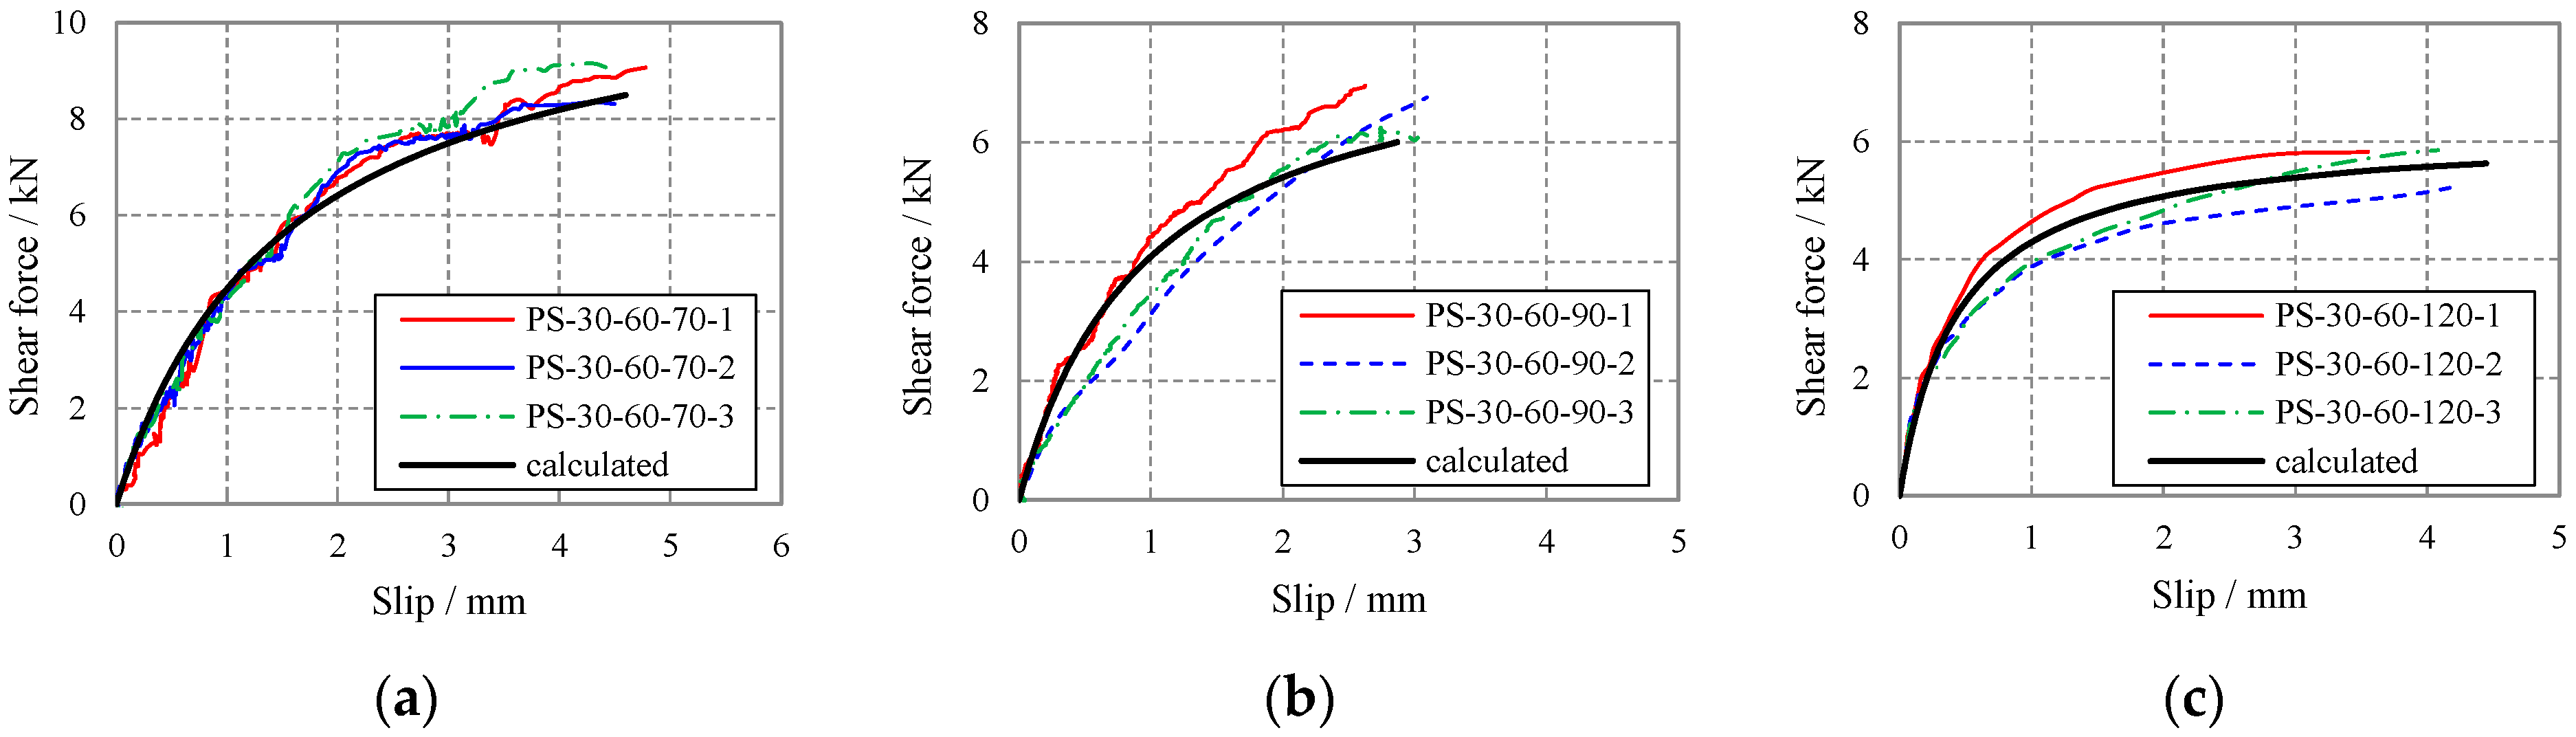
(3) Specimens PS-30-60-70-1 to 3, PS-30-60-90-1 to 3, and PS-30-60-120-1 to 3 displayed parabolic load–slip curves between the wythes. For Specimens PS-30-60-70-1 to 3, and PS-30-60-90-1 to 3, a splitting crack appeared at the intersections of the cruciform ribs. The crack width then increased rapidly, leading to a loss of load-bearing capacity in the connector. For Specimens PS-30-60-120-1 to 3, concrete spalling occurred around the anchorage zone of the connector when the peak load was attained. Subsequently, the shear force-slip curve began its descending branch.
(4) For Specimens PS-30-60-70-1 to 3, PS-30-60-90-1 to 3, and PS-30-60-120-1 to 3, the slip curves measured at the anchored ends of the two connectors on the same wythe were nearly identical. The slip difference between the two ends of the same connector did not exceed 0.5 mm.
4.3. Influence Law
This section analyzes the influence of connector embedment depth, outer wythe thickness, and insulation layer thickness on the shear capacity and shear–slip behavior, with the following results.
4.3.1. Effect of Connector Embedment Depth
Figure 10 illustrates the effect of connector embedment depth on the shear–slip behavior. The two specimen groups had embedment depths of 50 mm and 75 mm, respectively, while all other parameters were identical. The comparison reveals that their load–slip curves nearly coincided initially. However, the characteristic load of the specimens with a 50 mm embedment depth was approximately 15.9% lower than that for those with a 75 mm embedment depth. Beyond the characteristic load, the curves diverged significantly. The specimens with a 75 mm embedment depth exhibited a continued increase in load-bearing capacity, whereas those with a 50 mm embedment depth showed minimal additional load resistance, resulting in a final peak load roughly half that of the former group.
4.3.2. Effect of Outer Wythe Thickness
A comparison of load–slip behavior of specimens with different outer wythe thicknesses is presented in
Figure 11. The two groups featured 150 mm thick and 200 mm thick outer wythes, respectively, while all other parameters remained identical. The results show that the load–slip curves for the two groups nearly overlapped. The peak load of the specimens with a 200 mm thick outer wythe was 5.0% higher than that of the specimens with a 150 mm thick outer wythe. After accounting for the influence of the self-weight of the wythe, it is evident that the outer wythe thickness had no significant effect on the shear strength or stiffness of the connectors.
4.3.3. Effect of Insulation Layer Thickness
Figure 12 contrasts the load–slip curves obtained from specimens with varying insulation thicknesses. The three specimen groups had insulation thicknesses of 70 mm, 90 mm, and 120 mm, respectively, while all other parameters were kept constant. The results indicates that both the shear stiffness and shear capacity of the connectors decreased with increasing insulation thickness. Specifically, the peak loads for the specimens with 90 mm and 120 mm thick insulation were 26.2% and 36.2% lower, respectively, than that of the specimen with a 70 mm thick insulation layer.
7. Discussion
This paper proposes a novel FRP rod connector with a cruciform cross-section, which offers advantages including superior thermal efficiency, excellent mechanical performance, high durability and easy installation, showing promising application prospects in PCSPs. Push-out tests were conducted to investigate the influence of connector embedment depth, outer wythe thickness, and insulation layer thickness on the shear performance of the connectors. Both failure modes, including connector fracture and concrete anchorage failure, were observed. Based on the analysis of how various test parameters affect shear capacity, the following embedment depths are recommended: 75 mm for an outer wythe thickness of 200 mm, 50 mm for 150 mm, and 30 mm for 60 mm. When the insulation layer thickness exceeds 120 mm, concrete anchorage failure occurs, indicating that the FRP material is not fully utilized. For such cases, it is advisable to consider adding anchorage reinforcement or adopting other enhanced anchorage measures.
Based on the Hashin failure criterion, a calculation model for the shear capacity at connector fracture was proposed. Based on the Concrete Capacity Design (CCD) method, the angle of the concrete failure cone was revised in conjunction with experimental results, and a calculation model for the shear capacity at concrete anchorage failure was proposed. The average ratio of the calculated values from the aforementioned models to the experimental values is 0.97, with a standard deviation of 0.06, indicating good agreement. Furthermore, this study decomposes the slip between the inner and outer concrete wythes into two components: slip at the anchored end of the connector and slip due to connector deformation. A predictive model for the shear force-slip curve was subsequently proposed. The correlation coefficients between the predicted and measured load–slip curves for all specimens are greater than 0.98. It should be noted that the aforementioned models were developed for specimens with insulation layer thicknesses ranging from 30 to 120 mm. When the insulation layer thickness exceeds 120 mm, the configuration of the concrete failure cone may change. Consequently, the applicability of these models requires further verification.
8. Conclusions
This study developed a novel cross-shaped FRP rod connector for PCSPs and conducted both experimental and theoretical investigations on its shear performance. Through shear tests on 18 connectors, the failure modes, shear–slip behavior, and shear capacity of the connectors were examined, leading to the following conclusions:
(1) Two primary failure modes were observed: fracture of the connector and concrete anchorage failure. Specimens with insulation layer thicknesses ranging from 30 mm to 90 mm exhibited connector fracture, while those with a 120 mm thick insulation layer experienced concrete anchorage failure.
(2) For 30 mm thick insulation specimens, the stiffness dropped sharply after reaching a certain load, and the load–slip curve entered a plateau stage. As slip increased further, the load began to rise again until the connector failed in shear. For specimens with insulation thicknesses of 70 mm, 90 mm, and 120 mm, the load–slip curves all exhibited a parabolic shape, with failure occurring shortly after the peak load.
(3) For an insulation thickness of 30 mm, the load–slip curves of specimens with 50 mm and 75 mm embedment depths were nearly identical initially. However, beyond the characteristic load, the curves diverged significantly. Specimens with a 75 mm embedment depth showed a continued increase in load-bearing capacity, whereas specimens with a 50 mm embedment depth exhibited minimal additional load, resulting in a final peak load approximately half that of the former group.
(4) Both the shear stiffness and shear resistance of the connectors decreased with increasing insulation layer thickness. Specifically, the peak loads of specimens with 90 mm and 120 mm insulation were 26.2% and 36.2% lower, respectively, than that of the specimen with a 70 mm insulation layer.
Based on these findings, the underlying mechanisms for the observed failure modes were analyzed. A calculation model for the shear capacity corresponding to connector fracture was proposed based on the Hashin criterion for composite materials. Additionally, a formula for the shear capacity associated with concrete anchorage failure was derived using a cone pull-out model. The calculated results show good agreement with the experimental data. Furthermore, a theoretical load–slip model for the cross-shaped FRP rod connector was established.
The findings of this paper could provide support for the design and application of the cross-shaped FRP rod connectors in PCSPs. Future studies would focus more on the shear performance and detailing optimization of this connector when applied to PCSPs with thicker insulation layers, aiming to facilitate its application in ultra-low energy consumption buildings.