1. Introduction
Multi-floor buildings face increasing complexity due to height, loading patterns, and optimization constraints. Engineers require solutions that meet performance criteria and enhance design efficiency. While finite element software like ETABS offers precise modeling, it remains time-intensive for early-phase iterative design. This gap highlights the need for fast, integrated, and parametric tools that blend structural theory with intelligent automation.
Although many researchers have applied optimization algorithms—such as Particle Swarm Optimization (PSO) and genetic algorithms (GAs)—to structural design problems [
1,
2], these techniques are often isolated from physical validation and are computationally intensive. Moreover, most studies focus on single-objective tasks or general performance trends. For example, PSO has been used to minimize material use but without integration into multi-objective frameworks or verified theoretical models [
3].
To address the architectural design challenges in early phases, genetic algorithms have also been adopted to support spatial planning. For instance, a multi-objective GA framework was proposed to enhance conceptual decision-making by integrating layout logic and spatial performance criteria [
4]. Similarly, another study developed a GA-based interior design model aimed at reducing post-disaster risks in residential planning by balancing safety and comfort constraints [
5]. In parallel, several works have demonstrated the utility of metaheuristic optimization and fuzzy logic systems in structural and architectural contexts. One study explored metaheuristic algorithms for optimizing prefabricated wall–floor systems, improving modular construction efficiency [
6]. Another proposed a parametric framework combining finite element analysis with fuzzy logic for the design of in-plane concrete dry joints, supporting additive manufacturing applications [
7]. A further contribution introduced an ANFIS-based standard for evaluating precast concrete connections with steel tube elements, validated through experimental studies [
8]. Collectively, these studies emphasize the broader relevance of hybrid and machine-learning-driven methods across both the architectural and structural domains, reinforcing the conceptual foundation and application potential of the PARS-Solution framework.
Structural optimization enhances design efficiency, safety, and sustainability by determining optimal configurations and material distributions within specified constraints. A comprehensive review critically assesses the current achievements and limitations in structural optimization, providing guidelines for future research [
9]. The study emphasizes the importance of multi-objective optimization approaches that balance various performance criteria, such as cost, structural integrity, and environmental impact.
This study builds upon those efforts by coupling PSO with Adaptive Neuro-Fuzzy Inference Systems (ANFISs) and validating the results against classical methods and ETABS. The novelty lies in integrating physics-informed parameters, structural analysis equations, and real-world performance targets.
Optimization frameworks like PSO and GAs have been widely employed to optimize high-rise structures [
1,
10]. These techniques enable the efficient exploration of design spaces to minimize material usage and deformation while meeting performance objectives. Inspired by the collective behavior of birds and fish, PSO excels at balancing exploration and exploitation, effectively finding global optima for large-scale structural problems. Similarly, GA, which mimics the principles of natural selection through mechanisms like crossover and mutation, is robust in evolving optimal solutions for multi-variable constrained design problems.
Machine learning (ML), particularly ANFISs and neural networks, has shown potential in structural engineering for pattern recognition and prediction [
11,
12]. However, prior studies often rely on empirical datasets or simulation-only input [
13], lacking physical interpretation, dimensional consistency, and integration with mechanics-based rules.
Supervised and unsupervised learning techniques have also been employed to model material behavior, assess structural health, and optimize performance under uncertain loading conditions [
12,
14]. These techniques reduce computational costs while maintaining high accuracy in parametric evaluations. For example, neural networks have been successfully applied to predict post-seismic damage, enabling faster recovery planning and more efficient retrofitting of affected buildings.
This research uniquely trains an ANFIS using outputs generated from verified theoretical formulations, ensuring accuracy, interpretability, and real-world relevance.
Several recent works explore parametric and generative design tools in architecture (e.g., Rhino/Grasshopper) for structural configurations [
15,
16]. While these tools are flexible, they are mostly visual or form-based, with limited incorporation of actual structural behavior (e.g., bending and shear). Some approaches have attempted to connect generative design with performance analysis [
17] but often lack pre-validation steps or integration with analytical expressions. Our work fills this gap by grounding parametric exploration in stiffness, moment of inertia, and load–response relationships.
Generative design employs algorithms to generate numerous design iterations based on predefined constraints. A study integrated generative design with building performance simulations, allowing for improved energy efficiency and reduced carbon footprints [
15]. Modern tools like Rhino/Grasshopper and Autodesk Generative Design are commonly used to automate and refine these processes in high-rise buildings. Similarly, parametric design methods and optimization algorithms facilitate the rapid exploration of optimal layouts by integrating real-time performance feedback, such as wind load resistance and material efficiency [
16].
Furthermore, while hybrid frameworks have been proposed in other disciplines, few studies systematically validate them with both code-based examples and simulation platforms like ETABS. For instance, previous hybrid models have shown accuracy in damage detection or seismic response prediction [
18] but not in multi-floor optimization with full parameter delegation. This study validates its predictions with numerical and graphical comparisons and benchmarks performance across deformation, weight, and force criteria.
In summary, this study introduces several key innovations: (1) the development of a hybrid computational framework (PARS-Solution) that integrates theoretical calculations with MATLAB-based modeling; (2) the delegation of structural analysis to the ANFIS, enabling fast and accurate prediction of structural behavior; and (3) the application of MOPSO for multi-objective optimization of high-rise structures. This combination offers a validated, interpretable, and parametric toolset for early-stage structural design, with direct comparisons to ETABS confirming its practical applicability. These contributions fill the gap in the current literature for fast, validated, and machine-learning-assisted design frameworks.
2. Materials and Methods
This section has been added to clarify the materials, programming environments, and computational procedures used in the study before presenting the detailed application.
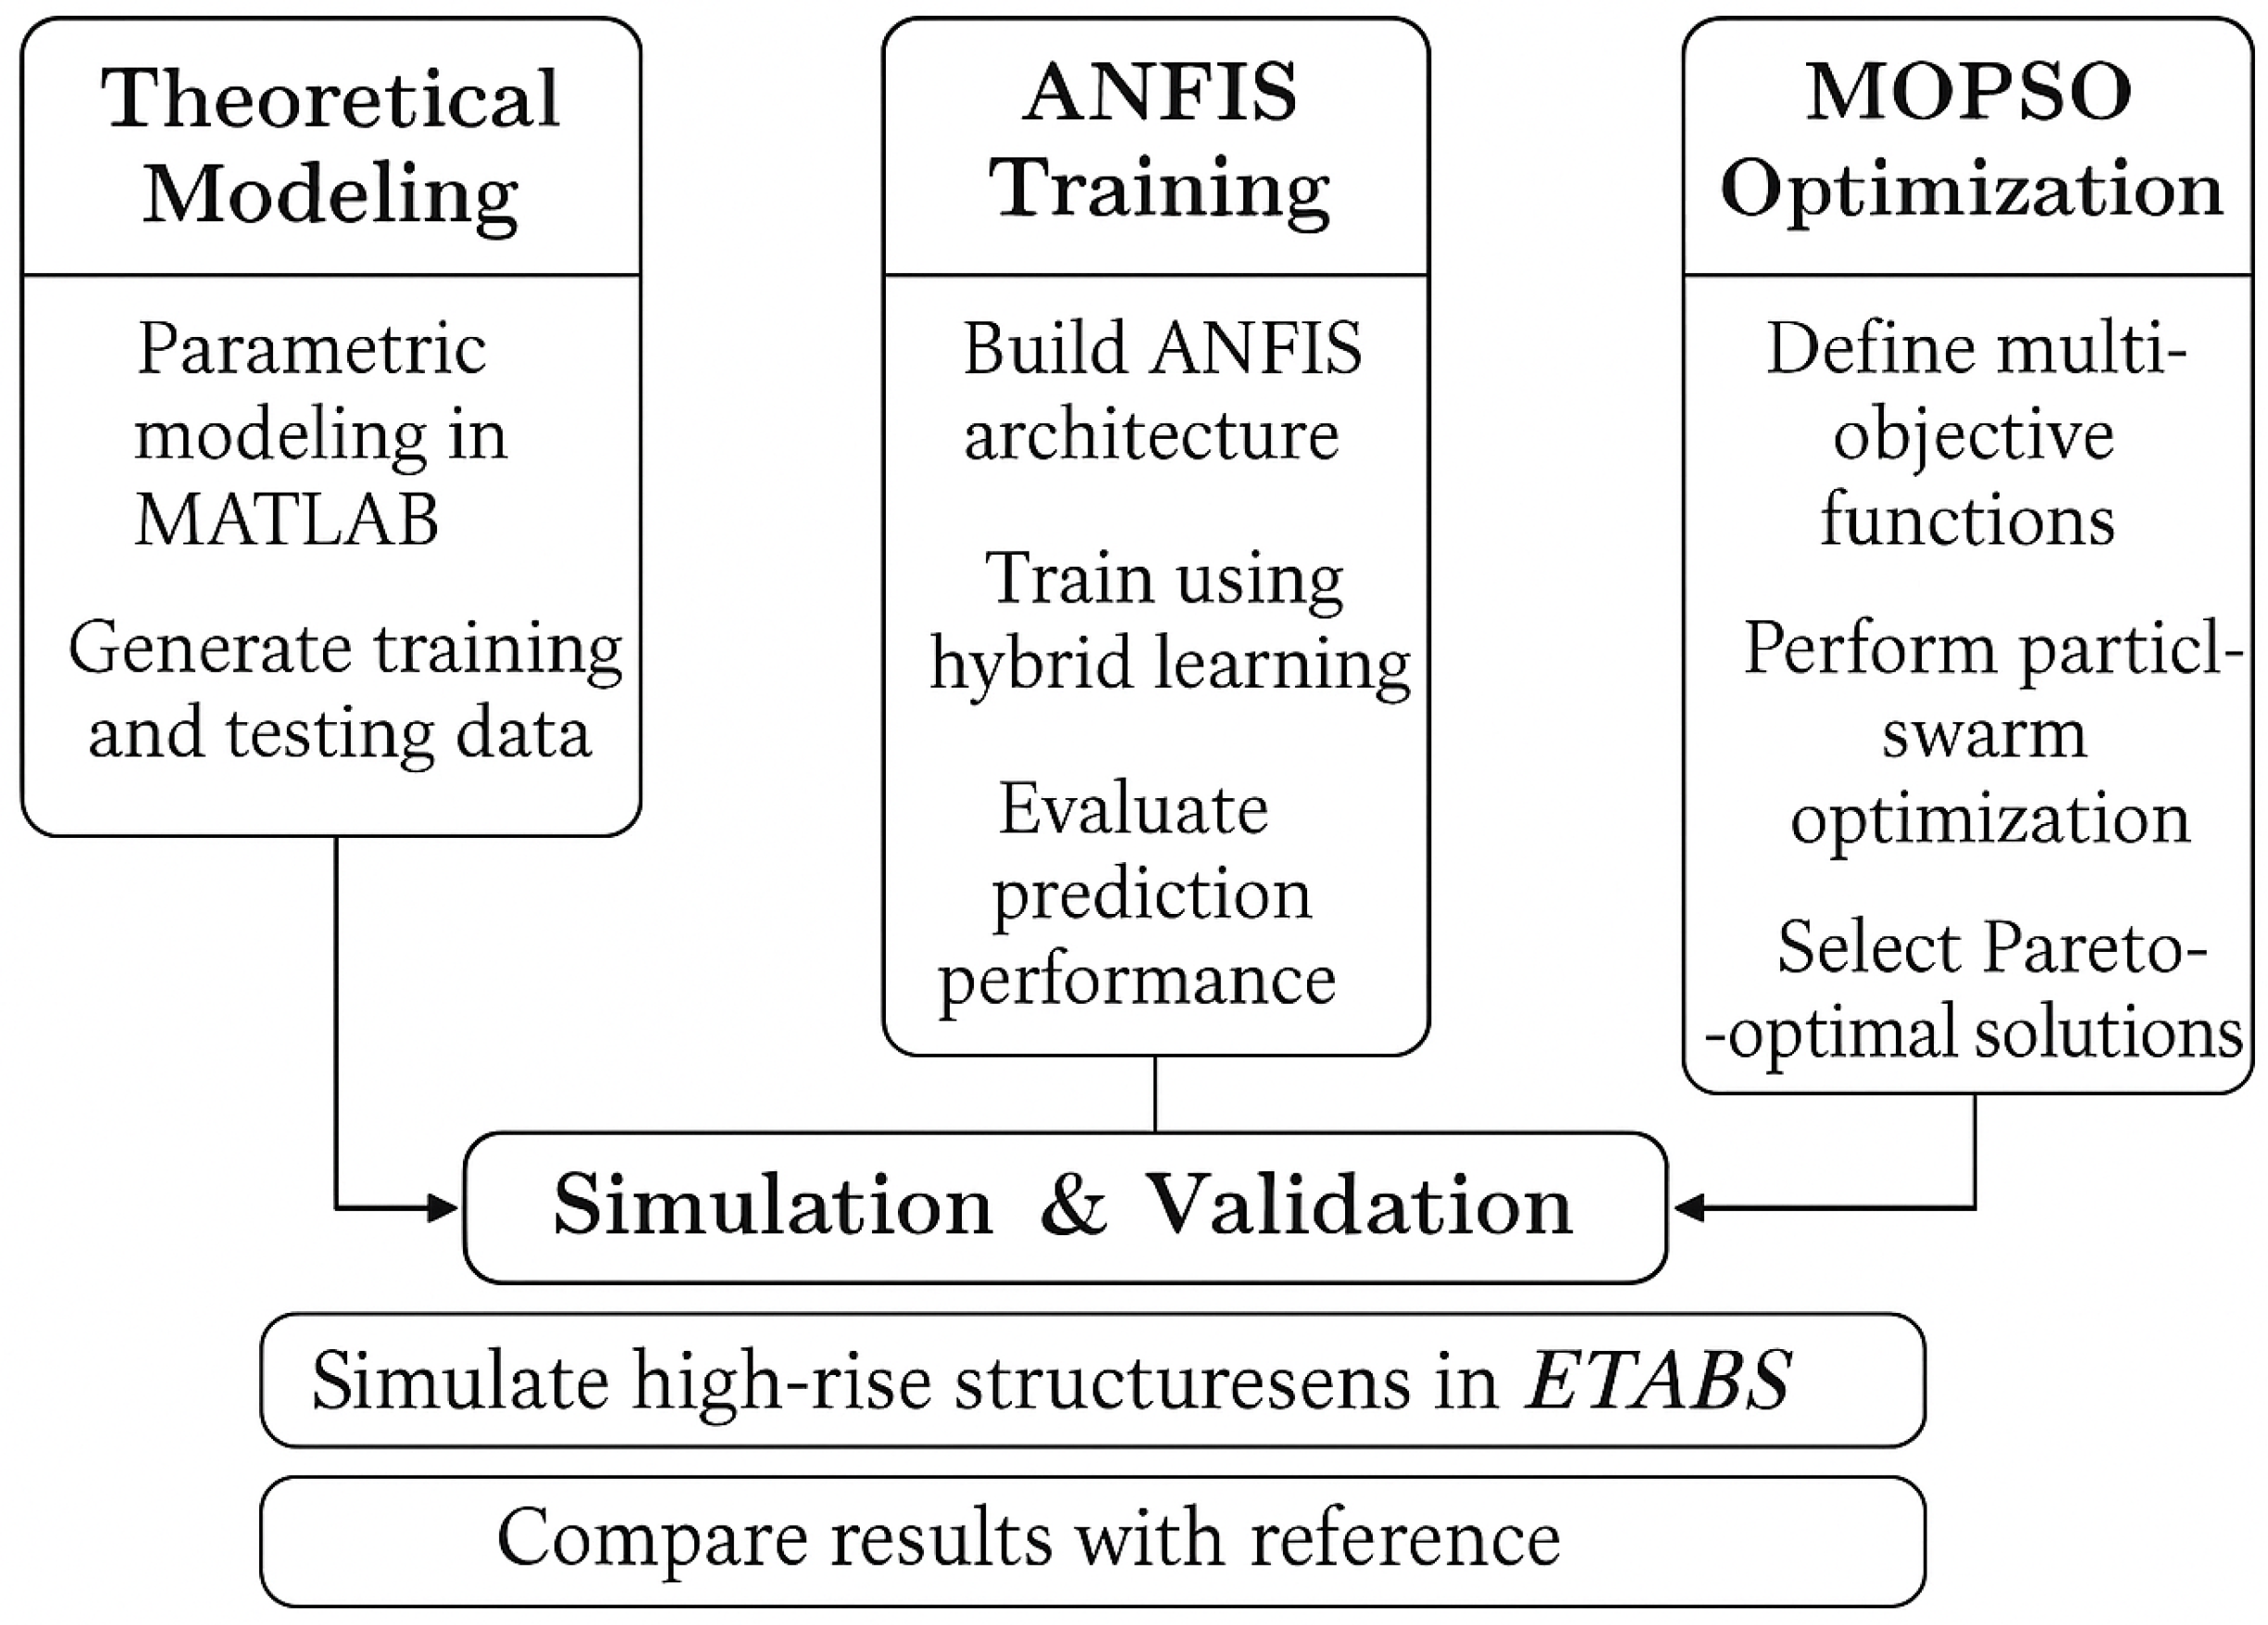
This research integrates theoretical formulations with computational simulations and machine learning techniques for structural optimization. The methodology is divided into the following key phases:
2.1. Theoretical Framework and Structural Modeling (PARS-Solution)
The Process–Action–Response System (PARS-Solution) was implemented in MATLAB (R2019 b) to simulate the behavior of a multi-floor structural frame. The structural model consists of core walls and frames subjected to lateral wind loads. The calculations include deflection profiles, internal forces (shear and bending), and stiffness adjustments using engineering equations and interpolation of coefficients from structural diagrams (). These calculations are performed iteratively across all floors, and the results serve as a foundation for machine learning and optimization.
2.2. Simulation Environment
All simulations and analyses were carried out using MATLAB R2022a due to its flexibility in matrix operations, interpolation functions, and support for fuzzy systems. The code was structured into modular functions to allow parameter variation across multiple runs. The verification was conducted by comparing outputs with reference hand calculations and simulations in ETABS software (Ultimate 21.2.0).
2.3. Machine Learning: Adaptive Neuro-Fuzzy Inference System (ANFIS)
ANFIS models were developed and trained in MATLAB using the genfis3 function with Fuzzy C-Means clustering. The training and testing datasets were extracted from the outputs of the PARS-Solution framework, forming look-up tables based on varying input parameters. The performance of ANFIS was evaluated across single-variable, multi-variable, and randomized input cases.
2.4. Optimization Algorithm: Multi-Objective Particle Swarm Optimization (MOPSO)
MOPSO was implemented in MATLAB to identify optimal parameter configurations that minimize deformation while reducing material usage. The algorithm maintained a Pareto front of non-dominated solutions using grid-based diversity preservation. Custom cost functions were used to evaluate structural performance across different scenarios. Optimization parameters were tuned to achieve convergence over 100 iterations with a population size of 50 particles.
2.5. Validation and Comparison
To validate the results, simulations from the PARS-Solution were compared to a detailed ETABS model under the same loading and geometric conditions. Deviations in deformation and force outputs were recorded to ensure the consistency and reliability of the proposed pipeline. Additionally, ANFIS predictions were benchmarked against PARS calculations to measure accuracy under varying input trends and table sizes.
3. Methodology
3.1. Structural Analyses and Coding (PARS-Solution)
This article presents a structured approach to analyzing a building frame with a core system, focusing on rigidity, shear forces, and deflections. The theoretical calculations are interfaced with optimization algorithms, and the accuracy of the codes is demonstrated through an example comparison with reference solutions [
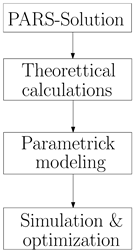
19,
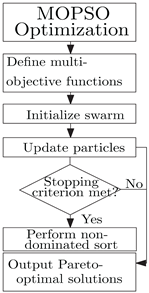
20]. To improve readability and clarify the methodology, this section has been expanded and illustrated with a process flowchart (
Figure 1).
The PARS-Solution framework is designed as a modular pipeline that connects physical theory with data-driven algorithms in structural engineering. It begins with theoretical modeling of core–frame systems using engineering mechanics and sectional properties. The results from this phase—such as deflection profiles, moment distributions, and shear forces—serve as input for parametric simulations in MATLAB. These simulations populate structured datasets, which are then used for training machine learning models (ANFIS) and driving optimization through MOPSO. This clear linkage between theory, simulation, learning, and optimization ensures the reliability, interpretability, and adaptability of the process.
While multi-scale and local–global hybrid methods are effective for pattern extraction in machine learning, they often act as black-boxes and may lack transparency or traceability in engineering contexts. In contrast, the PARS-Solution offers a fully interpretable and tunable framework—where each design parameter’s effect on structural performance can be precisely quantified. This makes the approach ideal not only for high-rise building design but also for comparative analysis, sensitivity studies, and early-stage structural evaluation. The following flowchart summarizes this integrated approach.
The selection of tools in this study—MATLAB-based structural calculations, Adaptive Neuro-Fuzzy Inference Systems (ANFISs), and Multi-Objective Particle Swarm Optimization (MOPSO)—occurred to address three key aspects of modern structural analysis: flexibility in parametric modeling, intelligent response prediction under nonlinear behavior, and efficient exploration of multi-objective design spaces. MATLAB enables precise parametric studies, ANFIS captures complex variable relationships with high interpretability, and MOPSO provides robust performance in optimizing conflicting goals, such as deformation versus material usage. High-rise buildings were chosen as a rigorous case study due to their structural complexity and high sensitivity to lateral loads and stiffness distribution. This sensitivity makes them ideal candidates to evaluate the framework’s effectiveness. Furthermore, successful validation on high-rise structures implies likely applicability and enhanced performance in simpler low- to mid-rise systems, confirming the robustness and scalability of the approach.
3.1.1. Selected Example to Discuss and Verification
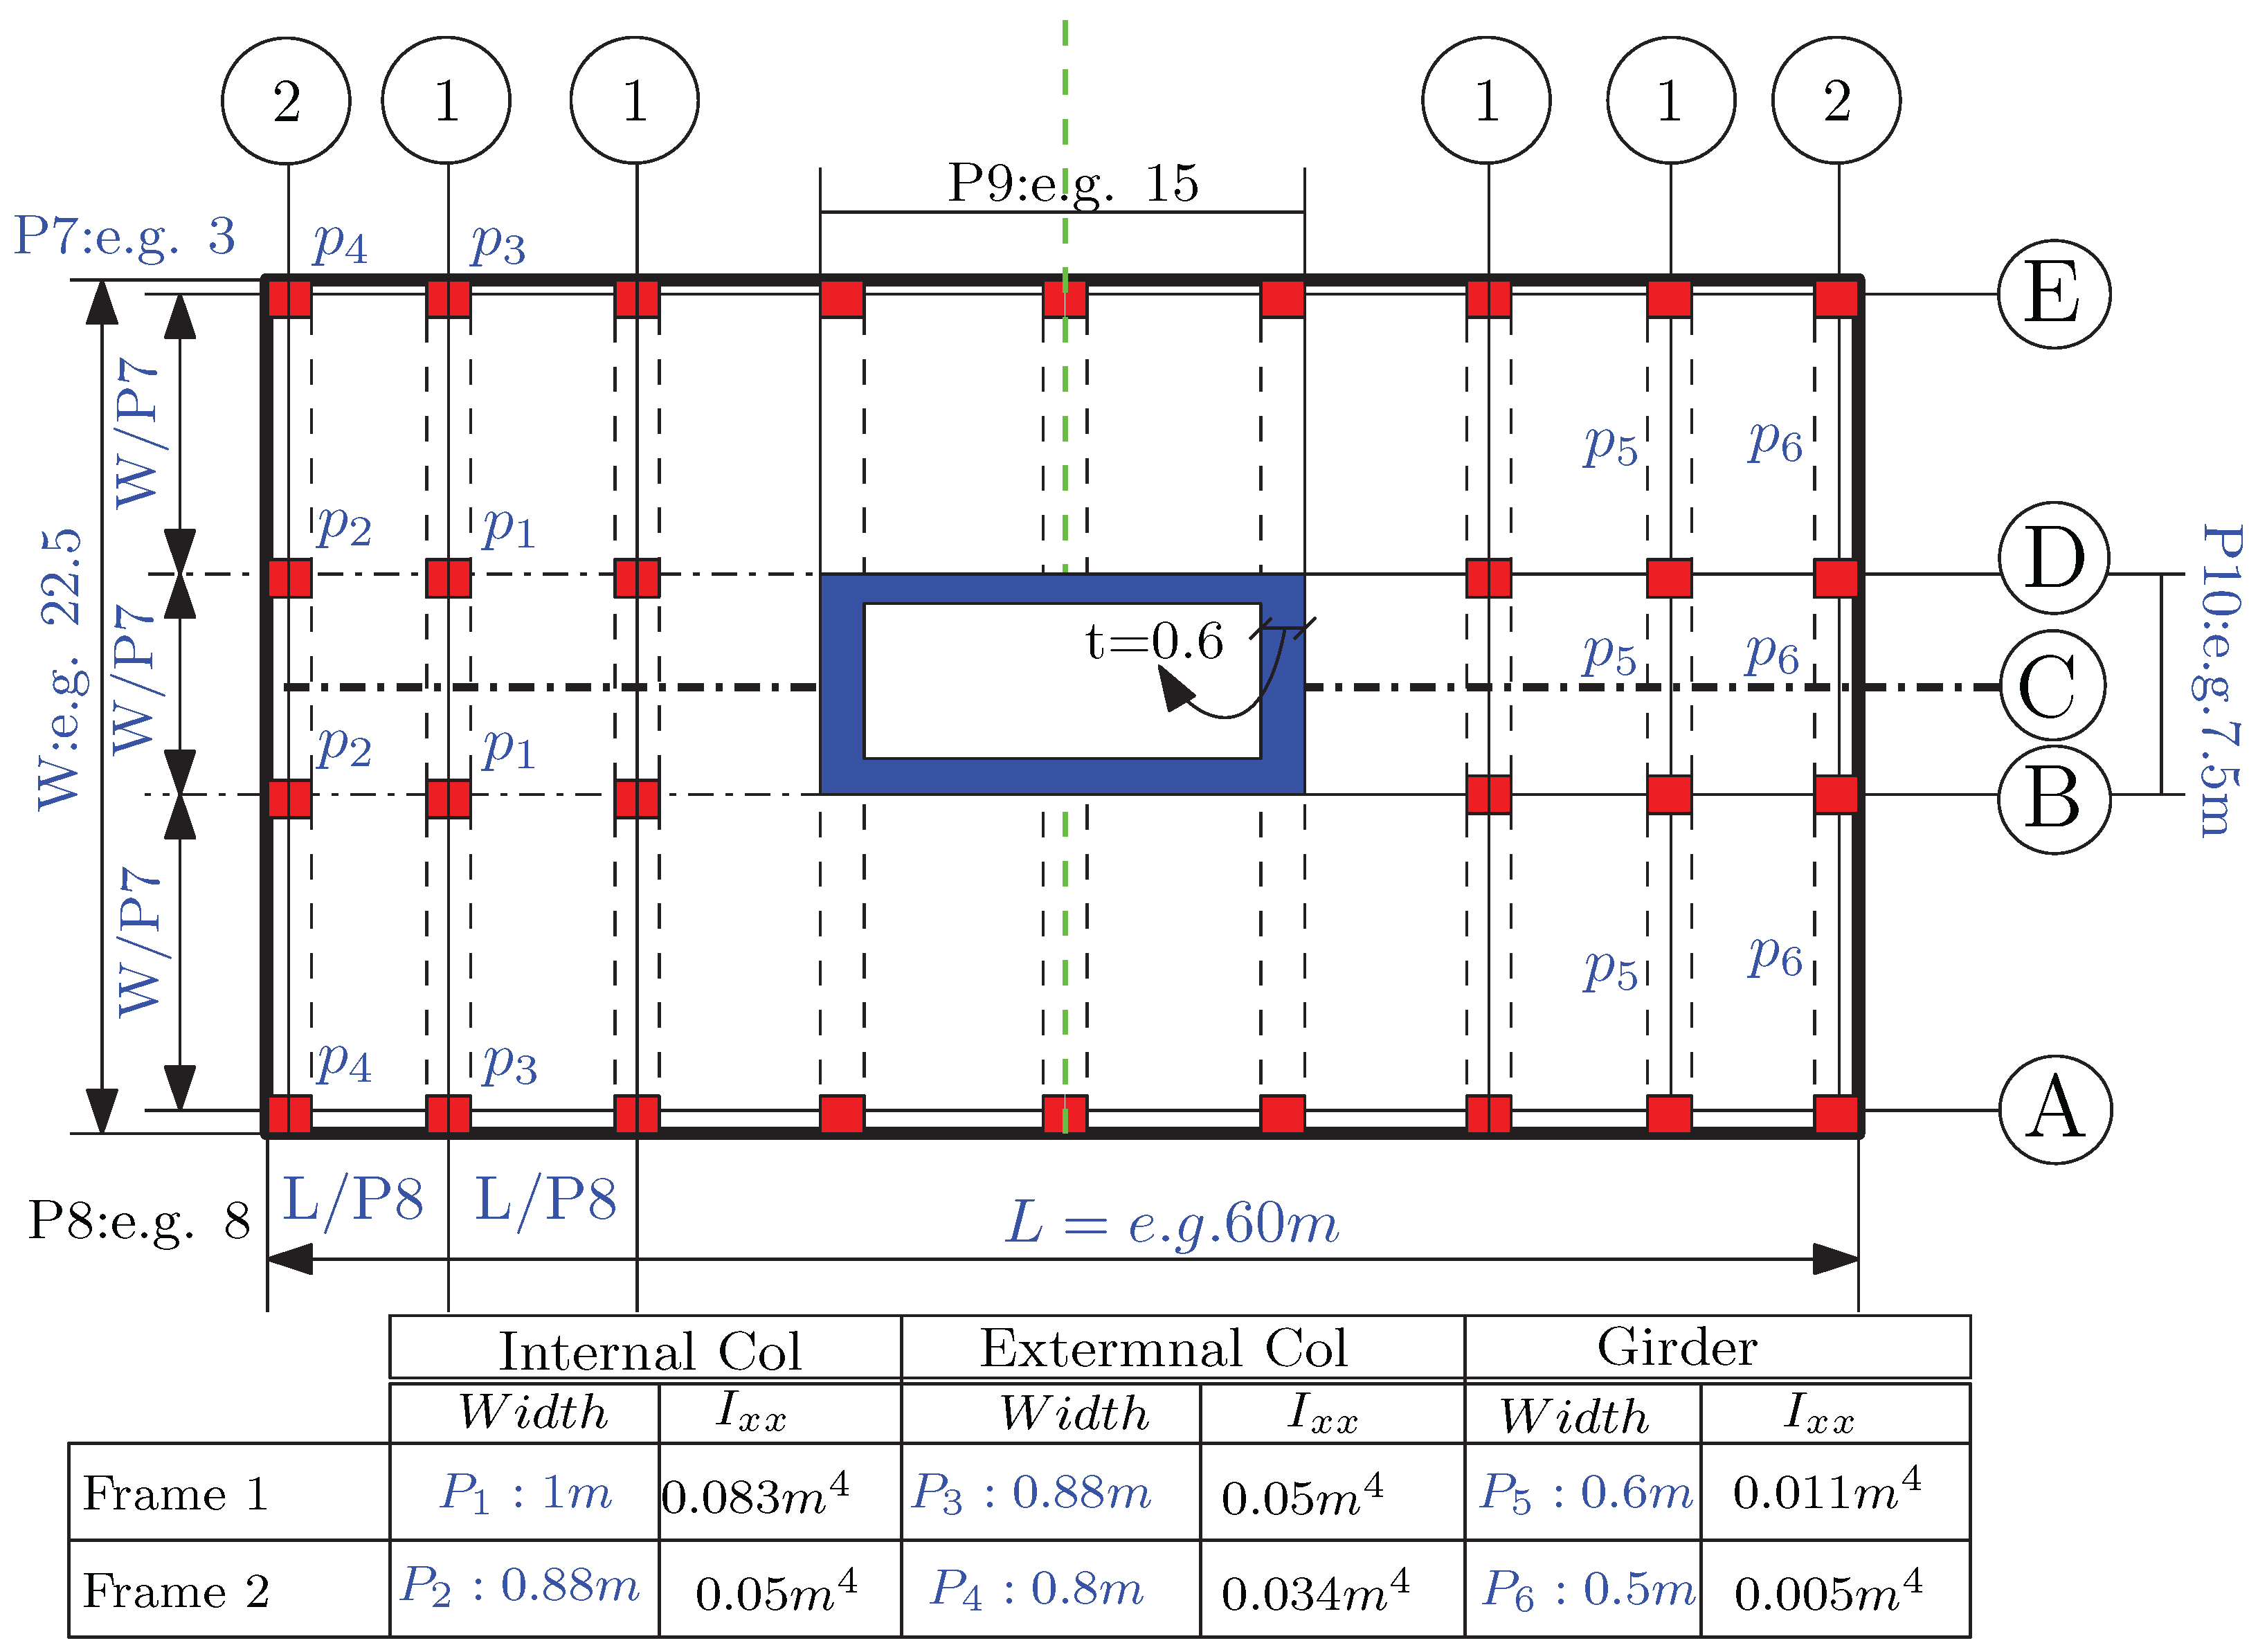
A hybrid structural system using a central core and rigid frames is considered in
Figure 2 and
Figure 3. The building is subjected to lateral forces of
and features different internal and external column dimensions. The role of girders in the rigid frame is also considered. Ten key parameters, denoted
, are selected for optimization based on their influence on deformation, shear force, and bending moments across the structure. The problem is solved using MATLAB, and the results are compared with the reference framework [
19,
20].
The structural plan depicts a high-rise building with a height of 122.5 m and 35 floors. The plan dimensions are
in length and
in width, divided into spans (
;
). The layout incorporates internal and external columns, girders, and a central shear wall (
) for lateral load resistance. Column widths, girder sizes, and moments of inertia are shown in
Figure 3. The system is designed to effectively resist lateral and vertical loads with a modulus of elasticity of
.
The MATLAB script performs a structural analysis of the high-rise building by calculating sectional properties, span distributions, and the total structural weight. In addition to the original examples calculations and parameters, a key feature, as defined and coded, is the use of a width-to-height ratio factor () to adjust column and girder cross-sections for non-rectangular shapes, enabling the computation of their second moment of inertia. Additionally, a reduction factor () is applied iteratively to simulate the gradual decrease in stiffness or moment of inertia at each floor, reflecting material optimization as the building height increases. This reduction models real-world construction practices where material usage is tapered to reduce weight while maintaining sufficient stiffness.
![Buildings 15 01565 i001]() | The structural grid is defined by the number of spans ( and ) along the width and length, with modular dimensions adjusted using parameters and . The cross-sectional areas ( to ) are calculated based on these dimensions, and the total structural weight is determined using a material density of . The MATLAB script iteratively updates these calculations across all floors (N), accounting for changes in geometry and stiffness. This example provides the foundation for optimization studies in later sections. This example calculates the core and frame floor-by-floor deformation, shear distribution, and bending forces. The results will demonstrate how optimization algorithms can improve structural efficiency in subsequent sections. |
3.1.2. Calculation of the Forces and Deformations
Step 1: Determining
It starts by defining the flexural rigidity (
) and shear rigidity (
). In this example, there is a single core with a moment of inertia
and modulus
. The rigidity calculation is as follows (results of coded PARS-Solution (CPS) shown next to the manual calculation.):
The shear rigidity (
) combines the flexural rigidity of the frame (girder (G) and column (C)) and the core. The total shear rigidity is calculated by combining the rigidities of two frame types:
Using these rigidity values,
is determined as
Figure 3.
The solved example of plan of frame–wall; wind pressure: (35 floors).
Figure 3.
The solved example of plan of frame–wall; wind pressure: (35 floors).
Step 2: Deflection Calculation
For vertical deflection (
), the formula is
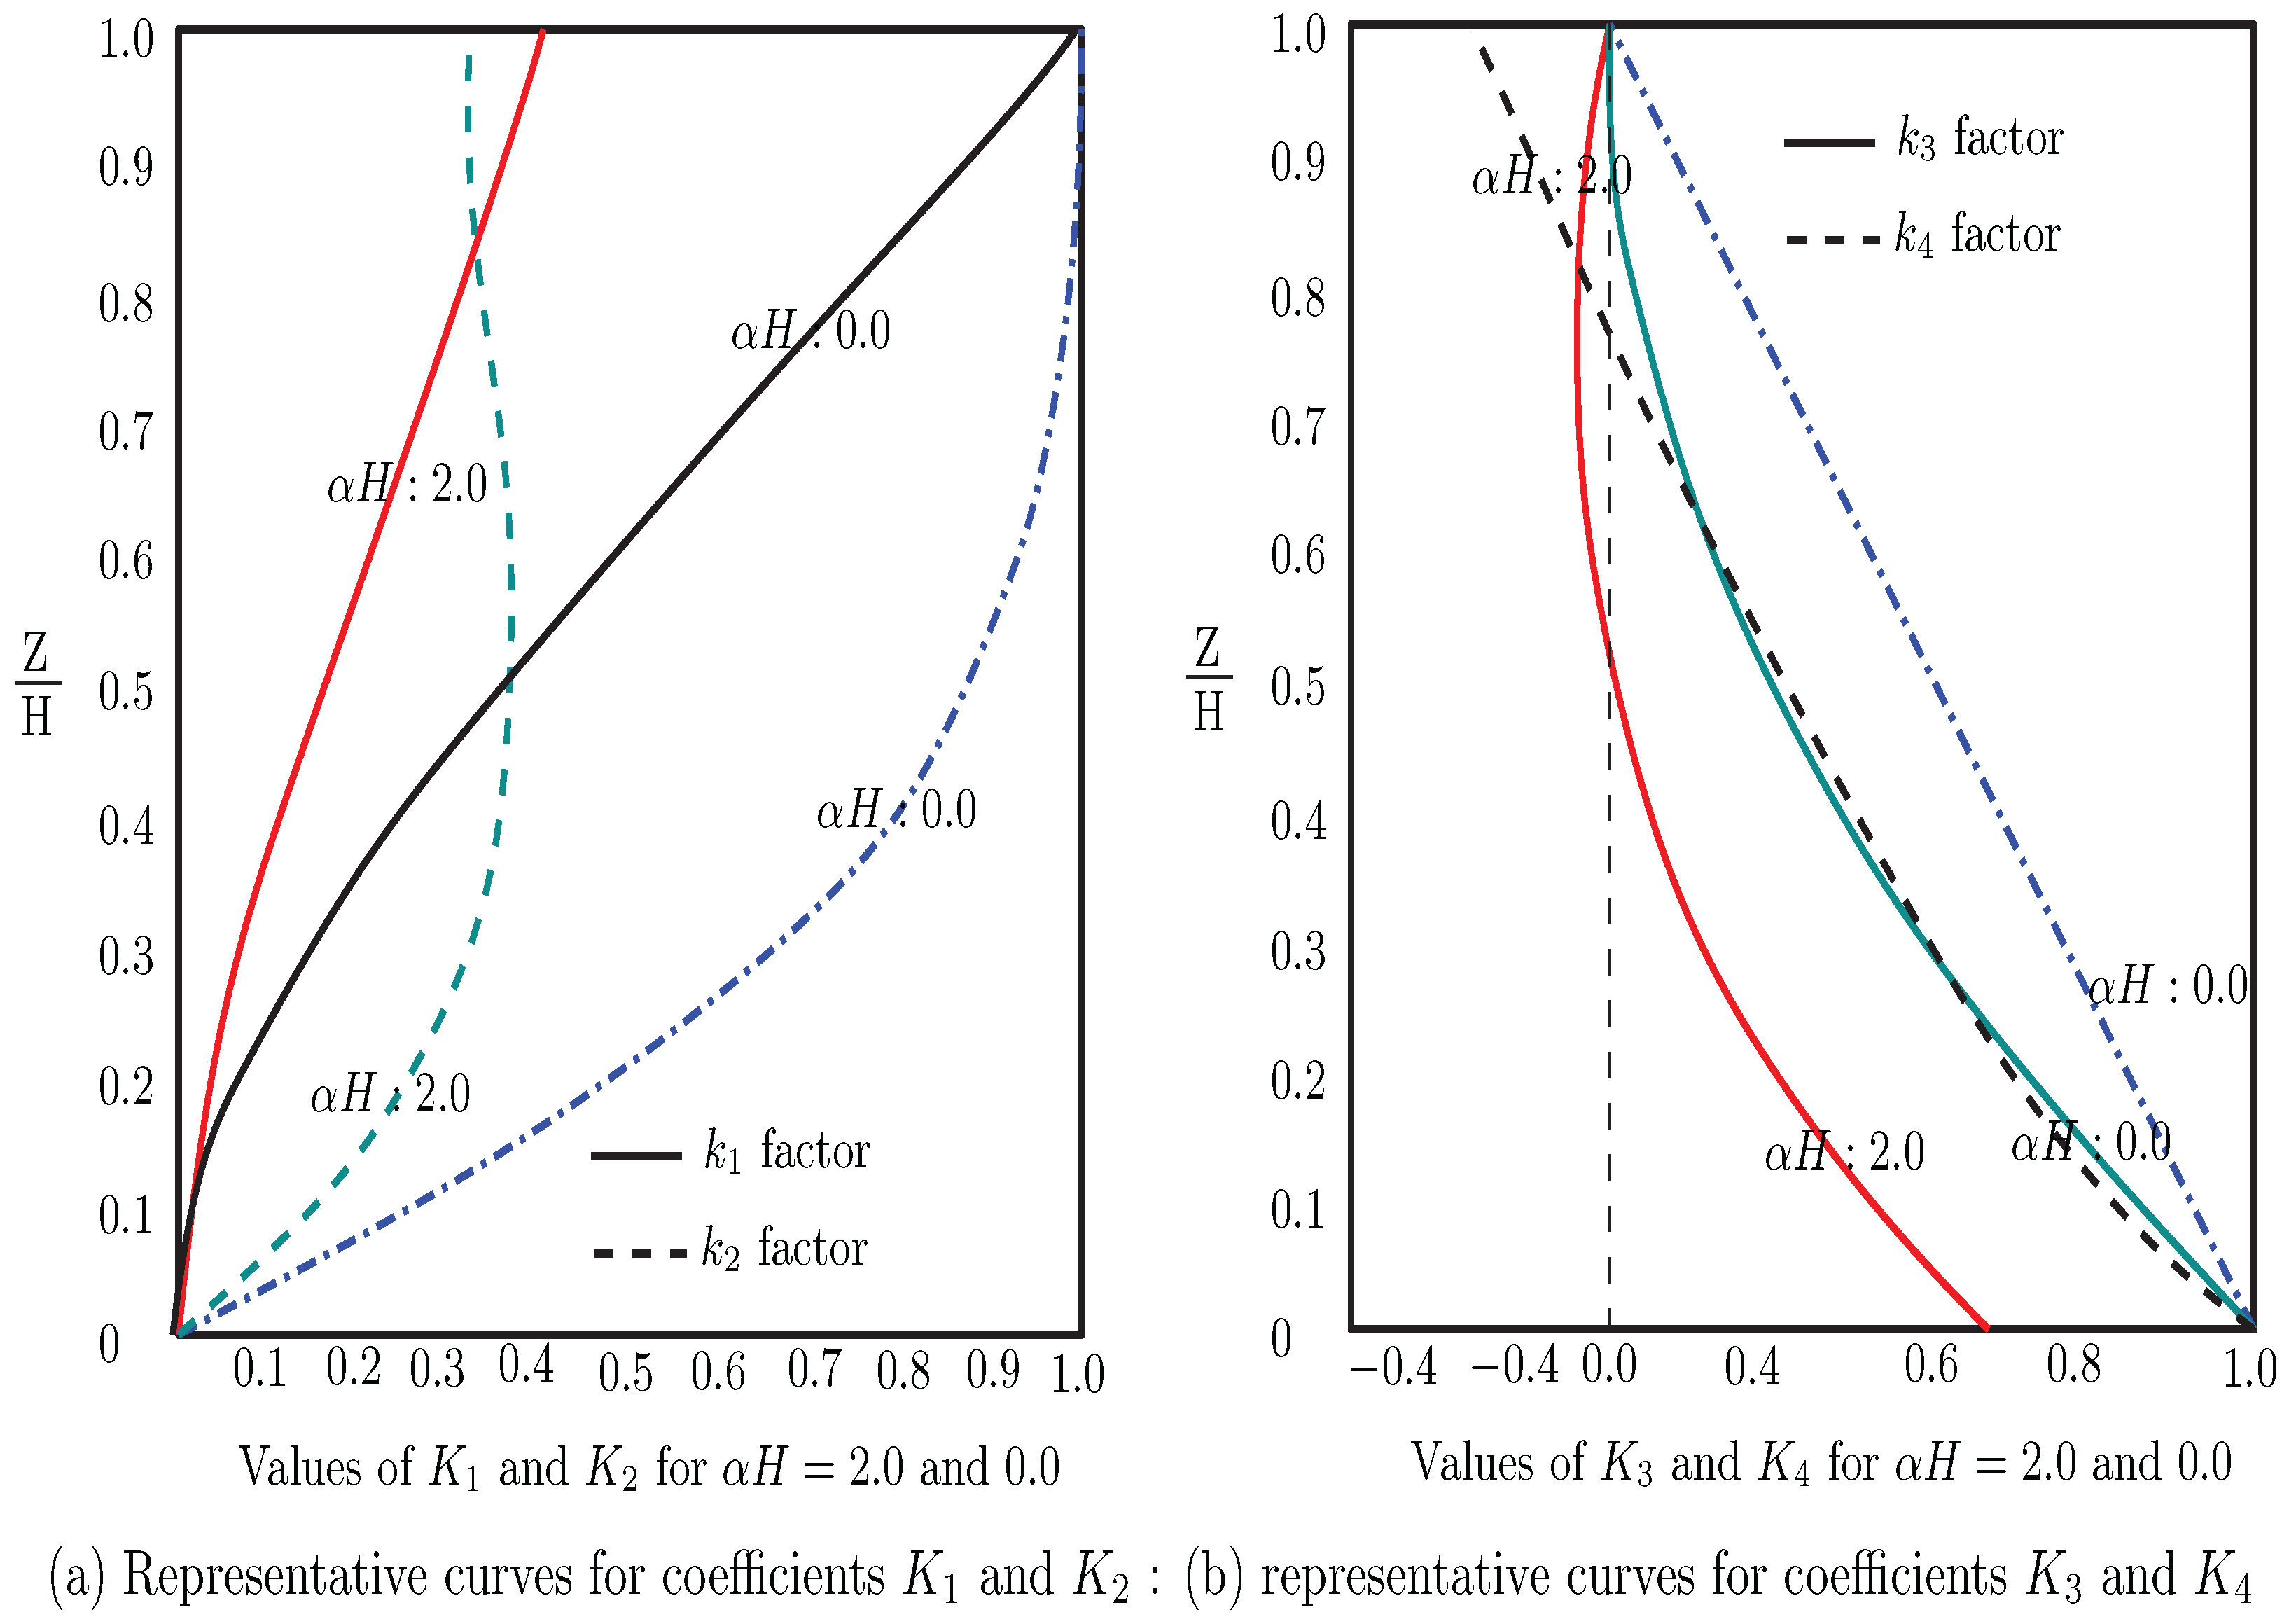
Here, the load
. The amount of coefficients (
) should be extracted from the prepared diagrams (
Figure 4 [
19,
20]). For the PARS-Solution, the amount of (
) is based on the interpolations through four precluded. Interpolation functions in MATLAB were coded and used, which, for example, is
, substituting
:
Step 3: Maximum Story Displacement Criteria
The story displacement is given by
Substituting
and
:
Step 4: Determining Frame Bending Moments
The bending moment along the height based on
(CPS:0.2243 ) is
Example calculation for bending moments yields
The total bending moment distribution is given by
For the middle of the ninth floor:
Bending in Frames 1 and 2:
Step 5: Shear Forces in the Frame and Wall
The overall shear at any height
z is given by
For the middle of the ninth floor with
:
The shear force at the middle of the ninth floor is
The shear force contributions at the ends of the structure are
This structured methodology exemplifies determining frame and core rigidity and calculating key structural parameters for evaluating structural performance.
This section provides a replicable method for calculating internal forces and deformations in high-rise buildings using MATLAB. The structured approach allows practitioners to perform accurate pre-design evaluations without relying solely on commercial software.
3.2. Differences Between the Codes and Original Method
In CPS, a MATLAB function computes the interpolated value of
based on two prepared and imported diagrams (e.g.,
and
). The data are derived from original structural studies [
19,
20] and re-digitized into
x and
y coordinates for further computations. Similar interpolation is performed for coefficients
, which are based on the normalized height
and the parameter
(
Figure 4).
Initially, the function defines two sets of coordinates representing values of for scenarios where and . To ensure clean data for interpolation, it removes any duplicate values using MATLAB’s unique function. The data are then plotted to visualize the relationship between and , after which the function prompts the user to input a valid value (between 0 and 1). Using MATLAB’s (R2019b) interp1 function, it performs linear interpolation to obtain the values corresponding to the given for both scenarios. A final value is calculated through a weighted average based on the input , producing a smooth transition of values reflecting varying structural parameters.
This approach differs from the original manual method by automating the interpolation process, improving computational accuracy and efficiency while reducing human errors associated with manual data extraction.
Figure 4.
Diagrams showing the relationship between and normalized height under different values of (0 and 2), used for interpolation in MATLAB computations.
Figure 4.
Diagrams showing the relationship between and normalized height under different values of (0 and 2), used for interpolation in MATLAB computations.
3.3. Verification and Comparison of Parametric Studies
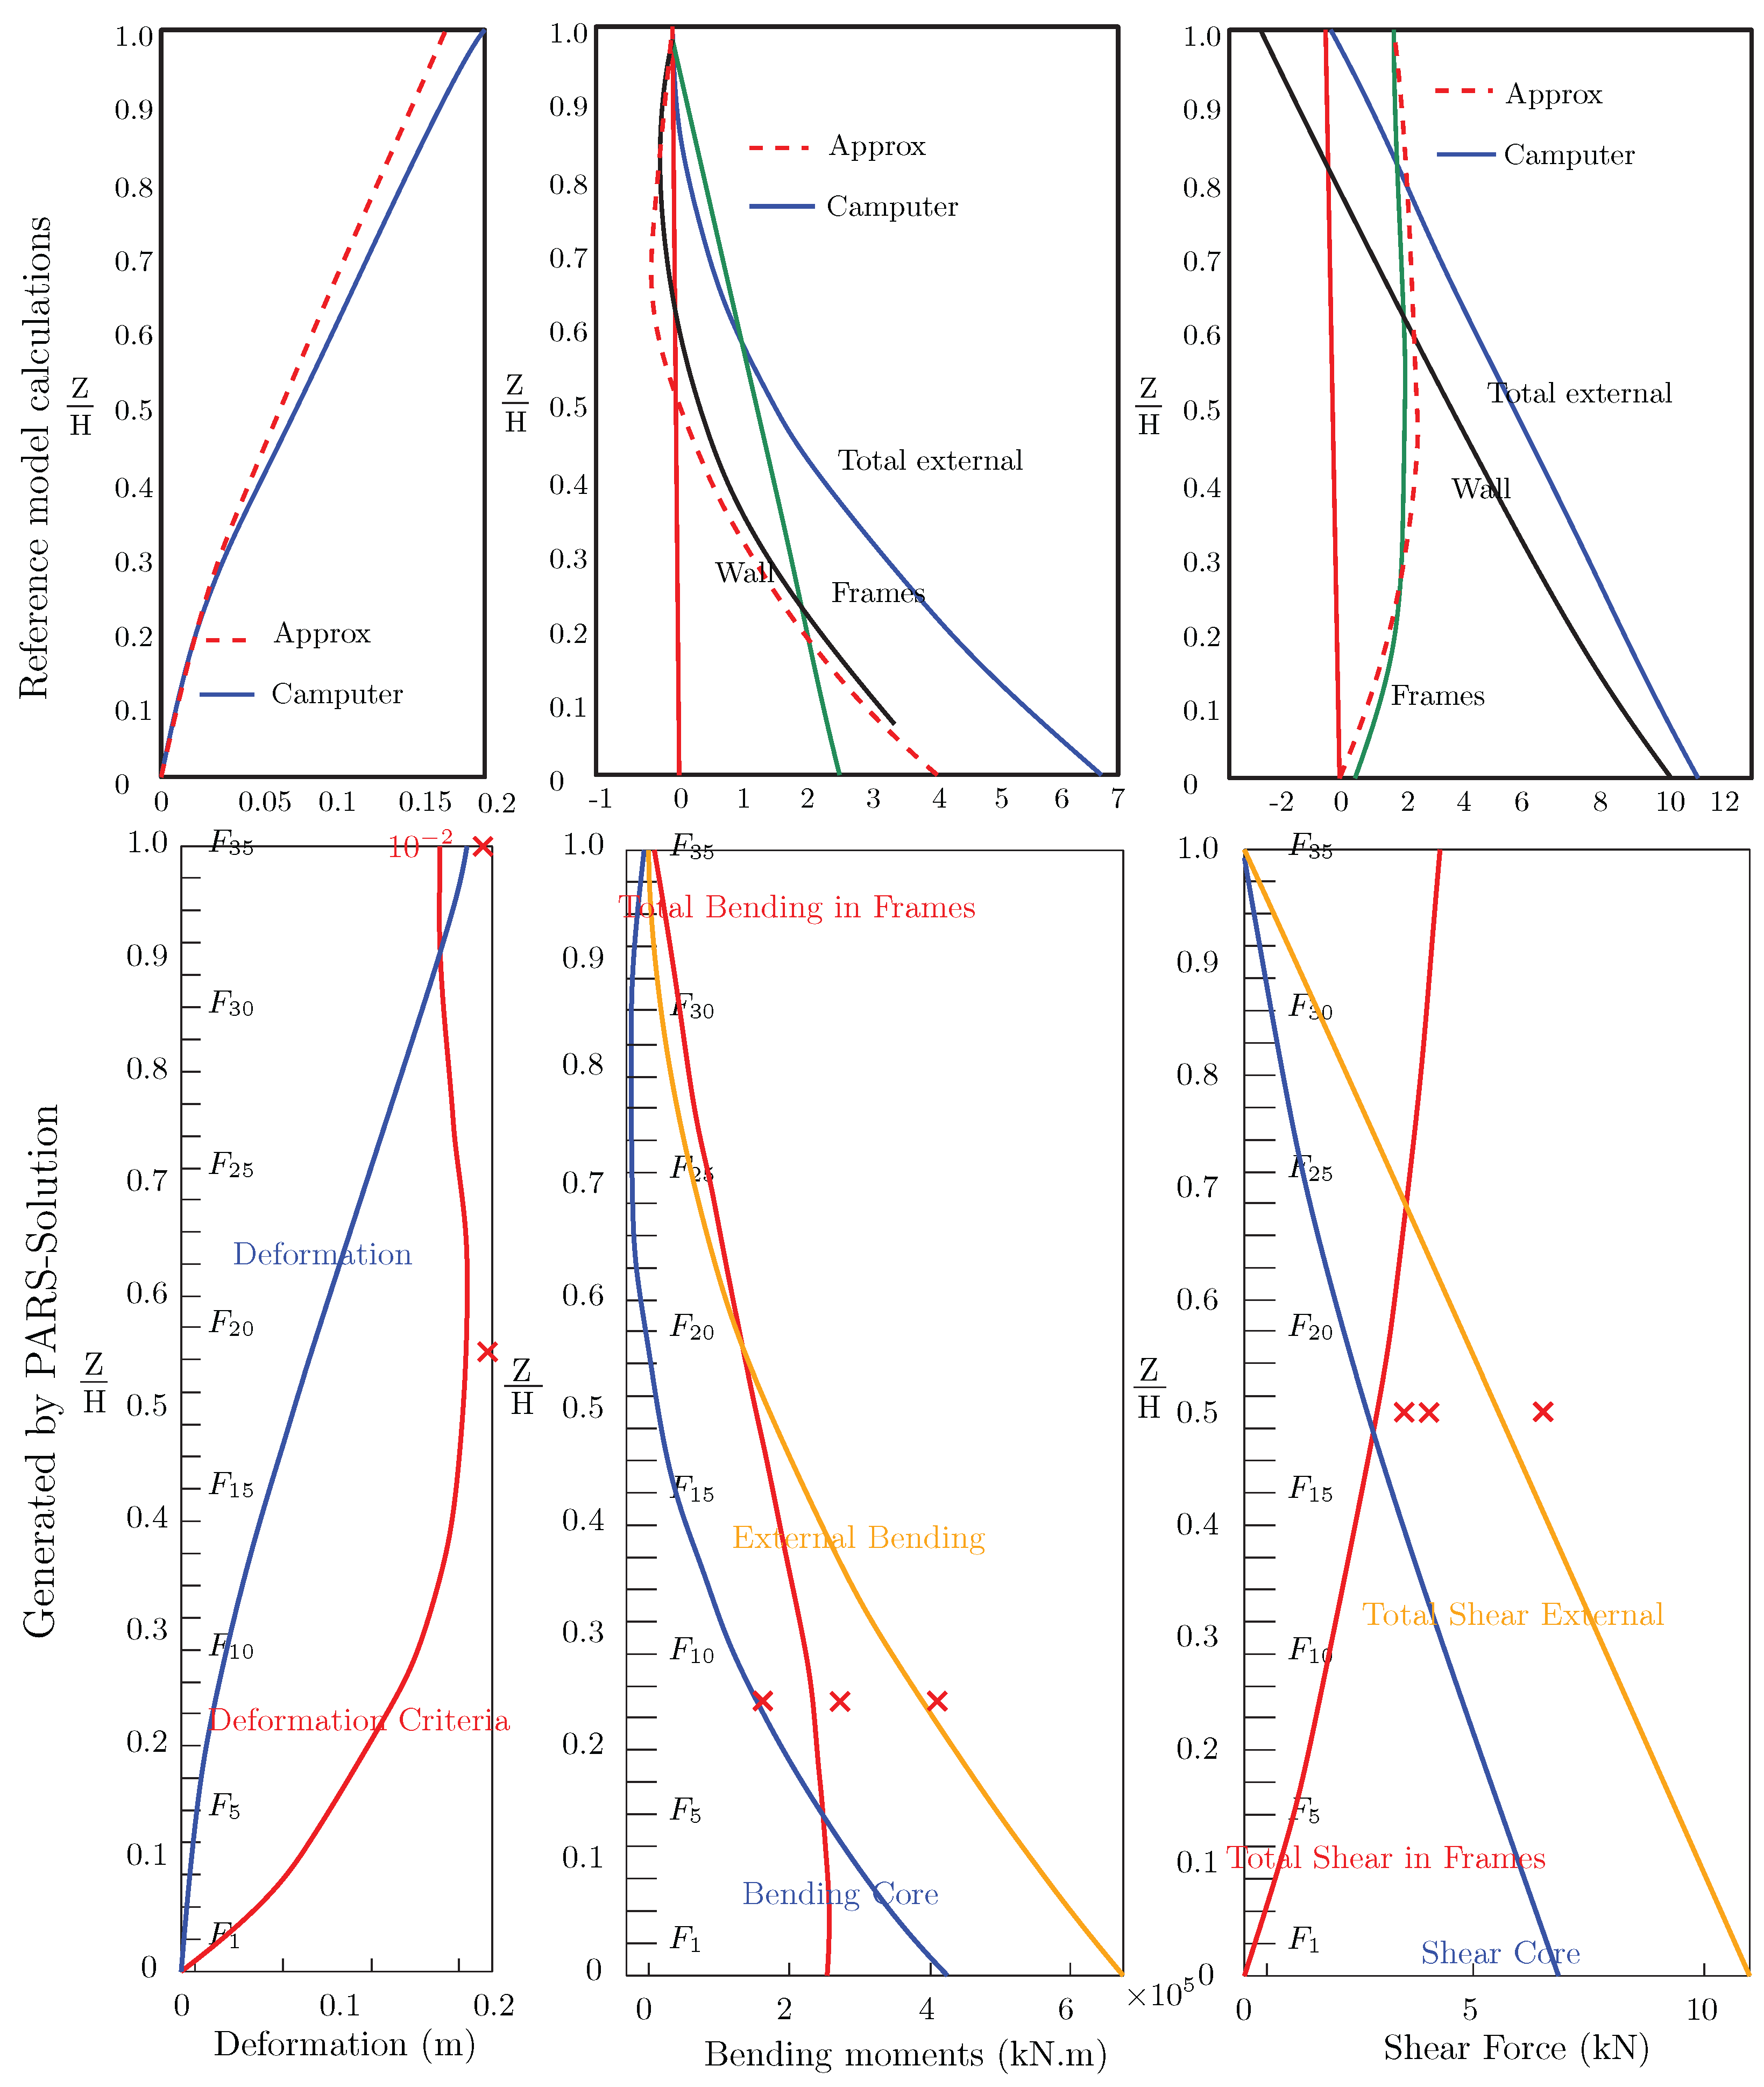
The above-mentioned examples, solved using MATLAB and reference methods, show minor differences due to variations in how coefficients are extracted. These differences primarily result from MATLAB’s more precise automated interpolation than manual methods. The largest discrepancy is observed in the coefficient and corresponding shear parameters, where the difference is approximately .
Figure 5 presents the results of structural analysis, including deformations, bending moments, and shear forces for the entire 35-floor structure. The diagrams were prepared using the same MATLAB code applied to the earlier example, with calculations performed iteratively for all floors (
).
The top diagrams show results from the structural reference model, including manual calculations and computer simulations (from [
19,
20]). In contrast, the bottom series displays the PARS-Solution results (CPS). Red points indicate solved examples used for data validation and comparison across floor levels. This validates the methodology for structural optimization and the creation of look-up tables for use in machine learning models, such as ANFISs or artificial neural networks (ANNs).
Figure 5.
Comparison of structural analysis results: top diagrams display manual and reference model calculations [
19,
20], and bottom diagrams present results generated by PARS-Solution.
Figure 5.
Comparison of structural analysis results: top diagrams display manual and reference model calculations [
19,
20], and bottom diagrams present results generated by PARS-Solution.
The validation of results against ETABS builds confidence in the accuracy of the proposed tool. Engineers can use this verified process as a reliable first-step evaluation method before finalizing designs in more detailed platforms.
3.4. Description of ANFIS and Optimization Coding in MATLAB
3.4.1. ANFIS Implementation
This study implemented the data preprocessing and model training for the Adaptive Neuro-Fuzzy Inference System (ANFIS) using MATLAB. The input features and target outputs were initially extracted from a dataset designated as OutPut. The dataset was partitioned into training and testing sets, utilizing of the data for training and for testing. Prior to model training, the isnan function was used to identify any NaN (Not a Number) values in both the training and testing datasets to ensure data quality. If any NaN values were detected, appropriate error messages were generated using the error command. Detecting and handling NaN values is critical as missing or corrupted data can lead to inaccurate predictions and convergence issues. This is needed due to limitations for manipulating values.
![Buildings 15 01565 i002]() | Various generation methods were considered to construct the Fuzzy Inference System (FIS), with a preference for Fuzzy C-Means clustering using the genfis3 function. Fuzzy C-Means clustering was chosen because it handles overlapping input spaces and provides robust partitioning, which is crucial in modeling structural behavior with uncertain or fuzzy inputs. The clustering parameters included a cluster count of 5, a partition matrix exponent of , a maximum iteration count of 100, and a minimum improvement threshold of . Error handling was incorporated using a try-catch block to address potential issues during the FIS generation process. |
The training of the ANFIS model involved an array of specified parameters, including a maximum epoch count of 100, an initial step size of , a step size decrease rate of , and a step size increase rate of . The initial step size and its adjustment rates were designed to balance speed and accuracy during convergence, with a smaller initial step size minimizing the risk of overshooting the optimal solution. The anfis command was used to train the model with the prepared training sets, including realigned inputs and corresponding targets, while the display options provided feedback during the optimization process.
Following the training phase, the performance of the trained model was evaluated using the evalfis command on both the training and testing datasets. Predictive outputs were generated, and subsequent prediction errors were calculated by comparing them to their target values. This systematic approach enabled the efficient development and assessment of the Neuro-Fuzzy system, ensuring its suitability for the specific requirements of this research.
3.4.2. Implementation of PSO and MOPSO
The Particle Swarm Optimization (PSO) algorithm was implemented in MATLAB to interface with the PARS-Solution framework, optimizing key structural outputs such as deformation, forces, and weight based on input parameters ( to ).
![Buildings 15 01565 i003]() | The algorithm initializes a swarm of particles, each representing a potential solution in an n-dimensional search space defined by the input parameters. MATLAB commands assign random positions and velocities to each particle within specified bounds.
Similarly, the Multi-Objective Particle Swarm Optimization (MOPSO) algorithm was applied, with a custom cost function MOPOBorjSpecific(x) defined using multiple decision variables (e.g., ), constrained by and . The swarm consists of particles, evolving over iterations. Non-dominated solutions are stored in a repository () and managed using a hypergrid with divisions and an inflation rate . Leader selection () and deletion pressure () mechanisms ensure repository diversity and convergence. |
Particle velocities are updated using the equation
where
is the inertia weight, reduced over iterations by
. The learning coefficients
and
govern the cognitive and social components, and
and
are random values in
. Mutation with rate
introduces variability. Repository management is based on Pareto dominance and crowding distance within the hypergrid.
The algorithm dynamically plots the population and repository costs, enabling visualization of the evolution of the Pareto front. This implementation combines adaptive parameter control, grid-based diversity preservation, and robust particle dynamics, ensuring efficient convergence to high-quality Pareto-optimal solutions. By maintaining a diverse set of non-dominated solutions, MOPSO allows designers to balance conflicting objectives, such as minimizing deformation while reducing material usage.
4. Discussion
The following section begins by summarizing the main results obtained from the parametric simulations and ANFIS training. This is followed by a reflective interpretation of these results in terms of their practical implications for structural design and machine learning delegation.
The focus of this study, after presenting and proving the results of the PARS-Solution, is on 3.1.—discussing the influence of each parameter, 3.2.—evaluating the capacity of the ANFIS in delegating PARS-Solution, and, finally, 3.3.—figuring out the optimum layout and dimensions of the structural elements to reduce deformations, forces, and the amount of the used materials. In this regard, the influence of parameters () in a fixed plan is discussed, and then, by using an ANFIS and MOPSO as a sub-machine-learning tool, they are delegated and optimized. In this study, the forces and performance of the structure in one direction were examined to discuss the influences and approach.
4.1. Influence of Structural Parameters on Weight and Deformation
This section examines the effect of key structural parameters, including column dimensions (), girder dimensions (), and core shear wall properties (). Additionally, the influences of floor height, number of floors (N), and spans () are considered. Parameters for gradually reducing stiffness and moment of inertia () and the use of rectangular cross-sections for beams and columns () are also examined for their impact on structural performance.
4.1.1. Influence of the Beam and Column Dimensions
Understanding how various parameters influence building deformation and weight is critical for optimizing designs in structural engineering. The analysis highlights the contributions of each parameter and their collective role in structural stability.
- -
Column Parameters:
and
define the width of the middle columns in Frame 1 and Frame 2. The width of the side columns in Frame 1 and Frame 2 is represented by
, and
corresponds to the load-bearing capacity of the corner columns.
Figure 7 displays the weight and maximum drift of the building by changing parameters (
), individually or simultaneously, as a factor (
P) to the initial amounts in the primary example. Raising
, in a specific range
, can lead to a deformation reduction of up to 25%, with a 60% increase in weight, making it a key parameter for efficient design, which, regarding the higher number of these columns, could be predicted, and, as the diagram (
Figure 7-left) displays, despite the low repetition, the corner columns (
) have relatively highest influences. Comparing them to increasing all the parameters (
to
) also proves it and shows mainly the influence of this simultaneous increase in dimensions on the weight of the system (
Figure 7-mid).
- -
Girder Parameters: Girders also significantly influence structural performance.
, representing the central girders in Frame 1, contributes to the overall weight, increasing it by 60% but reducing deformation by about 40%.
, corresponding to the side girders in Frame 2, which increase weight by 6% while reducing deformation by 16%. This demonstrates that girders play an essential role in controlling lateral deflections (
Figure 7-right). This distribution reflects the different roles of columns and girders in carrying axial and lateral loads. For example, the higher frequency of
columns ensures axial stability, while central girders (
) help to control bending moments and distribute loads across the building.
In conclusion, although girders () play a vital role in managing deformation, the optimization of column parameters ( to ) proves to be more effective due to their more significant contribution to overall structural integrity. An integrated approach that balances column and girder design is essential for achieving optimal performance while minimizing material usage.
4.1.2. Influence of the Core Dimensions
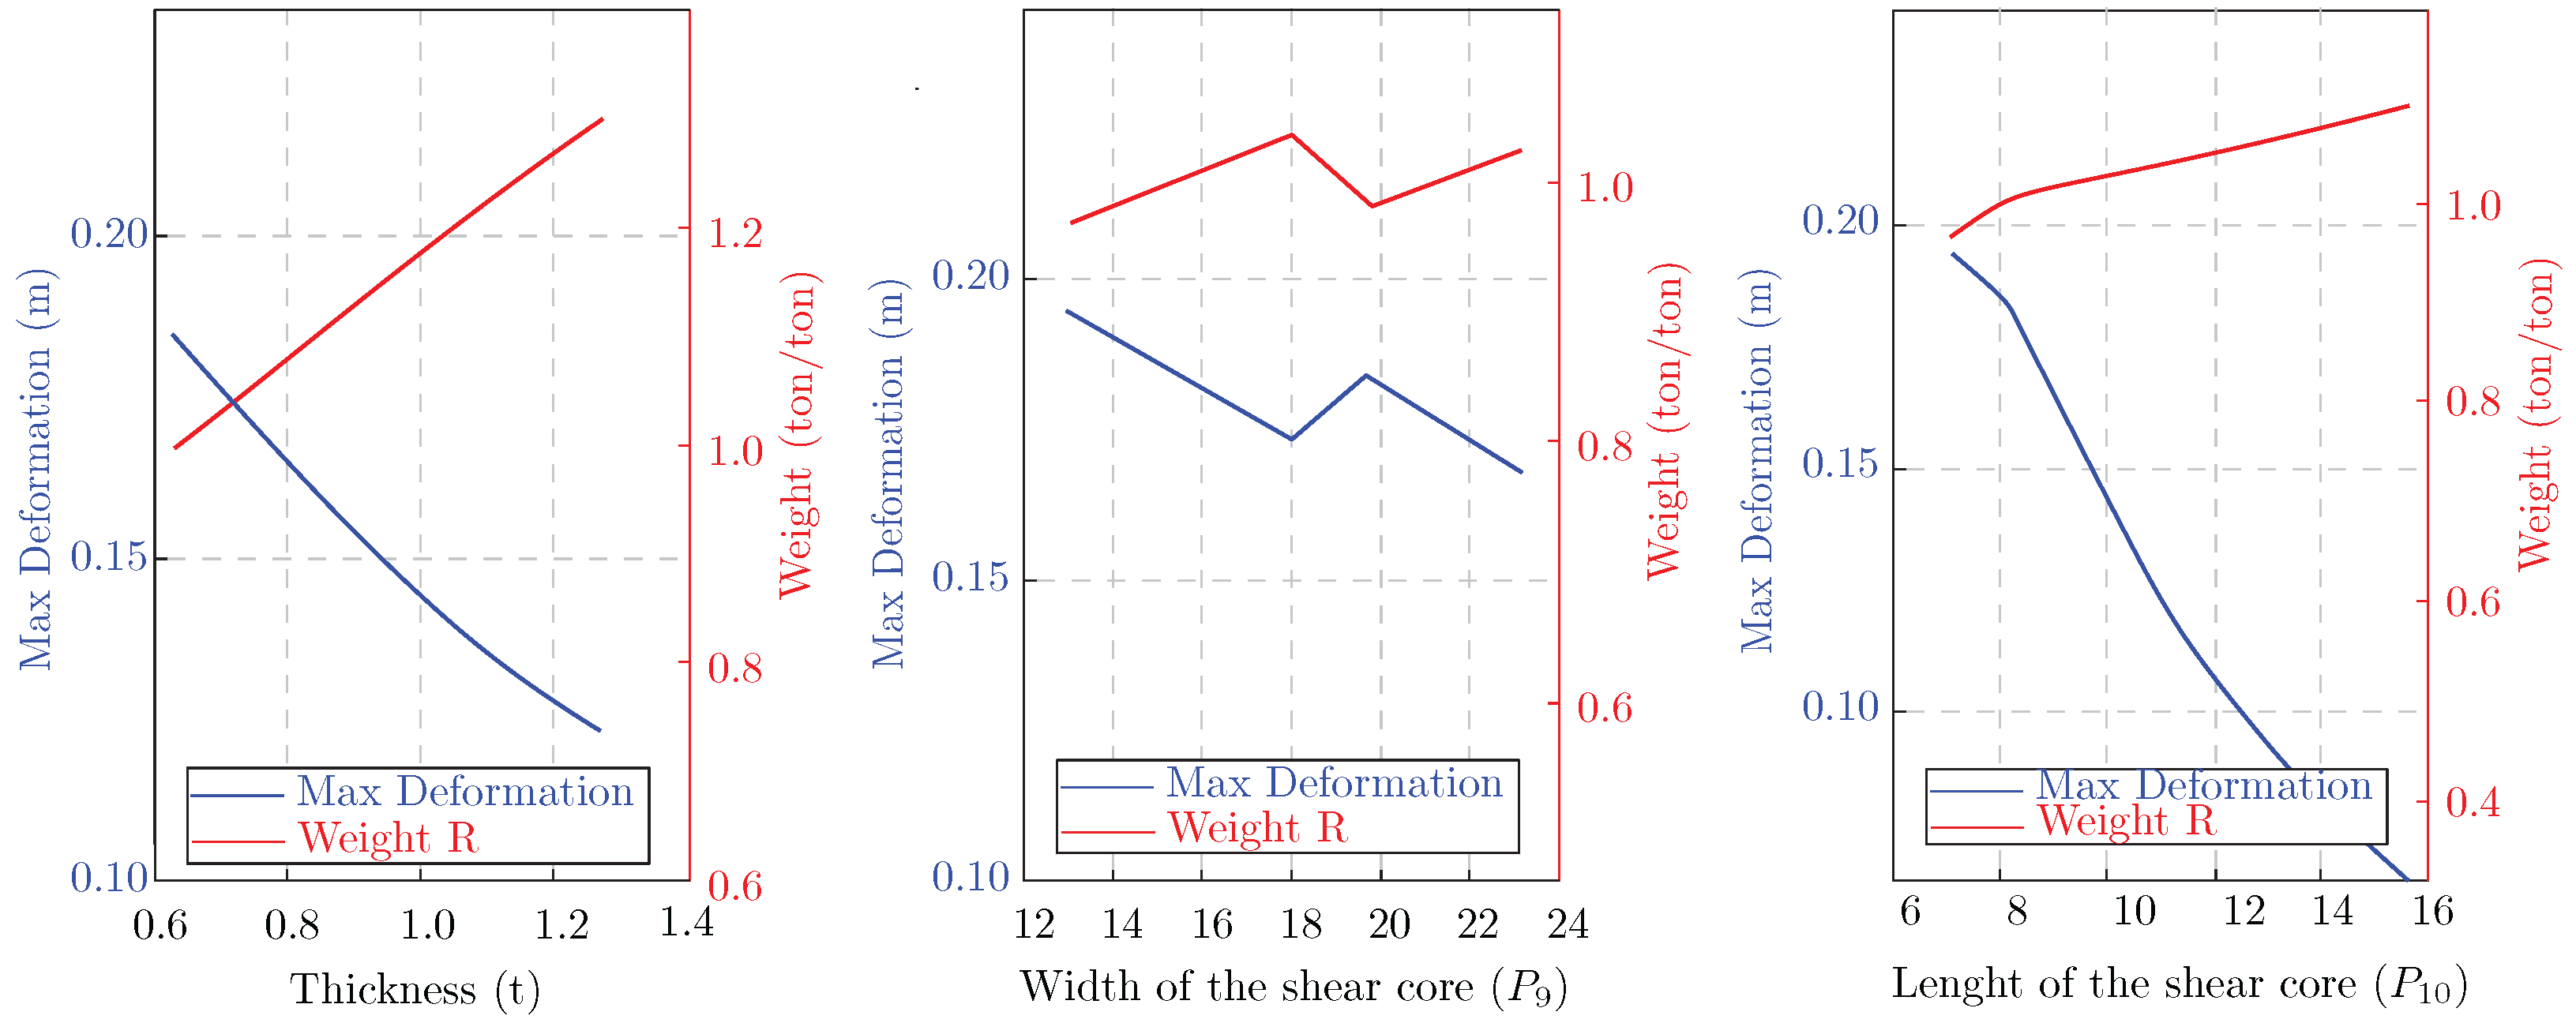
The core shear wall is a critical component of high-rise buildings, providing lateral stability and load resistance. This section evaluates how varying its thickness, width, and length affects building deformation and weight.
Increasing the core wall’s thickness directly improves its stiffness, reducing deformation under lateral loads. Specifically, an increase
in thickness results in a 23% reduction in maximum deformation. However, this improvement comes with a 29% increase in structural weight, displaying the strong influence and linear relation between the weight and stiffness of the structure (
Figure 8).
Likewise, the width of the core shear wall (
) influences its lateral stiffness. Increasing the width
results in an 11% reduction in maximum deformation. However, this improvement comes with an 18% increase in structural weight. The stepwise behavior observed in the diagram (
Figure 8-mid) is due to the automated adjustments in the PARS-Solution framework, where changes in width affect column placement (numbers) and, consequently, the overall weight and stiffness distribution.
The length of the core wall (
) from
has a pronounced effect on structural performance compared to thickness and width. The increase in length reduces the maximum deformation by 74%, with a corresponding 14% increase in weight (the weight criteria are generally a normalized comparison to the weight of entire walls and frames). As a result, increasing the length is considerably efficient for improving stiffness and is ranked lower in importance compared to thickness and width (
Figure 8).
This analysis emphasizes that thickness should be prioritized for optimal structural performance to minimize deformation while carefully balancing weight increases. Although width substantially reduces deformation, its more significant impact on weight must be minimized, especially in high-rise buildings. Due to the load direction, which contributes marginally to structural performance, length shows that its influence is less critical than that of thickness and width.
4.1.3. Influence of Floor Number and Height on Structural Response
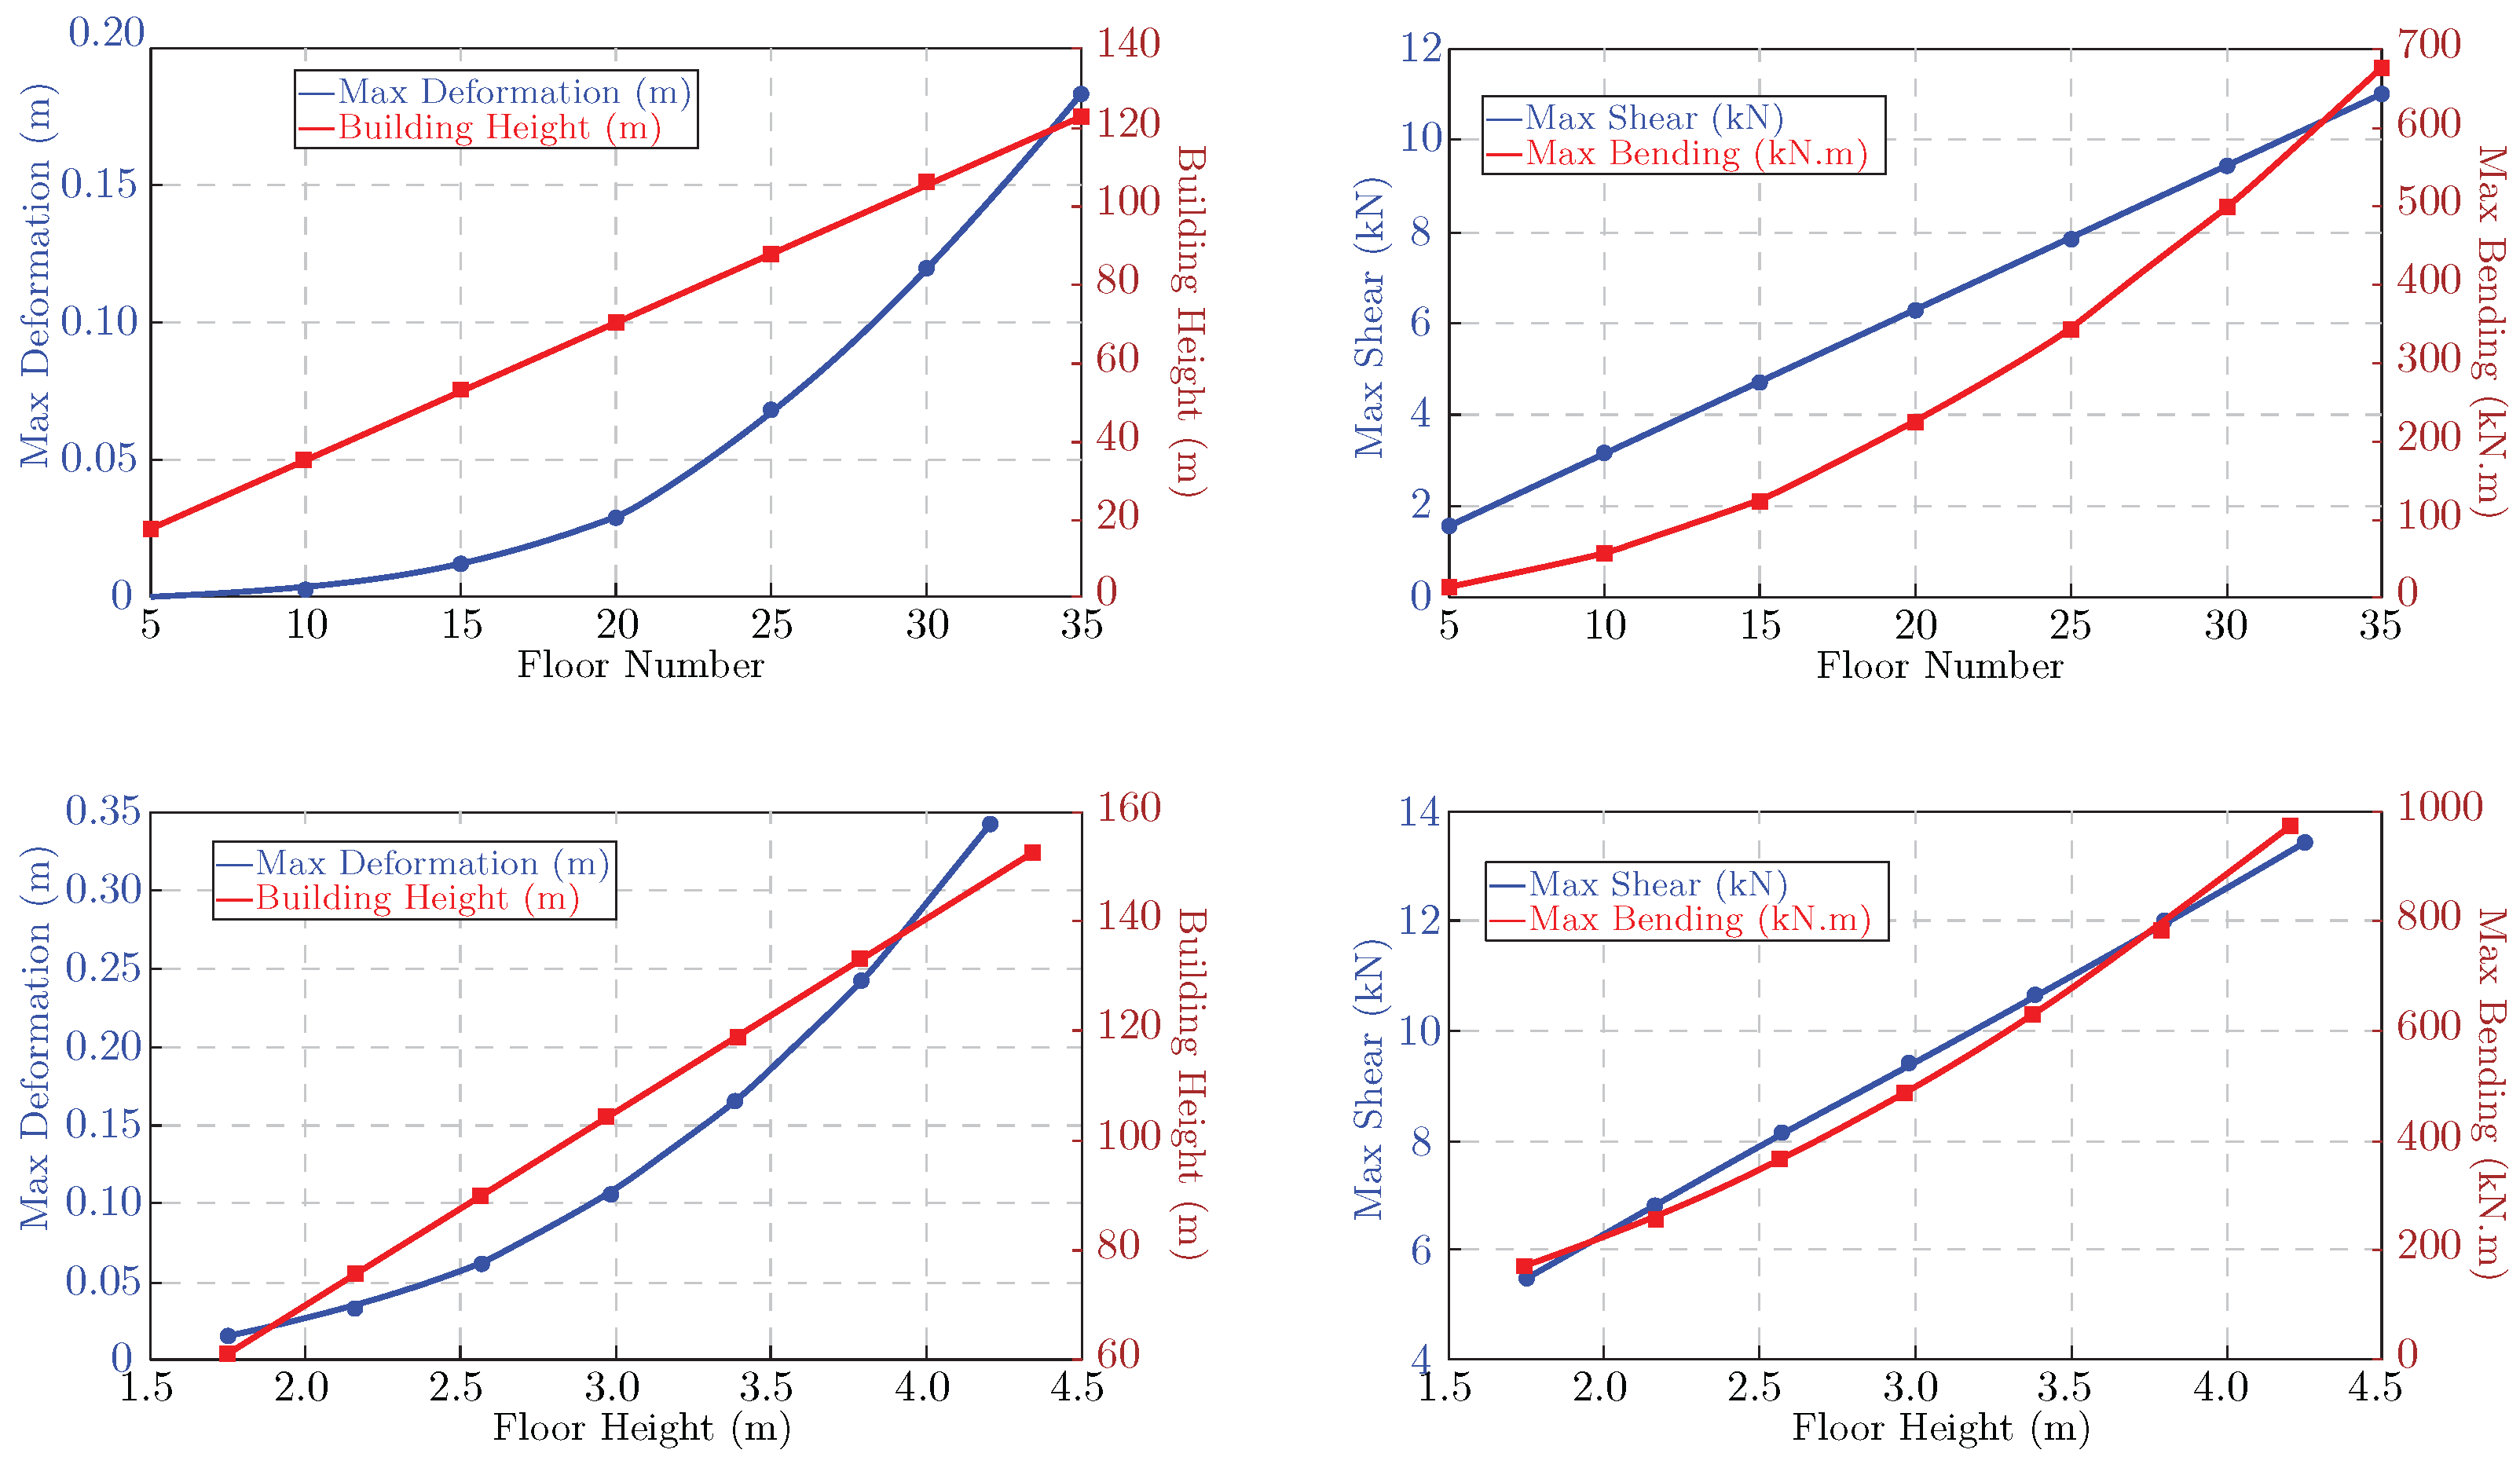
The analysis’s results are illustrated in four plots representing the relationships between the floor height, maximum deformation, maximum shear, and maximum bending moments within a building’s elements. Each plot effectively highlights the structural design considerations required for multi-floor buildings.
The comparison of maximum deformation to floor height in
Figure 9 shows how drastically maximum deformation changes as floor height increases. In the main example, when all the parameters are fixed, the higher floors experience greater deformation due to the accumulated weight from the upper floors, while the lower floors show reduced deformation due to diminishing load effects. The maximum deformation was observed at
for a floor height of
and reduced to
at
.
As the same plot illustrates, similar changes were experienced by changing the floor number, which, in this example, reduced the floor number to
, causing
approach to zero. Maximum shear, floor height, and numbers were also manipulated and compared.
Figure 9-right shows that maximum shear forces arise with increasing floor height, confirming that lower floors experience less shear effects, as seen in comparing maximum bending and floor height.
In this regard, shear decreases according to the floor number , reduced from at the first floor to in the building with a 17.5m height. This influence on bending is more considerable by reduction from to . These two points indicate the considerable influence of the general height of the building on the forces and deformations and, accordingly, on the period of the system. Nonetheless, two points should be considered. First, the force is not the entire force in the building but the bending and shear carried by the core wall and different frames, and then the reduction in the floor numbers means reducing the applied wind force.
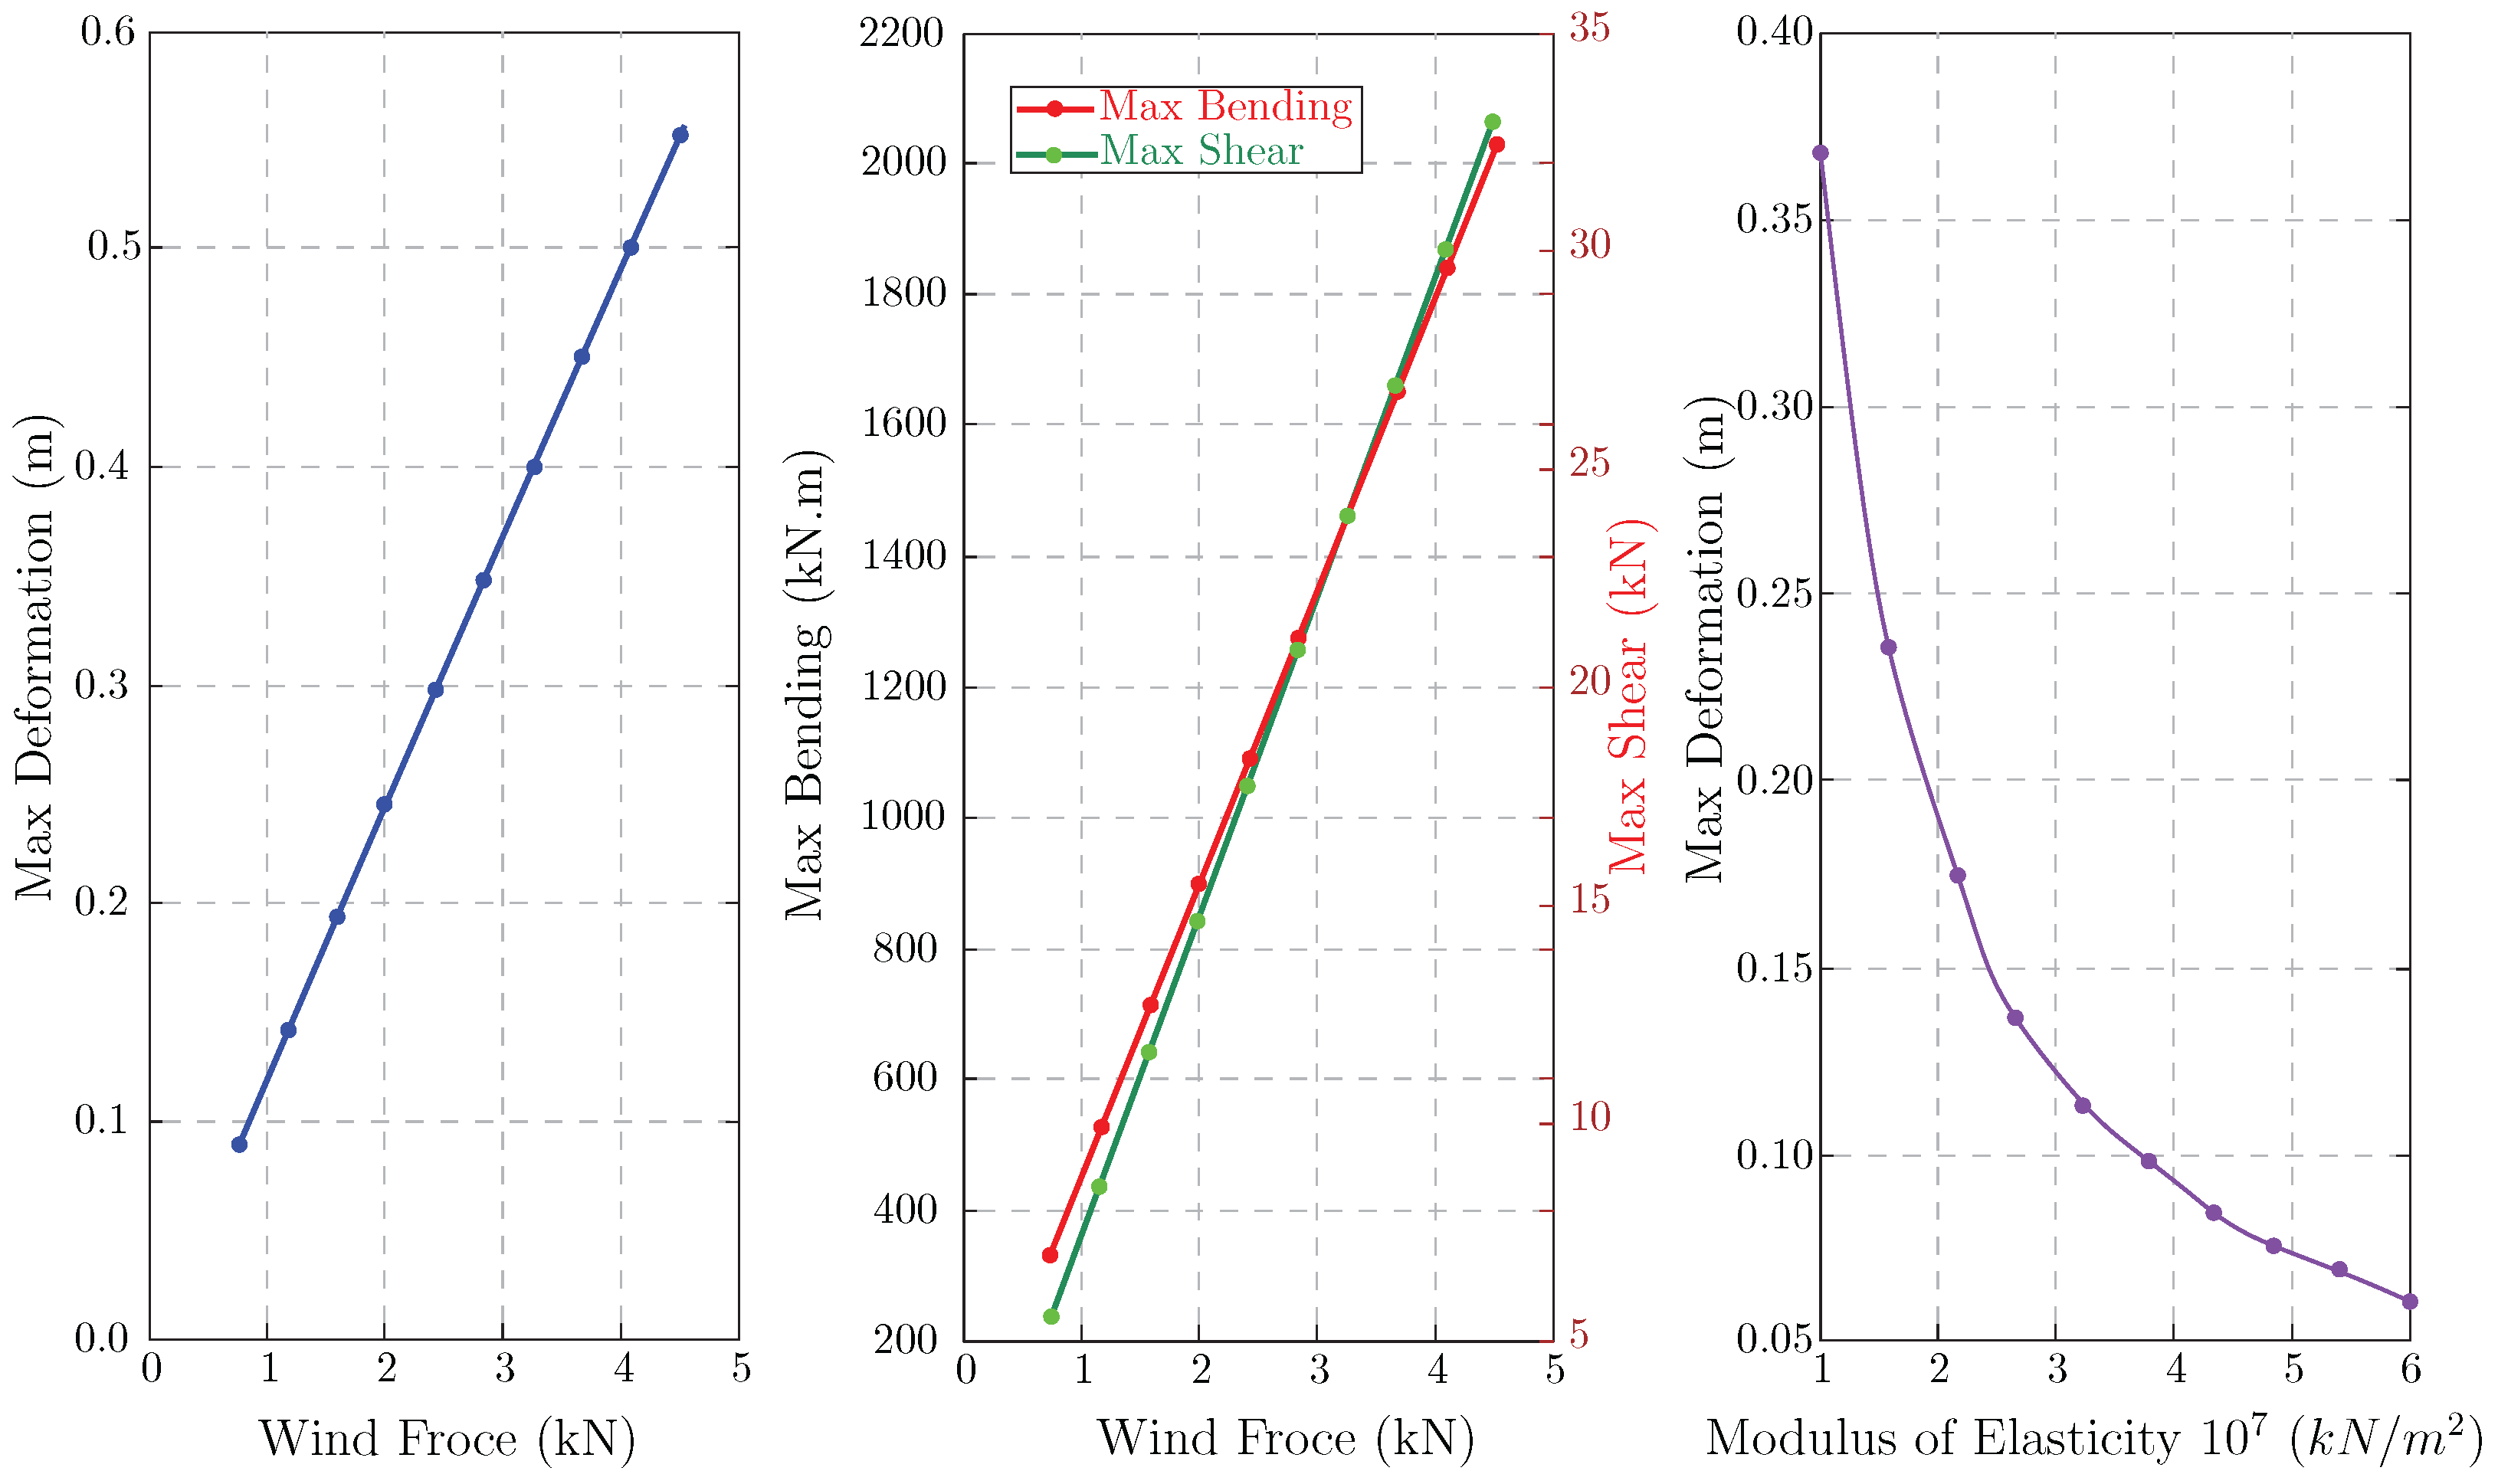
4.1.4. Influence of Forces and Material
The data reveal significant relationships between wind forces and key structural parameters, such as maximum deformation, bending moments, and shear forces. The wind force varies from 0.75 kN to 4.5 kN, while the modulus of elasticity (E) ranges from to .
Figure 10, shows that maximum deformation decreases from 0.55 m at a wind force of 4.5 kN to 0.09 m when the wind force is 0.75 kN, representing an 83.64% reduction. The mid-plot shows that maximum bending moments decrease with decreasing wind force. At 4.5 kN, the maximum bending moment is 2025.84 kNm, and the maximum shear is 33.075 kN. As the wind force decreases, both values follow the same trend, reflecting the importance of wind loads and their linear relation in maintaining structural stability.
Figure 9.
Influence of floor height and number on the forces and deformations.
Figure 9.
Influence of floor height and number on the forces and deformations.
The right plot highlights the effect of varying the modulus of elasticity on maximum deformation at a constant wind force of 1.5 kN. As E increases from to , maximum deformation decreases from 0.368 m to 0.061 m, a reduction of about 83.44%. It is important to note that the modulus of elasticity does not have a linear relation with deformation, and, after reaching , its influence reduces.
4.1.5. Influence of Sections and Moment of Inertia
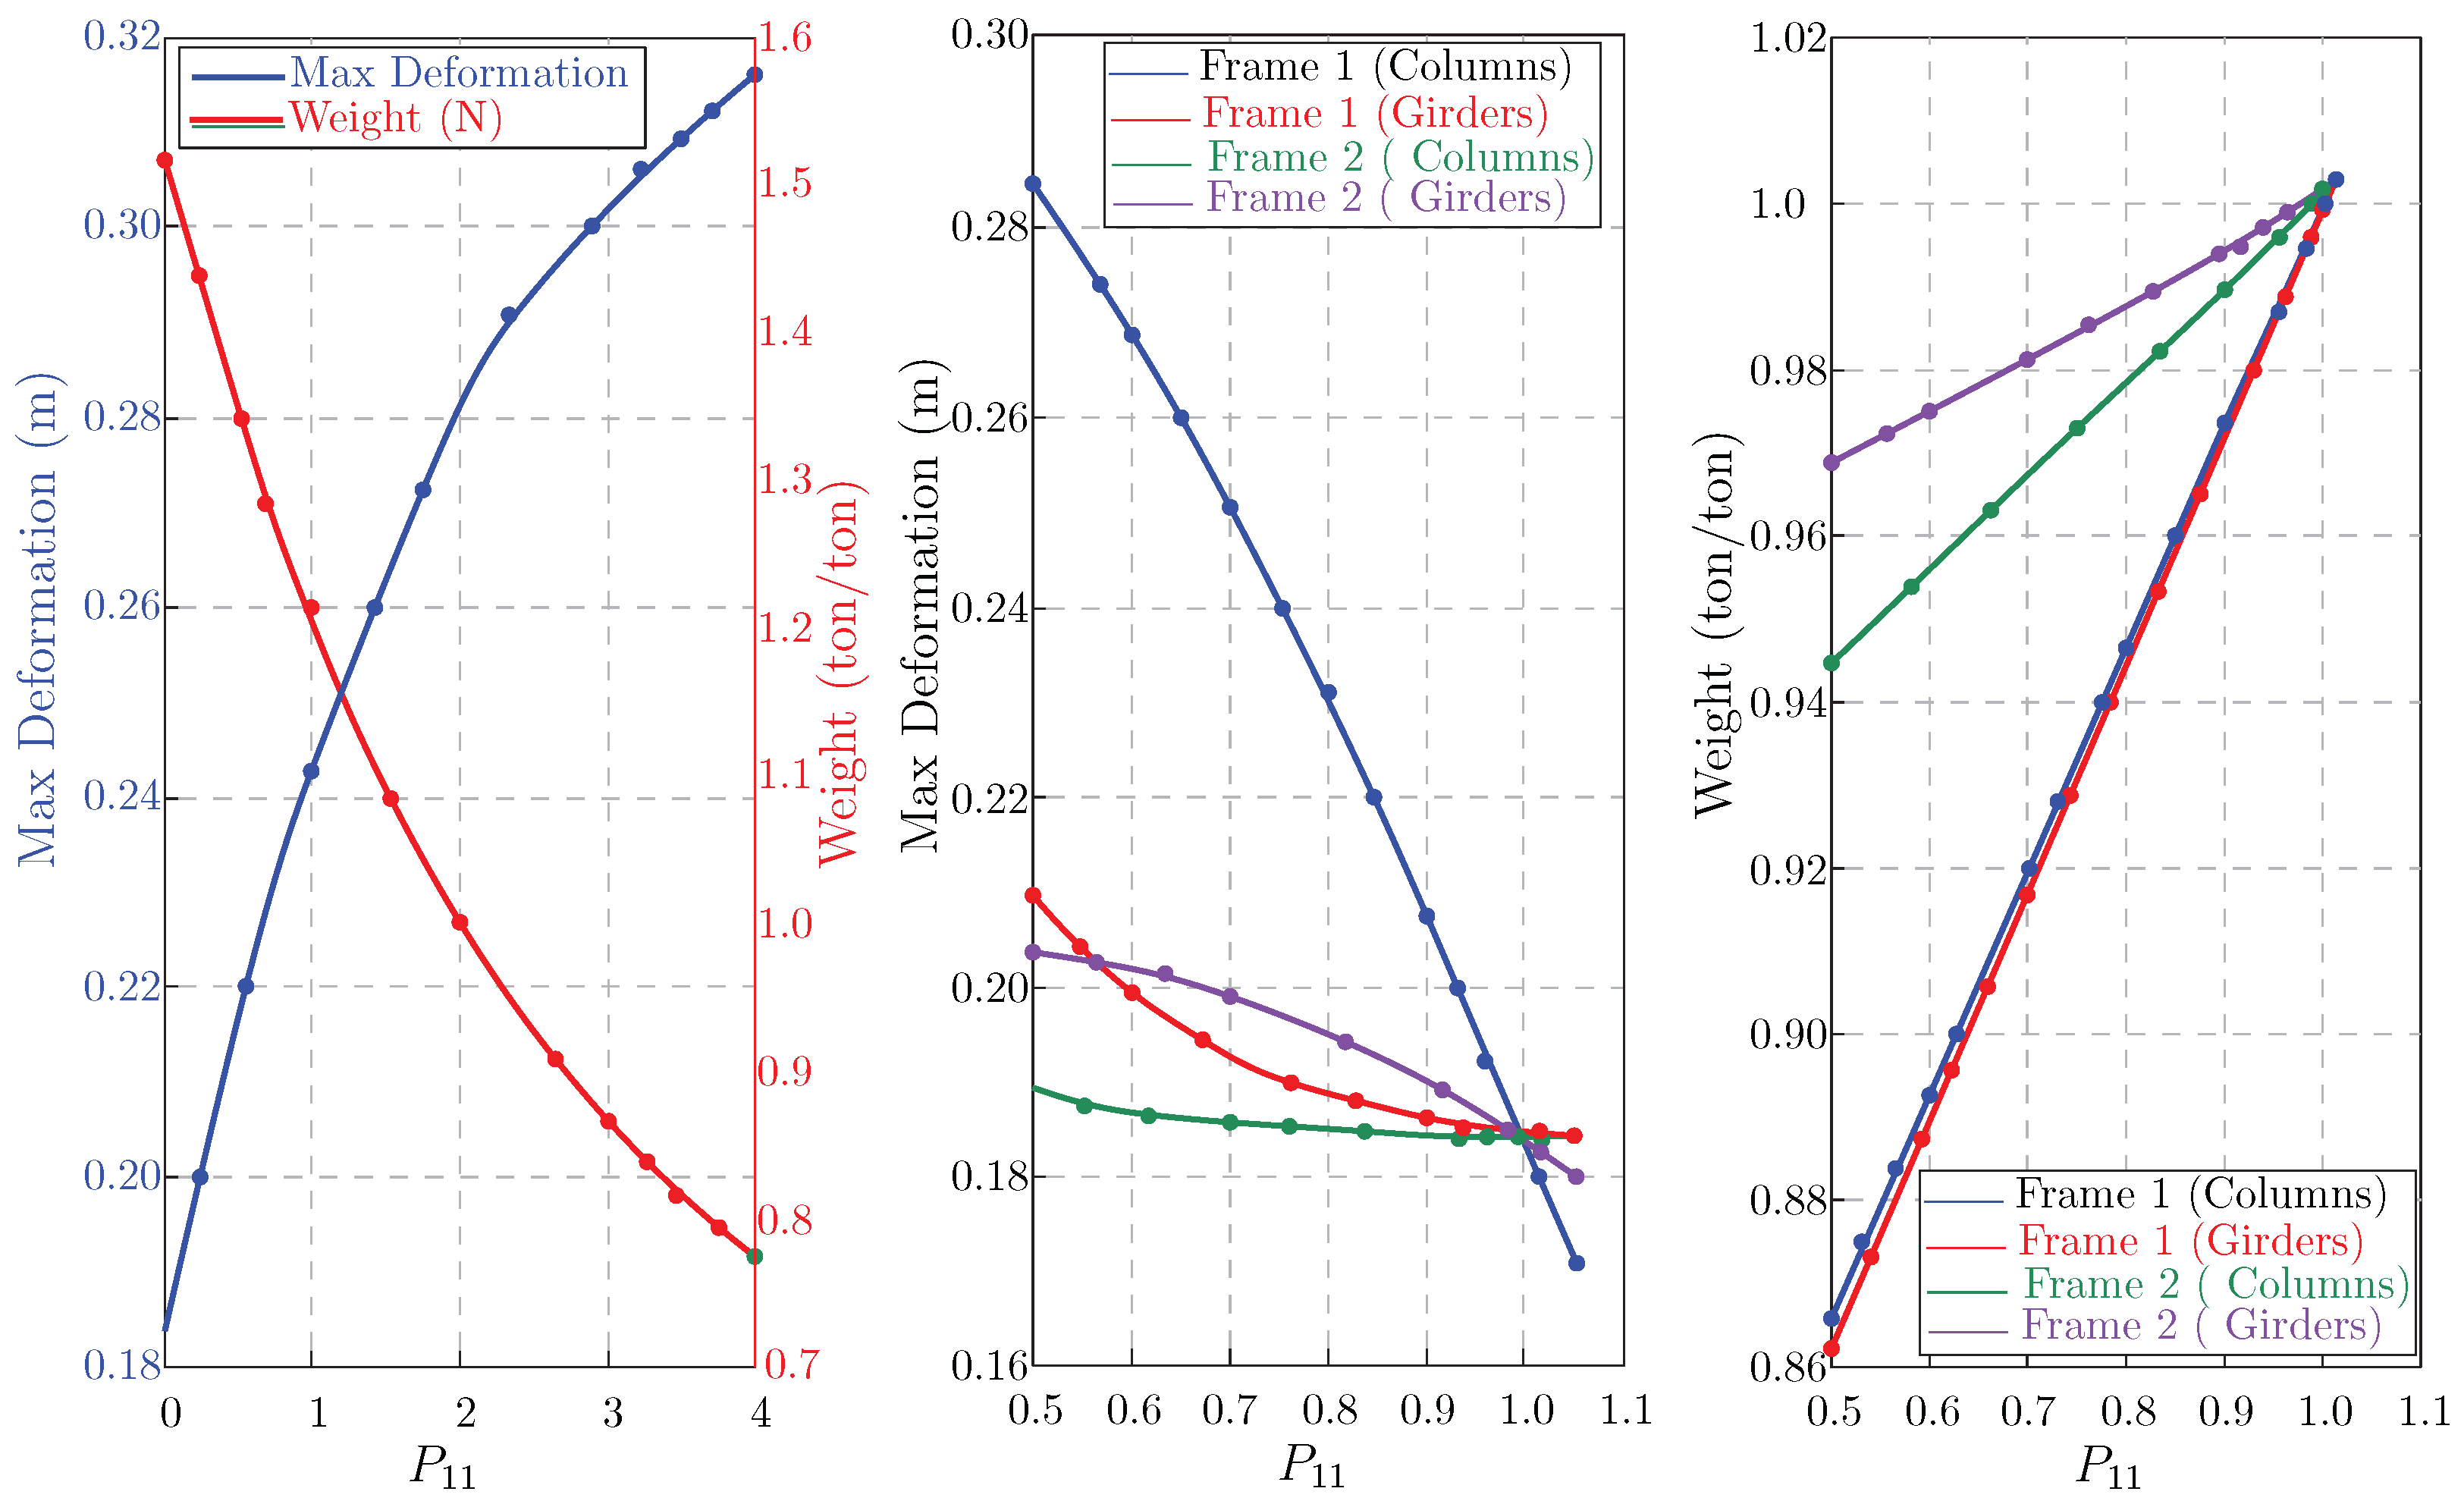
The main parameter in this section is , which is a damping factor for reducing the dimensions of the sections, including all the columns and girders on each floor. is not an independent factor, and, by percentage, reduces the initial dimensions of the sections on each floor from bottom to top. The relationship between and the second moment of inertia is critical. As is reduced stepwise, adjustments in the design parameters increase the moment of inertia across the building floors, reducing the stiffness of the structural components from bottom to top. This reduction influences the structure’s resistance to bending and shear forces.
The data (
Figure 11) illustrate the effects of the parameter
on key structural outcomes, specifically maximum deformation and weight across different building levels.
ranges from
, while, in the previous example,
, it was 0.
Maximum deformation decreases as decreases. For instance, deformation reduces from 0.316 m at to 0.184 m at , a significant reduction of 41.6%. Minimizing deformation is crucial for maintaining structural integrity and safety under severe loading conditions.
Conversely, the weight of the building elements shows a notable increase as decreases. This trade-off suggests that increasing optimizes the performance against the lateral forces, such as wind and seismic activity, used in the industry. Through iterative design, each adjustment optimizes the second moment of inertia, creating more resilience. Simultaneously, the stepwise adjustment of the second inertia module relatively influences each element’s stiffness and force absorptions.
The figure provides a comprehensive analysis of the influence of the six sections and two frame types (
), which should be considered in their stiffness, participation in carrying the forces, and weights.
Figure 11, displays how the changes in
(
) in the sections of each frame (
) influence the deformation and weights in the system.
Applying in column section Frame 1 causes deformation to reach 0.2835 m, while, for Frame 2, it is around 0.1891 m. For girders, the maximum deformation in Frame 1 is 0.2098 m, while, in Frame 2, it is 0.187 m. This highlights the importance of optimized column design in managing elastic deformation under load. By leveraging these insights, structural engineers can balance material efficiency and structural integrity across different frame configurations.
This analysis provides engineers with practical insight into which parameters—such as column width or girder size—most significantly influence weight and deformation. This understanding can inform better design decisions in the early stages of structural planning.
Up to this point, the focus has been on presenting the structural response trends and optimization outcomes. The next section reflects on how machine learning—specifically the ANFIS—supports the delegation and acceleration of these processes.
4.2. Application of Machine Learning
This research explores the use of machine learning techniques for the pre-design of multi-floor buildings. Two key subsets of machine learning are applied: the Adaptive Neuro-Fuzzy Inference System (ANFIS) and optimization algorithms, including metaheuristic methods, to identify the optimal solution for each PARS-Solution based on specific design targets.
4.2.1. Application of Adaptive Neuro-Fuzzy Inference System (ANFIS)
The ANFIS is an alternative to traditional calculations, providing outputs such as deformation and forces to show its ability to delegate engineering calculations. The parameters are varied one by one, and the results from the ANFIS, which is trained using a look-up table generated by the PARS-Solution, are compared to direct structural calculations.
- -
Parameter Study: The first step involves changing parameters individually to evaluate their influence on the accuracy of ANFIS predictions and calculating the average errors.
- -
Look-Up Table Size: The look-up table size is considered a key factor affecting ANFIS accuracy. Its influence is evaluated to determine the minimum size needed for reliable results.
- -
Multi-Parameter Study: The complexity of the ANFIS predictions is related to the number of varying input parameters (). Therefore, the accuracy of the results is assessed under different multi-parameter configurations to ensure robust performance in complex structural scenarios.
- -
Studying Random Inputs: In other sections, the training data collected in the look-up tables were sorted and mainly showed an increasing or decreasing trend. Hence, the evaluation of the ANFIS’s capacity to face the chaotic input in such a problem is studied.
The findings show that ANFIS accurately models complex structural behaviors, offering a fast, reliable alternative to costly computations for efficient design exploration.
4.2.2. Studying Parameter Influences
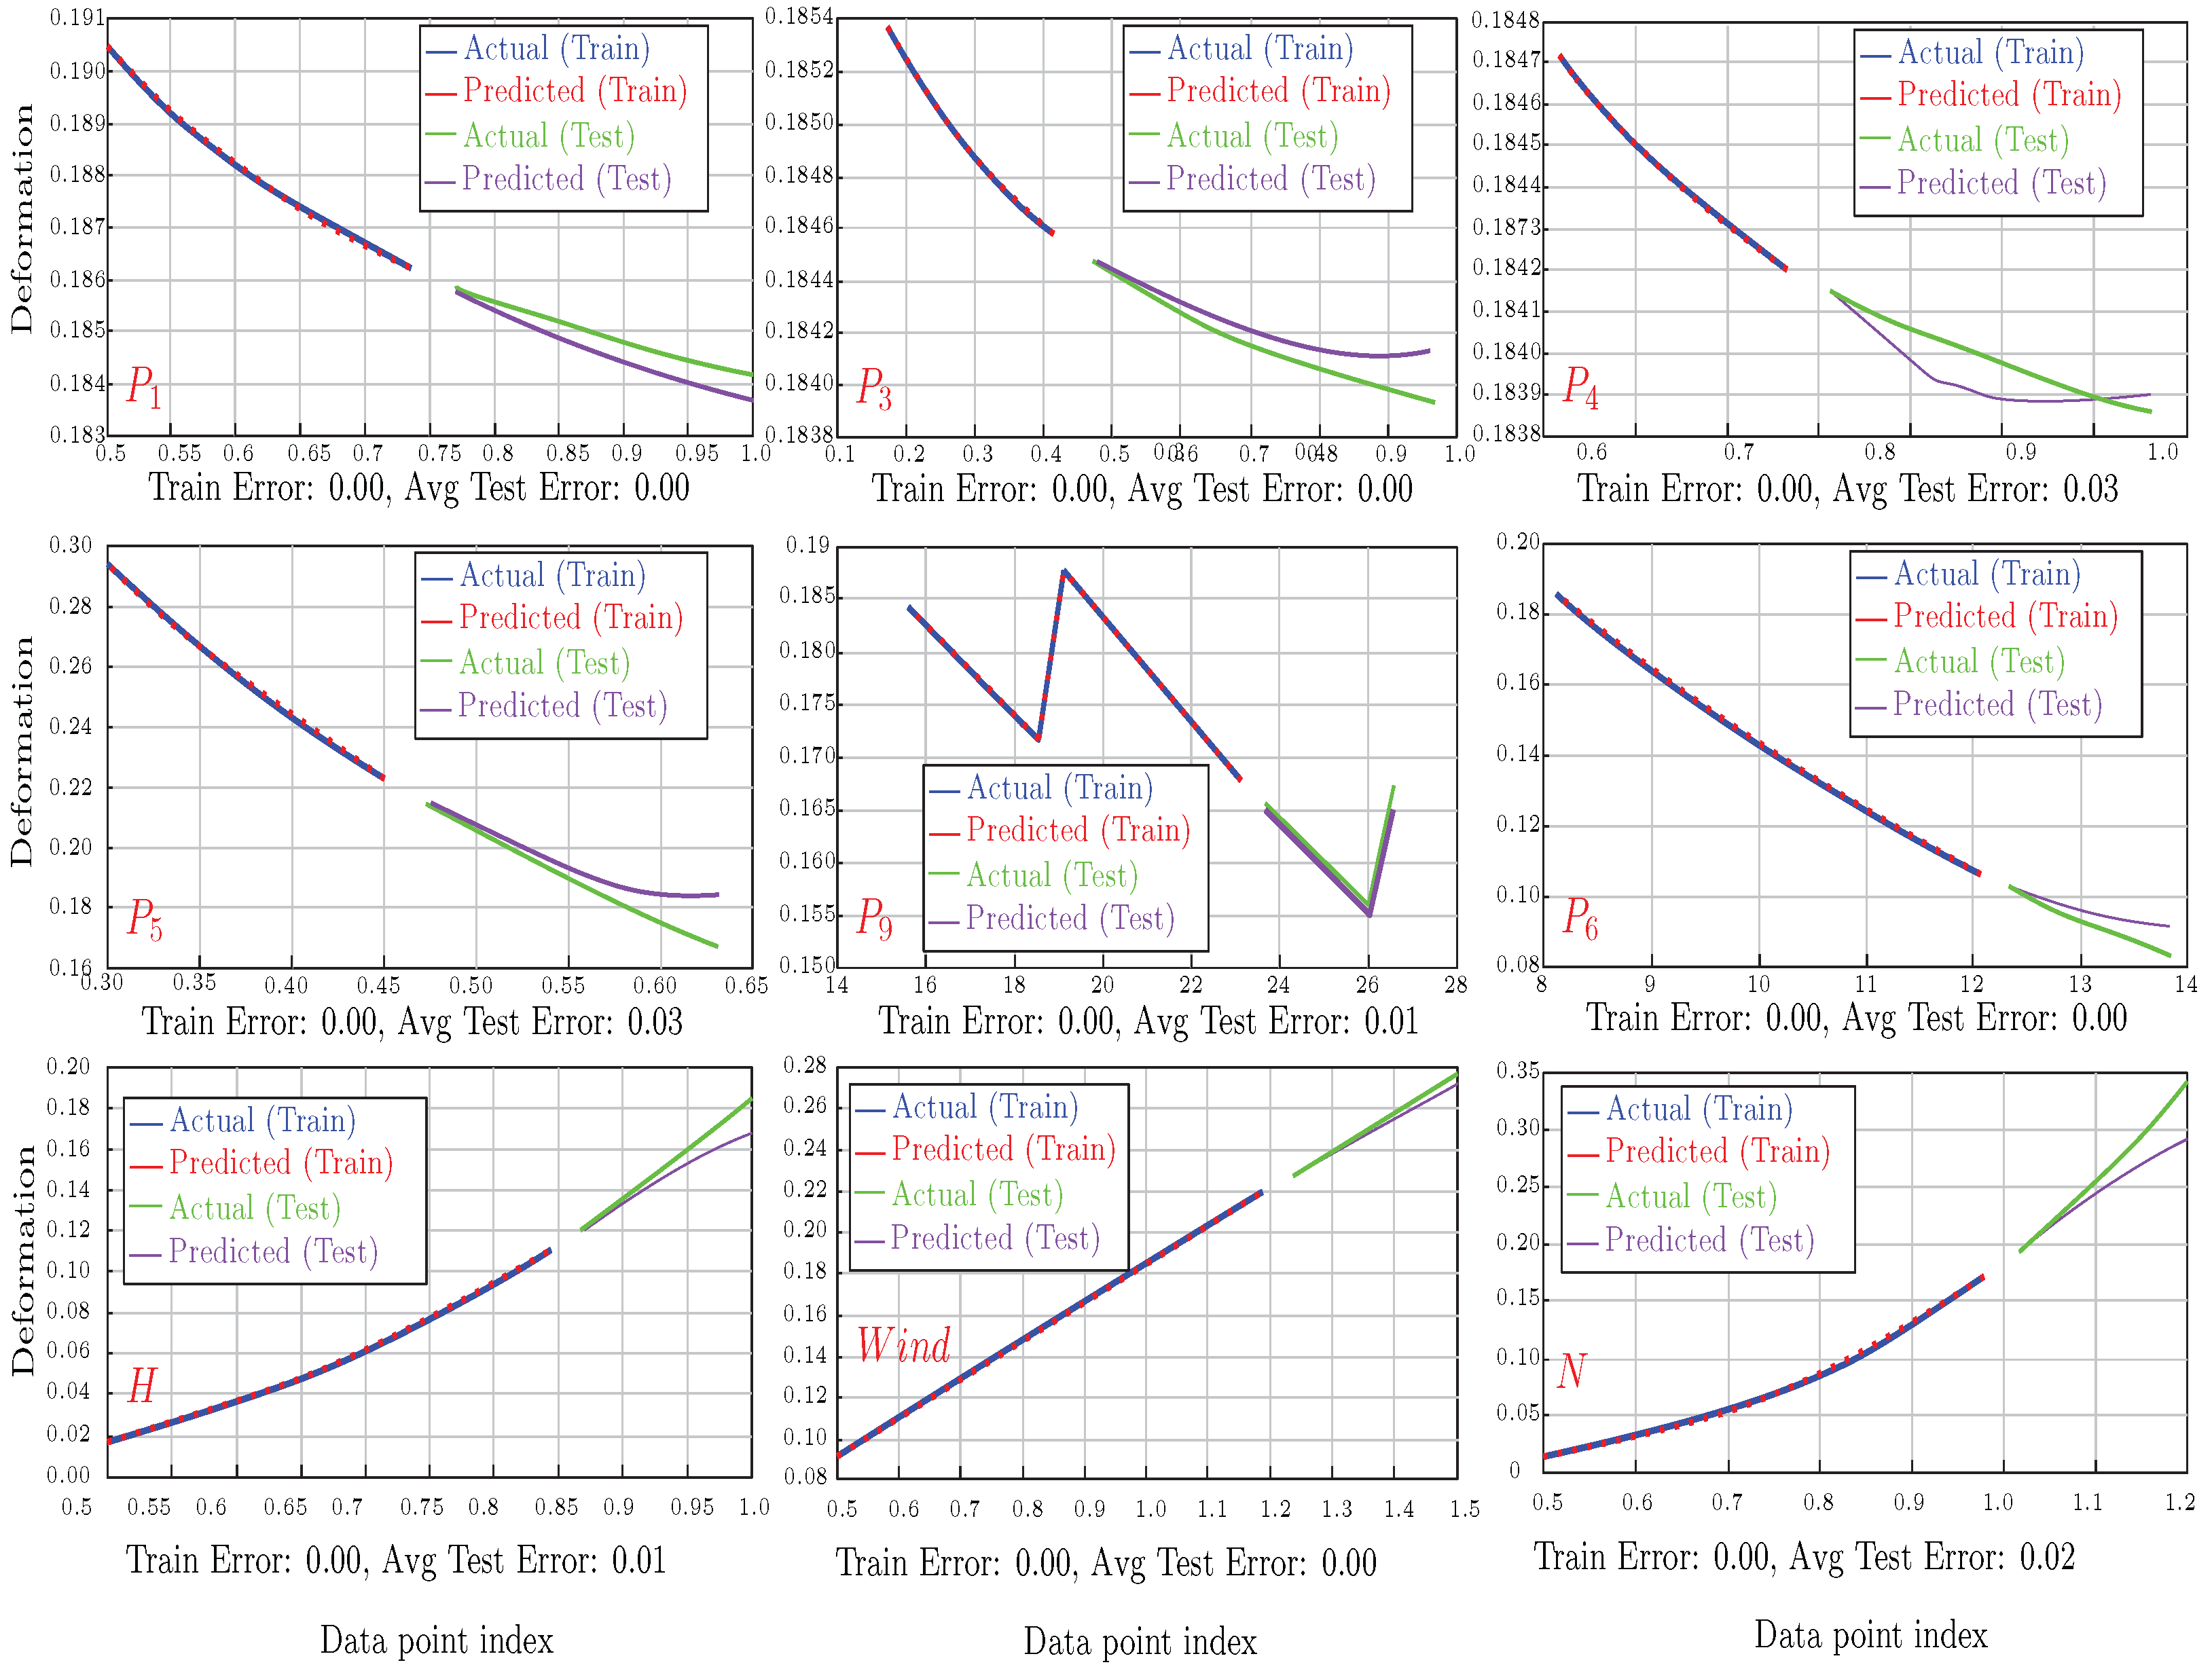
These evaluations changed the parameters individually, and deformation was selected as the output for the ANFIS. The assumptions were based on the verified example. This resulted in a look-up table with two columns and 20 rows for each parameter. Since the ANFIS training errors across parameters were almost zero, the study focuses on the testing error.
Figure 12 shows the performance of the ANFIS in predicting displacement while different prementioned parameters are changed one by one and compared to the ANFIS. The results indicate that the calculation of such a multi-floor building, as semi-large structural calculations, can be effectively delegated to the ANFIS. The evaluations for all the parameters demonstrated an average testing error of less than 2%, highlighting the reliability of this machine learning approach given the current look-up table size.
However, it is important to note that the original PARS-Solution has limitations due to its dependence on reference diagrams (). For example, when the range exceeds the available diagram data, ANFIS interpolations and predictions become less reliable. Significant errors were observed during a few runs due to unstable ANFIS performance but were mitigated by re-running the process.
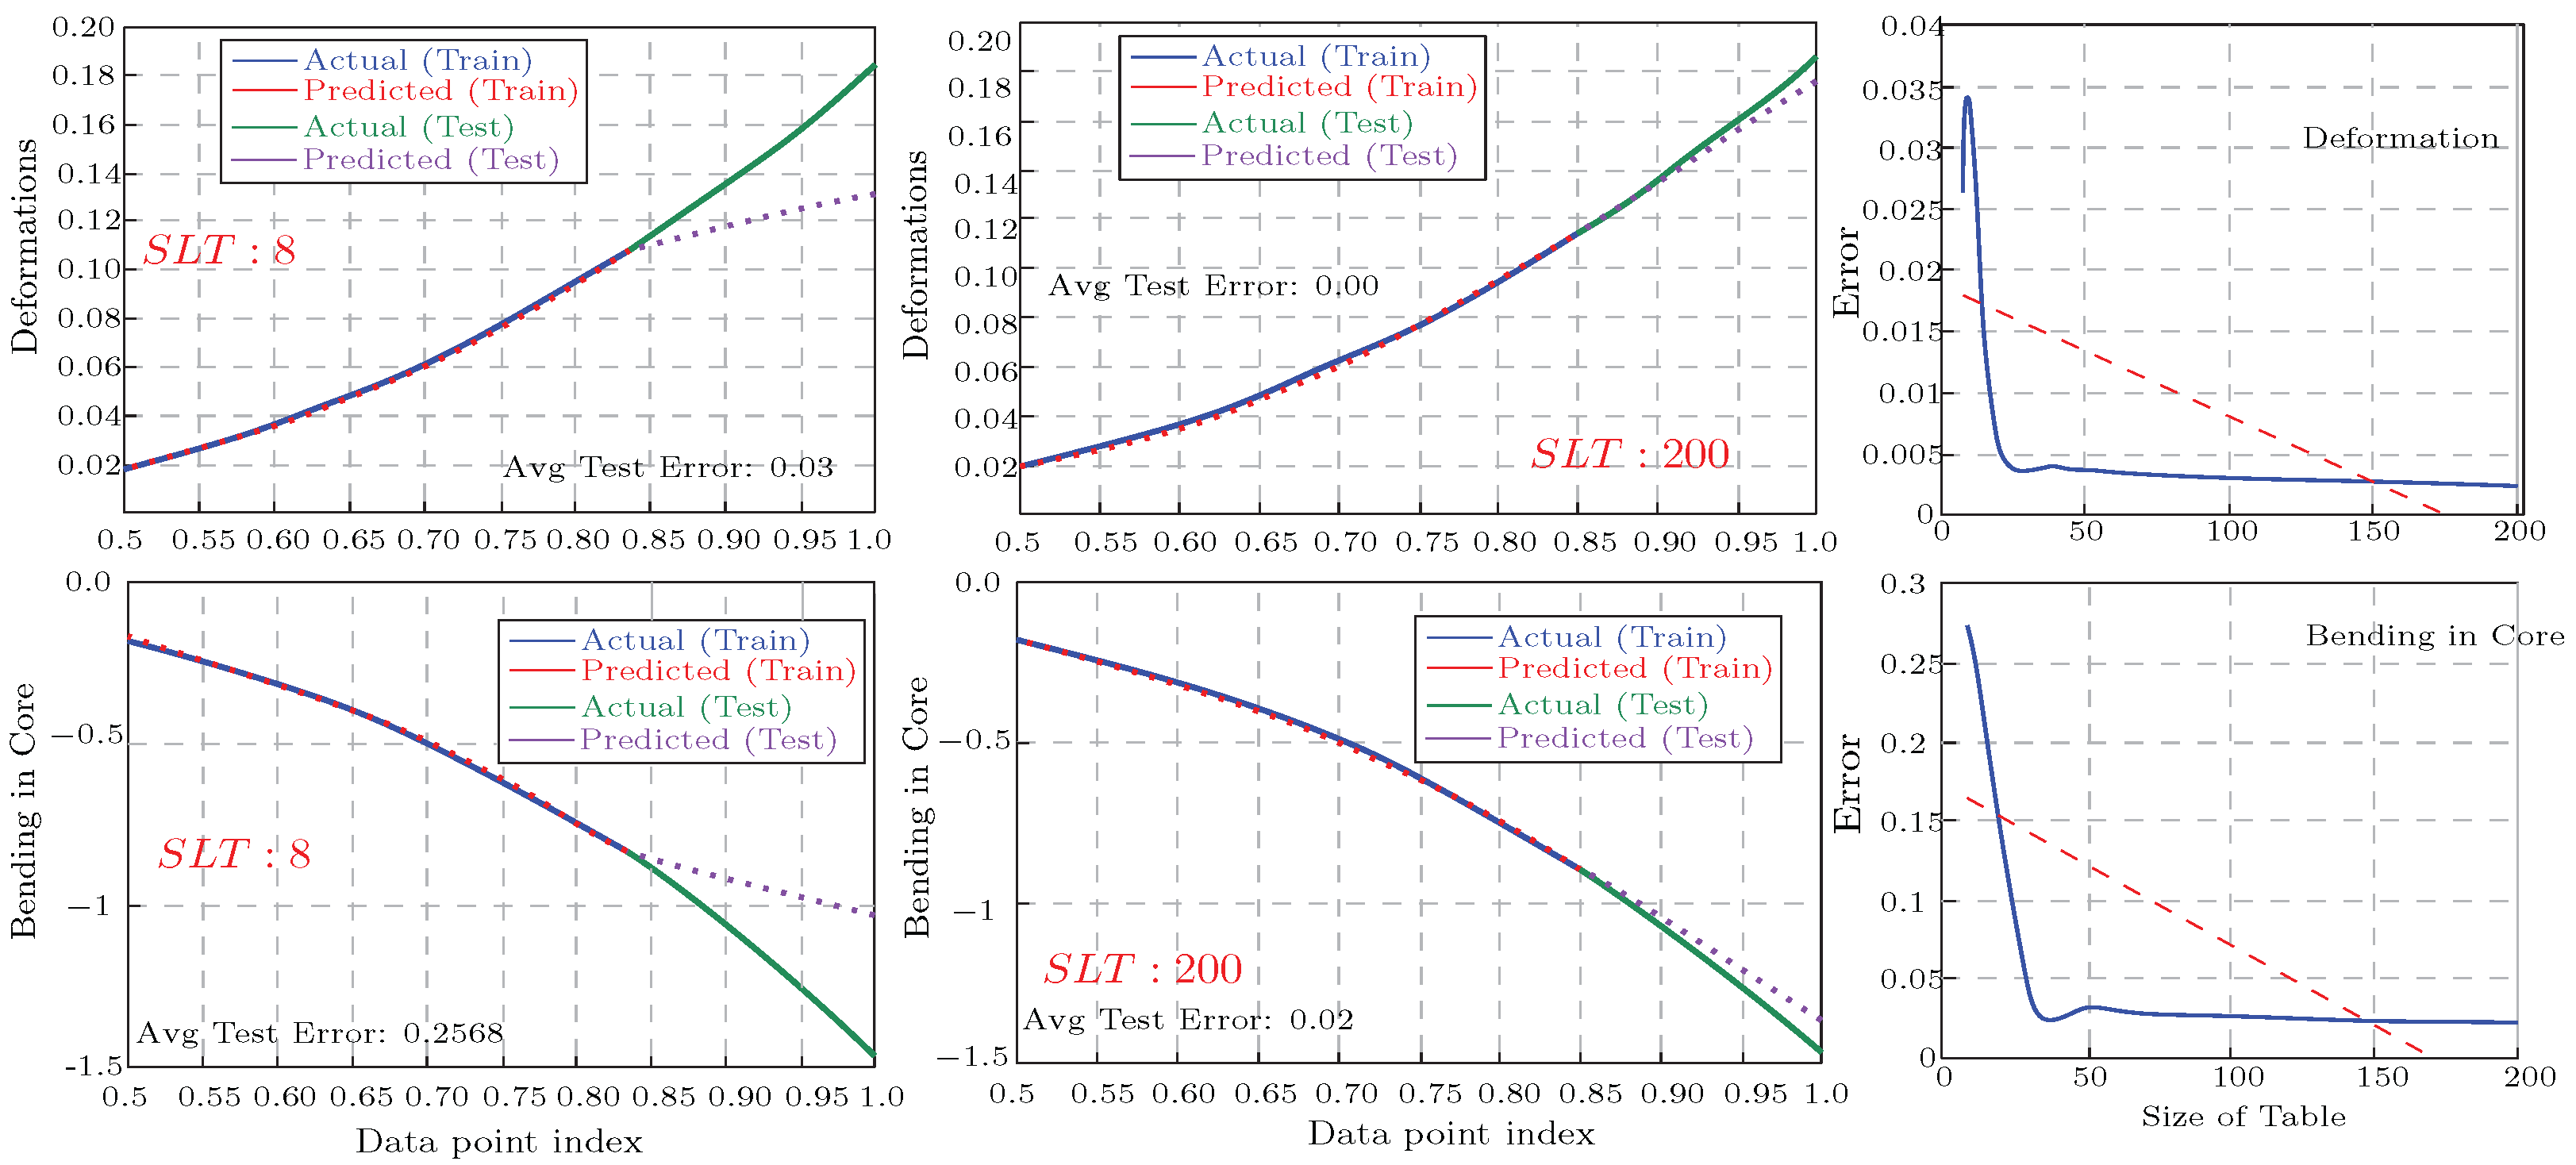
4.2.3. Studying the Size of the Look-Up Table
The initial evaluation was based on a look-up table with two columns and 20 rows, representing the range of changing parameters and deformation. This factor was parametrically studied due to the ANFIS’s dependence on the look-up table size, particularly in experimental studies. The number of floors was selected as a parameter, and tables of varying sizes (eight to three-hundred rows) were evaluated, with average errors collected.
Figure 13 shows the results of evaluations with 10 to 200 parameters and the influence of table size on accuracy.
The ANFIS’s performance for other outputs, including forces in walls and frames, showed similarly low training errors. However, the average error for the bending moment in the core () reached up to 5% when the look-up table size () was set to 20.
The influence of table size on accuracy is visible: as the size increased, the error decreased. For example, increasing the table size from 10 to 20 rows reduced the average error by 5.7 times. However, beyond 50 rows, further improvements were negligible (less than 0.1% improvement, even when the size increased to 300). This indicates that a look-up table with more than 50 rows is unnecessary for reliable ANFIS performance in this context.
Figure 13 also shows the results when
was used as the output target for the ANFIS. In this case,
showed lower accuracy among the outputs, especially when the look-up table size was reduced to right rows, where the error reached 27%. By increasing the table size to 50 rows, the error was reduced by 8.5 times to 3%.
Additionally, the computational cost of running different table sizes varied significantly. For example, a look-up table with 200 rows required 22.8 times the processing cost of a table with eight rows (414.54 vs. 18.13 s). The processing cost differed based on the selected output (e.g., deformation vs. bending).
These tests show that the ANFIS remains accurate even when input parameters vary randomly or in complex combinations. This robustness ensures the tool can be applied in realistic design environments where input variability is high.
4.2.4. Studying Multi-Parameters
After evaluating the ANFIS’s ability to delegate structural calculations with varying parameters and its sensitivity to the look-up table size (), its performance in handling multiple input parameters simultaneously (e.g., ) is analyzed. Structural outputs, including forces and deformations, are calculated individually by the ANFIS. The input parameters are sorted in the look-up table and interpolated by the ANFIS.
Figure 14 shows the accuracy of the ANFIS in predicting the bending moment in the frame on the top floor, considering four geometrical parameters
. Their values were normalized, and the look-up table size (
) was varied from 10 to 100 to assess the sensitivity to data availability. The first column evaluates
, the middle column evaluates
, and the right column considers
simultaneously. As the look-up table size increases from bottom to top, the ANFIS maintains high accuracy across all the cases. However, with an
of 10, the error increases to 17%, indicating the need for a larger table to achieve reliable accuracy.
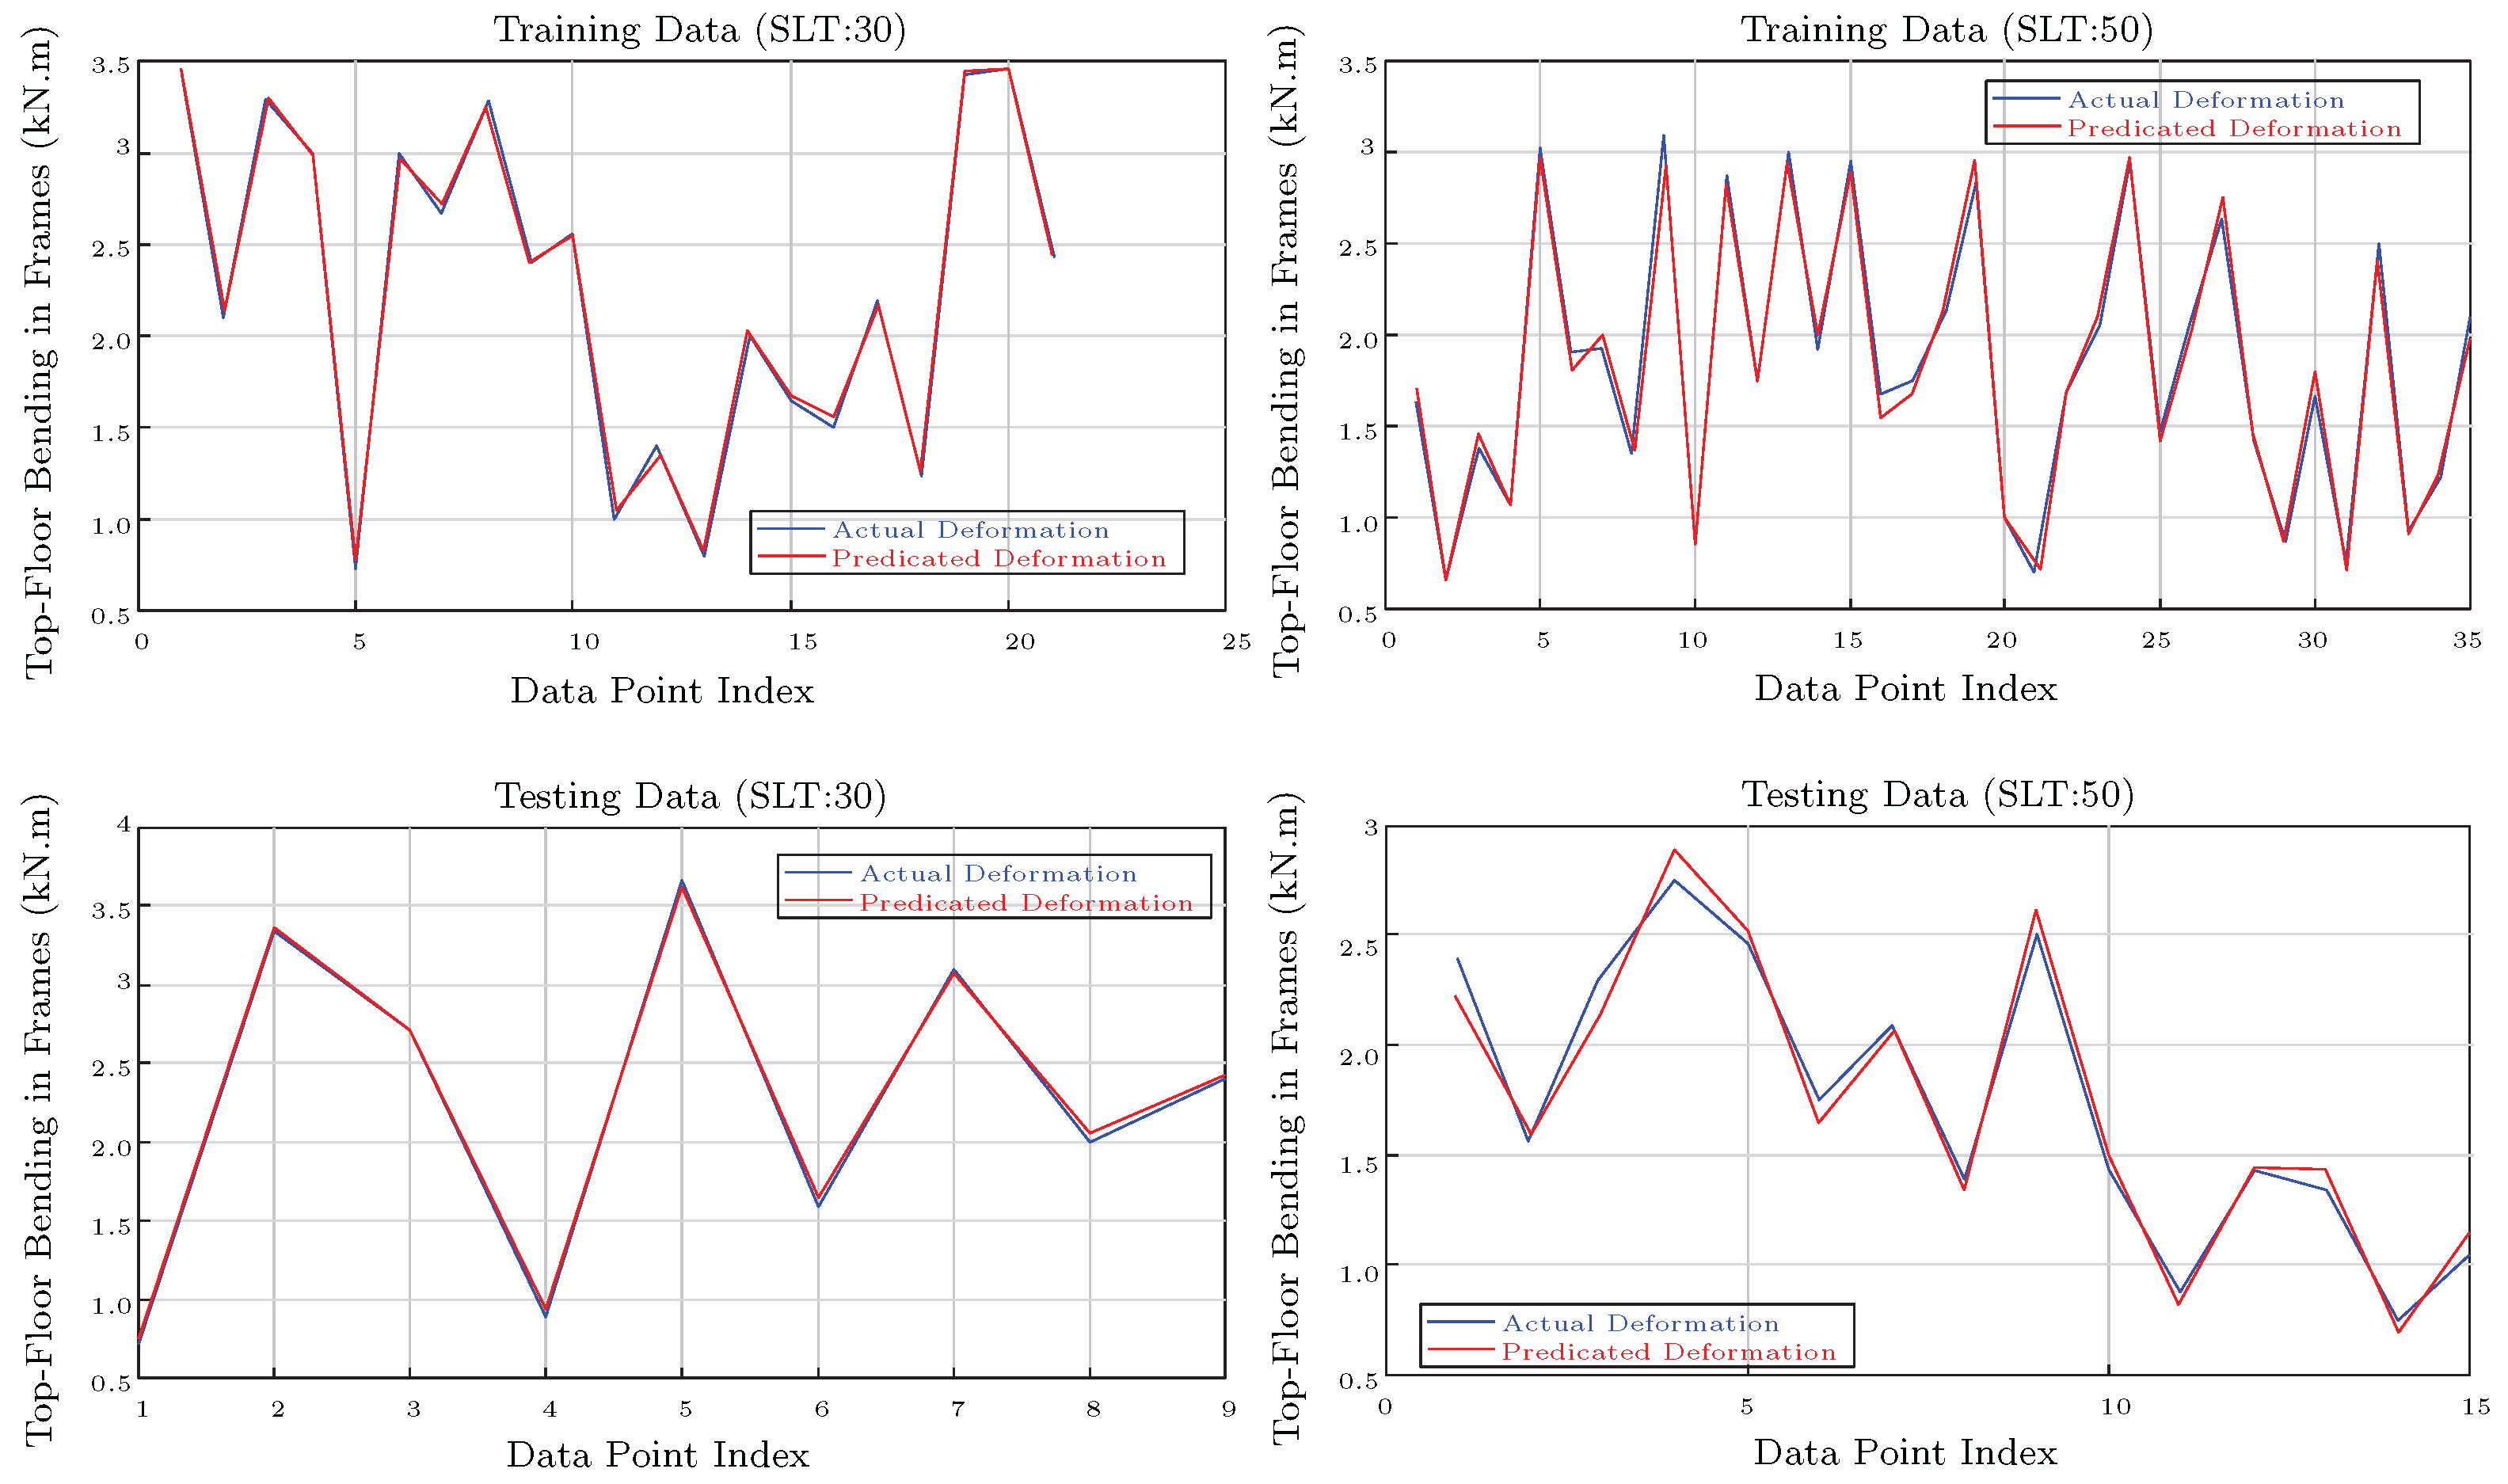
4.2.5. Studying Random Inputs
All the evaluated parameters showed an increasing trend, and the ANFIS demonstrated reliable performance. The final test involves varying the trends dynamically and introducing random parameter values.
Figure 15 displays the bending moment on the top floor when the wind force was randomly varied. The study examined 30 buildings with similar properties to the validated example, using an
of 30. In the left diagrams, wind force and floor height were randomly increased or decreased, with the
increased to 50 due to the complexity. In both cases, the average error remained low (below 2%), confirming the ANFIS’s ability to handle dynamic, chaotic inputs reliably.
This evaluation confirms the ANFIS’s suitability for replacing multi-step structural calculations in high-rise buildings. It effectively handles a variety of outputs and inputs, even with dynamically changing and chaotic input trends. The ANFIS provides precise predictions of deformation and forces, demonstrating its potential as a reliable tool for structural engineers.
These findings confirm that an ANFIS can reliably approximate complex structural behaviors, making it a powerful surrogate model for time-consuming calculations. This enables designers to rapidly explore design options without sacrificing accuracy.
Having interpreted the predictive capabilities of ANFISs, this section now discusses the practical use of optimization algorithms, including MOPSO, in achieving balanced structural performance through multi-objective solutions.
4.3. Application of Optimization Algorithm
Optimization plays a crucial role in structural design, although its practical application often faces challenges due to the complexity of achieving optimal designs. This section evaluates the capability of optimization algorithms in selecting optimal parameters. Due to the large number of design variables and the difficulty in visualizing multi-parameter optimization, a limited number of parameters were selected for each optimization run. Additionally, multi-objective optimization algorithms were applied to pair parameters, resulting in Pareto fronts for all the optimization cases.
One common optimization target in structural engineering is the simultaneous minimization of material costs and maximization of structural stiffness (e.g., strain energy reduction). Likewise, this study selected weight and deformation at the top floor as optimization objectives. The PARS-Solution framework was used for these optimizations, but, to accelerate the process, the coded loop for calculating forces and deformations on each floor was replaced by directly addressing the specific output at each floor level ().
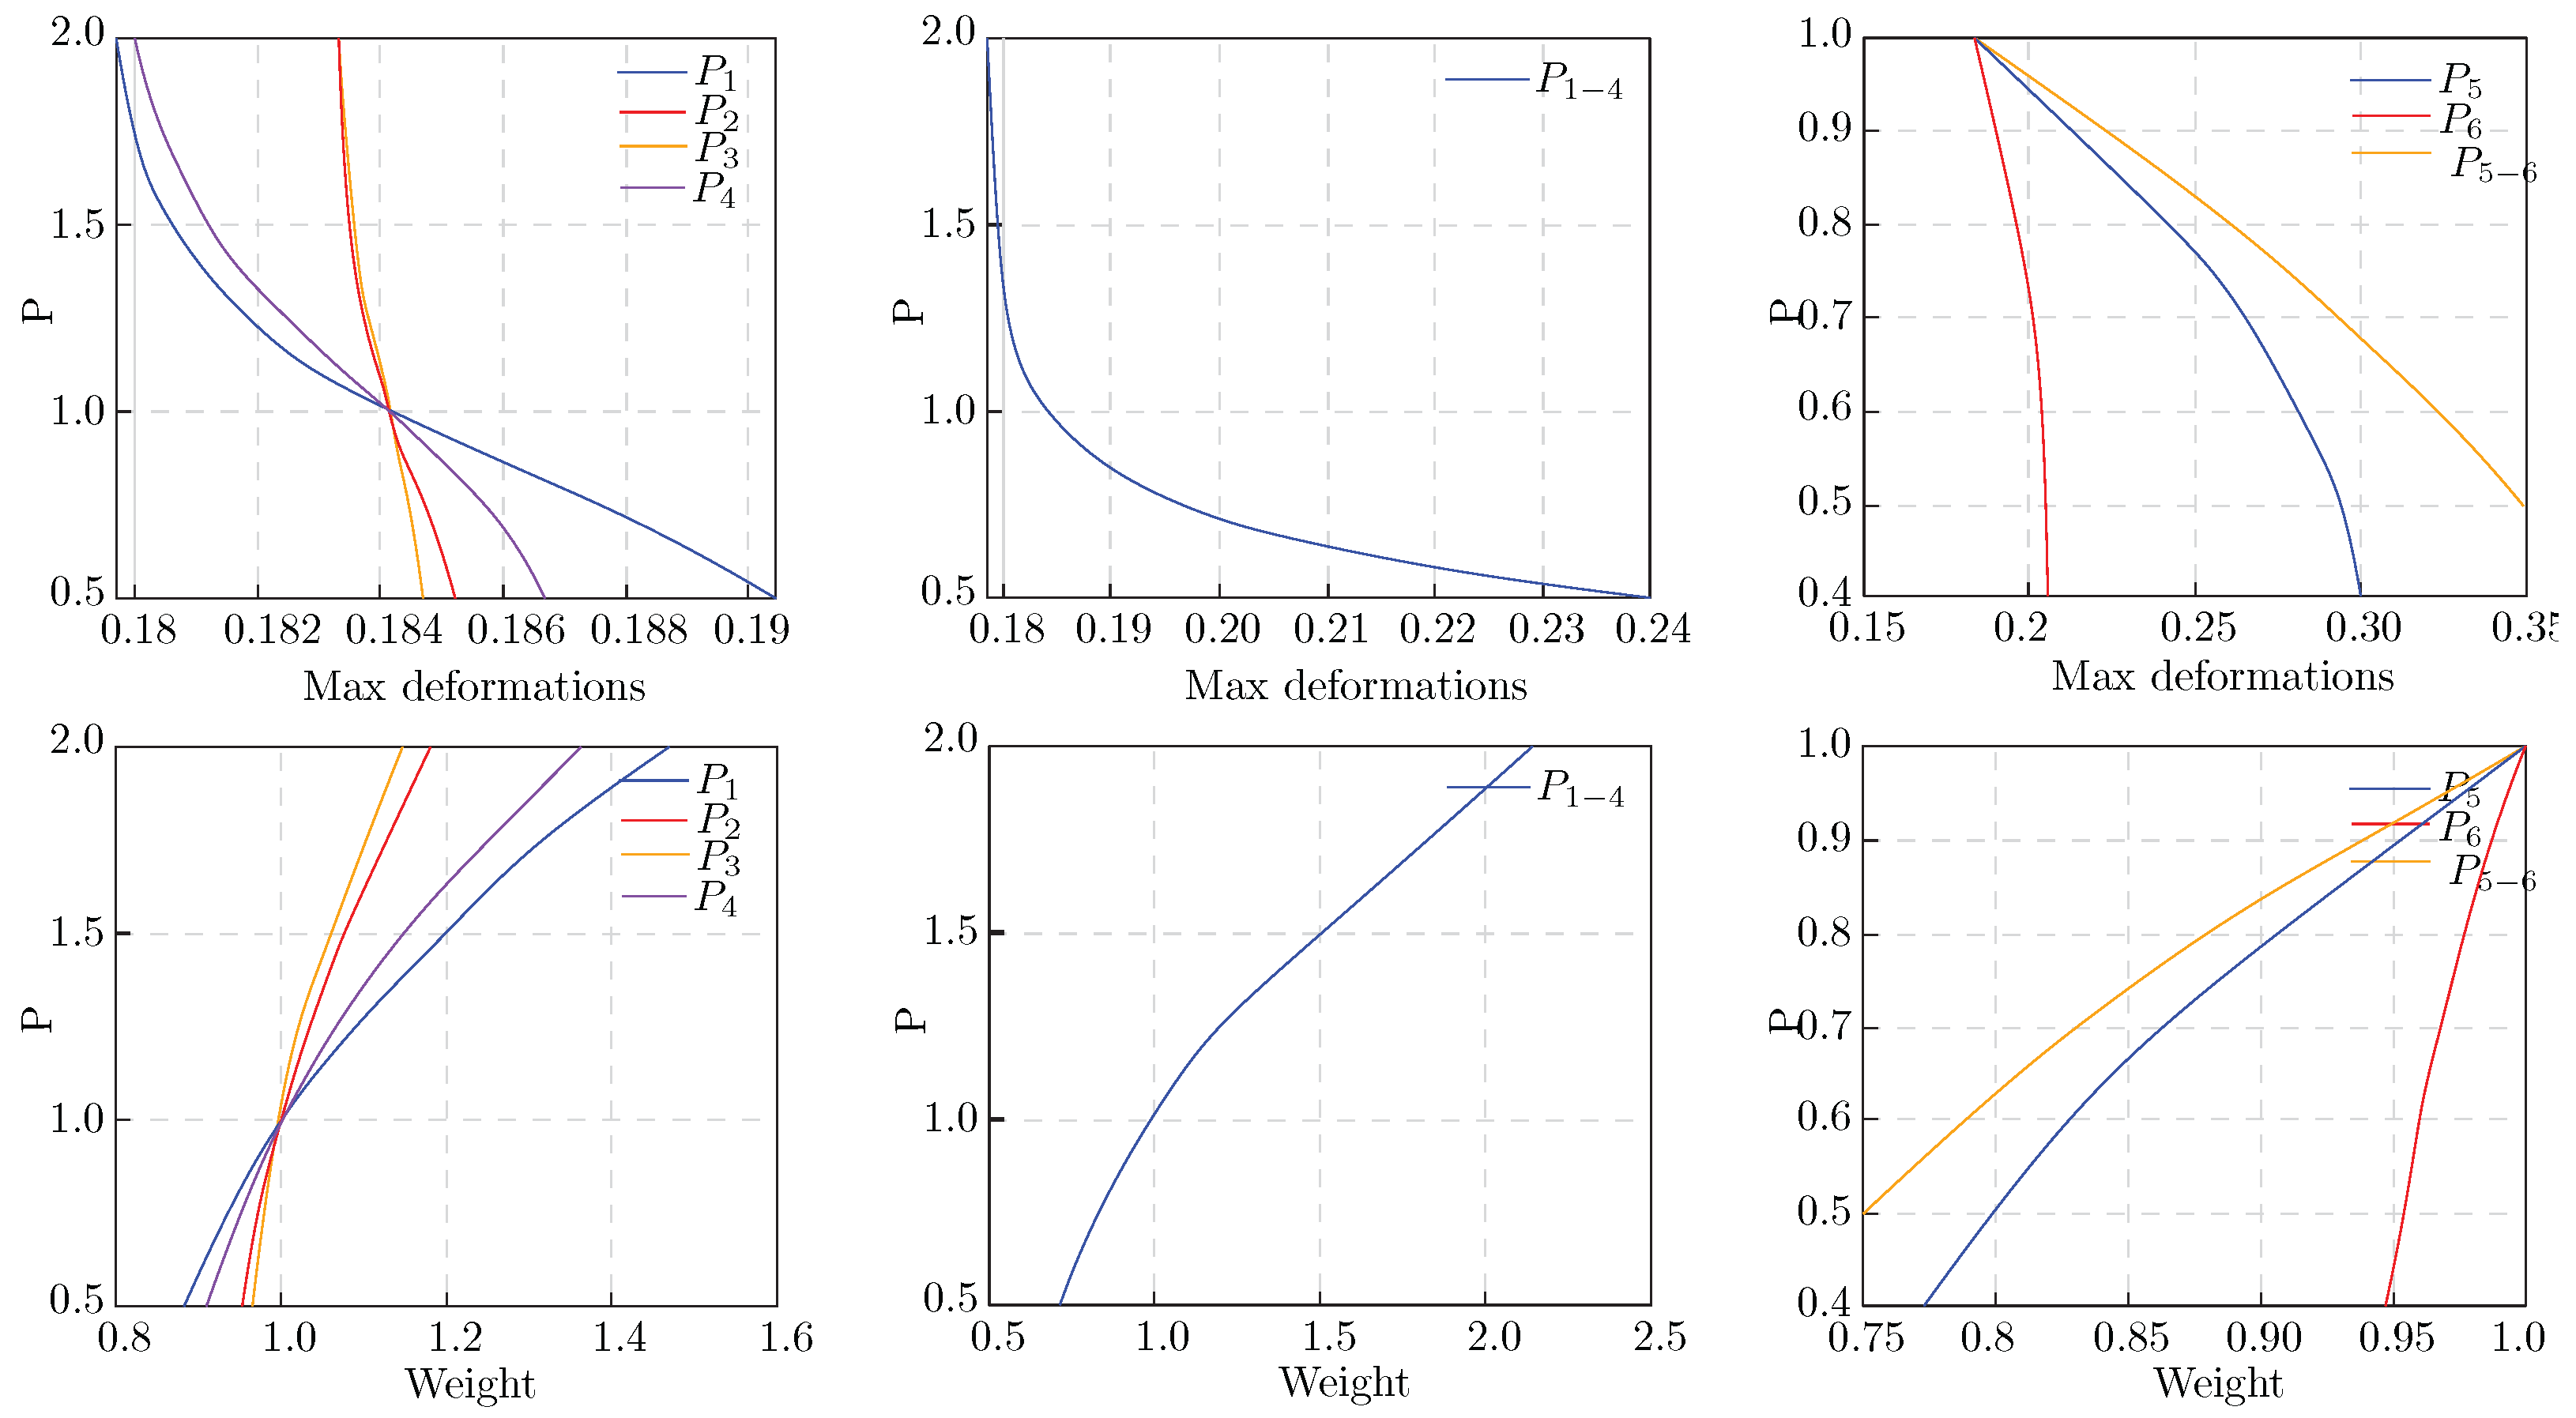
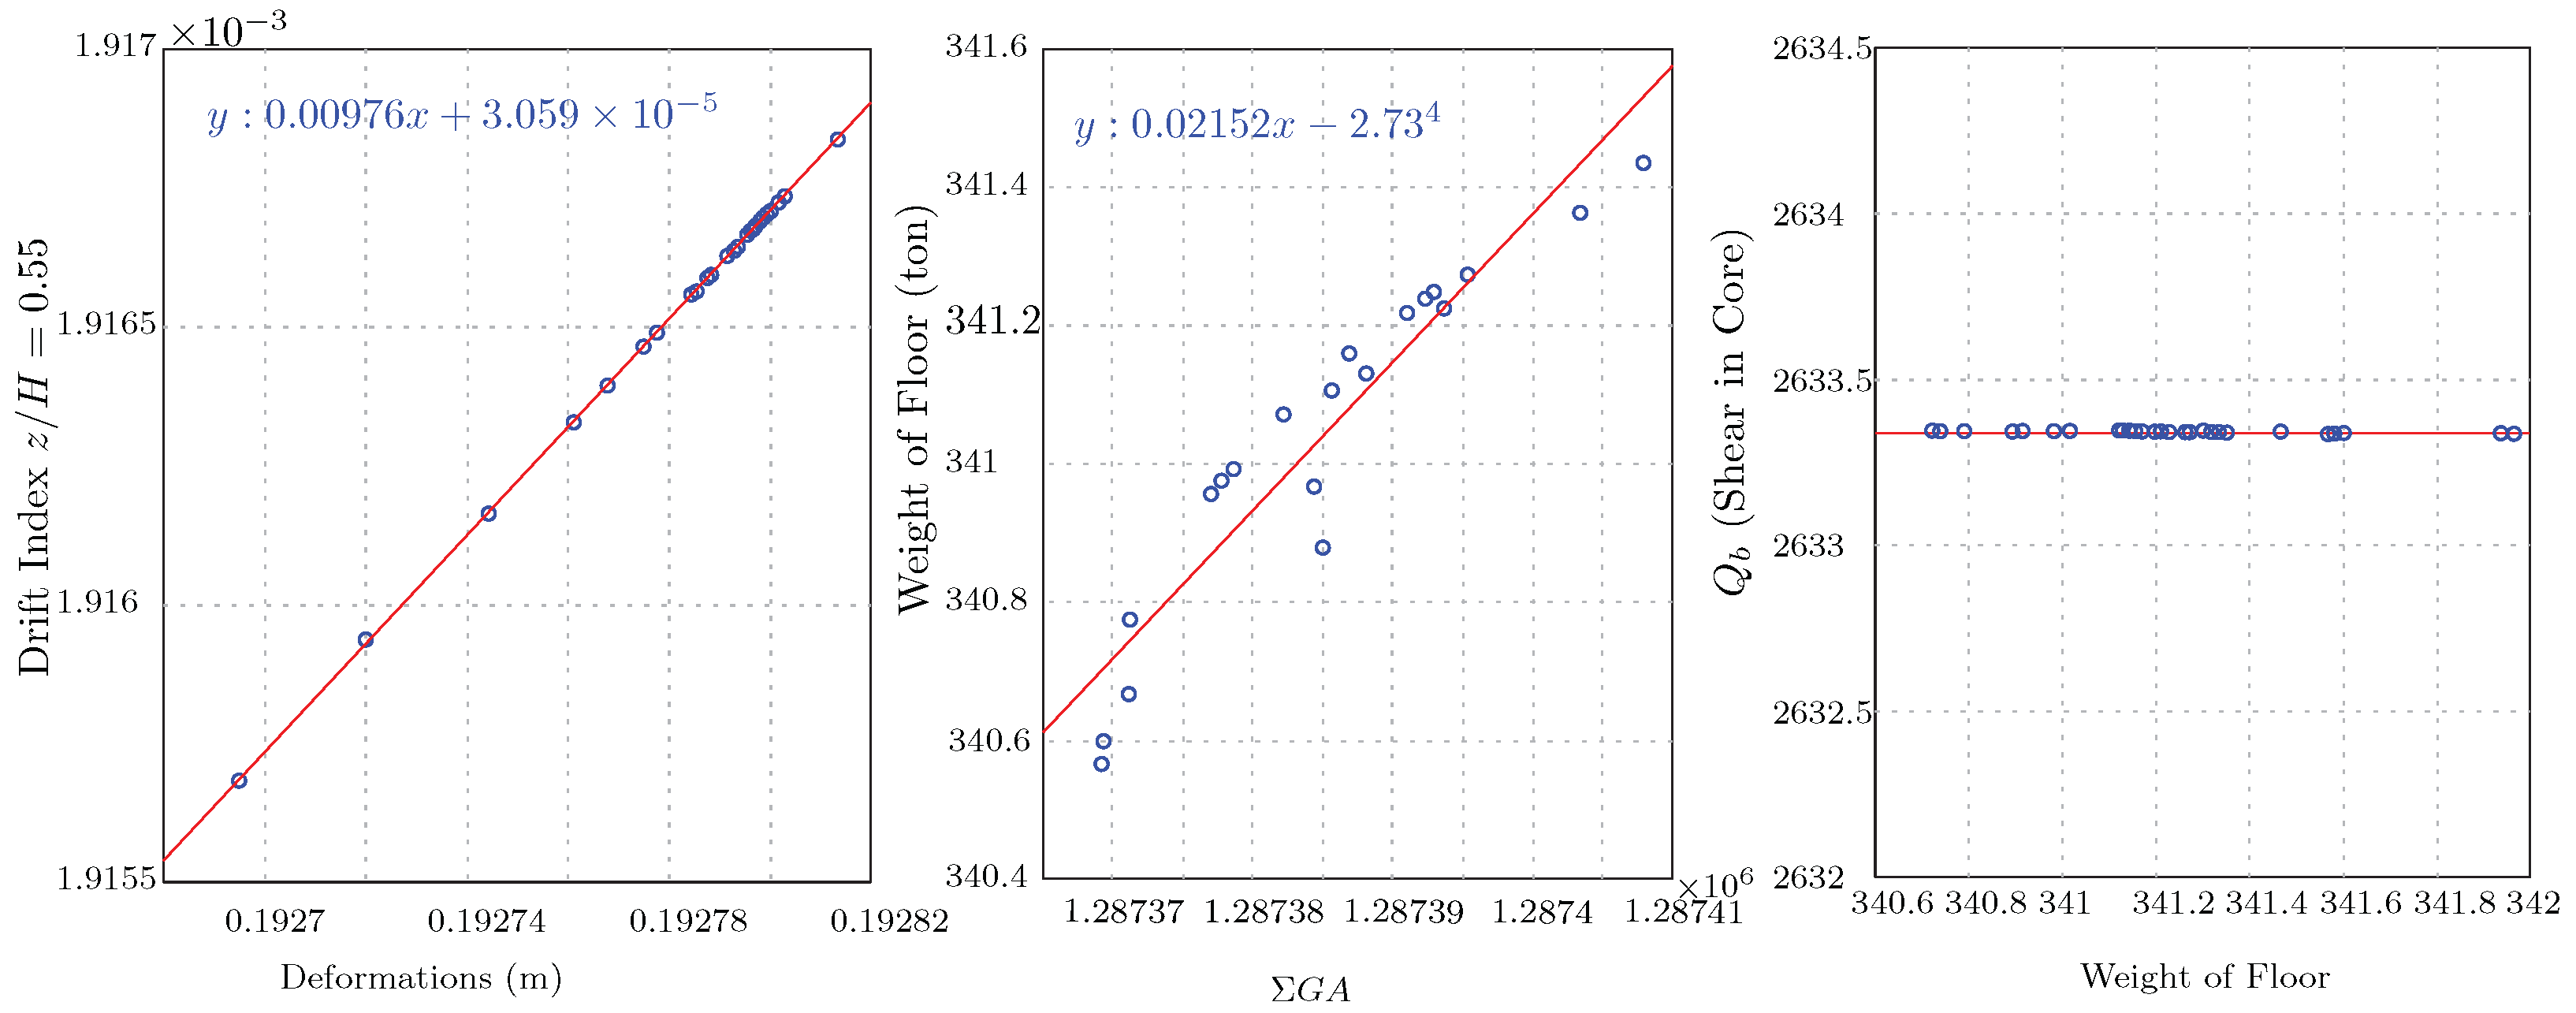
4.3.1. Linear Pareto Fronts
In weight and deformation optimizations, reducing one typically increases the other. However, some parameters, such as deformation and force amounts, exhibit direct relationships.
Figure 16-left shows a Pareto front obtained by optimizing the maximum deformation (
) and the drift index (
) using the column dimensions
and
as design variables. The objective is to control deformation and drift while achieving structural efficiency.
The regression analysis follows a linear relationship , where is the drift index, and is the maximum deformation. This linear relationship indicates direct proportionality between maximum deformation and the drift index, meaning that parameter adjustments in and have a predictable impact on both deformation and drift. From an optimization perspective, this simplifies decision-making as tuning and directly improves both targets. However, reducing deformation excessively could limit the feasible solutions due to drift constraints, highlighting the need to balance both objectives for efficient and feasible designs.
Similarly,
Figure 16-mid examines the relationship between floor weight (WeightFloor) and core shear force (
). The regression analysis yields
, in which
y is the core shear force (
) and
x is the floor weight.
The near-zero slope of the regression (
) indicates that variations in floor weight have almost no effect on the core shear force, which remains around 2633 kN (
Figure 16-right). This suggests that other parameters, such as core wall dimensions, stiffness, and lateral bracing, influence core shear force. From an optimization standpoint, engineers should focus on these structural factors rather than floor weight when addressing core shear distribution in static load applications. Additionally, parameters like
(shear in the core) and
(total shear in frames), which have fixed summations, cannot form a Pareto front. This highlights the need to focus on more variable design parameters for meaningful multi-objective optimizations.
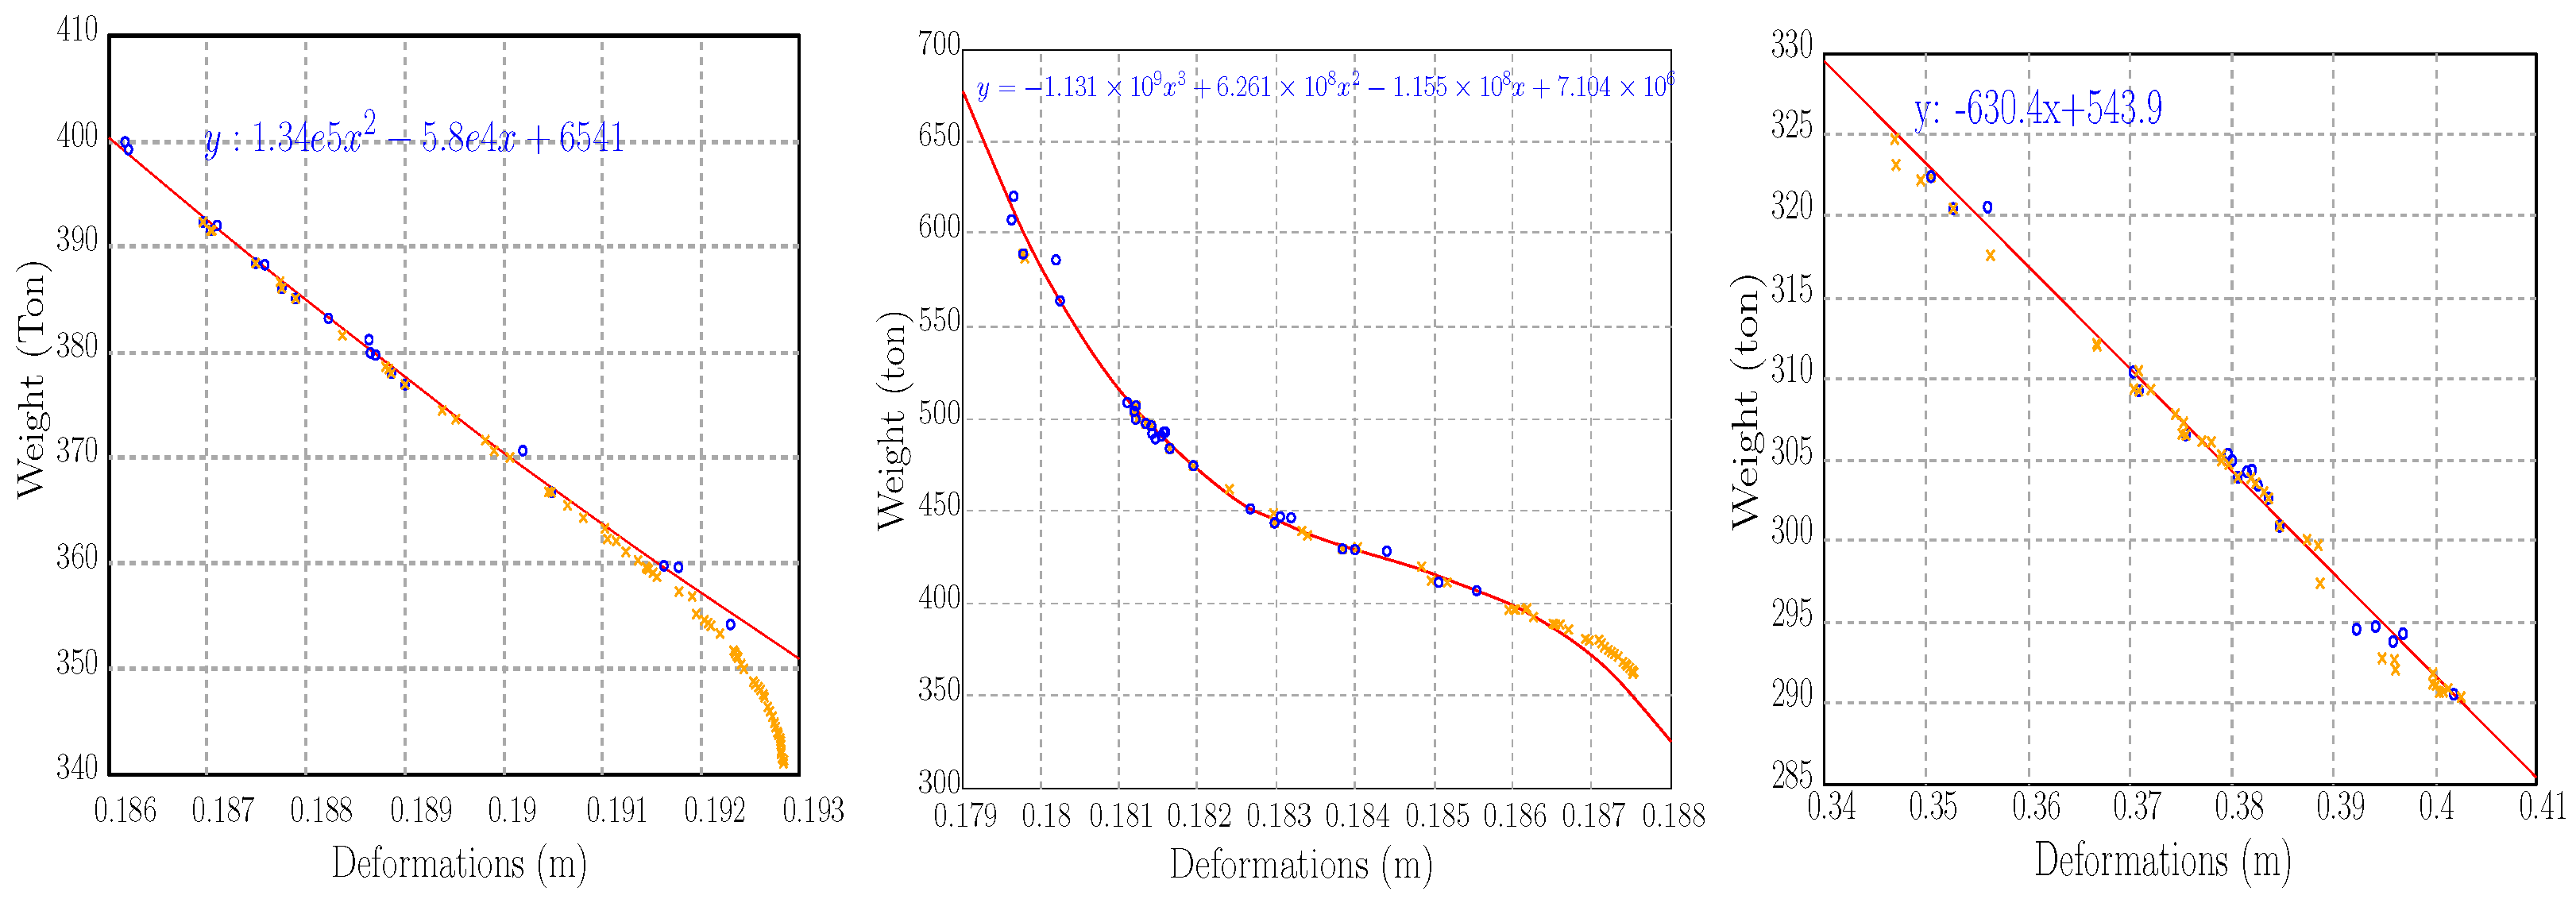
4.3.2. Nonlinear Pareto Fronts
Figure 17-left displays the results of an optimization study focused on minimizing weight while maintaining stiffness. The optimization considers the dimensions of the mid-columns in Frame 1 (
) and Frame 2 (
) as parameters to achieve weight reduction without compromising structural stiffness. In these diagrams, black circles represent the population of possible solutions, red asterisks denote the selected solutions on the Pareto front, and a blue regression line fits the quadratic model. The regression analysis yields a quadratic relationship,
, where
y represents the weight of the structure, and
x is related to deformation.
The quadratic equation shows that, in these optimized parameters, weight decreases initially as deformation increases, but, beyond a certain point, the reduction rate slows down. This indicates a nonlinear trade-off, where reducing weight can lead to diminishing returns in stiffness. Nonetheless, the main optimum population trends indicate a linear relation.
Figure 17-mid shows a Pareto front obtained by optimizing the dimensions of corner beams (
) and side beams (
). The goal is to balance weight reduction and stiffness. The regression analysis follows a cubic trend,
.
The cubic regression highlights a more complex relationship compared to the quadratic case. Initially, weight decreases as deformation increases, but, beyond a certain point, the trend changes, indicating an inflection point where weight savings diminish. The higher-degree regression provides a better fit and suggests the need for careful parameter selection to balance weight reduction with stiffness.
Figure 17-right represents a Pareto front obtained by optimizing the dimensions of side girders (
) and mid-girders (
). The objective is to find a trade-off between weight reduction and stiffness. The regression analysis yields a linear relationship, (
).
These equations in the example show the optimum relation between the parameters. Unlike the previous cases, the linear regression indicates a direct proportionality between weight and deformation. As deformation increases, weight decreases at a nearly constant rate, suggesting that optimizing and has a predictable impact on weight reduction. The simplicity of the relationship implies fewer trade-offs, making the optimization process more straightforward. The linear fit’s strong correlation highlights this parameter combination’s efficiency.
4.3.3. Increasing Number of Parameters
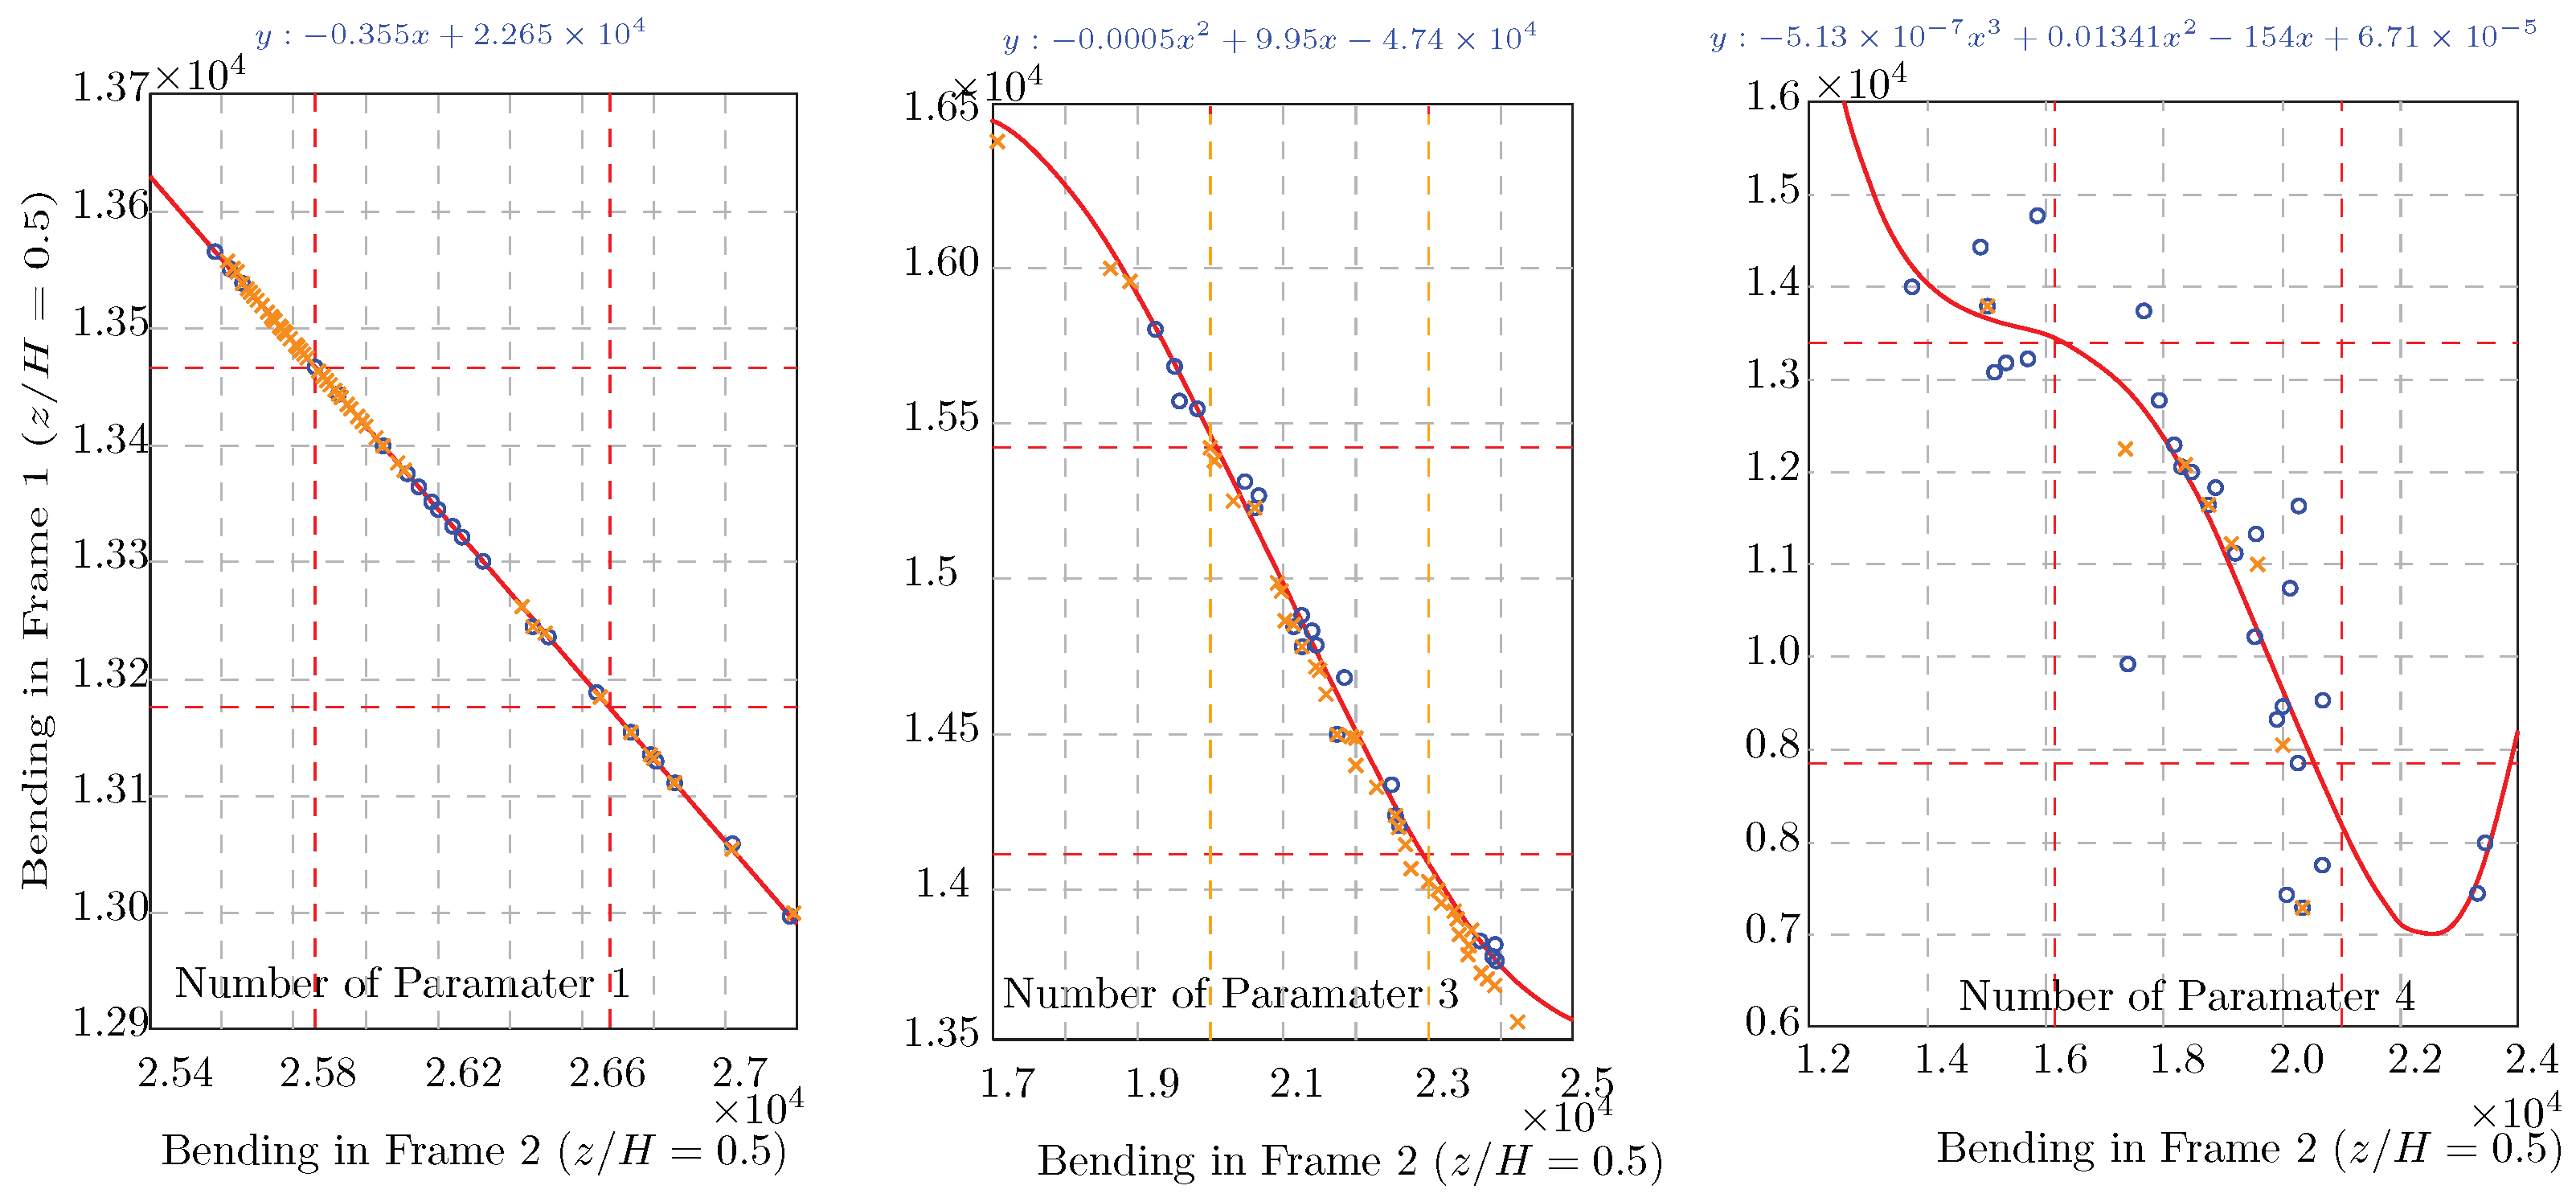
In the previous sections, two variables (e.g., ) were selected as optimization parameters. This section extends the analysis to three and four parameters, demonstrating how increasing the number of parameters affects the complexity of bending behavior in structural frames.
The diagrams illustrate the bending in frames at
as the number of optimization parameters increases, with a single parameter,
, resulting in a linear trend, and three parameters (
) introduce a nonlinear relationship, requiring polynomial regression. Moreover, four parameters (
) result in a more complex trend, requiring a fourth-degree polynomial regression (
Figure 18).
- -
When the number of parameters exceeds three, identifying the Pareto front requires a larger population size or more iterations to ensure convergence. This Increasing number of optimization parameters significantly affects the computational effort required to define the Pareto front. For higher-dimensional optimization problems, the following considerations are necessary:
- -
Using advanced regression models, such as higher-degree polynomial fits, employing larger populations in evolutionary algorithms like MOPSO, and
- -
performing additional iterations to ensure accurate convergence.
The increase in complexity with additional variables illustrates the importance of computational efficiency in optimization. MOPSO’s performance across different dimensions suggests it is suitable for real-world multi-variable engineering problems.
The analysis demonstrates that MOPSO, as a metaheuristic algorithm and a subset of machine learning, effectively finds optimal solutions across various structural outputs and parameters.
The use of MOPSO provides valuable Pareto-optimal solutions that balance competing objectives such as material use and stiffness. This allows engineers to better navigate trade-offs and arrive at more sustainable, efficient building designs.
5. Conclusions
This article presented a comprehensive study on the structural analysis and optimization of high-rise buildings using a hybrid methodology that integrates theoretical calculations, MATLAB-based simulations, ANFIS learning, and MOPSO optimization. The proposed PARS-Solution framework is designed as a validated and modular pipeline that enables efficient analysis of multi-floor buildings by computing deformations, bending moments, and shear forces based on key design parameters.
Research Contributions: The framework is validated through comparison with both reference calculations and ETABS software, achieving less than 5% deviation in the deformation results. The study demonstrates that structural calculations can be successfully delegated to machine learning tools, especially ANFISs, which achieved average errors below 2% even in chaotic or multi-parameter scenarios. Furthermore, MOPSO was used to generate Pareto fronts that effectively captured the trade-offs between deformation and material usage. The methodology allows for parametric, interpretable evaluations with direct access to design parameters.
Practical Implications: This approach enables engineers and designers to perform fast, cost-effective, and reliable pre-design analyses of high-rise buildings before applying detailed simulations in software like ETABS or SAP2000. It also provides a decision-support tool during early-stage structural planning, with outputs such as drift index, frame bending, and core shear force. The system’s modular structure makes it applicable to real-world prefabricated and high-rise design processes.
Limitations: The current implementation is limited to a MATLAB environment and uses specific stiffness diagrams () derived from reference models, which may constrain generalization to all structural forms. ANFIS accuracy depends on look-up table size, and optimization complexity increases significantly when more than four parameters are included. Additionally, the framework currently considers only one lateral load direction.
Future Work: Future developments will include extending the framework to irregular geometries, dynamic/seismic loading, and bi-directional force scenarios. The interpolation scheme for stiffness coefficients will be replaced by neural approximators to enhance adaptability. Moreover, the entire pipeline will be re-implemented in faster programming languages such as C++ or Python for better scalability and deployment in design offices or embedded systems. Further integration with structural health monitoring systems and real-time optimization for adaptive design are also envisioned.
Outlook and Generalization
Although MATLAB was used for implementing the PARS-Solution due to its flexibility and built-in toolboxes, the same methodology can be translated into other programming languages like C++, Python, or Visual Basic (VB) for faster execution and better scalability. This adaptability enables broader application in real-time structural analysis and optimization tasks.
The framework can be extended to support real-time optimization and adaptive structural control by integrating with sensor-based monitoring systems. Such integration would enable continuous structural assessment and dynamic parameter tuning, particularly beneficial for high-rise buildings in seismic or wind-prone regions.
To broaden the framework’s applicability, future work will investigate the integration of sustainability indicators (e.g., embodied carbon and cost efficiency) into the optimization objectives. This would allow the model to address not only performance and material usage but also environmental impact and economic feasibility, aligning with green building design standards.


