Article

The Two-Way Impact Between Economic Policy Uncertainty and Housing Prices in China: Sub-Sample Time-Varying Causality Analysis

1
School of Management, University of Sanya, Sanya 572022, China
2
School of Economics, Qingdao University, Qingdao 266071, China
*
Author to whom correspondence should be addressed.
Buildings 2025, 15(9), 1550; https://doi.org/10.3390/buildings15091550
Submission received: 10 March 2025 / Revised: 27 April 2025 / Accepted: 30 April 2025 / Published: 4 May 2025
(This article belongs to the Section Architectural Design, Urban Science, and Real Estate)

Abstract

This study investigates the time-varying causal relationship between China’s economic policy uncertainty (EPU) and housing prices (HP) at the macroeconomic level. Using sub-sample rolling-window techniques on monthly nationwide data spanning January 2000 to January 2025, we systematically analyze the dynamic interactions and structural shifts between these variables. It finds that EPU has both positive and negative impacts on HP, which are consistent with the general equilibrium model (GEM). Additionally, the study identifies a feedback effect of HP on EPU. The findings offer objective evidence and recommendations for the Chinese government to pay close attention to the intricate dynamic interactions between EPU and HP. Furthermore, the study provides insights into real estate market reactions in a developing country, which can be valuable for other market participants.

1. Introduction

House prices (HP) play a critical role in economic development, wealth distribution, consumption patterns, social resource allocation, and population mobility [1]. Significant fluctuations in HP can have profound impacts on a country’s economy [2]. A prime example of this is the 2007 US subprime mortgage crisis, which evolved into a global financial crisis, demonstrating the far-reaching consequences of housing market instability [3]. Therefore, understanding the key drivers of HP is essential for shaping effective housing policies and ensuring the stability of the national economic system [4]. Economic policy uncertainty (EPU) refers to the uncertainty faced by economic agents in predicting future economic policies and their outcomes [5,6]. EPU is primarily driven by conflicting countercyclical policy tool combinations, structural contradictions during institutional transitions, and exogenous shocks. Specifically, the concurrent implementation of monetary easing and fiscal tightening generates compounding uncertainty through signaling mechanisms and market expectation channels. The market-oriented reforms of prices, interest rates, and exchange rates necessitate adaptive adjustments in the policy framework. Meanwhile, exogenous shocks such as global financial crises or pandemics create dynamic friction between emergency policy interventions and normal economic operations. In summary, EPU can generally be categorized into two types: reform-oriented and crisis-driven. In today’s interconnected world, where information spreads rapidly through advanced technology and media, shocks in one economy, whether social, economic, or policy-driven, can swiftly reverberate across others [7]. This heightened interconnectedness has amplified the complexity of global economies and increased EPU [8]. EPU significantly influences the decisions of economic agents, including buyers, lenders, and real estate developers, thereby affecting the supply and demand dynamics of the real estate market and ultimately impacting HP [9,10]. Rising HP increase EPU by triggering regulatory policy, while falling HP elevate EPU through financial risk transmission and stimulus policies.
Therefore, investigating the interaction mechanism between EPU and HP holds significant theoretical and practical importance. However, the relationship between these two variables is complex and contingent upon specific economic conditions and participant behaviors. The existing literature has primarily focused on examining whether EPU affects HP and, if so, the direction of this impact. However, critical gaps remain regarding the following:: (1) How does EPU precisely propagate through policy responses and investor behavior, ultimately affecting HP? (2) Does the EPU-–HP relationship demonstrate systematic variation between different economic conditions, particularly distinguishing expansionary periods from contractionary phases, as well as across alternative policy regimes, with specific focus on reform-oriented versus crisis-driven policy environments? (3) Although EPU influences HP, what is the feedback mechanism from HP back to EPU? The primary objective of this study is to address these critical gaps.
After two decades of rapid development, China now boasts the largest real estate market in the world [11]. Coinciding with this growth, China has also experienced some of the fastest-rising HP globally. However, China’s housing market remains immature and is heavily influenced by policy. Unlike developed countries, China’s real estate sector is subject to significant regulation and is particularly sensitive to government interventions [12]. When the housing market overheats, the government often implements regulatory measures. Yet, the lack of clear policy expectations frequently leads to EPU. Compounding this issue, local governments rely heavily on land sales for fiscal revenue. A downturn in the housing market could threaten their financial stability, creating a strong incentive for both central and local governments to maintain stable HP. When HP fall, proactive measures are often taken to support the market. However, this frequent intervention can exacerbate EPU, creating a cycle of uncertainty [13]. China’s unique position as a developing country adds further complexity. Its rapid economic growth, unprecedented urbanization, and deep integration into the global supply chain generate additional EPU [14]. Moreover, the real estate industry serves as a cornerstone of China’s economy, significantly impacting both national economic growth and local government finances. The stability of the real estate market is thus intrinsically linked to broader economic stability [15]. Therefore, China, as the world’s largest and most policy-sensitive real estate market, presents an ideal case for studying the nonlinear impact of EPU on HP. Its unique dual dependence on policy interventions and land finance, coupled with the closed-loop feedback mechanism between EPU and housing prices, offers critical insights.
This study contributes in the following ways: First, unlike developed countries with more market-driven systems, China’s market is distinctly policy-led and institution-dependent. Our empirical analysis of EPU and HP expands theoretical understanding of policy-sensitive markets in emerging economies. Second, in methodology, we advance beyond traditional linear analysis by employing rolling-window time-varying causality tests. This dynamic approach better captures evolving EPU-–HP relationships. Structural break detection precisely identifies transmission mechanism shifts during major policy changes or economic crises. This nonlinear analytical framework can more comprehensively reveal both the directional changes in EPU’s impact on HP and its transmission pathways across different market cycles and economic environments. Third, we establish a two-way interactive mechanism between EPU and HP, forming a dynamic closed-loop model. Crucially, we demonstrate the policy feedback loop in China’s market: price drops trigger government stimulus, while price hikes prompt tightening measures, both amplifying policy uncertainty. This finding provides new theoretical insights into emerging economies’ real estate dynamics.
The remaining research components are organized as follows: Section 2 includes the literature review. Section 3 outlines the theoretical model. Section 4 details the research methods. Section 5 explains the data sources. Section 6 presents the empirical results and their analysis. Finally, Section 7 offers conclusions.

2. Literature Review

The relationship between EPU and HP has garnered significant attention, yet consensus remains elusive. Many studies have suggested that EPU acts as a significant determinant of HP volatility. Chien et al. (2020) evince that global economic policy risk increases HP instability [16]. Balcilar et al. (2021) find strong and robust Granger causality from EPU to HP in annual data for a panel of 16 countries, but not vice versa [17]. Fan et al. (2023) demonstrate a significant relationship between HP volatility and EPU in G7 countries [18]. Anoruo et al. (2017) offer evidence of reciprocal causality in variations between EPU and the HP in Japan [19]. Ghosh (2021) validates the asymmetric effect of EPU on HP over an extended period using quarterly observations from key European countries [20].
As for the directionality of the impact of EPU on HP, most studies suggest that there is a negative effect between the two variables. Choudhry (2020) demonstrates through empirical evidence a consistent negative impact of EPU on HP in 10 distinct geographical regions of England and Wales, both in the short and long term [21]. Balcilar et al. (2023) find that the EPU have a negative impact on HP in the UK [22]. Soon (2022) discovers a negative relationship between the EPU index and HP volatility in Korea [23]. André et al. (2017) observe that EPU negatively influences both real housing returns and their volatility in the US [24]. Antonakakis et al. (2015) demonstrate significant negative correlations between EPU and HP surrounding US recessions [25]. Moreover, they find that these short-term effects persist into the long run in 17 states [26]. Jeon (2018) demonstrates a negative relationship between Korea’s EPU and its HP [27]. Sreenu (2023) finds that EPU exerts a negative influence on HP across eight major Indian cities [28]. Wadud et al. (2022) find that the EPU affect HP negatively in seven Australian capital cities [1].
However, some studies confirm that EPU can boost HP. Kirikkaleli et al. (2021) observe that there is a positive correlation between EPU and HP at different periods in Germany [29]. Alola et al. (2020) show that the short-term impact of global EPU on HP is statistically significant and positive. Moreover, some scholars believe that the relationship between the two variables is complex [30]. Su et al. (2019) find that the impact of EPU on HP could be positive or negative, while HP volatility significantly raises EPU in Germany [31]. Aye (2018) examines whether EPU has led to real housing returns in eight emerging economies. The results based on the full sample period suggest that, except for Chile and China, there is no evidence that EPU Granger causes real housing returns. However, according to rolling window results, there is evidence of time-varying causal relationships in all countries except India [32]. El-Montasser et al. (2016) demonstrate a mutual relationship between EPU and HP, indicating that increased EPU can elevate HP. Their findings also reveal a similar bidirectional relationship for France and Spain. More precisely, in Canada, Germany, and Italy, the causal link primarily runs from EPU to HP, while in the UK and the US, it predominantly flows from HP to EPU [33].
Research on the correlation between EPU and HP in China has yielded notable findings. Xia et al. (2020) emphasize the influence of information stemming from EPU on HP [34]. Chow et al. (2018) indicate that the growth in EPU directly impacts real housing returns in China [35]. In terms of specific influence situation, Wang et al. (2020) find that HP growth is augmented by EPU [10]. Zhao (2021) finds a negative effect of EPU on HP [36]. Hu et al. (2020) reveal an asymmetric impact of EPU on HP, indicating that high EPU levels lead to increased HP volatility, while low EPU levels result in weaker impacts [37]. Huang et al. (2020) indicate the impact of EPU on HP varies with fluctuations, with stable EPU correlating positively with HP variation [38]. Qu et al. (2023) emphasize that heightened EPU fosters investment levels in real estate corporations, with HP fluctuations mediating the positive impact of EPU on such investments [39].
To sum up, the existing literature have explored various aspects, including the impact across different macroeconomic cycles and regions. However, certain gaps remain, warranting further investigation. First, while there has been significant attention on developed nations, studies on the relationship between EPU and HP in developing countries and emerging markets are notably lacking. Second, there is a lack of consensus regarding the exact nature of the relationship between EPU and HP. Last, the majority of studies have relied on linear assumptions, neglecting dynamic and nonlinear perspectives, which could provide deeper insights into this relationship.

3. General Equilibrium Model

This study utilizes the general equilibrium model (GEM) based on Pastor and Veronesi’s work to explain the correlation between EPU and HP [40,41]. Assume a real estate market in which investors (denoted by m ) are continuous with m [ 0 , T ] for a limited time period of [0, T]. Furthermore, it is assumed that at time 0, the investor m ’s capital C 0 m = 1 . Subsequently, real estate investors continuously invest all their capital in a linear manner, while the investment return H P t m is random. d C t m = C t m d H P t m represents the equation governing the accumulation of the investor’s capital. C t m represents the investor m ’s capital at time t . Over the entire time interval, regression Equation (1) can be formulated as follows.
d H P t m = ( u + p t ) d t + σ d Z t + σ 1 d Z t m , t [ 0 , T ]
where u represents the influences from other observable factors in the real estate market. Z t denotes Brownian motion of investor m , and Z t m denotes an independent Brownian motion. σ and σ 1 are coefficients that can be observed for Z t and Z t m p t represents the impact of China’s economic policy to the average of the profitability process.
If p t = 0 , we can assume that China’s economic policy and HP are unrelated. p o l d signifies the present impact of China’s economic policy, which remains constant unless there is a policy adjustment at time τ ( 0 < τ < T ) . Subsequently, the Chinese government must determine whether to make adjustments to the economic policy at time τ p n e w will replace p o l d if the government opts to modify the existing economic policy, and p t can be expressed as Equation (2):
p t = p o l d f o r t τ p o l d f o r t > τ n o a d j u s t m e n t , t [ 0 , T ] p n e w f o r t > τ a n a d j u s t m e n t
Following the announcement of an adjustment in economic policy by the Chinese government at time τ , its impacts will take effect immediately. However, the precise value of p t remains unknown to participants in the economy. An essential assumption is that the effects of China’s economic policies on investors returns are uncertain. p n e w and p o l d have prior distributions that are normally distributed with a mean of zero and known variance σ p 2 , where p ~ N ( O , σ P 2 ) . Hence, China’s EPU can be represented by σ p , which denotes the standard deviation of p t . As EPU ( σ p ) rises, it indicates increased volatility in the impacts ( p t ). However, a significant distinction exists between p o l d and p n e w , making their magnitudes indistinguishable. When p n e w > p o l d , heightened EPU strengthens investor confidence, accelerating capital inflows into the real estate market, driving up HP, EPU positively impacts HP. When p n e w < p o l d , increased EPU weakens investor confidence, leading to delayed or abandoned investment plans. This reduction in investment ultimately depresses HP, indicating that EPU negatively impacts HP.
Thus, based on this equilibrium model, it can be inferred that EPU indeed has consequential effects on HP, but the direction of its influence depends on contextual factors. From a market cycle perspective, rising EPU can exhibit two distinct characteristics: reform-oriented during economic booms and crisis-driven during recessions. During economic expansions, reform-oriented EPU typically accompanies institutional innovation and industrial upgrading, fostering sustained economic growth and optimistic long-term returns. This EPU creates new investment opportunities and growth potential, pushing real estate investment returns above historical levels. Therefore, an EPU increase may thus incentivize proactive market participation, driving HP upward [10,42,43]. Conversely, in recessions, crisis-driven EPU suppresses housing market activity through multiple channels: When EPU rises, buyers often delay purchasing decisions, reducing demand [18]. Real estate developers may postpone new projects, leading to a decline in housing supply [30,44]. Lenders may tighten mortgage approvals, creating financial constraints for both buyers and developers, further reducing purchases and supply [21,45]. The compounding effects of pessimistic sentiment and behavioral responses exert significant downward pressure on HP. Fundamentally, the cyclical split originates in how economic phases filter EPU’s transmission, producing divergent expectation-behavior linkages between upswings and downturns.

4. Methodology

4.1. Bootstrap Full-Sample Technique

Ensuring the stability of time series is crucial for the validity of the Granger causality test. Violations of this assumption can lead to unreliable results in traditional VAR models [46]. However, the residual bootstrap (RB) technique, pioneered by Shukur et al. (1997), offers a means to improve the accuracy of Granger causality testing [47]. Furthermore, their likelihood ratio (LR) tests can enhance the robustness and precision of these tests, particularly in situations with limited sample sizes [48]. To refine our understanding of the causal link between EPU and HP, this study employs a modified likelihood ratio statistic for testing purposes. The bivariate VAR (p) process is formulated as Equation (3):
Y t = a 0 + a 1 Y t 1 + + a p Y t p + ε t , t = 1 , 2 , 3 T
where p is selected using the Schwarz Information Criterion (SIC), a method employed to determine the optimal lag order. Furthermore, Y can be alternatively expressed as Y t = ( E P U t , H P t ) . The relationship between EPU and HP can be affected by the interest rate (IR) [49,50,51,52,53,54,55,56], and we regard it as a control variable here, then Equation (3) can be rewritten as follows:
E P U t H P t = a 10 a 20 + a 11 ( L ) a 12 ( L ) a 13 ( L ) a 21 ( l ) a 22 ( L ) a 23 ( L ) E P U t H P t I R t + ε 1 t ε 2 t
where ε t = ( ε 1 t , ε 2 t ) is a white-noise process. a i j ( L ) = k = 1 p a i j , k L k , i , j = 1 , 2 , and L is a lag operator, that is, L k Y t = Y t k . We can work on Equation (4) based on a 12 , k = 0 , where k = 1 , 2 , , p . Rejecting the null hypothesis that EPU does not influence HP implies a definite impact of EPU on HP. Similarly, the null hypothesis concerning HP’s lack of effect on EPU can also be examined.

4.2. Parameter Stability Test

To address the potential inaccuracies stemming from the assumption of constant VAR model parameters in the bootstrap full-sample causality test, this paper employs S u p-F , A v e-F and E x p-F tests to evaluate parameter stability [57,58]. Furthermore, the L c statistic developed by Nyblom (1989) [59] and Hansen (1992) [60] is utilized to assess whether the parameters follow a random walk process and to gauge their long-term stability. If instability is detected in the parameters, it suggests that the causal relationship between EPU and HP exhibits time-varying dynamics.

4.3. Bootstrap Sub-Sample Rolling-Window Causality Test

To mitigate the impact of parameter structural changes, the sub-sample rolling-window causality test developed by Balcilar et al. (2010) can be utilized [61]. This entails partitioning the complete dataset into numerous sub-samples, each having a consistent window width ( f ). If the sequence length is E , the original dataset is divided into E f  sub-samples. Subsequently, an enhanced L R test using the R B method is performed on each sub-sample. By analyzing the L R statistics and p-values of the E f sub-samples, we can ascertain the causal relationship between EPU and HP. N b 1 k = 1 p a 12 , k and N b 1 k = 1 p a 21 , k denote the impact of EPU on HP and the effect from HP to EPU, respectively.  N b represents the number of bootstrap repetitions. a 12 , k and a 21 , k are parameters derived from Equation (4). In this study, we utilize a 90% confidence interval, along with their respective lower and upper bounds, which are the 5th and 95th quantiles of a 12 , k and a 21 , k , respectively [62].

5. Data Source and Descriptive Analysis

This study utilizes monthly data spanning from 2000M01 to 2025M01 to examine the causal relationship between EPU and HP. China’s accession to the WTO in 2000 marked a pivotal milestone in economic liberalization [63], profoundly impacting domestic EPU and HP. The initial WTO compliance requirements, including tariff reductions and market access liberalization, triggered frequent policy adjustments that temporarily elevated EPU. Concurrently, WTO-mandated service sector openness facilitated foreign investment in real estate. Rising foreign capital inflows and export-driven income growth, combined with accelerated urbanization, stimulated substantial housing demand and price appreciation [64]. Notably, 2000 also witnessed the formal designation of real estate as a pillar industry and the implementation of pilot reforms in land auction systems. These institutional changes elevated land costs and exerted upward pressure on HP. In summary, the year 2000 marked the starting point of China’s “dual circulation” economic strategy, with WTO integration fueling external-oriented growth and urbanization coupled with housing marketization stimulating domestic demand. Given this context, the study adopts January 2000 as the starting point for analysis. To measure HP, we used the nationwide average selling price of housing, sourced from the National Bureau of Statistics of China.
In addition, we use the China Economic Policy Uncertainty Index (EPUI) compiled by Baker, as the second variable. The dataset was sourced from the Wind database. The China EPUI systematically measures EPU through quantitative textual analysis of major media sources. The index primarily utilizes content from the South China Morning Post, supplemented by authoritative Chinese publications including People’s Daily and Economic Daily. Following comprehensive data preprocessing and normalization procedures relative to total article volume, the index generates monthly measurements standardized to a base period of January 1995. This methodology preserves international comparability while incorporating China-specific policy terminology, establishing it as a robust empirical tool for assessing EPU dynamics in China’s evolving economic landscape.
The real estate sector, being capital-intensive, relies heavily on significant financial investments for both supply and demand. As a result, interest rates (IR) play a pivotal role in influencing HP [49,50]. Moreover, monetary policy stands as the cornerstone of macroeconomic regulation and is a primary source of EPU [55]. As a key monetary policy tool, IR adjustments are frequently employed by governments to regulate HP [53]. However, market responses to such policies can be unpredictable or even counterproductive, often exacerbating EPU [56]. Consequently, we include IR as a control variable, with data sourced from the People’s Bank of China.
Figure 1 illustrates the trends in CC and HP. Before the COVID-19 pandemic in 2020, HP demonstrates a steady upward trajectory, punctuated by notable declines in 2008 and 2011, due to the global financial crisis and European debt crisis, respectively. Since 2020, HP have declined due to policy regulations, the impact of the pandemic, slowing economic growth, high household leverage, and changing market expectations. In 2024, most cities in China successively canceled or relaxed home purchase restrictions, but HP did not rise, but accelerated decline. On the other hand, EPU exhibits substantial volatility throughout the sample period. A significant surge in EPU occurred following the 2008 financial crisis, with another spike during the European debt crisis. The RMB exchange rate reform in August 2015 marked the transition from a fixed to a market-based exchange rate system, triggering drastic economic policy fluctuations and a rapid rise in EPU [65]. The outbreak of the Sino-–US trade war in 2018 further drove EPU to historic highs. Subsequent global events, including the COVID-19 pandemic in 2020 and the Russia-–Ukraine conflict in 2022, continued to influence EPU significantly. In 2022, the Federal Reserve initiated a series of aggressive interest rate hikes, marking the largest cumulative increase in nearly four decades. This triggered intensified global capital flows, resulting in capital outflows and currency depreciation pressures in China and other emerging markets, significantly driving up EPU. By 2023, China’s real estate market continued its downward trend, with sluggish sales and debt defaults among some developers, elevating financial systemic risks and further increasing EPU. Additionally, the collapse of Silicon Valley Bank heightened tensions in global capital markets, particularly shaking investor confidence in the technology and innovation sectors, thereby exacerbating global economic and financial policy uncertainties and pushing EPU higher. Comparing the trends and fluctuations in EPU and HP reveals that these variables sometimes move in opposite directions, while sometimes synchronicity is also observed. Overall, the relationship between EPU and HP is dynamic and multifaceted, requiring the use of sub-sample analysis techniques to effectively capture their nuanced interactions.
Table 1 presents descriptive statistics. The mean values for EPU, HP, and IR are 270.154, 5785.667, and 4.000, respectively. There is substantial variation between the maximum and minimum values of EPU, HP, and IR, indicating high volatility in these variables. Skewness is positive for EPU, HP, and IR. The kurtosis value of EPU conforms to a leptokurtic distribution, and the kurtosis values of HP and IR conform to a platykurtic distribution. Additionally, the Jarque–Bera test statistics for all three variables are significant at the 1% level, suggesting a departure from normal distribution. Consequently, it is not reasonable to apply the traditional Granger causality test.

6. Empirical Results

We have applied the unit root test [66,67,68] in order to check the stability of EPU and HP. The result shows that the two variables after the first differencing are stable. The VAR model is utilized to investigate the full-sample causality between EPU and HP. The optimal lag length, determined by the Schwarz information criterion, is found to be 4. Results from the bootstrap full-sample Granger causality test (Table 2) indicated that EPU has a causal effect on HP, and vice versa. However, due to structural variations leading to parameter instability, the causality results in the full sample were considered unreliable. To address this issue, tests for parameter stability such as S u p-F , A v e-F and E x p-F were conducted [57,58], with the results shown in Table 3. The statistics of these tests are significant at the 1% level. This instability in causal linkages between EPU and HP prompted the utilization of a bootstrap sub-sample rolling-window causality test to further explore their relationship. A window width of 24 months was chosen based on prior research to ensure robust conclusions [48,69]. To verify the reliability of causation, we also examined widths of 20, 28, and 32 months, which yielded results that were largely consistent with those of 24 months. This methodology enables a more precise analysis of the bilateral connection between EPU and HP.
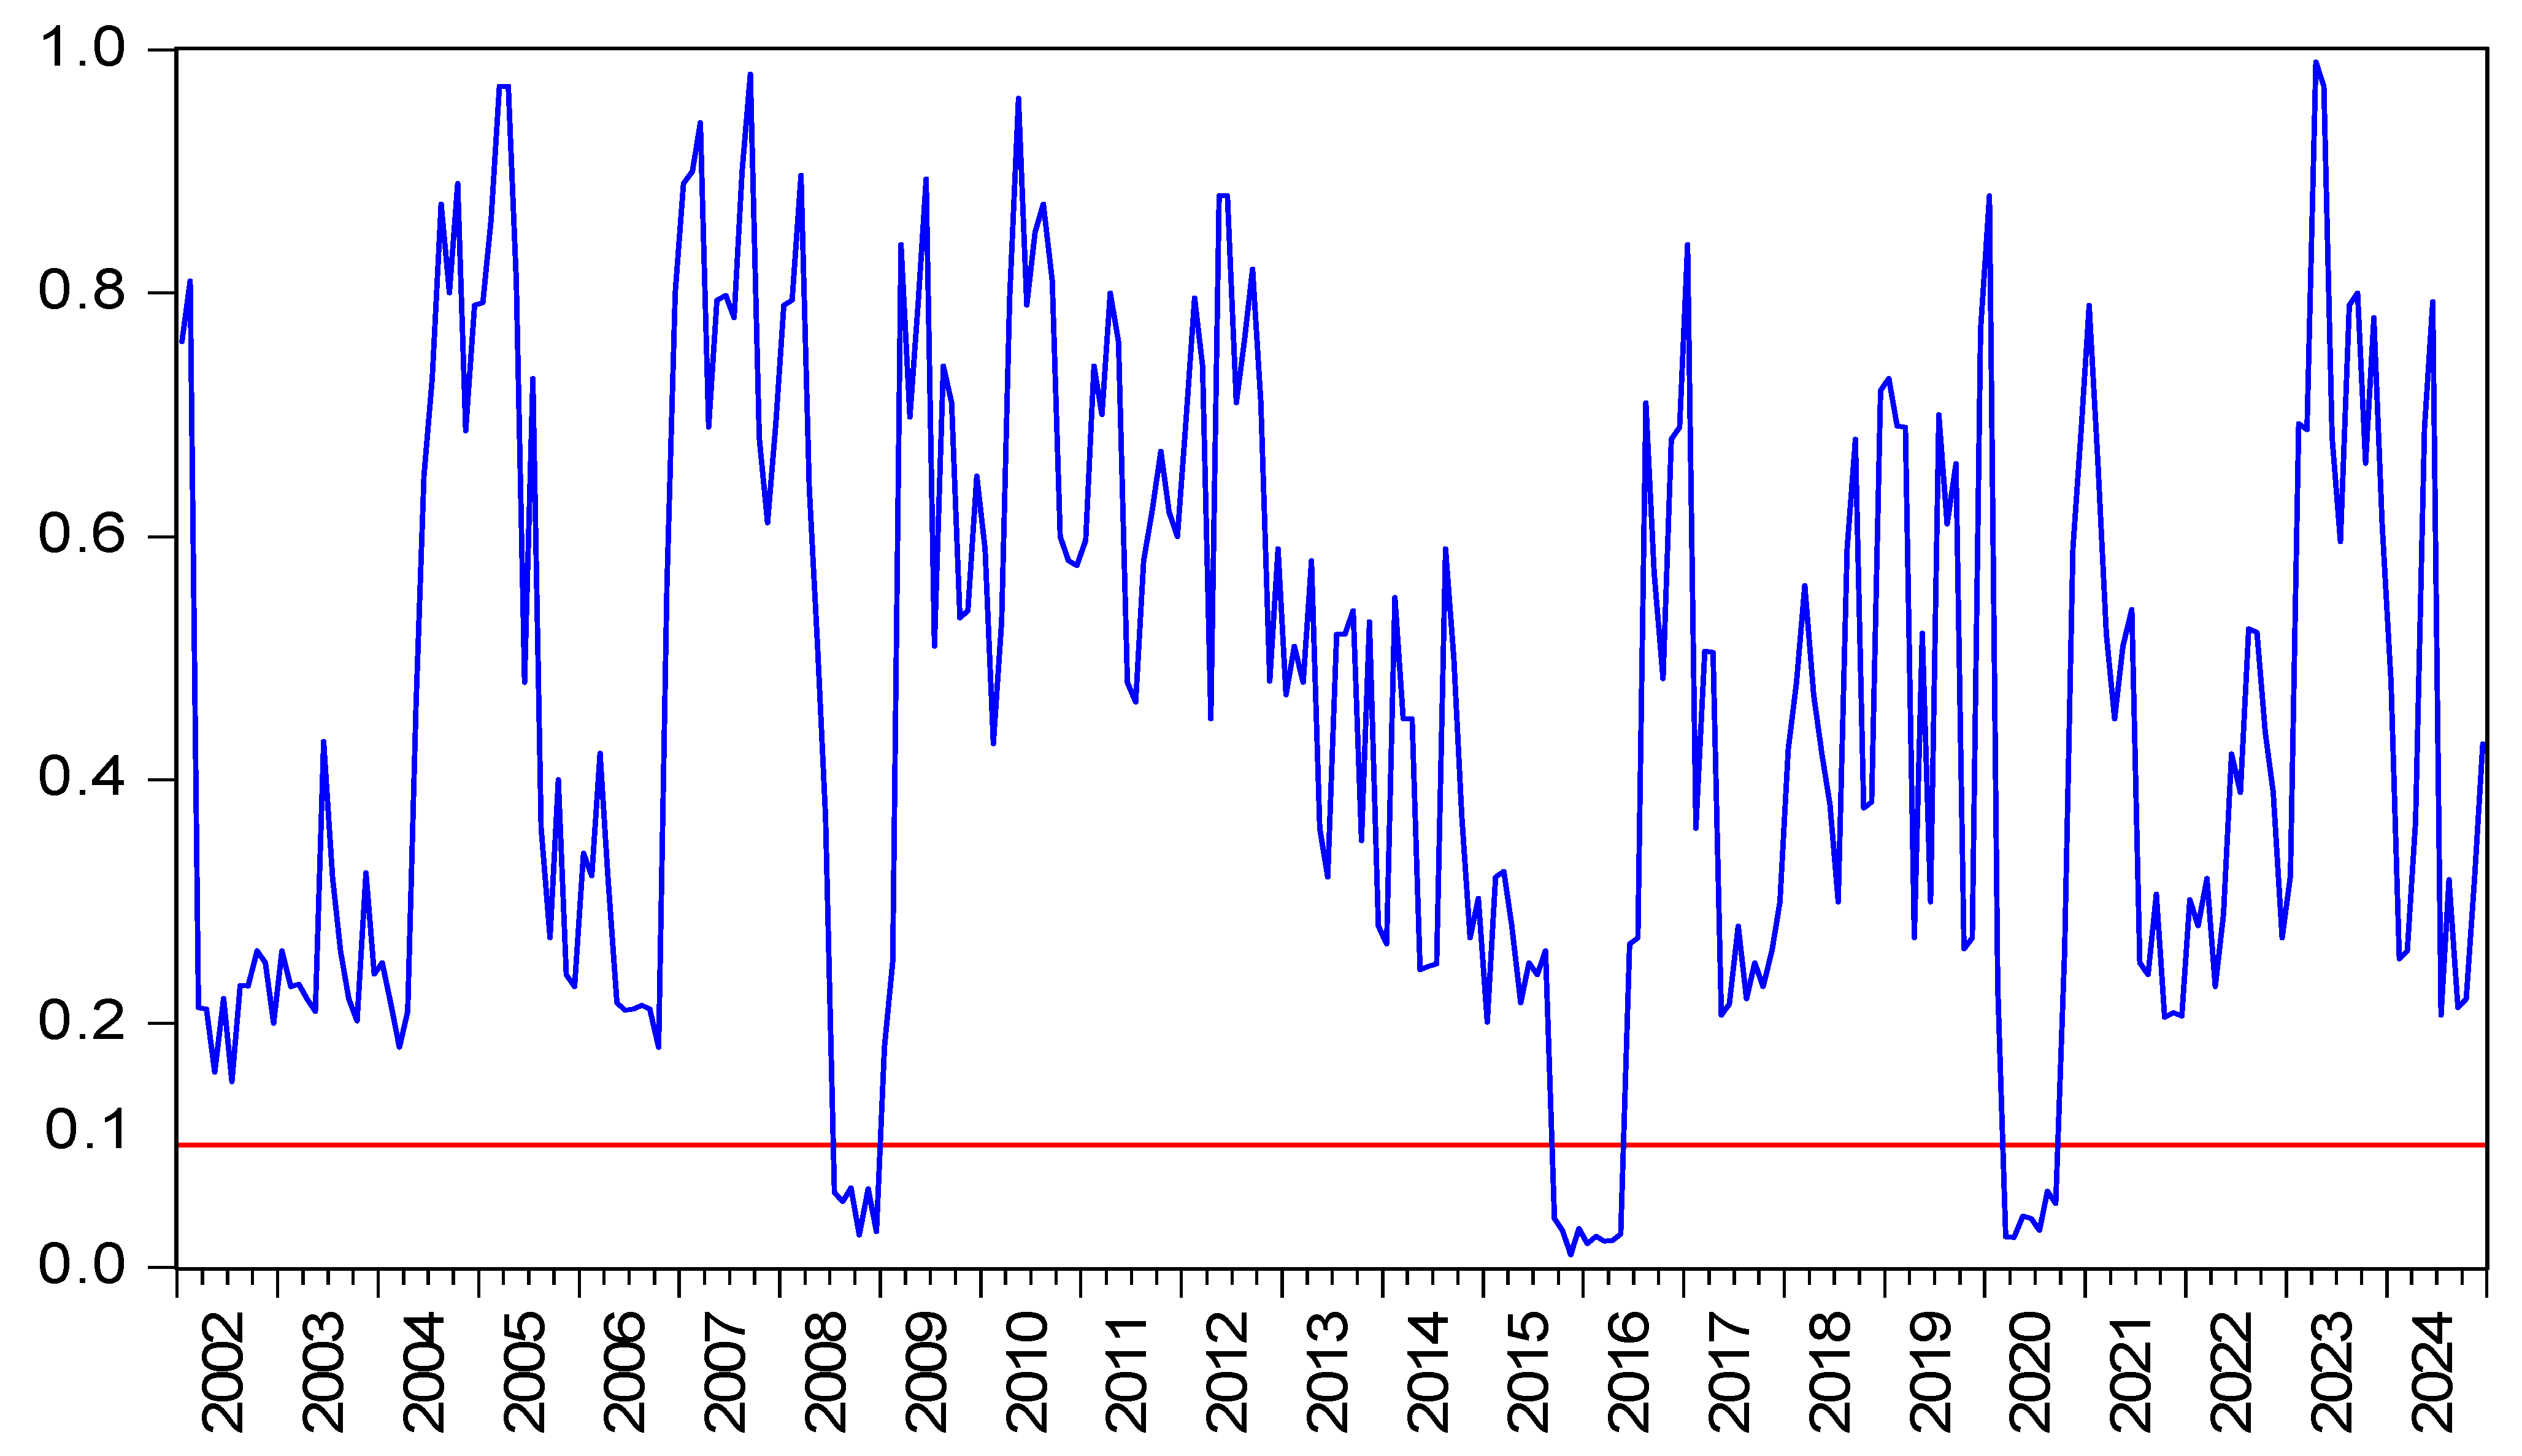
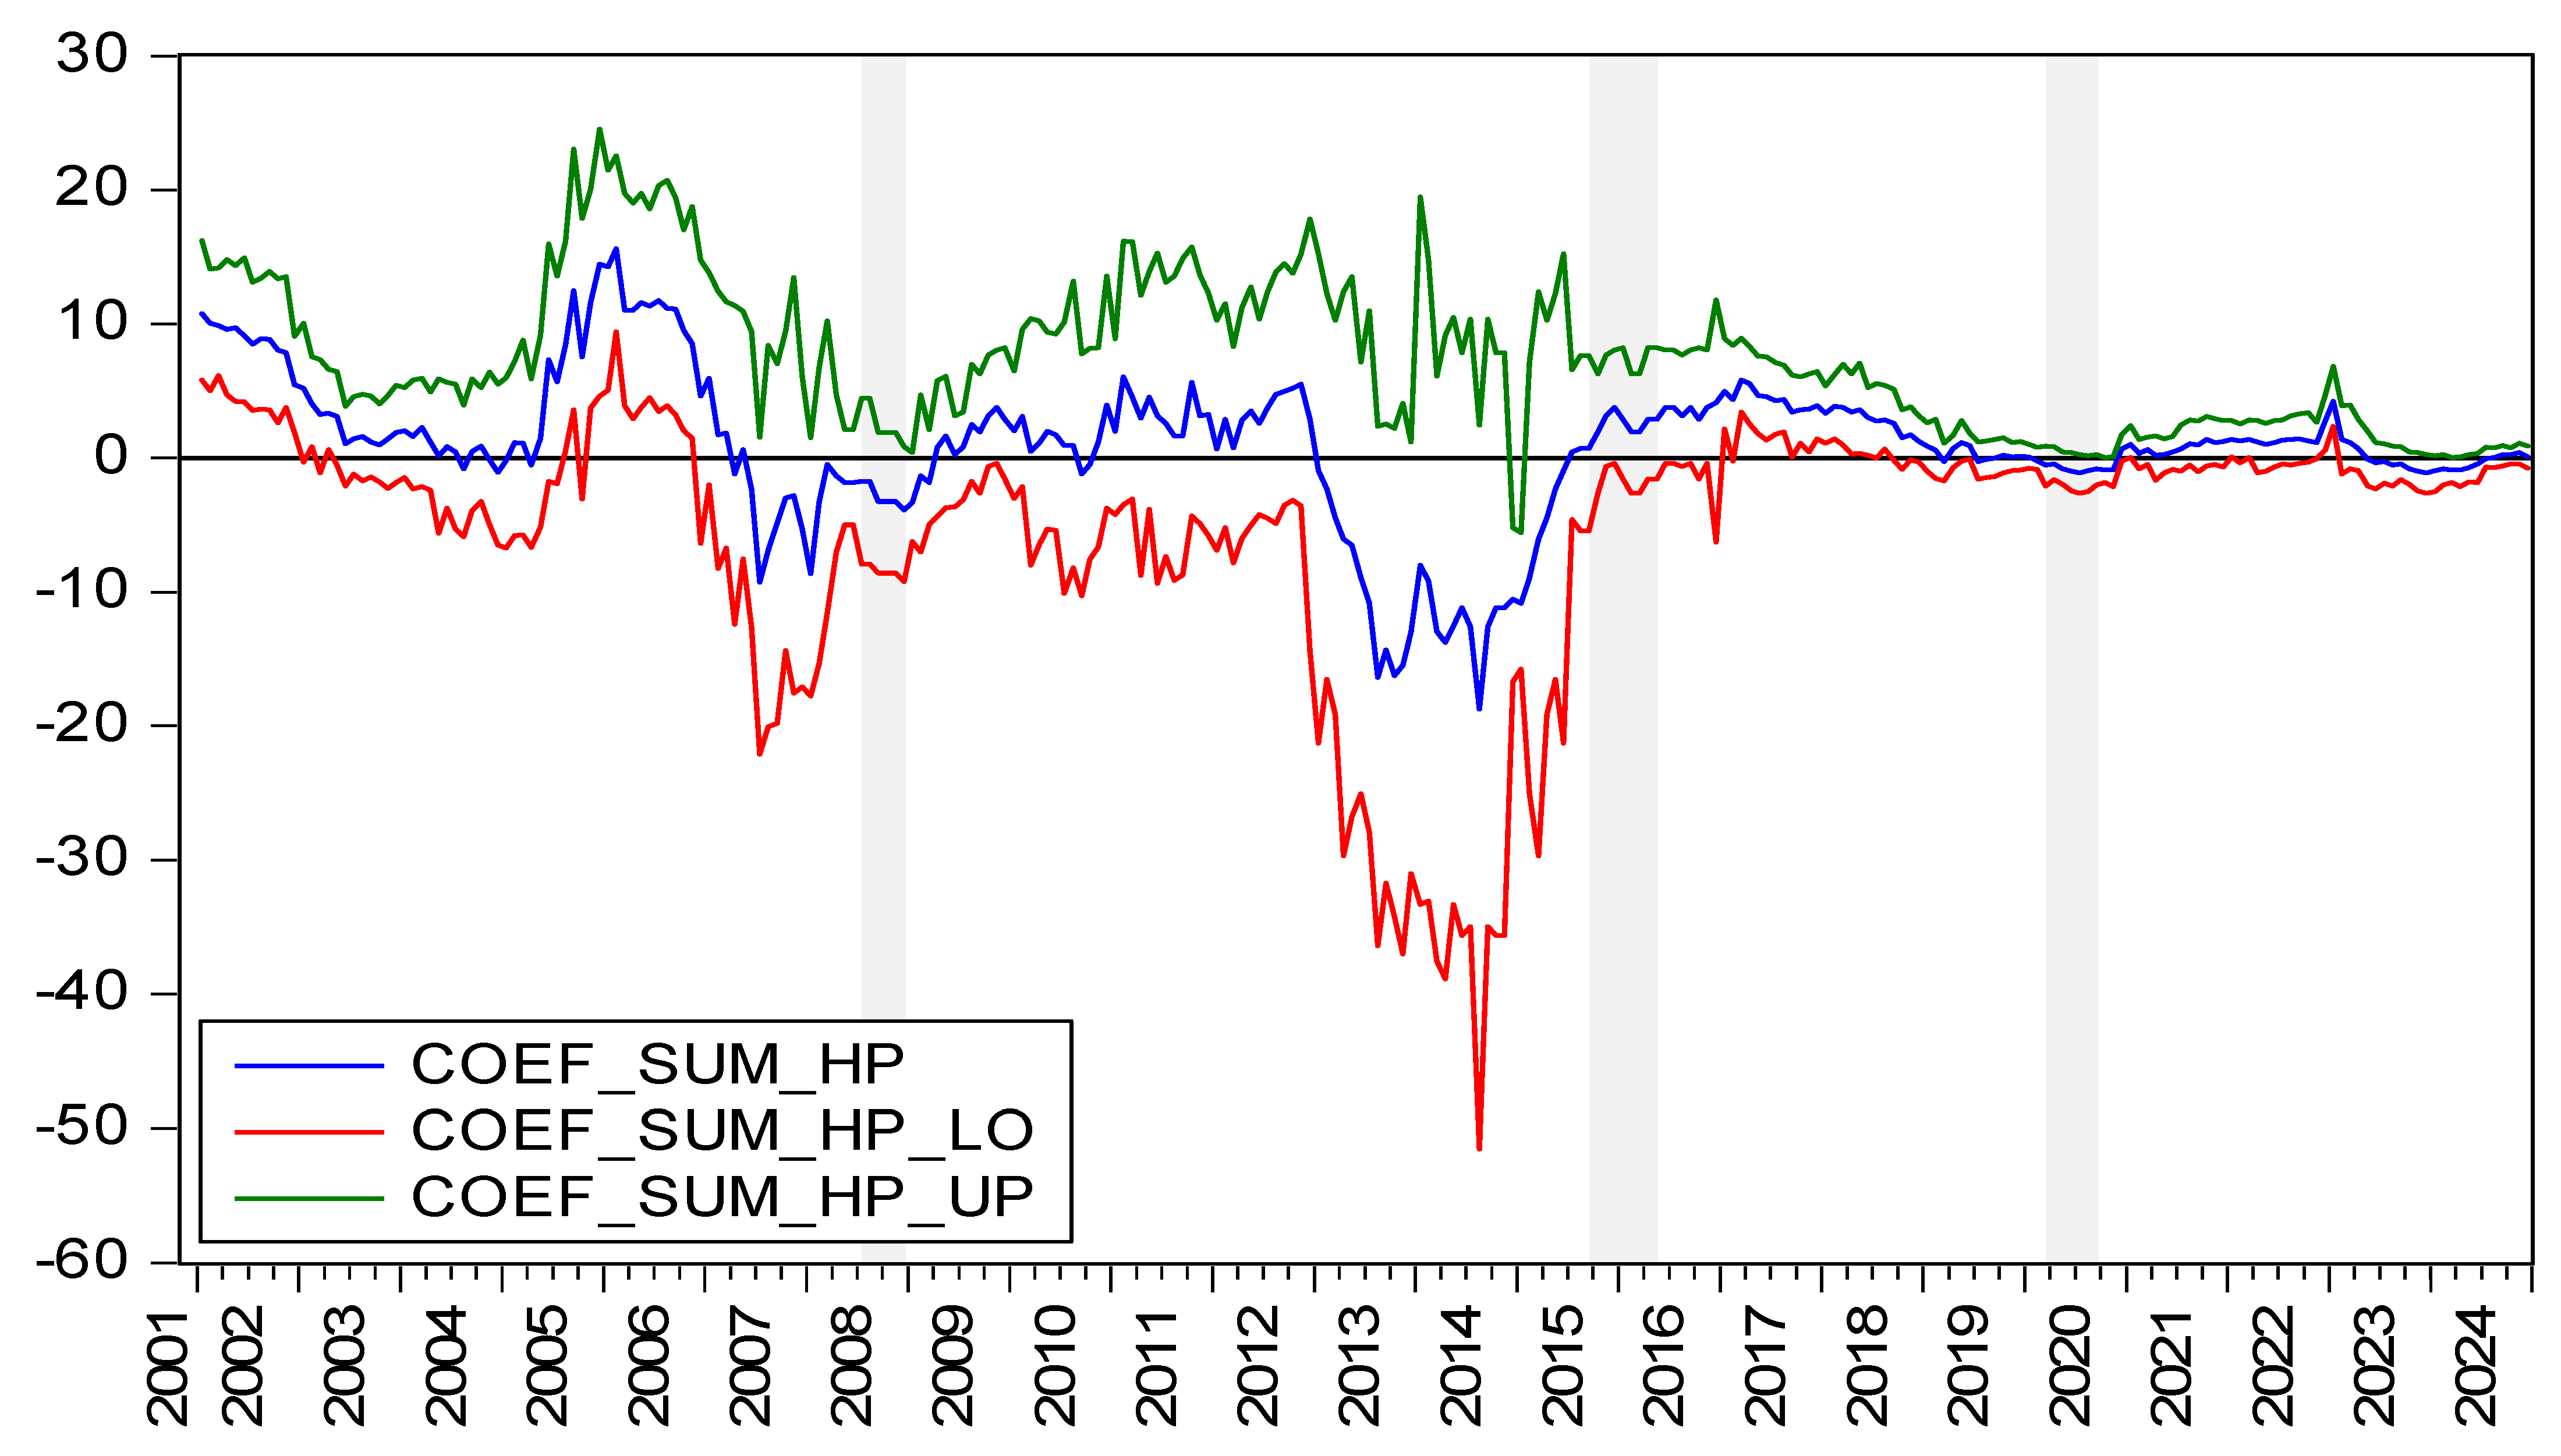
Figure 2 displays the p-values for testing the hypothesis that EPU does not Granger-cause HP. Figure 3 illustrates the directional influence from EPU to HP. By integrating these two figures, it is observed that negative causal relationships exist during the periods of 2008M07–2008M12 and 2020M03–2020M09, and positive causal relationships exist in the period of 2015M09–2016M05.
In the periods of 2008M07–2008M12 and 2020M03–2020M09, EPU increases while HP decreases. In September 2008, the bankruptcy of Lehman Brothers triggers severe turmoil in global financial markets, quickly spreading to the real economy. The crisis impacts China’s economy, causing a decline in exports, slowing growth, and a surge in EPU. Additionally, market confidence is eroded, demand decreases, and HP decreases by 1.9%. At the beginning of 2020, the COVID-19 pandemic breaks out, rapidly affecting various economic sectors. Production halts, consumption stagnates, and exports are disrupted, imposing immense pressure on China’s economic growth and causing a sharp rise in EPU. Meanwhile, HP also decline due to the pandemic and broader economic uncertainties. During these two periods, EPU exerts a negative impact on HP, which can be explained as follows. The increase in EPU during these two periods is fundamentally crisis-driven. Therefore, higher EPU reduces confidence in real estate investment [18], financing [37], and consumption [10,21]. The consequent behavioral contraction manifests in reduced market activity, ultimately exerting downward pressure on HP. The results are consistent with the predictions of general equilibrium models.
In the period of 2015M09–2016M05, EPU increases while HP increases too. In August 2015, China implements a reform to transition from a fixed to a market-driven exchange rate system. Initially, the RMB exchange rate’s volatility increases, triggering capital outflows and market concerns, which heighten EPU. In the second half of 2015, HP in China surges. According to the National Bureau of Statistics, HP in 70 major cities increases by 7.7%. Shenzhen leads with a 47.5% rise, followed by Shanghai at 18.2%, Beijing at 10.4%, and Guangzhou at 9.2%. In the first half of 2016, the upward trend continues. From January to June, HP in 70 major cities rises by 7%. Shenzhen again tops the list with a 16.8% increase, Guangzhou at 4.2%, Beijing at 7%, and Shanghai at 9.6%. EPU positively impacts HP during this period, which can be explained as follows. During this period, China’s economy experiences an upward cycle. HP rise due to multiple factors including government land supply restrictions, urbanization-driven demand, and increased purchasing power from continued economic growth [35]. Many investors expect HP to maintain a long-term upward trend, leading to more aggressive real estate investment strategies [41,43]. Additionally, the increase in EPU during this period is fundamentally reform-oriented. China’s exchange rate reforms trigger short-term depreciation expectations for the RMB. Against this backdrop, real estate, particularly in first- and second-tier cities, is perceived as a safe asset to hedge against depreciation risks [70], attracting significant capital inflows into the property market. Furthermore, currency depreciation encourages foreign investors to seek bargain opportunities. After the RMB depreciates, some foreign capital views real estate in China’s core cities as more cost-effective and accelerates purchases. This behavior further drives HP upward [42]. These findings align with the general equilibrium model, which suggests that when the investment returns of new economic policies exceed those of old policies during an economic upswing, an increase in EPU stimulates HP appreciation.
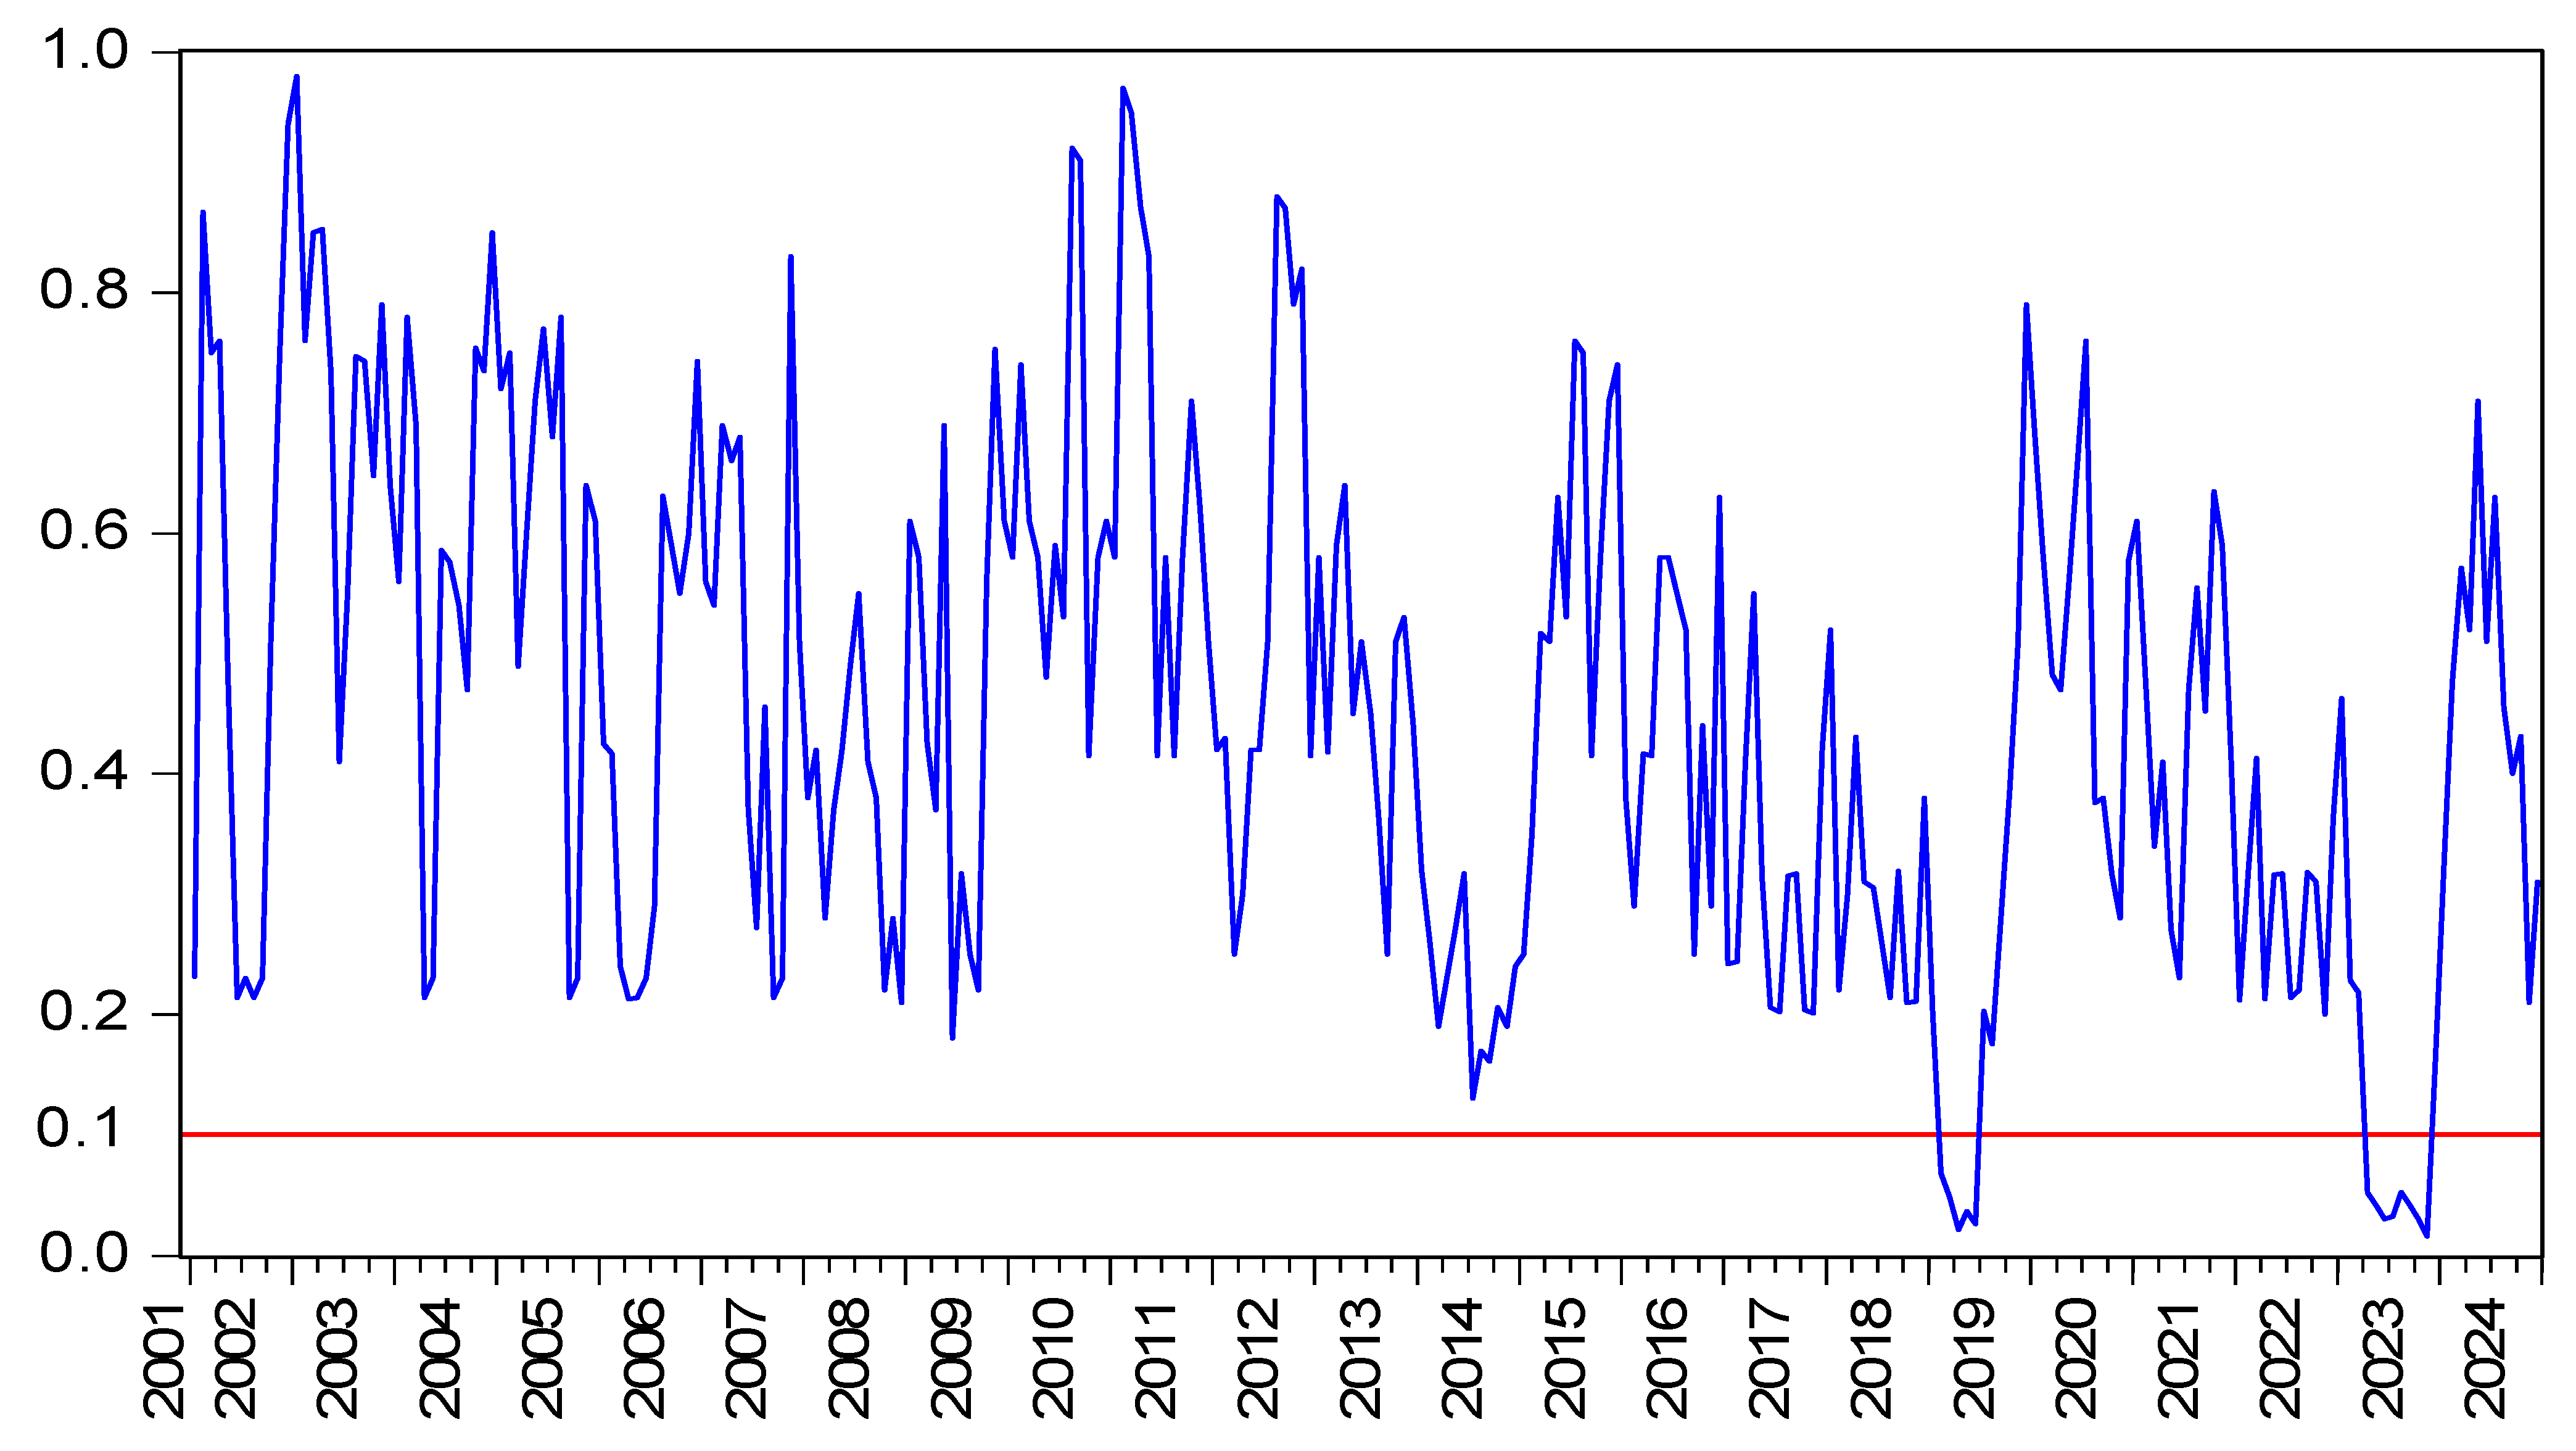
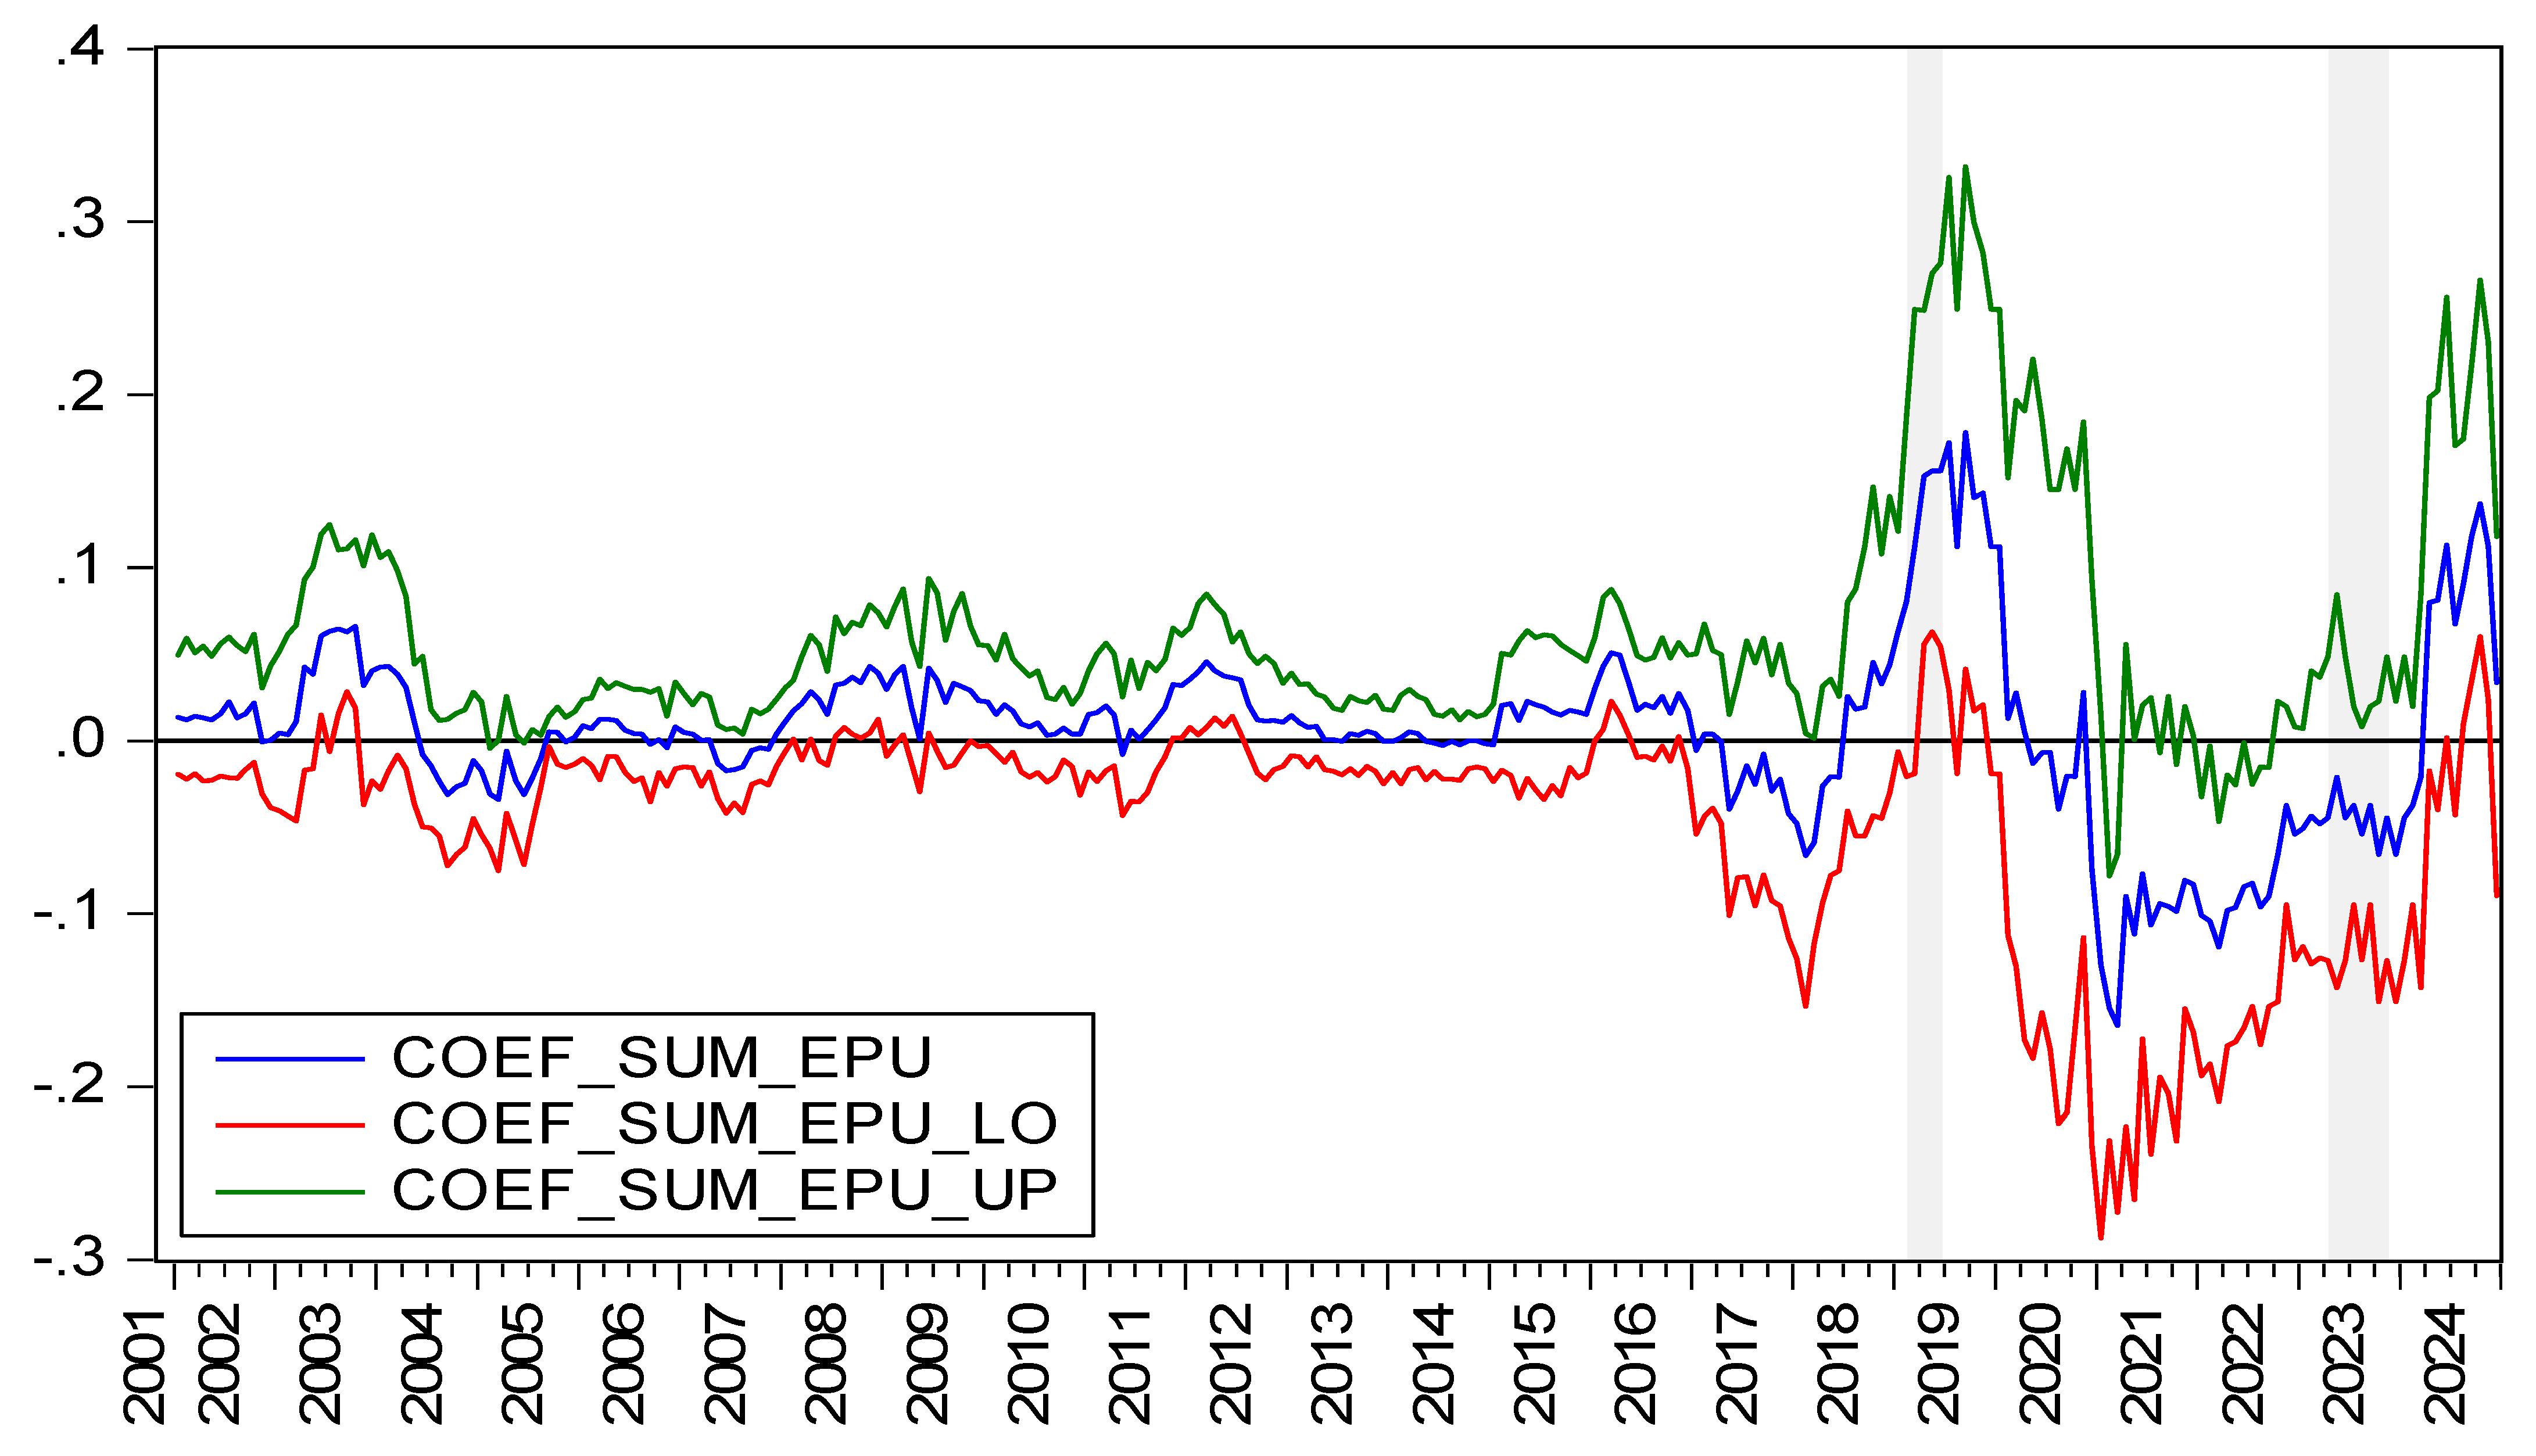
Figure 4 displays the p-values for testing the hypothesis that HP does not Granger-cause EPU. Figure 5 illustrates the directional influence from HP to EPU. By integrating these two figures, it is observed that there are positive causal relationships exist in the periods of 2019M02–2019M06, and negative causal relationships exist in the periods of 2023M04–2023M11.
In the period of 2019M02–2019M06, both HP and EPU increases. In the first three quarters of 2019, China’s HP reaches a record high of 9354 yuan. In the first nine months, total real estate development investment hits 9.8 trillion yuan, up 10.5%. This shows developers remain confident in the future market. Driven by high profits in real estate, high leverage and high debt property investments stay prevalent. In the second quarter of 2019, real estate development loans reach 11.04 trillion yuan, up 14.6%. Personal housing loans rise to 27.96 trillion yuan, up 17.3%. By the end of 2019, China’s household leverage ratio climbs to 55.8%. The household debt-to-income ratio reaches 1.02, higher than the US’s 0.93. Household leverage boosts short-term economic growth but also accumulates financial risks, driving EPU higher. During this period, the positive impact of HP on EPU can be explained in four ways. First, rapid HP growth encourages high-leverage financing among developers and buyers, driving up household and corporate debt [71]. Rising debt increases financial system risks, pushing governments and regulators into a dilemma. They must balance risk prevention with avoiding excessive suppression of the housing market, leading to increased EPU. Second, rapid HP growth diverts capital and resources excessively toward real estate, squeezing the real economy and other industries [72,73]. This economic imbalance prompts policy adjustments to diversify the economy, thereby increasing EPU. Third, HP growth creates inflationary pressure, forcing central banks to consider raising interest rates to curb bubbles [74]. However, rate hikes may suppress growth and consumption, intensifying market and EPU. Fourth, HP growth raises concerns about housing affordability and widens wealth gaps, fueling social tensions [75]. Governments respond with regulatory measures, but balancing growth, stability, and market control often leads to ambiguous policy directions, increasing EPU.
In the period of 2023M03–2023M11, HP decreases while EPU increases. In March 2023, the collapse of Silicon Valley Bank hits China’s tech stock market, worsens financing conditions, limits tech collaborations, and dampens innovation, further straining the economy. This lowers income expectations for many. People fear unemployment while carrying high mortgages, increasing life pressures. Meanwhile, the era of HP surging wildly in China is over. No one blindly believes buying property guarantees profits anymore, and speculative demand plunges. Overall, homebuyers stay cautious, adopting a wait-and-see approach. In 2023, China’s commercial housing sales area drops 8.5% to 1.12 billion square meters. Sales revenue falls 6.5% to 11.7 trillion yuan. Real estate development investment declines 9.6% to 11.1 trillion yuan. Additionally, SVB’s collapse fuels global economic uncertainty, raises fears of a crisis, and boosts China’s EPU. During this period, the negative impact of HP on EPU, can be explained in three ways. First, real estate plays a vital role in China’s economy. Falling HP reduces real estate investment and consumer demand, dragging down economic growth [76]. Facing a downturn, the government introduces stimulus policies, but uncertainty surrounding their effectiveness and direction increases. Second, HP declines raise default risks on mortgages and developer loans, threatening financial system stability [77]. Governments and regulators face tough choices between market intervention and systemic risk prevention, further fueling EPU. Third, HP drops cool the land market, slashing local government revenues and weakening their public spending and investment capacity [78]. In response, the government may adjust fiscal policies, which push up EPU.
To ensure the robustness of the quantitative findings, this study extends the control variable set beyond the initial interest rate (IR) by incorporating additional macroeconomic and financial indicators: money supply (M2) [79], the loan growth rate of financial institutions [80], the Consumer Price Index (CPI) [81], and the Shanghai Composite Index (SCI) [82]. These variables are included based on their well-documented influence on both EPU and HP. A subsequent regression analysis is performed using this expanded specification.
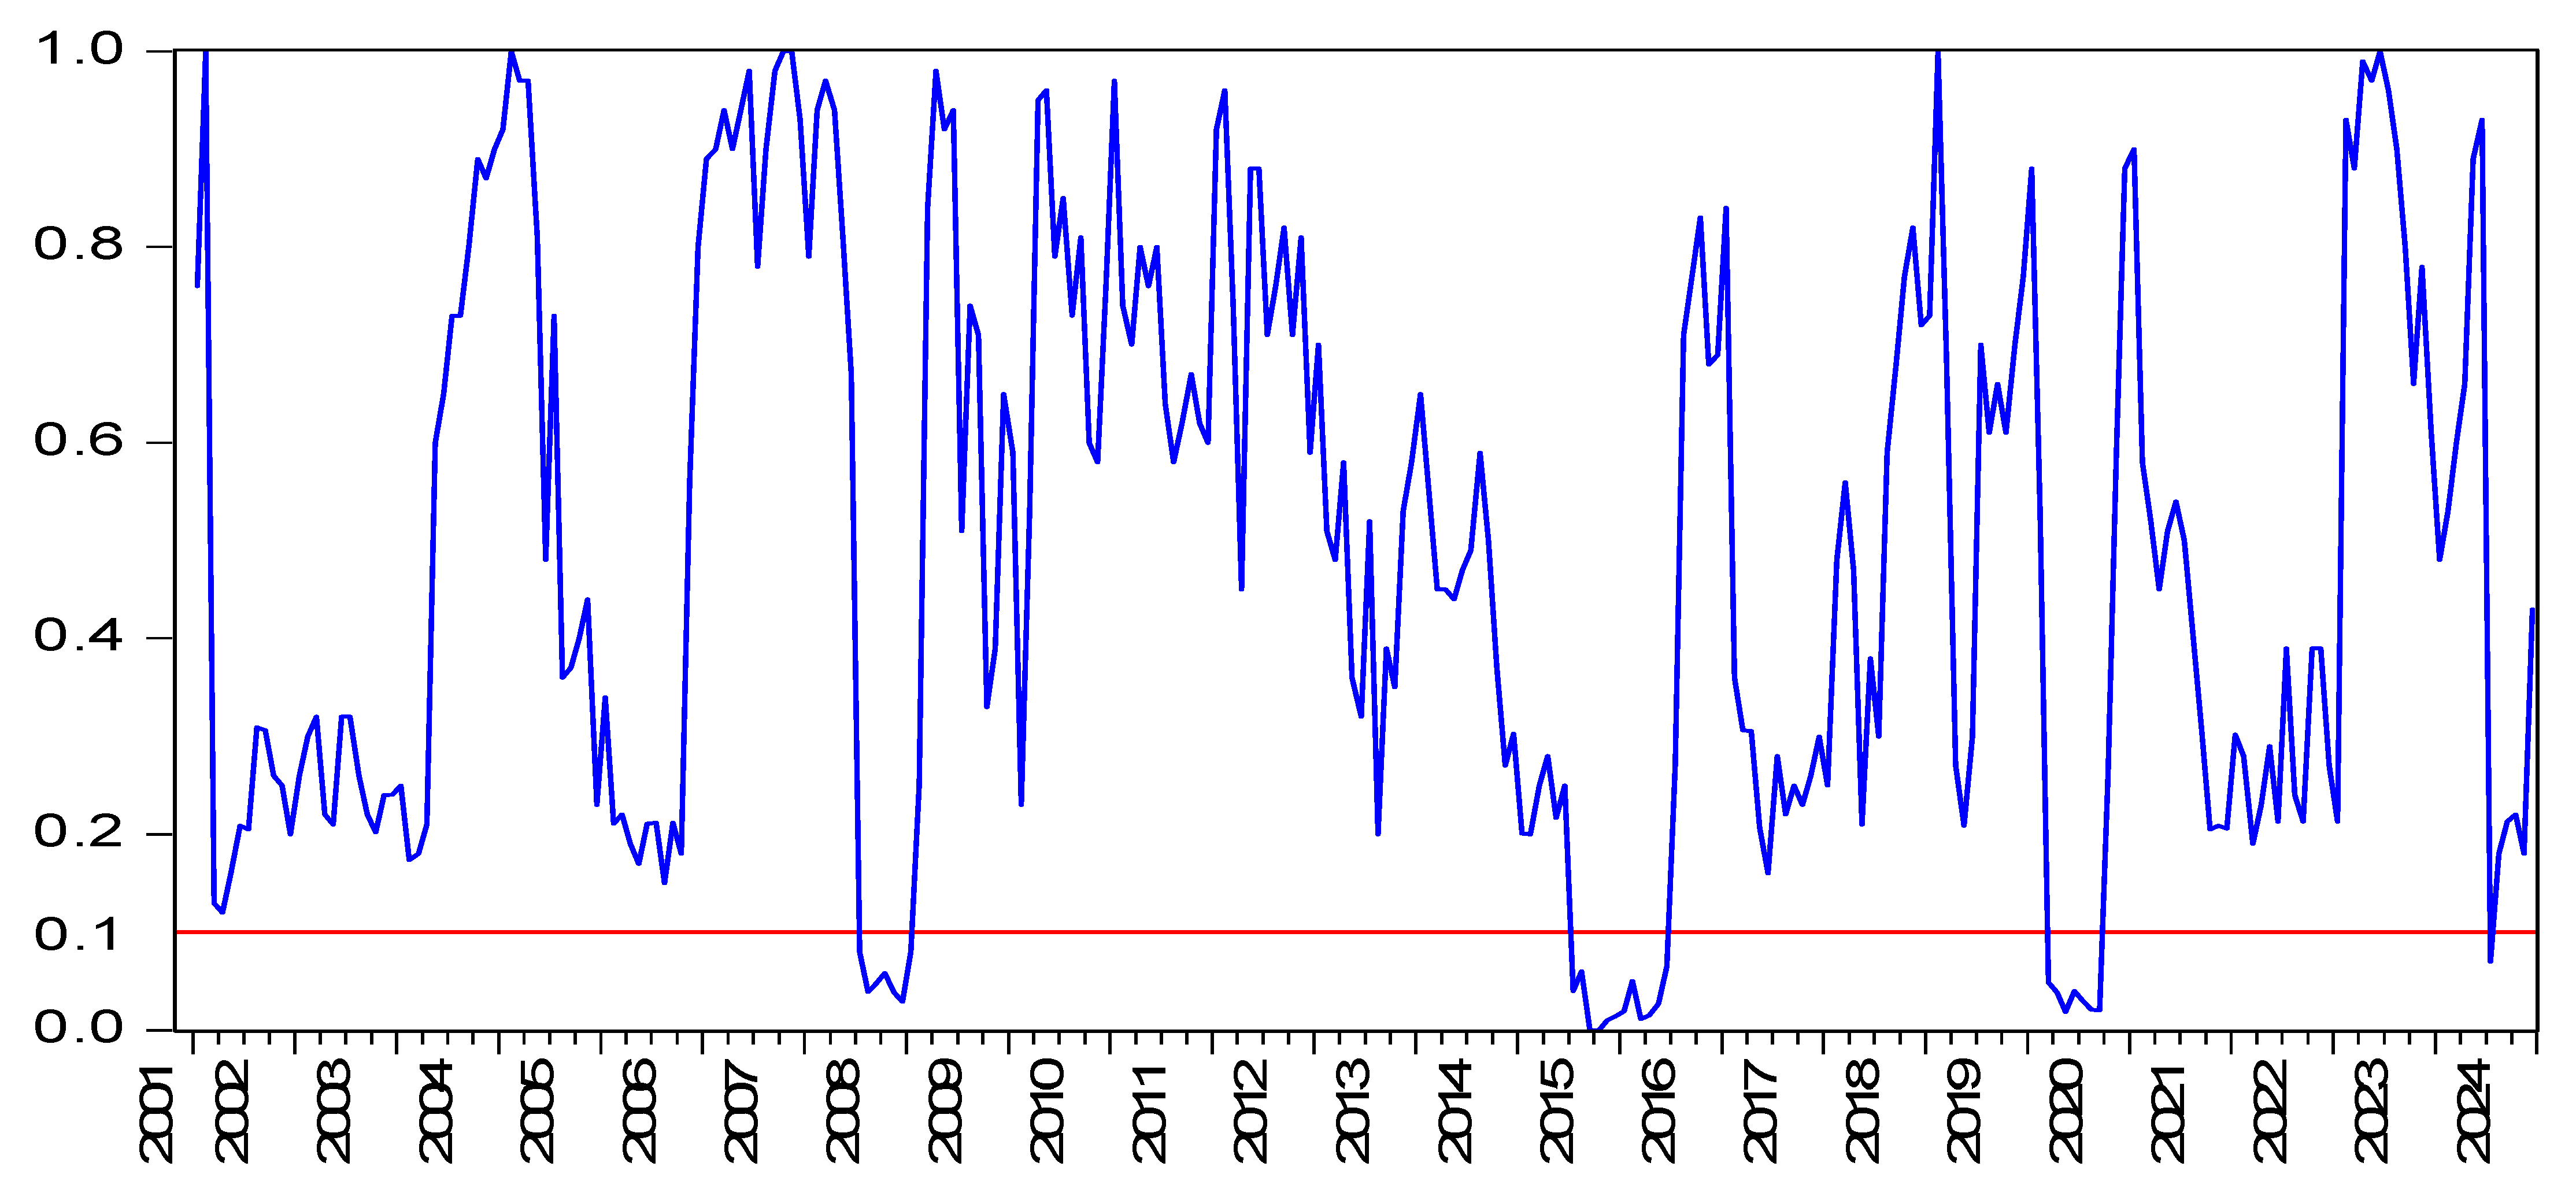
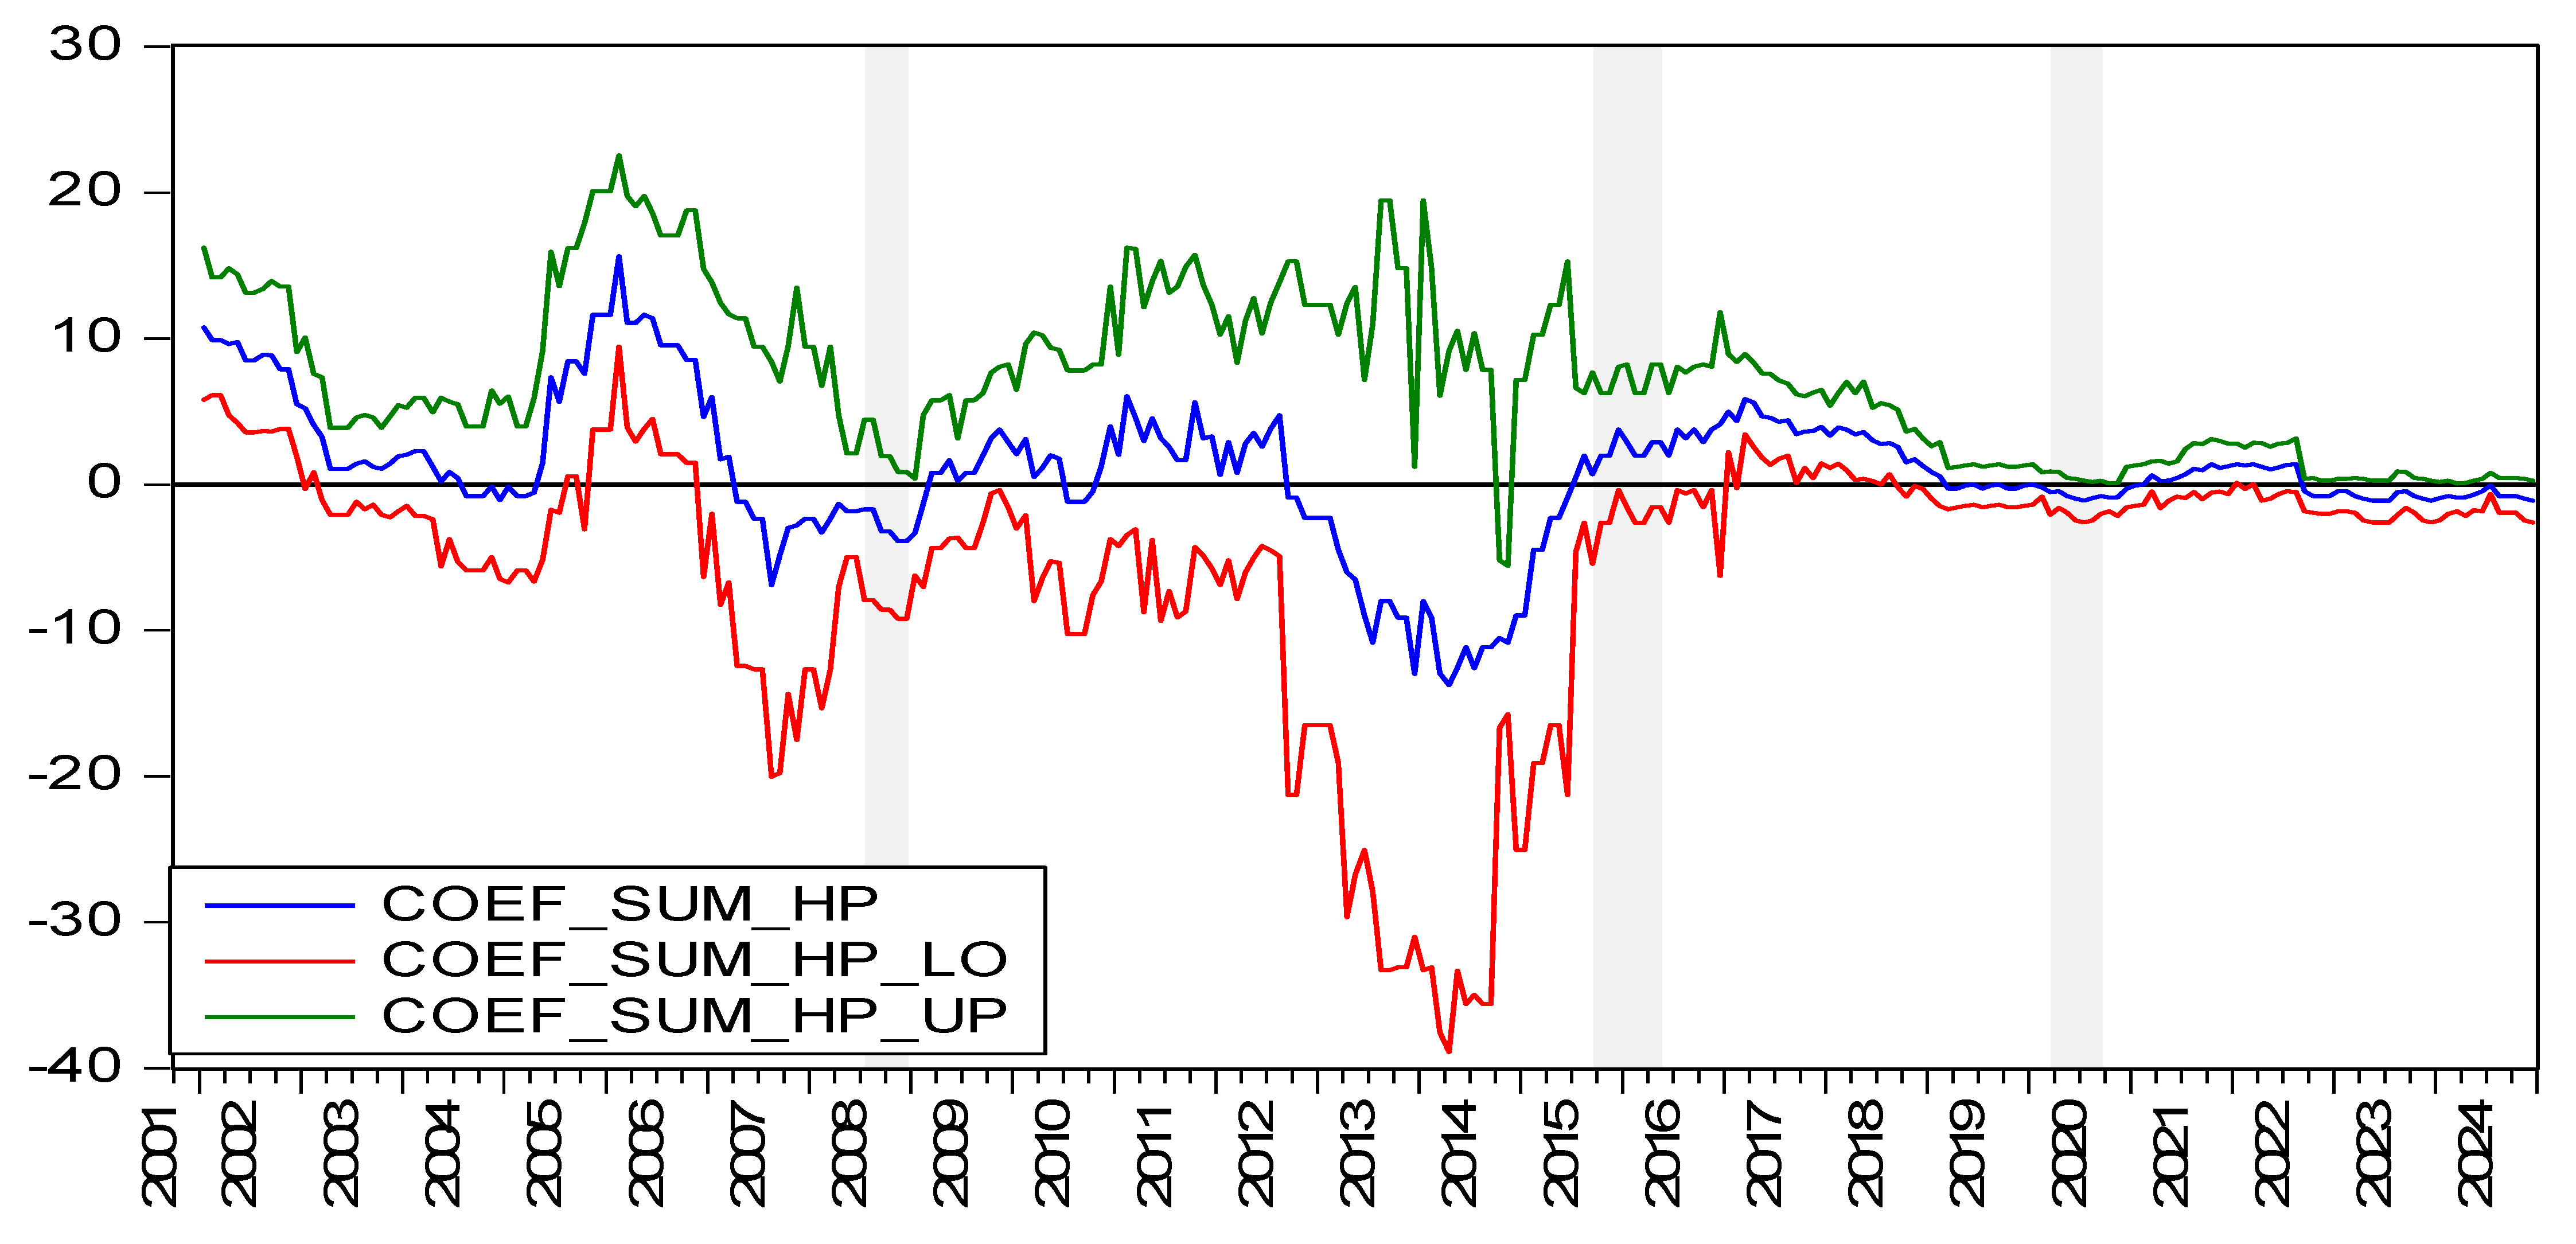
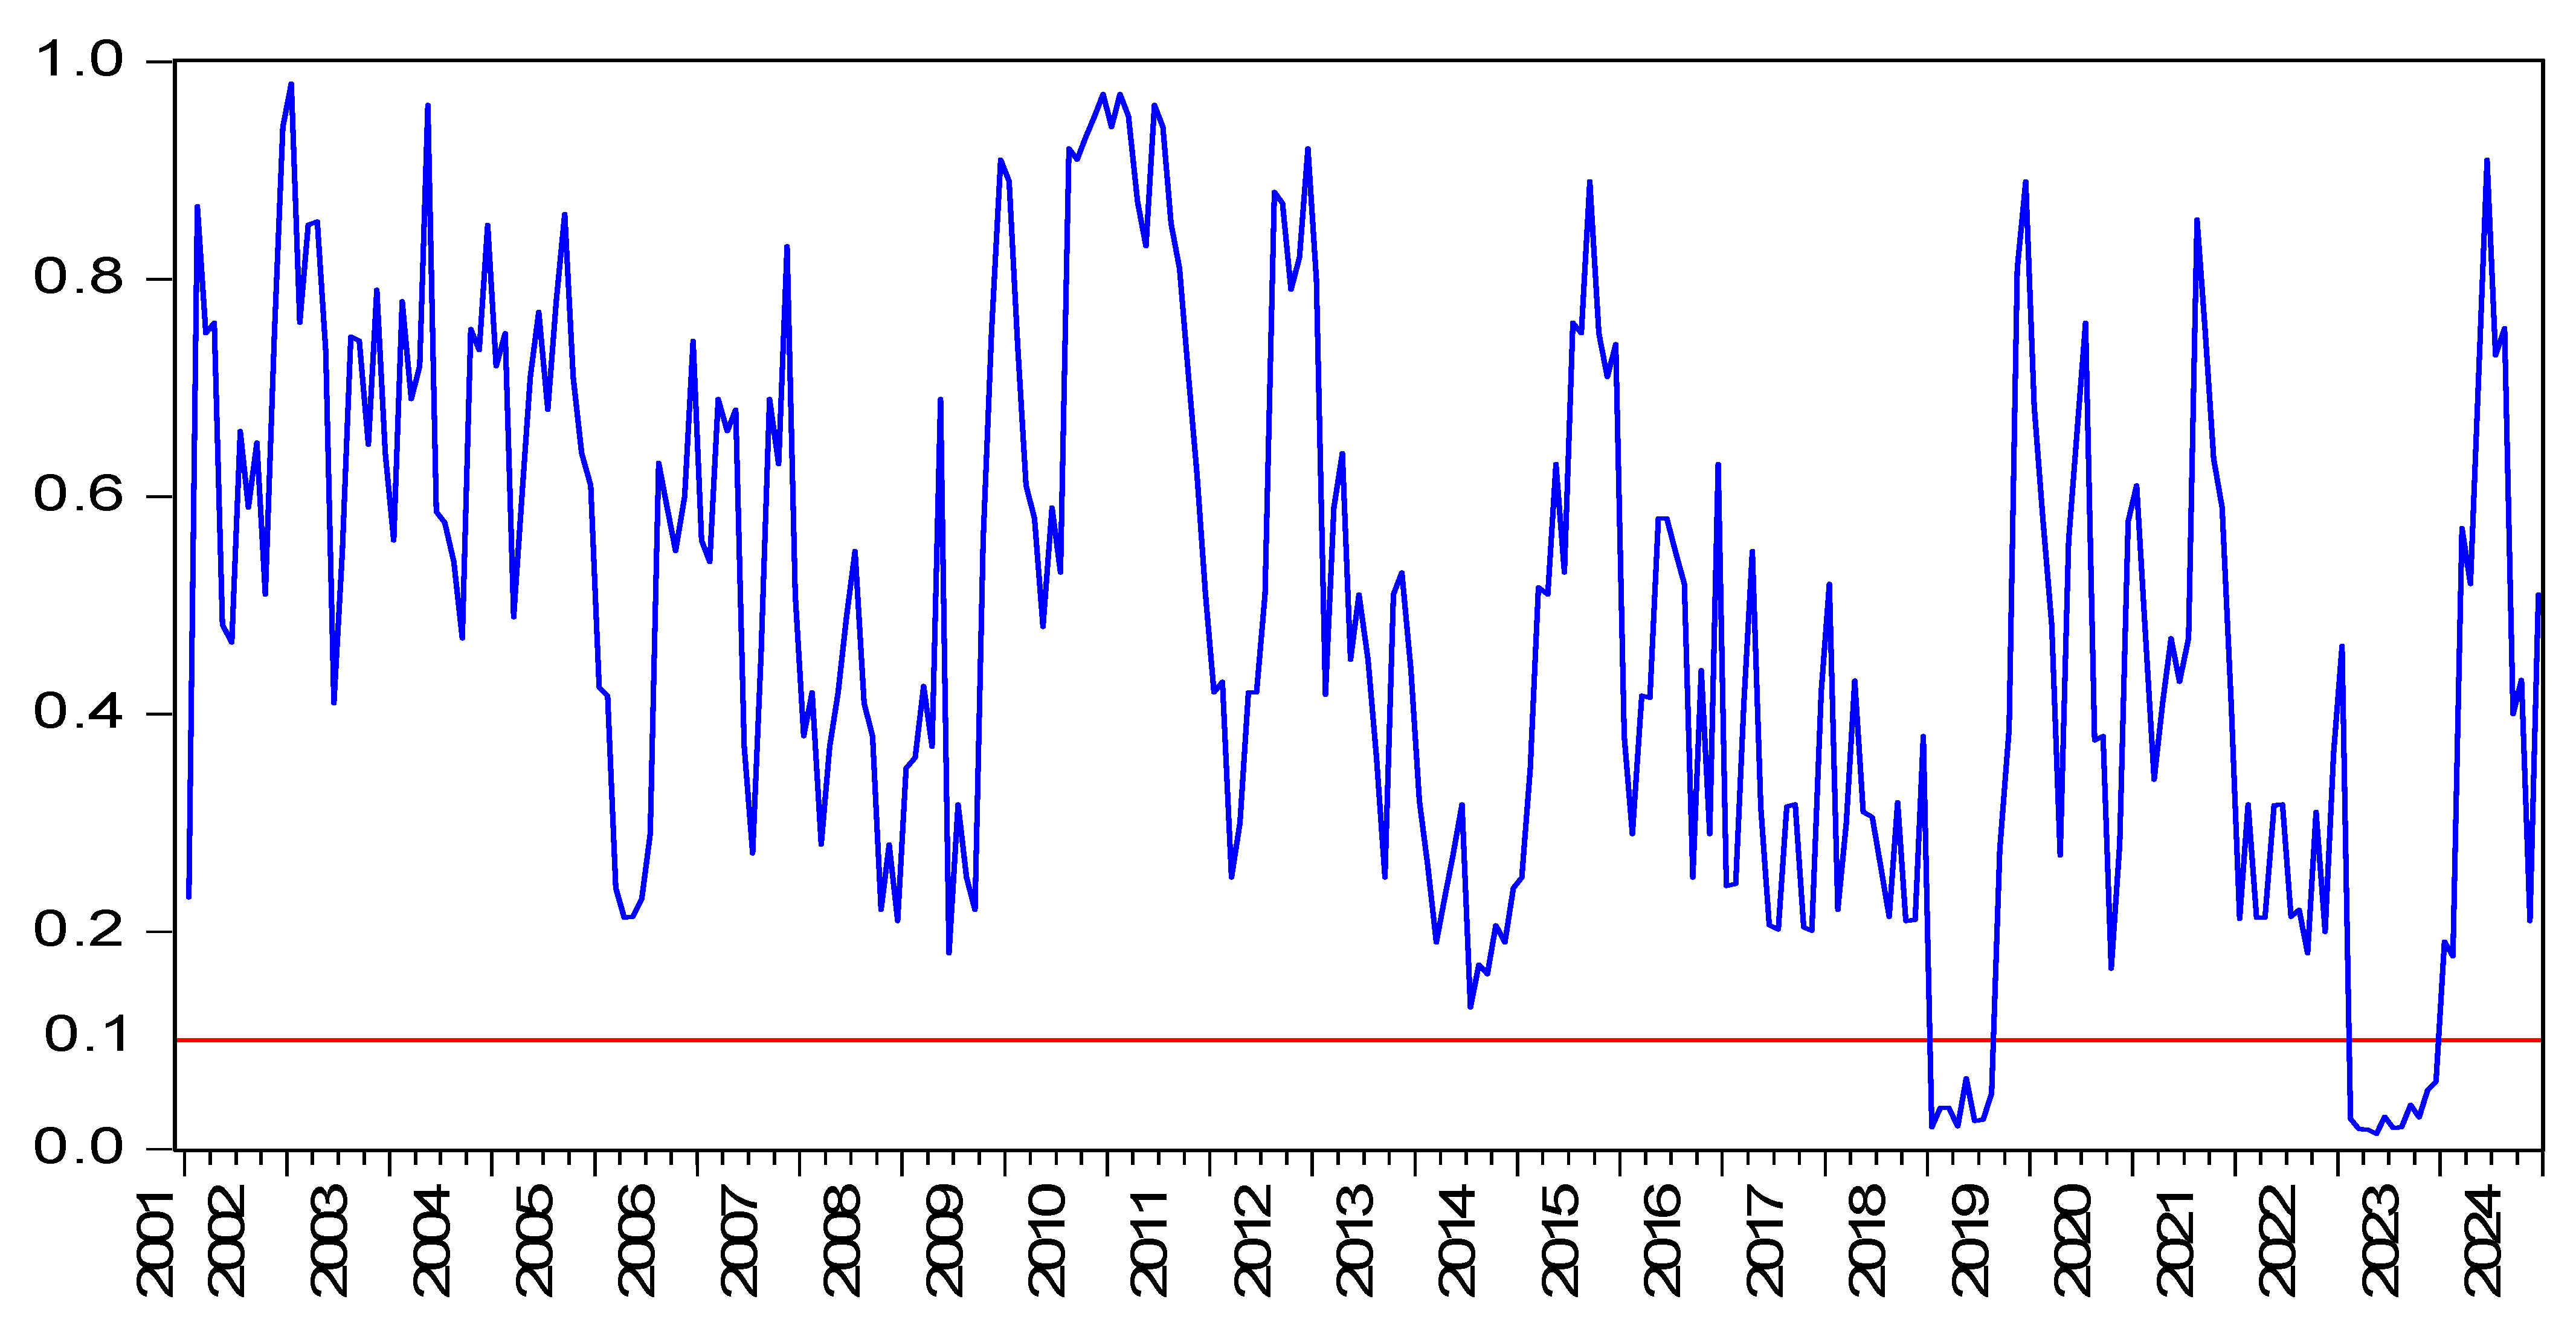
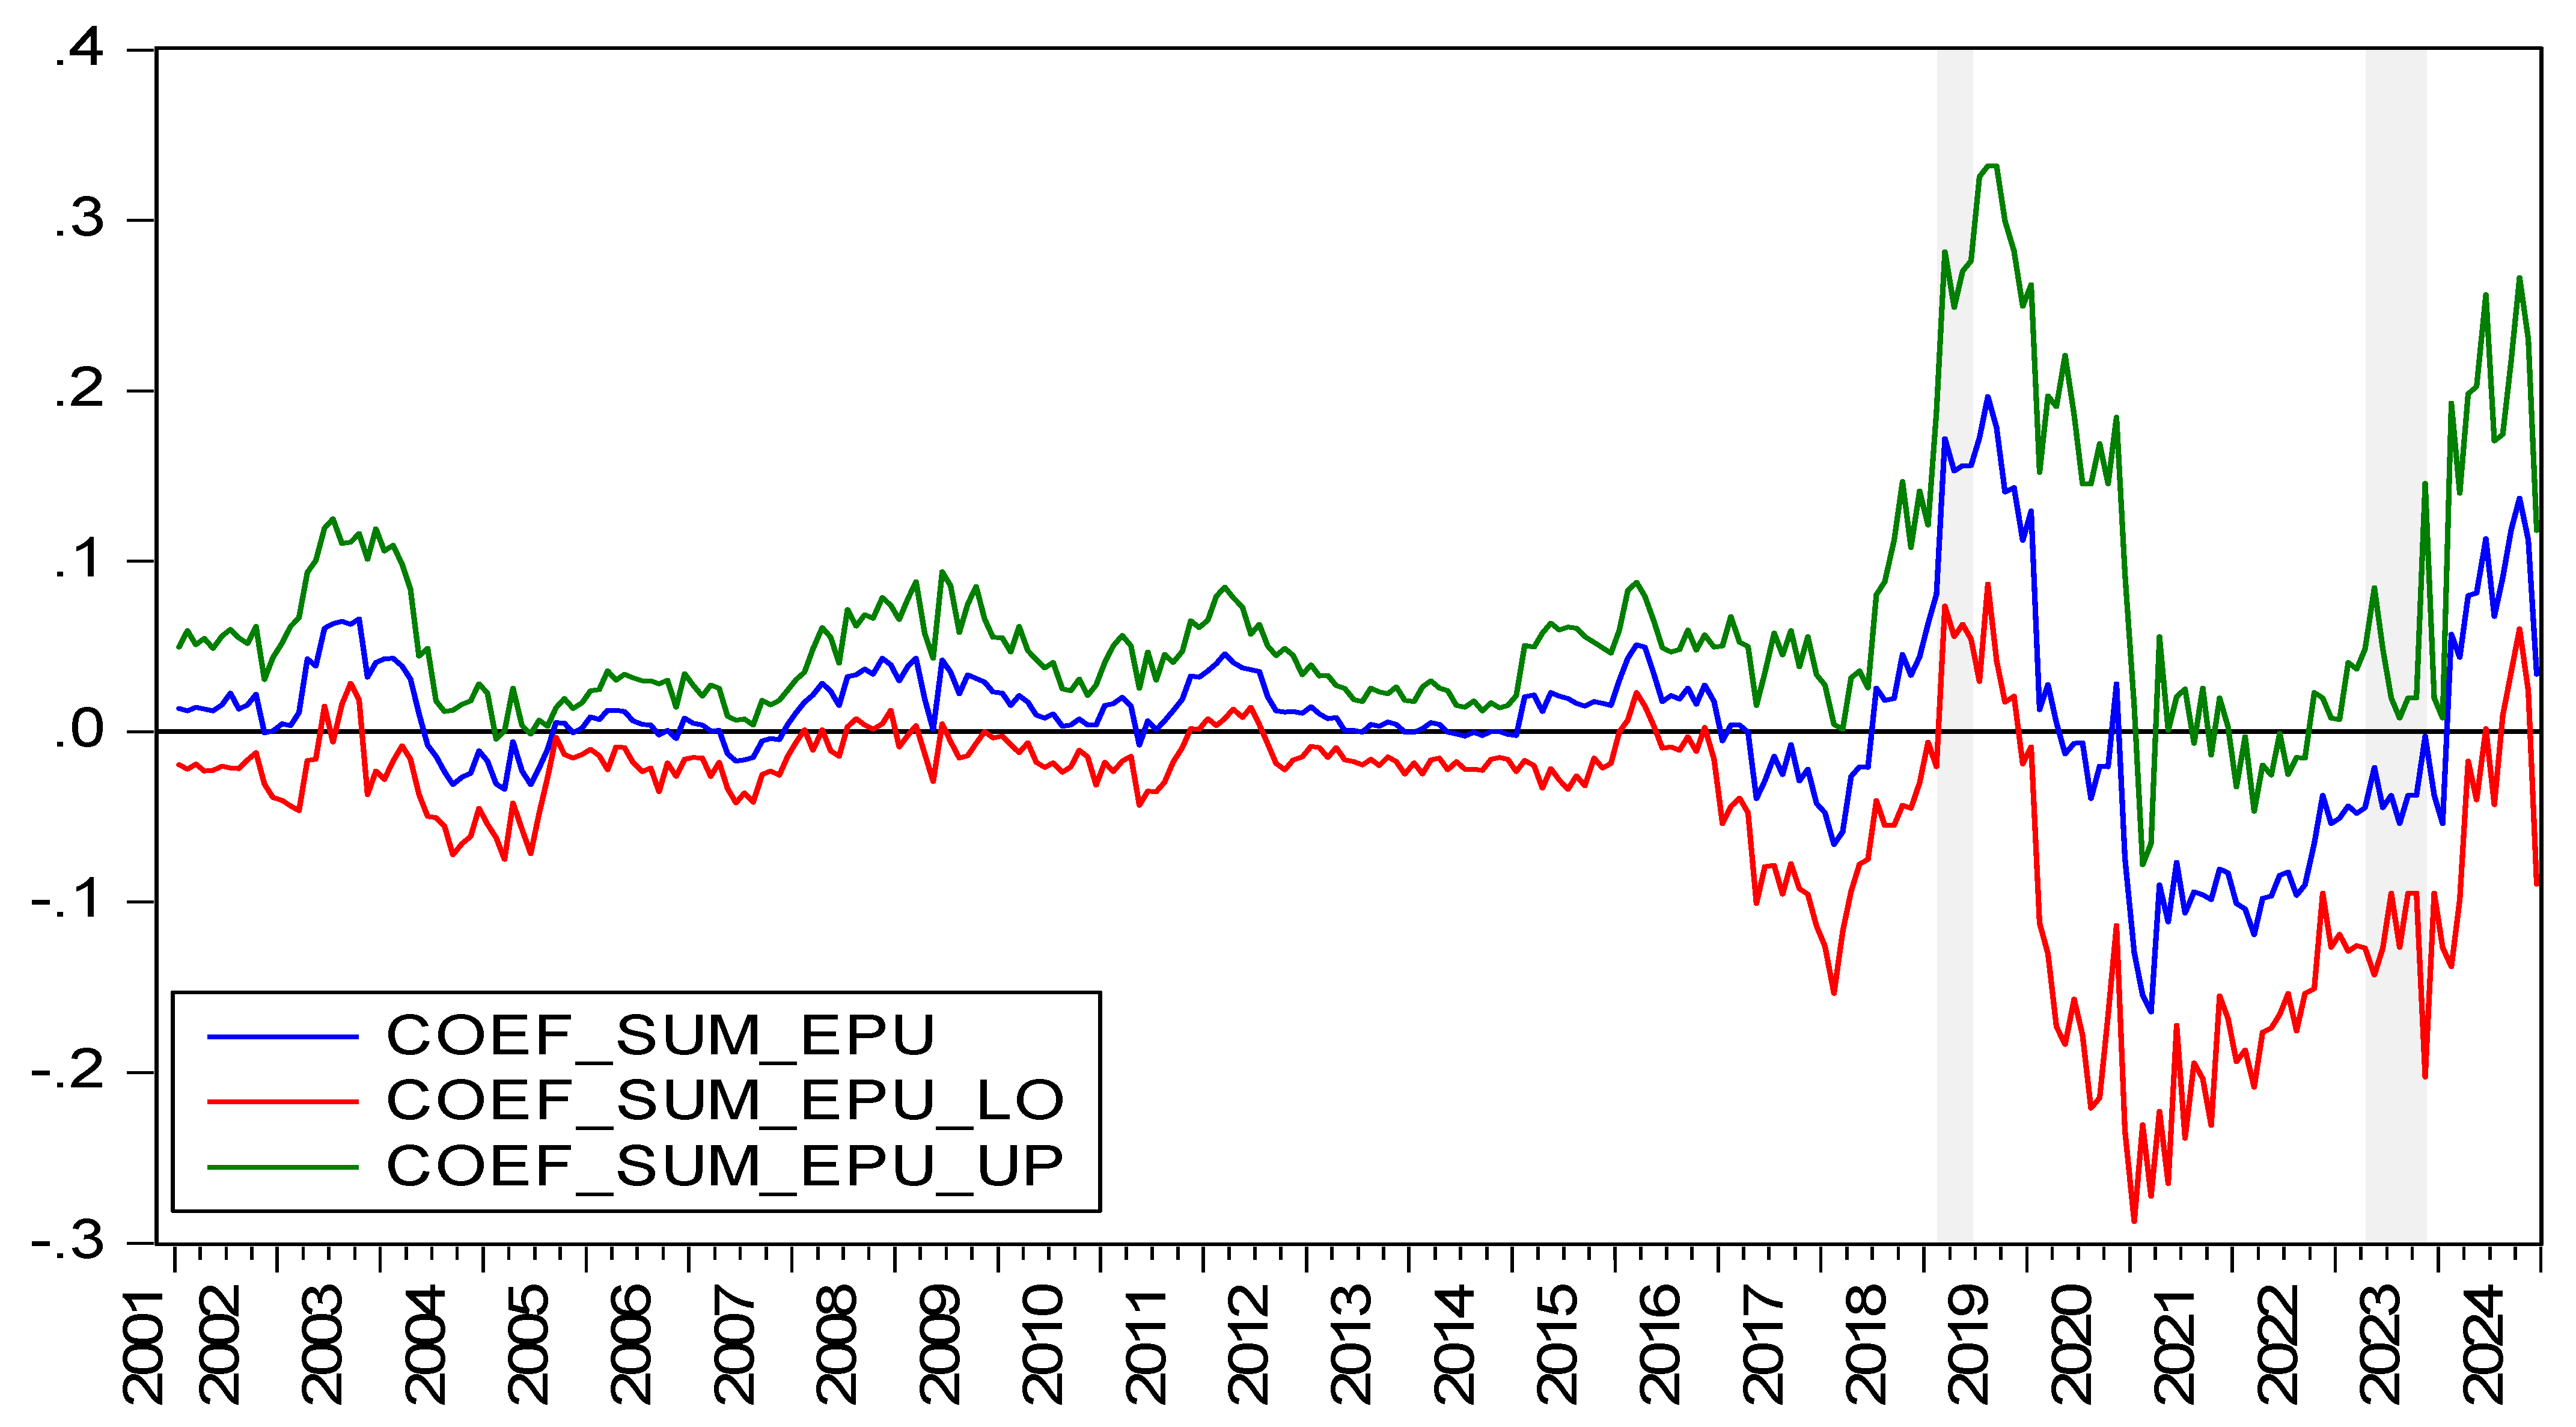
As illustrated in Figure 6, Figure 7, Figure 8 and Figure 9, the empirical results obtained with the augmented set of control variables remain consistent with those from the baseline model. This comparability across specifications reinforces the robustness of the quantitative analyses, suggesting that the core findings are not sensitive to the inclusion of these additional economic and financial controls.
In summary, the bootstrap full-sample method shows EPU and HP Granger-cause each other. However, this result is inconsistent when VAR(p) model coefficients are not constant. This study uses four parameter stability techniques to reveal abrupt structural shifts in EPU, HP, and the VAR(p) system. A more advanced sub-sample technique is then applied to explore the complex relationship. The findings show EPU can positively and negatively impact HP, and vice versa. The interaction between EPU and HP aligns with the general equilibrium model (GEM), which indicates that HP is influenced by EPU, but the direction cannot be definitively identified.

7. Conclusions and Policy Implications

This study explores the dynamic interplay between EPU and HP using the bootstrap rolling-window method. Empirical findings reveal that EPU exerts dual effects on HP. Reform-oriented EPU positively stimulates HP, whereas crisis-driven EPU negatively suppresses HP. Conversely, HP also influences EPU in both directions. Rapid HP appreciation triggers government regulatory measures, thereby elevating EPU, while HP downturns prompt market-rescue policies that similarly increase EPU.
Based on the research findings, the following policy recommendations are proposed: First, given the positive impact of reform-oriented EPU on HP, economically sensitive regions such as the Yangtze River Delta and Pearl River Delta should establish a policy buffer mechanism to mitigate market volatility induced by EPU. This entails announcing major real estate reform policies six months in advance with a one-year transition period. Concurrently, post-implementation evaluations should be conducted to dynamically adjust regulatory measures based on observed housing price responses. Second, a graded response mechanism should be established to counteract crisis-driven EPU depressive effects on housing markets. When EPU indices exceed historical means by one standard deviation, down payment ratios should automatically relax to 20%. At two standard deviations above mean, local governments should initiate stock housing repurchase programs. The most severe cases, such as three standard deviations above mean, warrant combined regional price decline restrictions and mortgage interest subsidies. Third, given the bidirectional EPU amplification from HP volatility, local governments must reduce real estate dependence through two complementary approaches: establish specialized industrial development funds tailored to local industry characteristics and comparative advantages, supporting sectoral upgrading and technological innovation; and, simultaneously, implement conditional land transfer policies that link residential development rights to binding commitments for investments in emerging industries.
While this study primarily validates the relationship between EPU and HP through statistical significance, the discussion on economic implications remains relatively limited. The nationwide analysis employed in this research may obscure heterogeneous responses across different regions, city tiers, or housing types.

Author Contributions

Y.G.: writing original draft. Y.W.: resources. C.S.: software. All authors have read and agreed to the published version of the manuscript.

Funding

This article did not receive any funding support.

Data Availability Statement

The original contributions presented in the study are included in the article; further inquiries can be directed to the corresponding author.

Conflicts of Interest

The authors declare no conflicts of interest.

References

  1. Wadud, I.M.; Bashar, O.H.M.N.; Ali Ahmed, H.J.; Dimovski, W. Property price dynamics and asymmetric effects of economic policy uncertainty: New evidence from the Australian capital cities. Account. Financ. 2022, 62, 4359–4380. [Google Scholar] [CrossRef]
  2. António, M.; Cunha, R.L. Housing price dynamics and elasticities: Portugal’s conundrum. Natl. Account. Rev. 2024, 6, 75–94. [Google Scholar]
  3. Liu, F.; Ren, H.; Liu, C. Housing price fluctuations and financial risk transmission: A spatial economic model. Appl. Econ. 2019, 51, 5767–5780. [Google Scholar] [CrossRef]
  4. Das, R.C.; Chatterjee, T.; Ivaldi, E. Nexus between Housing Price and Magnitude of Pollution: Evidence from the Panel of Some High- and Low Polluting Cities of the World. Sustainability 2022, 14, 9283. [Google Scholar] [CrossRef]
  5. Baker, S.R.; Bloom, N.; Davis, S.J. Measuring economic policy uncertainty. Q. J. Econ. 2016, 131, 1593–1636. [Google Scholar] [CrossRef]
  6. Hussain, R.Y.; Bajaj, N.K.; Kumari, S.; Al-Faryan, M.A.S. Does Economic Policy Uncertainty Affect Foreign Remittances? Linear and Non-linear ARDL Approach in BRIC Economies. Cogent Econ. Financ. 2023, 11, 2183642. [Google Scholar] [CrossRef]
  7. Amin, A.; Dogan, E. The role of economic policy uncertainty in the energy-environment nexus for China: Evidence from the novel dynamic simulations method. J. Environ. Manag. 2021, 292, 112865. [Google Scholar] [CrossRef]
  8. Al-Thaqeb, S.A.; Algharabali, B.G. Economic policy uncertainty: A literature review. J. Econ. Asymmetries 2019, 20, e00133. [Google Scholar] [CrossRef]
  9. Rodrik, D. Policy uncertainty and private investment in developing countries. J. Dev. Econ. 1991, 36, 229–242. [Google Scholar] [CrossRef]
  10. Wang, S.; Zeng, Y.; Yao, J.; Zhang, H. Economic policy uncertainty, monetary policy and housing price in China. J. Appl. Econ. 2020, 23, 235–252. [Google Scholar] [CrossRef]
  11. Shi, X.; He, Z.; Lu, X. The effect of home equity on the risky financial portfolio choice of Chinese households. Emerg. Mark. Financ. Trade 2018, 56, 543–561. [Google Scholar] [CrossRef]
  12. Yin, X.-C.; Li, X.; Wang, M.-H.; Qin, M.; Shao, X.-F. Do economic policy uncertainty and its components predict China’s housing returns? Pac.-Basin Financ. J. 2021, 68, 101575. [Google Scholar] [CrossRef]
  13. Huang, Y.; Luk, P. Measuring economic policy uncertainty in China. China Econ. Rev. 2020, 59, 101367. [Google Scholar] [CrossRef]
  14. Li, N.; Li, R.Y.M. A bibliometric analysis of six decades of academic research on housing prices. Int. J. Hous. Mark. Anal. 2024, 17, 307–328. [Google Scholar] [CrossRef]
  15. Ali, M.; Samour, A.; Joof, F.; Tursoy, T. Oil prices and gold prices on housing market in China: Novel findings from the bootstrap approach. Int. J. Hous. Mark. Anal. 2022, 17, 591–610. [Google Scholar] [CrossRef]
  16. Chien, M.-S.; Setyowati, N. The effects of uncertainty shocks on global housing markets. Int. J. Hous. Mark. Anal. 2021, 14, 218–242. [Google Scholar] [CrossRef]
  17. Balcilar, M.; Roubaud, D.; Uzuner, G.; Wohar, M.E. Housing sector and economic policy uncertainty: A GMM panel VAR approach. Int. Rev. Econ. Financ. 2021, 76, 114–126. [Google Scholar] [CrossRef]
  18. Fan, T.; Khaskheli, A.; Raza, S.A.; Shah, N. The role of economic policy uncertainty in forecasting housing prices volatility in developed economies: Evidence from a GARCH-MIDAS approach. Int. J. Hous. Mark. Anal. 2023, 16, 776–791. [Google Scholar] [CrossRef]
  19. Anoruo, E.; Akpom, U.N.; Nwoye, Y.D. Dynamic relationship between economic policy uncertainty and housing market returns in Japan. J. Int. Bus. Econ. 2017, 5, 28–37. [Google Scholar] [CrossRef]
  20. Ghosh, S. Housing price volatility: Uncertainty, an asymmetric econometric analysis-some European country experiences. Int. J. Hous. Mark. Anal. 2021, 14, 1004–1026. [Google Scholar] [CrossRef]
  21. Choudhry, T. Economic policy uncertainty and house prices: Evidence from geographical regions of England and Wales. Real Estate Econ. 2020, 48, 504–529. [Google Scholar] [CrossRef]
  22. Balcilar, M.; Uzuner, G.; Bekun, F.V.; Wohar, M.E. Housing price uncertainty and housing prices in the UK in a time-varying environment. Empirica 2023, 50, 523–549. [Google Scholar] [CrossRef]
  23. Soon, C.C. Impact of domestic economic policy uncertainty on the volatility of housing sale price and joense price, land price. Asia-Pac. J. Converg. Res. Interchange 2022, 8, 165–175. [Google Scholar]
  24. André, L.; Bonga-Bonga, R.; Gupta, J.W. Economic policy uncertainty, US real housing returns and their volatility: A nonparametric approach. J. Real Estate Res. 2017, 39, 493–513. [Google Scholar] [CrossRef]
  25. Antonakakis, N.; Gupta, R.; André, C. Dynamic co-movements between economic policy uncertainty and housing market returns. J. Real Estate Portf. Manag. 2015, 21, 53–60. [Google Scholar] [CrossRef]
  26. Bahmani-Oskoee, M.; Ghodsi, S.H. Policy uncertainty and housing prices in the United States. J. Real Estate Portf. Manag. 2017, 23, 73–85. [Google Scholar] [CrossRef]
  27. Jeon, J.H. The impact of Asian economic policy uncertainty: Evidence from Korean housing market. J. Asian Financ. Econ. Bus. 2018, 5, 43–51. [Google Scholar] [CrossRef]
  28. Sreenu, N. Dynamics of property prices and asymmetrical impacts of economic policy uncertainty: New evidence from Indian cities. Int. J. Hous. Mark. Anal. 2023. ahead of print. [Google Scholar] [CrossRef]
  29. Kirikkaleli, D.; Gokmenoglu, K.; Hesami, S. Economic policy uncertainty and house prices in Germany: Evidence from GSADF and wavelet coherence techniques. Int. J. Hous. Mark. Anal. 2021, 14, 842–859. [Google Scholar] [CrossRef]
  30. Alola, A.A.; Uzuner, G. The housing market and agricultural land dynamics: Appraising with economic policy uncertainty index. Int. J. Financ. Econ. 2020, 25, 274–285. [Google Scholar] [CrossRef]
  31. Su, C.W.; Li, X.; Tao, R. How does economic policy uncertainty affect prices of housing? Evidence from Germany. Argum. Oeconomica 2019, 42, 131–153. [Google Scholar] [CrossRef]
  32. Aye, G.C. Causality between economic policy uncertainty and real housing returns in emerging economies: A cross-sample validation approach. Cogent Econ. Financ. 2018, 6, 1473708. [Google Scholar] [CrossRef]
  33. El-Montasser, G.; Ajmi, A.N.; Chang, T.; Simo-Kengne, B.D.; André, C.; Gupta, R. Cross-country evidence on the causal relationship between policy uncertainty and housing prices. J. Hous. Res. 2016, 25, 195–211. [Google Scholar] [CrossRef]
  34. Xia, T.; Yao, C.X.; Geng, J.B. Dynamic and frequency-domain spillover among economic policy uncertainty, stock, and housing markets in China. Int. Rev. Financ. Anal. 2020, 67, 101427. [Google Scholar] [CrossRef]
  35. Chow, S.C.; Cunado, J.; Gupta, R.; Wong, W.K. Causal relationships between economic policy uncertainty and housing market returns in China and India: Evidence from linear and nonlinear panel and time series models. Stud. Nonlinear Dyn. Econom. 2018, 22, 20160121. [Google Scholar] [CrossRef]
  36. Zhao, H.M.H. Essays on Economic Uncertainty and Housing Market in China. Ph.D. Thesis, CUNY Academic Works, The City University of New York (CUNY), New York, NY, USA, 2021. p. 28539775. [Google Scholar]
  37. Hu, C.C.; Chen, X. Economic policy uncertainty, macroeconomic and asset price fluctuation: Based on TVAR model and spillover index. Chin. J. Manag. Sci. 2020, 28, 61–70. [Google Scholar]
  38. Huang, W.L.; Lin, W.Y.; Nin, S.L. The effect of economic policy uncertainty on China’s housing market. N. Am. J. Econ. Financ. 2020, 54, 100850. [Google Scholar] [CrossRef]
  39. Qu, Y.; Md Kassim, A.A. The impact of economic policy uncertainty on investment in real estate corporations based on sustainable development: The mediating role of house prices. Sustainability 2023, 15, 15318. [Google Scholar] [CrossRef]
  40. Pastor, L.; Veronesi, P. Uncertainty about government policy and stock prices. J. Financ. 2012, 67, 1219–1264. [Google Scholar] [CrossRef]
  41. Pastor, L.; Veronesi, P. Political uncertainty and risk premia. J. Financ. Econ. 2013, 110, 520–545. [Google Scholar] [CrossRef]
  42. André, C.; Gabauer, D.; Gupta, R. Time-varying spillovers between housing sentiment and housing market in the United States. Financ. Res. Lett. 2021, 42, 101925. [Google Scholar] [CrossRef]
  43. Li, X. Economic Policy Uncertainty and Corporate Cash Policy: International Evidence. J. Account. Public Policy 2019, 38, 106694. [Google Scholar] [CrossRef]
  44. Baker, S.R.; Bloom, N.; Davis, S.J.; Terry, S.J. COVID-Induced Economic Uncertainty; National Bureau of Economic Research: Cambridge, MA, USA, 2020. [Google Scholar]
  45. Hu, S.; Gong, D. Economic policy uncertainty, prudential regulation and bank lending. Financ. Res. Lett. 2019, 29, 373–378. [Google Scholar] [CrossRef]
  46. Toda, H.Y.; Phillips, P.C.B. Vector autoregression and causality. Econometrica 1993, 61, 1367–1393. [Google Scholar] [CrossRef]
  47. Shukur, G.; Mantalos, P. A simple investigation of the Granger-causality test in integrated-cointegrated VAR systems. J. Appl. Stat. 2000, 27, 1021–1031. [Google Scholar] [CrossRef]
  48. Shukur, G.; Mantalos, P. Size and power of the RESET test as applied to systems of equations: A bootstrap approach. J. Mod. Appl. Stat. Methods 2004, 3, 370–385. [Google Scholar] [CrossRef]
  49. Park, J.B.; Lee, T.R.; Oh, M.J. An empirical study on the contribution of interest rates to housing prices. Korean Assoc. Hous. Policy Stud. 2021, 29, 75–100. [Google Scholar] [CrossRef]
  50. Lee, C.; Park, J. The time-varying effect of interest rates on housing prices. Land 2022, 11, 2296. [Google Scholar] [CrossRef]
  51. Martin, C.; Schmitt, N.; Westerhoff, F. Housing markets, expectations formation and interest rates. Macroecon. Dyn. 2022, 26, 491–532. [Google Scholar] [CrossRef]
  52. De Mansilla, G.R.B. Interest rates, prices and housing transactions in Spain. Rev. Estud. Empres. 2023, 2, 5–26. [Google Scholar]
  53. McDonald, J.F.; Stokes, H.H. Monetary policy and the housing bubble. J. Real Estate Financ. Econ. 2013, 46, 437–451. [Google Scholar] [CrossRef]
  54. Hartzmark, S.M. Economic uncertainty and interest rates. Rev. Asset Pricing Stud. 2016, 6, 179–220. [Google Scholar] [CrossRef]
  55. Hsieh, Y.S.; Yang, C.W. The dominant risks in the interest rate channel: Evidence from the urban housing market. Appl. Econ. 2023, 56, 8091–8111. [Google Scholar] [CrossRef]
  56. Xin, B.; Jiang, K. Economic uncertainty, central bank digital currency, and negative interest rate policy. J. Manag. Sci. Eng. 2023, 8, 430–452. [Google Scholar] [CrossRef]
  57. Andrews, D.W.K. Tests for parameter instability and structural change with unknown change point. Econometrica 1993, 61, 821–856. [Google Scholar] [CrossRef]
  58. Andrews, D.W.K.; Ploberger, W. Optimal tests when a nuisance parameter is present only under the alternative. Econometrica 1994, 62, 1383–1414. [Google Scholar] [CrossRef]
  59. Nyblom, J. Testing for the constancy of parameters over time. J. Am. Stat. Assoc. 1989, 84, 223–230. [Google Scholar] [CrossRef]
  60. Hansen, B.E. Tests for parameter instability in regressions with I(1) processes. J. Bus. Econ. Stat. 1992, 20, 45–59. [Google Scholar] [CrossRef]
  61. Balcilar, M.; Ozdemir, Z.A.; Arslanturk, Y. Economic growth and energy consumption causal nexus viewed through a bootstrap rolling window. Energy Econ. 2010, 32, 1398–1410. [Google Scholar] [CrossRef]
  62. Su, C.W.; Lv, S.; Qin, M.; Norena-Chavez, D. Uncertainty and Credit: The Chicken or the Egg Causality Dilemma. Emerg. Mark. Financ. Trade 2024, 60, 2560–2578. [Google Scholar] [CrossRef]
  63. Fan, H.; Gao, X.; Zhang, L. How China’s accession to the WTO affects global welfare? China Econ. Rev. 2021, 69, 101688. [Google Scholar] [CrossRef]
  64. Jiang, Y.; Wang, Y. Price dynamics of China’s housing market and government intervention. Appl. Econ. 2020, 53, 1212–1224. [Google Scholar] [CrossRef]
  65. Yin, D.; Zhang, J.; Yu, X.; Xin, L. Causality between economic policy uncertainty and exchange rate in China with considering quantile differences. Theor. Appl. Econ. 2017, 24, 29–38. [Google Scholar]
  66. Dickey, D.A.; Fuller, W.A. Likelihood ratio statistics for autoregressive time series with a unit root. Econometrica 1981, 49, 1057–1072. [Google Scholar] [CrossRef]
  67. Phillips, P.C.B.; Perron, P. Testing for a unit root in time series regression. Biometrika 1988, 75, 335–346. [Google Scholar] [CrossRef]
  68. Kwiatkowski, D.; Phillips, P.C.B.; Schmidt, P.; Shin, Y. Testing the null hypothesis of stationarity against the alternative of a unit root. J. Econom. 1992, 54, 159–178. [Google Scholar] [CrossRef]
  69. Pesaran, M.H.; Timmermann, A. Small sample properties of forecasts from autoregressive models under structural breaks. J. Econom. 2005, 129, 183–217. [Google Scholar] [CrossRef]
  70. Hu, C.; Chen, X. Economic policy uncertainty, property market and macroeconomic fluctuations—A study of regional differences based on GVAR model. Explor. Econ. Issues 2019, 8, 11. [Google Scholar]
  71. Zhang, Q.; Chen, K.; Zhang, F. Risk spillover effect of resident leverage on corporate debt. Financ. Res. Lett. 2024, 65, 105551. [Google Scholar] [CrossRef]
  72. Hu, Z.Y.; Qian, J. The impact of housing price on entrepreneurship in Chinese cities: Does the start-up motivation matter? Cities 2022, 131, 104045. [Google Scholar] [CrossRef]
  73. Fan, W.; He, Y.; Hao, L.; Wu, F. Do high house prices promote the development of China’s real economy? Empirical evidence based on the decomposition of real estate price. PLoS ONE 2024, 19, e0295311. [Google Scholar] [CrossRef] [PubMed]
  74. Kuang, D.; Liu, P. Inflation and House Prices: Theory and Evidence from 35 Major Cities in China. Int. Real Estate Rev. 2015, 18, 217–240. [Google Scholar] [CrossRef]
  75. Zhang, P.; Sun, L.; Zhang, C. Understanding the role of homeownership in wealth inequality: Evidence from urban China (1995–2018). China Econ. Rev. 2021, 69, 101657. [Google Scholar] [CrossRef]
  76. Aizenman, J.; Jinjarak, Y.; Zheng, H. Housing Bubbles, Economic Growth, and Institutions. Open Econ. Rev. 2019, 30, 655–674. [Google Scholar] [CrossRef]
  77. Su, C.W.; Cai, X.Y.; Qin, M.; Tao, R. Can bank credit withstand falling house price in China? Int. Rev. Econ. Financ. 2021, 71, 257–267. [Google Scholar] [CrossRef]
  78. Yii, K.J.; Tan, C.T.; Ho, W.K.; Kwan, X.H.; Shim, N.F.; Tan, Y.Y.; Wong, K.H. Land availability and housing price in China: Empirical evidence from nonlinear autoregressive distributed lag (NARDL). Land Use Policy 2022, 113, 105888. [Google Scholar] [CrossRef]
  79. Bahmani-Oskooee, M.; Ghodsi, H.; Hadzic, M.; Marfatia, H. Asymmetric relationship between money supply and house prices in states across the U.S. Appl. Econ. 2023, 55, 3580–3608. [Google Scholar] [CrossRef]
  80. Ampudia, M.; Mayordomo, S. Borrowing constraints and housing price expectations in the euro area. Econ. Model. 2018, 72, 410–421. [Google Scholar] [CrossRef]
  81. Dias, D.A.; Duarte, J.B. Monetary policy, housing rents, and inflation dynamics. J. Appl. Econ. 2019, 34, 673–687. [Google Scholar] [CrossRef]
  82. Hong, Y.; Li, Y. House price and the stock market prices dynamics: Evidence from China using a wavelet approach. Appl. Econ. Lett. 2020, 27, 971–976. [Google Scholar] [CrossRef]
Figure 1. The trends in EPU and HP. Source: original work by the authors.
Buildings 15 01550 g001
Figure 2. Rolling-window Granger causality test p-values for the null hypothesis that EPU does not Granger-cause HP. Notes: the null hypothesis is rejected at the 10% significance level (p < 0.1), and the model shows good explanatory power (R2 > 0.5), consistent with standard econometric thresholds for time-series analysis. Source: original work by the authors.
Buildings 15 01550 g002
Figure 3. The coefficients for the effect of EPU on HP. Notes: a positive effect occurs when the blue line lies above zero, and a negative effect occurs when the blue line lies below zero. The model exhibits acceptable fit (R2 > 0.4) per time-series econometric norms. Source: original work by the authors.
Buildings 15 01550 g003
Figure 4. Rolling-window Granger causality test p-values for the null hypothesis that HP does not Granger-cause EPU. Notes: the null hypothesis is rejected at the 10% significance level (p < 0.1), and the model shows good explanatory power (R2 > 0.6), consistent with standard econometric thresholds for time-series analysis. Source: original work by the authors.
Buildings 15 01550 g004
Figure 5. The coefficients for the effect of HP on EPU. Notes: a positive effect occurs when the blue line lies above zero, and a negative effect occurs when the blue line lies below zero. The model exhibits acceptable fit (R2 > 0.5) per time-series econometric norms. Source: original work by the authors.
Buildings 15 01550 g005
Figure 6. Rolling-window Granger causality test p-values for the null hypothesis that EPU does not Granger-cause HP in stability test.
Buildings 15 01550 g006
Figure 7. Estimated coefficients representing the directional effect of EPU on HP in stability test.
Buildings 15 01550 g007
Figure 8. Rolling-window Granger causality test p-values for the null hypothesis that HP does not Granger-cause EPU in stability test.
Buildings 15 01550 g008
Figure 9. Estimated coefficients representing the directional effect of HP on EPU in stability test.
Buildings 15 01550 g009
Table 1. Descriptive statistics.
MeanMedianMaximumMinimumStandard DeviationSkewnessKurtosisJarque-Bera
EPU270.154151.865970.8309.007251.2841.2083.21870.132 ***
HP5785.6675586.27011970.2081984.1402770.1820.2711.78321.142 ***
IR4.0104.0505.2203.1000.6430.0401.70520.043 ***
Notes: *** denotes significance at the 1% level. Source: original work by the authors.
Table 2. Full-sample Granger causality tests.
TestsH0: EPU Does Not Granger Cause HPH0: HP Does Not Granger Cause EPU
Statisticsp-ValuesStatisticsp-Values
Bootstrap LR test2.8727440.054.1346960.08
Notes: p-values are computed using 10,000 bootstrap iterations. Source: original work by the authors.
Table 3. The parameter stability test.
TestsEPUHPVAR System
Statisticsp-ValueStatisticsp-ValueStatisticsp-Value
Sup-F27.810 ***0.00034.422 ***0.00045.565 ***0.000
Ave-F20.194 ***0.00012.199 ***0.00021.331 ***0.000
Exp-F11.772 ***0.00012.406 ***0.00018.175 ***0.000
Lc 2.926 ***0.000
Notes: p-values are computed using 10,000 bootstrap iterations. *** denote significance at the 1% levels. Source: original work by the authors.
Disclaimer/Publisher’s Note: The statements, opinions and data contained in all publications are solely those of the individual author(s) and contributor(s) and not of MDPI and/or the editor(s). MDPI and/or the editor(s) disclaim responsibility for any injury to people or property resulting from any ideas, methods, instructions or products referred to in the content.