1. Introduction
In light of increasing global extreme weather events and resource scarcities, sustainable development has become a shared concern across various sectors [
1,
2]. At the 2020 United Nations Summit, China introduced its “3060” objectives, aiming to reach carbon peaking by 2030 and carbon neutrality by 2060 (commonly known as the “dual carbon” goals) [
3,
4,
5,
6]. According to the
2024 Research Report on Carbon Emissions in China’s Urban and Rural Construction Sector, the total carbon emissions from building construction and operational activities in China reached 5.13 billion tonnes of CO
2 in 2022. This figure represents 48.3% of the nation’s total energy-related carbon emissions, underscoring the construction industry’s pivotal role as both a major carbon source and a critical leverage point for achieving national decarbonization goals. High energy consumption and carbon emissions present pressing challenges that must be addressed in the framework of these “dual carbon” goals. The construction sector’s efforts toward energy conservation and emissions reduction are vital for combating climate change and achieving carbon neutrality [
7,
8,
9]. Conventional buildings, characterized by standardized design practices and non-sustainable materials, exhibit elevated energy demands, inefficient resource utilization, and fragmented environmental governance. In contrast, green buildings prioritize lifecycle carbon reduction through energy-optimized design, renewable energy integration, closed-loop resource management, and smart operational systems, thereby achieving dual objectives: maximized energy performance and minimized ecological footprints. From an environmental perspective, promoting green buildings can reduce energy consumption by 50%, conserve 60% of water resources, and lower CO
2 emissions by 45% [
10]. The transformation of traditional construction methods toward green building practices has become an inevitable trend in the industry’s future development. Green buildings, which incorporate energy-saving technologies and environmentally friendly materials, can significantly reduce energy consumption and carbon emissions, thus contributing to climate change mitigation [
11,
12,
13]. Moreover, green buildings enhance the efficient use of renewable resources, minimizing harm to the natural environment and cultivating sustainable resource utilization [
14,
15].
Green building practices in China emerged relatively late, with the promulgation of the Design Standard for Energy Efficiency of Residential Buildings (Heating Section) in 1986, marking the country’s initial entry into the green building sector [
16]. The evolutionary game dynamics among governments, construction enterprises, and consumers constitute a critical mechanism influencing the achievement of carbon peaking and carbon neutrality goals [
17,
18], as illustrated in
Figure 1. As policy suppliers, governments drive industry transition through fiscal subsidies, tax incentives, and mandatory standards. Construction enterprises, as primary implementers, balance green technology investments with market competitiveness, and their strategic choices are shaped by policy intensity, consumer demand, and peer competition. Meanwhile, end-demand consumers face decision-making tensions between evolving environmental awareness and purchasing power constraints, yet their purchasing behaviors exert reciprocal influence on corporate supply strategies and governmental policy adjustments [
19].
The green building sector is currently in a rapid development phase, with extensive scholarly attention on strategies to advance its growth [
20,
21]. However, despite the progress in theoretical research, practical challenges persist: insufficient policy coordination among Chinese governmental institutions, weak motivation for green transformation in construction enterprises, and pronounced awareness–behavior problems among consumers. This study addresses these problems by developing a tripartite evolutionary game model involving governments, enterprises, and consumers. The model elucidates multi-agent evolutionary trajectories and stability conditions under China’s dual carbon goals, validated through numerical simulations. Our findings provide a scientific foundation for refining policy formulation and market optimization in green building promotion.
The subsequent sections of this paper are structured as follows:
Section 2 reviews the existing literature, identifies research gaps, and outlines the theoretical framework.
Section 3 develops a tripartite evolutionary game model and analyzes its stability conditions.
Section 4 validates the model through numerical simulations.
Section 5 proposes actionable strategies for green building adoption.
Section 6 and
Section 7 present the discussion and conclusions, respectively, integrating theoretical insights with simulation outcomes.
2. Literature Review
As research on green buildings has intensified in recent years, they have become a focal point of societal interest [
22,
23,
24,
25]. Green buildings are a prominent topic in global architectural research and development, representing the construction industry’s response to environmental challenges. Their implementation and promotion have gained significant traction in developed countries [
26,
27,
28,
29,
30]. Over recent decades, researchers have explored green buildings from diverse perspectives, focusing on assessment frameworks [
31,
32], sustainable materials [
33,
34,
35], regulatory policies [
36,
37], consumer preferences [
38,
39], and design innovations [
40,
41,
42]. Notable contributions include the following: Wu et al. (2023) developed a green performance evaluation system, integrating Building Information Modeling (BIM) data models with expert knowledge, validating its applicability in practice [
32]. Yin et al. (2019) evaluated the governance mechanisms involved in the shift from the building material industry (BMI) to a green BMI (GBMI), considering both supply-side and demand-side perspectives [
33]. Qian et al. (2022) expanded complex systems theory by analyzing green supply chains in construction under technology subsidies [
36]. Li and He (2024) employed duopoly competition models and Stackelberg games to reveal profit mechanisms in green material supply chains under consumer preference influences [
39]. Zhong et al. (2024) established tailored guidelines for 3D green spaces in buildings, addressing technical specifications and plant maintenance [
42]. Collectively, these studies provide a foundational framework for advancing green building adoption.
The promotion of green buildings is influenced by multiple factors. For instance, insufficient government support and high construction costs pose significant challenges [
43]. Demand from project partners and societal awareness are also critical drivers [
44]. Rising construction costs, coupled with low awareness and demand among investors (owners), further hinder adoption [
45]. Government policy formulation and implementation play a pivotal role in shaping green building development [
22,
46]. Additionally, studies have classified these factors hierarchically to assess their differential impacts [
47,
48]. Barriers to green building adoption—including policy incentives, incremental costs, corporate green transition commitments, and public awareness—are consistent across nations, as observed in China and elsewhere [
49]. Collectively, these studies establish a foundational framework for advancing green building initiatives.
The promotion of green buildings requires coordinated participation from multiple stakeholders. As a pivotal stakeholder, governments influence user decisions through policy interventions [
50]. Beyond policy support, long-term economic benefits serve as effective incentives for behavioral shifts among enterprises and owners [
51]. Scholars have further explored inter-stakeholder dynamics, demonstrating that stakeholders’ knowledge significantly shapes their behavioral choices [
52]. Additionally, well-designed subsidy mechanisms can align interests among governments, developers, and buyers to accelerate green building adoption [
53]. These findings collectively underscore the necessity of multi-actor collaboration in advancing sustainable construction practices.
While research on green buildings has achieved significant progress, it is still plagued by several problems in its promotion. Firstly, the low level of innovation and high construction cost are barriers to the development of green building projects [
36]. Secondly, consumers are often unaware of the economic efficiency and health benefits of green buildings and are thus reluctant to make purchases due to the higher incremental cost [
39]. Meanwhile, construction companies suffer from a revenue–expense mismatch during the development of green buildings, which largely impedes their popularity. While green buildings contribute to evident environmental, social, and economic benefits, the development and adoption of green buildings will only be considered with consensus if the interests of the key market participants are assured.
In response, a large body of literature has explored the behavior of various market participants and the effective intervention policies of governments. Evolutionary game theory is well acknowledged for its powerful iterative and interactive quantitative analysis methods in resolving multi-dimensional game problems among different stakeholders [
33,
54,
55,
56]. In addressing game–theoretic problems among stakeholders in green building promotion, Zhao et al. investigated how carbon tax policies influence stakeholder engagement in low-carbon development [
49,
57]. Lu et al. developed an evolutionary game model between governments and developers, examining government incentives’ impact on developers’ decision-making within the dynamic trajectories of green building industries [
58]. Chen et al. analyzed intrinsic mechanisms governing behavioral evolution between government agencies and construction enterprises [
59]. Qian and Yu proposed a tripartite evolutionary game model to study principal behaviors in China’s green residential market [
9], while Feng et al. established a three-stage game framework to explore construction enterprises’ selection mechanisms under government regulation, considering inter-organizational correlations [
18].
Existing research on the relationships among various stakeholders in the green building market has made considerable strides, laying a solid foundation for future investigations. Nevertheless, several limitations persist: (1) Current studies have not adequately addressed the effect of social reputation in scenarios involving active government regulation; research on stakeholders’ interactive decision-making often focuses on a limited set of initial conditions and (2) Most game models in existing studies, being simplistic and based on static reward and punishment mechanisms, struggle to accurately reflect the complexities of real-world situations. To address these shortcomings, this study constructs a tripartite game model involving the government, construction companies, and consumers under a static reward and punishment mechanism. It introduces a nonlinear dynamic reward and punishment system to address the instability .
The primary contributions of this paper are threefold: (1) Taking into account the government’s reputation, this study develops a triadic evolutionary game model, including the government, construction enterprises, and consumers. It simulates the evolutionary paths of various stakeholders in the green building market under diverse initial conditions. (2) To better reflect objective reality, this paper incorporates a nonlinear dynamic reward and punishment mechanism that links governmental incentives and penalties for construction enterprises to regulatory measures and the additional costs incurred by these enterprises. (3) Through simulation examples, this paper analyzes the effect of three key parameters—government reputation , additional costs incurred by enterprises , and the indirect benefits to consumers —on the stakeholders involved.
3. Tripartite Evolutionary Game Model
3.1. Model Overview
Evolutionary game theory provides a theoretical framework for analyzing multi-party interest games in green building promotion through a dynamic perspective. It focuses on strategic interactions among individuals, the evolution of group behaviors, and their mutual influences on environmental factors, thereby revealing underlying mechanisms and driving forces in green building adoption.
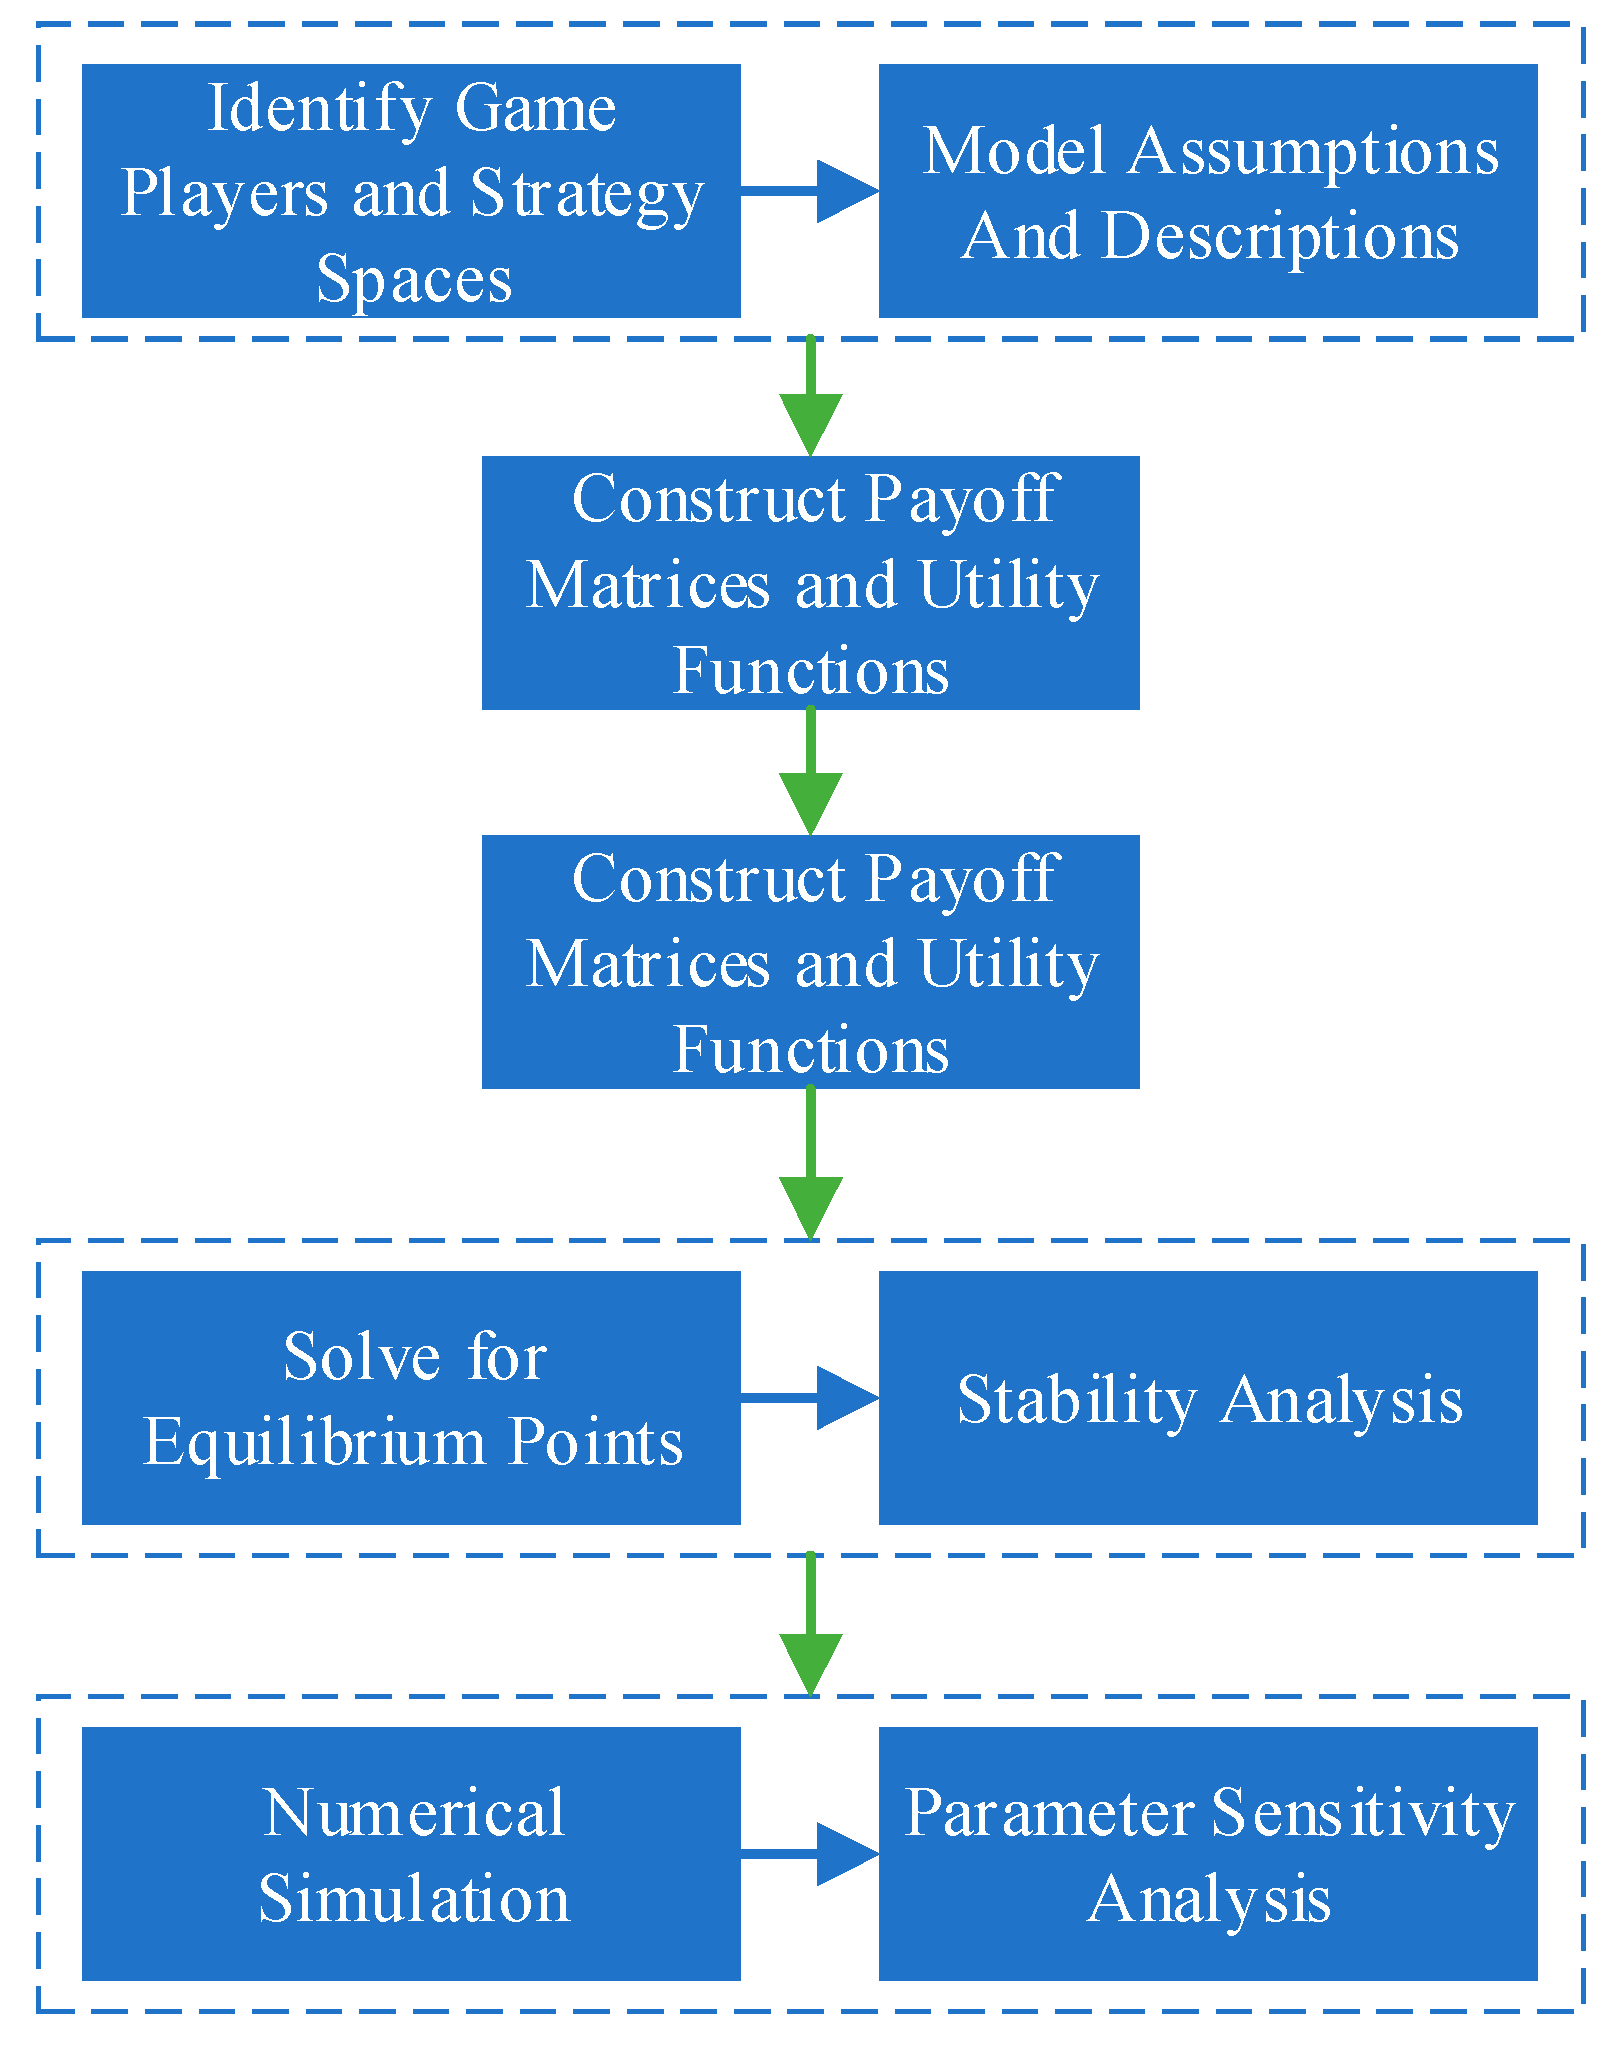
In green building markets, governments, construction enterprises, and consumers form core stakeholders. Their strategic choices are shaped by cost–benefit considerations, policy incentives, and market feedback. Individuals and groups adjust strategies based on self-interest and external influences, including interactions with others. Evolutionary game theory captures how these strategies emerge and evolve over time. The modeling steps are outlined below (
Figure 2):
Step 1. Identify Game Players and Strategy Spaces
Define key stakeholders and their feasible strategies based on the research context. Establish model assumptions and describe participant roles.
Step 2. Construct Payoff Matrices and Utility Functions
Determine payoff values under different strategy combinations to build a payoff matrix.
Step 3. Formulate Replicator Dynamic Equations
Develop replicator dynamic equations based on the payoff matrix to describe the temporal evolution of participants’ strategies.
Step 4. Solve Equilibrium Points and Stability Analysis
Set derivatives of all replicator equations to zero to identify system equilibria. Evaluate stability by analyzing the eigenvalues of the Jacobian matrix at equilibrium points.
Step 5. Numerical Simulations and Parameter Sensitivity Analysis
Validate model effectiveness through numerical simulations. Adjust key parameters to assess their impacts on evolutionary trajectories.
Next, we studied the dynamic game between the government, construction enterprises, and consumers in the promotion of green buildings, following the steps mentioned above.
3.2. Model Assumptions and Description
(1) In dynamic games, governments, construction enterprises, and consumers iteratively adjust strategies through trial-and-error, imitation, and experience-driven revisions, aligning with the pursuit of “satisficing solutions” under bounded rationality rather than static optimality under full rationality assumptions. Therefore, this work assumes that all three parties are bounded rationality;
(2) These three parties are cognizant of each other’s payoffs and strategy choices. In the short-term equilibrium state, they can achieve a Nash equilibrium solution and engage in a static game [
16,
60];
(3) In the game model, each party faces a different set of strategic options. The government may opt for active regulation or loose oversight; construction enterprises can choose between developing green or traditional buildings; and consumers can decide whether to purchase green buildings;
(4) Regarding the probability of selecting different strategies, x represents the probability of the government actively regulating green building development, y denotes the probability of construction enterprises developing green buildings, and z signifies the probability of consumers purchasing green buildings. The probabilities that the three parties choose their opposing strategies are , , and , respectively, where ;
(5) The government can cultivate the green building market through various means, including regulatory rewards or penalties, subsidies, and tax incentives for construction enterprises and consumers based on their green behavior.
- 2.
Model Description
Governments, construction enterprises, and consumers form the core stakeholders in advancing green building initiatives. The government’s primary objective is to facilitate the large-scale adoption of green buildings to meet sustainability targets. As a regulatory authority, it must balance public trust and institutional credibility with the imperative to enforce market governance frameworks. Beyond establishing regulations, the government is responsible for overseeing compliance and designing incentive mechanisms that align stakeholder incentives while mitigating conflicts of interest among the three parties [
61].
For construction enterprises, the primary aim is to maximize profits. Throughout this game process, they are subject to oversight from both governmental bodies and consumers. When they opt to develop green buildings, they become eligible for government subsidies but simultaneously face additional expenses associated with research, development, and construction. Should consumers refrain from purchasing green buildings, the construction enterprises incur the resulting financial losses. Consumers, for their part, enjoy a comparative advantage in decision-making, as they have the freedom to choose between green and traditional buildings. Their purchasing preferences affect the supply decisions of construction enterprises and influence the government’s reward or penalty strategies. Therefore, a higher ratio of green building transactions proves advantageous for the low-carbon, environmentally friendly shift in the construction industry, finally deriving greater environmental benefits [
10].
This paper aims to boost the prevalence of green building transactions by analyzing the behavioral evolution of the three key stakeholders involved in promoting eco-friendly construction, leveraging game theory. The objective can be realized only when all construction enterprises adopt green building strategies and consumers choose to purchase such properties.
Table 1 presents the symbols employed in the model.
Building on the previously mentioned model assumptions, eight potential strategy combinations exist in the evolutionary game involving the government, construction enterprises, and consumers. Drawing from the parameter assumptions and strategy combinations in the game model, we calculated the payoff matrix for each scenario, as illustrated in
Table 2.
Evolutionary game theory suggests that participants tend to replicate strategies that offer higher payoffs in their group. The magnitude of the payoff directly corresponds to the level of fitness. For any given individual, the shift in the probability of exhibiting a particular behavior demonstrates a positive correlation with the gap between its fitness and the group’s average fitness [
62,
63]. In this study, we applied replicator dynamic equations to illustrate the pace and orientation of strategy adjustments for the government, construction enterprises, and consumers.
The expected payoffs for the government under active regulation and lenient regulation are represented by
and
. The average expected payoff for the government is denoted by
, and the rate of change in the government’s active regulation strategy is expressed by
:
Similarly, the expected payoffs for construction enterprises from their development of green buildings and traditional buildings are represented by
and
, respectively, with an average expected payoff of
. The rate of change in the probability in which construction enterprises choose green building strategies is denoted by
; therefore, the following equation can be given:
The expected payoffs for consumers’ purchases of green buildings and traditional buildings are represented by
and
, respectively, with an average expected payoff of
. The rate of change in the probability in which consumers purchase green buildings is denoted by
; therefore, the following equation can be given:
where
,
, and
represent the replicator dynamic system for the evolutionary game that involves the government, construction enterprises, and consumers.
When
= 0,
= 0, and
= 0, the strategy adjustments for all three parties (government, construction enterprises, and consumers) are zero, signifying that the system has reached a relatively stable equilibrium state. By solving this system of replicator dynamic equations, eight pure strategy Nash equilibrium solutions can be obtained:
,
,
,
,
,
,
, and
. Next, by taking the partial derivatives of the replicator dynamic system (13) with respect to
x,
y, and
z, the Jacobian matrix of the system was constructed as follows:
where
3.3. Stability Analysis
By analyzing the local stability of the Jacobian matrix, we identified the Evolutionarily Stable Strategies (ESSs). In evolutionary game theory, equilibrium points are considered ESSs when all eigenvalues of the Jacobian matrix are non-positive [
64,
65,
66].
Table 3 presents a summary of the stability analysis results for the previously mentioned equilibrium points.
Drawing upon industry life-cycle theory, this study evaluated the stability conditions of the green building industry. The industry life cycle describes how various sectors progress from their emergence to eventual decline [
67,
68,
69]. In this paper, we divided the life cycle of the green building industry into three stages: the early stage, the mid-stage, and the late stage.
During the early stage, the conditions outlined in
Table 4, labeled as I, are applicable. At this juncture, only the green building concept has been introduced, resulting in low awareness among construction enterprises and consumers. The technology is still in its early stages, and the market is devoid of suitable subsidies and penalties. In this context, the system’s evolutionary stable strategy is reflected by
(loose regulation, traditional buildings, and non-purchase). As time progresses, a small fraction of consumers begin to recognize that green buildings can improve residential comfort. When
, a niche market with specific demand for green buildings takes shape. Accordingly, the system’s evolutionary stable strategy transitions to
(loose regulation, traditional buildings, and purchase). Upon recognizing this specialized demand, construction enterprises tend to develop green buildings. Once the conditions in
Table 4, designated as III, are fulfilled, the system’s evolutionary stable strategy becomes
(loose regulation, green buildings, and non-purchase).
As the green building movement progresses to its intermediate phase, governmental bodies begin to fully understand the critical nature and pressing need for eco-friendly construction. In response, they institute proactive regulatory policies and implement varied incentive and disincentive mechanisms targeting both builders and end-users. The government transitions to a proactive regulatory stance when the reputational benefits derived from penalties and assertive oversight outweigh the associated costs (such as regulatory and promotional expenses). Nevertheless, construction enterprises often revert to conventional building practices when subsidies and fines prove insufficient to offset the significant expenses associated with green construction. When the conditions in
Table 4, labeled as V, are met, the system reaches an evolutionary stable strategy of active regulation, traditional buildings, and non-purchase. As the government intensifies its reward and penalty measures for construction enterprises and consumers, and when conditions VI or VII are met, the system’s evolutionary stable strategies shift to
(active regulation, traditional buildings, and purchase) and
(active regulation, green buildings, and non-purchase), respectively.
In the mature stage, when the inequalities
, and
are satisfied, corresponding to condition VIII in
Table 4, the system’s evolutionary stable strategy is
(active regulation, green buildings, and purchase). However, based on the assumed conditions,
is not established and is not an asymptotic equilibrium point. This scenario, nevertheless, is considered the optimal strategic approach for promoting green buildings and achieving the “dual carbon” goals in the short term. In this game, the government assumes a critical role as the managing party in cultivating green building adoption. It should guide the active involvement of construction enterprises and consumers, thereby facilitating collaboration among all three parties and propelling the green and low-carbon transformation of the construction sector.
Section 4 evaluates this situation through the application of dynamic rewards and penalties. As the later stage progresses, with condition IV in
Table 4 being satisfied, active regulation (subsidies and fines) can effectively stimulate the willingness of construction enterprises to build and consumers’ purchase intention. Moreover, the growing public cognizance of green buildings, coupled with continuously advancing industry technology, will contribute to reducing the construction costs of green buildings, thus amplifying the benefits for both consumers and construction enterprises. At this juncture, the system’s evolutionary stable strategy shifts to
(loose regulation, green buildings, and purchase), which simultaneously represents the optimal Nash equilibrium strategy for this system. In this context, loose regulation saves regulatory expenses and obviates the additional costs associated with environmental remediation. The transaction rate of green buildings is expected to climb steadily, potentially reaching 100%, which reflects the ideal outcome for green building promotion. However, the current limited awareness among construction enterprises and consumers regarding green buildings, in conjunction with the significant costs associated with their construction, renders the popularization of green buildings through this strategic combination challenging in the short term without governmental support in technological and financial domains.
The analysis indicates that the primary factors affecting the strategic decisions of construction companies and consumers are the costs and benefits associated with developing and purchasing green buildings. Government incentives play a crucial role in facilitating the green and low-carbon transition of the construction industry. Accordingly, the government, construction enterprises, and consumers base their strategies on the actual returns of various approaches. Therefore, the government should implement well-designed subsidy and penalty measures to encourage construction companies to build green buildings and motivate consumers to purchase them.
4. Numerical Simulation Analysis
Government subsidies and penalties are critical drivers for green building initiatives. To offer a more comprehensive understanding of how the three parties’ strategies evolve at different stages of green building promotion, we employed MATLAB R2016a to conduct numerical simulations. These simulations appraised the strategic choices of the government, construction companies, and consumers under various scenarios.
Section 4.1 explores the behavioral tendencies and underlying patterns of the three parties during the early, middle, and late stages of industry development.
Section 4.2 presents numerical simulations of the government’s reputation
, consumers’ indirect benefits, and additional costs incurred by enterprises
, along with a sensitivity analysis of these factors.
This section presents numerical simulations based on data satisfying the model’s parameter constraints (
Table 4). In practice, governmental policy parameters (e.g., subsidy standards and penalties) are referenced from official documents like the NDRC’s 14th
Five-Year Plan for Energy Conservation and Emissions Reduction; construction costs are collected via market research; and consumer willingness-to-pay and indirect benefits are derived from nationally representative surveys. During preprocessing, multi-source heterogeneous data were standardized using the entropy weighting method, with Python 3.0 employed for missing value imputation and outlier removal, ensuring input reliability for robust simulations.
4.1. Dynamic Evolution of Parties at Different Stages
- (1)
Simulation Analysis of the Green Building Market in the Early Stage
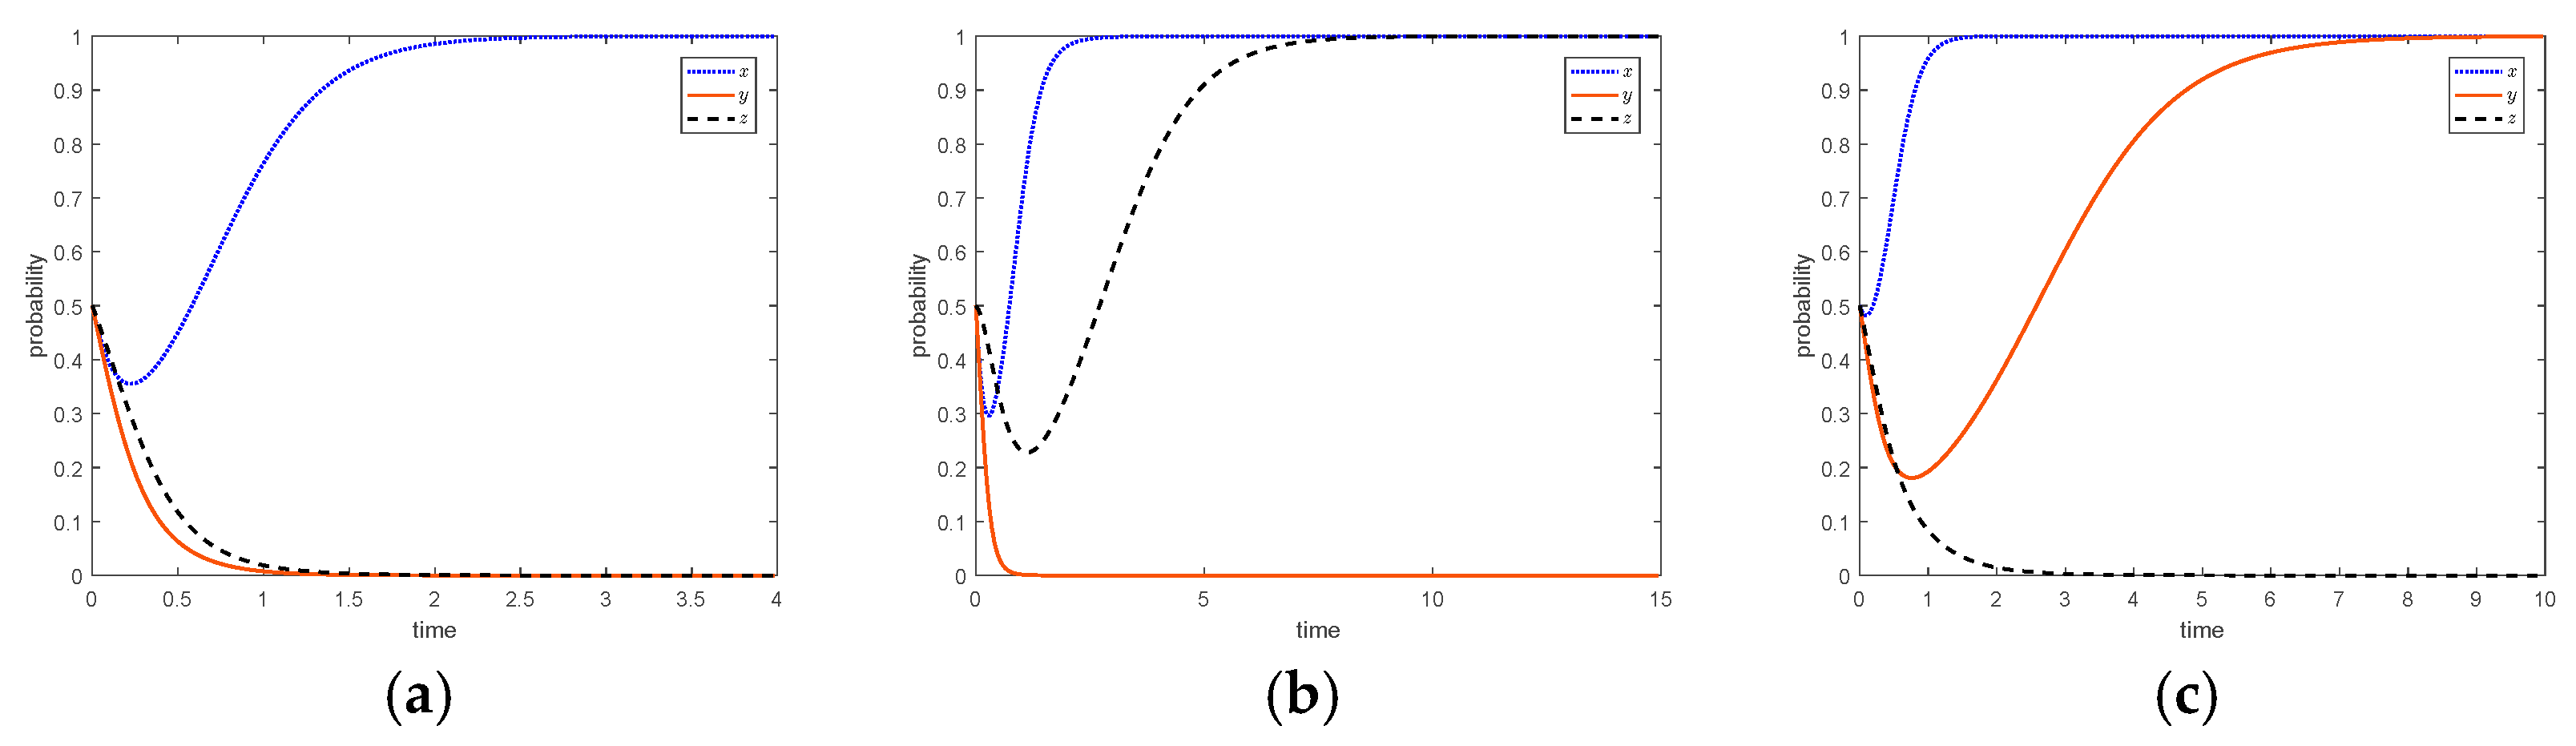
The parameter values are presented in
Table 5. In this phase, market forces primarily govern the demand and supply of green buildings. The government tends to adopt a less stringent regulatory approach due to the high associated costs. Construction enterprises opt for conventional buildings, considering the significant risk costs of green construction without sufficient market demand. Therefore, the system’s stable point is denoted as
, as illustrated in
Figure 3a. When consumers recognize the superior benefits of green buildings, satisfying the condition
, they intend to purchase these structures. This shifts the system’s stable point to
, as depicted in
Figure 3b. When the additional benefits derived from green building development surpass the costs, satisfying the condition
, construction enterprises favor green buildings. This moves the system’s stable point to
, as presented in
Figure 3c.
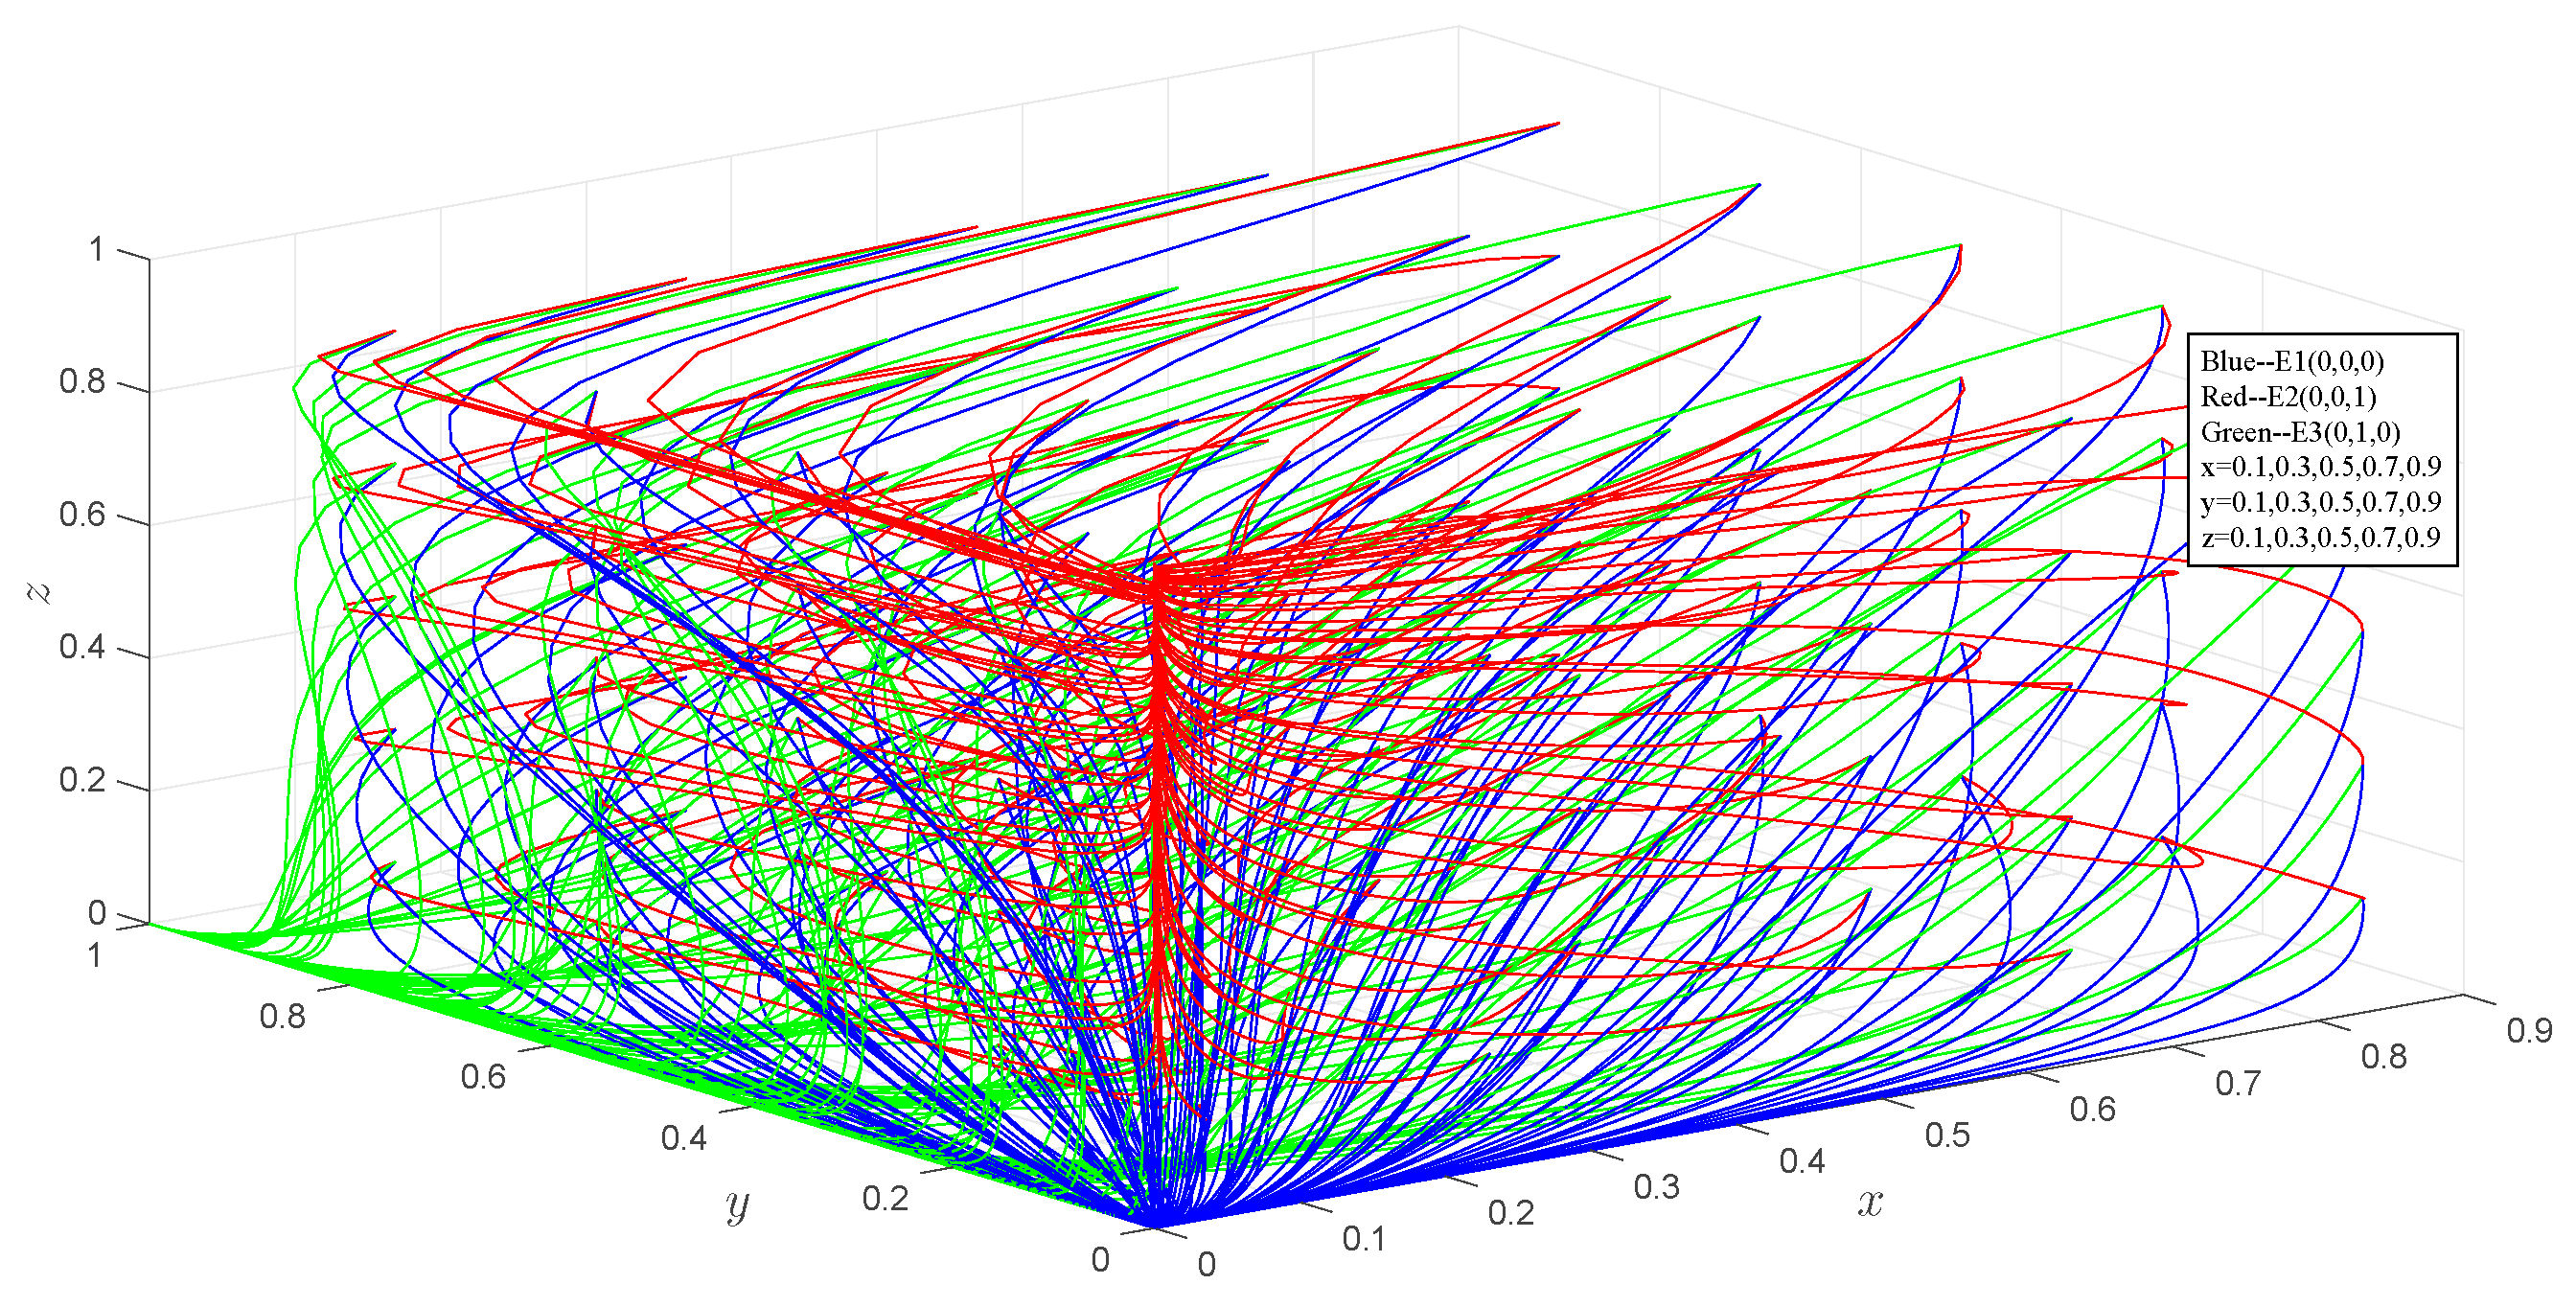
To offer a more comprehensive understanding of the evolutionary decision-making paths of the three parties during the early stages of the green building market under various initial conditions,
Figure 4 illustrates the evolution paths when
x,
y,
z assume values of 0.1, 0.3, 0.5, 0.7, and 0.9. The figure demonstrates that the ultimate evolutionary paths of the three parties are not influenced by the initial states;
- (2)
Simulation Analysis of the Green Building Market in the Mid-stage
As the government recognizes that proactive regulation can enhance its standing, it introduces a system of incentives and penalties to influence market intervention. When the intensity of these measures is low and inequalities
and
are satisfied, and construction enterprises and consumers maintain their existing practices, while the government’s reputation improves. This phase of the system’s evolutionary path is represented as
, as depicted in
Figure 5a. With the gradual intensification of these regulatory measures, and when the criteria for rewarding and penalizing construction enterprises
are satisfied, these companies adjust their conduct. Therefore, the system’s development shifts to
, as presented in
Figure 5b. Once the conditions for incentivizing and sanctioning consumers
are fulfilled, their behavior also adapts. This results in a further shift of the system’s evolutionary path to
, as illustrated in
Figure 5c.
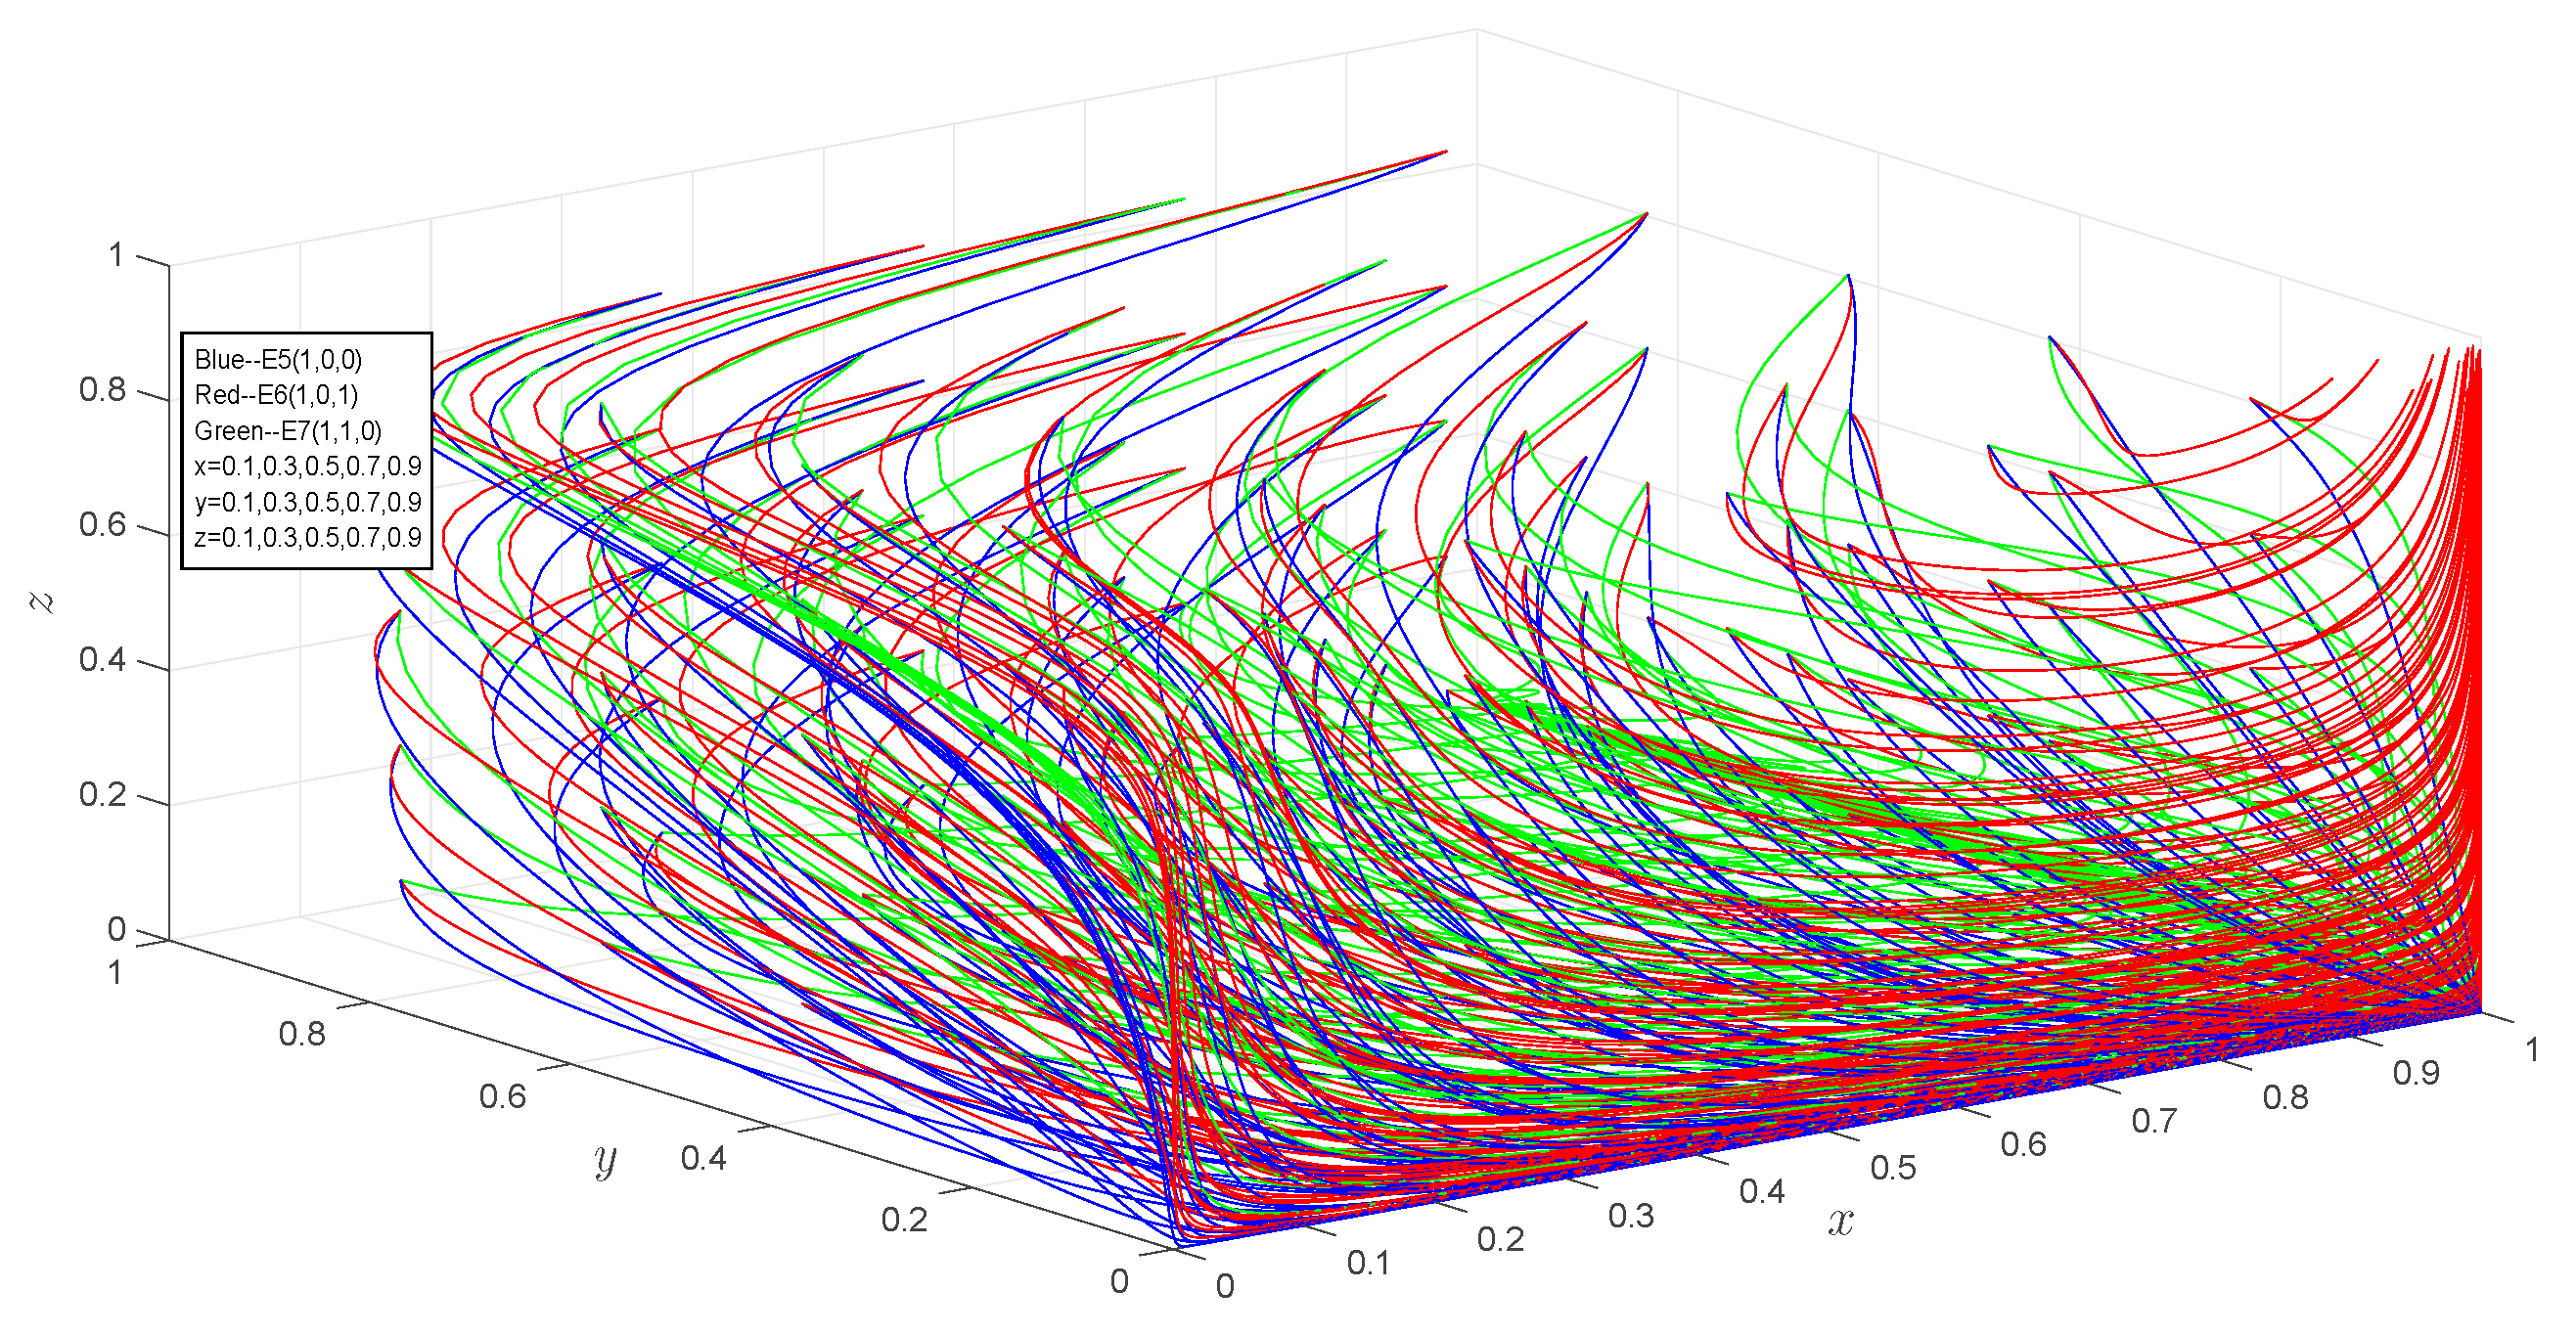
Figure 6 offers a simulation of the evolutionary paths for the government, construction enterprises, and consumers, with
x,
y, and
z assuming values of 0.1, 0.3, 0.5, 0.7, and 0.9. The graph demonstrates that the ultimate evolutionary paths of these three parties are not contingent on their initial states;
- (3)
Simulation Analysis of the Green Building Market in the Late Stage
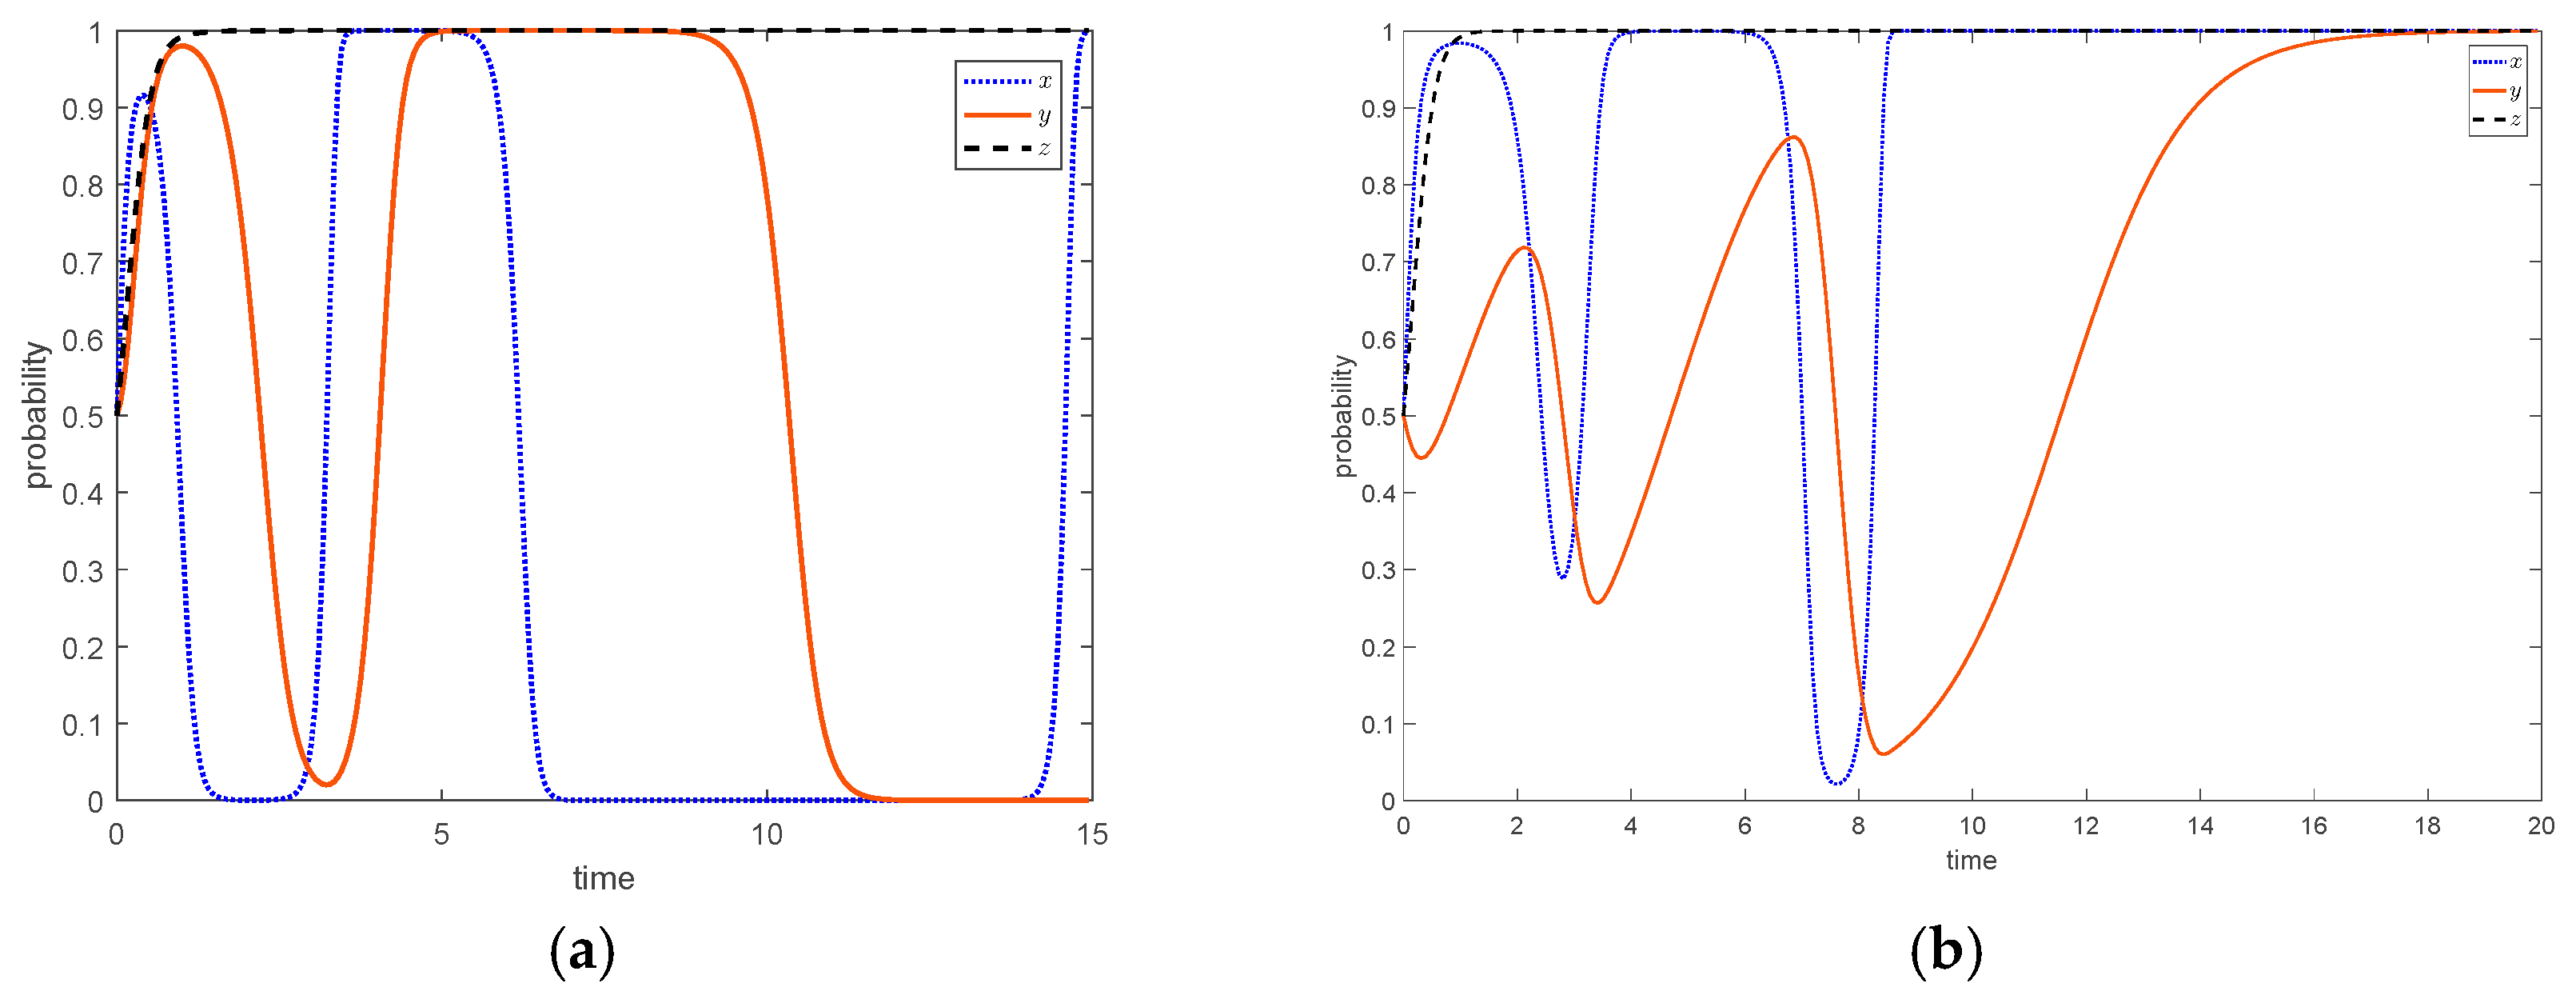
As the scenario progresses, all stakeholders develop a more thorough understanding of one another’s approaches. Under a static reward and punishment mechanism, consumers rapidly align their purchasing behavior, trending decisively toward 1. Simultaneously, the government and construction enterprises display significant fluctuations in their active strategies over time (between 0 and 1). The government’s selection of regulatory stringency typically trails behind the rate at which construction companies embrace green building practices. At the outset, these oscillations occur in rapid succession, but as time elapses, the intervals between fluctuations extend, with no clear stable equilibrium points. Therefore, this phase still necessitates assertive governmental guidance. As technological progress advances and prerequisite conditions are satisfied, the government can eventually step back from its market involvement.
Concerning nonlinear dynamic rewards and punishments, an analysis of interventions on construction enterprises’ and consumers’ behaviors was conducted [
59,
70,
71,
72]. The introduction of functions
and
represents the reward and punishment mechanisms for construction enterprises, respectively. Let
, where
is the reward coefficient. This expression suggests that government incentives for enterprises correlate with their additional expenditures, and more proactive governmental regulation and support lead to higher subsidies for enterprises incurring greater costs. Let
, where
is the punishment coefficient. This formula indicates that the government’s penalties for enterprises are inversely related to the additional costs, and as governmental oversight intensifies and penalties increase, enterprises facing higher additional costs receive smaller penalties.
are substituted into Equation (13) to conduct the system simulation, and the results depicted in
Figure 7b indicate that under nonlinear dynamic rewards and punishments, consumers’ purchasing strategies swiftly converge to 1. Initially, the evolutionary game processes between the government and construction enterprises exhibit cyclical fluctuations. However, as the number of game iterations increases, their paths eventually stabilize at
. The significant reduction in fluctuations indicates the asymptotic stability of the evolutionary game between the government and construction enterprises under this dynamic strategy. In addition,
Figure 7b illustrates that shifts in the government’s regulatory probability generally precede changes in construction enterprises’ adoption of green building practices, with the government’s amplitude exceeding that of the enterprises. This observation suggests a robust commitment from the government to cultivate the green and low-carbon transformation of construction enterprises in this scenario.
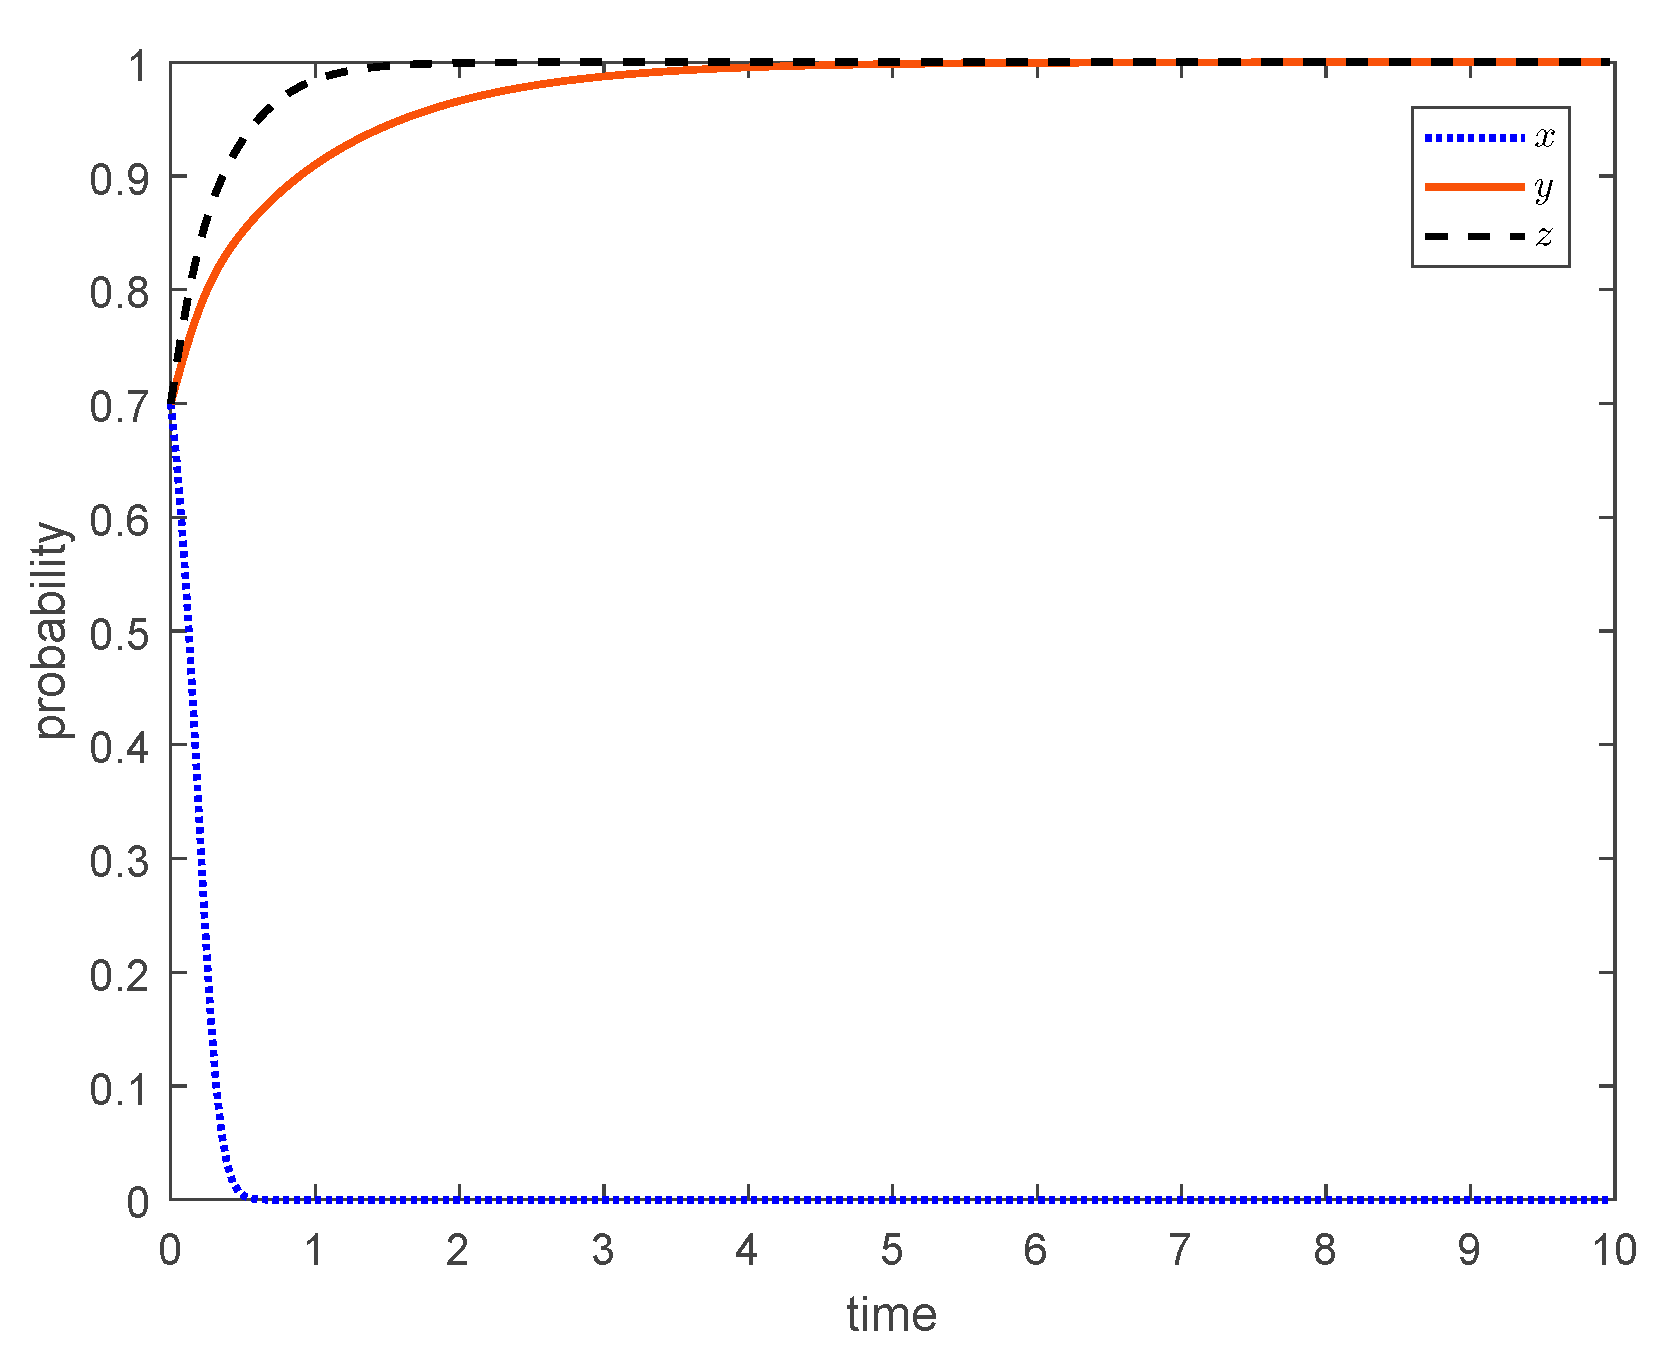
As the green building market matures, consumers develop a more comprehensive understanding of green buildings, which enhances their interest and purchasing power. The significant advancements in green building construction technology contribute to reduced construction costs. When
,
, it indicates that construction enterprises can offer consumers a healthy and comfortable living environment without imposing excessive additional expenses in green building development. Therefore, higher prices will neither discourage consumer purchases nor lead to the phasing out of traditional buildings. As illustrated in
Figure 8, once the market spontaneously achieves an equilibrium favoring green building development, the government, acting as a rational agent, can withdraw its incentives for green buildings and adopt a more relaxed regulatory approach. At this stage, the system’s evolutionary stable strategy is represented as
.
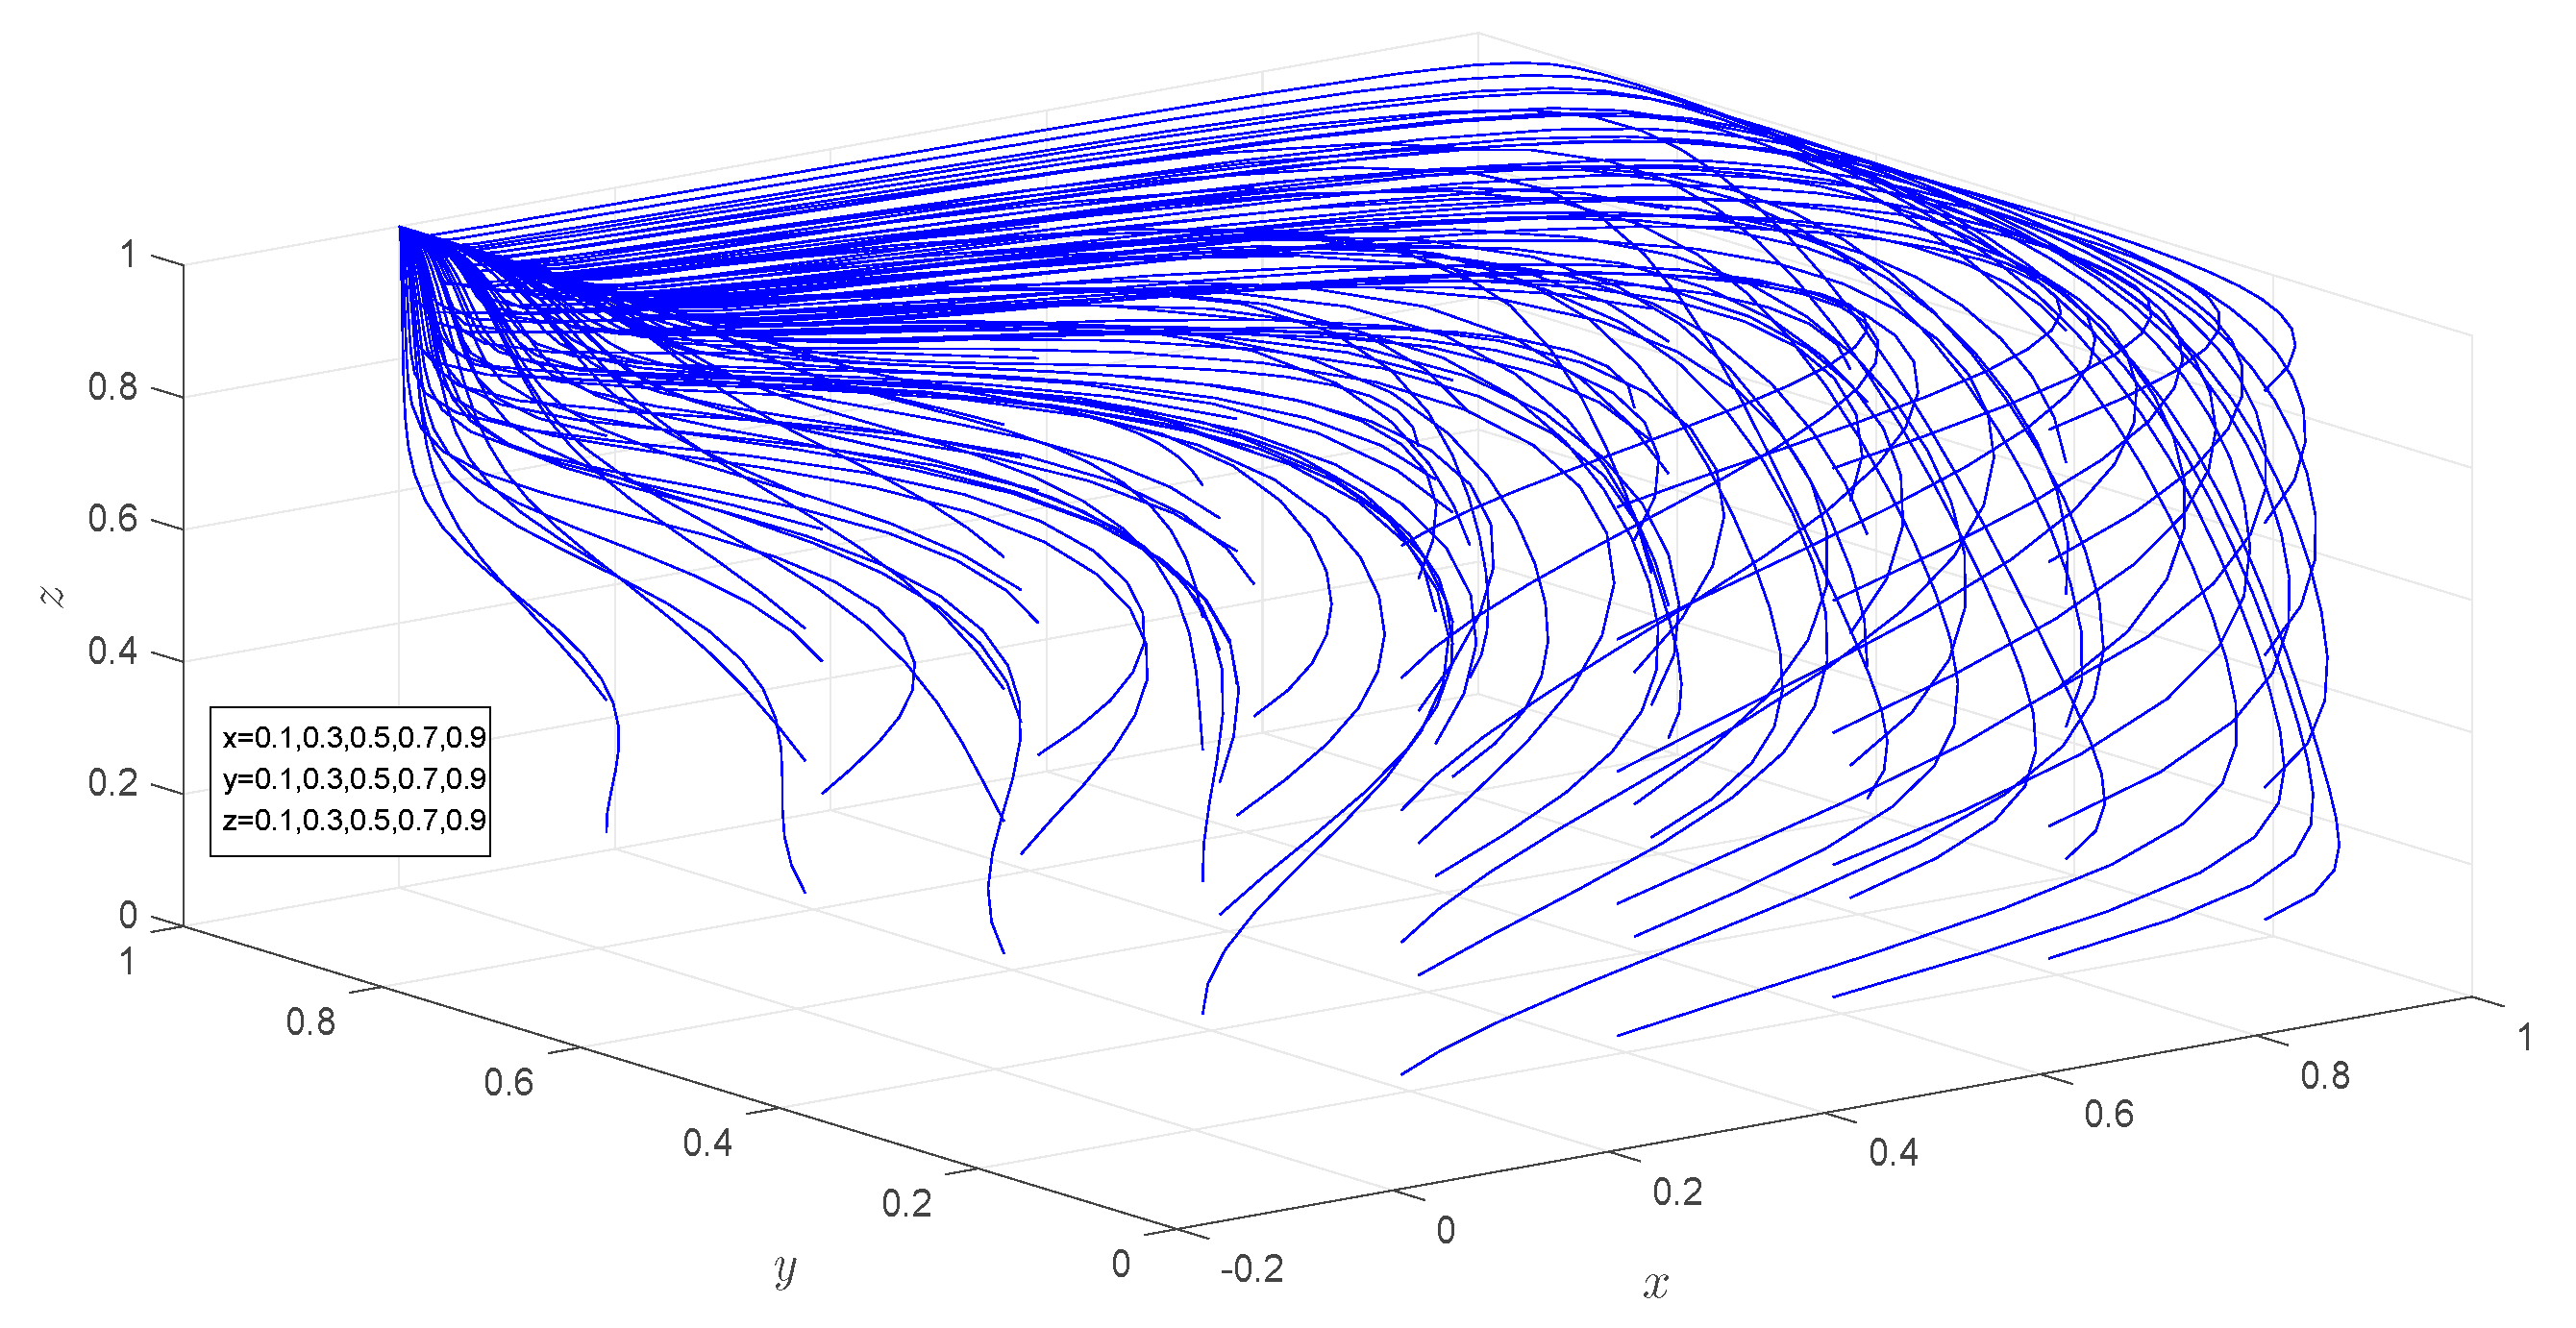
Figure 9 simulates the evolutionary paths of participants under various initial conditions. The simulation results corroborate the conclusions derived from the preceding analysis.
4.2. Impact of Parameter Variations on the Evolution of Participant Behavior
In the evolutionary game involving the government, construction enterprises, and consumers, changes in parameter values may influence the final evolutionary stable strategy. To further analyze how variations in key parameters affect the decision-making behaviors of these three parties, we conducted a sensitivity analysis utilizing the numerical simulations of , , and .
- (1)
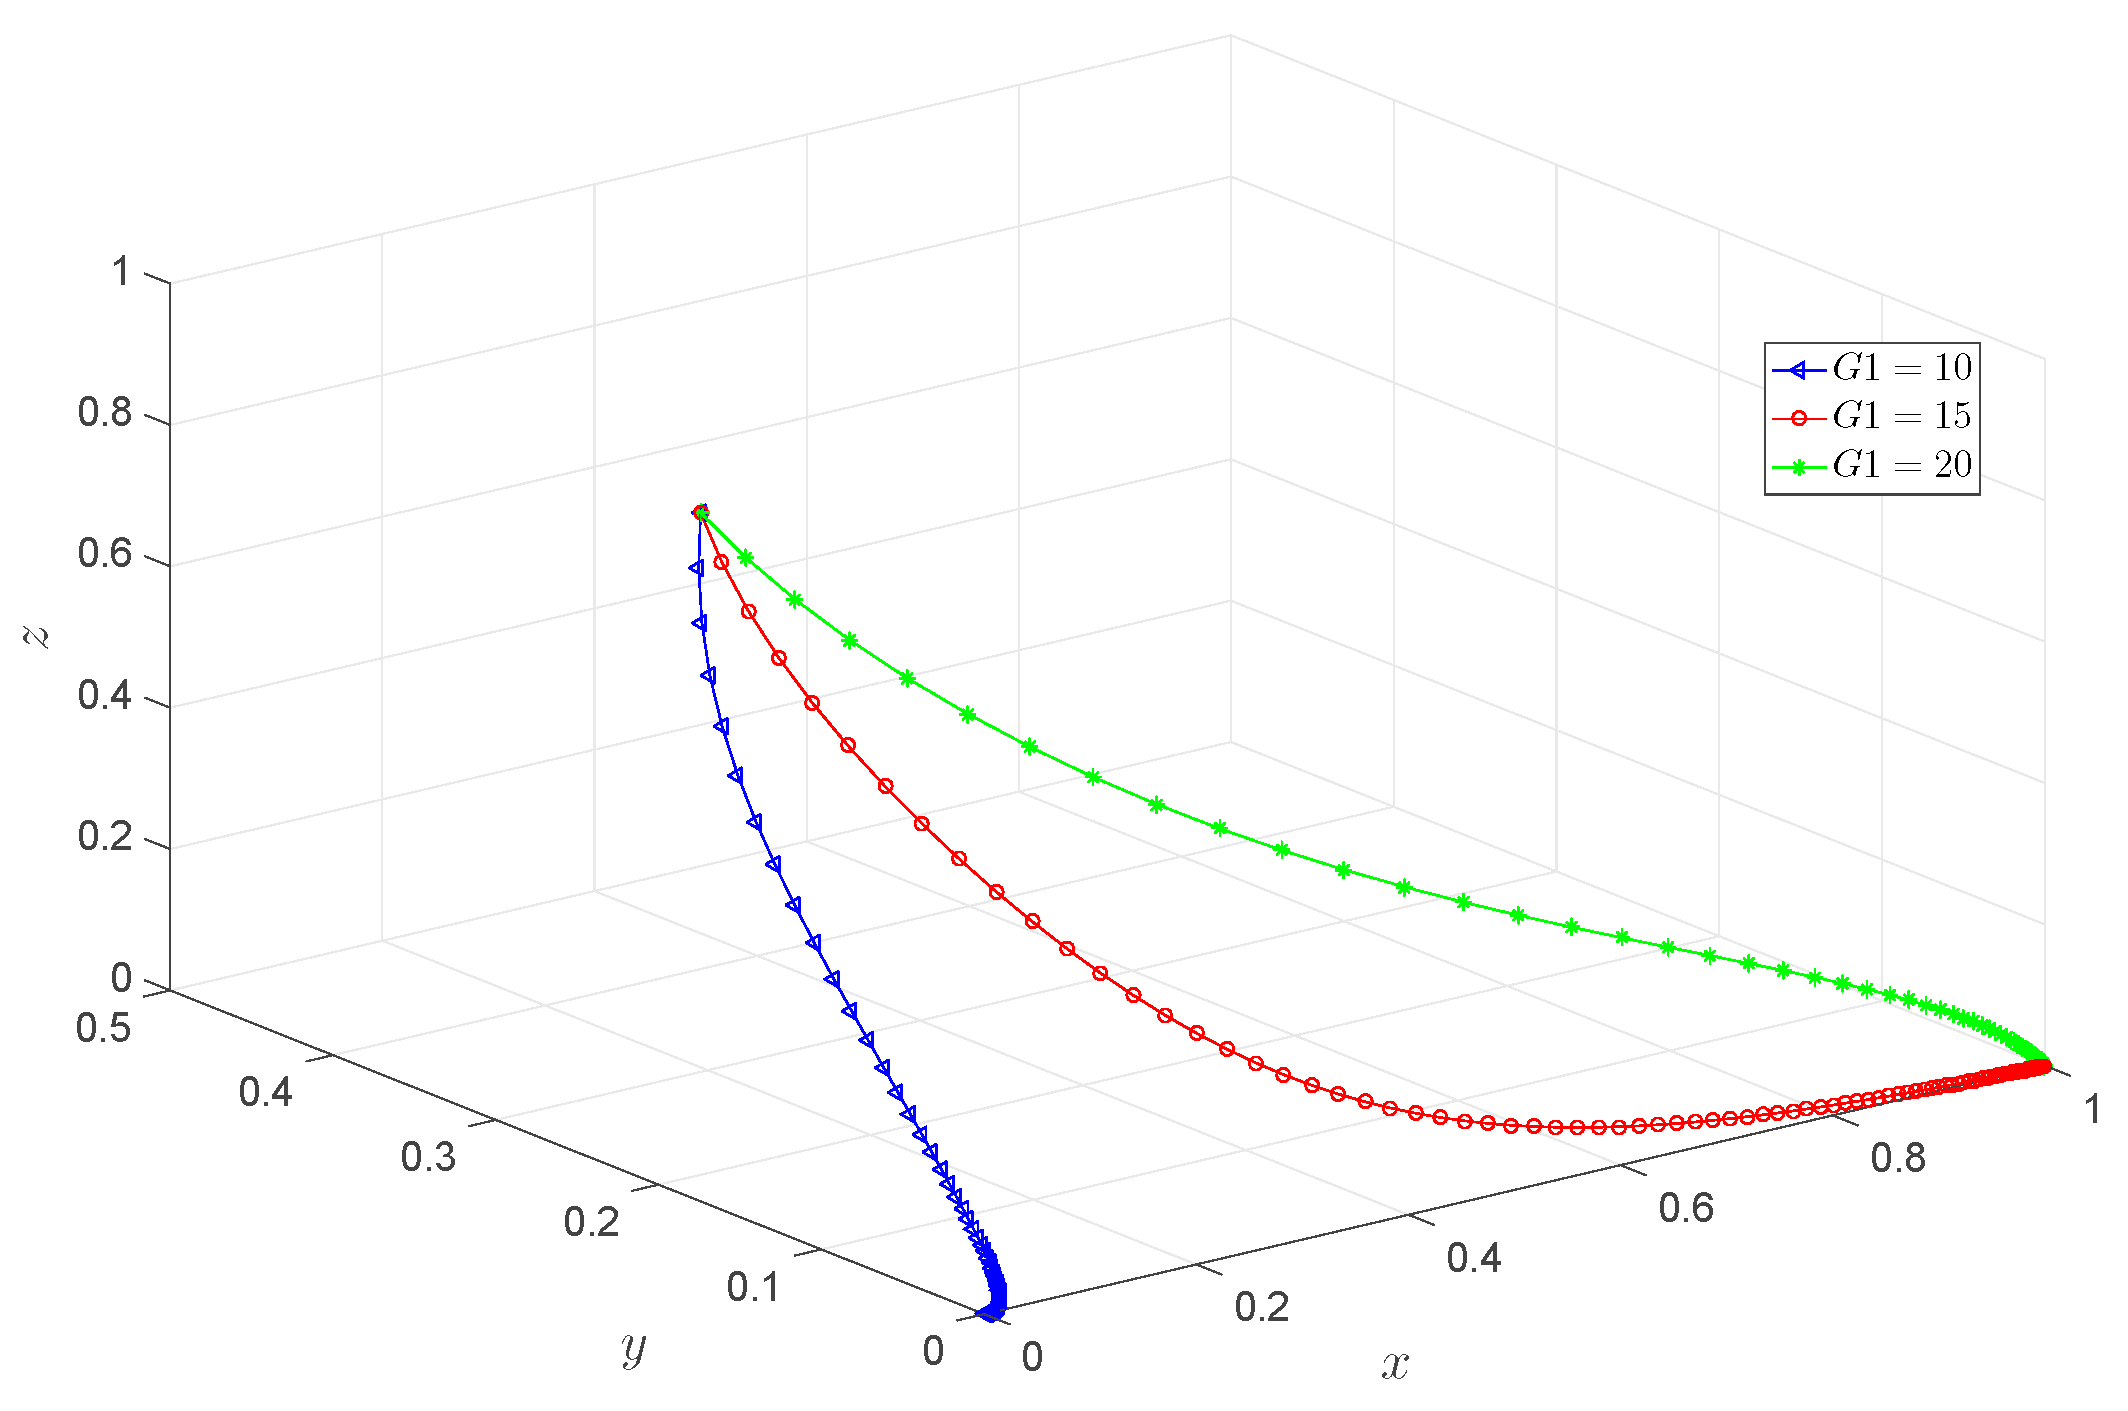
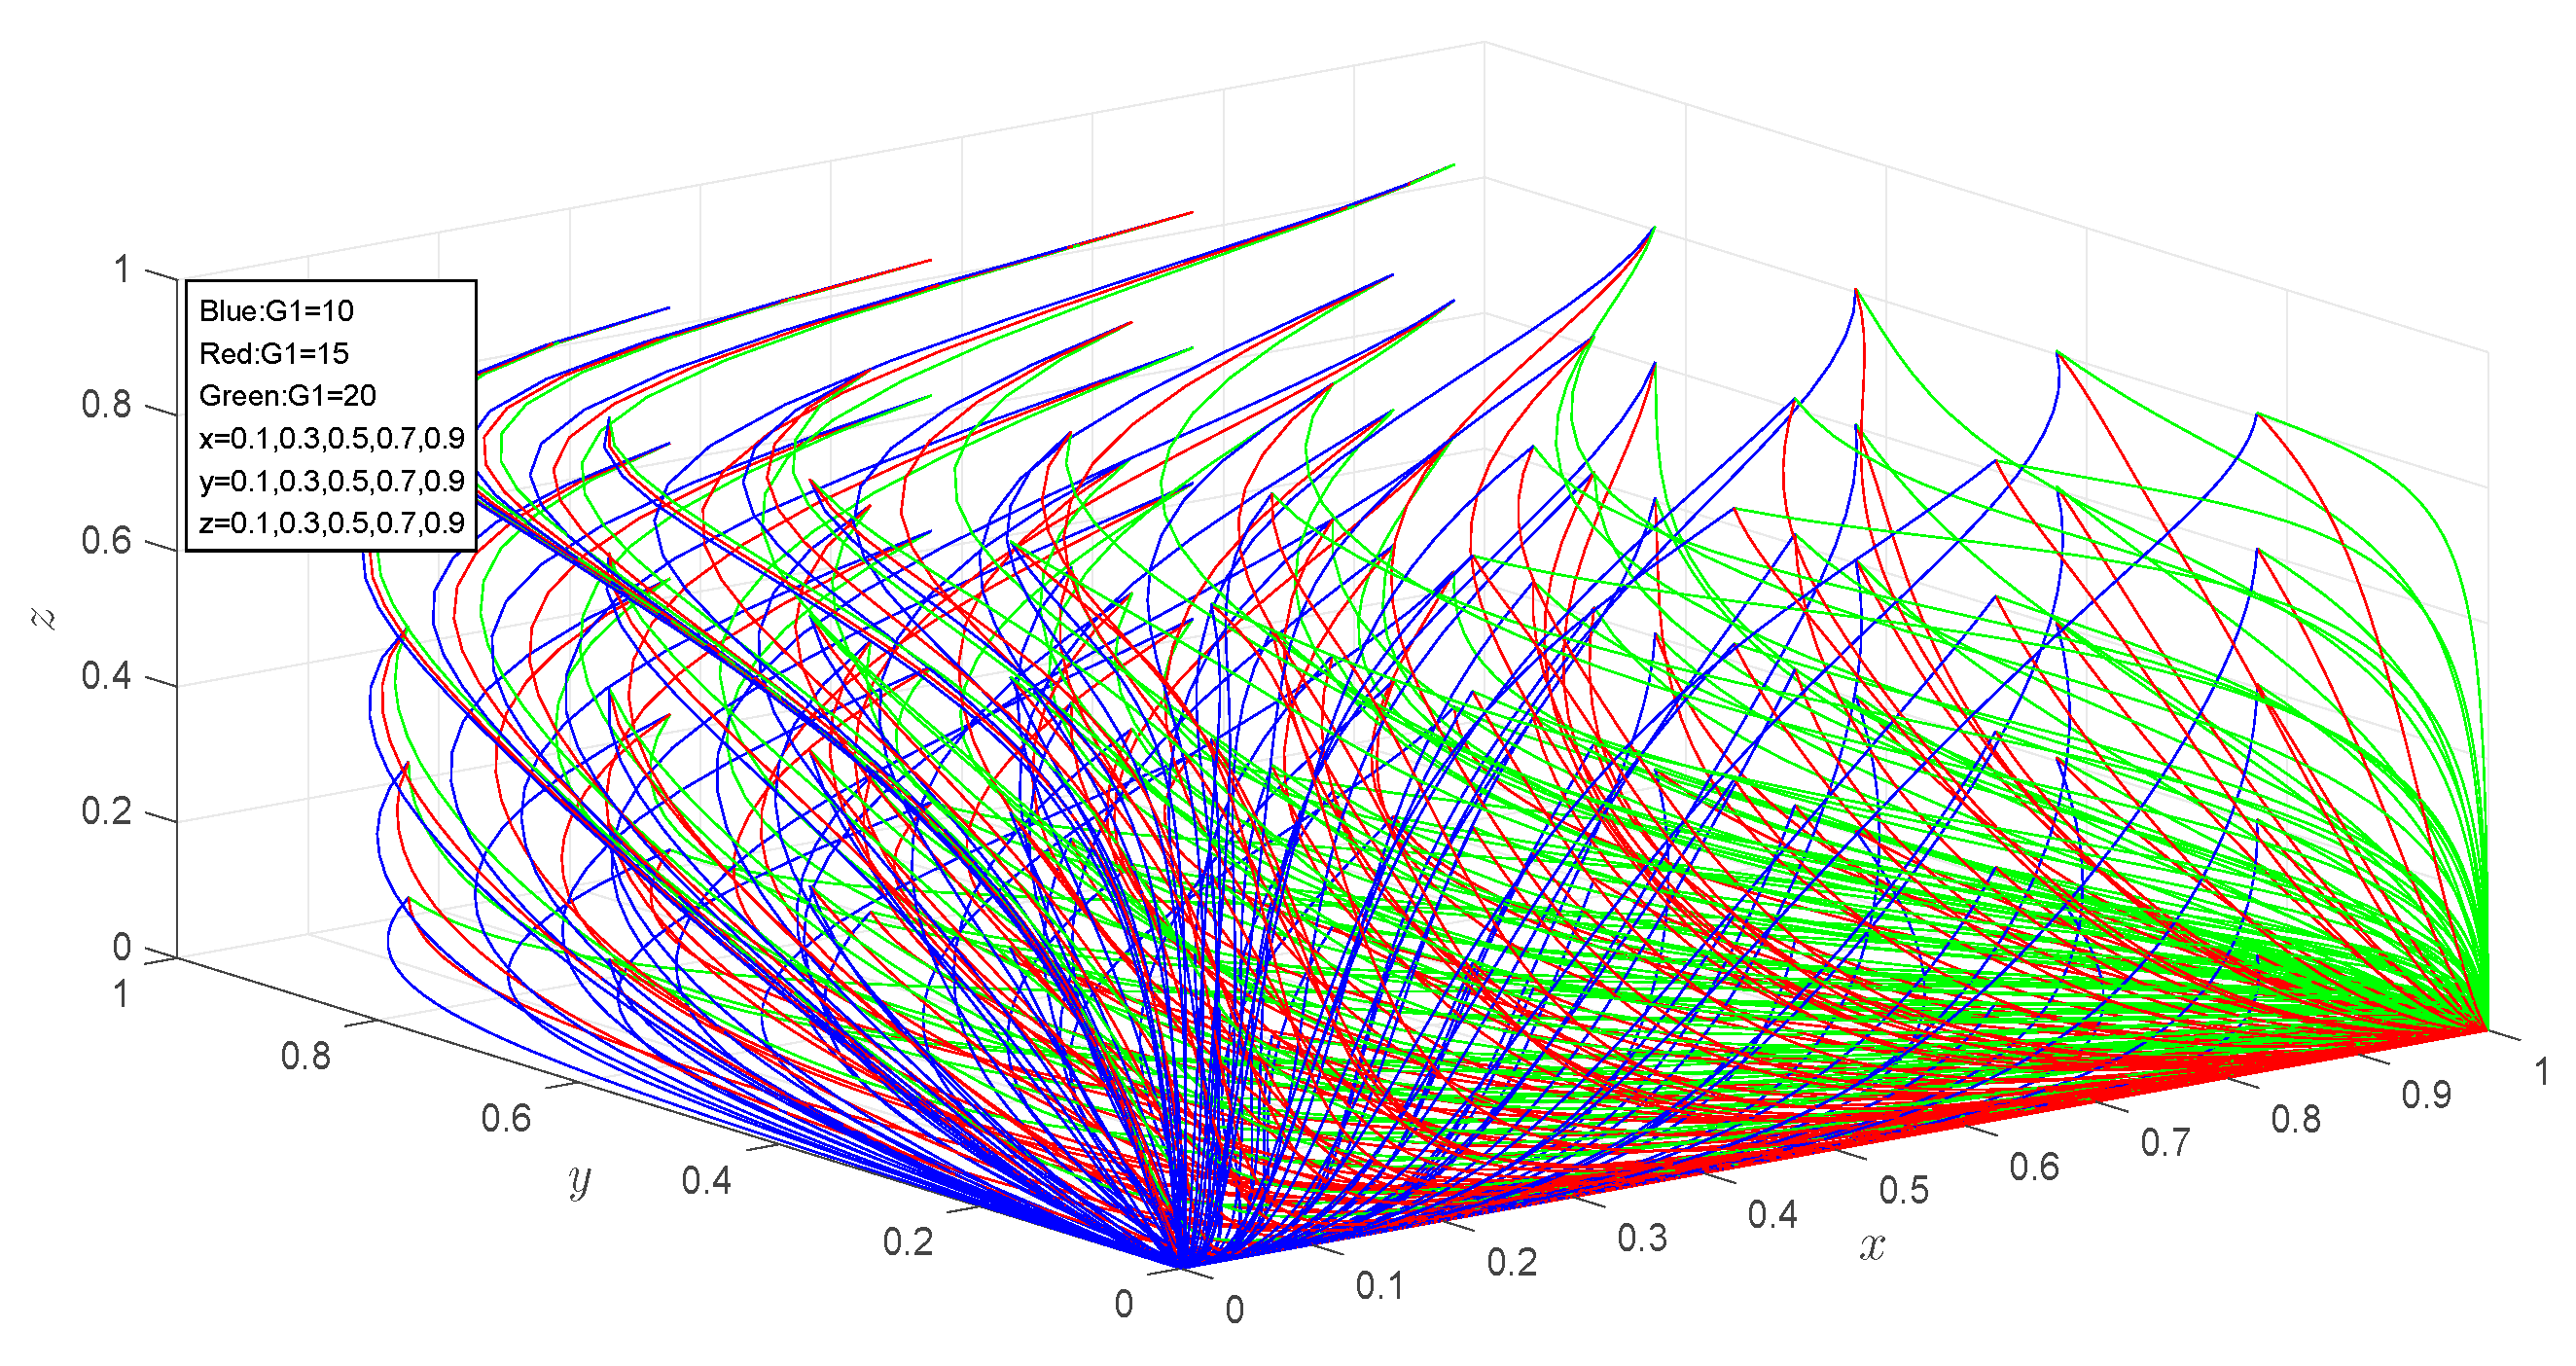
Impact of Changes in on the Decision-Making Behavior of the Three Parties
Considering the original assumptions and maintaining all other parameters as fixed,
was set to 10, 15, and 20, with the initial state set to
. The values for the parameters were as follows:
,
,
,
,
,
,
,
,
,
,
,
,
, and
.
Figure 10 illustrates that when
, the system reaches an evolutionary stable point at
. At this juncture, the government assumes responsibility for resolving
. As consumers become increasingly cognizant of green practices, low-carbon lifestyles, and environmental conservation, the government’s proactive measures gain public approval, resulting in an improved reputation (indicated by the rise in
). This shift prompts the government to transition from a lenient regulatory approach to a more assertive one. Then, the system’s development moves toward
. Moreover, the figure demonstrates a deceleration in the rate at which construction enterprises (and consumers) opt for traditional buildings (or abstain from purchasing), indicating that governmental actions have begun to influence their decision-making processes.
Figure 11 offers additional simulations of the effects of variations in
under different initial states, corroborating the findings from previous analyses;
- (2)
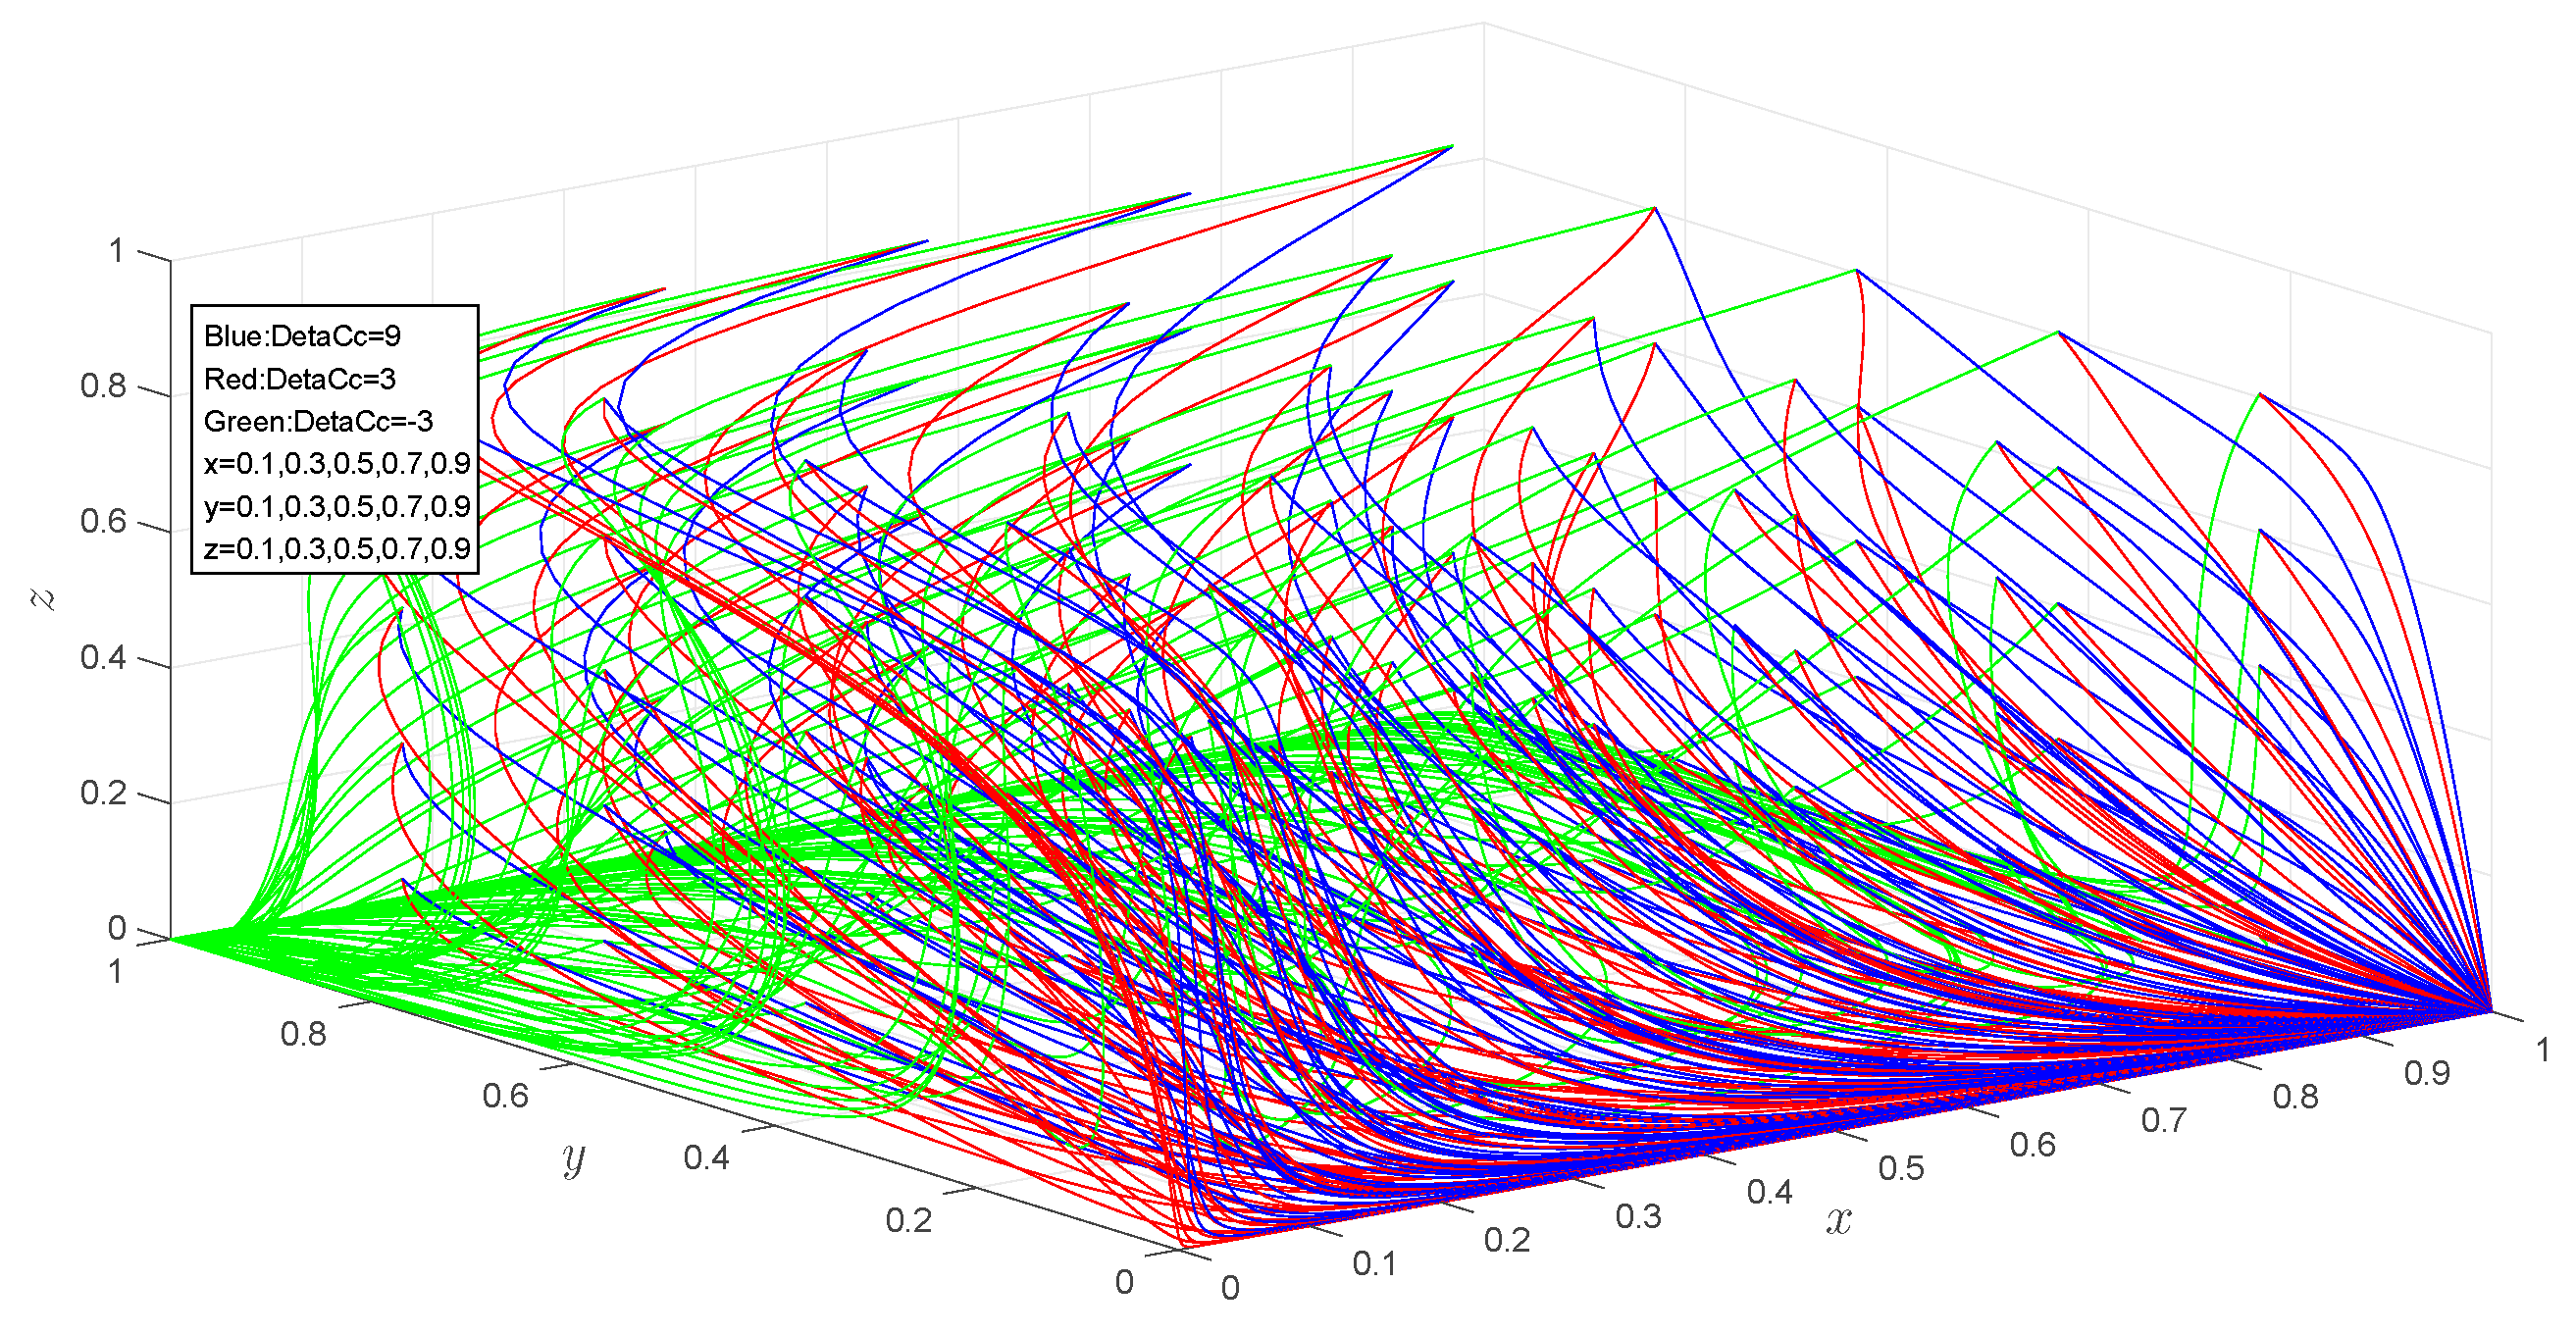
Impact of Changes in on the Decision-Making Behavior of the Three Parties
was set to 9, 3, −3, with the initial state maintained at
. The parameter values were as follows:
,
,
,
,
,
,
,
,
,
,
,
,
, and
. Profit indicates economic performance for enterprises. Under significant increases in the cost of green buildings
and the small corresponding profit gains, construction enterprises tend to choose traditional buildings. As illustrated in
Figure 12, the system’s evolutionary stable point under these circumstances is located at
. Nevertheless, as technology advances and green building material prices decrease,
experiences a reduction. In this scenario, the system’s evolutionary stable point is represented as
.
Figure 13 offers a simulation of how variations in
influence the decision-making processes of the three parties across various initial states. The findings align with the previous observations when the initial state was
;
- (3)
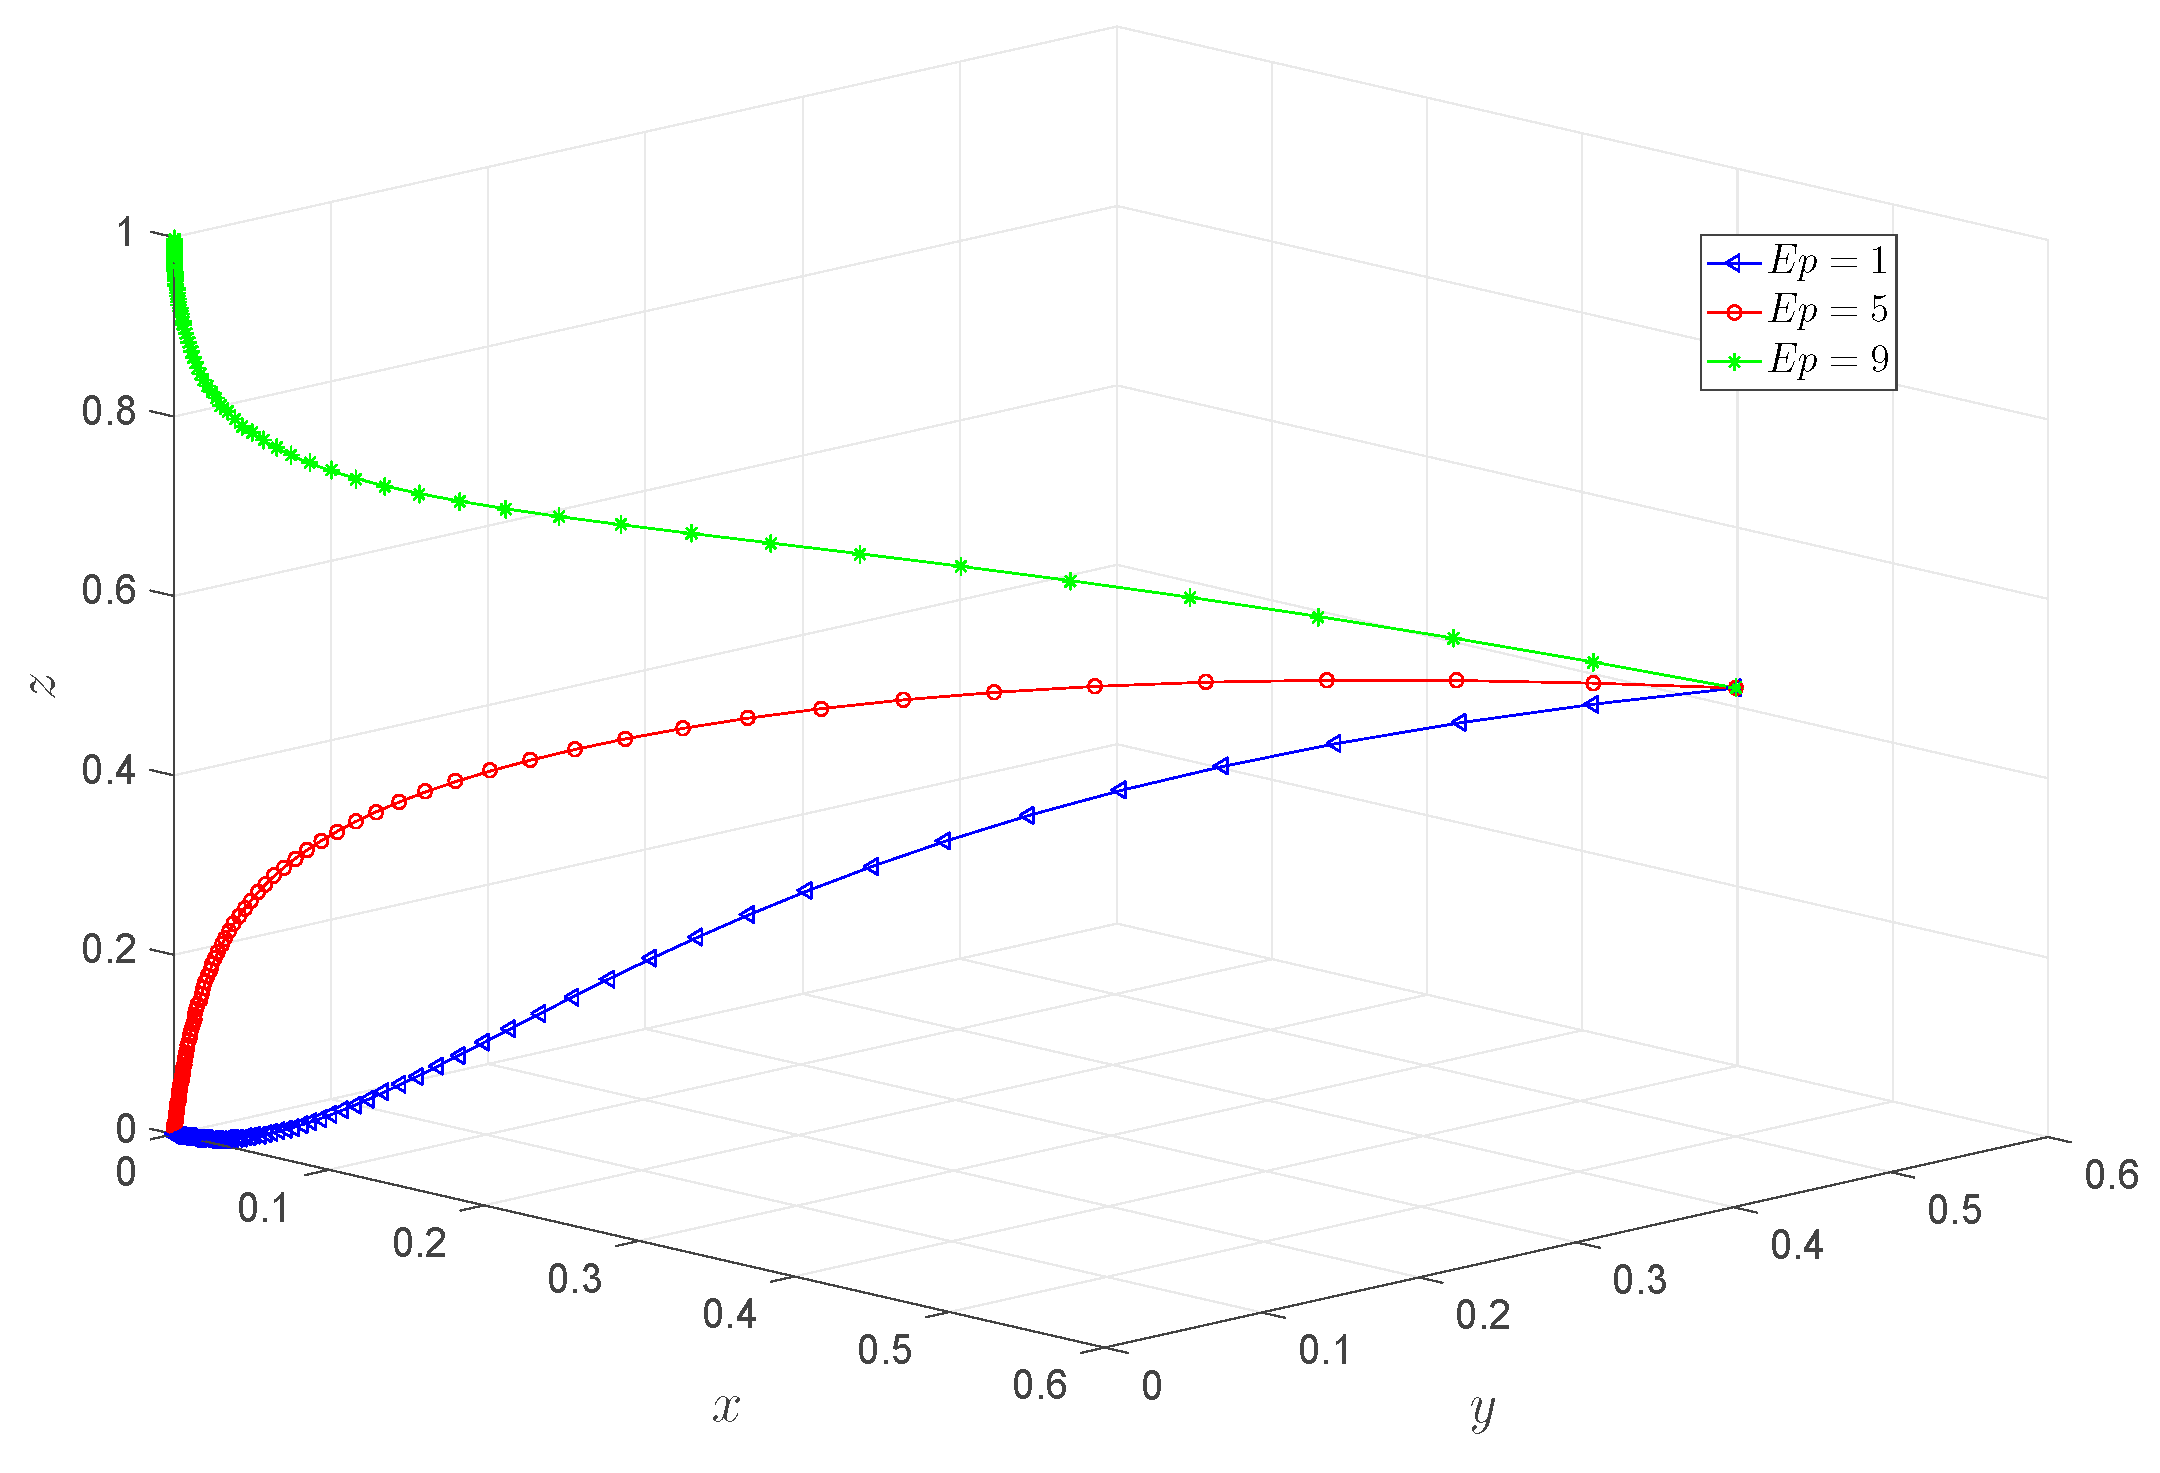
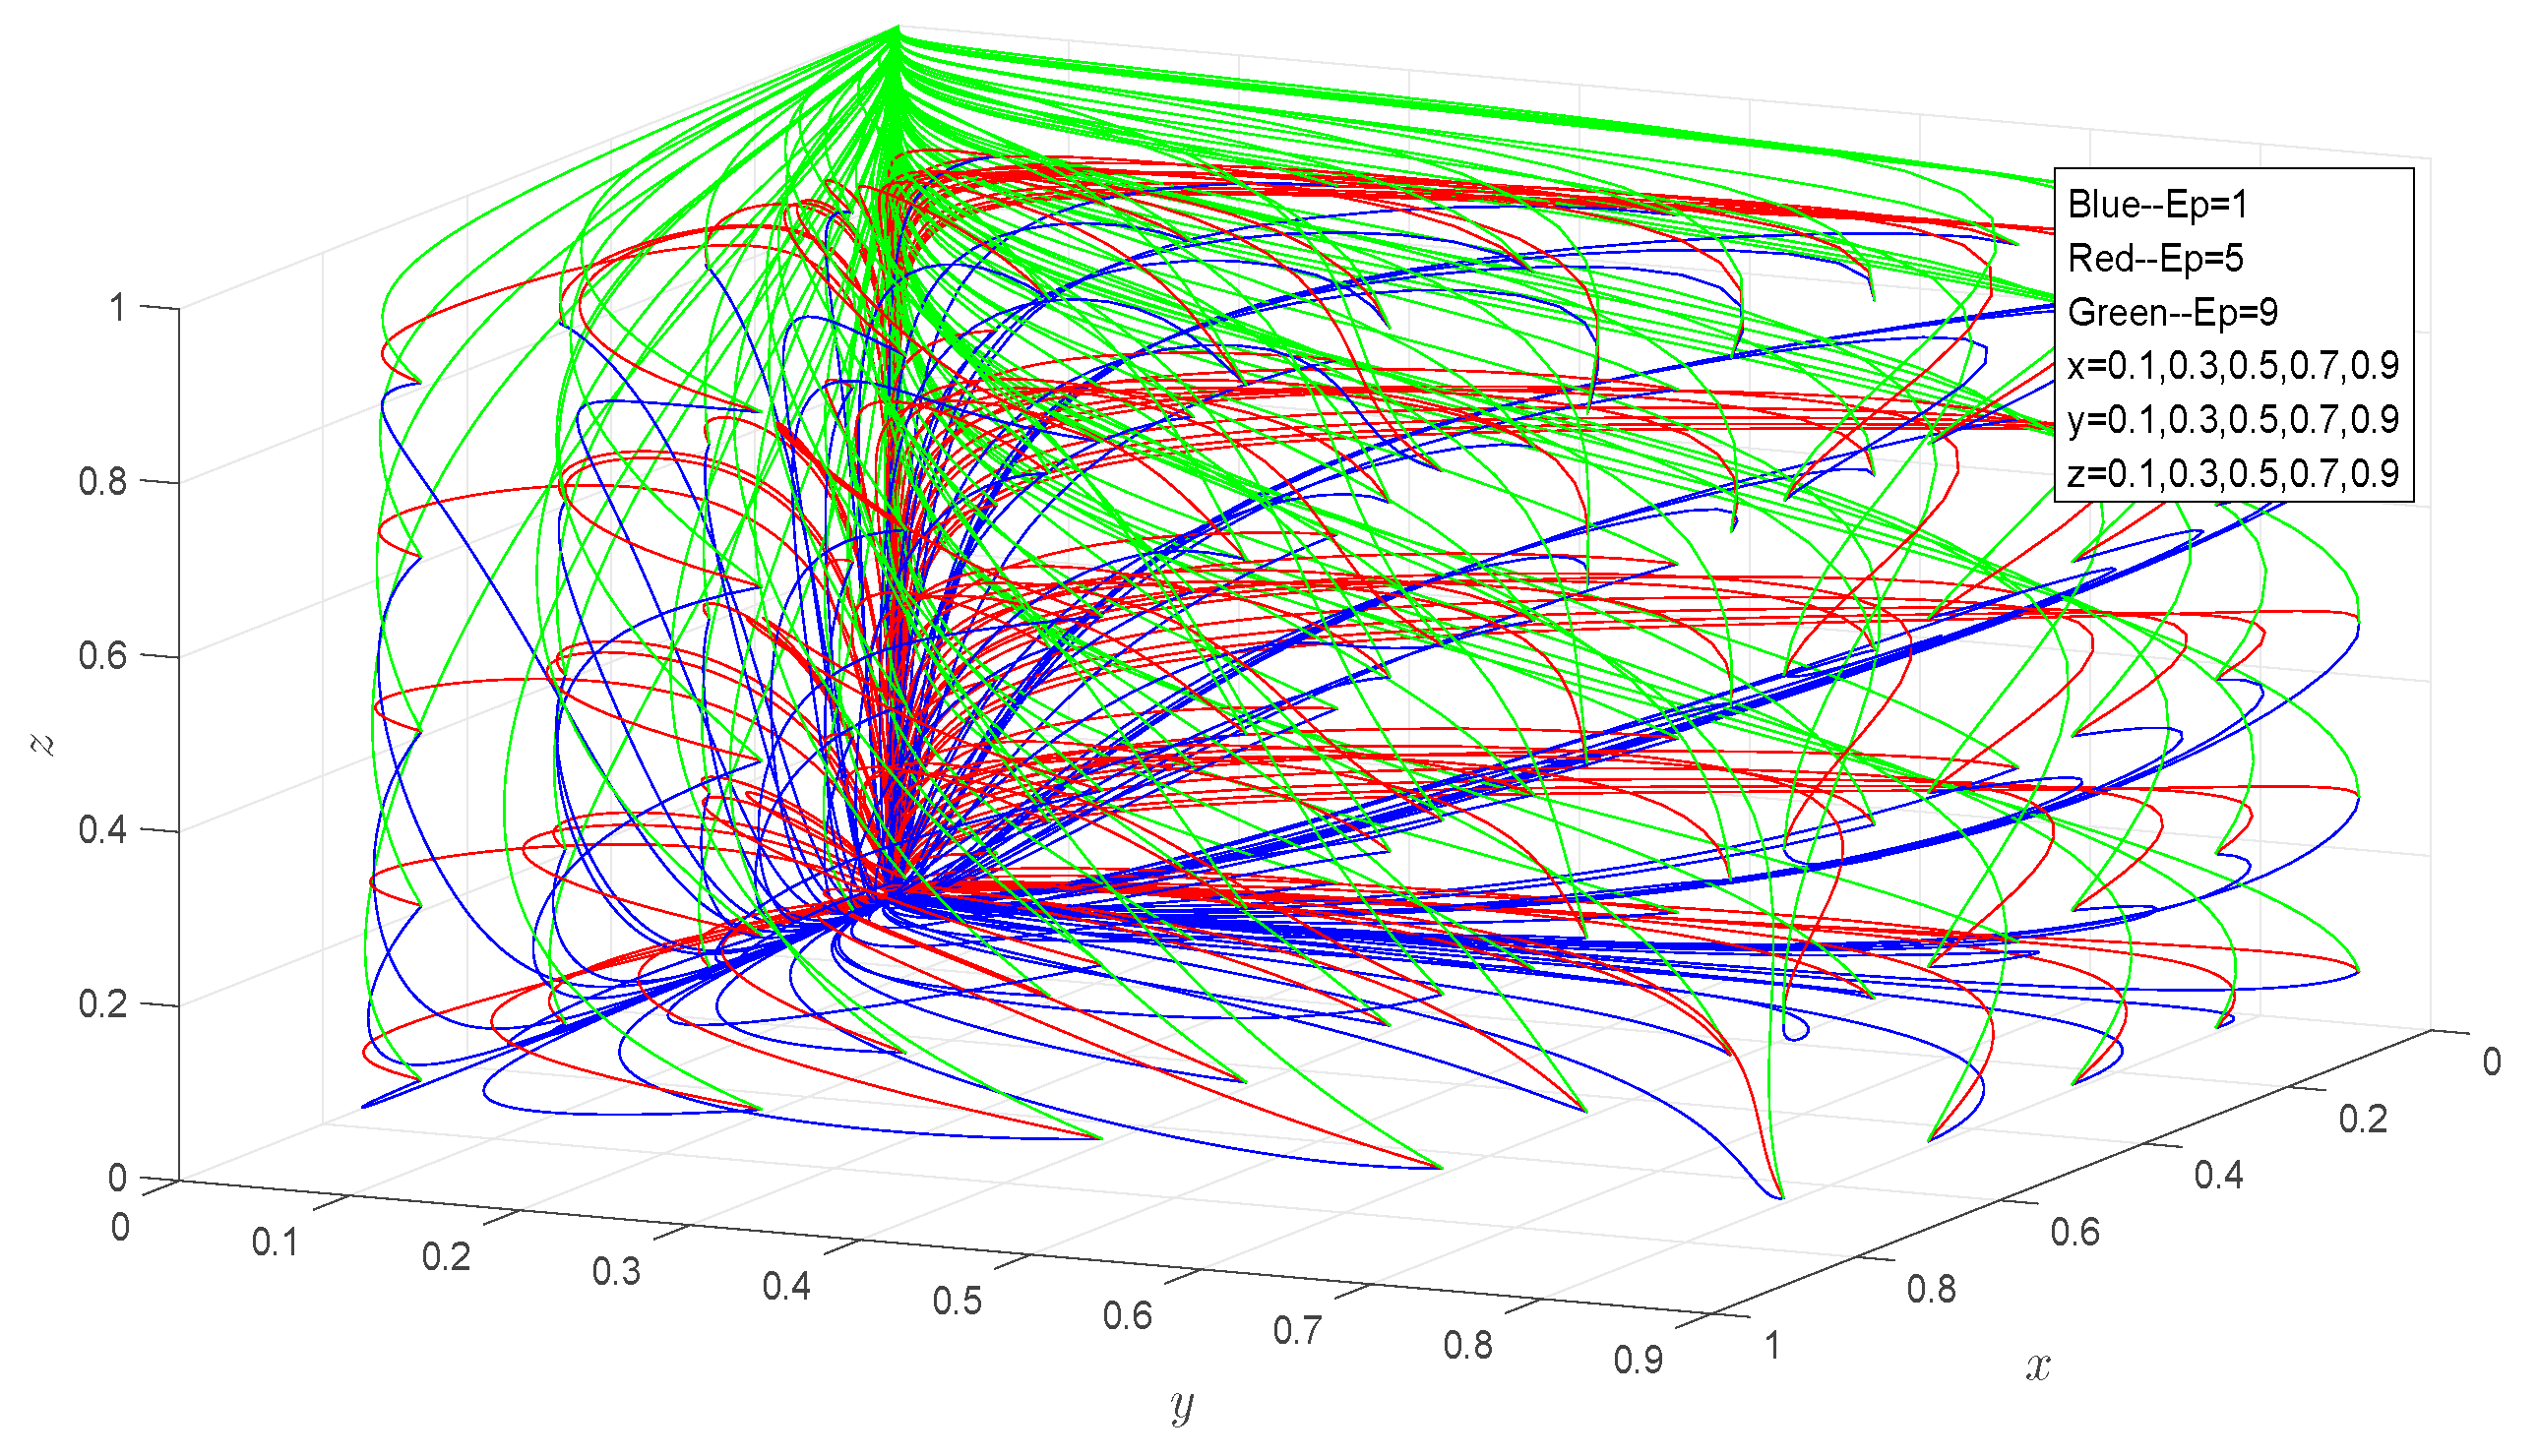
Impact of Changes in on the Decision-Making Behavior of the Three Parties
was set to 1, 5, and 9, with the initial state maintained at
. The parameter values were as follows:
,
,
,
,
,
,
,
,
,
,
,
,
, and
.
Figure 14 illustrates that as
increases, consumers’ tendency to purchase traditional buildings gradually decelerates. They begin to recognize the significant additional benefits offered by green buildings, particularly in terms of environmentally friendly living spaces and improved comfort. While green buildings incur higher initial costs, consumers reap the rewards of these investments during usage periods. Therefore, in a specific range, the difference in purchasing costs becomes tolerable, and consumers finally exhibit a preference for green buildings. In this scenario, the system’s evolutionary stable point is represented as
.
Figure 15 simulates the effects of variations in
on the decision-making behavior of the three parties under different initial states. The results indicate that the system’s evolutionary stable point remains unaffected by the initial states.
5. Research on Strategies for the Promotion of Green Buildings
The advancement of green buildings and the realization of dual carbon objectives play a critical role in transforming and upgrading the construction industry. This section seeks to propose promotional strategies from a governmental standpoint, drawing on the findings of the preceding evolutionary game analysis, to offer guidance for the growth of the green building sector.
(1) Prior to the maturation of the green building market , governmental regulations are instrumental in its development. Governments should implement well-balanced incentive and penalty systems by increasing and to encourage both enterprises to construct green buildings and consumers to purchase them. For construction enterprises, effective incentives may include enhanced floor area ratios or supplementary subsidies for certified green buildings. In addition, the government should establish favorable policies to strengthen fiscal and tax support for construction enterprises. To stimulate consumer purchasing, the government could consider tax reductions or increased loan ratios;
(2) The expression of standards and norms for green buildings holds significant importance. Efforts should be made to cultivate collaboration among universities, research institutes, and enterprises in conducting research and demonstration projects relevant to green building technologies, as well as offering relevant guidance. The introduction of innovative technologies, processes, materials, and equipment for green buildings can enhance the technological sophistication of these structures. This approach aims to offer consumers greater indirect benefits and reduce the additional costs associated with the development of green buildings ;
(3) Concrete measures should be implemented to improve promotion and training initiatives. A comprehensive media strategy utilizing various platforms, including the internet, television, radio, and print media, should be employed to communicate information regarding green buildings, including their concepts and practices. The objective is to raise social awareness of these initiatives and boost . Government actions that can significantly enhance public trust and its own image to promote the government’s reputation are recommended.
6. Discussion
(1) In this paper, the green building industry can be divided into three stages: the early stage, the middle stage, and the mature stage. In each stage, the strategic choice of the government, construction enterprises, and consumers is deeply coupled with the actual market development, collectively driving the sector’s transition from policy-dependent to market-driven growth.
- ➢
Early Stage: Immature technologies and low consumer awareness result in weak market demand and delayed feedback loops [
49]. High government subsidies become essential to offset enterprises’ trial-and-error costs in technology adoption [
59];
- ➢
Middle Stage: Enhanced technical maturity and growing consumer awareness enable mandatory policies and phased subsidies to incentivize green building adoption [
2]. Concurrently, emerging consumer preference for sustainability generates a complementary market pull;
- ➢
Mature Stage: Cost parity with conventional buildings triggers universal green technology adoption. Consumers instinctively prioritize green options, while self-organizing market mechanisms replace direct policy interventions [
15,
16]. This phase demonstrates tripartite synergy (policy–enterprise–consumer) in sustaining innovation momentum.
(2) In this model, the government is presumed to have the capacity to stimulate the green building market through regulatory measures and policy instruments. Nevertheless, governmental oversight faces certain obstacles. Primarily, regulations that lack sufficient effectiveness or rigor may fail to elicit changes in the decision-making patterns of construction enterprises and consumers, whereas excessively stringent regulations could increase the government’s administrative burden and potentially provoke resistance from businesses. Therefore, a delicate balance of interests exists among the government, construction enterprises, and consumers. This necessitates a careful calibration of regulatory intensity by the government;
(3) Concerning the decision-making behaviors and stable strategies of stakeholders at various stages of the green building market, while theoretical stable strategies have been derived for different scenarios, the current state of both the green building and conventional markets indicates that the evolution of , , , and , from a developmental standpoint, are unfavorable for achieving the dual carbon objectives. Therefore, in the practical promotion of the green building market, it is necessary for the government to prevent or halt the progression of these states;
(4) This study focuses on tripartite game theory, yet critical stakeholders in the green building value chain—such as designers, financial institutions, and third-party certifiers—remain inadequately integrated. Their conflicting interests and synergistic effects are under-represented in the current models, which compromises the practical validity of conclusions. Furthermore, the long-term evolutionary impacts of path dependence and technological lock-in effects lack systematic verification. For instance, institutional inertia in conventional construction practices may hinder the diffusion speed of green technologies, highlighting the necessity of incorporating industry-specific behavioral inertia into evolutionary frameworks. In future studies, more factors can be considered for inclusion in the model to study the decision-making evolution of key stakeholders.
7. Conclusions
(1) This research utilizes evolutionary game theory to analyze the long-term learning behaviors and strategy adjustment mechanisms among three key players: government, construction enterprises, and consumers. The findings highlight the government’s critical role as a regulator in cultivating the green building market. Stakeholders exhibit dynamic strategic adjustments across phases due to diverging interests. Governments transition from dominant actors to regulatory overseers, enterprises evolve from passive compliance to proactive innovation, and consumers shift from price sensitivity to value-driven preferences, collectively fostering a multi-win green building ecosystem. The strategies of various stakeholders at different stages are shown in
Table 6;
(2) The cooperative behaviors and evolutionary trajectories of the three stakeholders are highly sensitive to key parameters. For instance, when government subsidies are sufficiently high or consumer willingness-to-pay premiums are strong enough, the system converges to identical stable equilibria regardless of the initial preferences among enterprises or consumers;
(3) The social reputation gained by the government through proactive regulation, the incremental costs borne by construction enterprises in developing green buildings, and the additional benefits obtained by consumers when purchasing green buildings exert significant influence on the decision-making processes of the three stakeholders. Government subsidies and penalties are able to effectively guide the decision-making behaviors of enterprises and consumers. Moreover, adaptable reward and punishment mechanisms can significantly reduce fluctuations in the evolutionary game between the government and construction enterprises, leading to a stable evolutionary state () for all parties;
(4) This study operates under the assumptions of bounded rationality, while real-world decisions by governments, developers, and consumers may involve non-rational factors (e.g., cognitive biases and social pressures), creating gaps between model predictions and practical outcomes. Additionally, although some parameters are derived from surveys, critical variables in real-world adoption lack dynamic data calibration. Future work could integrate machine learning techniques and experimental data on consumer green preferences (e.g., willingness-to-pay premiums for green buildings) to refine game-theoretic parameters and enhance the realism of behavioral assumptions.


