
Modeling the Ecological Network in Mountainous Resource-Based Cities: Morphological Spatial Pattern Analysis Approach


Abstract
1. Introduction
1.1. Research Background
1.1.1. Urban Blue-Green Space Urgently Needs Reconstruction
1.1.2. Blue-Green Space Reconstruction’s Needs in Mountainous Resource-Based Cities
1.1.3. Ecological Networks Promote the Construction of Blue-Green Space
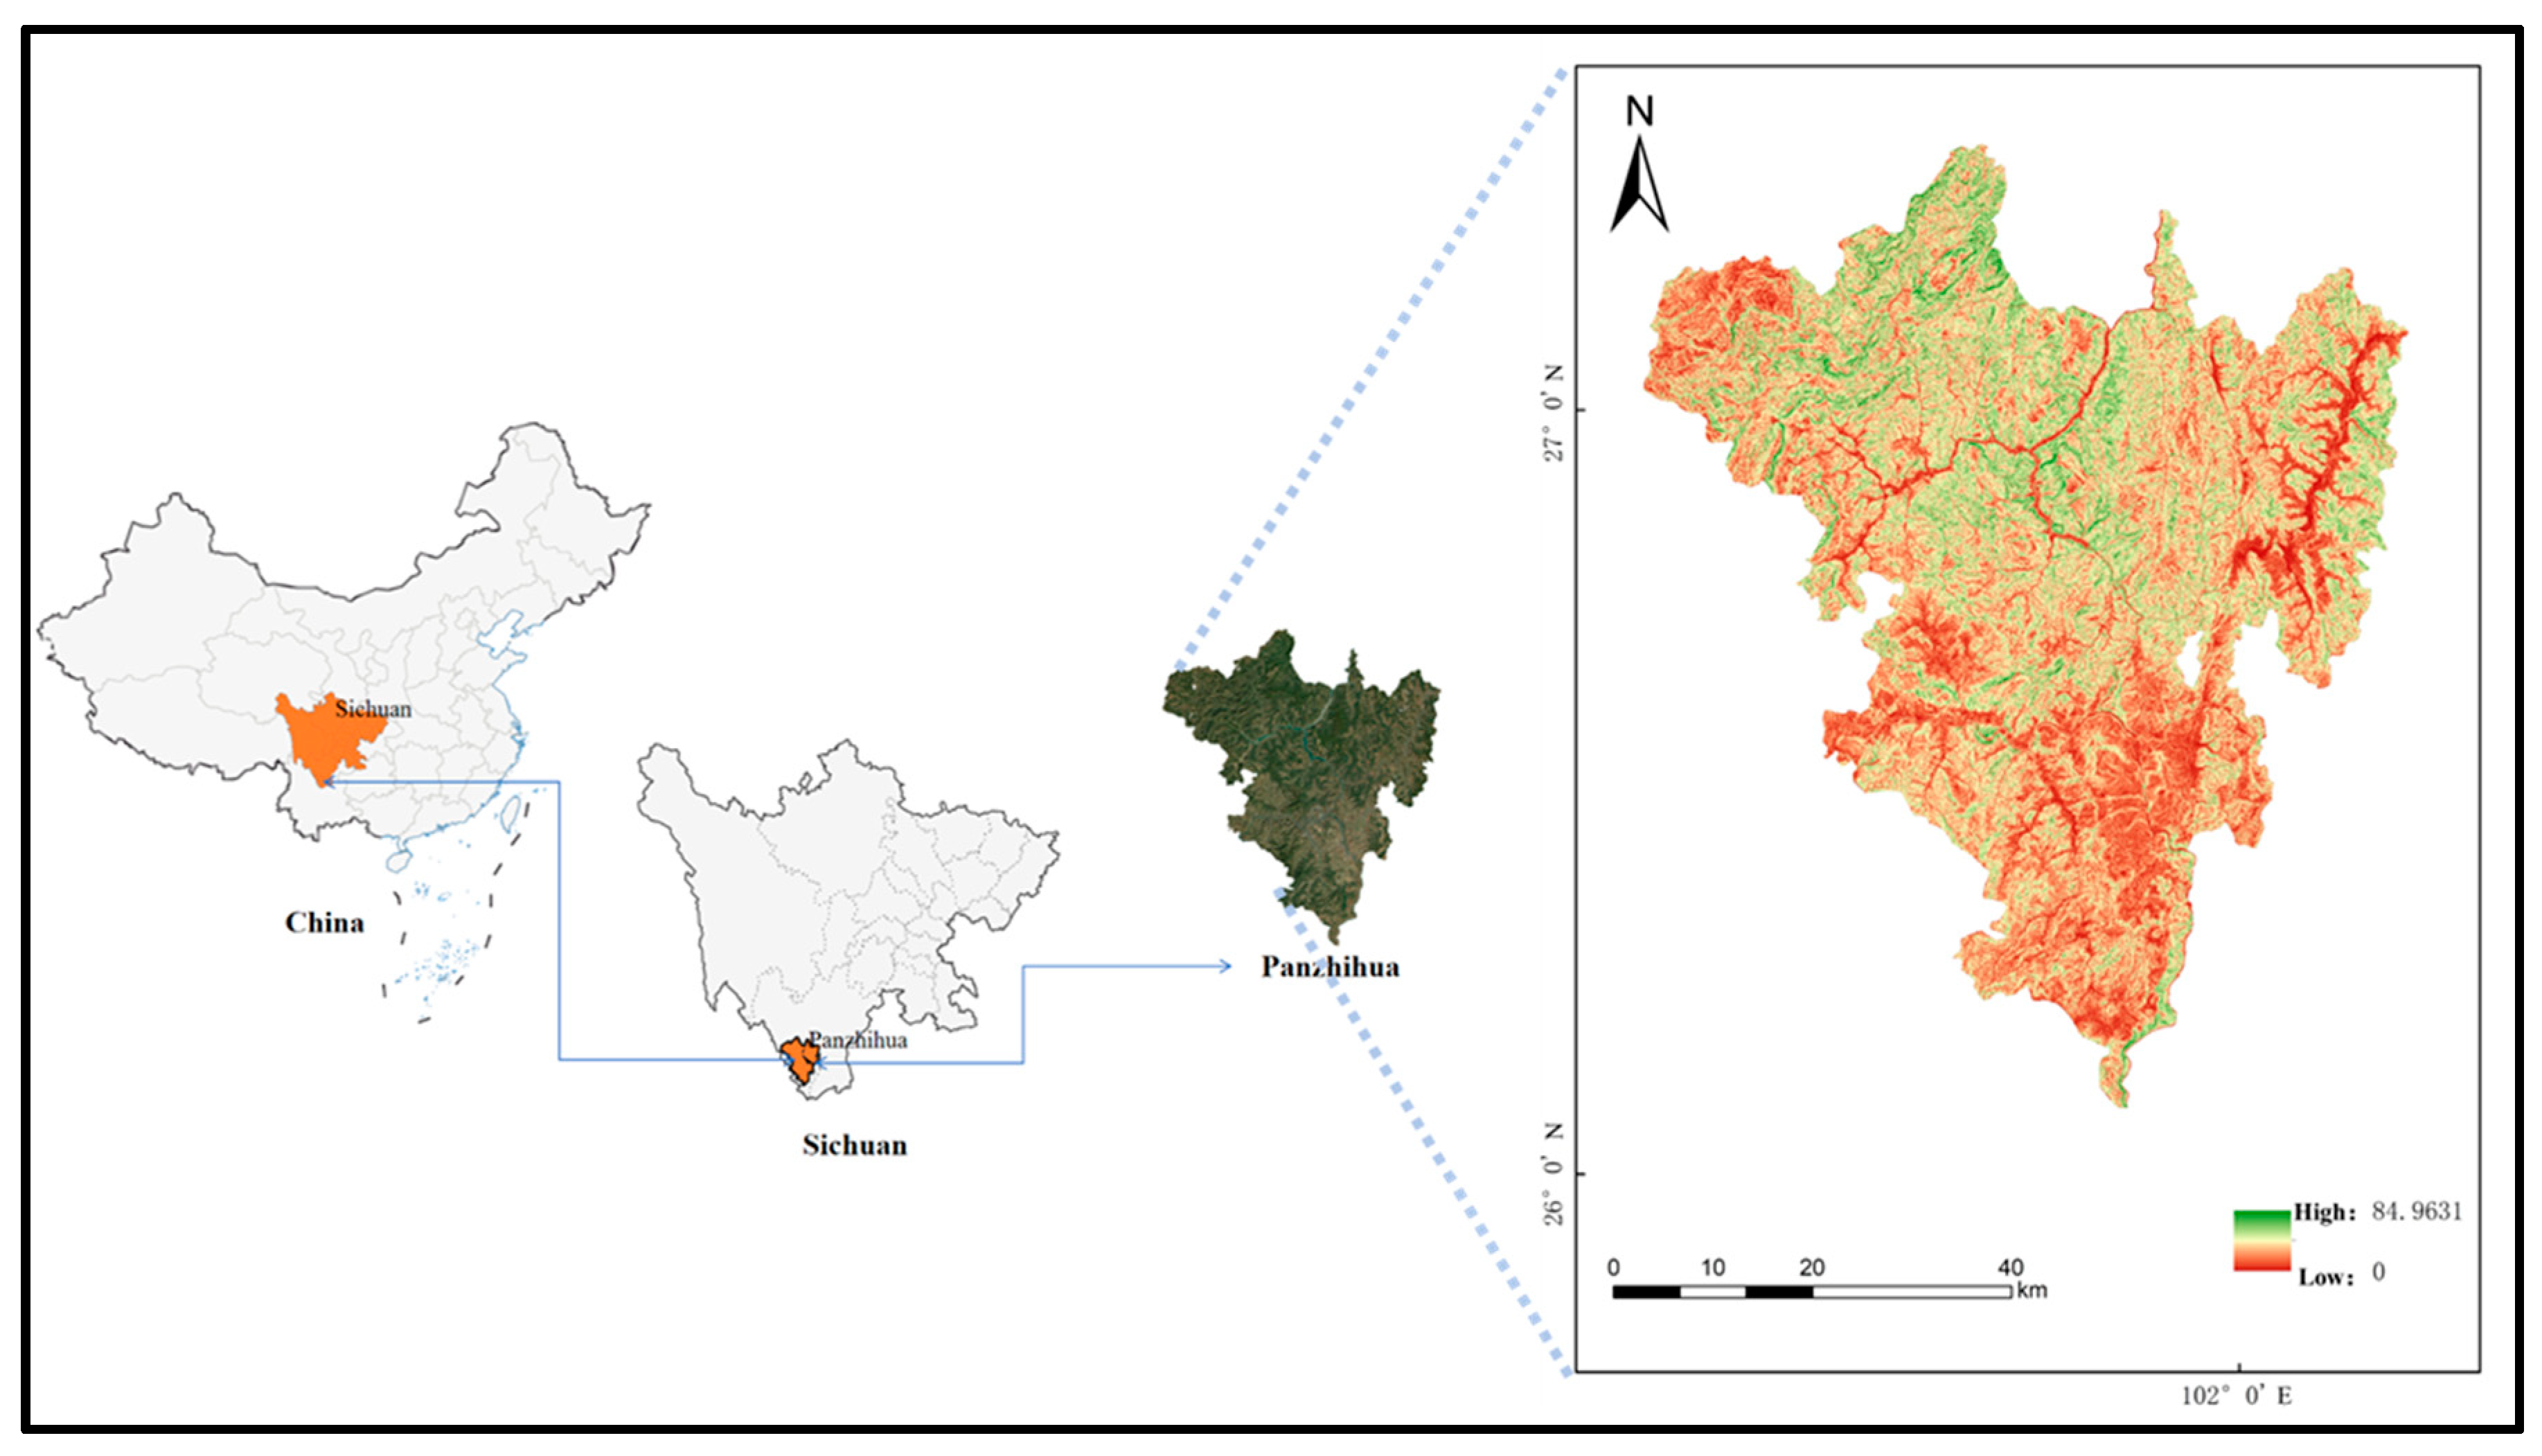
1.1.4. A Mountainous Resource-Based City Case Study
1.2. Research Questions
1.3. Research Purpose
2. Literature Review
2.1. Ecological Network

| Country | Worldwide Research Focus |
|---|---|
| The United States | In-depth research on food webs, mutualistic relationships between plants and animals, and biodiversity maintenance [28]. |
| Canada | The impact of ecosystem services and climate change on ecological networks. |
| The United Kingdom | Biodiversity conservation, ecosystem restoration, and urban ecological network planning [29]. |
| Australia | Tropical ecosystem network structures, coral reef ecosystem functions, and conservation [30]. |
| China | Urban landscape planning, ecological security pattern construction, urban expansion-conservation synergy, and administrative-division-oriented ecological network optimization [31,32]. |
2.2. Morphological and Ecological Spatial Patterns
2.3. MAPA–Conefor–MCR Model
2.3.1. MSPA
2.3.2. Patch Connectivity Analysis (Conefor)
2.3.3. MCR Model
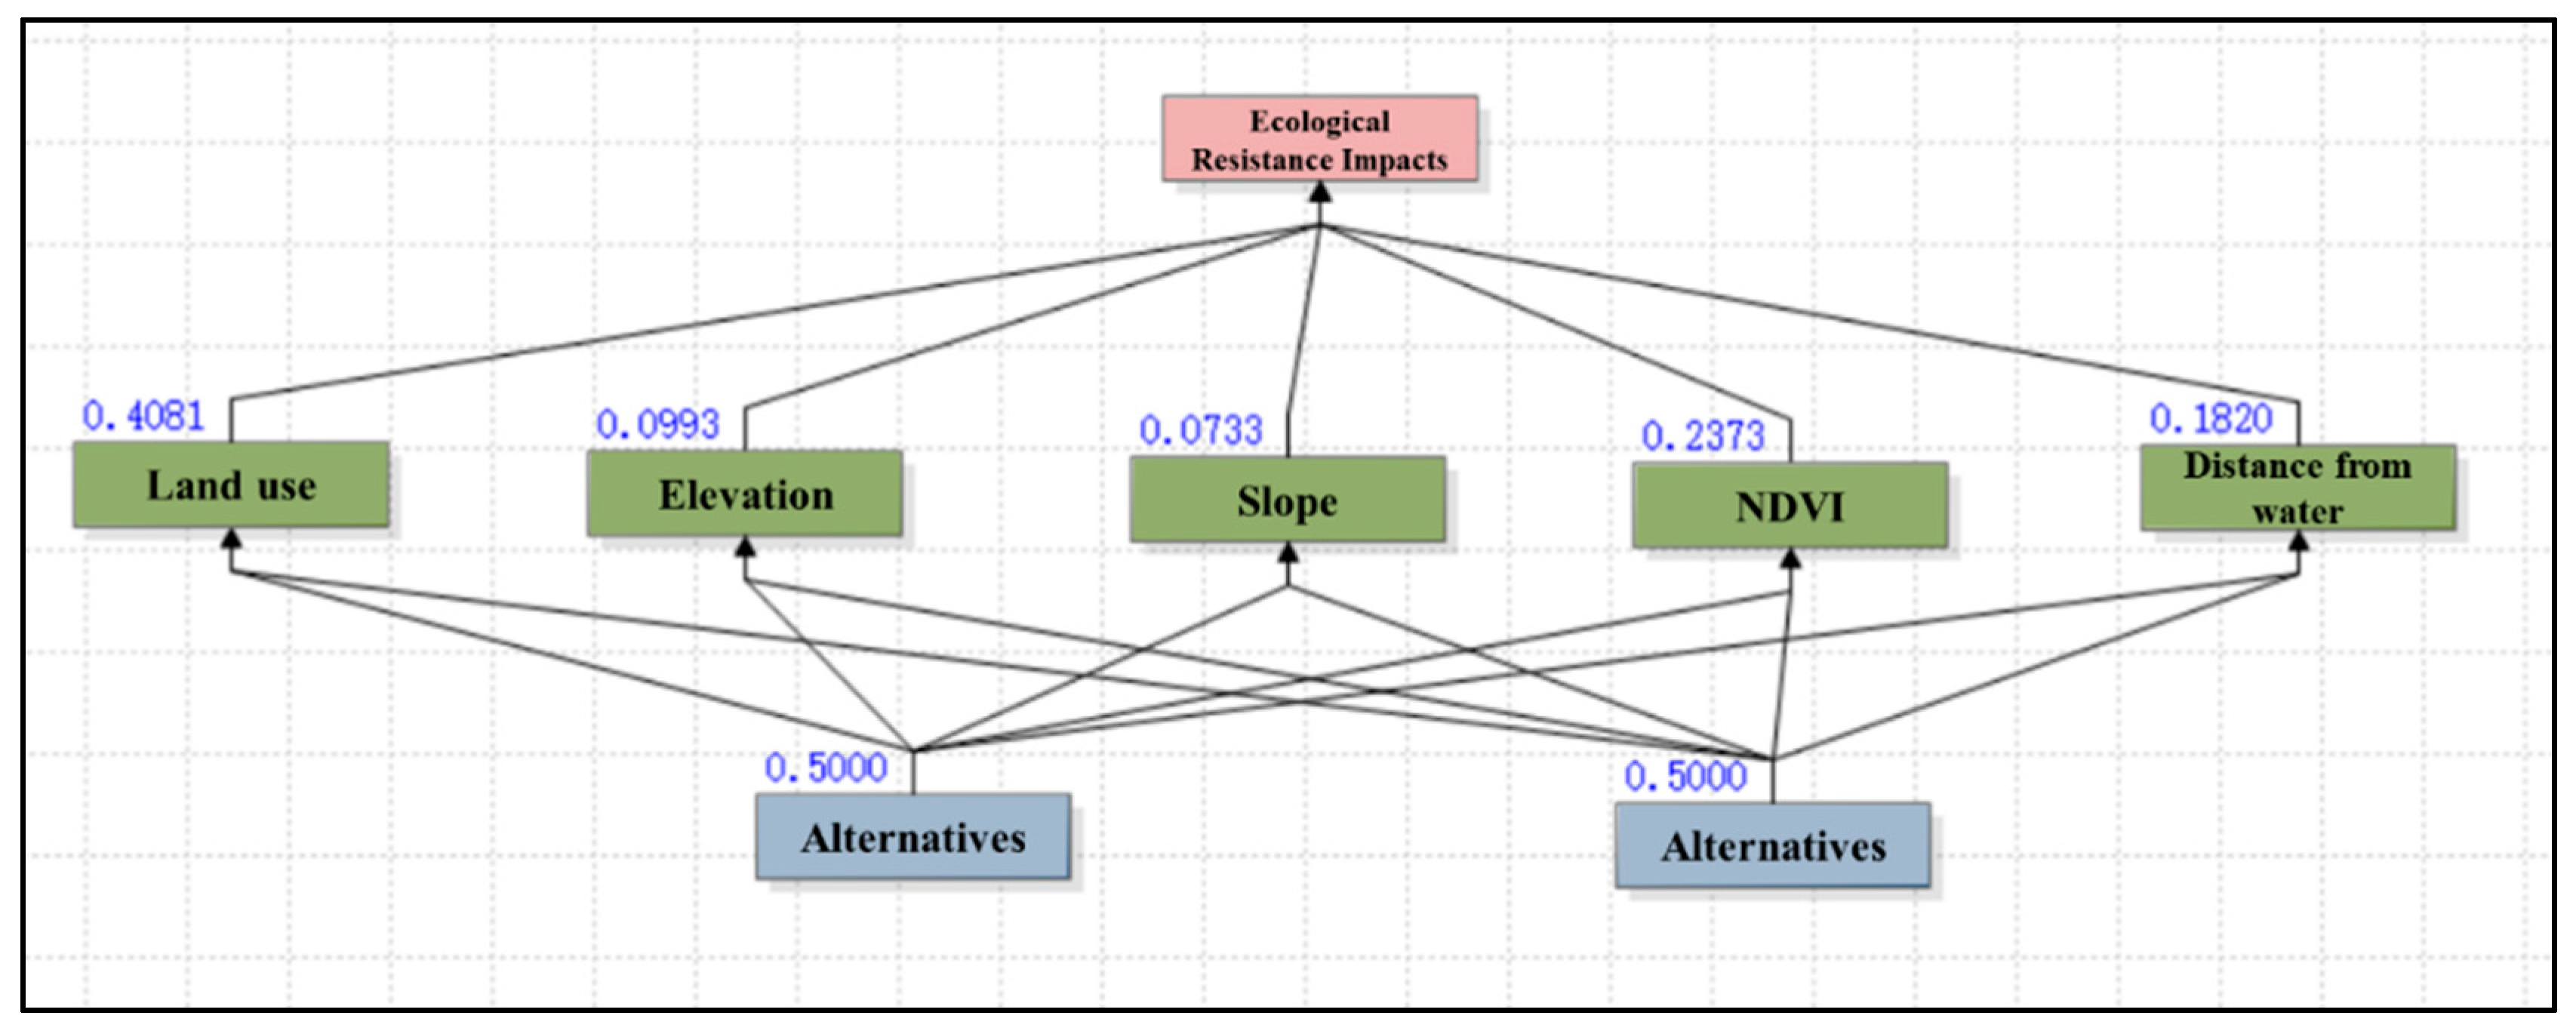
2.4. Analytic Hierarchy Process (AHP)
3. Research Methods
3.1. Research Framework
3.2. Data Sources
4. Data Analysis
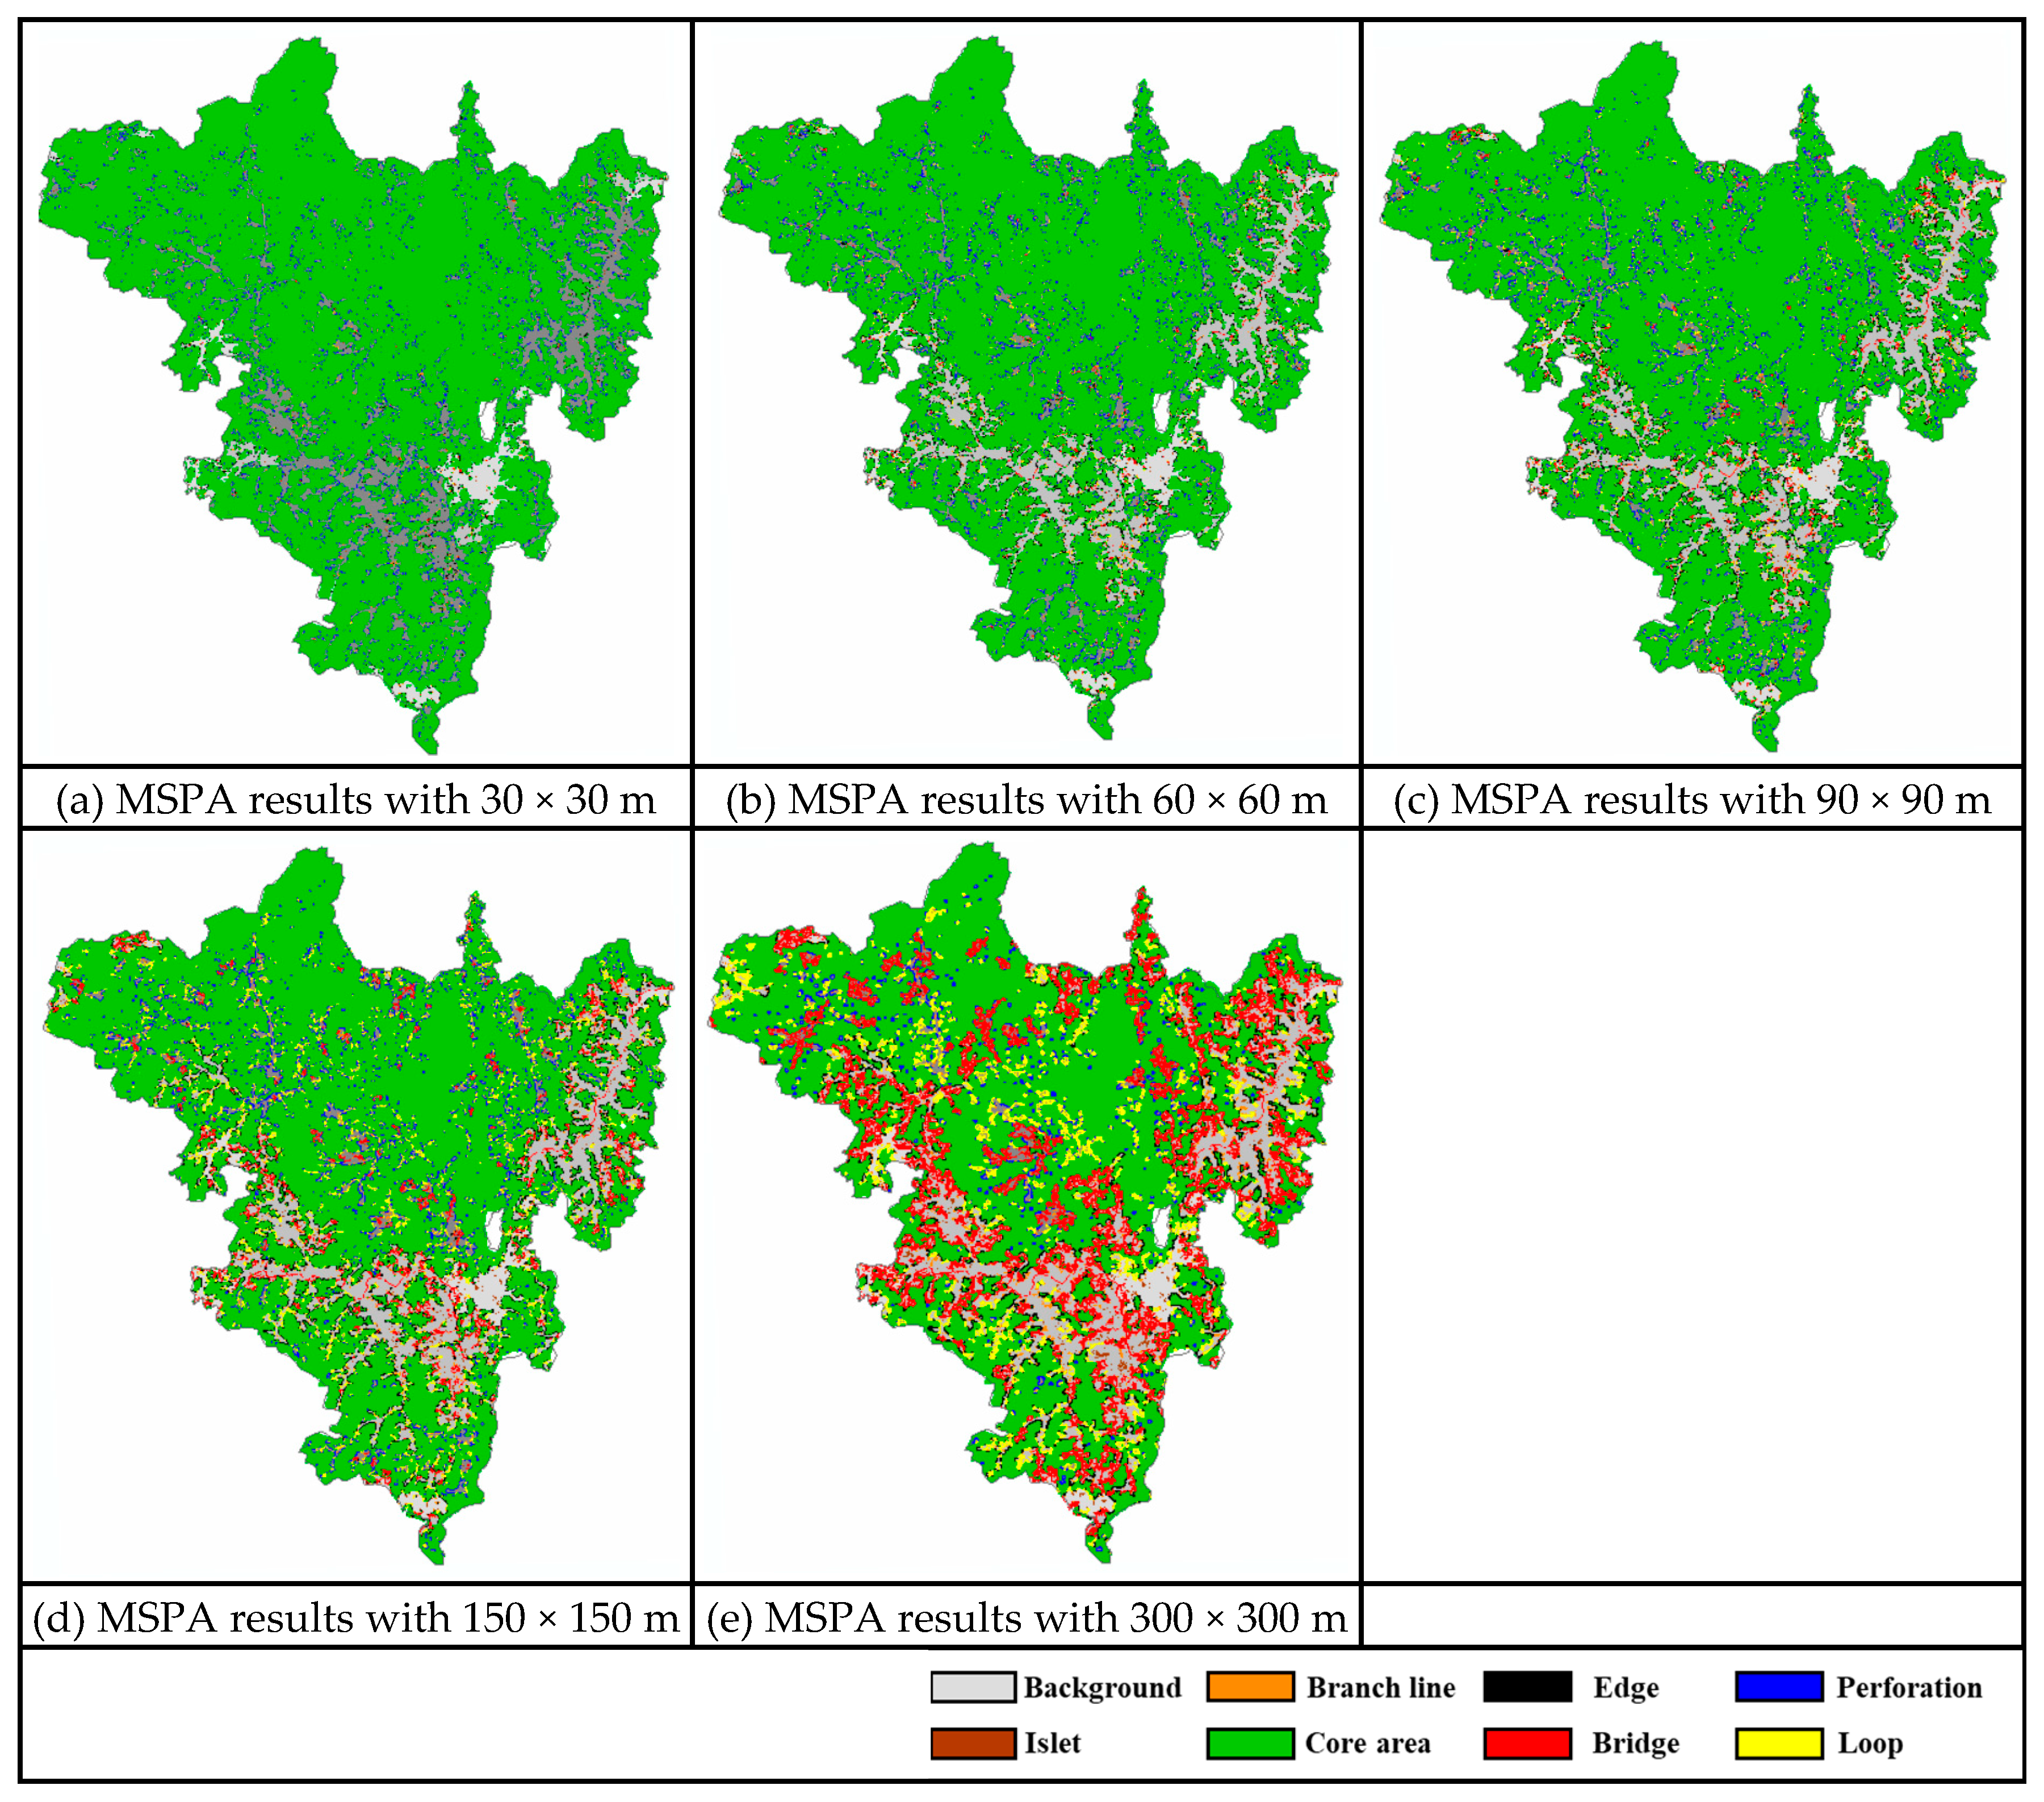
4.1. Landscape Type Identification Based on MSPA Technology
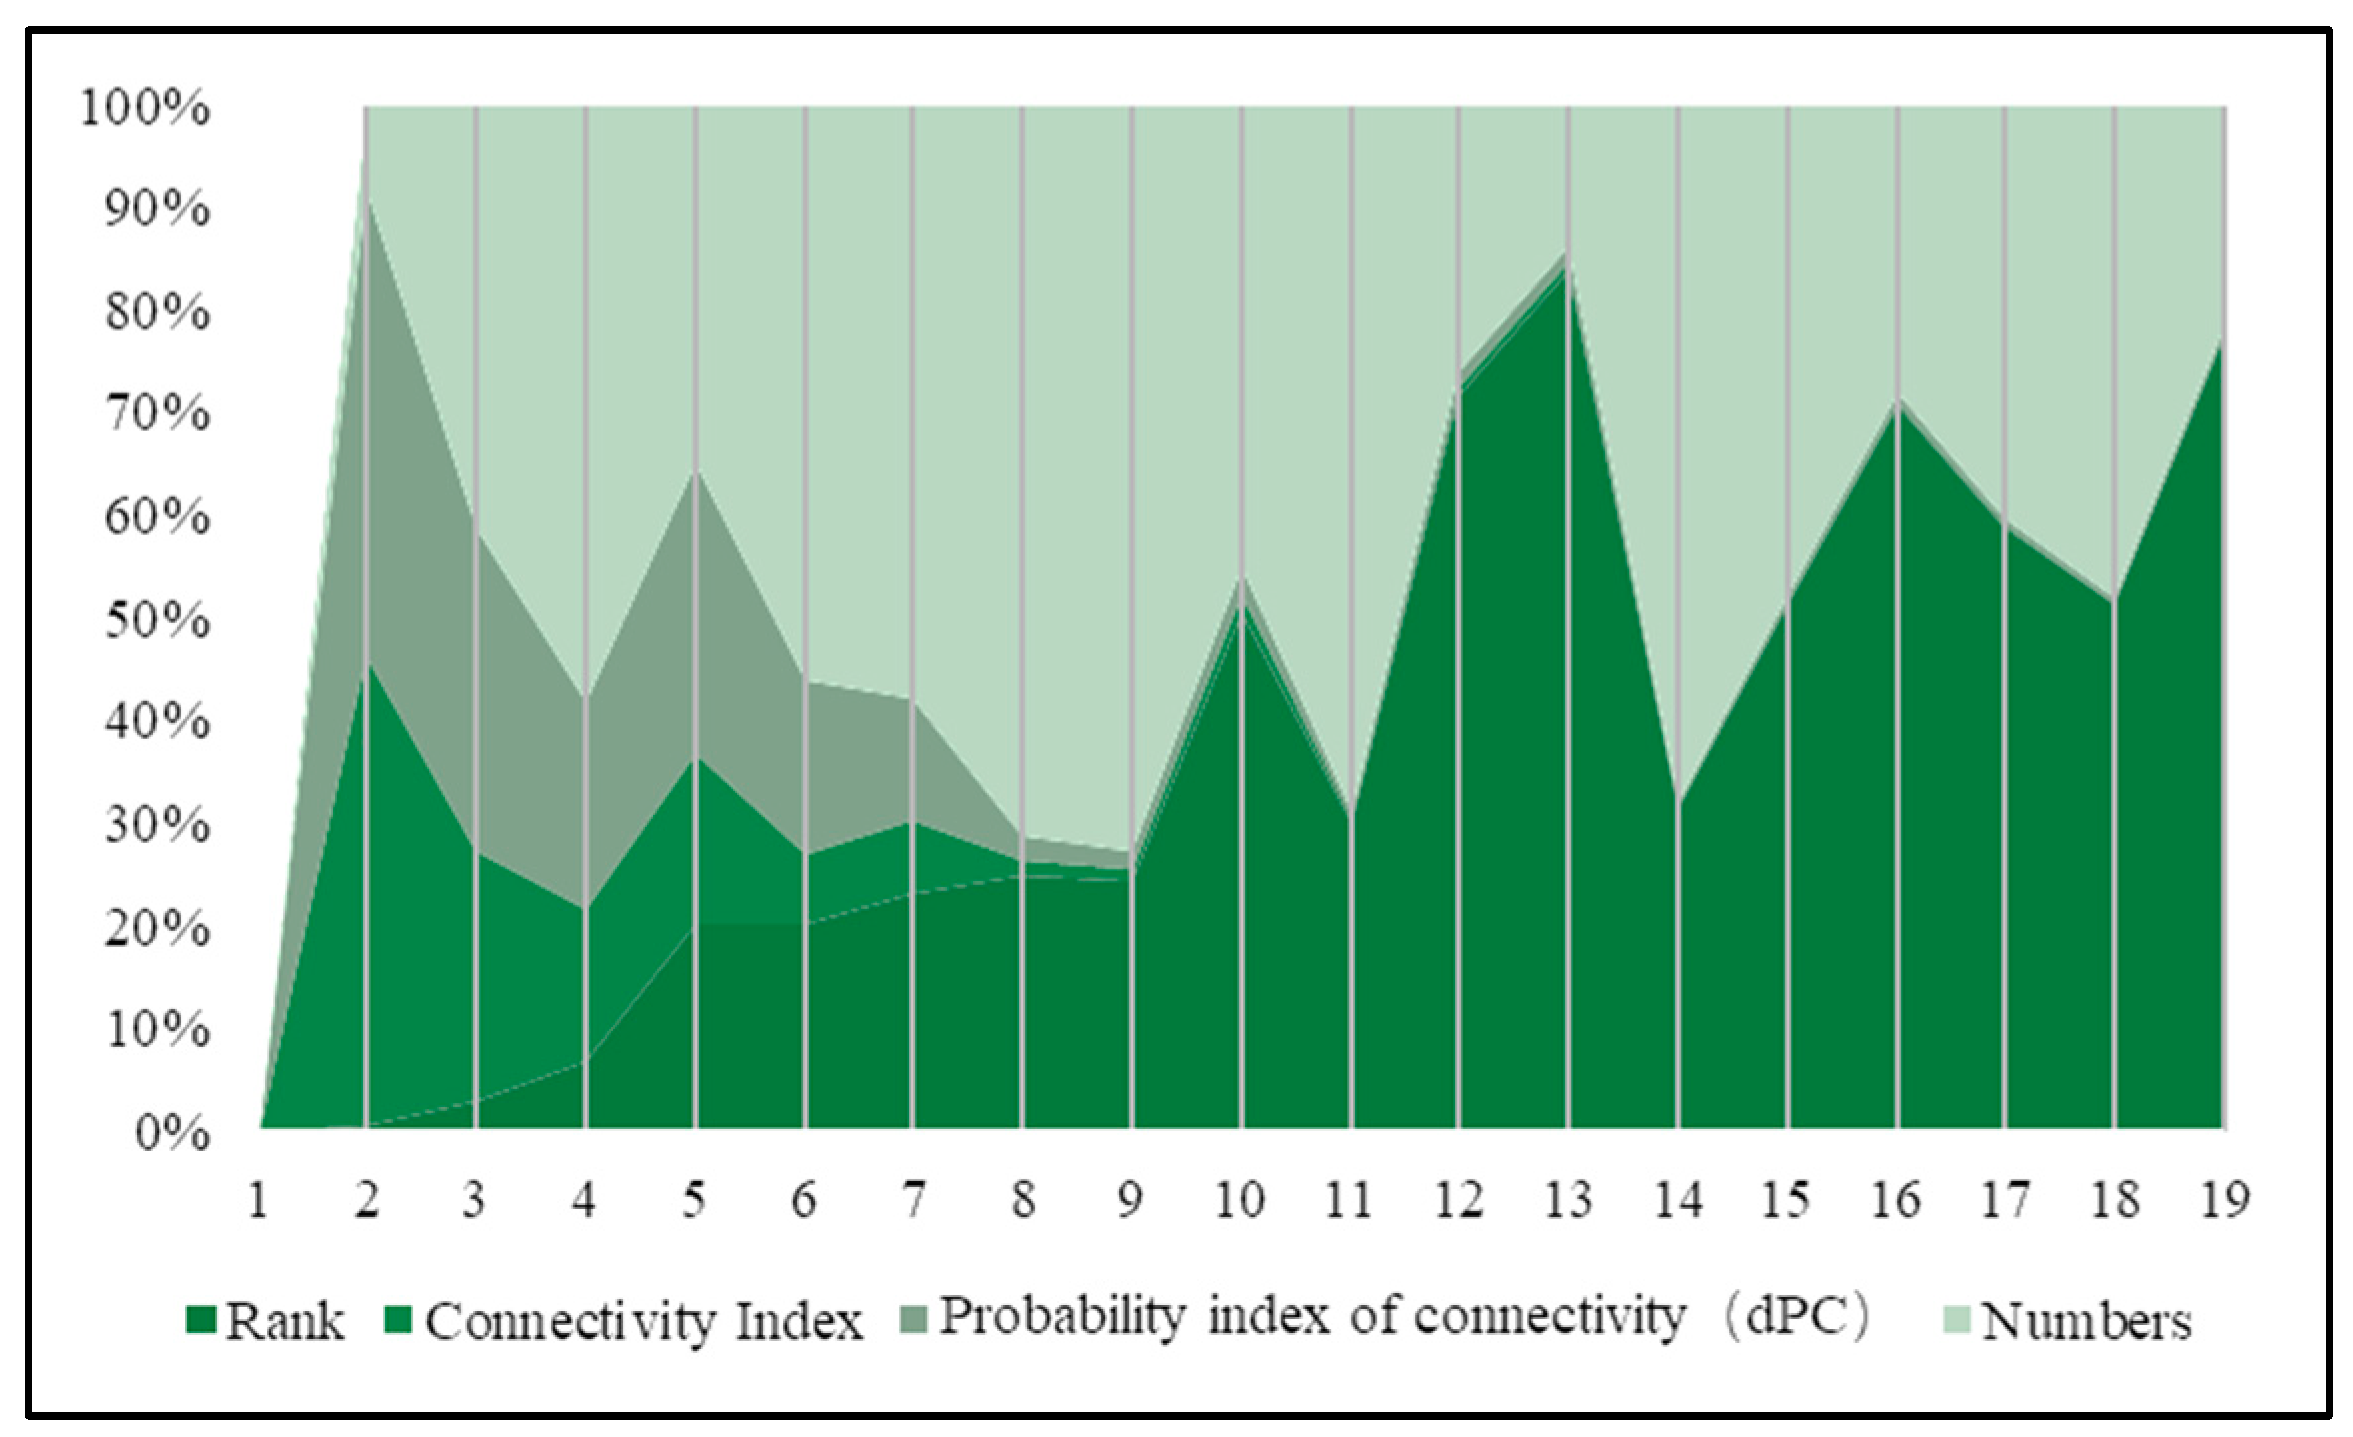
4.2. Landscape Connectivity Evaluation Based on Conefor
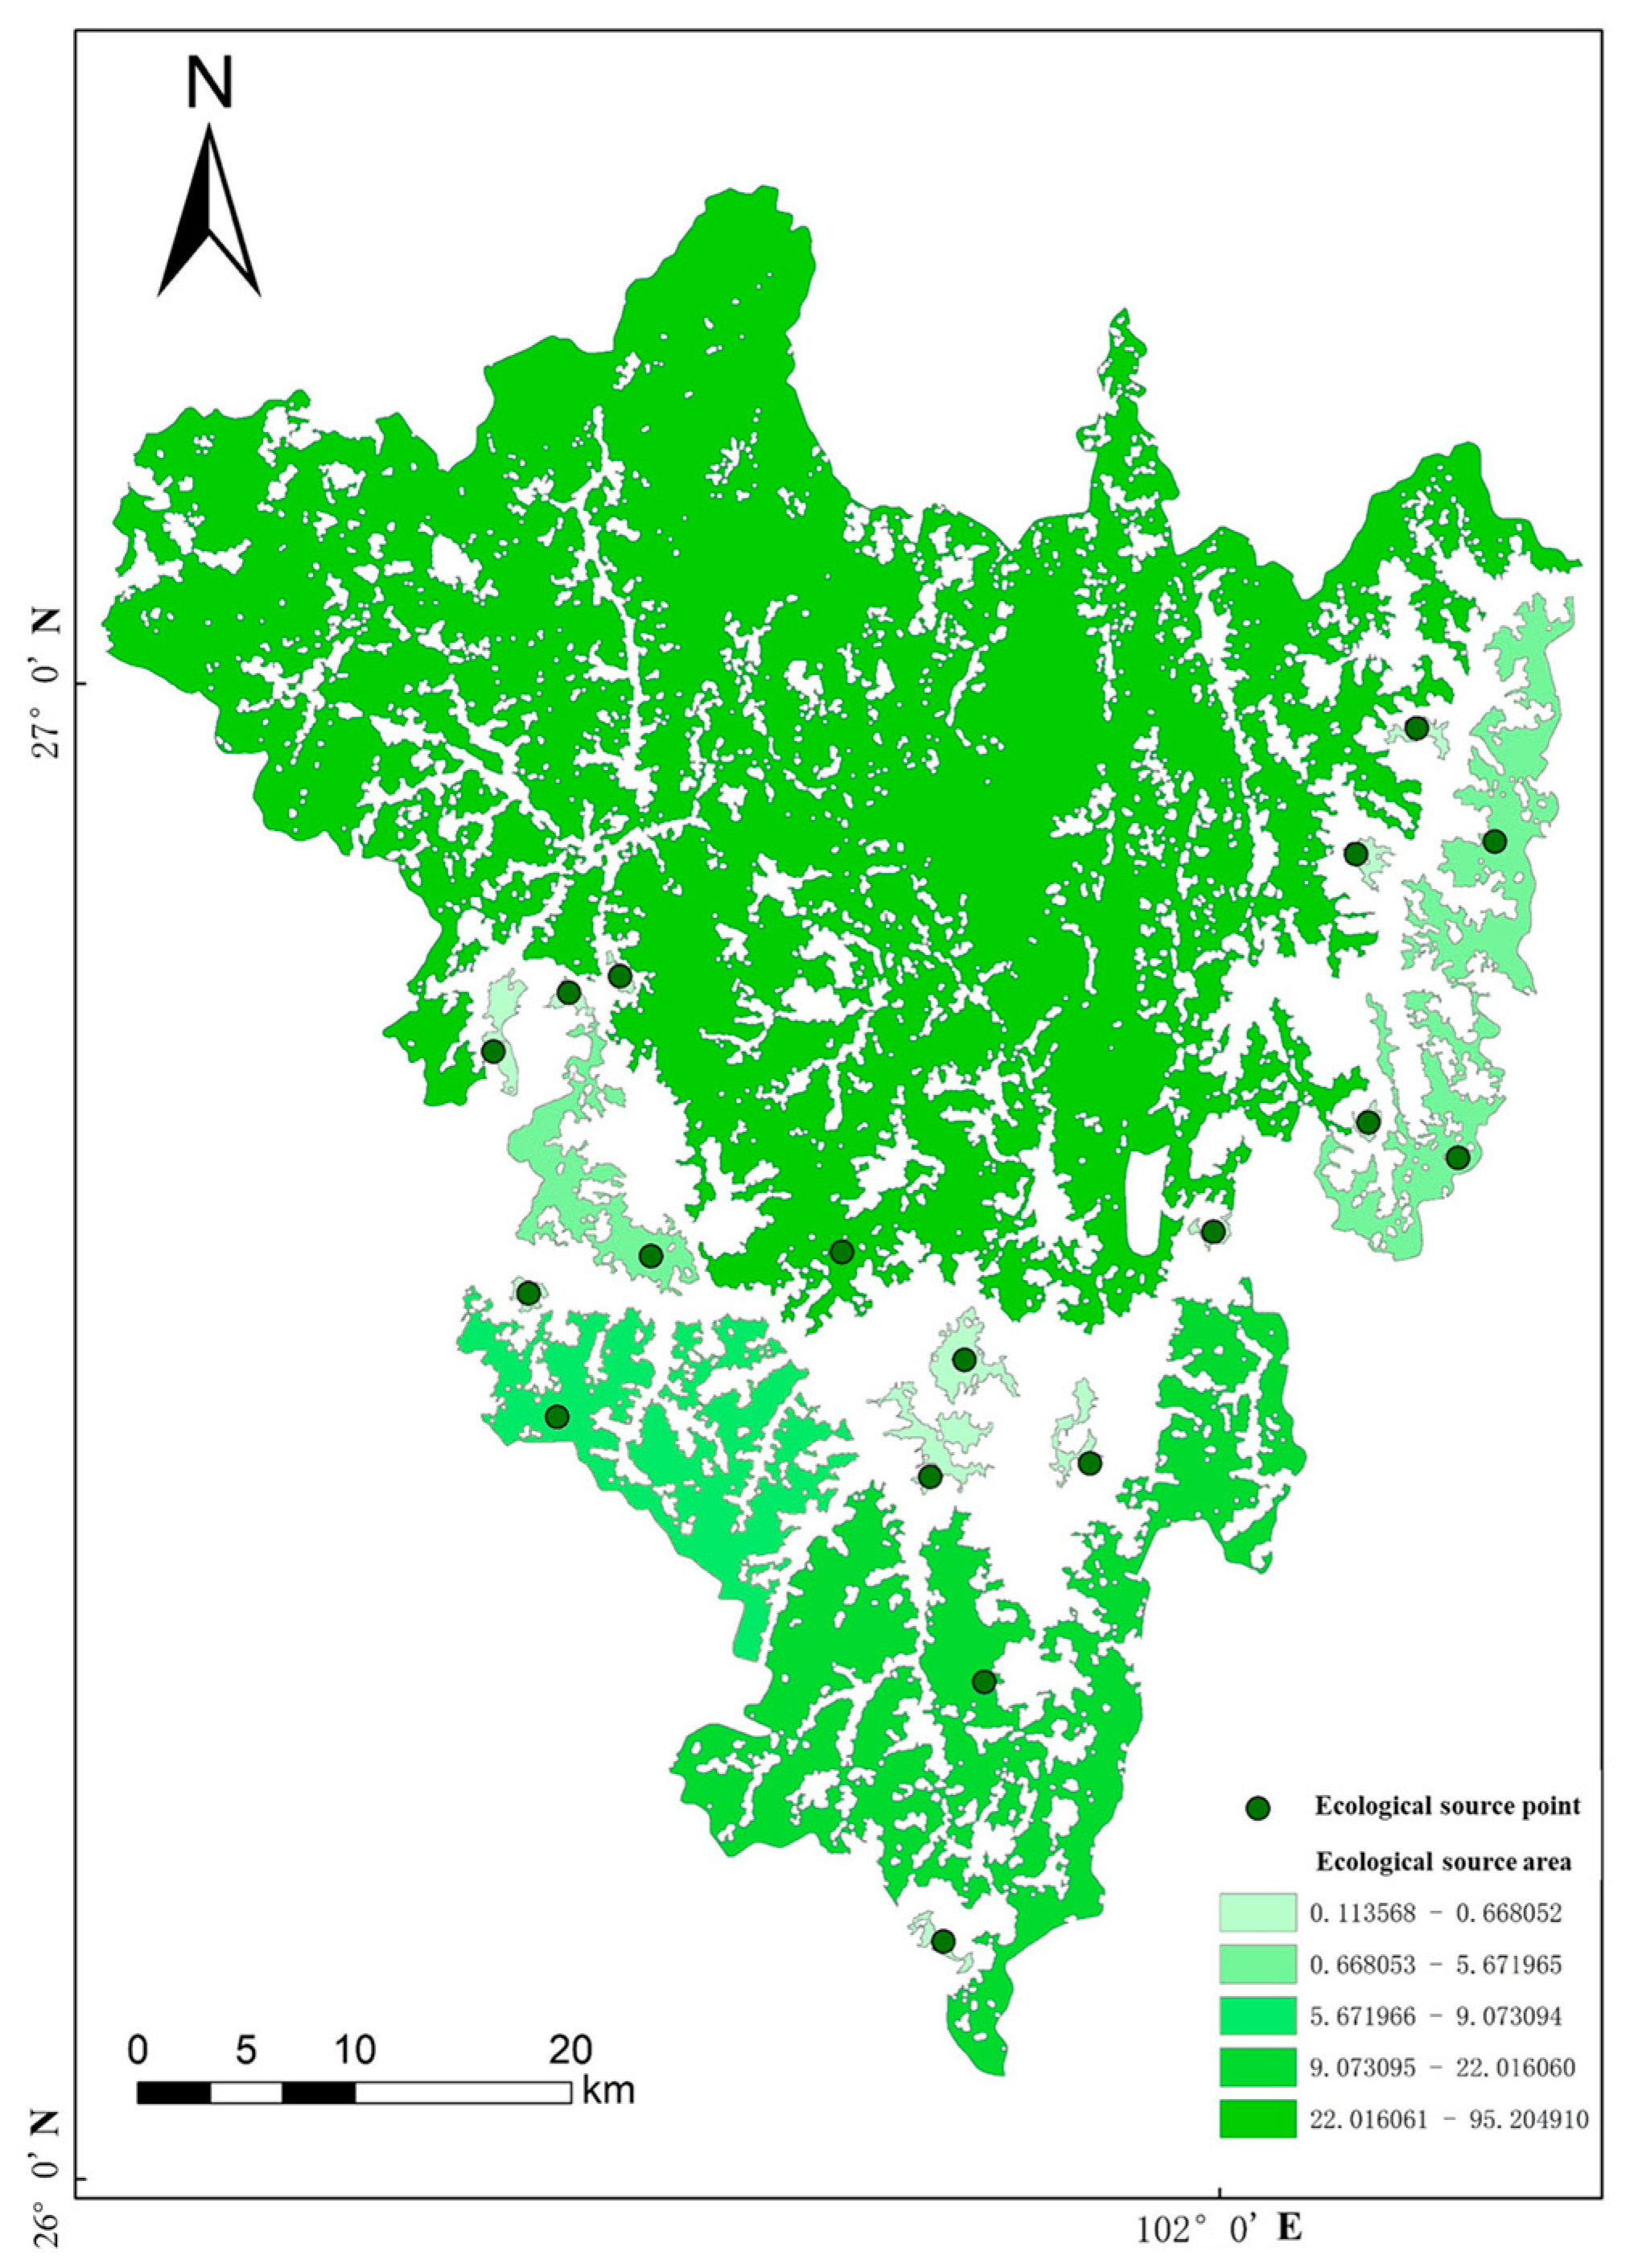
4.3. Selection of Ecological Source Areas
4.4. Construction of Ecological Resistance Surface
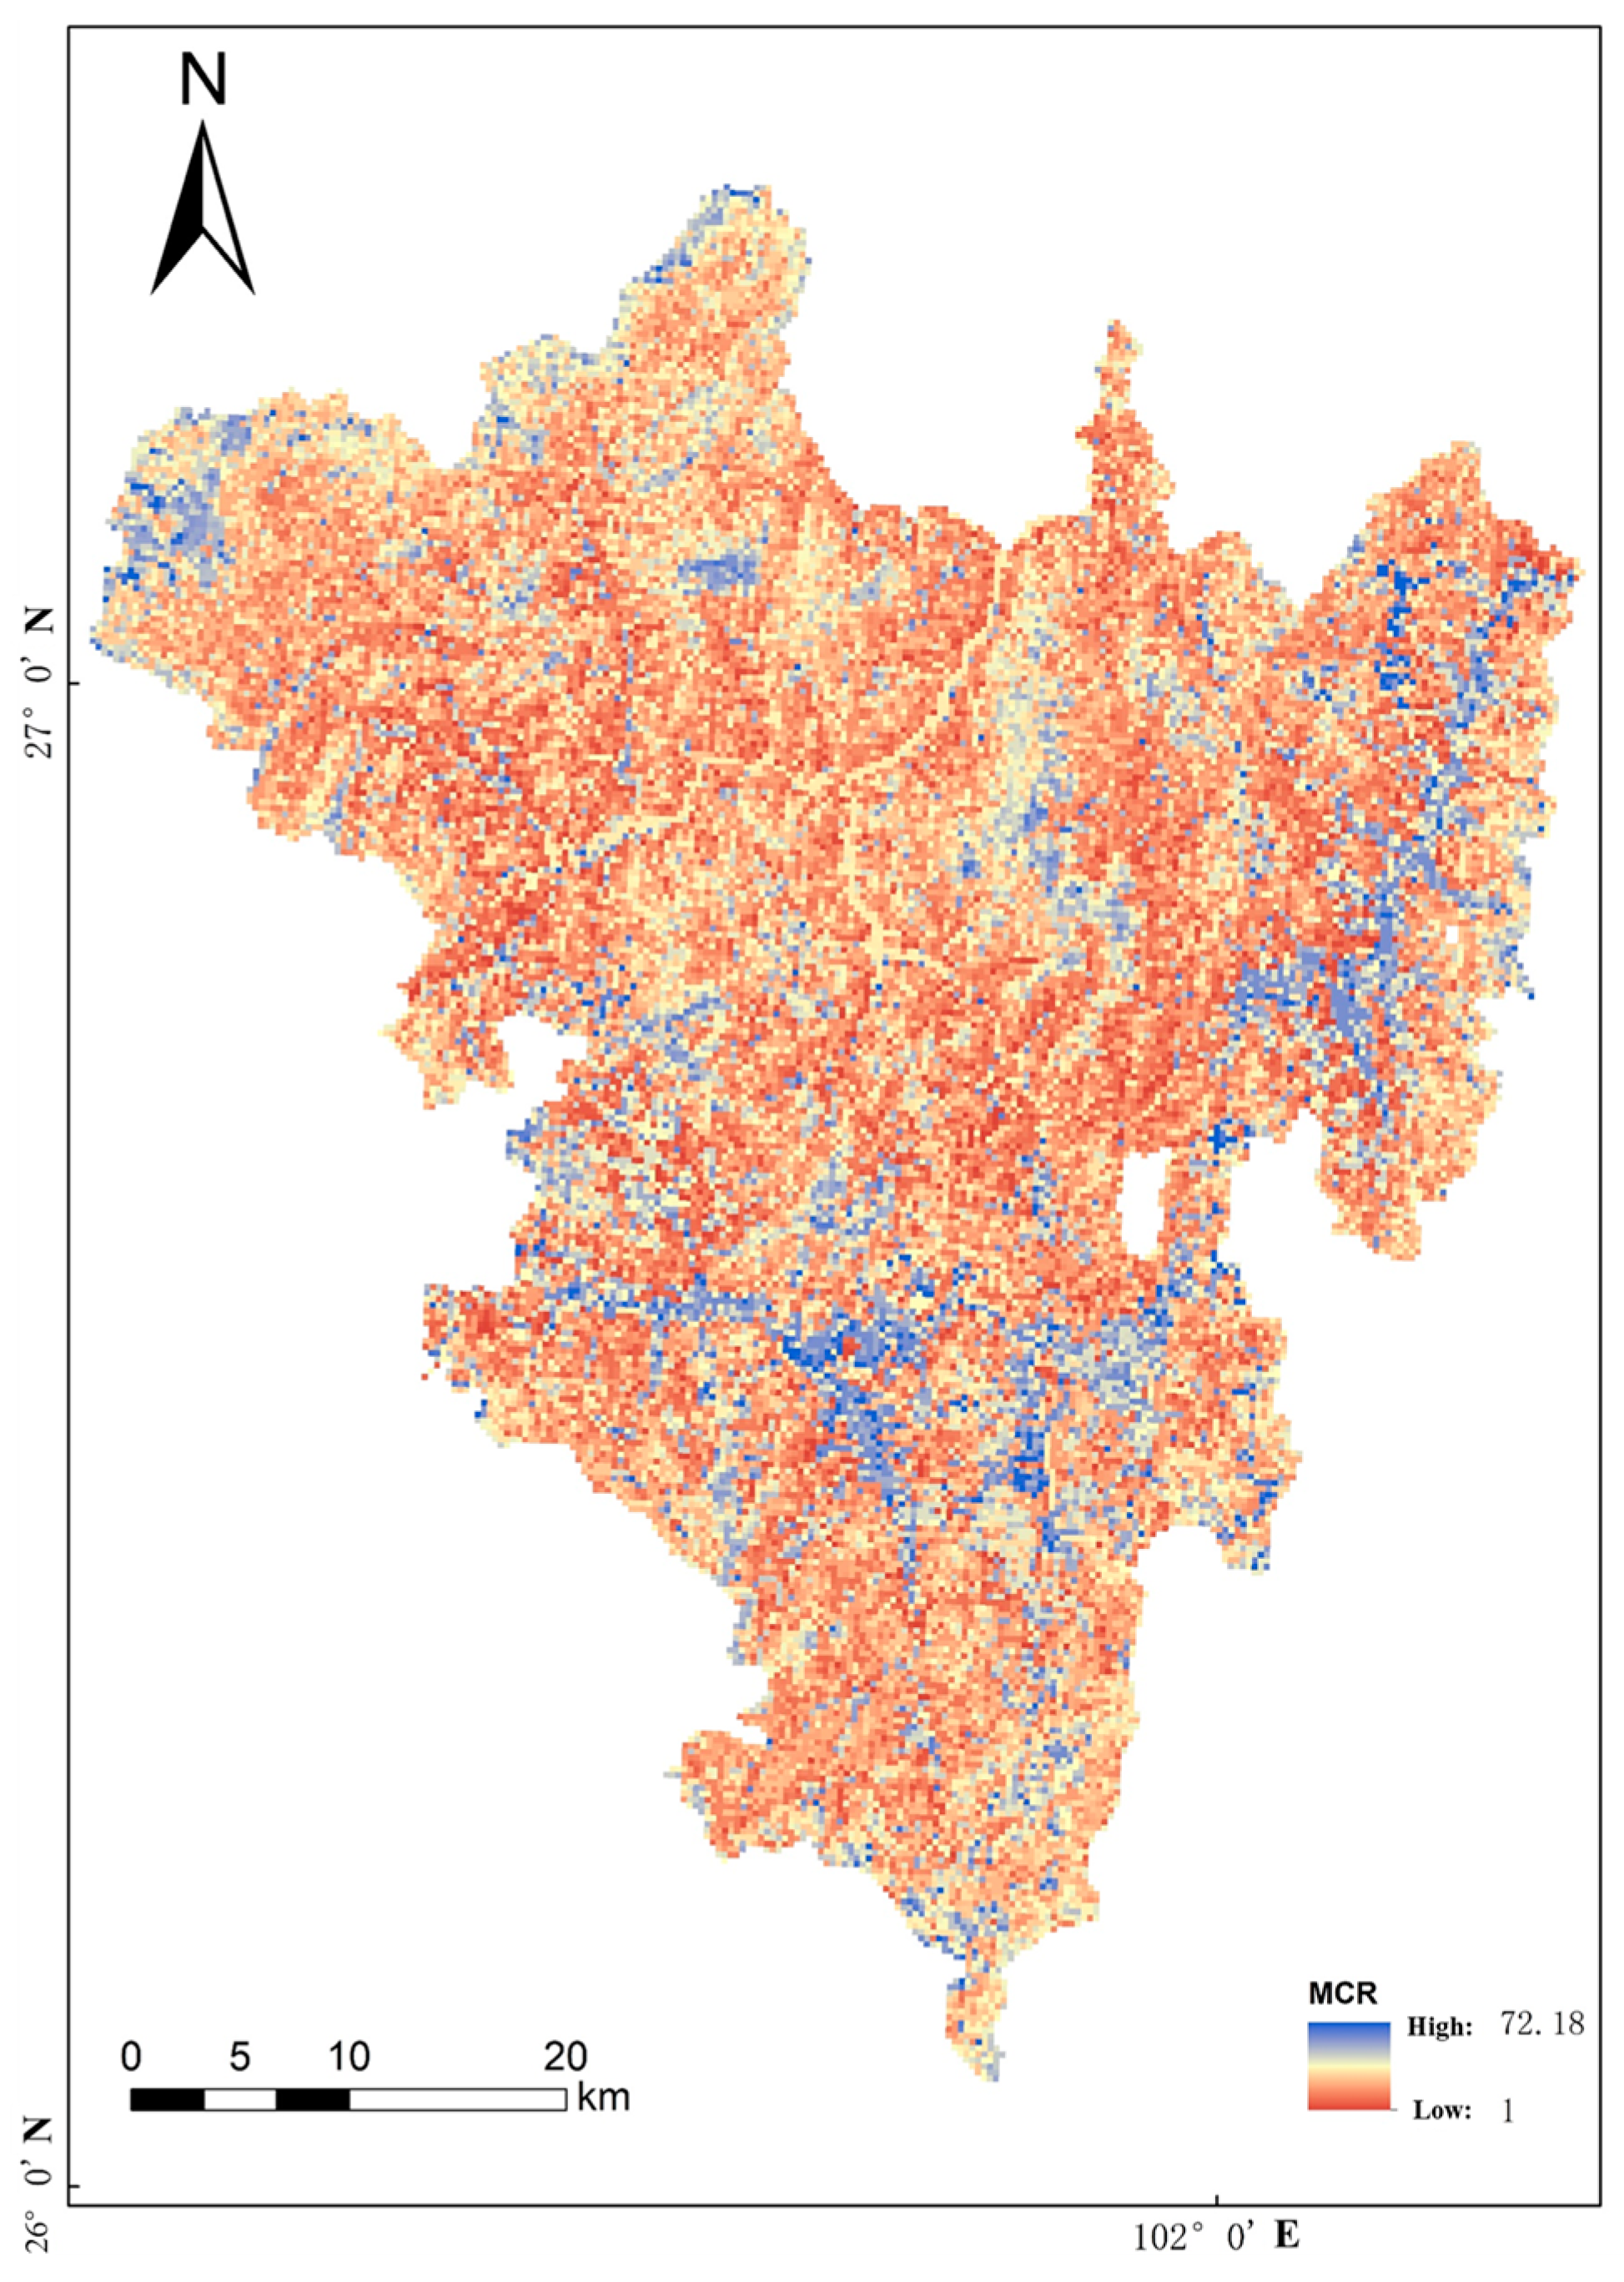
4.5. Ecological Network Construction Based on the MCR Model
4.6. Analysis of Ecological Network Structure Characteristics
4.7. Analysis of the Current Situation of Blue-Green Space Coupling
5. Results
5.1. Ecological Network Optimization: New Ecological Sources and Ecological Resting Points
5.1.1. Ecological Sources, Nodes, and Resting Points
5.1.2. Strengthening Ecological Breakpoint and Integration with Road Networks
5.2. Causes and Potential Impacts of the Blue-Green Space Fragmentation in Panzhihua City
6. Discussion
6.1. Scientific Basis and Innovations in Ecological Network Construction
6.2. Mechanism Analysis of the Causes of Blue-Green Space Fragmentation
6.3. Limitations and Directions for Further Research
7. Conclusions
7.1. Theoretical Implications
7.2. Practical Implications
Author Contributions
Funding
Data Availability Statement
Conflicts of Interest
Appendix A. AHP Scoring Table
| Circle One Number Per Row Below Using the Scale: | |||||||||||||||||||
| 1 = Equal 3 = Moderate 5 = Strong 7 = Very Strong 9 = Extremely Strong | |||||||||||||||||||
| 1 | Land use | 9 | 8 | 7 | 6 | 5 | 4 | 3 | 2 | 1 | 2 | 3 | 4 | 5 | 6 | 7 | 8 | 9 | Elevation |
| 2 | Land use | 9 | 8 | 7 | 6 | 5 | 4 | 3 | 2 | 1 | 2 | 3 | 4 | 5 | 6 | 7 | 8 | 9 | Slope |
| 3 | Land use | 9 | 8 | 7 | 6 | 5 | 4 | 3 | 2 | 1 | 2 | 3 | 4 | 5 | 6 | 7 | 8 | 9 | NDVI |
| 4 | Land use | 9 | 8 | 7 | 6 | 5 | 4 | 3 | 2 | 1 | 2 | 3 | 4 | 5 | 6 | 7 | 8 | 9 | Distance from water |
| 5 | Elavation | 9 | 8 | 7 | 6 | 5 | 4 | 3 | 2 | 1 | 2 | 3 | 4 | 5 | 6 | 7 | 8 | 9 | Slope |
| 6 | Elavation | 9 | 8 | 7 | 6 | 5 | 4 | 3 | 2 | 1 | 2 | 3 | 4 | 5 | 6 | 7 | 8 | 9 | NDVI |
| 7 | Elavation | 9 | 8 | 7 | 6 | 5 | 4 | 3 | 2 | 1 | 2 | 3 | 4 | 5 | 6 | 7 | 8 | 9 | Distance from water |
| 8 | Slope | 9 | 8 | 7 | 6 | 5 | 4 | 3 | 2 | 1 | 2 | 3 | 4 | 5 | 6 | 7 | 8 | 9 | NDVI |
| 9 | Slope | 9 | 8 | 7 | 6 | 5 | 4 | 3 | 2 | 1 | 2 | 3 | 4 | 5 | 6 | 7 | 8 | 9 | Distance from water |
| 10 | NDVI | 9 | 8 | 7 | 6 | 5 | 4 | 3 | 2 | 1 | 2 | 3 | 4 | 5 | 6 | 7 | 8 | 9 | Distance from water |
References
- Yu, Z.; Yang, G.; Zuo, S.; Jørgensen, G.; Koga, M.; Vejre, H. Critical Review on the Cooling Effect of Urban Blue-Green Space: A Threshold-Size Perspective. Urban For. Urban Green. 2020, 49, 126630. [Google Scholar] [CrossRef]
- Lekshmi, B.; Saha, D.; Sutar, R.S.; Singh, R.; Prabhu, S.D.; Kamat, A.M.; Sharma, S.; Saxena, R.; Loiselle, S.; Asolekar, S.R. Science & Technology Agenda for Blue-Green Spaces Inspired by Citizen Science: Case for Rejuvenation of Powai Lake. Sustainability 2021, 13, 10061. [Google Scholar] [CrossRef]
- Dai, W.; Tan, Y. Study on Multi-Scenario Rain-Flood Disturbance Simulation and Resilient Blue-Green Space Optimization in the Pearl River Delta. Buildings 2024, 14, 3797. [Google Scholar] [CrossRef]
- Gao, H.; Chen, Y.H.; Li, K.N.; Gao, S.J. People’s Exposure to Blue-Green Spaces Decreased but Inequality Increased During 2001–2020 across Major Chinese Cities. Ecol. Indic. 2024, 166, 112571. [Google Scholar] [CrossRef]
- Jiao, X.X.; Zhao, Z.M.; Li, X.; Wang, Z.F.; Zhang, Y.J. Advances in the Blue-Green Space Evaluation Index System. Ecohydrology 2023, 16, e2527. [Google Scholar]
- Jiang, Y.; Zhou, L.; Wang, B.; Zhang, Q.; Gao, H.; Wang, S.; Cui, M. The Impact of Gradient Expansion of Urban–Rural Construction Land on Landscape Fragmentation in Typical Mountain Cities, China. Int. J. Digit. Earth 2024, 17, 2310093. [Google Scholar] [CrossRef]
- Luo, Q.; Bao, Y.; Wang, Z.; Chen, X.; Wei, W.; Fang, Z. Vulnerability Assessment of Urban Remnant Mountain Ecosystems Based on Ecological Sensitivity and Ecosystem Services. Ecol. Indic. 2023, 151, 110314. [Google Scholar] [CrossRef]
- Xing, L.; Wang, Z.; Tu, Y. Spatial and Temporal Evolution of Landscape Pattern of Urban Natural Remnant Mountains in Karst Region of Central Guizhou: A Case Study of Anshun City. Acta Ecol. Sin. 2021, 41, 1291–1302. [Google Scholar]
- Chen, X.; Wang, Z.; Bao, Y. Cool Island Effects of Urban Remnant Natural Mountains for Cooling Communities: A Case Study of Guiyang, China. Sustain. Cities Soc. 2021, 71, 102983. [Google Scholar] [CrossRef]
- van Kooten, G.C.; Thomsen, R.; Hobby, T.G.; Eagle, A.J. Social Dilemmas and Public Range Management in Nevada. Ecol. Econ. 2006, 57, 709–723. [Google Scholar] [CrossRef]
- Yu, X.; Liu, Y.; Zhang, Z.; Xiong, Y.; Dang, M. Urban Spatial Structure Features in Qinling Mountain Area Based on Ecological Network Analysis-Case Study of Shangluo City. Alex. Eng. J. 2022, 61, 12829–12845. [Google Scholar] [CrossRef]
- Liu, L.; Song, W.; Zhang, Y.; Han, Z.; Li, H.; Yang, D.; Wang, Z.; Huang, Q. Zoning of Ecological Restoration in the Qilian Mountain Area, China. Int. J. Environ. Res. Public Health 2021, 18, 12417. [Google Scholar] [CrossRef] [PubMed]
- Yang, F.; Yao, Z.; Sun, J.; Zhu, Y.; Wang, Z. The Landscape Pattern Changes Analysis of Changbai Mountain Forest Based on Rs and Gis—A Case Study in Fusong and Antu Counties. Syst. Sci. Compr. Stud. Agric. 2010, 26, 431–437. [Google Scholar]
- de Groot, R.S.; Alkemade, R.; Braat, L.; Hein, L.; Willemen, L. Challenges in Integrating the Concept of Ecosystem Services and Values in Landscape Planning, Management and Decision Making. Ecol. Complex. 2010, 7, 260–272. [Google Scholar] [CrossRef]
- Rojas Quezada, C.; Jorquera, F. Urban Fabrics to Eco-Friendly Blue–Green for Urban Wetland Development. Sustainability 2021, 13, 13745. [Google Scholar] [CrossRef]
- Well, F.; Ludwig, F. Integrated Planning and Implementation of a Blue-Green Architecture Project by Applying a Design-Build Teaching Approach. Land 2022, 11, 762. [Google Scholar] [CrossRef]
- Pritipadmaja; Garg, R.D.; Sharma, A.K. Assessing the Cooling Effect of Blue-Green Spaces: Implications for Urban Heat Island Mitigation. Water 2023, 15, 2983. [Google Scholar] [CrossRef]
- Chu, S.Z.; Xu, W.Z.; Zhang, D.Y.; Lin, J.S.; Liu, J.; Liu, S.H.; Hong, X.C. Urban Blue-Green Spaces and Tranquility: A Comprehensive Review of Noise Reduction and Sensory Perception Integration. J. Asian Archit. Build. Eng. 2025, 1–22. [Google Scholar] [CrossRef]
- Li, J.F.; Xu, H.Y.; Ren, M.J.; Duan, J.X.; You, W.W.; Zhou, Y. Knowledge Mapping of Cultural Ecosystem Services Applied on Blue-Green Infrastructure-a Scientometric Review with Citespace. Forests 2024, 15, 1736. [Google Scholar] [CrossRef]
- Nalumu, D.J.; Peña, D.O.; Perrotti, D. Leveraging the No Net Land Take Policy through Ecological Connectivity Analysis: The Role of Industrial Platforms in Flanders, Belgium. Sustainability 2023, 15, 16103. [Google Scholar] [CrossRef]
- Lu, Z.; Li, W.; Wang, Y.; Zhou, S. Bibliometric Analysis of Global Research on Ecological Networks in Nature Conservation from 1990 to 2020. Sustainability 2022, 14, 4925. [Google Scholar] [CrossRef]
- Panzhihua Municipal Bureau of Statistics. Panzhihua Statistical Yearbook 2023. Available online: http://tjj.panzhihua.gov.cn (accessed on 1 May 2024).
- Panzhihua Municipal Bureau of Natural Resources and Planning. Panzhihua Municipal Bureau of Natural Resources and Planning (2021–2035); Panzhihua Municipal Bureau of Natural Resources and Planning: Panzhihua, China, 2022.
- Lau, M.K.; Borrett, S.R.; Baiser, B.; Gotelli, N.J.; Ellison, A.M. Ecological Network Metrics: Opportunities for Synthesis. Ecosphere 2017, 8, e01900. [Google Scholar] [CrossRef]
- Scheiner, S.M.; Chiarucci, A.; Fox, G.A.; Helmus, M.R.; McGlinn, D.J.; Willig, M.R. The Underpinnings of the Relationship of Species Richness with Space and Time. Ecol. Monogr. 2011, 81, 195–213. [Google Scholar] [CrossRef]
- Wang, Y.; Zhao, W.L.; Liu, C.Q. Optimization and Construction of Ecological Network Based on Mspa-Conefor-Mcr Path: Take Pengze County as an Example. Acta Agric. Univ. Jiangxiensis 2022, 44, 504–518. [Google Scholar]
- Miao, Z.; Pan, L.; Wang, Q.; Chen, P.; Yan, C.; Liu, L. Research on Urban Ecological Network under the Threat of Road Networks—A Case Study of Wuhan. ISPRS Int. J. Geo-Inf. 2019, 8, 342. [Google Scholar] [CrossRef]
- Miller, D.A.; Wigley, T.B.; Miller, K.V. Managed Forests and Conservation of Terrestrial Biodiversity in the Southern United States. J. For. 2009, 107, 197–203. [Google Scholar] [CrossRef]
- Isaac, N.J.B.; Brotherton, P.N.M.; Bullock, J.M.; Gregory, R.D.; Böhning-Gaese, K.; Connor, B.; Crick, H.Q.P.; Freckleton, R.P.; Gill, J.A.; Hails, R.S.; et al. Defining and Delivering Resilient Ecological Networks: Nature Conservation in England. J. Appl. Ecol. 2018, 55, 2537–2543. [Google Scholar] [CrossRef]
- Fox, R.J.; Bellwood, D.R.; Costa, D. Herbivores in a Small World: Network Theory Highlights Vulnerability in the Function of Herbivory on Coral Reefs. Funct. Ecol. 2013, 28, 642–651. [Google Scholar] [CrossRef]
- Zhao, S.-M.; Ma, Y.-F.; Wang, J.-L.; You, X.-Y. Landscape Pattern Analysis and Ecological Network Planning of Tianjin City. Urban For. Urban Green. 2019, 46, 126479. [Google Scholar] [CrossRef]
- Hu, G.; Mu, X. Dominants in Evolution of Urban Energy Metabolism: A Case Study of Beijing. Ecol. Model. 2018, 385, 26–34. [Google Scholar] [CrossRef]
- Gutt, J.; Isla, E.; Bertler, A.N.; Bodeker, G.E.; Bracegirdle, T.J.; Cavanagh, R.D.; Comiso, J.C.; Convey, P.; Cummings, V.; De Conto, R.; et al. Cross-Disciplinarity in the Advance of Antarctic Ecosystem Research. Mar. Genom. 2018, 37, 1–17. [Google Scholar] [CrossRef] [PubMed]
- Huang, J.; Tu, Z.; Lin, J. Land-Use Dynamics and Landscape Pattern Change in a Coastal Gulf Region, Southeast China. Int. J. Sustain. Dev. World Ecol. 2009, 16, 61–66. [Google Scholar] [CrossRef]
- Lu, J.; Jiao, S.; Han, Z.; Yin, J. Promoting Ecological Restoration of Deeply Urbanized Hilly Areas: A Multi-Scale Ecological Networks Approach. Ecol. Indic. 2023, 154, 110655. [Google Scholar] [CrossRef]
- Xu, L.; Li, J.; Liu, C.; Cui, X. Research on Geomorphological Morphology and Regionalization of Hoh Xil Based on Digital Elevation Model (Dem). Acta Sci. Nat. Univ. Pekin. 2017, 53, 833–842. [Google Scholar]
- Li, L.; Li, X.; Niu, B.; Zhang, Z. A Study on the Dynamics of Landscape Patterns in the Yellow River Delta Region. Water 2023, 15, 819. [Google Scholar] [CrossRef]
- Beroya-Eitner, M.A. Ecological Vulnerability Indicators. Ecol. Indic. 2016, 60, 329–334. [Google Scholar] [CrossRef]
- Xue, Q.; Lu, L.; Niu, R.; Zhang, X.J.; Du, W.Q. Identification and Restoration of Key Areas of Ecological Security Pattern Based on Sensitivity to Geological Disasters: A Case Study of Jinan City. Acta Ecol. Sin. 2021, 41, 9050–9063. [Google Scholar]
- Rogan, J.; Wright, T.M.; Cardille, J.; Pearsall, H.; Ogneva-Himmelberger, Y.; Riemann, R.; Riitters, K.; Partington, K. Forest Fragmentation in Massachusetts, USA: A Town-Level Assessment Using Morphological Spatial Pattern Analysis and Affinity Propagation. GIScience Remote Sens. 2016, 53, 506–519. [Google Scholar] [CrossRef]
- Ostapowicz, K.; Vogt, P.; Riitters, K.H.; Kozak, J.; Estreguil, C. Impact of Scale on Morphological Spatial Pattern of Forest. Landsc. Ecol. 2008, 23, 1107–1117. [Google Scholar] [CrossRef]
- Zhou, S.; Song, Y.; Li, Y.; Wang, J.; Zhang, L. Construction of Ecological Security Pattern for Plateau Lake Based on Mspa–Mcr Model: A Case Study of Dianchi Lake Area. Sustainability 2022, 14, 14532. [Google Scholar] [CrossRef]
- Ghehi, N.K.; MalekMohammadi, B.; Jafari, H. Integrating Habitat Risk Assessment and Connectivity Analysis in Ranking Habitat Patches for Conservation in Protected Areas. J. Nat. Conserv. 2020, 56, 125867. [Google Scholar] [CrossRef]
- Qi, K.; Fan, Z.Q.; Ng, C.N.; Wang, X.R.; Xie, Y.J. Functional Analysis of Landscape Connectivity at the Landscape, Component, and Patch Levels: A Case Study of Minqing County, Fuzhou City, China. Appl. Geogr. 2017, 80, 64–77. [Google Scholar] [CrossRef]
- Saura, S.; Estreguil, C.; Mouton, C.; Rodríguez-Freire, M. Network Analysis to Assess Landscape Connectivity Trends: Application to European Forests (1990–2000). Ecol. Indic. 2011, 11, 407–416. [Google Scholar] [CrossRef]
- Jenks, G.F. The Data Model Concept in Statistical Mapping. Int. Yearb. Cartogr. 1967, 7, 186–190. [Google Scholar]
- O’Neill, R.V.; Krummel, J.R.; Gardner, R.H.; Sugihara, G.; Jackson, B.; DeAngelis, D.L.; Milne, B.T.; Turner, M.G.; Zygmunt, B.; Christensen, S.W.; et al. Indices of Landscape Pattern. Landsc. Ecol. 1988, 1, 153–162. [Google Scholar] [CrossRef]
- Schumaker, N.H. Using Landscape Indices to Predict Habitat Connectivity. Ecology 1996, 77, 1210–1225. [Google Scholar] [CrossRef]
- Saura, S.; Torné, J. Conefor Sensinode 2.2: A Software Package for Quantifying the Importance of Habitat Patches for Landscape Connectivity. Environ. Model. Softw. 2009, 24, 135–139. [Google Scholar] [CrossRef]
- Pinto, N.; Keitt, T.H. Beyond the Least-Cost Path: Evaluating Corridor Redundancy Using a Graph-Theoretic Approach. Landsc. Ecol. 2009, 24, 253–266. [Google Scholar] [CrossRef]
- Wei, H.; Zhu, H.; Chen, J.; Jiao, H.Y.; Li, P.H.; Xiong, L.Y. Construction and Optimization of Ecological Security Pattern in the Loess Plateau of China Based on the Minimum Cumulative Resistance (Mcr) Model. Remote Sens. 2022, 14, 5906. [Google Scholar] [CrossRef]
- Jiang, W.Y.; Cai, Y.L.; Tian, J.J. The Application of Minimum Cumulative Resistance Model in the Evaluation of Urban Ecological Land Use Efficiency. Arab. J. Geosci. 2019, 12, 714. [Google Scholar] [CrossRef]
- Hu, C.; Wang, Z.; Wang, Y.; Sun, D.; Zhang, J. Combining Mspa-Mcr Model to Evaluate the Ecological Network in Wuhan, China. Land 2022, 11, 213. [Google Scholar] [CrossRef]
- Pan, T.T.; Zhang, Y.; Yan, F.Q.; Su, F.Z. Collaborative Optimal Allocation of Urban Land Guide by Land Ecological Suitability: A Case Study of Guangdong-Hong Kong-Macao Greater Bay Area. Land 2023, 12, 754. [Google Scholar] [CrossRef]
- Chen, M.B.; Wei, X.; Zeng, L.; Jiang, X. Construction and Optimizition of Ecological Network of Nanchang City Based on Mspa and Mcr Model. Bull. Soil Water Conserv. 2021, 41, 139–147. [Google Scholar]
- Richter, B.; Behnisch, M. Integrated Evaluation Framework for Environmental Planning in the Context of Compact Green Cities. Ecol. Indic. 2019, 96, 38–53. [Google Scholar] [CrossRef]
- Wang, J.Y.; Zhao, W.W.; Ding, J.Y.; Liu, Y.X. Shifting Research Paradigms in Landscape Ecology: Insights from Bibliometric Analysis. Landsc. Ecol. 2025, 40, 63. [Google Scholar] [CrossRef]
- Zhang, L.; Hou, G.; Li, F. Dynamics of Landscape Pattern and Connectivity of Wetlands in Western Jilin Province, China. Environ. Dev. Sustain. 2019, 22, 2517–2528. [Google Scholar] [CrossRef]
- Soille, P.; Vogt, P. Morphological Segmentation of Binary Patterns. Pattern Recognit. Lett. 2009, 30, 456–459. [Google Scholar] [CrossRef]
- Peng, J.; Yang, Y.; Liu, Y.; Hu, Y.; Du, Y.; Meersmans, J.; Qiu, S. Linking Ecosystem Services and Circuit Theory to Identify Ecological Security Patterns. Sci. Total Environ. 2018, 644, 781–790. [Google Scholar] [CrossRef]
- Vogt, P.; Riitters, K.H.; Estreguil, C.; Kozak, J.; Wade, T.G.; Wickham, J.D. Mapping Spatial Patterns with Morphological Image Processing. Landsc. Ecol. 2007, 22, 171–177. [Google Scholar] [CrossRef]
- Shen, Z.; Wu, W.; Tian, S.; Wang, J. A Multi-Scale Analysis Framework of Different Methods Used in Establishing Ecological Networks. Landsc. Urban Plan. 2022, 228, 104579. [Google Scholar] [CrossRef]
- Wu, J.S.; Liu, H.M.; Huang, X.L.; Feng, Z. Dynamic evaluation on landscape connectivity of ecological land: A case study of Shenzhen, Guangdong Province of South China. Chin. J. Appl. Ecol. 2012, 23, 2543–2549. [Google Scholar]
- Pascual-Hortal, L.; Saura, S. Comparison and development of new graph-based landscape connectivity indices:towards the priorization of habitat patches and corridors for conservation. Landsc. Ecol. 2006, 21, 959–967. [Google Scholar] [CrossRef]
- Saura, S.; Pascual-Hortal, L. A new habitat availability index to integrate connectivity in landscape conservation planning:comparison with existing indices and application to a case study. Landsc. Urban Plan. 2007, 83, 91–103. [Google Scholar] [CrossRef]
- Zhou, X.; Hao, C.; Bao, Y.; Zhang, Q.; Wang, Q.; Wang, W.; Guo, H. Is the Urban Landscape Connected? Construction and Optimization of Urban Ecological Networks Based on Morphological Spatial Pattern Analysis. Sustainability 2023, 15, 14756. [Google Scholar] [CrossRef]
- Yin, H.; Kong, F.; Qi, Y.; Wang, H.; Zhou, Y.; Qin, Z. Developing and Optimizing Ecological Networks in Urban Agglomeration of Hunan Province, China. Acta Ecol. Sin. 2011, 31, 2863–2874. [Google Scholar]
- Gao, Y.; Liu, Y.X.; Qian, J.L.; Guo, Y.; Hu, Y.S. Improving Ecological Security Pattern Based on the Integrated Observation of Multiple Source Data: A Case Study of Wannian County, Jiangxi Province. Resour. Sci. 2020, 42, 2010–2021. [Google Scholar]
- Zhang, X.; Dong, T.; Du, H.; Liao, C.; Wang, F. Optimization of Landscape Pattern in Fujiang River Basin Based on Landscape Assessment. Acta Ecol. Sin. 2021, 41, 3940–3951. [Google Scholar]
- Chen, Y.; Luo, Z.; Qi, S.; Zhao, J.; Yuan, Y.; Li, F. Ecological Security Pattern Constructionof Nanchang City Based on Ecological Sensitivity and Ecological Network. Res. Soil Water Conserv. 2021, 28, 342–349. [Google Scholar]
- Saaty, T.L. A Scaling Method for Priorities in Hierarchical Structures. J. Math. Psychol. 1977, 15, 234–281. [Google Scholar] [CrossRef]
- Saaty, R.W. The Analytic Hierarchy Process—What It Is and How It Is Used. Math. Model. 1987, 9, 161–176. [Google Scholar] [CrossRef]
- Saaty, T.L. Decision Making with the Analytic Hierarchy Process. Int. J. Serv. Sci. 2008, 1, 83–98. [Google Scholar] [CrossRef]
- Hamed, T. Decision Making Using the Analytic Hierarchy Process (AHP); A Step by Step Approach. Int. J. Econ. Manag. Syst. 2017, hal-02557320. [Google Scholar]
- Brunelli, M. Introduction to the Analytic Hierarchy Process; Springer Briefs in Operations Research; Springer: Berlin/Heidelberg, Germany, 2015; p. 83. ISBN 978-3-319-12502-2. [Google Scholar]
- Altuzarra, A.; Moreno-Jiménez, J.M.; Salvador, M. Consensus Building in Ahp-Group Decision Making: A Bayesian Approach. Oper. Res. 2010, 58, 1755–1773. [Google Scholar] [CrossRef]
- Liu, Y.; Bi, J.; Lv, J.; Ma, Z.; Wang, C. Spatial Multi-Scale Relationships of Ecosystem Services: A Case Study Using a Geostatistical Methodology. Sci. Rep. 2017, 7, 9486. [Google Scholar] [CrossRef]
- Huang, M.Y.; Yue, W.Z.; Feng, S.R.; Cai, J.J. Analysis of spatial heterogeneity of ecological security based on MCR model and ecological pattern optimization in the Yuexi county of the Dabie Mountain Area. J. Nat. Resour. 2019, 34, 771–784. [Google Scholar] [CrossRef]
- Peng, X.; Dai, X.; Shi, R.; Zheng, Y.; Liu, X.; Xiao, Y.; Li, W.; Zhang, Y.; Wang, J.; Huang, H. Investigating the Effects of Mining on Ecosystem Services in Panzhihua City: A Multi-Scenario Analysis. Land 2024, 13, 819. [Google Scholar] [CrossRef]
- Jiao, W.; Zhang, X.; Li, C.; Guo, J. Sustainable Transition of Mining Cities in China: Literature Review and Policy Analysis. Resour. Policy 2021, 74, 101867. [Google Scholar] [CrossRef]
- Wang, H.; Chen, C. Quantifying the Contributions of Urban Spatial Morphology on the River Cold Island Effect: Taking Changsha, China, as an Example. Sustain. Cities Soc. 2025, 122, 106256. [Google Scholar] [CrossRef]
- Haddad, N.M.; Brudvig, L.A.; Clobert, J.; Davies, K.F.; Gonzalez, A.; Holt, R.D.; Lovejoy, T.E.; Sexton, J.O.; Austin, M.P.; Collins, C.D.; et al. Habitat Fragmentation and Its Lasting Impact on Earth’s Ecosystems. Sci. Adv. 2015, 1, e1500052. [Google Scholar] [CrossRef]
- Radzi, A. 2—The Ruhr Innovation Ecosystem—From Industrial Brownfields to Regenerative Smart Environments. In Intelligent Environments, 2nd ed.; Droege, P., Ed.; Elsevier: Haarlem, The Netherlands, 2023; pp. 33–85. [Google Scholar]
- Schwarze-Rodrian, M. Green Infrastructure Ruhr: Urban Regeneration through Nbs. In Nature-Based Solutions for More Sustainable Cities—A Framework Approach for Planning and Evaluation; Croci, E., Lucchitta, B., Eds.; Emerald Publishing Limited: Leeds, UK, 2021; pp. 291–300. [Google Scholar]
- Wu, Z.; Lei, S.; Yan, Q.; Bian, Z.; Lu, Q. Landscape Ecological Network Construction Controlling Surface Coal Mining Effect on Landscape Ecology: A Case Study of a Mining City in Semi-Arid Steppe. Ecol. Indic. 2021, 133, 108403. [Google Scholar] [CrossRef]
- Xu, W.; Wang, J.; Zhang, M.; Li, S. Construction of Landscape Ecological Network Based on Landscape Ecological Risk Assessment in a Large-Scale Opencast Coal Mine Area. J. Clean. Prod. 2021, 286, 125523. [Google Scholar] [CrossRef]


| No. | Types of Data | Time Range | Precision | Processing Method | Data Source |
|---|---|---|---|---|---|
| 1 | The current status of land use in Panzhihua City | 2023 | 30 m resolution | The data underwent manual visual interpretation correction, topological verification, and reclassification to ensure analytical rigor | Panzhihua City Natural Resources and Planning Bureau http://zgj.panzhihua.gov.cn/ |
| 2 | Remote sensing images of Panzhihua City | 2023 | Achieving a positional accuracy of <0.5 pixel | The data are processed with atmospheric correction and geometric registration | http://www.gscloud.cn/ |
| 3 | SRTM digital elevation products | 2023 | 30 m resolution | The data underwent void filling and projection transformation | http://www.gscloud.cn/ |
| 4 | Vegetation coverage in Panzhihua City | 2023 | MODIS NDVI 250 m resolution | The data are processed by using the Maximum Value Composition (MVC) method to generate monthly composite datasets | http://www.gscloud.cn/ |
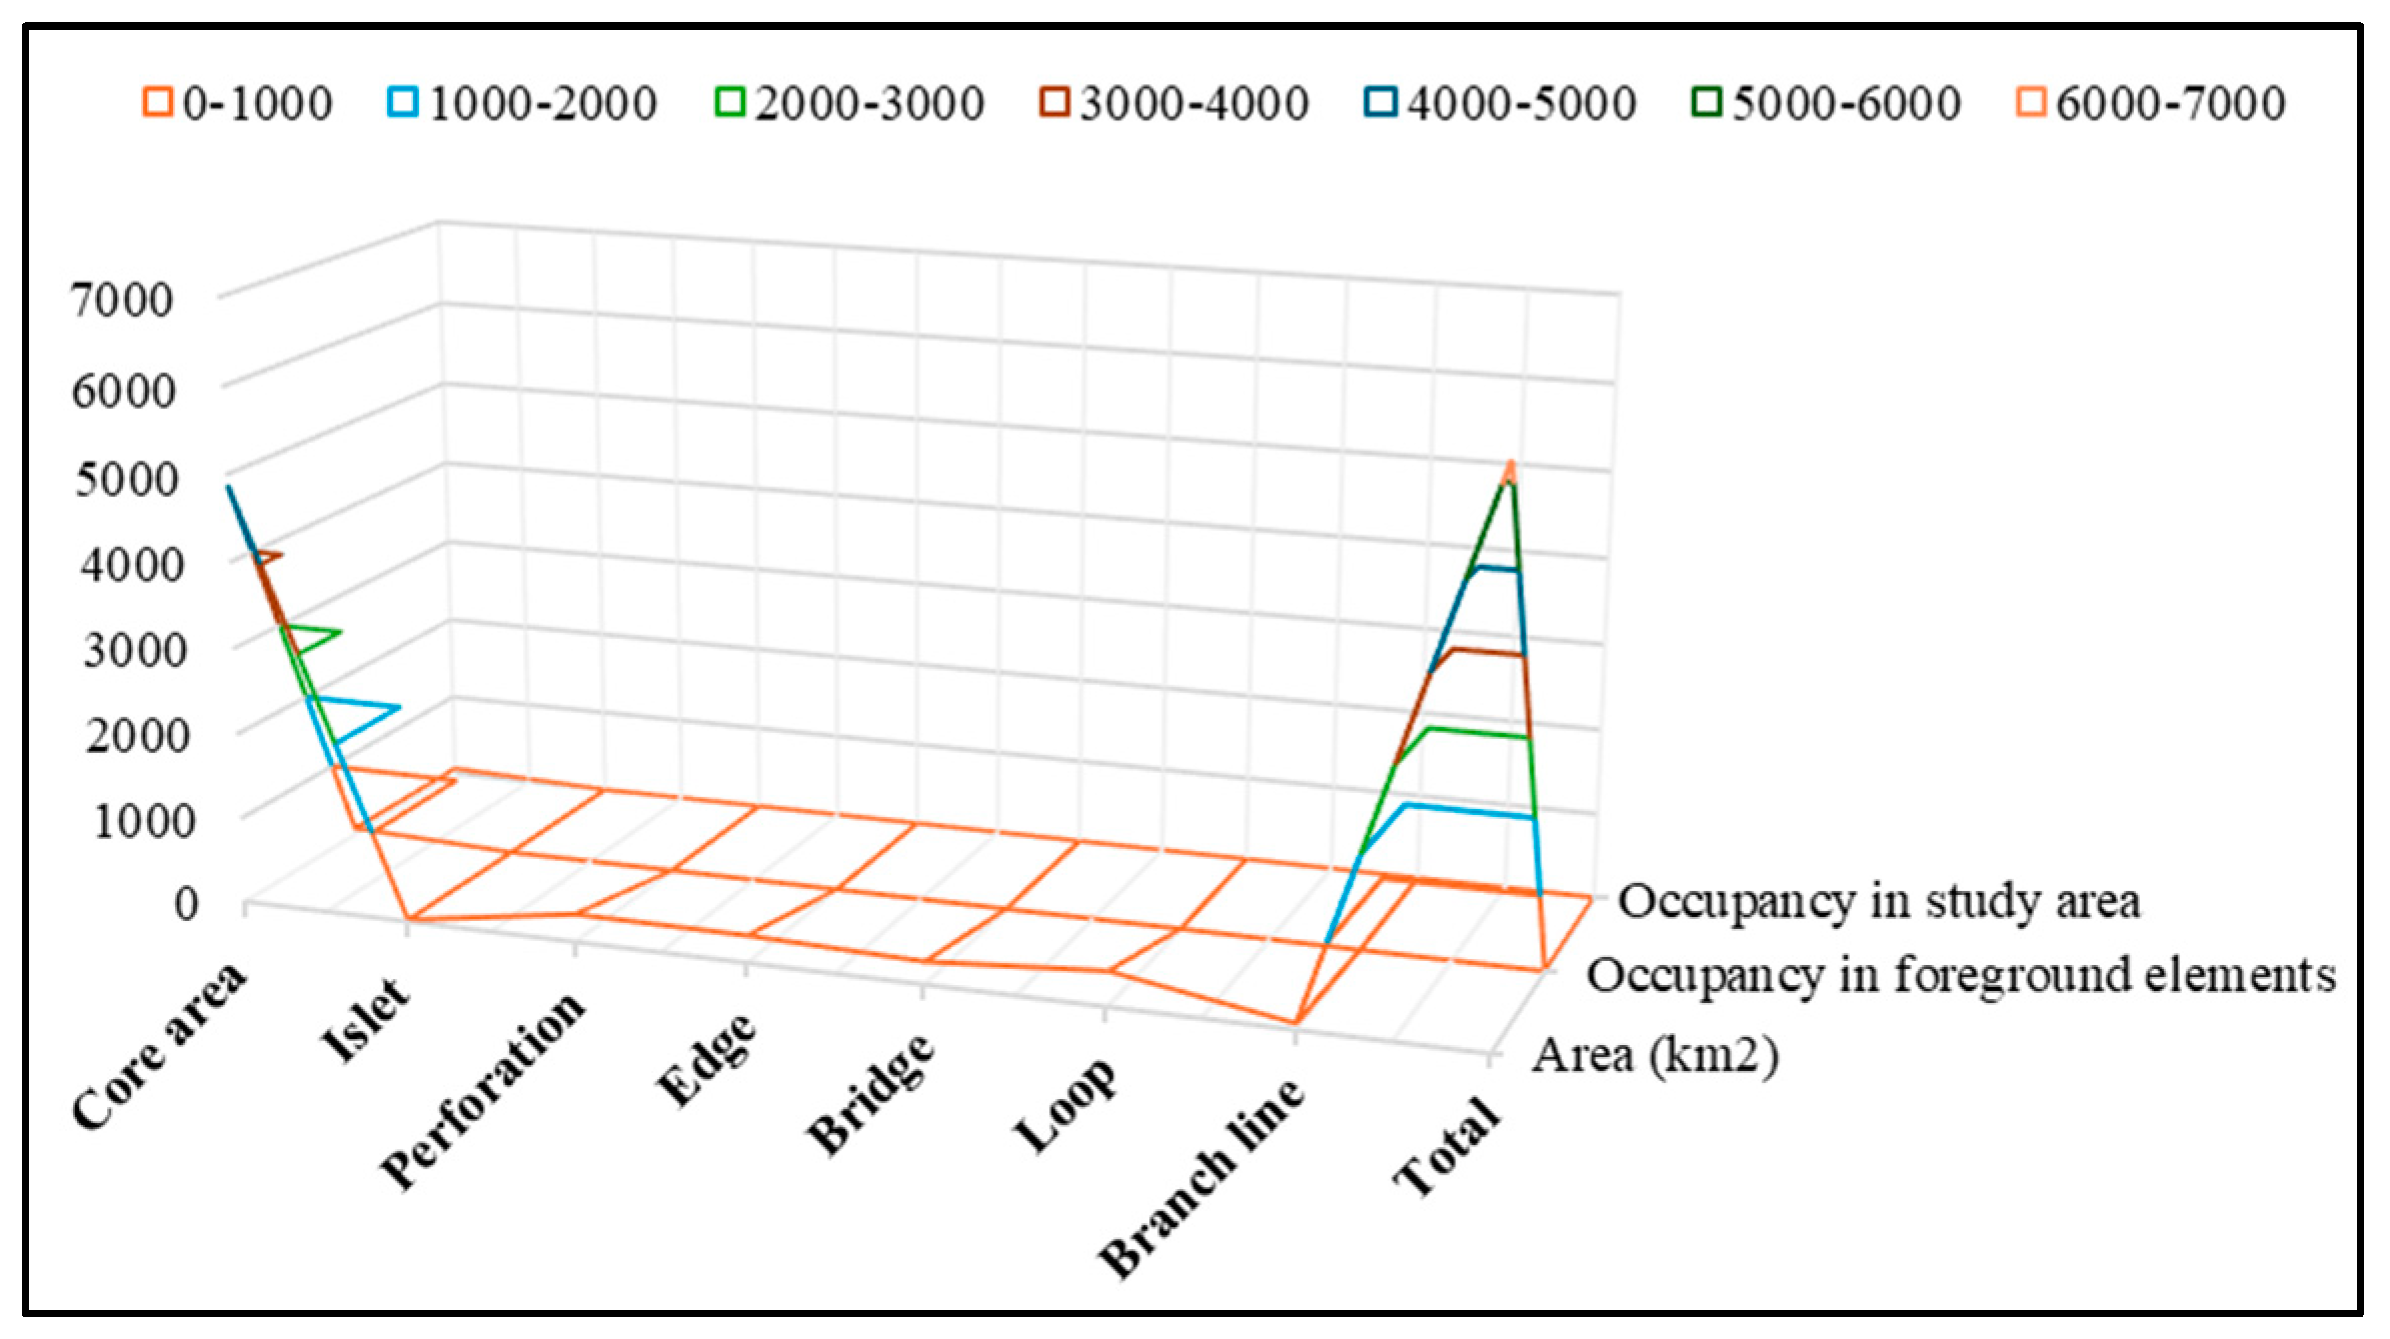
| Type | Area (km2) | Occupancy in Foreground Elements | Occupancy in Study Area |
|---|---|---|---|
| Core area | 4872.00 | 77.81% | 65.72% |
| Islet | 19.18 | 0.31% | 0.26% |
| Perforation | 322.46 | 5.15% | 4.35% |
| Edge | 315.31 | 5.04% | 4.25% |
| Bridge | 260.96 | 4.17% | 3.52% |
| Loop | 401.23 | 6.41% | 5.41% |
| Branch line | 70.42 | 1.12% | 0.95% |
| Total | 6261.56 |
| Rank | Connectivity Index (dIIC) | Probability Index of Connectivity (dPC) | Numbers |
|---|---|---|---|
| 1 | 95.49 | 95.20 | 17 |
| 2 | 17.13 | 22.02 | 29 |
| 3 | 6.68 | 9.07 | 26 |
| 4 | 3.36 | 5.67 | 7 |
| 5 | 1.70 | 4.25 | 14 |
| 6 | 1.87 | 3.04 | 15 |
| 7 | 0.45 | 0.67 | 20 |
| 8 | 0.39 | 0.66 | 24 |
| 9 | 0.32 | 0.48 | 8 |
| 10 | 0.16 | 0.25 | 23 |
| 11 | 0.15 | 0.23 | 4 |
| 12 | 0.12 | 0.21 | 2 |
| 13 | 0.09 | 0.15 | 28 |
| 14 | 0.09 | 0.15 | 13 |
| 15 | 0.09 | 0.14 | 6 |
| 16 | 0.08 | 0.14 | 11 |
| 17 | 0.07 | 0.13 | 16 |
| 18 | 0.069 | 0.11 | 5 |
| Scale | 1 | 3 | 5 | 7 | 9 | 2, 4, 6, 8 |
|---|---|---|---|---|---|---|
| Meaning | Equal | Moderate | Strong | Very strong | Extremely strong | The median value of the adjacent scale |
| Factors | Land Use | Elevation | Slope | NDVI | Distance from Water |
|---|---|---|---|---|---|
| Land use | 1 | 5 | 6 | 2 | 3 |
| Elevation | 1/5 | 1 | 2 | ¼ | 1/2 |
| Slope | 1/6 | 1/2 | 1 | 1/5 | 1/3 |
| NDVI | 1/2 | 4 | 5 | 1 | 2 |
| Distance from water | 1/3 | 2 | 3 | 1/2 | 1 |
| NDVI | |||||||
| Original value | −0.26–0.11 | 0.11–0.24 | 0.24–0.33 | 0.33–0.39 | 0.39–1.00 | ||
| Reclassified value | 100.00 | 70.00 | 50.00 | 20.00 | 1.00 | ||
| Land use | |||||||
| Original value | Water area | Forest land | Wetland | Grassland | Cultivated land | Construction land | Unused land |
| 4.00 | 2.00 | 5.00 | 3.00 | 1.00 | 6.00 | 7.00 | |
| Reclassified value | 1.00 | 1.00 | 5.00 | 5.00 | 40.00 | 60.00 | 100.00 |
| Elevation | |||||||
| Original value | 838.00–1439.00 | 1439.00–1803.00 | 1803.00–2192.00 | 2192.00–2680.00 | 2680.00–4143.00 | ||
| Reclassified value | 1.00 | 20.00 | 50.00 | 70.00 | 100.00 | ||
| Slope | |||||||
| Original value | 0.00– 11.33 | 11.33– 19.66 | 19.66– 27.65 | 27.65– 36.98 | 36.98– 84.96 | ||
| Reclassified value | 1.00 | 10.00 | 50.00 | 70.00 | 100.00 | ||
| Distance from water | |||||||
| Original value | 0.00– 7212.93 | 7212.93– 16,006.42 | 16,006.42– 26,175.90 | 26,175.90– 38,959.54 | 38,959.54– 62,381.30 | ||
| Reclassified value | 1.00 | 20.00 | 50.00 | 70.00 | 100.00 | ||
| 1 | 2 | 3 | 4 | 5 | 6 | 7 | 8 | 9 | 10 | 11 | 12 | 13 | 14 | 15 | 16 | 17 | 18 | |
|---|---|---|---|---|---|---|---|---|---|---|---|---|---|---|---|---|---|---|
| 1 | 98.07 | 94.76 | 3.07 | 2.70 | 2.76 | 29.50 | 10.25 | 9.63 | 5.03 | 4.11 | 3.36 | 5.73 | 2.53 | 4.72 | 4.62 | 1.17 | 1.66 | |
| 2 | 57.03 | 4.07 | 3.50 | 3.49 | 67.04 | 18.91 | 15.56 | 7.25 | 5.55 | 4.34 | 8.34 | 3.25 | 6.48 | 6.30 | 1.49 | 2.00 | ||
| 3 | 1.76 | 219.20 | 63.13 | 5.20 | 2.16 | 3.99 | 9.57 | 20.22 | 13.34 | 4.79 | 7.04 | 3.32 | 4.37 | 1.27 | 1.73 | |||
| 4 | 1.67 | 128.20 | 4.72 | 2.01 | 3.57 | 10.15 | 23.68 | 15.26 | 4.62 | 7.76 | 3.03 | 4.72 | 1.37 | 1.86 | ||||
| 5 | 1.79 | 19.60 | 9.31 | 5.55 | 3.08 | 2.60 | 2.18 | 3.48 | 1.65 | 2.96 | 2.91 | 0.77 | 1.12 | |||||
| 6 | 4.70 | 2.06 | 3.47 | 7.75 | 15.20 | 11.34 | 4.16 | 6.36 | 3.03 | 4.33 | 1.33 | 1.92 | ||||||
| 7 | 189.40 | 37.02 | 11.01 | 8.15 | 6.24 | 13.19 | 4.65 | 10.75 | 9.58 | 2.17 | 2.83 | |||||||
| 8 | 10.51 | 9.75 | 5.93 | 4.35 | 27.53 | 3.50 | 19.47 | 14.19 | 2.58 | 2.57 | ||||||||
| 9 | 4.52 | 3.64 | 2.96 | 5.31 | 2.22 | 4.61 | 4.20 | 1.05 | 1.46 | |||||||||
| 10 | 40.99 | 101.40 | 11.24 | 44.73 | 5.16 | 11.10 | 2.72 | 3.13 | ||||||||||
| 11 | 20.40 | 7.36 | 119.50 | 5.27 | 11.13 | 2.87 | 3.51 | |||||||||||
| 12 | 44.03 | 15.71 | 12.75 | 27.13 | 4.10 | 4.43 | ||||||||||||
| 13 | 8.26 | 32.47 | 121.40 | 6.76 | 5.01 | |||||||||||||
| 14 | 5.63 | 49.44 | 10.16 | 5.71 | ||||||||||||||
| 15 | 14.83 | 18.12 | 8.79 | |||||||||||||||
| 16 | 3.71 | 4.46 | ||||||||||||||||
| 17 | 10.47 | |||||||||||||||||
| 18 |
Disclaimer/Publisher’s Note: The statements, opinions and data contained in all publications are solely those of the individual author(s) and contributor(s) and not of MDPI and/or the editor(s). MDPI and/or the editor(s) disclaim responsibility for any injury to people or property resulting from any ideas, methods, instructions or products referred to in the content. |
© 2025 by the authors. Licensee MDPI, Basel, Switzerland. This article is an open access article distributed under the terms and conditions of the Creative Commons Attribution (CC BY) license (https://creativecommons.org/licenses/by/4.0/).
Share and Cite
Zeng, L.; Li, R.Y.M.; Du, H. Modeling the Ecological Network in Mountainous Resource-Based Cities: Morphological Spatial Pattern Analysis Approach. Buildings 2025, 15, 1388. https://doi.org/10.3390/buildings15081388
Zeng L, Li RYM, Du H. Modeling the Ecological Network in Mountainous Resource-Based Cities: Morphological Spatial Pattern Analysis Approach. Buildings. 2025; 15(8):1388. https://doi.org/10.3390/buildings15081388
Chicago/Turabian StyleZeng, Liyun, Rita Yi Man Li, and Hongzhou Du. 2025. "Modeling the Ecological Network in Mountainous Resource-Based Cities: Morphological Spatial Pattern Analysis Approach" Buildings 15, no. 8: 1388. https://doi.org/10.3390/buildings15081388
APA StyleZeng, L., Li, R. Y. M., & Du, H. (2025). Modeling the Ecological Network in Mountainous Resource-Based Cities: Morphological Spatial Pattern Analysis Approach. Buildings, 15(8), 1388. https://doi.org/10.3390/buildings15081388