Article

Field Pumping and Recharge Test Study for Confined Aquifers in Super-Large Deep Foundation Pit Group Sites

1
Department of Geotechnical Engineering, Tongji University, Shanghai 200092, China
2
East China Architecture Design & Research Institute Co., Ltd., Shanghai 200011, China
3
Shanghai Engineering Research Center of Safety Control for Facilities Adjacent to Deep Excavations, Shanghai 200011, China
*
Author to whom correspondence should be addressed.
Buildings 2025, 15(8), 1383; https://doi.org/10.3390/buildings15081383
Submission received: 26 March 2025 / Revised: 7 April 2025 / Accepted: 8 April 2025 / Published: 21 April 2025

Abstract

:
To ensure the stability of deep foundation pits in confined aquifers, dewatering is often required. However, pumping from confined aquifers in large deep foundation pit groups may lead to significant environmental deformations. Therefore, field pumping and recharge tests are required to guide design of groundwater and environmental deformation control scheme. Focusing on a super-large deep foundation pit group in Shanghai, single-well pumping, multi-well pumping, and recharge tests were conducted in distinct geological zones (normally consolidated area and paleochannel zone). The hydraulic connectivity and spatiotemporal patterns of groundwater drawdown and soil settlement were systematically analyzed. The results show that: (1) There exists a certain hydraulic connection between the first and second confined aquifers. In the paleochannel area, the aquitard between the micro-confined and the first confined aquifer is insufficient to completely block hydraulic connectivity. (2) The ratio of ground surface settlement to groundwater drawdown is about 3.4 mm/m, and the deep soil settlement is significantly or even greater than the surface settlement, so it is necessary to strengthen the monitoring of deep settlement. (3) Recharge can elevate the groundwater and reduce settlement; however, it is difficult to eliminate the variation in settlement along the vertical direction.

1. Introduction

With the deepening development of urban underground space, foundation pit engineering has demonstrated the characteristics of large-scale and significant excavation depth [1,2,3,4,5]. Particularly in projects involving large transportation hubs and metro transfer stations, multiple interconnected foundation pits form super-large deep foundation pit groups [6,7]. Due to the substantial excavation depth, confined aquifer dewatering is frequently required during excavation to prevent inrush failure [3,8,9,10,11,12]. When the confined aquifer is sufficiently thick, suspended waterproof curtains are commonly employed for economic reasons [4,13,14,15]. During pumping inside the pit, the external groundwater may also drop significantly, substantially altering the effective stress field of soil, leading to soil settlement that may damage adjacent underground structures [16,17,18]. Therefore, recharge wells are typically installed near protected structures to mitigate environmental deformation by reducing drawdown through artificial recharge [19,20,21,22]. For super-large deep foundation pit groups, the hydrogeological conditions are extremely complex and the environmental effects caused by construction are pronounced. Hence, it is necessary to carry out pumping and recharge tests in confined aquifers prior to construction. These tests aim to elucidate the spatiotemporal evolution of groundwater variations and soil deformation, thereby guiding subsequent engineering design and risk management.
Current research on pumping and recharge technologies predominantly focuses on single foundation pits or small-scale pit groups [23,24], with limited field measurement data available for super-large deep foundation pit groups. Most existing tests were conducted during the construction phases where groundwater seepage and soil deformation were inevitably influenced by the retaining structures. For instance, Zeng et al. [25] conducted numerical simulations to analyze the ground settlement caused by pumping in a single foundation pit, revealing the combined effects of groundwater changes and retaining wall deformation on the soil outside the pit. Zhang et al. [17] validated the feasibility of deep aquifer recharge through field pumping–recharge tests while observing interference between external recharge and internal dewatering efficiency. Xu et al. [26] investigated the interaction between retaining wall and pumping wells through physical modeling and numerical simulation, identifying the critical influence of curtain embedment depth and well screen length on groundwater variation and surface settlement. Wang et al. [27] combined field experiments with numerical simulations to discuss non-Darcy flow patterns under different curtain-well configurations, proposing optimization strategies through coupled effect control.
The existing research has two main limitations: Firstly, constrained by small-scale projects, most tests have been confined to single geological units without a comparative analysis of complex stratigraphic combinations. Secondly, retaining structures indirectly distort the correlation between drawdown and settlement through stress redistribution, leading to the potential misinterpretation of settlement mechanisms. Addressing these deficiencies, this study conducted field pumping–recharge tests during the investigation phase of a super-large deep foundation pit group project, prior to retaining structure construction. This approach enables the clearer observation of drawdown–settlement relationships by eliminating structural interference. The test area included two typical geological conditions: normally consolidated zones and paleochannel zones. Through a comparative analysis, this research reveals differential settlement characteristics under various stratigraphic conditions, providing both a theoretical basis and practical guidance for subsequent pumping–recharge system designs. Furthermore, it enriches the field measurement database for super-large deep foundation pit groups, laying a foundation for further research.

2. Project Background

2.1. Project Overview

The project was located in the planned T3 terminal area of Shanghai Pudong International Airport, covering approximately 936,300 square meters. The proposed site was divided into several pits, with a total area of about 350,000 square meters, which were designated as four pit groups (Group A to Group D) according to the construction sequence. And the planned excavation depth ranged from 12.7 m to 36.9 m, making it a super-large deep foundation pit groups, as shown in Figure 1. For simplicity, the diagram only illustrates the divided pit areas without displaying the sub-pits within each region. Based on the distribution of micro-confined aquifers and the first confined aquifer, the site can be divided into two typical zones: the normally consolidated zone (located in the north) and the paleochannel zone (located in the south).

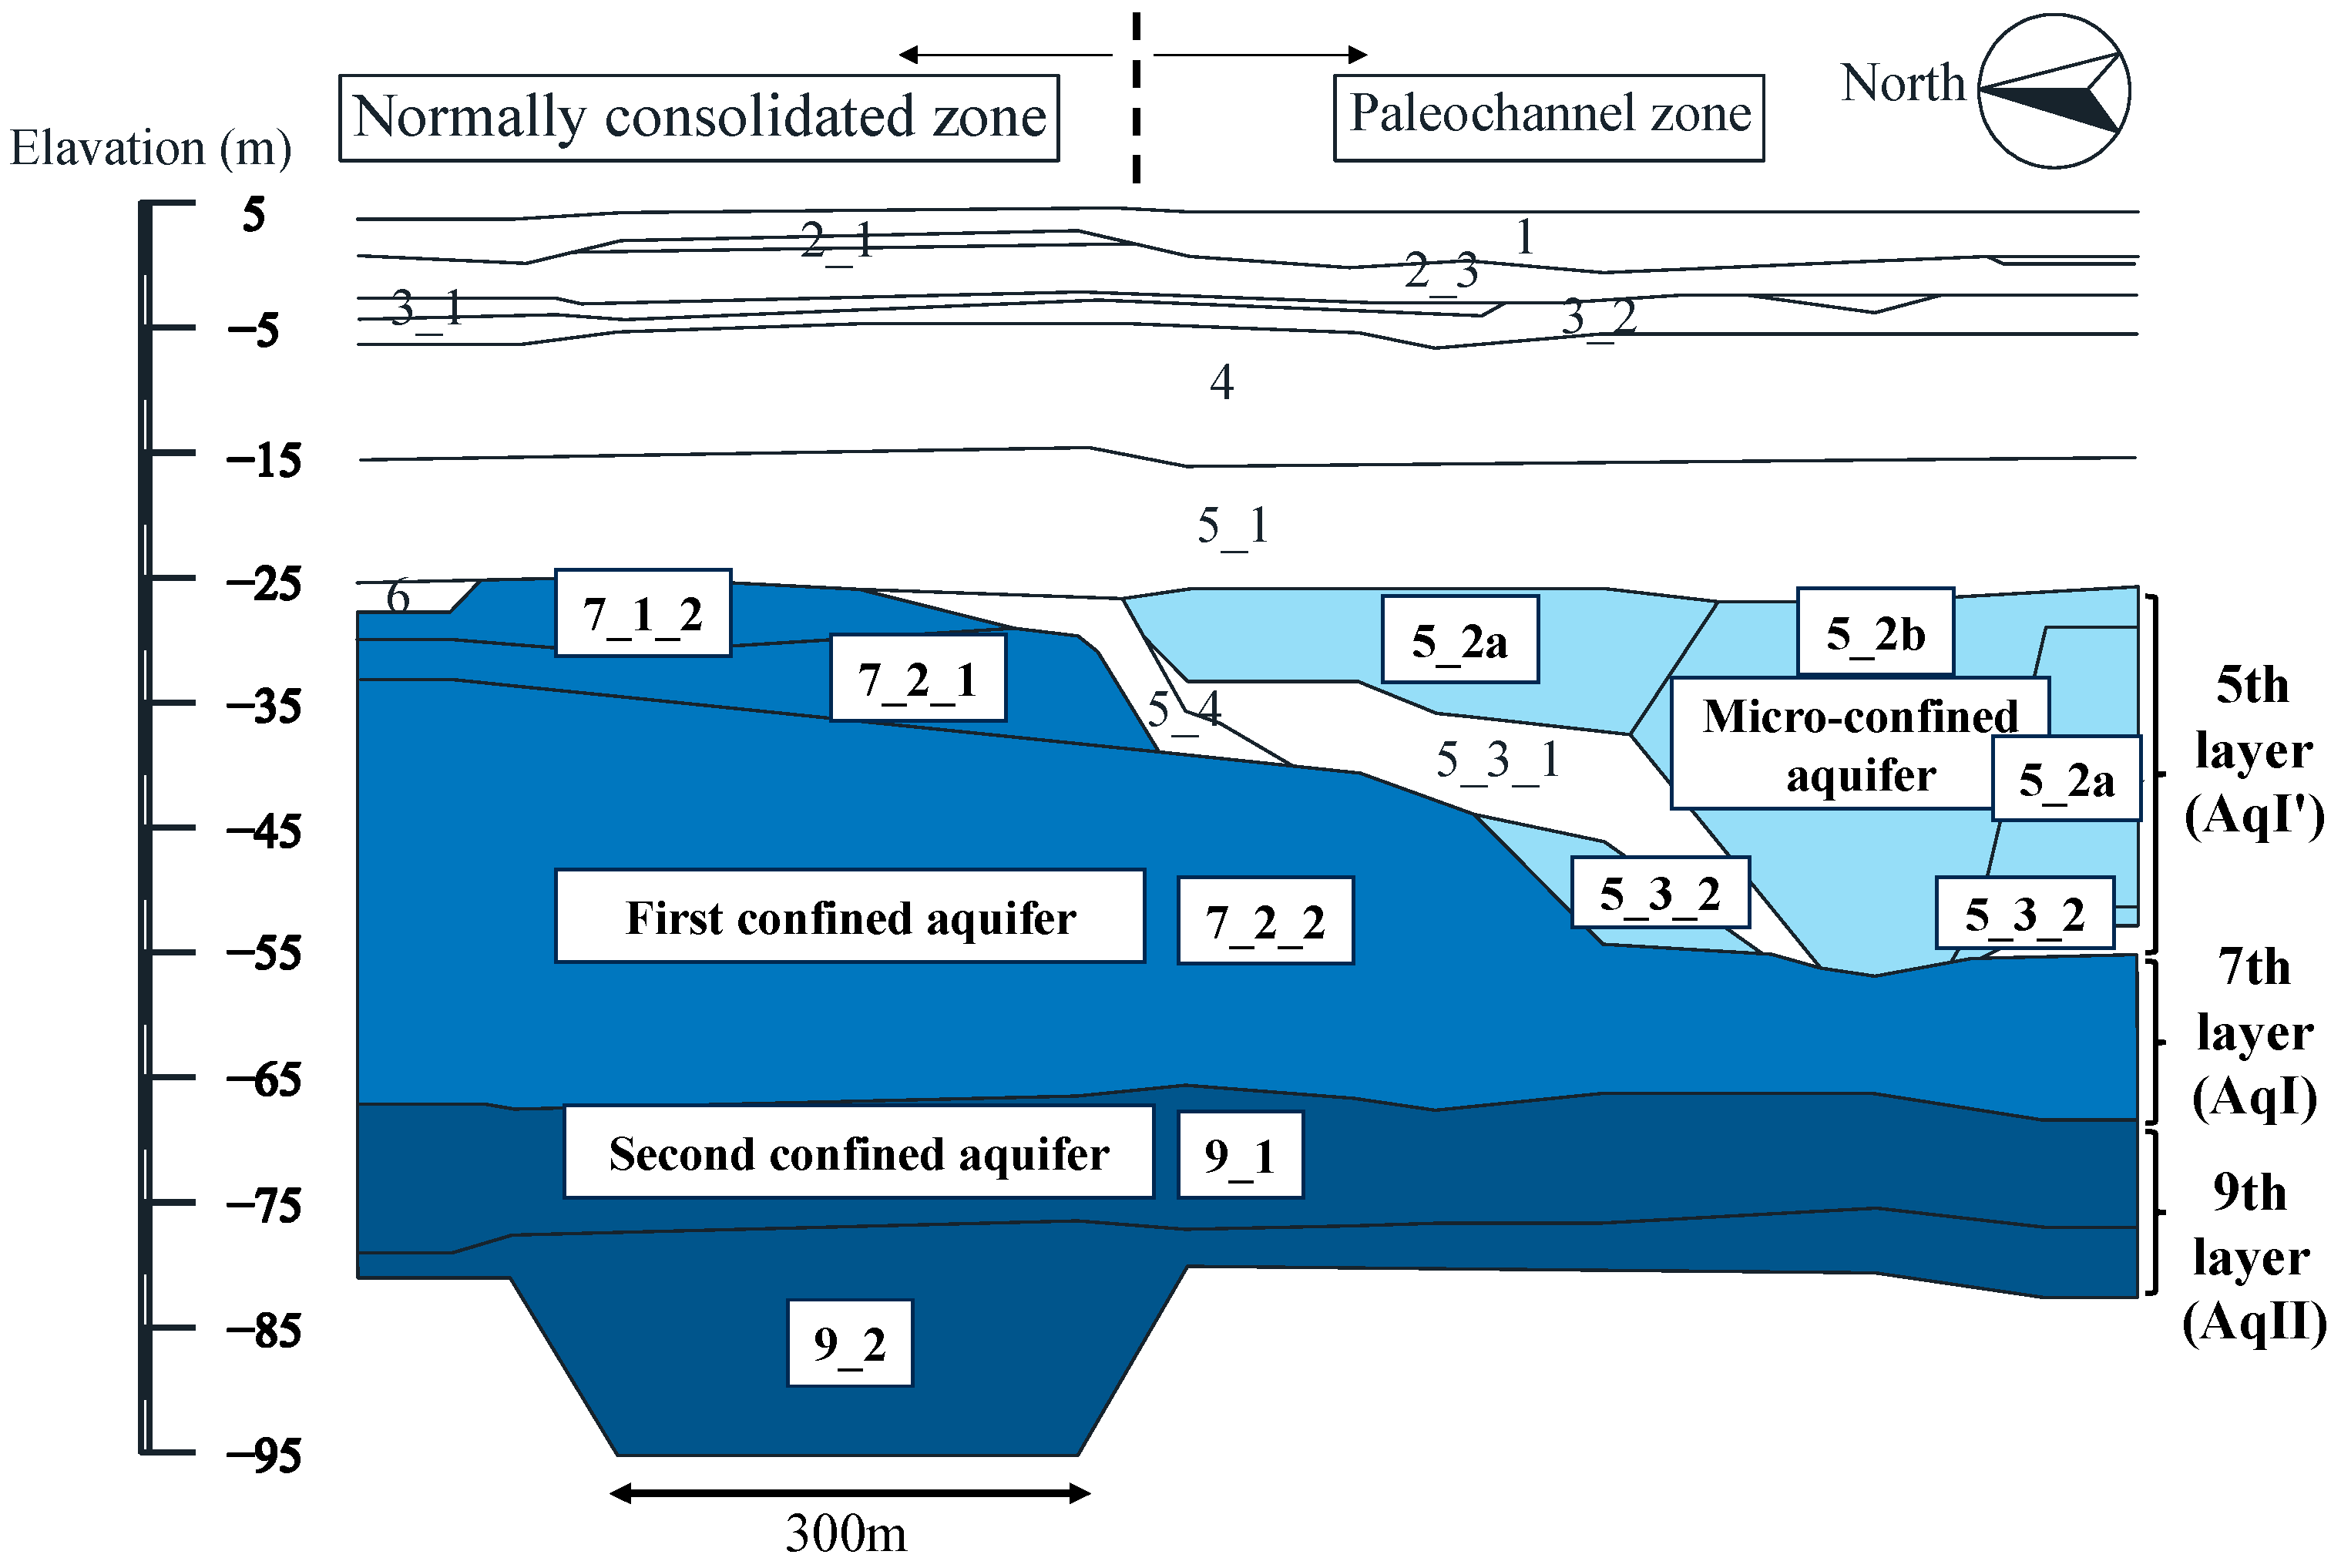
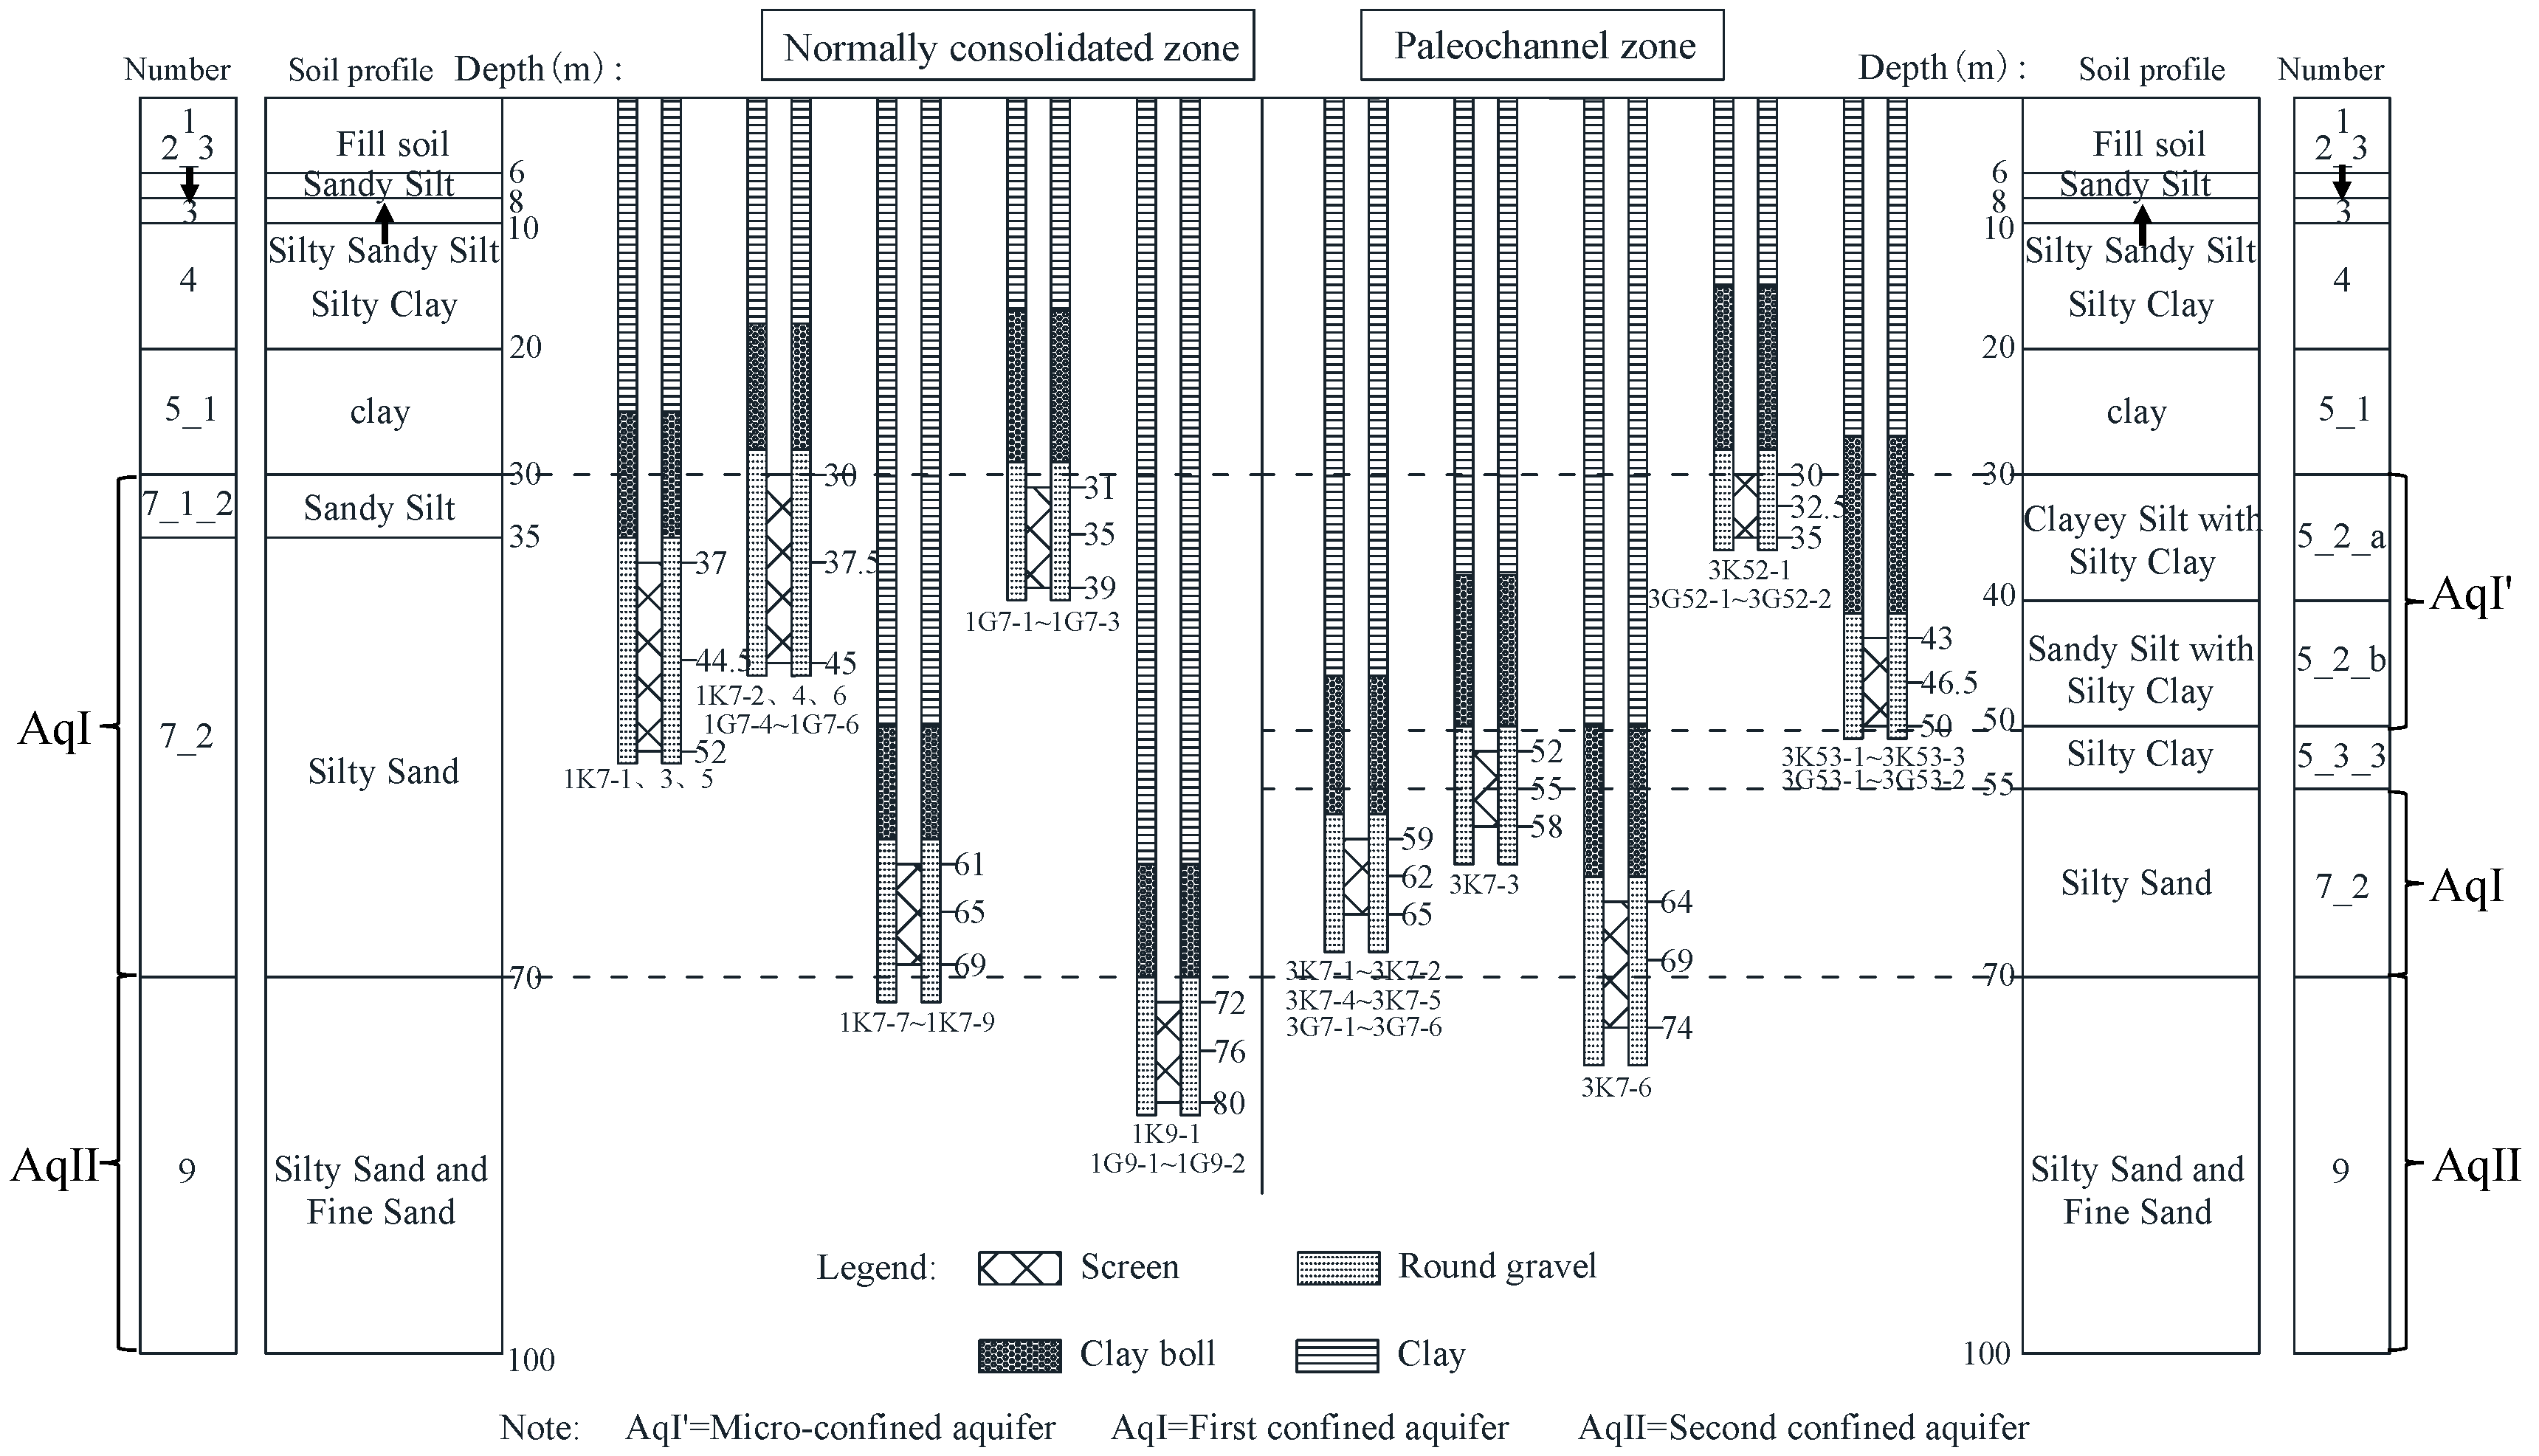
2.2. Hydrogeological Conditions

Figure 2 shows the typical geological profile for the pumping and recharge test area. It should be noted that, due to the large extent and complex stratigraphy of the overall site, additional layers, such as layers 6 and 8, were present outside the designated test area. Within the exploration depth, the groundwater types mainly included phreatic aquifer in the shallow soil layers, micro-confined aquifer in the middle silty layers, and confined aquifer in the deep sandy layers. The micro-confined aquifer (AqI′) was located in the 5th layer, distributed in the paleochannel zone, with significant fluctuations and a lens-shaped distribution. The confined aquifer was located in the 7th layer (AqI) and the 9th layer (AqII) of the sand layers, corresponding to the unified first and second confined aquifers in Shanghai. In the normally consolidated zone, the top of the 7th layer is generally buried at a depth of less than 35 m. In contrast, in the paleochannel zone, the 7th layer is found at a much greater depth, with the 5th layer micro-confined aquifer present at its top.
During the geotechnical investigation, the groundwater depth of the unconfined water was measured to be approximately 0.1–5.6 m, while the groundwater depth of the micro-confined aquifer and confined aquifer was approximately 4–8 m. Based on the planned excavation depth of the foundation pit and the aquifer water table depths, a preliminary stability calculation against inrush failure was performed. Figure 1 illustrates the planned dewatering depths for the pressurized aquifers in the core area of the project (Group A and Group B), with the maximum groundwater drawdown in Group A reaching up to 30 m.
To further investigate the hydraulic connection among aquifers, analyze the groundwater flow and soil deformation patterns, and obtain hydrogeological parameters of the confined aquifer, providing parameter references and recommendations for subsequent design and construction, field pumping and recharge tests were carried out.

3. Field Pumping and Recharge Test

To ensure that the pumping test results can provide targeted guidance for subsequent engineering designs while avoiding adverse impacts on the existing structures, the test zones were arranged in accordance with the following principles: Firstly, they were situated within the densely planned excavation zones. Secondly, they were positioned as far as possible from existing roads and underground structures. Based on these principles, four test areas were selected. Among them, the S1 test area was located in the normally consolidated zone, while the S2 to S4 test areas were situated in the paleochannel zone. Given that only single-well pumping tests were conducted in the S2 and S4 test areas, whereas both multi-well pumping and pumping–recharge tests were conducted in zones S1 and S3, this paper focused on the presentation and analysis of the test results from S1 and S3 in subsequent sections.

3.1. Test Well and Monitoring Point

Figure 3 displays the arrangement of ground surface settlement monitoring points, while Figure 4 illustrates the layout of the test wells and deep ground settlement monitoring points. Both the S1 test site (Figure 4a) and the S3 test site (Figure 4b) are equipped with eight ground surface settlement cross-section monitoring points along the ground surface, as well as six deep ground settlement monitoring points arranged in the central area of the test wells, to comprehensively assess the ground settlement in the project area. The specific arrangements of test wells were as follows: The S1 test site was situated in the normally consolidated zone, with the pumping tests targeting the 7th layer (first confined aquifer) and the 9th layer (second confined aquifer). In the 7th layer, nine pumping wells (labeled 1K7-1 to 1K7-9) were installed, among which wells 1K7-7 to 1K7-9 were used for deep pumping in this layer. Additionally, six observation wells (1G7-1 to 1G7-6) were deployed. In the 9th layer, one pumping well (1K9-1) and two observation wells (1G9-1 and 1G9-2) were established. The S3 test site was located in the paleochannel zone, and the target layers for the pumping tests were the 5th layer (the micro-confined aquifer, mainly comprising layers 5_2a and 5_2b) and the 7th layer. Specifically, in the 5_2a layer, one pumping well (3K52-1) and two observation wells (3G52-1 to 3G52-2) were installed. In the 5_2b layer, three pumping wells (3K53-1 to 3K53-3) and two observation wells (3G53-1 to 3G53-2) were arranged. In the 7th layer, six pumping wells (3K7-1 to 3K7-6) and six observation wells (3G7-1 to 3G7-6) were deployed. Figure 5 displays the depths of the test wells and the positions of the filter pipes. It should be noted that, since the soil layers are not perfectly horizontal, the layers shown in the figure displays representative stratigraphy after layered simplification. Furthermore, as the test wells were arranged following undulating stratigraphy, wells with similar depths might actually vary from 1 to 3 m. In the figure, such wells with similar depths are grouped together, and their depths are averaged.

3.2. Test Scheme

The details of the pumping test conditions are provided in Table 1. Each test was conducted independently with no overlapping test periods. In the S1 test area, single-well pumping tests and multi-well pumping tests were carried out sequentially. For the single-well pumping tests, the pumping duration was uniformly 1.5 days. Test wells 1G7-1, 1K7-5, 1K7-8, and 1K9-1 were used to pump from the upper part of the 7th aquifer, the mid-upper part of the 7th aquifer, the deep part of the 7th aquifer, and the 9th aquifer, respectively, each followed by a 1.5-day recovery period. Test wells 1K7-1 to 1K7-6 were used for a group pumping test of the upper and middle parts of the 7th aquifer, lasting 9 days, followed by a 7-day recovery period. In the S3 test area, single-well pumping tests were performed using wells 3K52-1, 3K53-1, and 3K7-2 for 2.2 days, 3.2 days, and 1 day, respectively, with corresponding recovery periods of 2.8 days, 2.8 days, and 2 days. A 10-day group pumping test was conducted using wells 3K7-1 to 3K7-6, followed by 7 days of recovery.
Following these tests, the hydraulic connectivity between aquifers and the relationship between groundwater drawdown and soil ground settlement in different zones were fundamentally understood. To better guide recharge design during formal construction, pumping–recharge tests were conducted, as shown in Table 2. Pumping was performed according to the proposed dewatering depths specified in Section 2, resulting in approximately 30 m drawdown in the normally consolidated zone and 15 m drawdown in the paleochannel zone after 1 day of pumping. Recharge wells were then activated for simultaneous pumping and recharge operations lasting 1 day. The water level had stabilized both prior to recharge initiation and before well closure. In the S1 test area, the pumping wells were 1K7-1 and 1K7-3, and the recharge wells were 1K7-4 to 1K7-6, with recharge rates of 1080 m3/d, 696 m3/d, and 552 m3/d, respectively. The filter pipes for both the pumping and recharge wells were installed at depths ranging from 30 to 52 m. In the S3 test area, the pumping well was 3K7-1, and the recharge wells were 3K7-3 to 3K7-5, with recharge rates of 260 m3/d, 186 m3/d, and 156 m3/d, respectively. The filter pipes for these wells were installed at depths ranging from 52 m to 65 m.

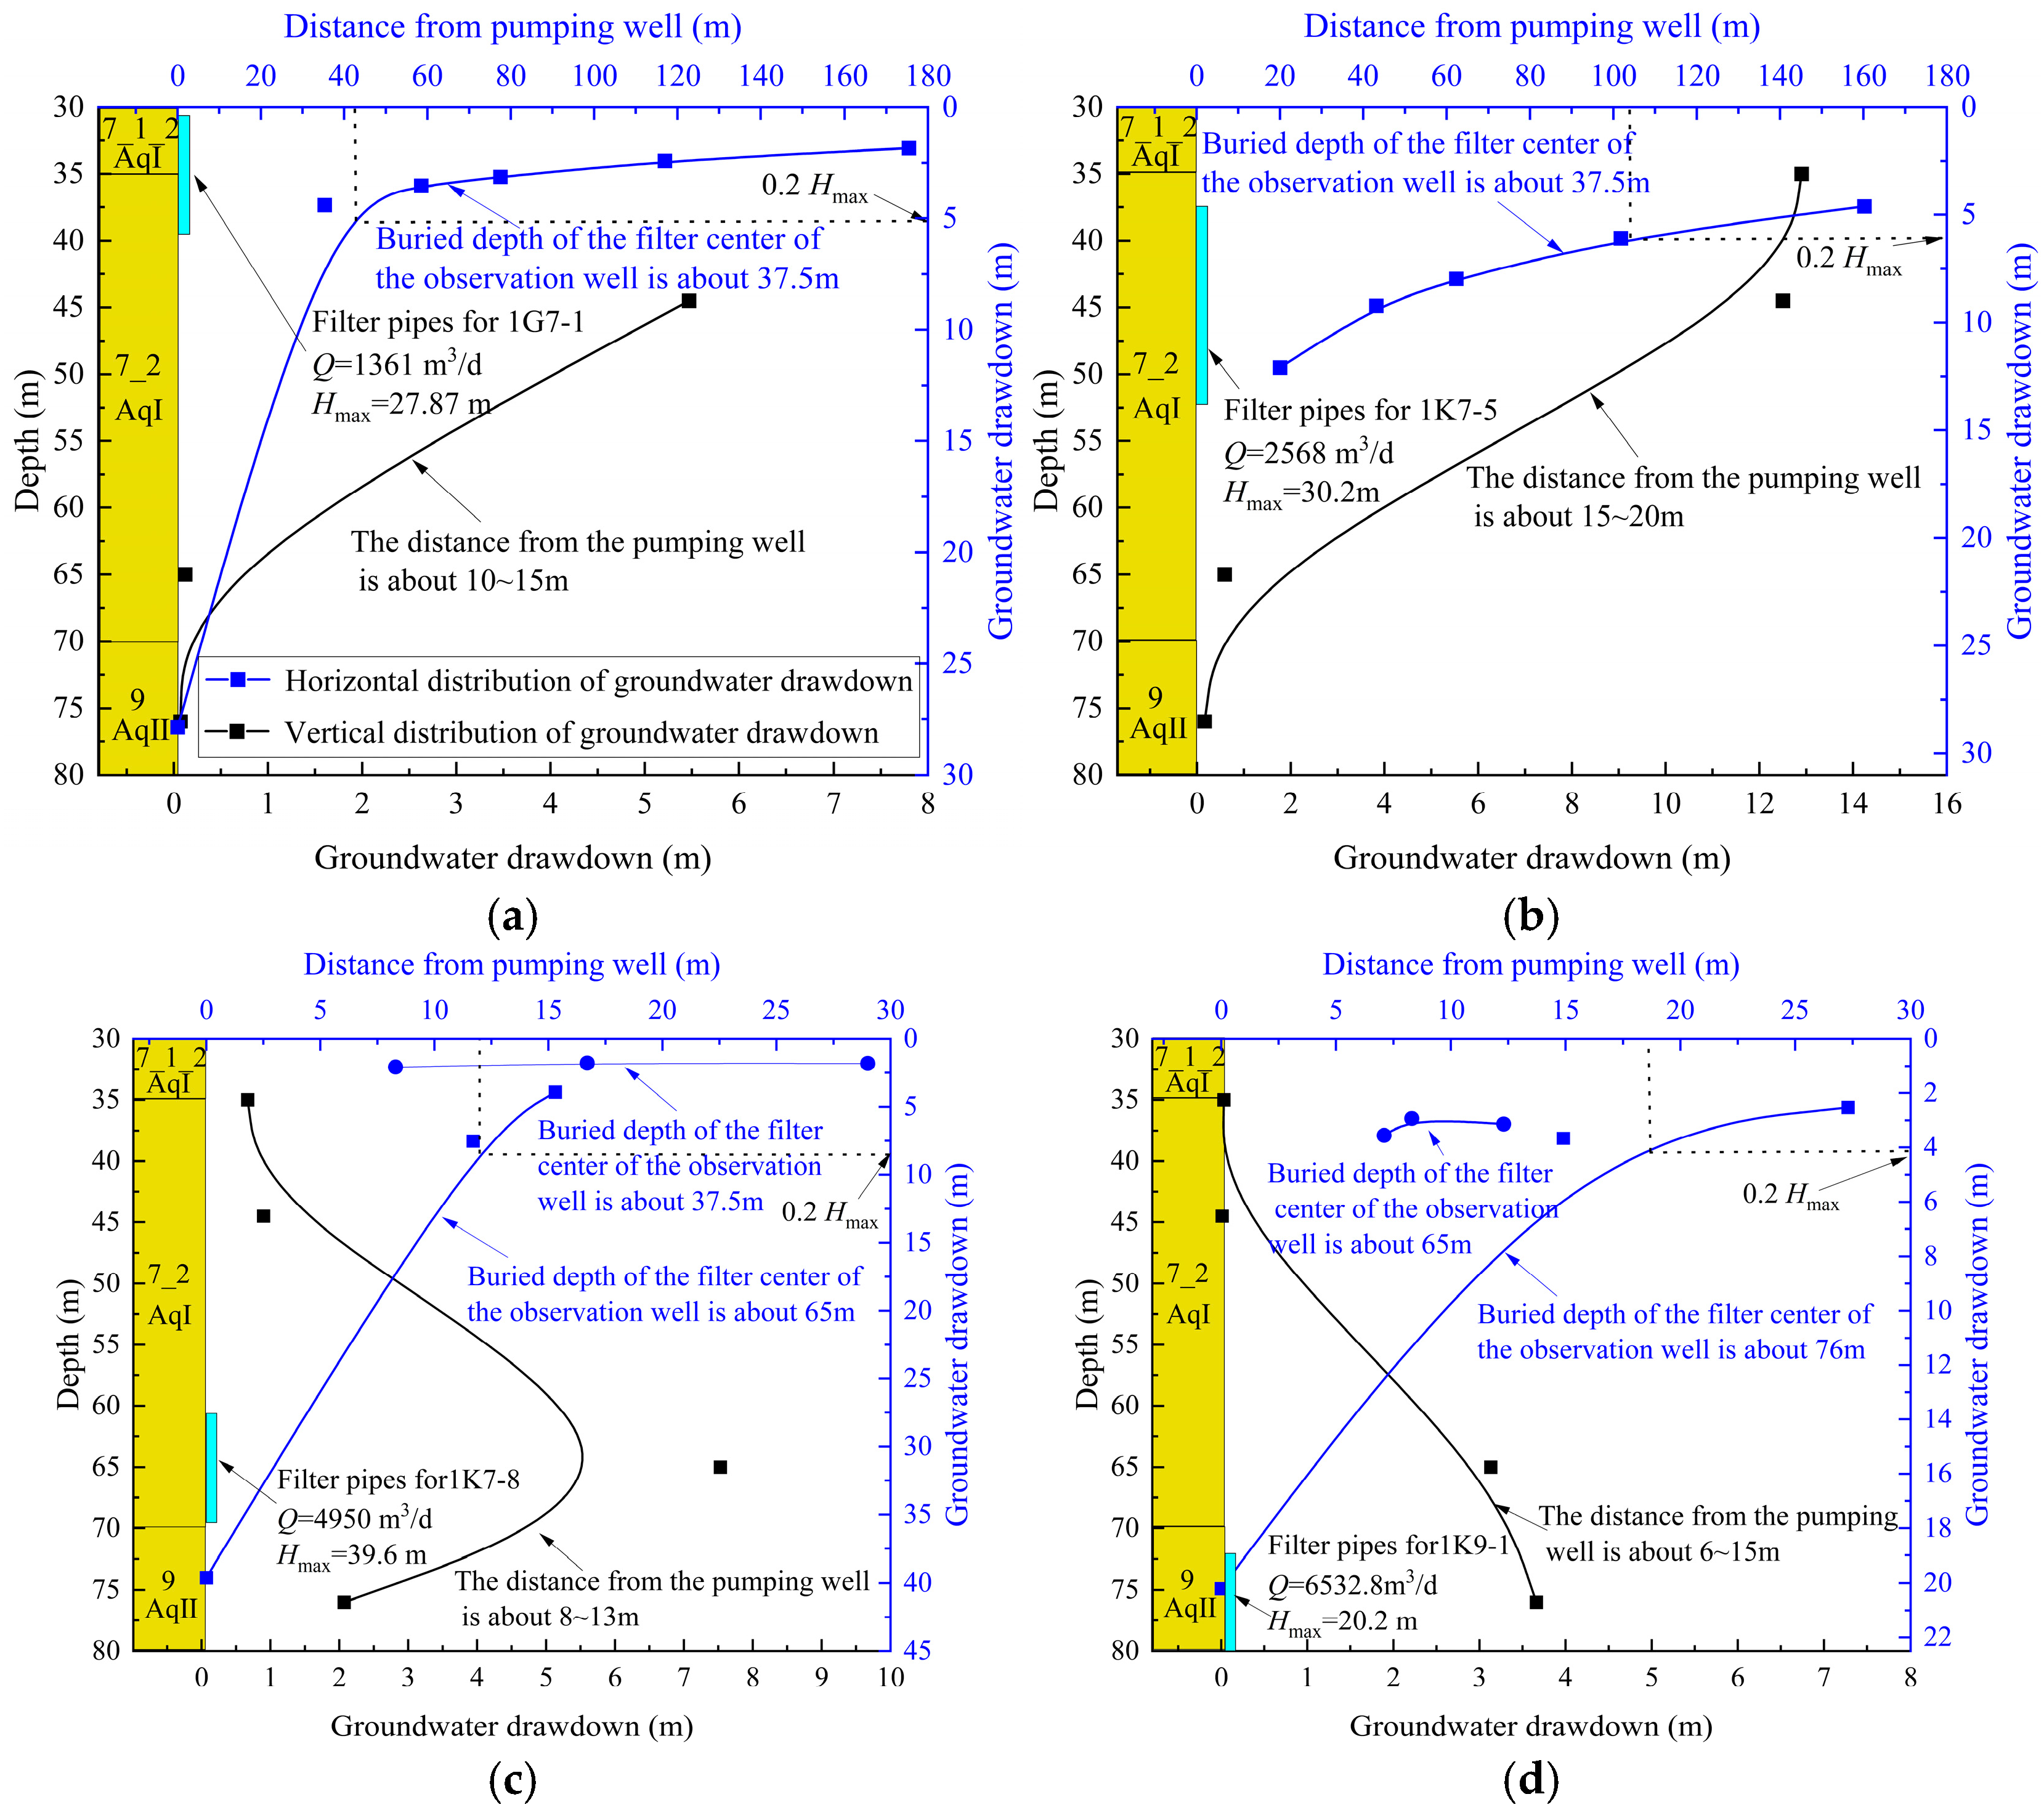
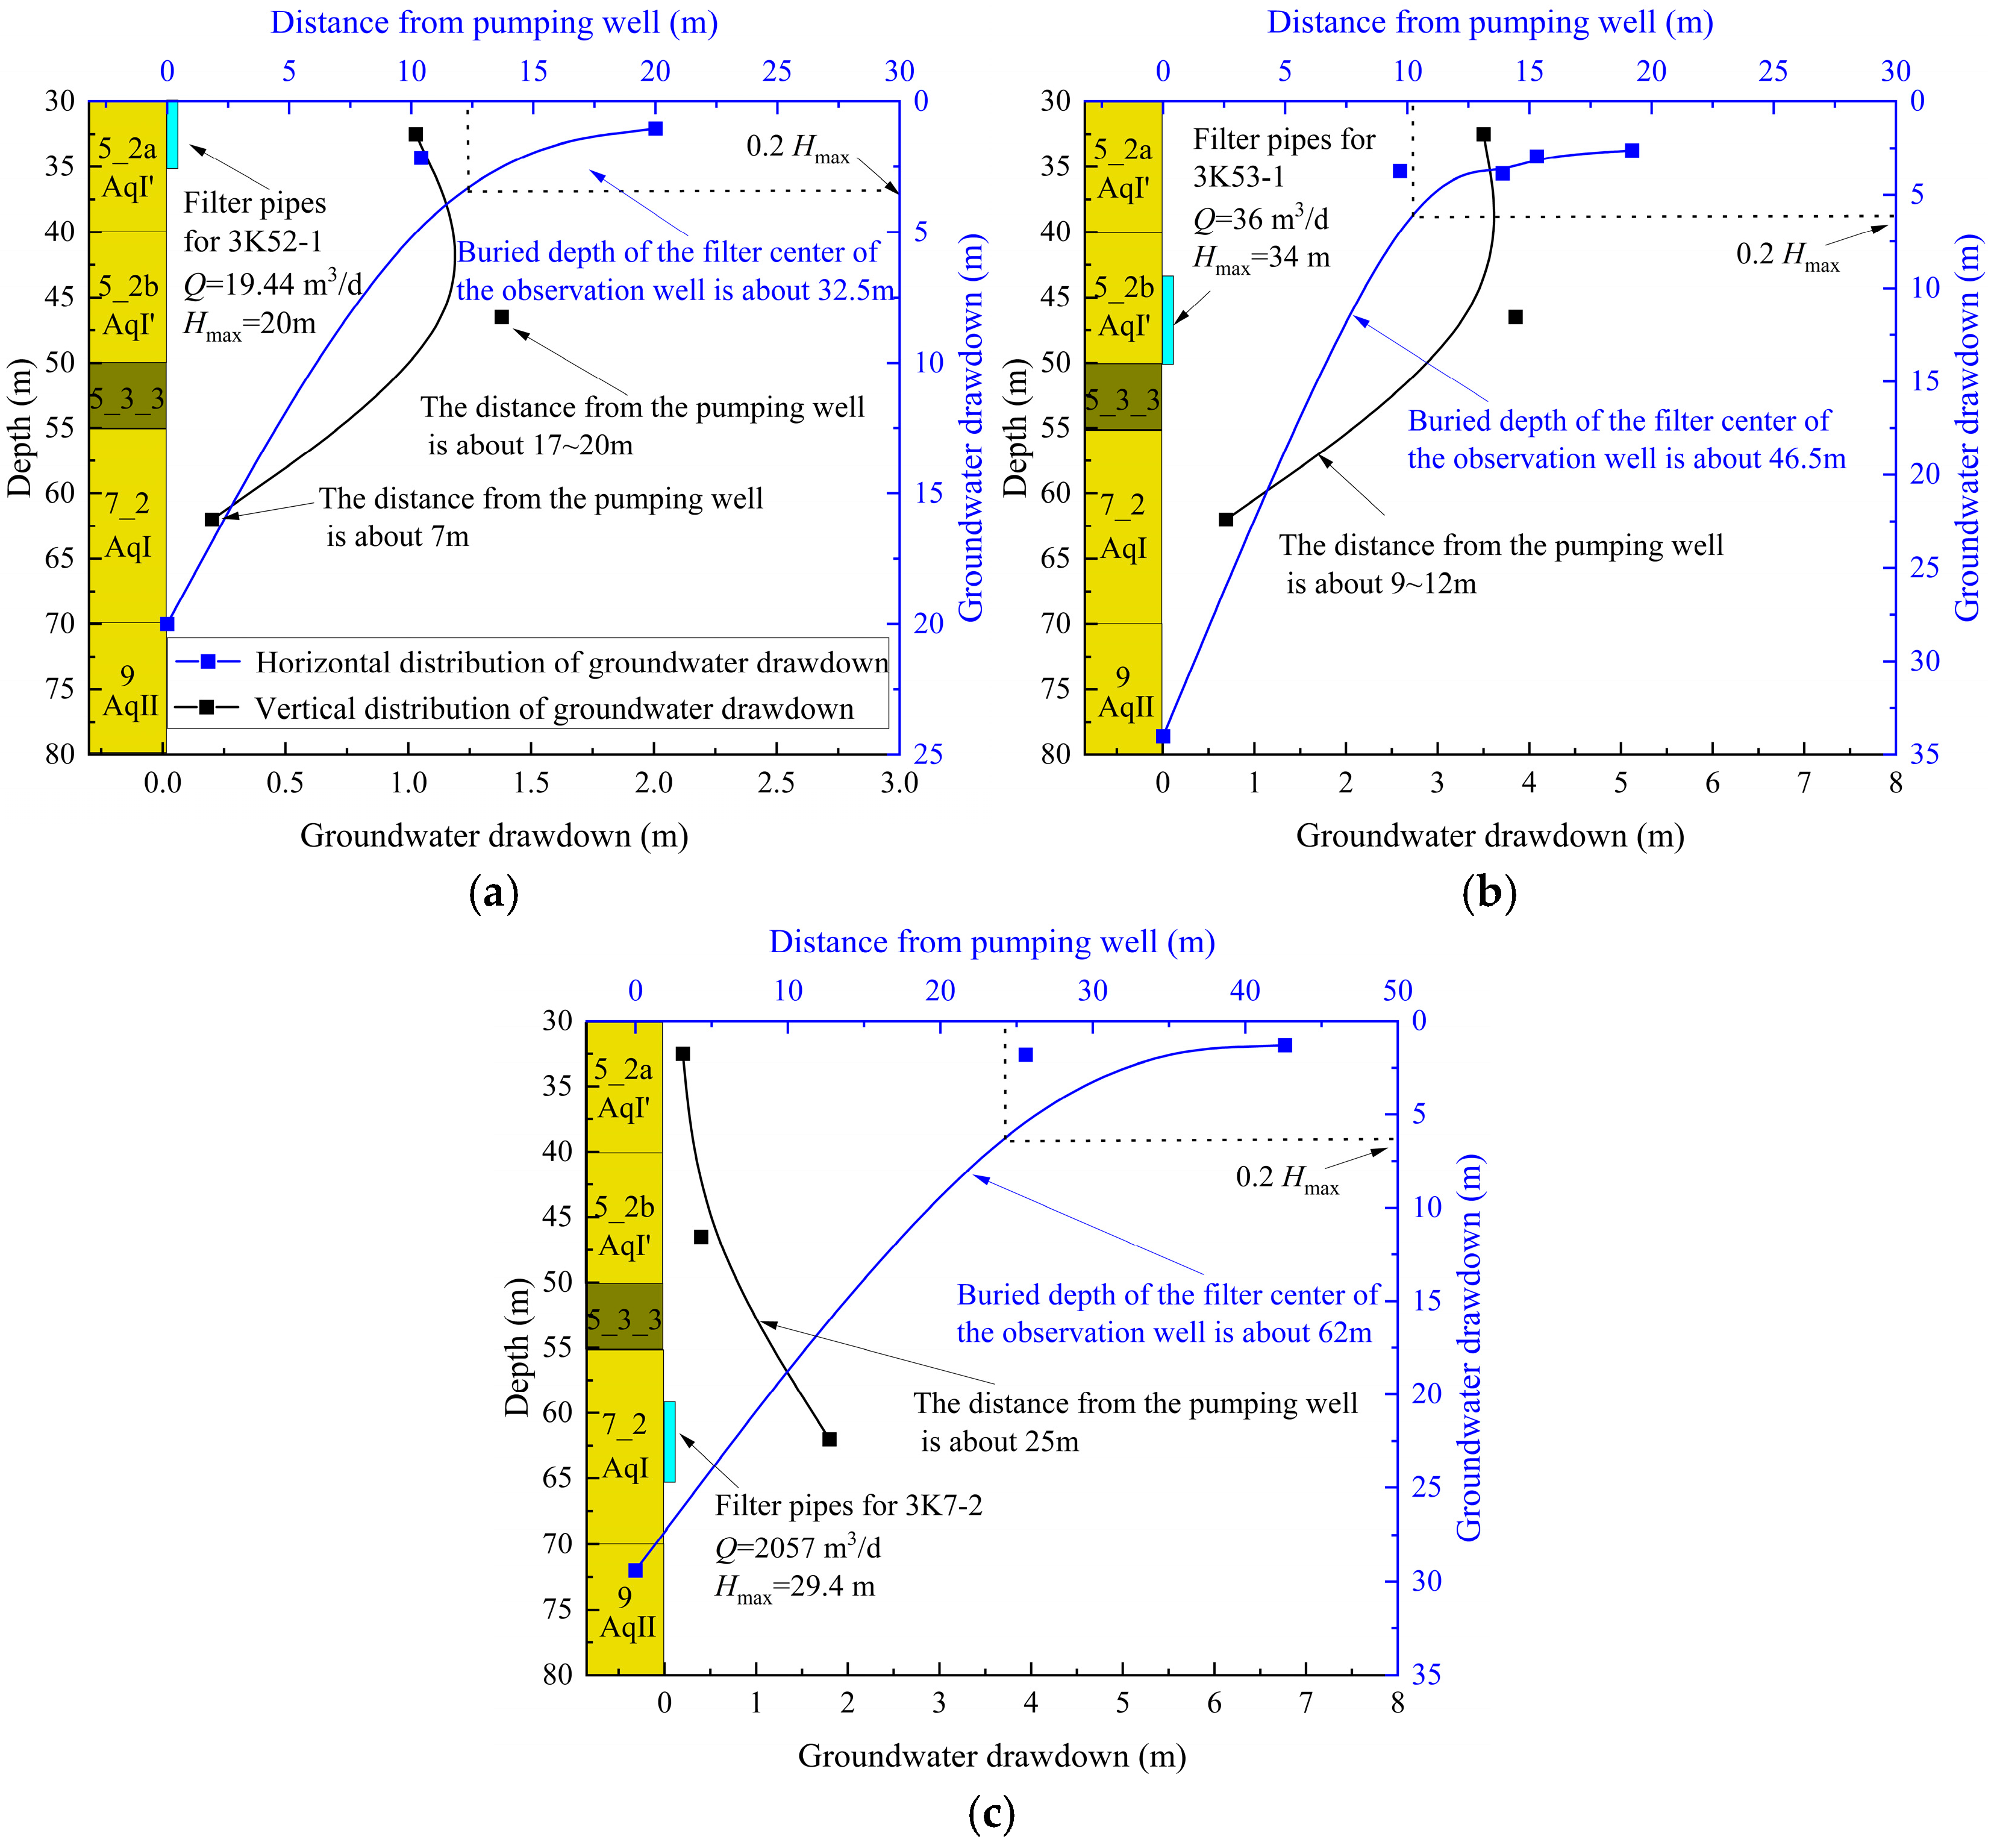
4. Analysis of Single-Well Pumping Test Results

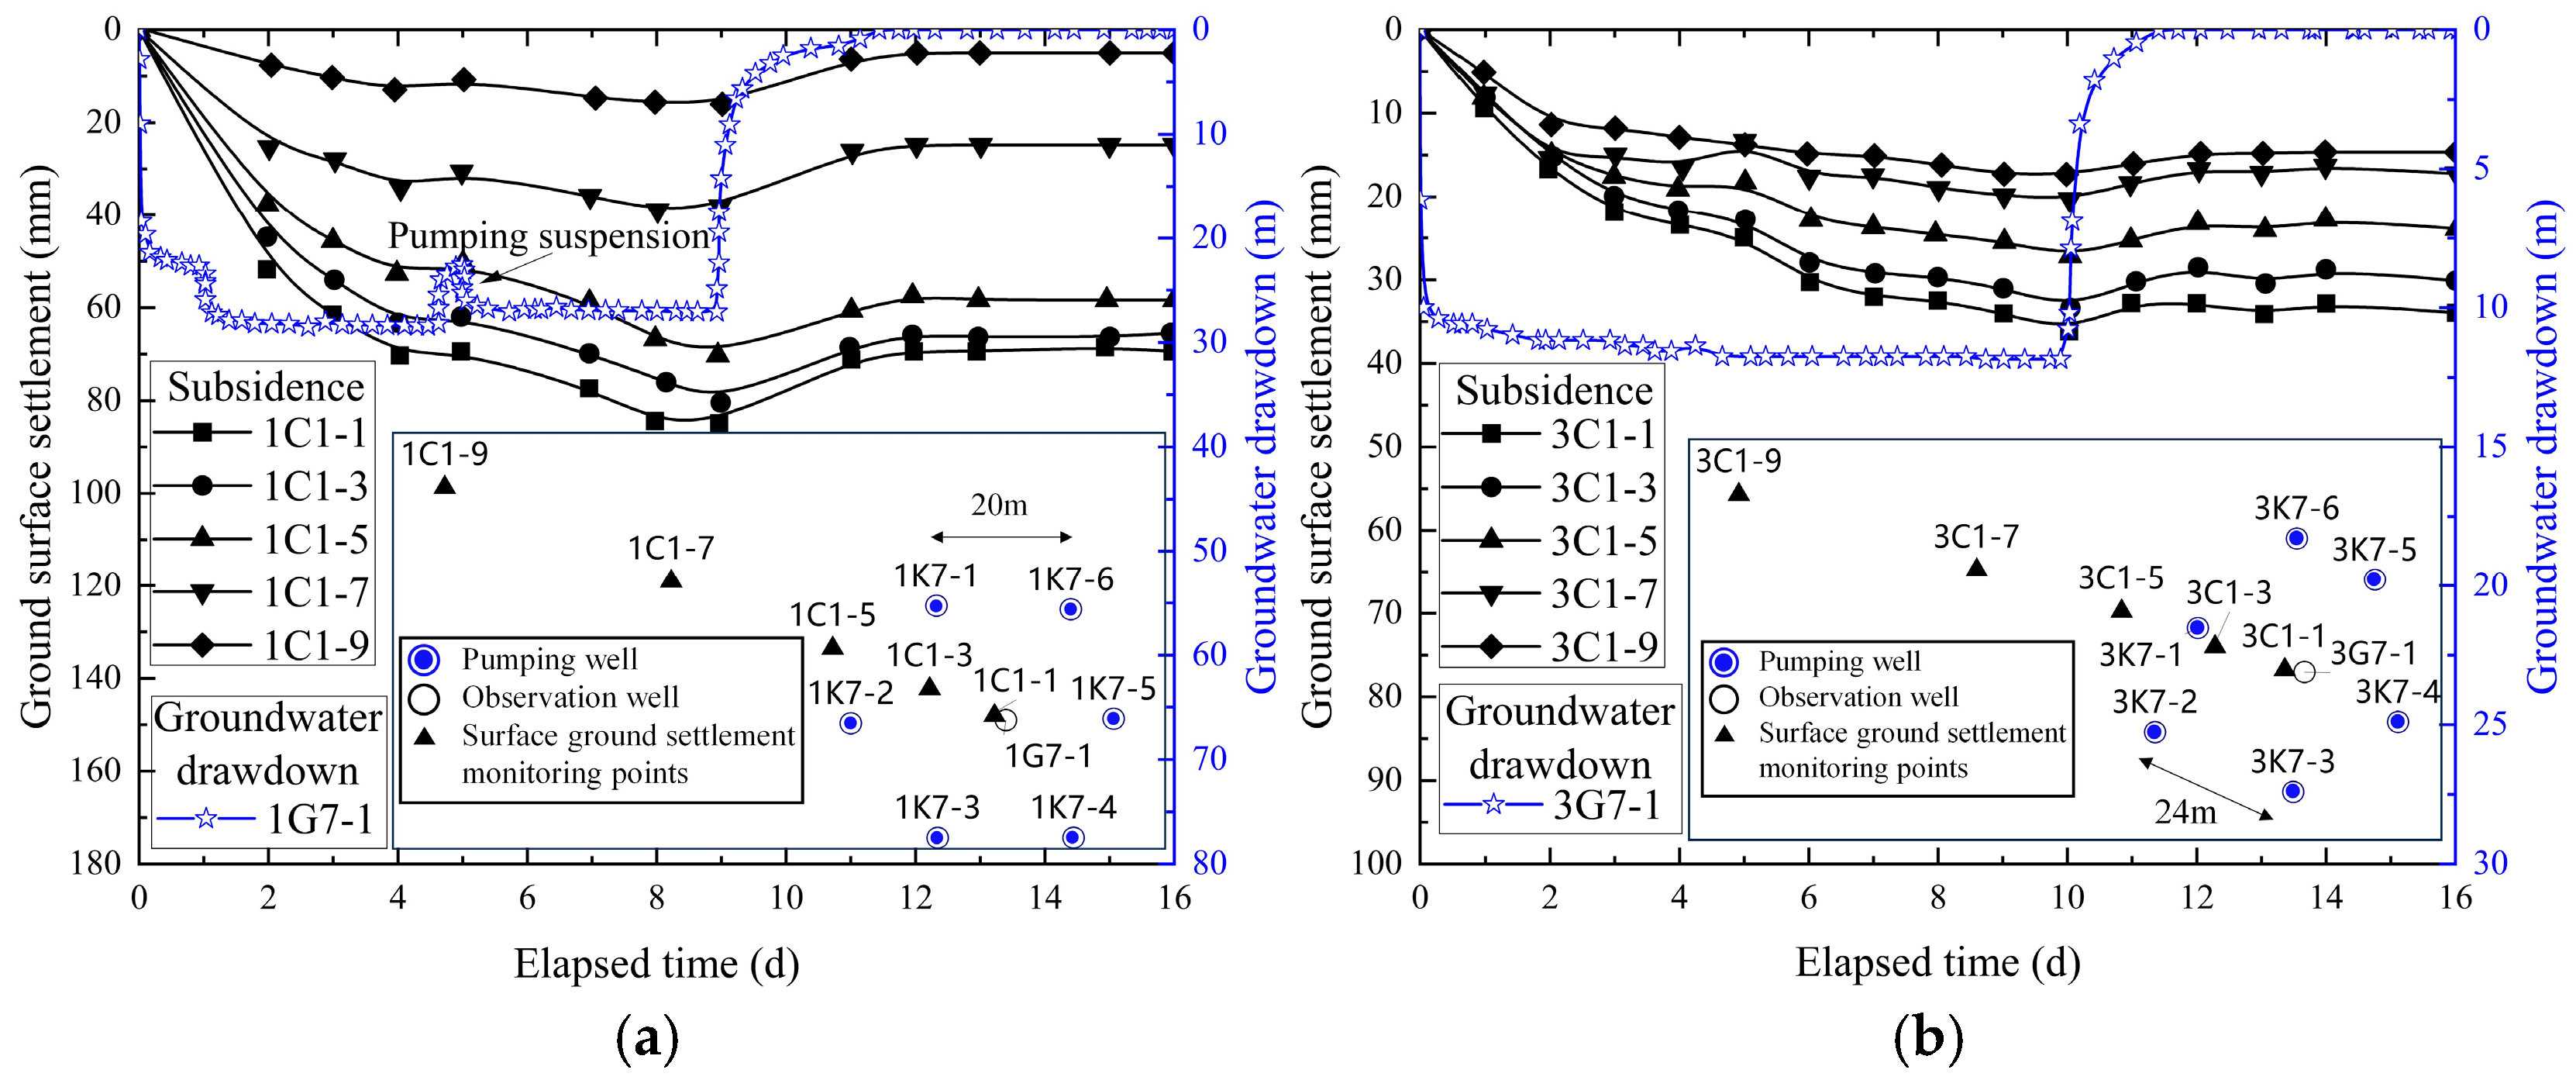
4.1. Temporal Development of Groundwater Drawdown

Figure 6 presents the groundwater drawdown time curves obtained from single-well pumping tests, where Figure 6a represents the normally consolidated zone and Figure 6b represents the paleochannel zone. Both pumping wells and observation wells were located within the same aquifer, with observation well selection adhering to the near-field monitoring principle. Based on engineering experience in the Shanghai area, it was observed that hydraulic recharge is the highest at the 9th level (resulting in the largest discharge volume), followed by the deeper part of the 7th level, the shallower part of the 7th level, and finally the 5th level. Accordingly, during the pumping tests, pumps with rated capacities of 4800, 2400, and 240 m3/d were installed at the 9th/deep 7th, shallow 7th, and 5th layers, respectively. The table in Figure 6 lists both the rated and the actual pumping rates for each well. The maximum groundwater drawdown of observation wells after pumping is denoted as Hd,max, while the residual drawdown after recovery is Hd,ro. The groundwater recovery ratio is calculated as:
(Hd,maxHd,ro)/Hd,max.
It can be observed that, in the normally consolidated zone: (1) The upper and deep parts of layer 7 and layer 9 rapidly attained steady-state seepage conditions, whereas the mid-upper part of layer 7 required approximately 500 min (8 h) to reach steady-state seepage. (2) The actual pumping rate in layer 9 significantly exceeded its rated capacity, necessitating the subsequent replacement of pumping equipment in this layer to enhance rated discharge capacity. (3) All aquifers demonstrated groundwater recovery ratios exceeding 0.6 within 10 min after pumping, indicating strong hydraulic recharge. Consequently, during subsequent construction dewatering processes, pumping interruptions should be avoided and auxiliary pumping wells should be installed.
For the paleochannel zone: (1) All aquifers achieved steady-state seepage rapidly. Notably, the initial drawdown in layer 5_2a was relatively small during pumping, prompting a controlled pumping rate increase after 1500 min that induced stepwise drawdown behavior in well 3G52-1. (2) The actual pumping rate of the micro-confined aquifer was significantly lower than its rated pumping capacity, suggesting that, in future pumping operations, the pump for the micro-confined aquifer may be replaced with one having a lower rated capacity. (3) After pumping for 10 min, the groundwater in the 7th layer had almost fully recovered, whereas in the micro-confined aquifer of the 5th layer, the groundwater recovered by only 10% after approximately 20 min. Therefore, during subsequent construction dewatering, pumping interruptions should be avoided for the 7th layer—with the installation of auxiliary pumping wells—and for the 5th layer, the cessation time should be controlled within 20 min.

4.2. Spatial Distribution of Groundwater Drawdown

The spatial distribution of steady-state groundwater drawdown during single-well pumping in the normally consolidated zone was obtained by extracting the data of observation wells with close buried depth or distance to the pumping well, as shown in Figure 7. About 20% of the maximum groundwater drop depth Hmax (i.e., 0.2Hmax) of the pumping well was taken as the limit of the main influence radius, that is, any location where the groundwater drawdown exceeded 0.2Hmax was considered to be within the primary influence zone of the single well. Figure 7a–d correspond to pumping from the upper part of layer 7, the middle-upper part of layer 7, the deep part of layer 7, and layer 9, respectively. It can be observed that: (1) When pumping from the upper part of layer 7 (Figure 7a, pumping well 1G7-1) and from the middle-upper part of layer 7 (Figure 7b, pumping well 1K7-5), the groundwater drawdown in the deep part of layer 7 and in layer 9 remain essentially unaffected. The radius of primary influence measures approximately 42 m for 1G7-1 versus 105 m for 1K7-5. This significant difference may be attributed to the higher permeability of sublayer 7_2 compared to 7_1_2. (2) When pumping from the deep part of layer 7 (Figure 7c, pumping well 1K7-8), a groundwater drawdown of approximately 2 m occurred in layer 9; similarly, when pumping from layer 9 (Figure 7d), pumping well 1K9-1), a groundwater drawdown of approximately 3 m was observed in the deep part of layer 7, indicating a certain hydraulic connection between layer 7 and layer 9. Therefore, when performing pumping in the deep part of layer 7, it is advisable to monitor not only the groundwater in that layer but also that in layer 9, and vice-versa. (3) The radius of primary influence measure approximately 12 m for deep part of layer 7 and 18 m for layer 9 under single-well pumping conditions. These values are notably smaller than those observed in upper and middle sections of layer 7, potentially resulting from stronger hydraulic recharge capacities in the deep part of layer 7 and layer 9.
Figure 8 illustrates the spatial distribution of steady-state groundwater drawdown during single-well pumping in the paleochannel zone, with Figure 8a–c representing pumping operations in layers 5_2a and 5_2b and layer 7, respectively. It can be observed that: (1) For pumping from the 5_2a layer (Figure 8a, pumping well 3K52-1) and from the 5_2b layer (Figure 8b, pumping well 3K53-1), the primarily affected soil layer is the 5th layer, while the 7th layer exhibits a minor drawdown of approximately 0.2 m. Similarly, for pumping from the 7th layer (Figure 8c, pumping well 3K7-2), the groundwater in the 5th layer slightly decreases. This hydraulic connection occurs due to the presence of the weakly permeable layer 5_3_3, which inadequately isolates the first confined aquifer (layer 7) from the micro-confined aquifer (stratum 5), resulting in inter-aquifer leakage. (2) For pumping from the 5_2a layer at well 3K52-1 and from the 5_2b layer at well 3K53-1, the primary influence radius is about 11 m. In contrast, single-well pumping from the 7th layer has a relatively larger influence radius of approximately 24 m. The comparison with the single-well pumping results in the normally consolidated zone reveals that pumping from the upper to middle part of the 7th layer in this zone exhibits the largest influence area, which is three to five times greater than that of the others. Therefore, special attention should be paid to the presence of protected structures in surrounding areas when implementing pumping operations in the middle-upper section of layer 7 within normally consolidated zones.

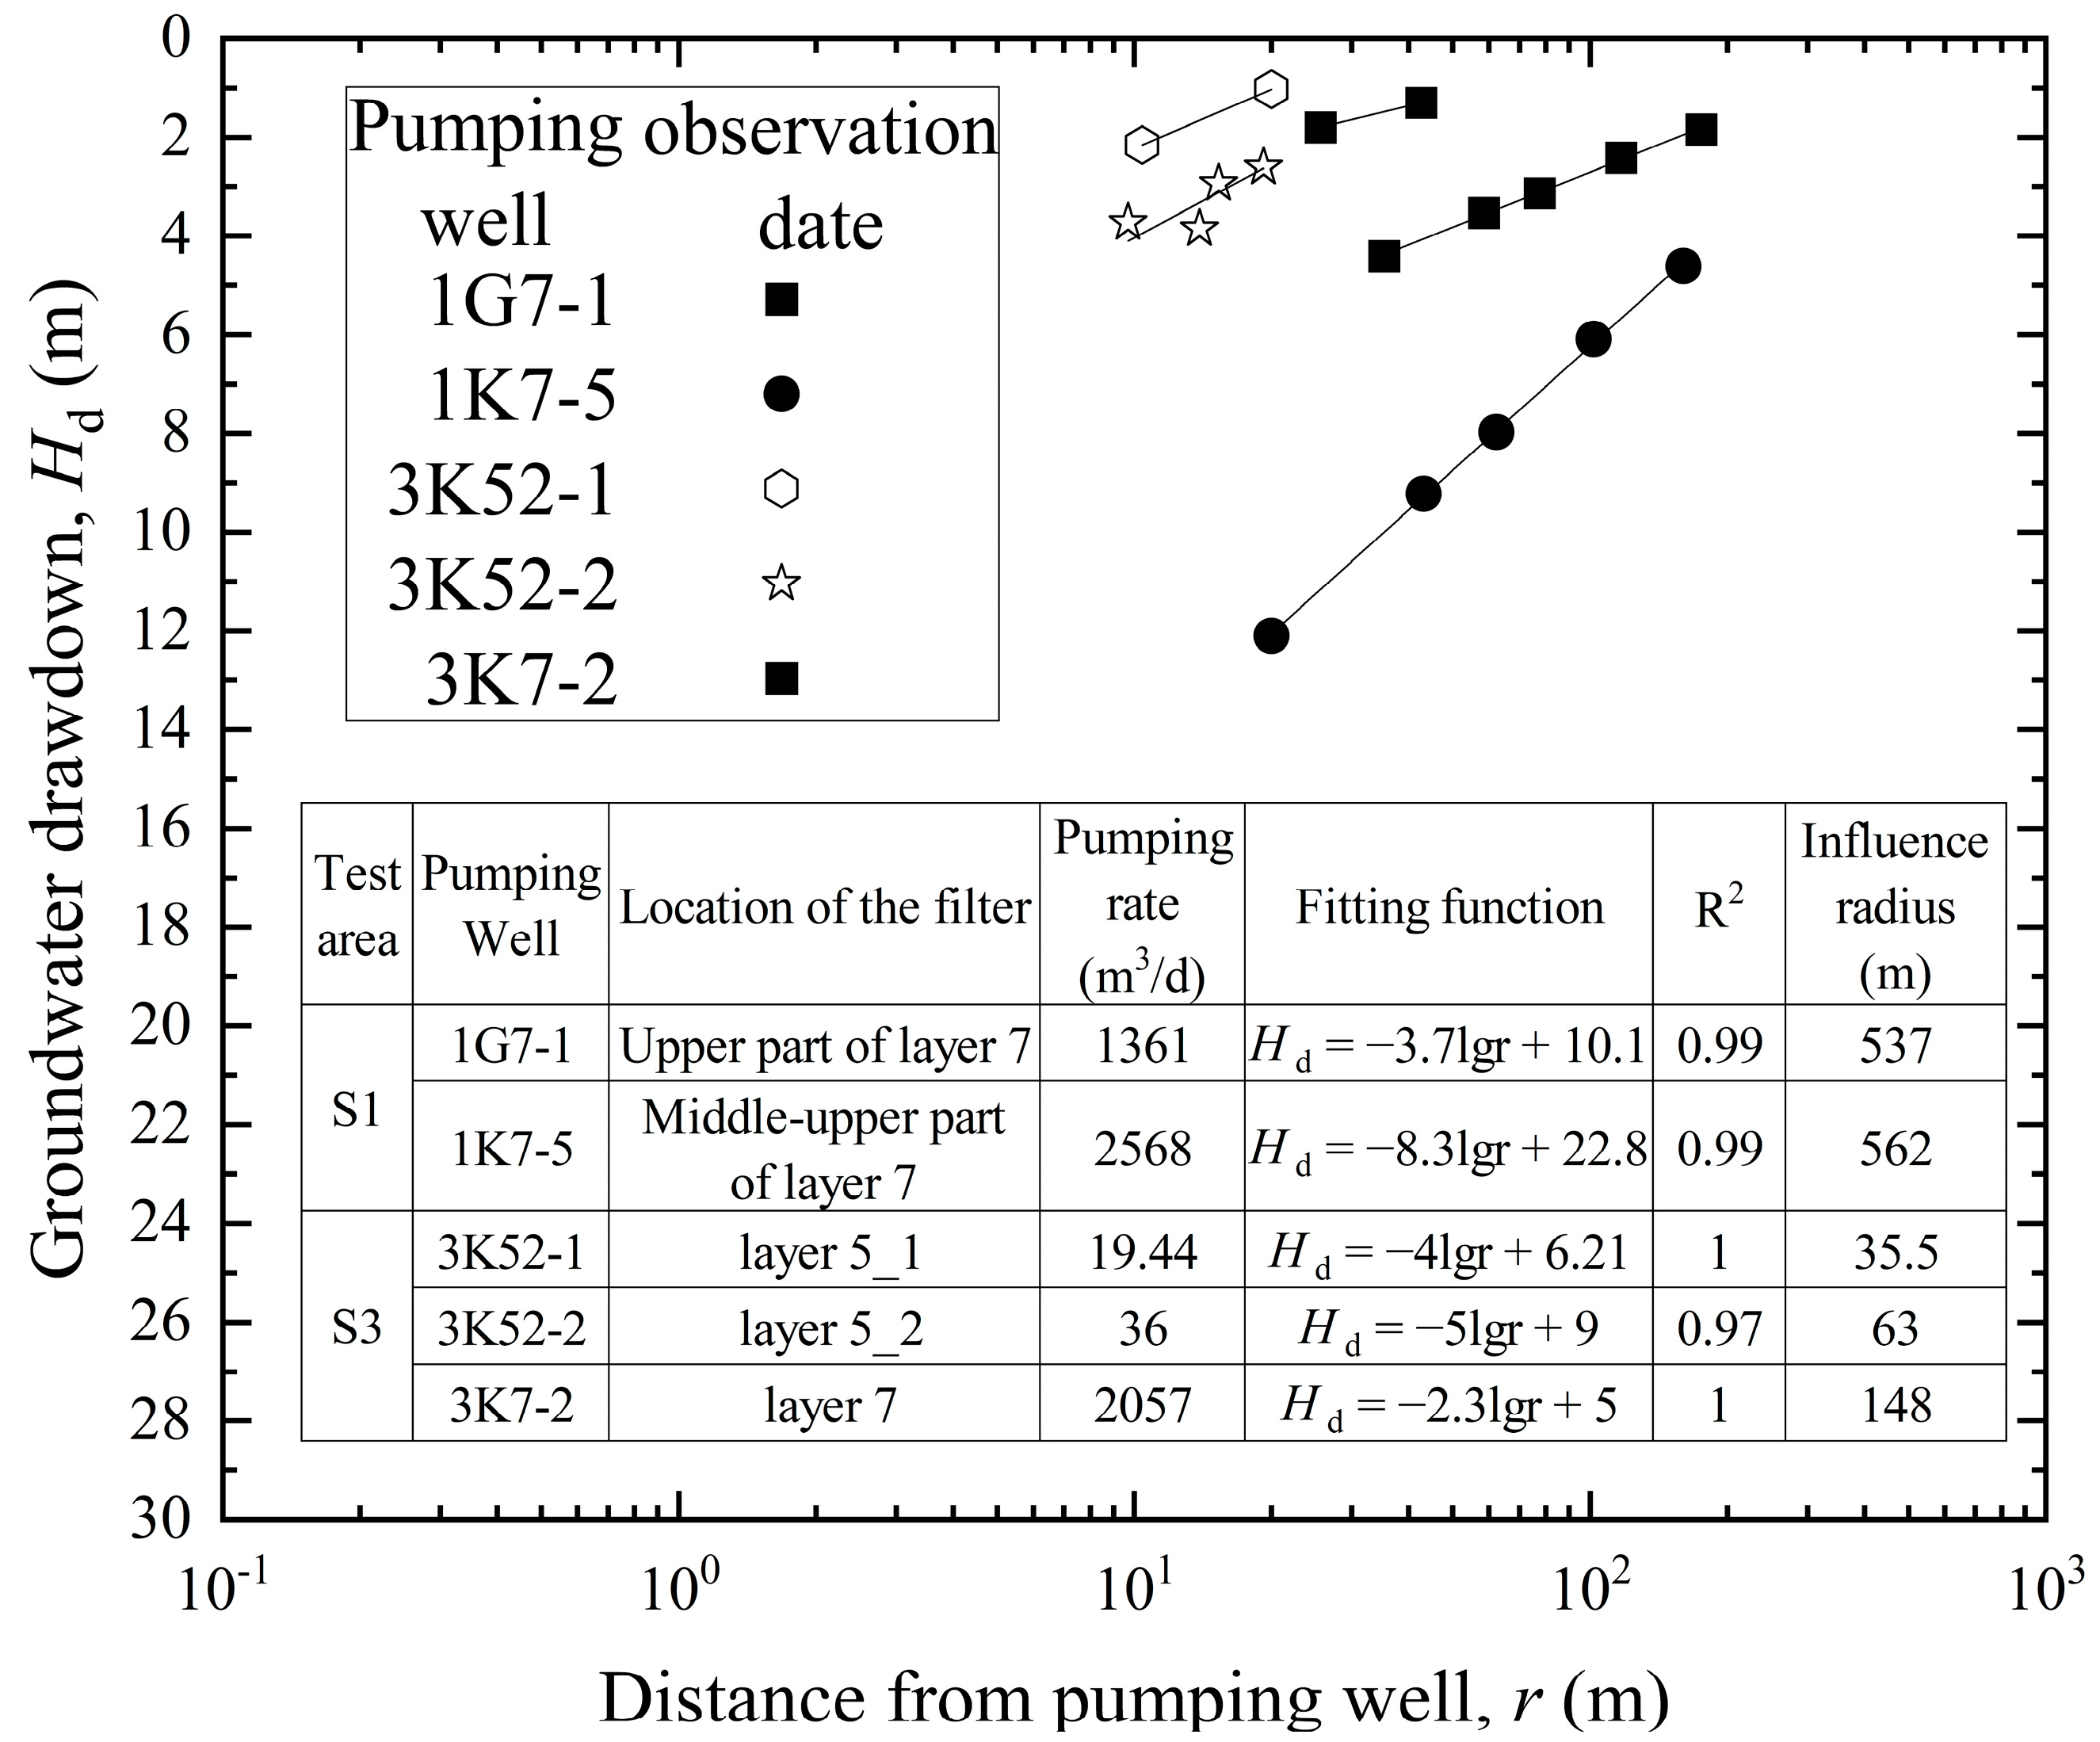
4.3. Single-Well Influence Radius

The radius of influence determined from pumping tests holds significant implications for subsequent foundation pit pumping design (such as optimizing the layout, number, and locations of pumping wells), environmental impact assessments, and emergency response planning. Figure 9 illustrates the relationship between the groundwater drawdown (Hd) in same-layer observation wells and lgr, where r denotes the distance between the observation well and the pumping well. By fitting the Hd-lgr data to establish corresponding functions, the radius of influence was calculated based on the r value corresponding to Hd = 0.
The results demonstrate that the pumping well in the seventh layer of the normally consolidated zone exhibits the largest single-well influence radius, followed by the pumping well in the seventh layer of the paleochannel zone. In contrast, the pumping well in the fifth layer (micro-confined aquifer) of the paleochannel zone has the smallest single-well influence radius. Therefore, in subsequent pumping well arrangements, the wells in the fifth layer of the paleochannel zone should be positioned more densely.

5. Analysis of Multi-Well Pumping Test Results

In the previous section, the single-well pumping test primarily provided information on the site’s hydraulic connectivity and the influence radius of a single well. However, due to the relatively short pumping duration and small pumping volume in the single-well pumping test, the resulting soil settlement was minimal, which did not allow for a detailed study of the relationship between groundwater drawdown and soil settlement. Therefore, it is necessary to conduct a multi-well pumping test to investigate this relationship. Additionally, a numerical model was used to fit the groundwater drawdown induced by the multi-well pumping test, and the hydrogeological parameters of the aquifer were inversely determined.

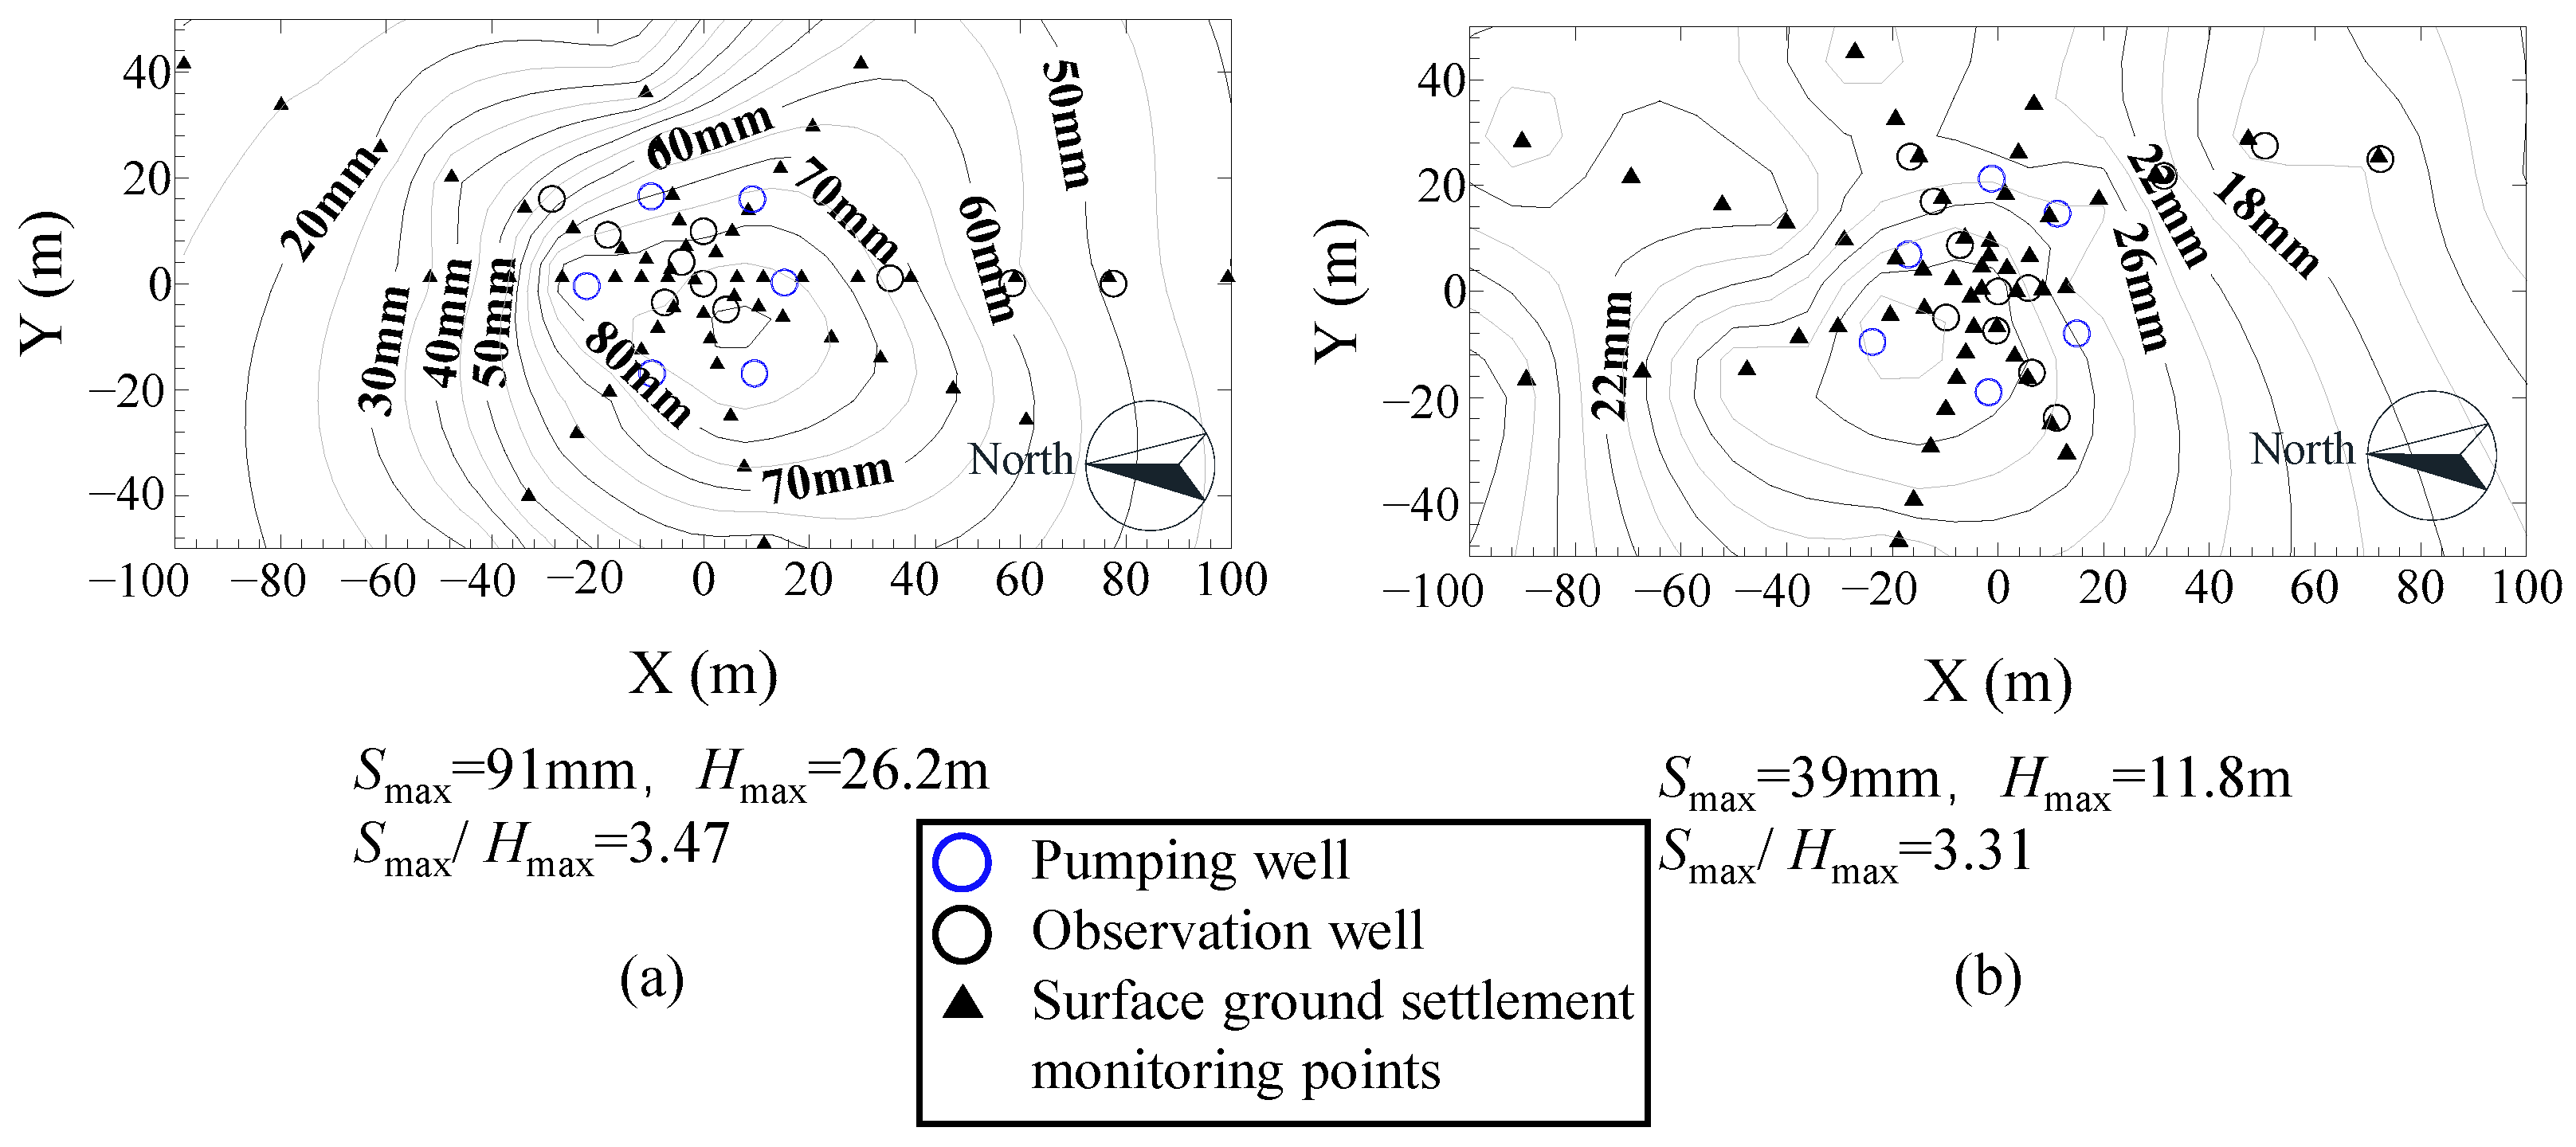
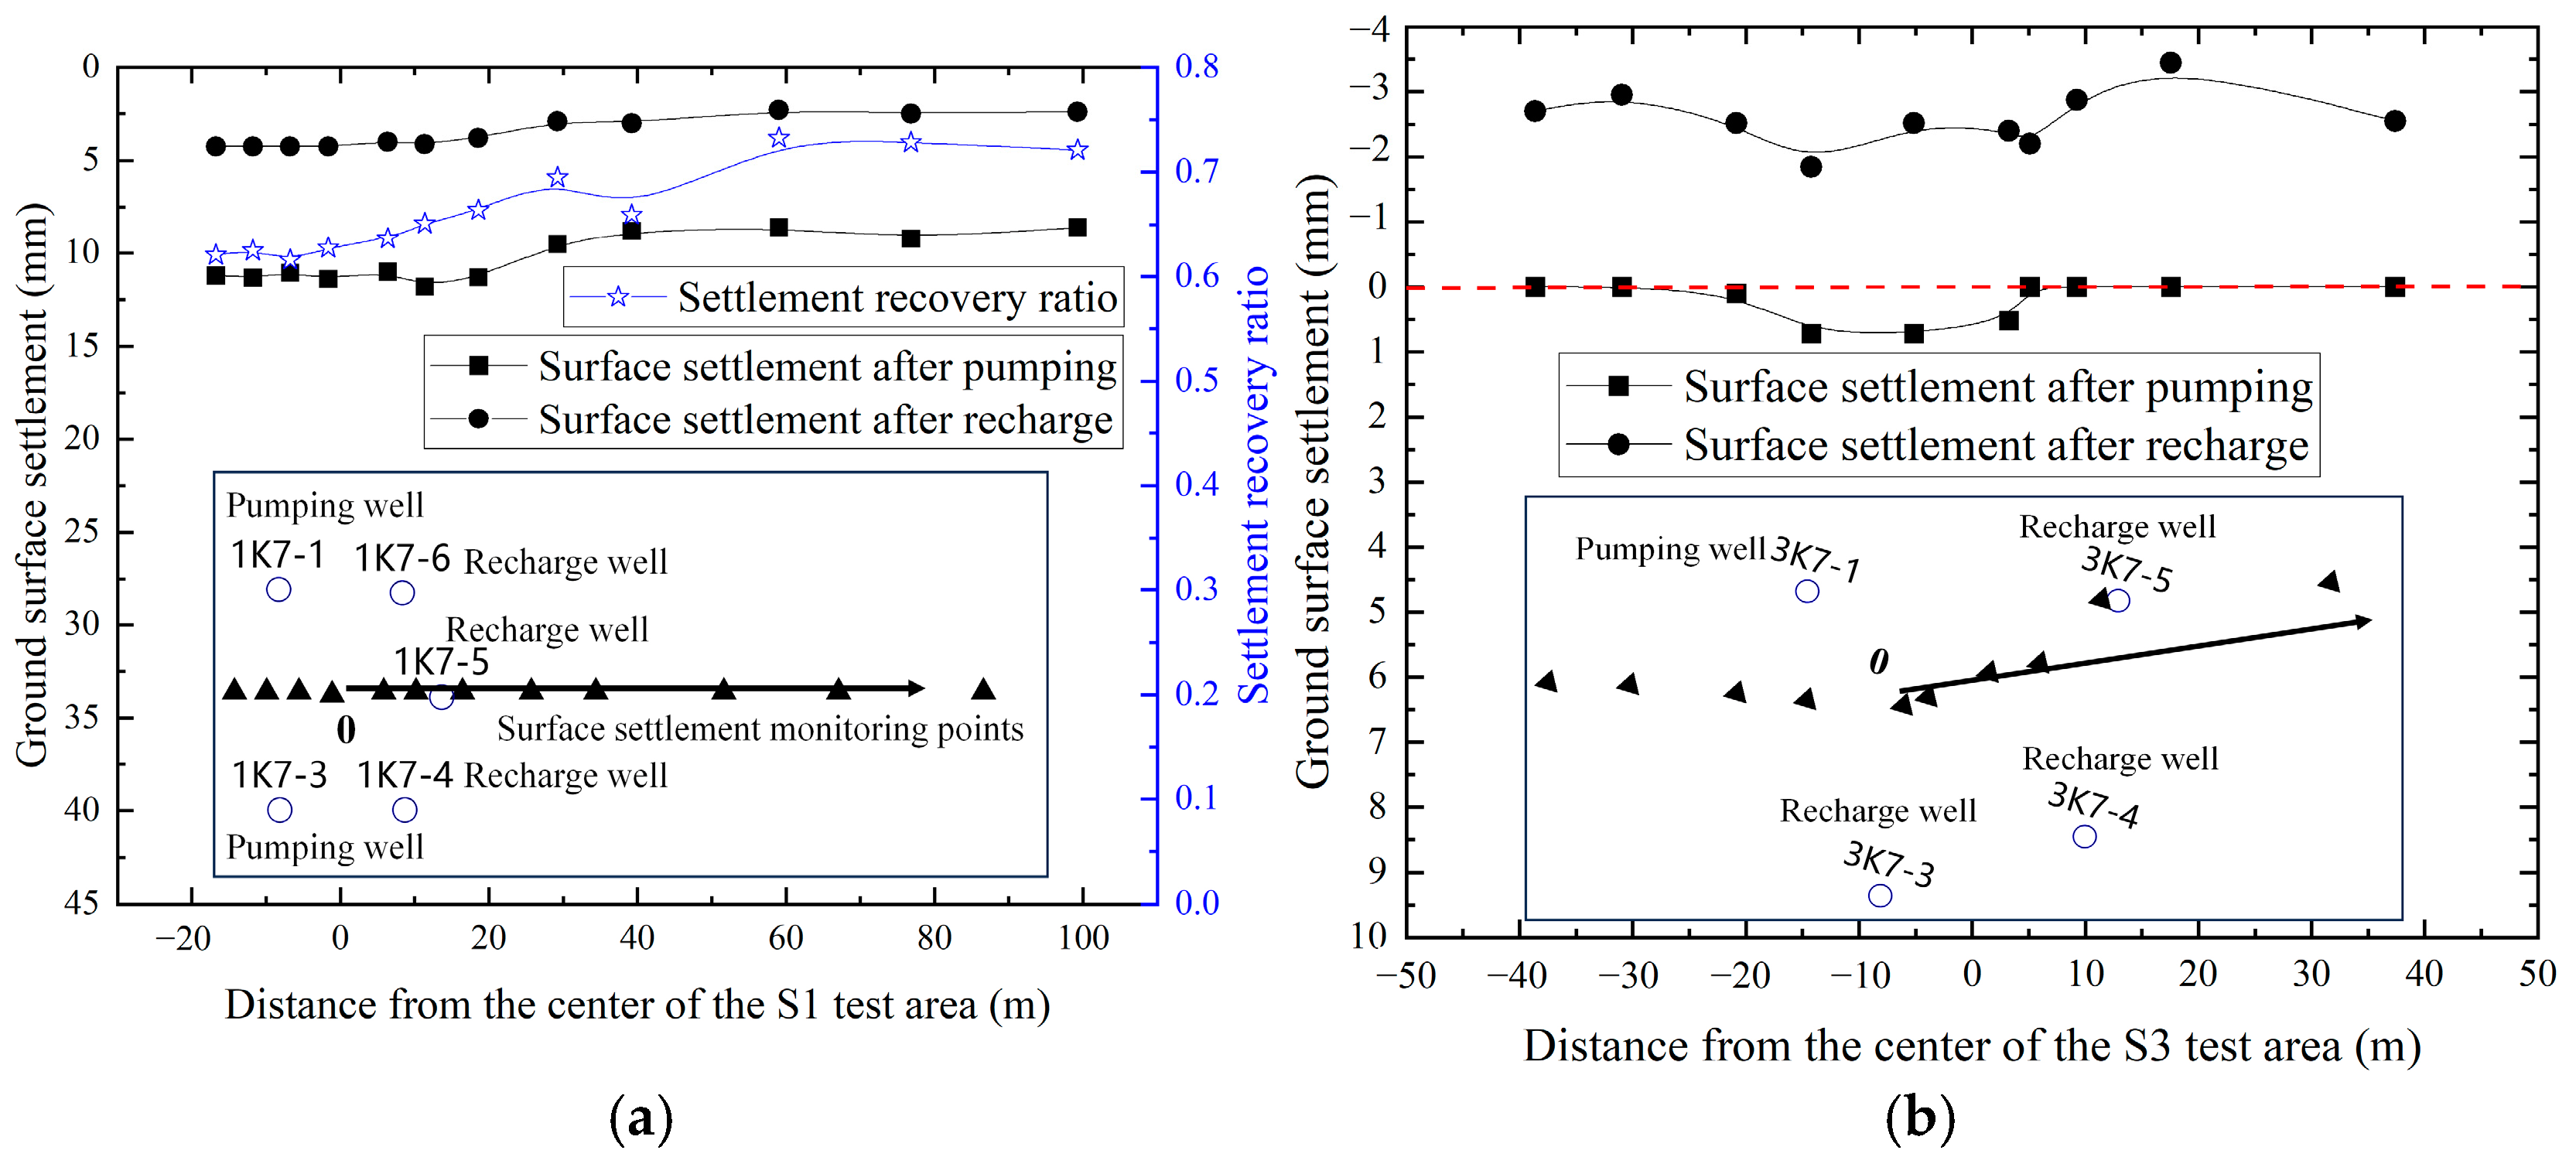
5.1. Ground Surface Settlement

Figure 10 shows the time–history curves of ground surface settlement during the multi-well pumping test. In normally consolidated zone (Figure 10a, S1), wells 1K7-2, 1K7-4, and 1K7-6 were activated firstly, followed by wells 1K7-1, 1K7-3, and 1K7-5 approximately one day later. Pumping was interrupted for maintenance due to a power outage 4.5 days after initiation and resumed 7 h later. In the paleochannel zone (Figure 10b, S3), all test wells (3K7-1 to 3K7-6) operated simultaneously. The results indicate that groundwater stabilized rapidly in both zones. The maximum groundwater drawdown observed at the central monitoring well (1G7-1) in the normally consolidated zone was 26.2 m, while the corresponding value at the central monitoring well (3G7-1) in the paleochannel zone was 11.8 m. Notably, settlement deformation lagged significantly behind ground changes, and settlements decreased after groundwater recovery.
Figure 11 illustrates the spatial distribution of ground surface settlement after pumping. Maximum settlements occurred near the center of the pumping well group. The normally consolidated zone exhibited a maximum settlement (Smax) of 91 mm, compared to 39 mm in the paleochannel zone. As detailed in Section 5.1, the maximum drawdowns (Hmax) at layer 7 observation wells in the central areas of S1 and S3 were 26.2 m and 11.8 m, respectively. The calculated settlement-to-drawdown ratios were 3.475 mm/m for the normally consolidated zone and 3.305 mm/m for the paleochannel zone, indicating consistent settlement–drawdown characteristics between the two regions.
Figure 12 presents the spatial distribution of ground surface settlement after groundwater recovery. The post-recovery surface settlement (Sro) was reduced to some extent across the area, with the maximum post-recovery settlement (Sro,max) still located near the center of the pumping well group: approximately 70 mm in the normally consolidated zone and 32 mm in the paleochannel zone.
Figure 13 depicts the spatial distribution of settlement recovery ratios, calculated as:
(Smax − Sro,max)/Smax,
representing the proportion of elastic deformation to total deformation. The central settlement recovery ratios were 0.23 for the normally consolidated zone and 0.18 for localized areas of the paleochannel zone. These low ratios reflected both soil plastic deformation and insufficient recovery time relative to soil creep processes. Settlement recovery ratios increased with the distance from the pumping wells in certain directions. However, from a safety perspective, subsequent engineering settlement analyses and calculations should be based on the lower settlement recovery ratio observed near the pumping well group.

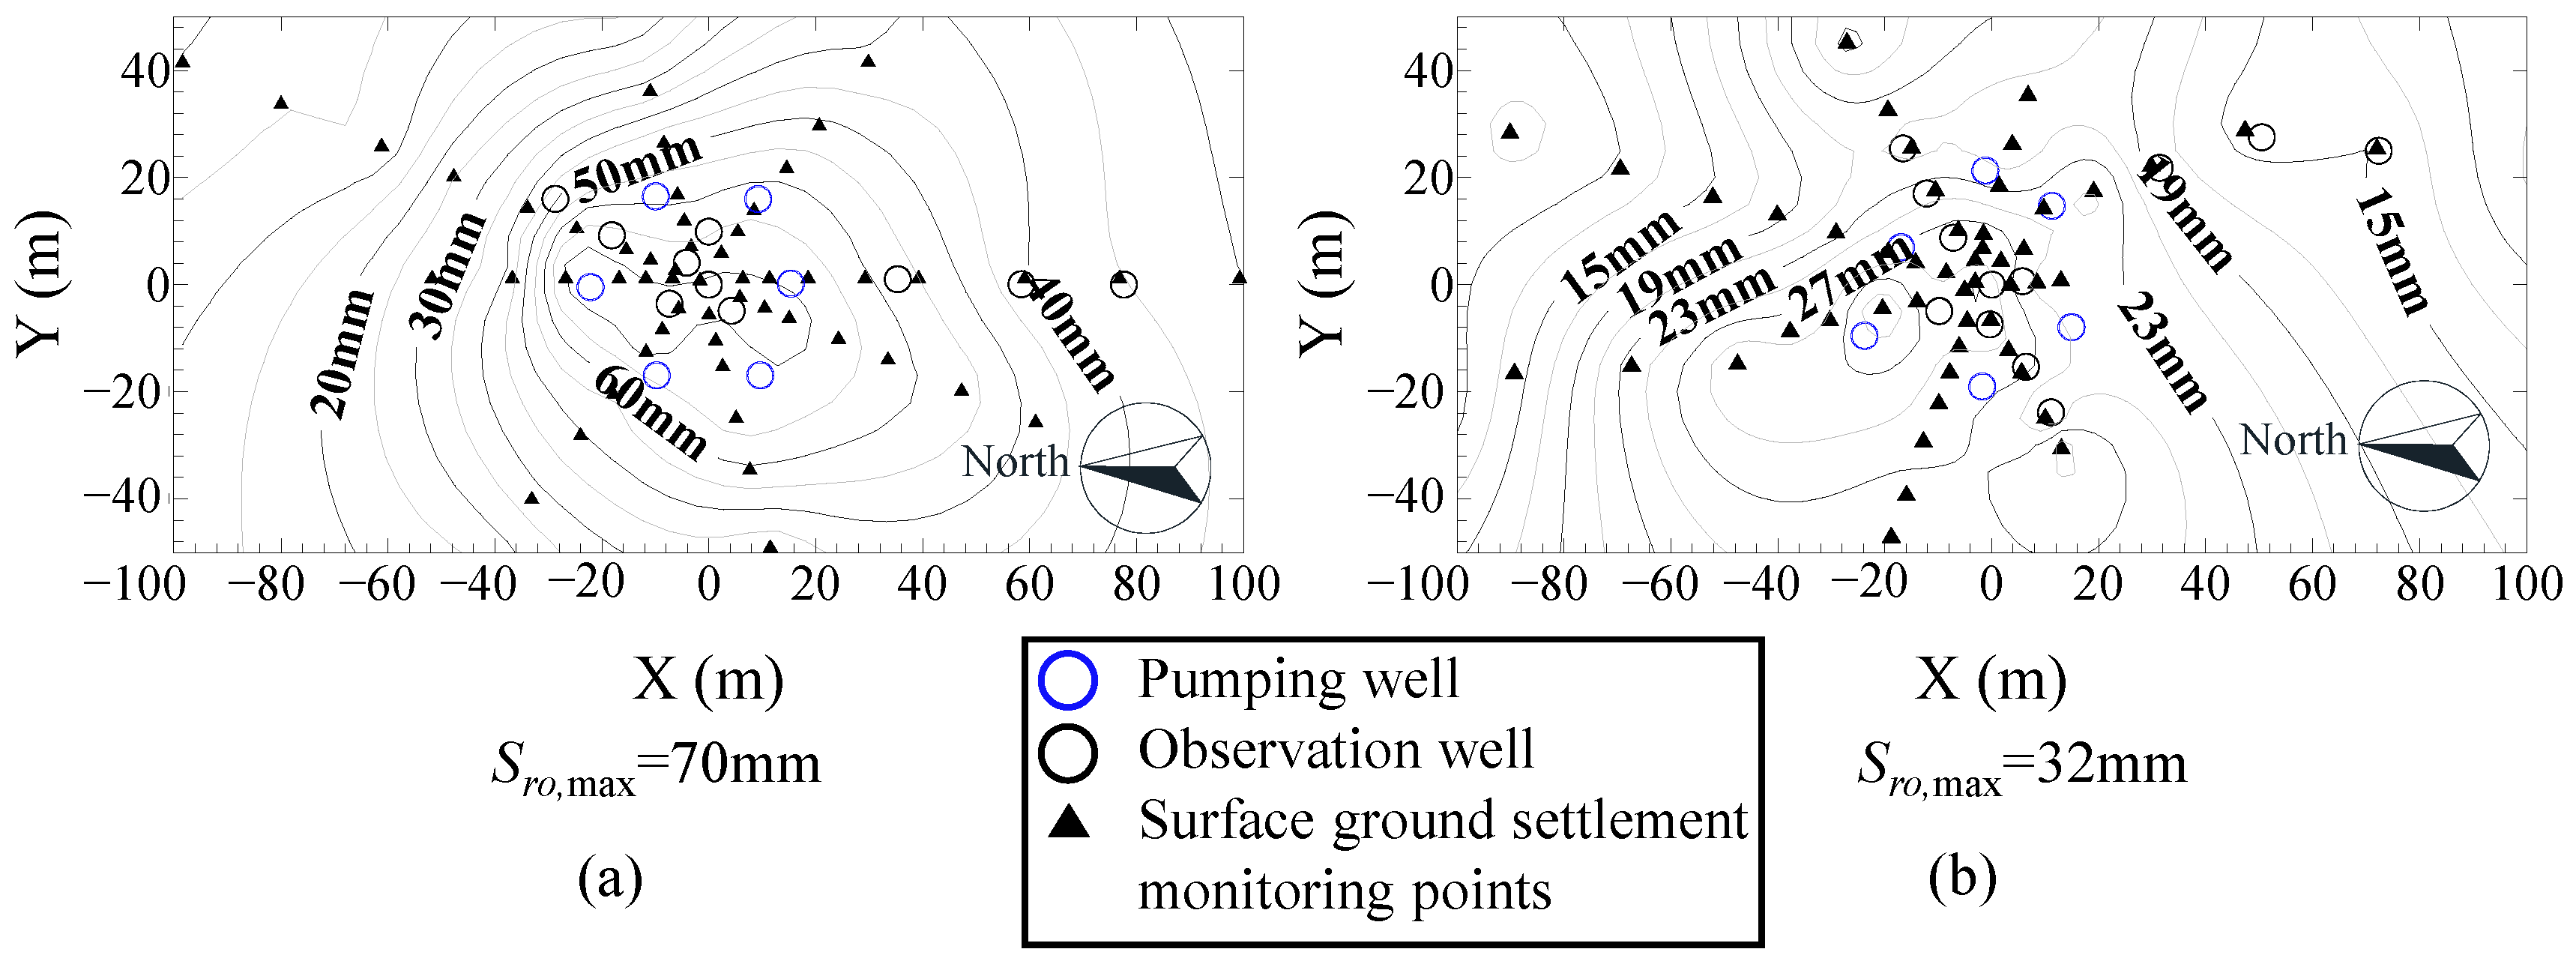
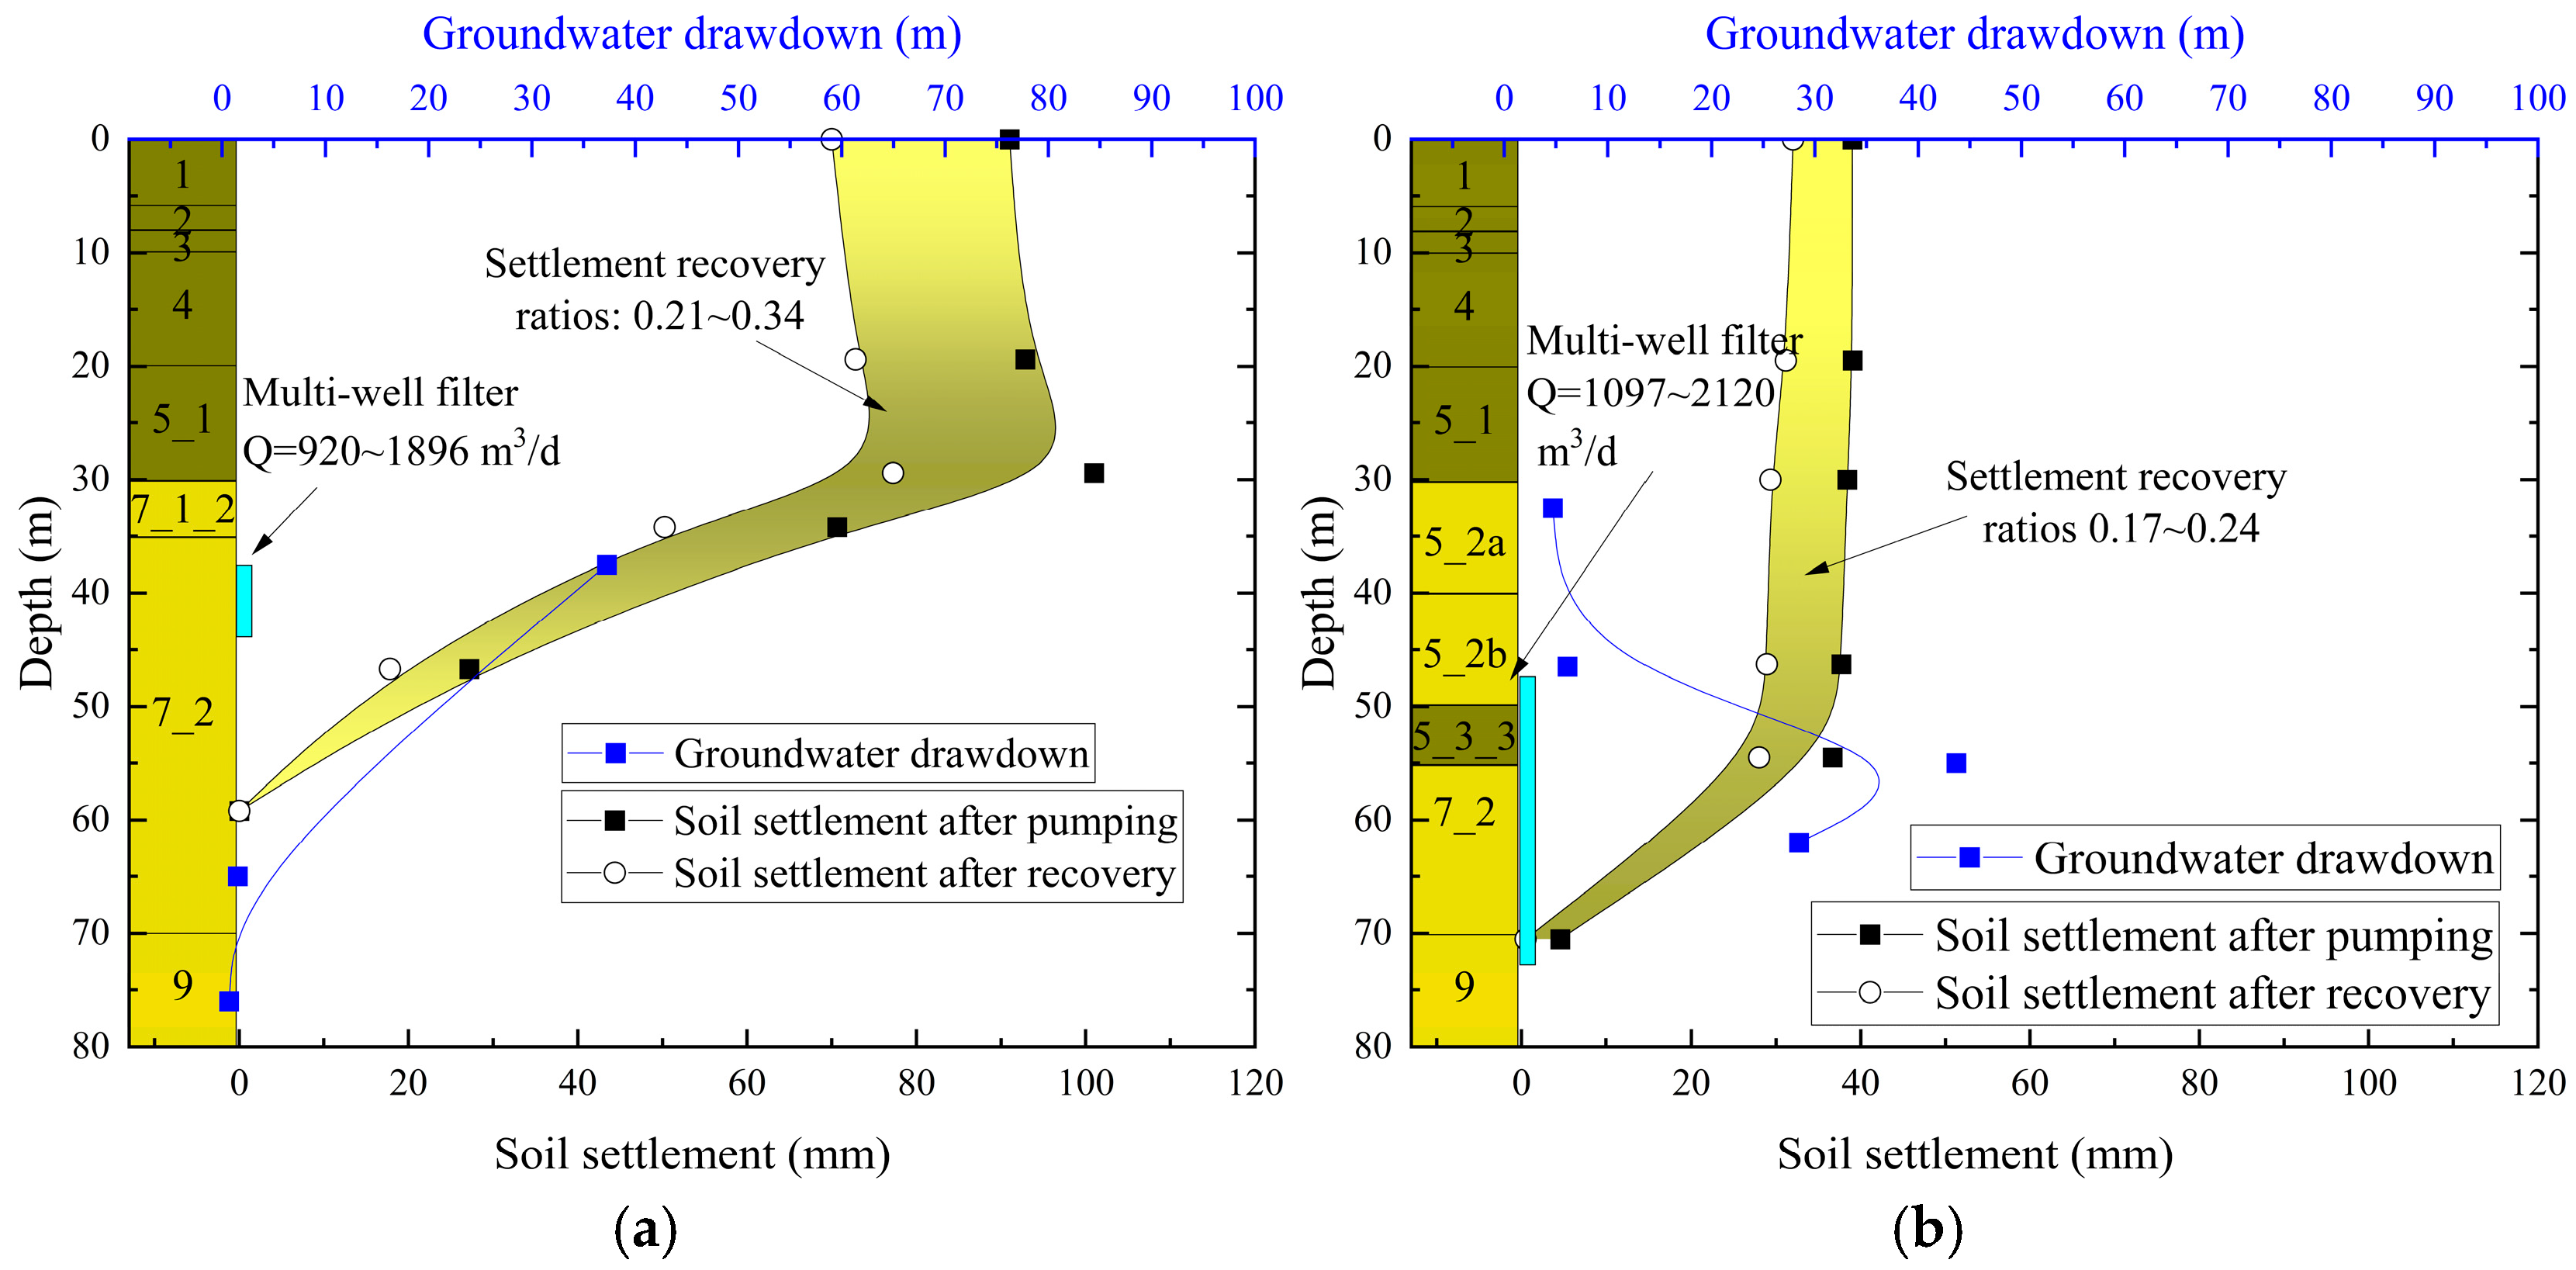
5.2. Deep Soil Settlement

Figure 14 illustrates the deep soil settlement after pumping and groundwater recovery. Due to the lack of multi-depth groundwater monitoring data at the center of the pumping well group, this study selected observation wells approximately 10 m from the well group center in the normally consolidated zone and approximately 20 m from the well group center in the paleochannel zone to systematically analyze groundwater drawdown at different depths.
In the normally consolidated zone, multi-well pumping primarily affected the middle-upper part of layer 7, with single-well pumping rates ranging between (920~1896) m3/d. Monitoring results indicated that groundwater in the middle-upper part of the 7th layer declined by about 37 m, while the groundwater at the bottom of the 7th layer and in the 9th layer remained essentially stable, which was consistent with the results obtained from previous single-well pumping tests. Notably, although conventional views suggest that maximum ground settlement caused by groundwater drawdown should occur at the ground surface, the observed maximum ground settlement in the normally consolidated zone was located at the top of layer 7. Potential explanations include variations in the horizontal distribution of deep settlement markers or tensile deformation in the overlying aquitard [4]. Regardless of the specific mechanism, the settlement at the top of the depressurized aquifer was comparable to that at the ground surface. This highlights the need to increase monitoring frequency for settlement at the top of depressurized aquifers in engineering practice, rather than focusing solely on ground surface settlement.
In the paleochannel zone, multi-well pumping was concentrated in layer 7, with single-well pumping rates in the range of (1097~2120) m3/d. Measured data indicated that the groundwater in the 7th layer declined by approximately 42 m, while the micro-confined aquifer experienced a decline of about 5 m. Unlike the normally consolidated zone, the paleochannel zone did not exhibit the phenomenon of maximum ground settlement distinctly localized at the top of the depressurized aquifer. This may be attributed to the relatively thin and permeability of the 5_3_3 layer in this region. Previous studies [4,25] have shown that maximum ground settlement is more likely to occur at the top of depressurized aquifers when the overlying aquitard has a low hydraulic conductivity.
Following groundwater recovery, soil rebound was observed at all depths. The settlement recovery ratios at various depths within the pumping well group areas of the normally consolidated zone and paleochannel zone were 0.21–0.34 and 0.17–0.24, respectively. The settlement recovery ratios were slightly higher in the normally consolidated zone than in the paleochannel zone, while locations with greater ground settlement magnitudes exhibited relatively lower settlement recovery ratios.
In summary, whether in the normally consolidated zone or in the paleochannel zone, the settlement of deep soil deserves careful monitoring. Particularly, when there are existing underground structures above the pressure-relieved aquifer, it is imperative not only to monitor surface settlement but also to focus on the settlement of the deep soil and its recovery characteristics to ensure engineering safety and long-term stability.

5.3. Hydraulic Conductivity Inversion

Based on the multi-well pumping test, a three-dimensional numerical model was established. By adjusting the permeability coefficients of aquifer layers and calibrating the simulated groundwaters against the measured data, the hydrogeological parameters of the aquifer were inversely obtained, with specific values presented in the table shown in Figure 15.
Figure 15 compares the inverted permeability coefficients with those reported in previous studies [28,29] for Shanghai area. The results demonstrate that the inverted permeability coefficients all fall within the statistically reported parameter ranges in the literature. Statistical analysis reveals that the permeability coefficients of confined aquifers in Shanghai generally satisfy the relationship:
Kh = 3–10 Kv,
where Kh and Kv represent horizontal and vertical permeability coefficients, respectively.

6. Analysis of Recharge Test Results

6.1. Groundwater Drawdown

The recharge tests including pumping tests and pumping–recharge tests were conducted in the first confined aquifer (layer 7). Pumping was initially performed according to the proposed dewatering depth described in Section 2. The groundwater drawdown in the pumping wells of the normally consolidated zone reached approximately 30 m after pumping, while that in the paleochannel zone was about 15 m. Subsequently, recharge wells were activated for natural recharge while pumping continued, achieving “simultaneous pumping and recharge within the same aquifer”. In the normally consolidated zone, two pumping wells (1K7-1, 1K7-3) and three recharge wells (1K7-4, 1K7-5, 1K7-6) were installed. In the paleochannel zone, one pumping well (3K7-1) and three recharge wells (3K7-3, 3K7-4, 3K7-5) were established.
By monitoring groundwater heads in observation wells within the same aquifer, the post-pumping drawdown (Hd) and post-recharge drawdown (Hd,g) were obtained. The groundwater recharge rate, defined as:
(Hd − Hd,g)/Hd,
was calculated and illustrated in Figure 16. In Figure 16a, the well 1G7-1 location serves as the center of the S1 test area, while in Figure 16b, the well 3G7-1 location represents the center of the S1 test area. Due to missing groundwater monitoring data from recharge wells, the post-recharge drawdown curve exhibits a two-stage variation. The results indicate that the post-pumping drawdown in the paleochannel zone was significantly smaller, with minimal groundwater recovery after recharge. Higher recharge rates were observed near recharge wells, whereas lower rates occurred near pumping wells.

6.2. Soil Settlement

Figure 17 illustrates the ground surface settlement after pumping (Sd) and the ground surface settlement after recharge (Sg), along with the calculated settlement recovery ratios:
(SdSg)/Sd.
In the normally consolidated zone, the maximum ground surface settlement after pumping was approximately 11 mm, which decreased to about 4 mm after recharge, yielding a recovery rate of approximately 0.7. This indicates that recharge exhibited significant effectiveness in controlling and even reducing ground surface settlement. In contrast, within the paleochannel zone, the drawdown caused by pumping was smaller, resulting in relatively minor ground surface settlement with a maximum value of only about 1 mm. However, a slight heave was observed across the ground surface after recharge. This phenomenon might be attributed to the well loss effect, which created a groundwater difference between the interior and exterior of the well. Although the observed groundwater remained below the initial value, the actual groundwater near the observation well area might exceed the initial level, thereby inducing minor ground surface heave.
Figure 18 presents the distribution of ground settlement and its recovery rate with depth after recharge test (including pumping test and pumping–recharge test). It can be observed that, during dewatering of the 7th aquifer layer, the maximum ground settlement in both the normally consolidated zone and the paleochannel zone occurs in the overlying aquitard, was consistent with the experimental results in Section 5.2. After recharge, ground settlement at all depths in the normally consolidated zone was reduced, while the paleochannel zone generally exhibited ground heave. The vertical distribution trends of ground settlement at the end of pumping and recharge were similar, but the recovery rates displayed an inverse pattern: areas with larger ground settlements exhibited lower recovery rates. Therefore, simply using recharge to control settlement is insufficient to alleviate the depth-dependent differences in soil settlement caused by pumping. For areas with high settlement control requirements, localized control measures, such as active grouting with a balloon-type injection, should be considered.

7. Conclusions

This study conducted pumping and recharge tests for confined aquifers in super-large deep foundation pit group sites to investigate the hydraulic connectivity between aquifers, the relationship between groundwater drawdown and soil settlement, and the effectiveness of same-layer recharge for settlement control. The main conclusions are as follows:
(1)
A certain hydraulic connectivity exists between the 7th and 9th layers at the site, with strong hydraulic recharge between these two aquifers. The groundwater rapidly recovers once pumping is stopped. Therefore, during subsequent foundation pit construction, pumping should not be interrupted and a backup pumping well should be provided. The 5th layer in the paleochannel zone exhibits poor hydraulic recharge, allowing pumping interruptions to be controlled within 20 min. The aquitard between the 5th and 7th layers in the paleochannel zone is insufficient to completely block hydraulic connectivity, resulting in leakage between these two layers.
(2)
Ground surface settlement significantly lags behind groundwater variations in both the normally consolidated zone and paleochannel zone. Although settlement decreases after groundwater recovery, the settlement recovery rate reaches only 20%, indicating 80% plastic deformation. The ratio of ground surface settlement to groundwater drawdown remains consistent in both zones at approximately 3.4 mm/m.
(3)
Soil settlement in the overlying aquitard caused by confined aquifer dewatering is comparable to or even greater than ground surface settlement. Therefore, attention should not be limited solely to surface settlement. In particular, when existing underground structures are present above the de-pressurized aquifer, it is necessary to increase the monitoring frequency of the settlement and structural behavior at the top of the de-pressurized aquifer.
(4)
Both the normally consolidated zone and the paleochannel zone can employ recharge to control or even reduce settlement resulting from groundwater drawdown. However, relying solely on recharge cannot fully address the differential settlement along depth caused by pumping. During design and construction, comprehensive consideration should be paid to target dewatering depth, ground settlement control, and deformation requirements of protected structures to ensure both the safety and cost-effectiveness of the dewatering–recharge scheme.

Author Contributions

Conceptualization: S.W., W.W. and Z.X.; methodology: Q.S.; software: W.W. and Q.S.; validation: S.W., Z.X. and W.W.; formal analysis: S.W. and Z.X.; investigation: Q.S.; re- sources: W.W. and J.Q.; data curation: W.W. and Q.S.; writing—original draft preparation: S.W.; writing—review and editing: Z.X.; visualization: S.W.; supervision: J.Q.; project administration: W.W. and J.Q.; funding acquisition: Z.X. All authors have read and agreed to the published version of the manuscript.

Funding

This research was funded by the Natural Science Foundation of Shanghai (Grant No. 23ZR1414700) and the Shanghai Municipal Science and Technology Major Project for Social Development (Grant No. 22DZ1202900).

Data Availability Statement

Data are contained within the article.

Conflicts of Interest

Authors Weidong Wang, Zhonghua Xu and Qingjun Song were employed by East China Architecture Design & Research Institute Co., Ltd. The remaining authors declare that the research was conducted in the absence of any commercial or financial relationships that could be construed as a potential conflict of interest.

References

  1. Li, X.; Liu, T.; Ju, S.; Guo, Y. Optimization and Impact Assessment of Excavation Sequence around Subway Stations from the Perspective of Sustainable Urban Development. Buildings 2024, 14, 1767. [Google Scholar] [CrossRef]
  2. Oka, F.; Takada, N.; Shimono, K.; Higo, Y.; Kimoto, S. A Large-Scale Excavation in Soft Holocene Deposit and Its Elasto-Viscoplastic Analysis. Acta Geotech. 2016, 11, 625–642. [Google Scholar] [CrossRef]
  3. Li, M.G.; Chen, J.J.; Xia, X.H.; Zhang, Y.Q.; Wang, D.F. Statistical and Hydro-Mechanical Coupling Analyses on Groundwater Drawdown and Soil Deformation Caused by Dewatering in a Multi-Aquifer-Aquitard System. J. Hydrol. 2020, 589, 125365. [Google Scholar] [CrossRef]
  4. Zeng, C.F.; Wang, S.; Xue, X.L.; Zheng, G.; Mei, G.X. Evolution of Deep Ground Settlement Subject to Groundwater Drawdown during Dewatering in a Multi-Layered Aquifer-Aquitard System: Insights from Numerical Modelling. J. Hydrol. 2021, 603, 127078. [Google Scholar] [CrossRef]
  5. Liu, B.; Zhang, D.W.; Wang, Y.Y.; Wang, N.N.; Xu, W. Design Optimization and Observed Performance of a Super-Large Foundation Pit Excavation Subjected to Unsymmetrical Loading in Water-Rich Floodplain: A Case Study. Soils Found. 2023, 63, 101329. [Google Scholar] [CrossRef]
  6. Liu, Y.; Xiang, B.H.; Fu, M.F. Observed Performance of a Large-Scale Deep Triangular Excavation in Shanghai Soft Clays. Geotech. Geol. Eng. 2019, 37, 2791–2809. [Google Scholar] [CrossRef]
  7. Lei, H.Y.; Zhan, B.S.; Feng, S.X.; Amin, M. Influence of Foundation Pit Groups’ Excavation on the Deformation Characteristics of Adjacent Railway Subgrade and Protection Measures. Geotech. Geol. Eng. 2023, 41, 3877–3895. [Google Scholar] [CrossRef]
  8. Pujades, E.; Jurado, A. Groundwater-Related Aspects during the Development of Deep Excavations below the Water Table: A Short Review. Undergr. Space 2021, 6, 35–45. [Google Scholar] [CrossRef]
  9. Zhang, D.M.; Xie, X.C.; Zhou, M.L.; Huang, Z.K.; Zhang, D.M. An Incident of Water and Soil Gushing in a Metro Tunnel Due to High Water Pressure in Sandy Silt. Eng. Fail. Anal. 2021, 121, 105196. [Google Scholar] [CrossRef]
  10. Chen, Z.; Huang, J.T.; Zhan, H.B.; Wang, J.G.; Dou, Z.; Zhang, C.J.; Chen, C.S.; Fu, Y.S. Optimization Schemes for Deep Foundation Pit Dewatering under Complicated Hydrogeological Conditions Using MODFLOW-USG. Eng. Geol. 2022, 303, 106653. [Google Scholar] [CrossRef]
  11. Peng, C.X.; Liu, N.W.; Li, M.G.; Zhen, L.; Chen, J.J. Hydro-Mechanical Coupled Analyses on Wall Deformations Caused by Deep Excavations and Dewatering in a Confined Aquifer. Acta Geotech. 2022, 17, 2465–2479. [Google Scholar] [CrossRef]
  12. Deng, Y.S.; Guo, Y.J.; Zou, B.P.; Wang, J.X.; Liu, X.T.; Chen, Q.Z.; Kong, B.W.; Liang, S.J. Failure Analysis and Zoning Control of Water Gushing in Foundation Pit. Eng. Fail. Anal. 2023, 145, 107029. [Google Scholar] [CrossRef]
  13. Chu, Y.; Shi, J.; Ye, Z.; Liu, D. Dewatering Characteristics and Drawdown Prediction of Suspended Waterproof Curtain Foundation Pit in Soft Soil Areas. Buildings 2024, 14, 119. [Google Scholar] [CrossRef]
  14. Xu, Y.S.; Shen, S.L.; Ma, L.; Sun, W.J.; Yin, Z.Y. Evaluation of the Blocking Effect of Retaining Walls on Groundwater Seepage in Aquifers with Different Insertion Depths. Eng. Geol. 2014, 183, 254–264. [Google Scholar] [CrossRef]
  15. Wu, Y.X.; Shen, S.L.; Yuan, D.J. Characteristics of Dewatering Induced Drawdown Curve under Blocking Effect of Retaining Wall in Aquifer. J. Hydrol. 2016, 539, 554–566. [Google Scholar] [CrossRef]
  16. Zhou, N.Q.; Vermeer, P.A.; Lou, R.X.; Tang, Y.Q.; Jiang, S.M. Numerical Simulation of Deep Foundation Pit Dewatering and Optimization of Controlling Land Subsidence. Eng. Geol. 2010, 114, 251–260. [Google Scholar] [CrossRef]
  17. Zhang, Y.Q.; Li, M.G.; Wang, J.H.; Chen, J.J.; Zhu, Y.F. Field Tests of Pumping-Recharge Technology for Deep Confined Aquifers and Its Application to a Deep Excavation. Eng. Geol. 2017, 228, 249–259. [Google Scholar] [CrossRef]
  18. Pujades, E.; De Simone, S.; Carrera, J.; Vázquez-Suñé, E.; Jurado, A. Settlements around Pumping Wells: Analysis of Influential Factors and a Simple Calculation Procedure. J. Hydrol. 2017, 548, 225–236. [Google Scholar] [CrossRef]
  19. Zhou, X.J.; Burbey, T.J. Deformation Characteristics of a Clayey Interbed during Fluid Injection. Eng. Geol. 2014, 183, 185–192. [Google Scholar] [CrossRef]
  20. Zhang, Y.Q.; Wang, J.H.; Chen, J.J.; Li, M.G. Numerical Study on the Responses of Groundwater and Strata to Pumping and Recharge in a Deep Confined Aquifer. J. Hydrol. 2017, 548, 342–352. [Google Scholar] [CrossRef]
  21. Zheng, G.; Cao, J.R.; Cheng, X.S.; Ha, D.; Wang, F.J. Experimental Study on the Artificial Recharge of Semiconfined Aquifers Involved in Deep Excavation Engineering. J. Hydrol. 2018, 557, 868–877. [Google Scholar] [CrossRef]
  22. Zeng, C.F.; Zheng, G.; Xue, X.L. Responses of Deep Soil Layers to Combined Recharge in a Leaky Aquifer. Eng. Geol. 2019, 260, 105263. [Google Scholar] [CrossRef]
  23. Zeng, C.F.; Liao, H.; Xue, X.L.; Long, S.C.; Luo, G.J.; Diao, Y.; Li, M.G. Responses of Groundwater and Soil to Dewatering Considering the Barrier Effect of Adjacent Metro Station on Multi-Aquifers. J. Hydrol. 2022, 612, 128117. [Google Scholar] [CrossRef]
  24. Li, M.G.; Zhang, Z.J.; Chen, J.J. Zoned and Staged Construction of an Underground Complex in Shanghai Soft Clay. Tunn. Undergr. Space Technol. 2017, 67, 187–200. [Google Scholar] [CrossRef]
  25. Zeng, C.F.; Wang, S.; Xue, X.L. Characteristics of Ground Settlement Due to Combined Actions of Groundwater Drawdown and Enclosure Wall Movement. Acta Geotech. 2022, 17, 4095–4112. [Google Scholar] [CrossRef]
  26. Xu, Y.S.; Yan, X.X.; Shen, S.L.; Zhou, A.N. Experimental Investigation on the Blocking of Groundwater Seepage from a Waterproof Curtain during Pumped Dewatering in an Excavation. Hydrogeol. J. 2019, 27, 2659–2672. [Google Scholar] [CrossRef]
  27. Wang, J.X.; Liu, X.T.; Wu, Y.B.; Liu, S.L.; Wu, L.G.; Lou, R.X.; Lu, J.S.; Yin, Y. Field Experiment and Numerical Simulation of Coupling Non-Darcy Flow Caused by Curtain and Pumping Well in Foundation Pit Dewatering. J. Hydrol. 2017, 549, 277–293. [Google Scholar] [CrossRef]
  28. Shen, S.L.; Xu, Y.S. Numerical Evaluation of Land Subsidence Induced by Groundwater Pumping in Shanghai. Can. Geotech. J. 2011, 48, 1378–1392. [Google Scholar] [CrossRef]
  29. Li, X.W.; Xu, Y.S.; Wang, X.W. Analysis of Factors Affecting the Groundwater Level during Foundation Pit Dewatering in the Soft Soil Area: A Review. Environ. Earth Sci. 2024, 83, 526. [Google Scholar] [CrossRef]
Figure 1. Plane view of the proposed super-large deep foundation pit groups.
Buildings 15 01383 g001
Figure 2. Typical geological sections in the site.
Buildings 15 01383 g002
Figure 3. Layout of ground surface settlement monitoring points.
Buildings 15 01383 g003
Figure 4. Layout of the test wells and deep ground settlement monitoring points: (a) normally consolidated zone and (b) paleochannel zone.
Buildings 15 01383 g004
Figure 5. Structures of pumping and observation wells and their relative positions to the soil layers.
Buildings 15 01383 g005
Figure 6. The groundwater drawdown time curves obtained from single-well pumping tests: (a) normally consolidated zone and (b) paleochannel zone.
Buildings 15 01383 g006
Figure 7. The spatial distribution of steady-state groundwater drawdown during single-well pumping in the normally consolidated zone: pumping from (a) the upper, (b) middle-upper, (c) the deep part of layer 7 and (d) layer 9.
Buildings 15 01383 g007
Figure 8. The spatial distribution of steady-state groundwater drawdown during single-well pumping in the paleochannel zone: pumping from (a) layer 5_2a, (b) layer 5_2b, and (c) layer 7.
Buildings 15 01383 g008
Figure 9. Hd-lgr curve of the aquifer during the single-well pumping test.
Buildings 15 01383 g009
Figure 10. The time–history curves of ground surface settlement during the multi-well pumping test: (a) normally consolidated zone and (b) paleochannel zone.
Buildings 15 01383 g010
Figure 11. The spatial distribution of ground surface settlement after pumping: (a) normally consolidated zone and (b) paleochannel zone.
Buildings 15 01383 g011
Figure 12. The spatial distribution of ground surface settlement after groundwater recovery: (a) normally consolidated zone and (b) paleochannel zone.
Buildings 15 01383 g012
Figure 13. The spatial distribution of settlement recovery ratios: (a) normally consolidated zone and (b) paleochannel zone.
Buildings 15 01383 g013
Figure 14. The deep soil settlement after pumping and groundwater recovery: (a) normally consolidated zone and (b) paleochannel zone.
Buildings 15 01383 g014
Figure 15. The inverted permeability coefficients compares with those reported in previous studies for the Shanghai area (Shen (2011) [28], Li (2024) [29]).
Buildings 15 01383 g015
Figure 16. The groundwater drawdown and groundwater recharge rate after recharge test (including pumping test and pumping–recharge test): (a) normally consolidated zone and (b) paleochannel zone.
Buildings 15 01383 g016
Figure 17. The ground surface settlement and settlement recovery ratios after recharge test: (a) normally consolidated zone and (b) paleochannel zone.
Buildings 15 01383 g017
Figure 18. The distribution of ground settlement and settlement recovery rate with depth after recharge test: (a) normally consolidated zone and (b) paleochannel zone.
Buildings 15 01383 g018
Table 1. Pumping test conditions.
Test AreaTest StagePumping WellDuration (d)
TotalPumpingRecovery
S1
(Normally consolidated zone)
Single-well pumping test1G7-1 (Upper 7th Layer)3 1.51.5
1K7-5 (Mid-upper 7th Layer)
1K7-8 (Deep 7th Layer)
1K9-1 (9th Layer)
Multi-well pumping tests1K7-1~1K7-616 97
S3
(Paleochannel zone)
Single-well pumping test3K52-152.22.8
3K53-163.22.8
3K7-2312
Multi-well pumping tests3K7-1~3K7-617107
Table 2. Recharge tests conditions.
Test AreaPumping WellRecharge WellPumping Duration (d)Pumping–Recharge Duration (d)
S1
(Normally consolidated zone)
1K7-1, 1K7-31K7-4~1K7-611
S3
(Paleochannel zone)
3K7-13K7-3~3K7-511
Disclaimer/Publisher’s Note: The statements, opinions and data contained in all publications are solely those of the individual author(s) and contributor(s) and not of MDPI and/or the editor(s). MDPI and/or the editor(s) disclaim responsibility for any injury to people or property resulting from any ideas, methods, instructions or products referred to in the content.

