Article

Application of Advanced Multi-Parameter Monitoring in Concrete Structure Defect Detection: Integrating Thermal Integrity Profiling and Strain Analysis

1
Jinan Transportation Development Investment Co., Ltd., Jinan 250014, China
2
Department of Geotechnical Engineering, Tongji University, 1239 Siping Road, Shanghai 200092, China
*
Author to whom correspondence should be addressed.
Buildings 2025, 15(8), 1350; https://doi.org/10.3390/buildings15081350
Submission received: 27 February 2025 / Revised: 27 March 2025 / Accepted: 1 April 2025 / Published: 18 April 2025

Abstract

:
Thermal Integrity Profiling (TIP) effectively monitors concrete integrity. TIP detects structural defects and locates them through anomalies in hydration–temperature curves. However, TIP alone cannot accurately identify the defect types. To resolve this limitation, strain monitoring is integrated with TIP. A dual-parameter temperature–strain monitoring system using fiber-optic sensing was implemented in a diaphragm wall of Weizishan Station, Jinan. This study investigated the spatial distribution and variation patterns of concrete temperature–strain during the different stages of hydration. A thermal–mechanical–chemical multi-field coupling model was established based on the concrete mix ratio and the theoretical thermal parameters, and its feasibility was verified. This study also analyzed the impact mechanisms of four defect types—voids, mud inclusions, necking, and widening—on the surrounding concrete’s heat release and deformation during hydration. It presents specific hydration–temperature–strain characteristic curves that can accurately differentiate the defect types and established the correspondence between the defect types and these characteristic patterns. Finally, a rapid and accurate defect identification process is proposed for practical application, improving efficiency and precision in detecting anomalies. The findings provide a reference for implementing appropriate defect prevention and remediation measures on-site and hold promise for enhancing the prediction and control of defects during the hydration period of concrete structures.

1. Introduction

Underground continuous wall (UCW) systems have become the preferred form of retaining structure in deep foundation pits due to their reliable performance and dual role in support and structural load-bearing [1,2]. However, various factors such as the construction conditions, geology, and workmanship can introduce defects (e.g., voids, mud inclusions, necking, and misalignment) that jeopardize UCW integrity [3,4]. Undetected defects severely threaten the stability of foundation pits, making it difficult to assess the wall capacity or take timely corrective measures. Thus, the rapid and effective quality monitoring of UCWs is crucial for ensuring safety [5].
Ensuring UCW construction quality is challenging because the wall is deeply embedded and largely concealed in soil [3,6]. The traditional integrity detection methods (core sampling, acoustic transmission, impact echoes, resistivity, etc.) each have limitations [7]. For example, core sampling provides direct evidence, but is destructive and may miss the defects between cores [8]. Acoustic methods (e.g., cross-hole sonic logging) rely on pre-installed pipes and suffer from signal attenuation in concrete, making them less effective for large-scale walls [9,10]. Impact echoes can only roughly locate defects and cannot determine their nature or size [11,12]. Electrical resistivity requires a high data density for accuracy, resulting in low efficiency, and serves only as an auxiliary tool. To meet the demands of large, deep excavations and overcome these limitations, other researchers have developed new non-destructive monitoring technologies for concrete quality [13,14].
Temperature-based methods have shown particular promise. The Temperature Tracer Method (TTM) [15,16], as introduced by Fengfei He et al., has been widely employed in the structural health monitoring of underground structures, pipelines, and concrete structures due to its distinct advantages of distributed monitoring capabilities, good stability, low cost, and environmental friendliness. In addition to the temperature-based methods, ultrasonic coda wave (UCW) monitoring offers a complementary high-resolution approach. UCW is highly sensitive to subtle internal changes, enabling the detection of minute defects, such as micro-cracks and stress changes that may not manifest in global temperature trends. Despite the challenges in data interpretation due to environmental influences, UCW can directly sense internal structural defects, enhancing structural integrity assessments. Moreover, environmental temperature effects, such as daily and seasonal fluctuations, can induce structural deformations, further complicating monitoring efforts. Recent studies have integrated environmental temperature data with advanced remote sensing technologies, like the Multi-Temporal Interferometry Synthetic Aperture Radar (MTInSAR)-based early warning system developed by Mirko Calò et al. [17]. This system integrates environmental temperature data and satellite radar information to monitor deformation in simply supported concrete bridges, highlighting the crucial role of temperature in assessing structural health. Fiber-optic sensing technology, with its capabilities for rapid, continuous data acquisition and strong anti-interference, has also attracted significant attention. This technology has been applied to the Thermal Integrity Profiling (TIP) of concrete and achieved promising defect detection results. TIP, which leverages embedded fiber-optic temperature sensors, has been successfully used to assess the integrity of cast-in-place deep foundations for the last decade. Compared to the conventional sonic or coring tests, TIP provides real-time, full-length temperature profiles of curing concrete, enabling earlier and more comprehensive anomaly detection [18].
The principle behind TIP is to exploit the heat released during hydration during concrete curing. As cement hydrates, it releases heat; defects (e.g., inclusions or cross-sectional changes) locally alter the thermal profile [19,20]. By embedding distributed temperature sensors (e.g., fiber-optic cables or Bragg grating arrays) along the reinforcement prior to casting, one can continuously monitor the internal temperature rise [21,22]. Any abnormal temperature drop or deviation indicates a potential defect region. Some studies have shown that this method yields continuous, high-precision data for quantitative internal quality assessment, offering substantial advantages over the older techniques. For instance, TIP outperforms conventional cross-hole sonic logging in anomaly detectability and coverage, while also reducing the testing costs. Furthermore, Sun et al. [8] enhanced TIP interpretation by integrating finite element simulations of pile curing, which significantly increased the anomaly detection accuracy relative to that of the standard empirical methods. However, hydration–temperature as a single diagnostic parameter has its limitations. Different defect types can sometimes produce similar temperature anomalies, impeding confident identification. For example, Sun et al. [20] demonstrated that distributed temperature profiles can distinguish various pile defect types based on characteristic heat loss signatures. Nonetheless, certain defect scenarios yield overlapping thermal responses, making it difficult to uniquely identify the defect nature from the temperature data alone [23,24].
Increasing evidence suggests that incorporating mechanical strain monitoring can resolve some of these ambiguities [25,26]. The abnormal deformation behavior of new concrete (e.g., unusual strain spikes or distortions during curing) often correlates with internal flaws [27,28]. Thus, tracking the strain evolution alongside temperature is essential for a more complete integrity assessment [29]. Recently made concrete undergoes thermal expansion, autogenous and drying shrinkage, and creep; excessive or non-uniform strain may indicate cracking or weak zones, making strain a critical indicator of structural health [30,31]. Measuring the strain in curing concrete is challenging due to concrete’s early-stage properties and the multitude of influencing factors, and until recently there has been limited research linking distributed strain profiles to specific defect types in situ [32,33]. Some initial studies have applied distributed fiber-optic strain sensing in cast-in-place piles, obtaining that high-resolution strain data can be collected during curing. However, those works focused on the overall structural behavior and did not develop robust criteria to identify the defect signatures from the strain data. In other words, a comprehensive monitoring framework combining temperature and strain metrics had yet to be fully established. This gap pointed to the urgent need for a rapid, accurate, and easily interpretable multi-parameter monitoring method for UCWs, one capable of determining the defect type, location, and characteristics, thereby guiding timely remediation.
Against this background, this study innovatively builds upon conventional TIP by introducing simultaneous strain measurement as part of the monitoring system [34,35,36], offering a new multi-parameter approach. Notably, unlike most previous TIP research that focused on concrete piles, our work applies combined temperature–strain monitoring to an underground continuous wall, extending integrity monitoring to this different structural context [37]. Fiber-optic sensors were used to capture both the hydration–temperature and the strain of the wall, providing a more thorough, dual-modal dataset for analysis [38]. During hydration, different defect types induce distinctive patterns in temperature and strain. Temperature anomalies primarily reflect the changes in heat release, while strain anomalies can reveal localized deformation and stress concentrations [39]. By analyzing the two signals together, one can more accurately pinpoint the abnormal zones in the UCW and infer the likely defect types, significantly improving the accuracy and reliability of defect identification. In summary, the synergy of temperature and strain monitoring yields a multidimensional defect signature, greatly improving identification confidence compared to that of temperature-only diagnostics [40]. Nevertheless, prior to our work, research on such integrated temperature–strain evaluation remained nascent, with many fundamental issues (e.g., quantitative defect characterization and automated interpretation) yet to be fully addressed.
This study focuses on the underground continuous wall of Weizishan Station in Jinan as an engineering case study. Bragg fiber grating temperature–strain sensors were employed to perform the real-time monitoring of the hydration process, capturing the spatial and temporal evolution of temperature and strain in the concrete. Based on the physical and thermal properties of the concrete obtained from the field measurements, a high-fidelity thermal–mechanical–chemical multi-field finite element model was developed and validated. Utilizing this model, a series of numerical simulations were carried out to investigate the thermal integrity and strain responses in concrete structures containing different types of defect. This paper is structured as follows: Section 2 outlines the field implementation of the multi-parameter monitoring system, including the deployment of Thermal Integrity Profiling (TIP) and the strain sensors and the recording of temperature and strain behaviors during hydration. Section 3 describes the development and validation of the coupled finite element model. Section 4 presents the analysis of the four representative defect types—voids, mud inclusions, necking, and widening—highlighting their respective effects on the hydration-induced responses. Section 5 proposes a practical defect identification framework based on the combined temperature–strain data. This integrated approach not only enables the rapid and accurate identification of defect types during construction, but also supports long-term structural health monitoring, contributing to the safety and durability of underground concrete structures.

2. Field Monitoring of Temperature and Strain in Underground Continuous Walls During Hydration

To investigate the spatial distribution and evolution of hydration–temperature and strain in underground continuous walls, field monitoring experiments were conducted at a subway station’s underground continuous wall project. This study examined the heat release and temperature rise during concrete hydration at different stages, along with the temporal changes in concrete strain. These findings provide crucial data support for the development of the subsequent thermal–mechanical–chemical multi-field coupling model.

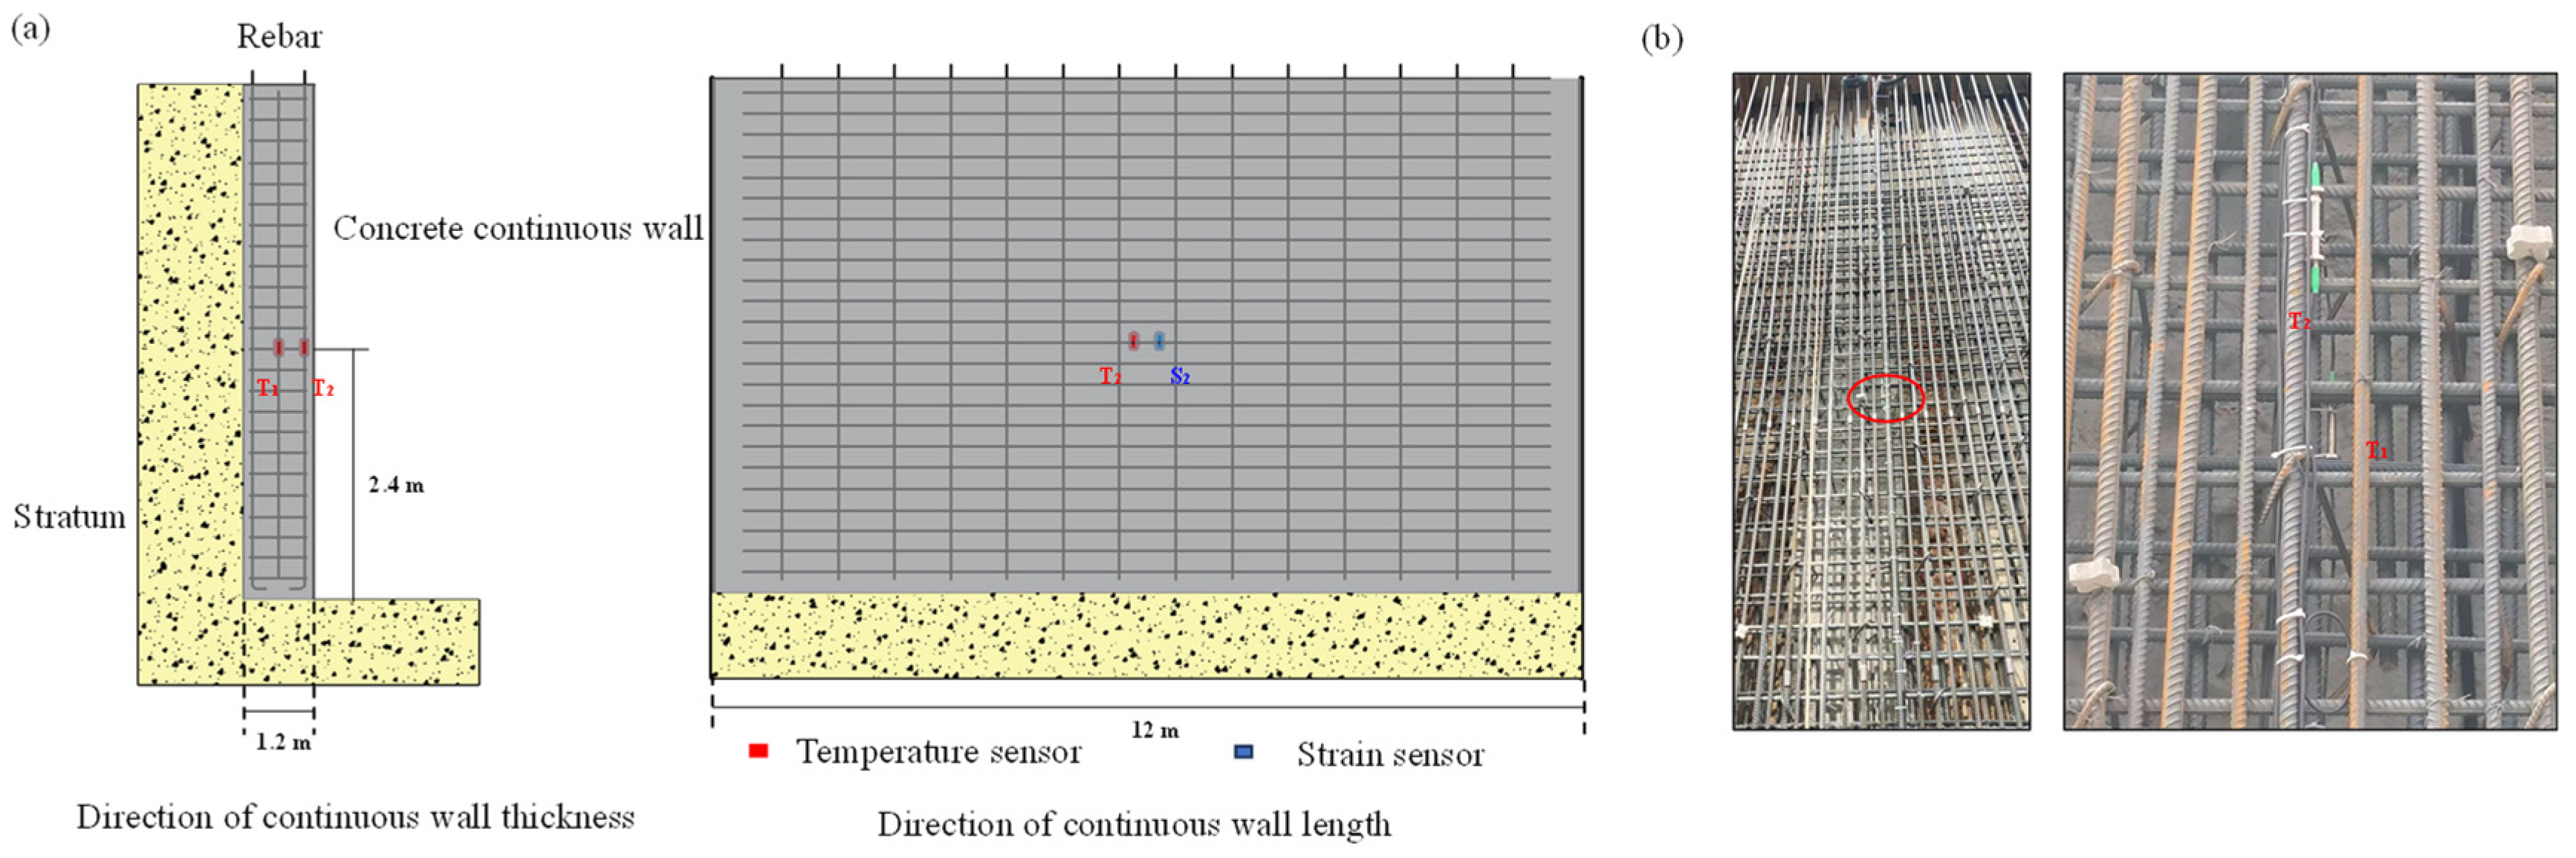
2.1. Project Overview

Weizishan Station is located in Jinan, Shandong Province, China. It is an underground station with two levels and a single-island platform. The station uses a combined “two-wall integrated” structure, where the retaining and main structures are integrated. The underground continuous wall has a thickness of 1.2 m and is connected using the “roughening + rebar anchoring” method. Concrete strength is rated C45, with double-layer, bidirectional reinforcement (Φ25@100mm), grade II steel. The protective layer thickness of upper steel reinforcement is 25 mm. After the model was poured, the side walls were insulated with wooden formwork, while the top surface was insulated using a thin film and burlap. The continuous wall was poured over a length of 12 m and a height of 4.8 m. The formwork was removed 48 h after concrete pouring, and further curing was carried out.

2.2. Sensors and Monitoring Plan

This project uses a real-time, dynamic Bragg fiber-optic grating monitoring system. Fiber Bragg grating (FBG) sensors detect the changes in external parameters, such as temperature and strain, by modulating the Bragg center wavelength. This type of fiber-optic sensor operates by using a broadband light source, which travels along the fiber core. After passing through the grating period, part of the light is reflected back along the core, forming reflected light, while the remaining light forms transmitted light. Changes in physical parameters like strain and temperature alter the Bragg grating’s center wavelength, causing it to shift (Figure 1). The basic expression for the reflected wavelength of the fiber grating is [41]:
λB = 2neff · Λ
In this equation, λB represents the center wavelength of the FBG; neff is the effective refractive index of the fiber core; and Λ is the modulation period of the fiber grating’s refractive index. Equation (1) represents the fundamental Bragg condition for FBG sensors. It indicates that a specific wavelength λB will be strongly reflected when the grating period (Λ) and the fiber’s effective refractive index (neff) satisfy this relationship. Physically, if either Λ or neff changes (for example due to strain or temperature), the Bragg wavelength shifts accordingly. This principle underpins the operation of FBG sensors, as external stimuli can be detected by monitoring the resulting shifts in the reflected wavelength.
The refractive index of the FBG varies periodically along the fiber axis, offering excellent wavelength selectivity. Incident light that satisfies the Bragg diffraction condition (with a wavelength of λB) is coupled and reflected at the FBG, while light of other wavelengths passes through unaffected. As shown in Figure 1, the reflection spectrum exhibits a peak at the center wavelength λB of the FBG. Both temperature and strain changes can cause shifts in λB, following the linear relationship described by Equation (2):
Δ λ λ B = ( 1 P e ) ε + ( α + ζ ) Δ T
In this equation, Δ λ represents the change in the FBG wavelength, ε is the axial strain in the fiber, Δ T is temperature change, P e is the fiber’s photoelastic coefficient, α is the fiber’s thermal expansion coefficient, and ζ is the fiber’s thermo-optic coefficient [42]. Equation (2) quantitatively relates the fractional change in Bragg wavelength ( Δ λ λ B ) to the applied strain and temperature change. The first term, ( 1 P e ) ε , represents the effect of mechanical strain; stretching the fiber ( ε ) increases the grating period and alters the refractive index via the photoelastic effect, producing a proportional shift in λ B . The second term, ( α + ζ ) Δ T , represents thermal effects; a temperature rise causes the fiber to expand ( α ) and its refractive index to change ( ζ ), together shifting. This linear model underpins the FBG sensor’s ability to simultaneously measure strain and temperature by distinguishing their respective contributions to the wavelength shift.
Based on the above principles, this system enables the dynamic and precise measurement of both temperature and strain in structures. It features corrosion resistance, immunity to electromagnetic interference, and lightning protection. Additionally, due to the lightweight and flexible nature of optical fibers, the sensors are compact and lightweight, making installation easier. Moreover, the sensors have minimal impact on the material properties and mechanical parameters of the installation site, allowing for non-destructive embedding. Fiber Bragg grating (FBG) strain and temperature sensors are embedded at different locations within the wall, allowing for multi-channel remote monitoring via a bus system. These sensors are connected to an FBG wireless demodulator for the real-time, automatic collection and storage of strain and hydration–temperature data.
To investigate the evolution of temperature and strain during the hydration period of the continuous wall, two monitoring sections were set up along the wall’s thickness direction: one at the center layer and one at the outer layer. The temperature and strain measurement points were arranged at both the sections, with the temperature sensors for the center and outer layers labeled T1 and T2, respectively, and the strain sensors labeled S1 and S2. The outer layer monitoring points are located approximately 300 mm from the wall surface, while the center layer points are about 600 mm away. Both the points are located at an absolute height of 2400 mm. The FBG temperature and strain sensors were installed using the main reinforcement binding method. A diagram of the sensor layout is shown in Figure 2.
Given the thin wall thickness, efforts were made to minimize the impact of sensor embedding on the quality of concrete pouring. To avoid sensor damage during concrete vibration, the sensors were securely fixed, and their lead wires were organized, marked, and protected. During the concrete pouring process, the sensors and their lead wires were not to be directly impacted by the material, and the vibrator should not come into contact with the sensors or lead wires. A full-process monitoring approach was implemented to ensure the safety of the sensors, lead wires, and measuring instruments. All the fiber Bragg grating (FBG) temperature and strain sensors were factory-calibrated by the manufacturer, and their accuracy was verified under controlled laboratory conditions prior to deployment. Although no independent reference sensors (such as thermocouples or resistive strain gauges) were used for side-by-side calibration, manufacturer-provided calibration curves were used to convert the raw sensor measurements to engineering units. The consistency of sensor readings was also checked before and after the monitoring period to ensure a stable performance and measurement accuracy. The monitoring began immediately after the completion of concrete pouring, with a monitoring period of 28 days and a frequency of every 0.2 h.

2.3. Analysis of Monitoring Results

The temperature evolution curves at the different monitoring points of the continuous wall during hydration are shown in Figure 3a. The temperature trends at all the points are generally consistent, with each point experiencing an initial increase followed by a decrease. Based on the temperature curve, the hydration–temperature change can be divided into three stages:
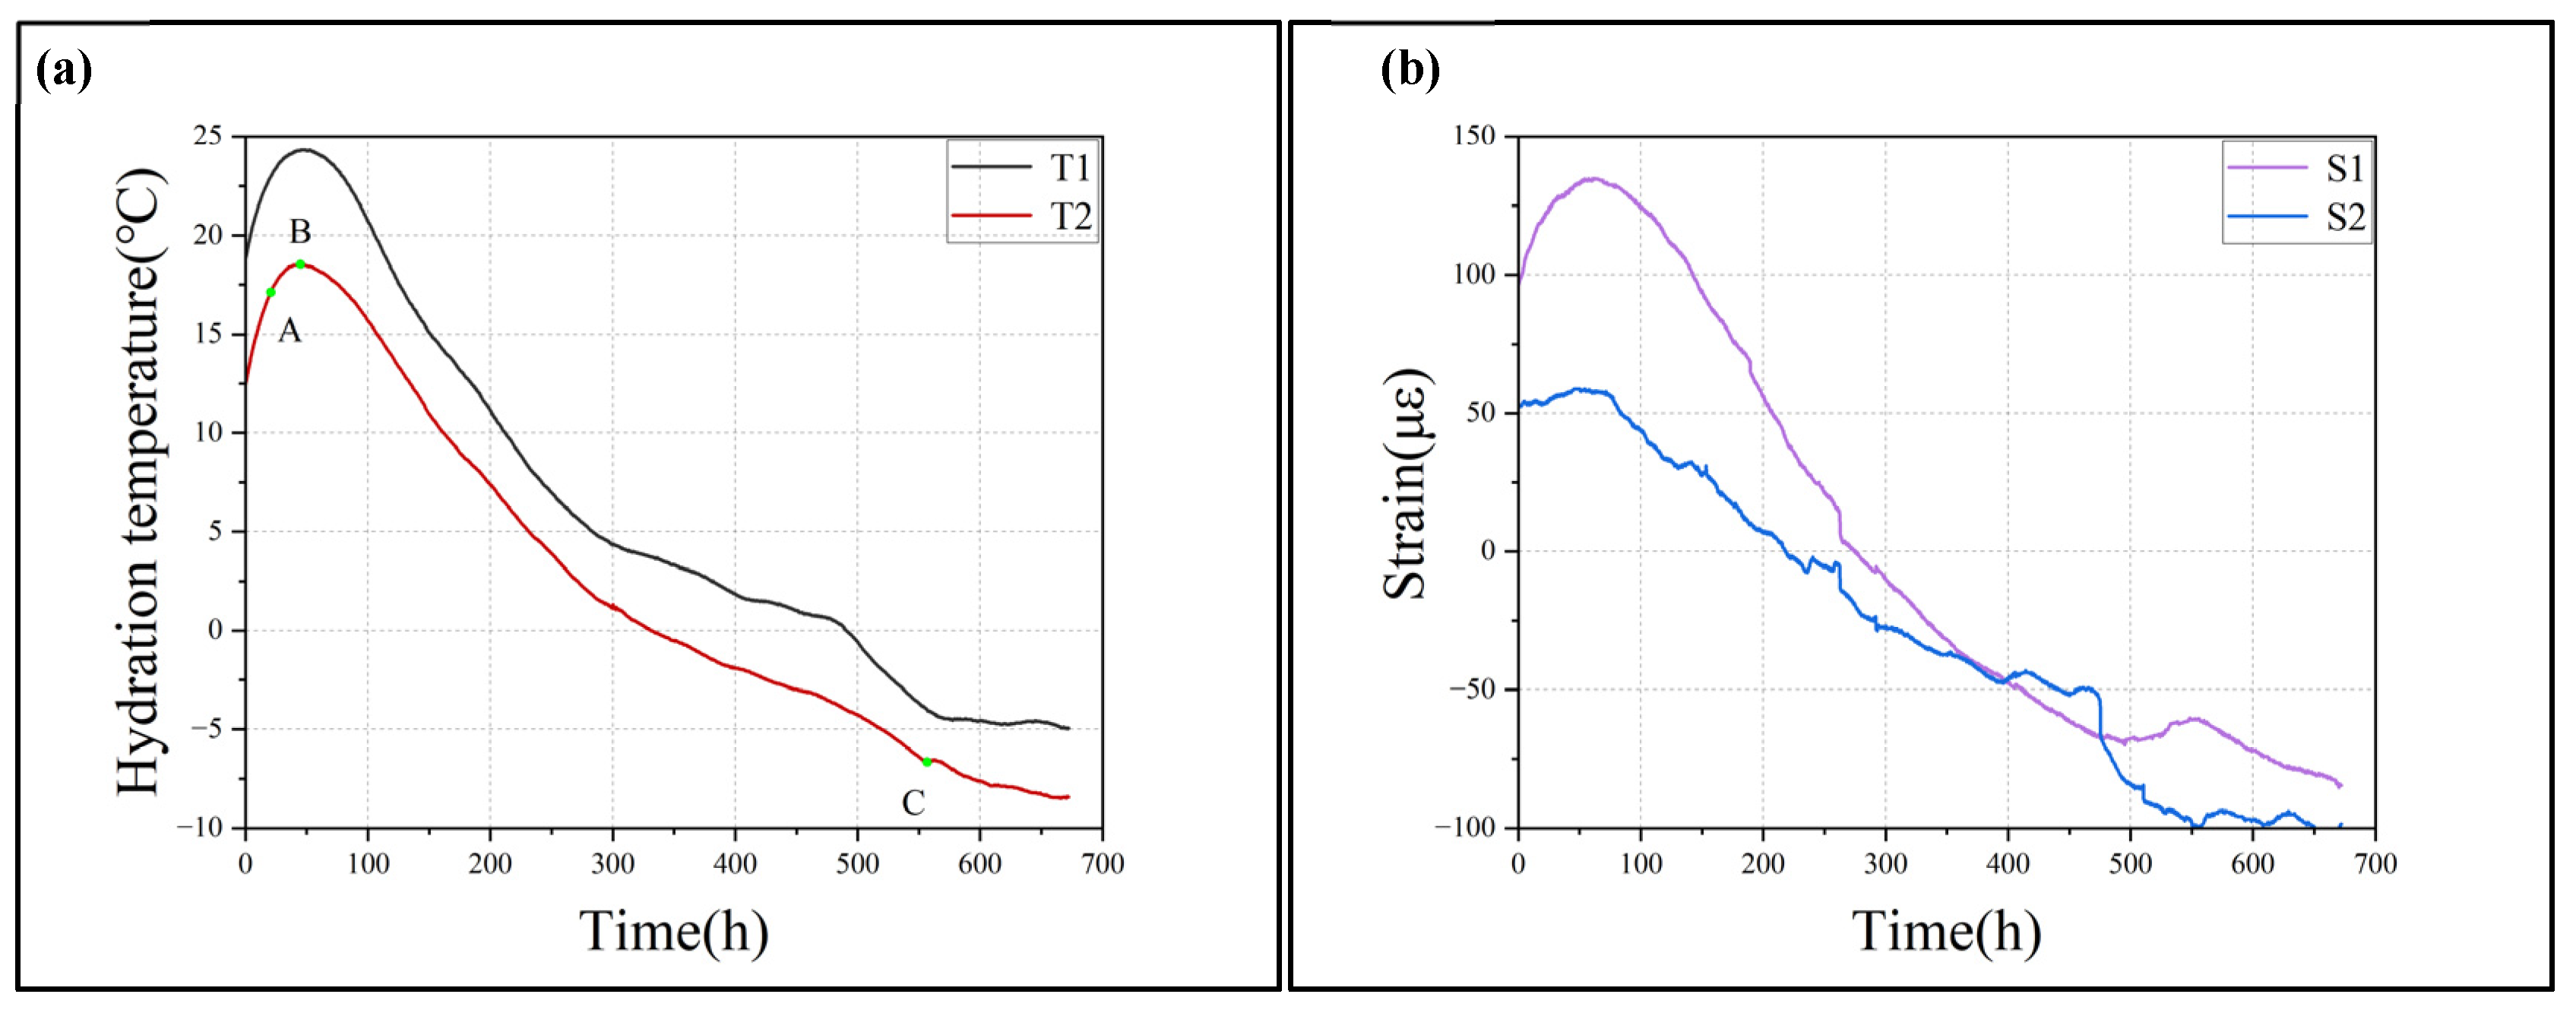
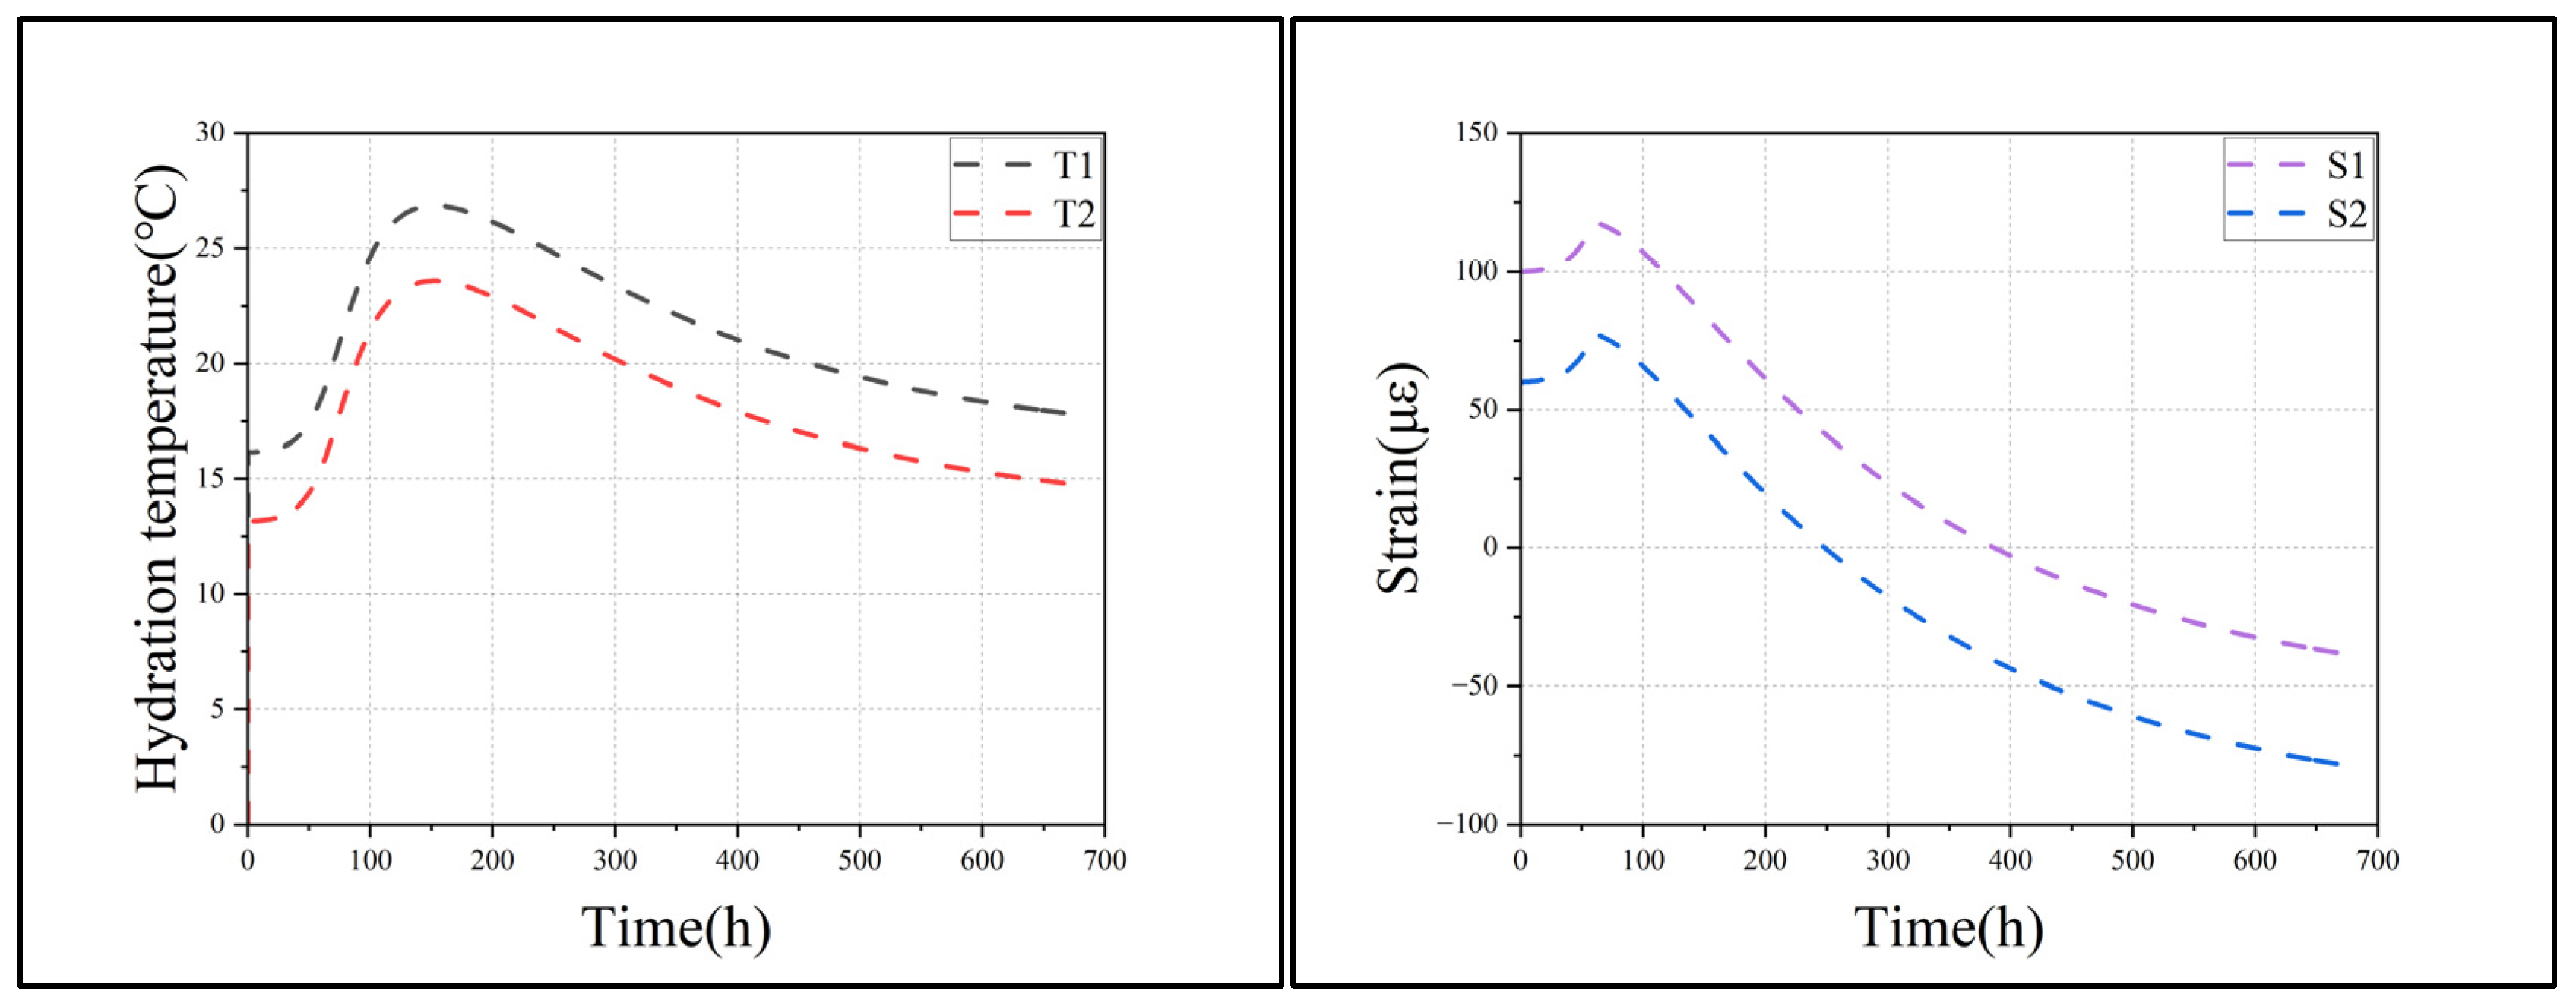
  • Rapid Hydration and Accelerated Temperature Rise: After concrete pouring is completed, the hydration effect becomes significant. During this stage, the hydration degree of the concrete increases rapidly, and the heat released from the hydration reaction exceeds heat loss from the surrounding environment due to convection and heat conduction, causing a rapid increase in concrete temperature. At 21 h after pouring (Point A), the rate of heat release reaches its maximum.
  • Slower Hydration and Continuous Temperature Rise: After 21 h, the hydration heat effect slows down, and the internal temperature of the concrete continues to rise steadily until 44 h after pouring (Point B), at which point the internal and external temperatures of the wall reach their peak. This characteristic time point (44 h) was identified by analyzing the measured temperature evolution curves obtained from the fiber-optic sensing system during the transition from temperature rise to decline.
  • Hydration Cooling Stage: In this phase, the hydration rate decreases, and the heat released is less than heat loss caused by convection and heat conduction. As a result, the concrete temperature decreases. The temperature continues to decrease until 153 h after pouring (Point D), when the hydration effect is essentially complete. This point (153 h) was selected based on the observation that the concrete temperature stabilized, indicating the hydration process was essentially complete. The hydration heat effect shows a phased pattern, initially slowing, and then accelerating, followed by stabilization and gradual dissipation. The temperature changes throughout the hydration stage are influenced by both the heat generated from hydration and heat dissipation from the concrete surface.
Despite the overall consistency in the temperature trends across the different points, the peak temperatures at each monitoring point vary significantly. At 44 h, the center and outer layer points reach their peak temperatures. The peak temperature at the center point (T1) is 24.3 °C, while the peak temperature at the outer point (T2) is 18.5 °C, 23.8% lower than that at T1. This difference occurs because the surface of the continuous wall can exchange heat more easily with the surrounding environment, while the center of the wall cannot, resulting in poorer heat dissipation conditions. Therefore, the maximum temperature increases with the thickness of the concrete protective layer.
Based on these findings, it can be further inferred that assuming the concrete is homogeneous and defect-free, the temperature differences generated at the different locations in the concrete during hydration can be used to precisely identify the thickness of the concrete protective layer. The heat produced during the hydration process spreads through the surrounding soil and atmosphere. The rates of heat generation and diffusion depend on the internal conditions of the concrete, such as the cement content, the type of cement material, and the presence of defects. If a distinct temperature anomaly is observed in the temperature distribution along the wall in the early hydration stage, it can be compared with the ideal temperature distribution for the wall to identify potential defects. However, different defect types can result in similar temperature profiles during hydration, making it difficult to accurately distinguish between them based on temperature data alone. This similarity increases the risk of misidentifying the defect type if temperature is used as the sole diagnostic parameter. Additional parameters are needed for precise defect identification.
Strain evolution curves inside the wall during the hydration period are shown in Figure 3b. Two measurement points, constrained by the bottom and lateral sides, initially experience compressive strain in the early hydration stage after pouring is complete. As the concrete’s hydration heat causes temperature rise, the compressive strain gradually increases, reaching its maximum value at 62 h. The compressive strain then gradually decreases, and during the cooling phase, it decreases to zero and transitions into tensile strain. Subsequently, the tensile strain increases until hydration is complete, and strain eventually stabilizes.
Analyzing the hydration–temperature curve, in the early hydration stage, the rapid temperature rise causes concrete to expand, and this expansion, under external constraints, leads to significant compressive strain. As hydration progresses, the temperature rise slows down, and the autogenous shrinkage effect gradually becomes more evident, counteracting deformation caused by thermal expansion. The compressive strain begins to decrease. As hydration continues, the concrete temperature starts to decrease, and the material transitions from thermal expansion deformation to shrinkage deformation, with shrinkage gradually dominating. This process reduces compressive strain until tensile strain is generated, which increases as the age of the concrete progresses until hydration is complete.

3. Finite Element Modeling

3.1. Basic Principles

This paper introduces a new multi-physics computational framework based on the COMSOL multiphysics® 6.2 finite element software, enabling the capture and analysis of the complex thermo-mechanical–chemical (TMC) properties of concrete during its hydration period. The model couples the essential thermo-mechanical–chemical processes to describe temperature evolution, the changes in hydration degree, and mechanical behavior, incorporating age-related effects to represent the changes in material properties. The model also accounts for heat conduction/convection between the solid material and the environment at temperature T0. The specific principles are detailed below.

3.1.1. Heat Generation and Thermal Diffusion

During the early-stage curing of concrete, hydration reactions release heat, causing the material to heat up and expand. Subsequently, heat transfer processes such as conduction and convection lead to a gradual reduction in temperature after reaching their peak, inducing shrinkage deformation. Therefore, heat generation and diffusion are two critical concepts in the TIP testing process. The thermodynamic equilibrium of concrete during hydration follows Fourier’s law. The heat generation equation and the heat conduction equation can be expressed as follows [43]:
ρ c t T t = q + Q c
q = λ T
where ρ is the density of concrete, c t is the specific heat capacity, T is temperature, q is heat flux, and Q c is the heat generation rate per unit volume due to cement hydration. λ is the material’s thermal conductivity coefficient.

3.1.2. Stress–Strain Constitutive Relationship

The strain equation for concrete under hydration can be expressed as follows [44]:
ε = ε m + ε t + ε a
ε t = η t ( θ θ 0 )
ε a = η a ξ χ
In this equation, ε m represents mechanical strain, ε t represents thermal expansion strain, and ε a represents autogenous shrinkage strain. η t is the thermal expansion coefficient, which characterizes the thermal expansion strain related to the difference between the current temperature θ and the initial temperature. χ is the degree of hydration. When the degree of hydration χ exceeds the threshold χ 0 ( χ 0 = 0.03), concrete undergoes autogenous shrinkage, and its magnitude is related to the coefficient η a . ξ ( χ ) is a truncated linear function expressed as follows:
ξ ( χ ) = χ χ 0 χ χ 0
χ = 1 exp ( 3.3 w c )
The final degree of hydration of concrete, χ , follows the above exponential relationship with the water-to-cement ratio.

3.1.3. Hydration Equation

χ = ϕ χ exp E a R θ
In this equation, θ represents the current temperature, E a is activation energy, which characterizes the rate of heat generation, and R = 8.314 J/(K·mol) is the ideal gas constant [45].

3.1.4. Concrete Ageing Effects

As the age of concrete increases, it exhibits noticeable ageing effects. Specifically, the elastic modulus ( E 0 ), compressive strength ( f t ), and fracture energy ( G f ) gradually increase, while Poisson’s ratio ( v 0 ) remains relatively constant. To simplify, we assume that the hydration degree threshold for the development of the elastic modulus, compressive strength, and fracture energy in the recently made concrete is the same as that for the autogenous shrinkage strain, denoted as χ 0 . The concrete ageing effect is considered as follows [46,47]:
E 0 χ = E ξ χ
G f χ = G f ξ χ
f t χ = f t ξ χ
In this equation, the function ξ χ is given by Equation (8), and E , G f , and f t represent the elastic modulus, fracture energy, and tensile strength when the degree of hydration reaches saturation at χ , respectively [48,49].

3.2. Model Parameters

For simulating the underground continuous wall, the relevant material parameters were obtained through on-site measurements, as shown in Table 1. The critical hydration degree at which the cement material begins to gain strength is defined as follows: when the degree of hydration exceeds χ 0 = 0.03, autogenous shrinkage strain is activated. Throughout the simulation, the environmental temperature is assumed to be constant, with an initial temperature of T0 = 0 °C for the entire system. The structure is influenced by the convective boundary conditions, where the radiation/convection coefficient is assumed to be independent of wind speed, with a value of h = 6 [W/(m2·K)].
Additionally, to match the on-site conditions, constraints are applied to the x displacement at the left end of the wall and to the y displacement at the lower end. The y displacement at the upper end is free. The structure is meshed using triangular elements with a maximum element size of hmax e = 0.0022 m and a minimum element size of hmin e = 0.0013 m. For the first 200 time steps, the time increment is set at Δt = 300 s, and for the remaining 2500 time steps, the increment is set at Δt = 600 s. The goal is to ensure appropriate soil medium dimensions, boundary condition definitions, and element meshing, so that the model size is manageable and provides convergence. The final configuration includes 22,434 nodes and 19,146 elements (Figure 4a).

3.3. Validation with Experimental Data

To validate the effectiveness of the developed finite element model, two monitoring points were set in the numerical model (as shown in Figure 4b). Temperature–time and strain–time curves were extracted from the finite element model at both the points, as shown in Figure 5. The results indicate that the numerical coupled model aligns with the observed temperature–strain variations over time from the field measurements. The data from the coupled model closely match the field measurements in terms of the temporal domain. To further quantify the model’s accuracy, statistical validation metrics were calculated. In particular, the Root Mean Square Error (RMSE) and the Pearson correlation coefficient (R) were employed to evaluate the differences between the simulated and experimental time-series data. The RMSE is defined as follows:
R M S E = 1 N i = 1 N ( Y i s i m Y i e x p 2 )
This metric represents the average magnitude of the error between the simulation ( Y i s i m ) and experiment ( Y i e x p ) over N data points. Similarly, the Pearson correlation coefficient is given as follows:
R = i = 1 N Y i s i m Y ¯ i s i m Y i exp Y ¯ i exp i = 1 N Y i s i m Y ¯ i s i m 2 i = 1 N Y i exp Y ¯ i exp 2
It measures the strength of linear correlation (with R = 1 indicating a perfect positive correlation and R = 0 indicating no correlation). Using these metrics, the model predictions show excellent agreement with the experimental data. For the temperature–time curves at Point 1 and Point 2, the RMSEs between the simulated and measured temperatures are approximately 1.1 °C and 1.3 °C, with Pearson correlation coefficients of 0.98 and 0.97, respectively. For the strain–time curves, the RMSE is on the order of 5–6 με for the two monitoring points, with R values of 0.96 and 0.95, respectively. All the correlation coefficients exceed 0.95, indicating a very strong linear relationship between the model and the experimental results. These low RMSE values and high correlations quantitatively confirm that the finite element model can accurately reproduce the thermal and mechanical responses observed in the field. Table 2 summarizes the validation metrics for each monitoring point.
Overall, the finite element modeling approach used in this study is deemed sufficient and capable of accurately simulating the TIP process, including the maximum temperature, the temperature differences caused by defects, and the temperature–time history. Consequently, the finite element model was used for further defect analysis.
Additionally, a monitoring line was placed vertically from the bottom to the top of the model (as shown in Figure 4b) to extract the spatial distribution of hydration–temperature and strain at a specific moment, as presented in Figure 6. In the absence of defects, the temperature and strain curves of the wall are smooth and continuous. Across the wall’s depth, the temperature and strain values gradually change and remain relatively stable, without significant jumps or discontinuities. The convective heat transfer coefficient at the top of the wall is significantly higher than those at the middle and bottom of the wall. As a result, during hydration, the temperature at the top of the wall at the same time is approximately 3 °C lower than at the middle, and the temperature of the concrete gradually decreases from the top to the middle. This phenomenon is consistent with the experimental results observed by Rui et al. [50].
In the early stages of hydration, if the temperature and strain profiles along the wall show smooth, uniform trends without significant anomalies, this indicates a uniform heat distribution and a defect-free condition within the wall. However, if the temperature and strain curves exhibit distinct anomalies—such as sharp changes at certain depths—this suggests the presence of defects (e.g., voids, mud inclusions, or cross-sectional narrowing/widening). The further analysis of the coupled temperature–strain behavior can help determine the specific nature of the defect. This integrated analysis approach is crucial for comprehensively assessing the wall’s integrity and providing reliable defect diagnosis.

4. Analysis of the Influence of Different Defect Types on the Temperature and Strain Evolution of the Wall During Hydration

This section builds upon the concrete hydration model established in the previous section, introducing the different defect types (Table 3). By analyzing the impact of these defects on temperature and strain during the hydration process, we study the relationship between the defect types and the temperature–strain characteristic curves, enabling the accurate identification of defect types. Underground continuous walls are prone to a range of structural quality issues after pouring, influenced by factors such as the geological conditions, construction equipment, and technician skill levels. The main types of defects include necking, widening, mud inclusion, and voids. This section builds upon the concrete hydration model established in the previous section, introducing the different defect types (Figure 7). These defects not only reduce the wall’s load-bearing capacity, but also pose serious risks related to the stability of the structure. In the experiments, in addition to the defect-free model, four sets of intentionally created defects were included. To improve computational efficiency and convergence, the mud inclusion and void defect zones were modeled as circular areas with a radius of 0.3 m. The distance from the defect boundary to the left wall boundary is 0.1 m, and the height is 1.8 m. In the case of the void defects, the area is filled with air, while the mud inclusion defect area is filled with soil. The widening and necking defects are represented as protrusions and recesses along the left and right boundaries of the wall, with a 0.1 m distance from the defect boundary to the wall. For the necking defect, the recessed area is filled with the surrounding soil. The grid size for the four defect groups is similar to that of the baseline model.
A distributed fiber-optic monitoring line is used in the model to monitor the changes in temperature and strain along the wall’s height during hydration. It is important to note that depending on the relative distance between the monitoring line and the defect location, two scenarios arise: the monitoring line either passes through the defect zone, or does not (Figure 8). The position of the monitoring line significantly affects the results, so this section analyzes both the scenarios separately.

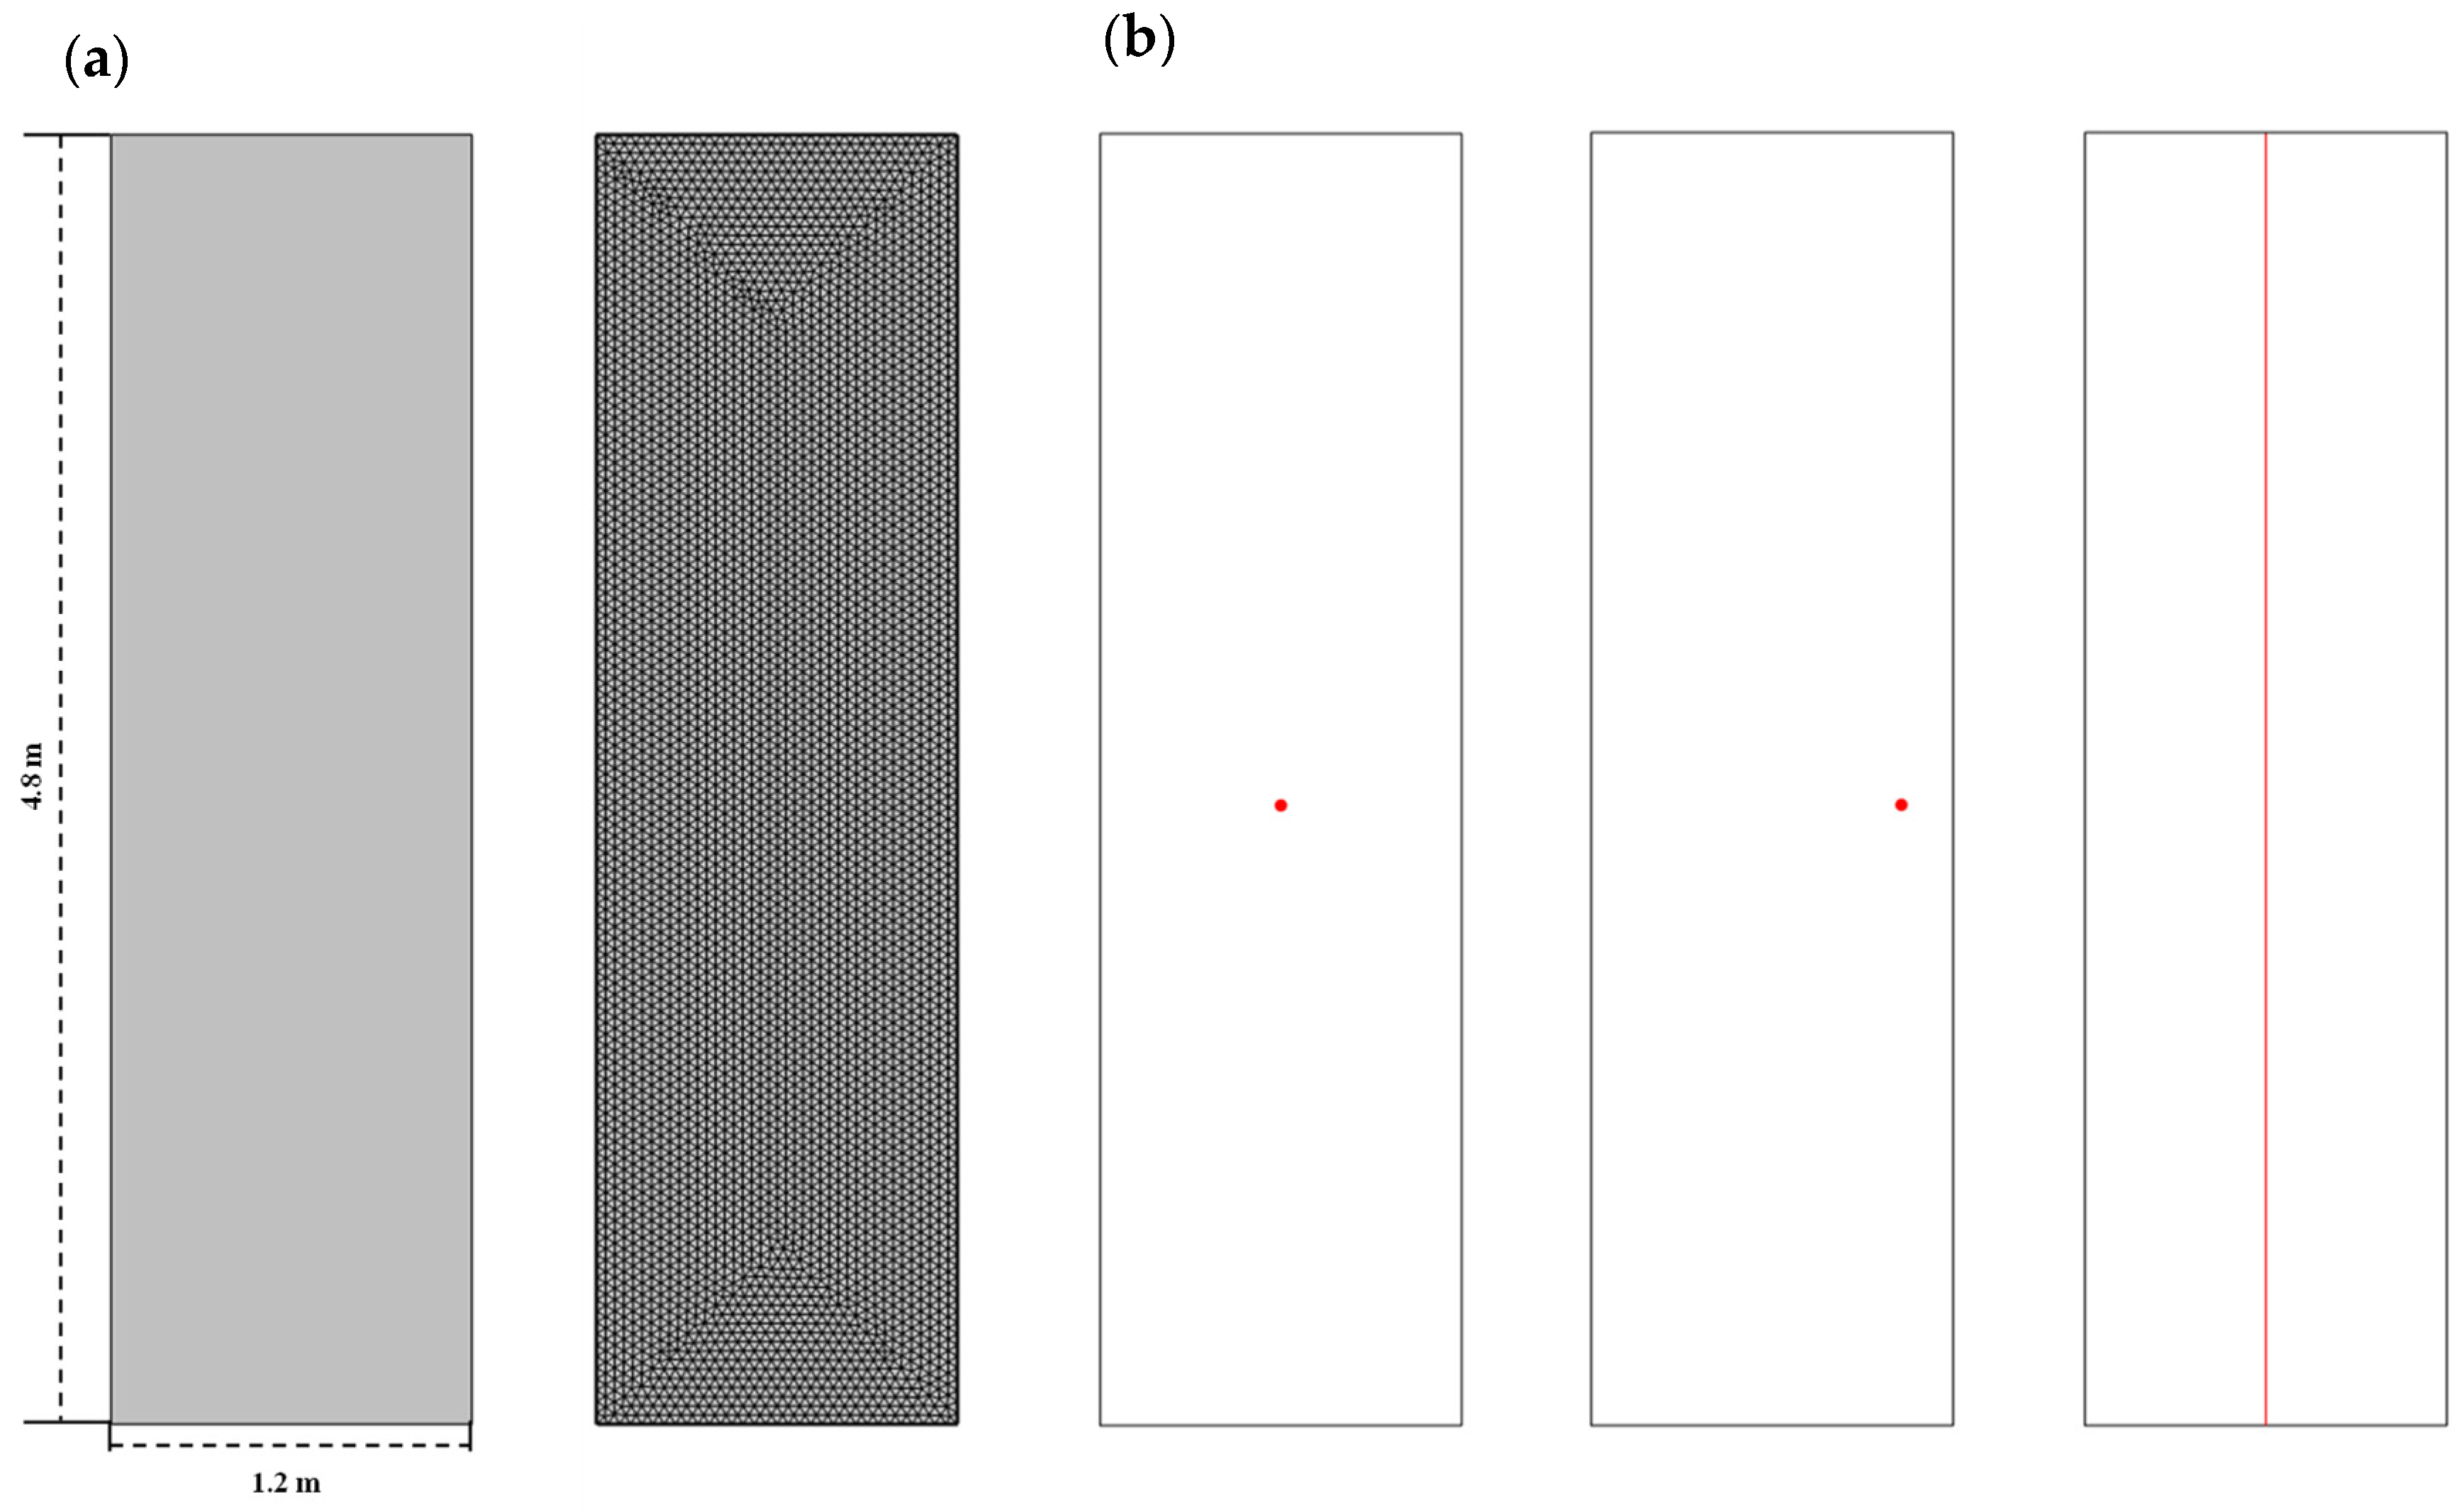
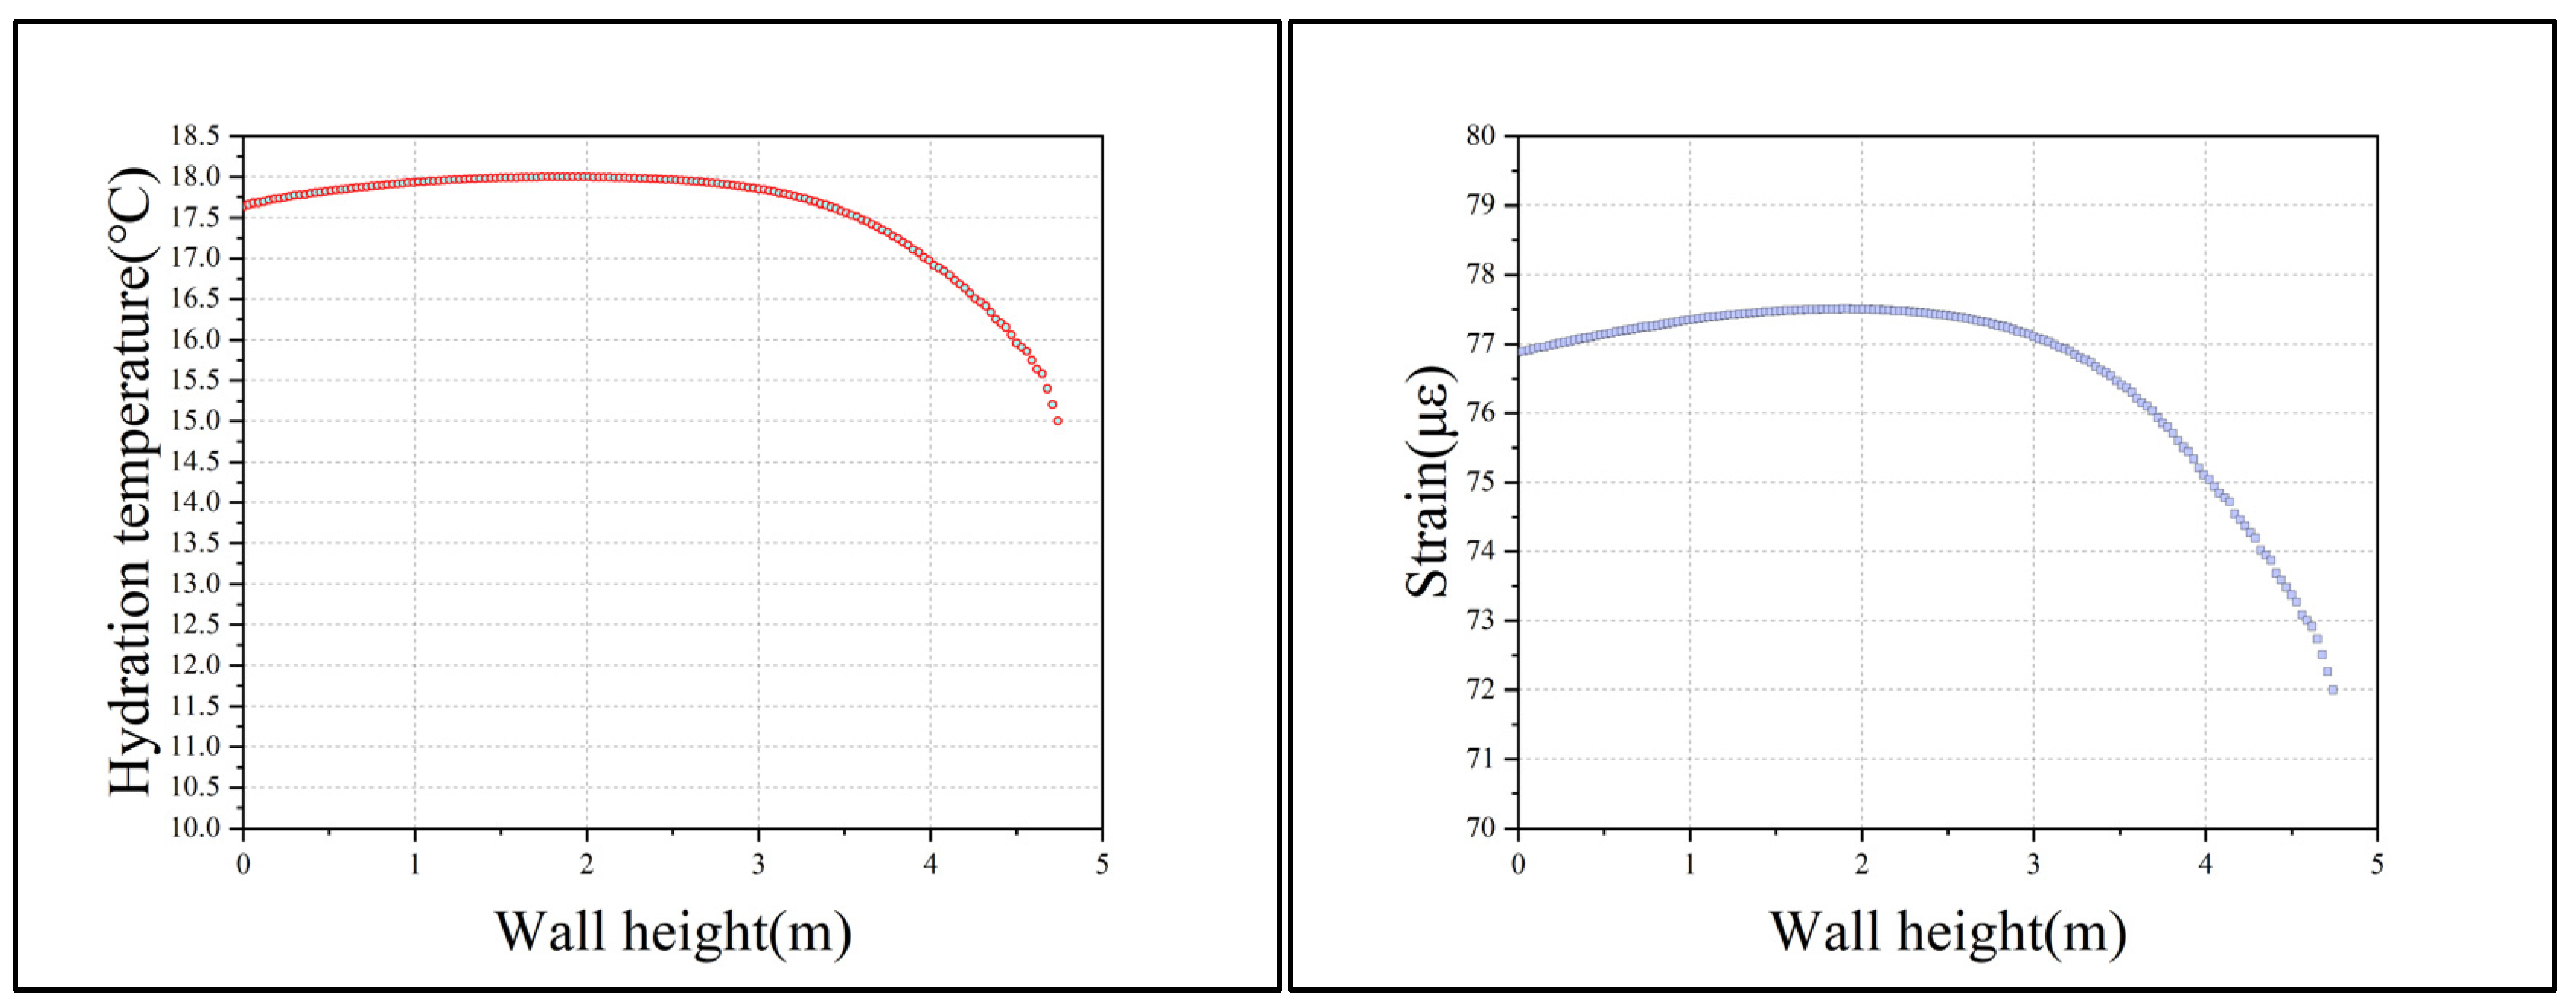
4.1. Temperature and Strain Distribution of the Wall During Hydration When the Monitoring Line Does Not Pass Through the Defect Zone

Figure 9 presents distribution maps of hydration–temperature and strain in the continuous wall for the different defect types (void, mud inclusion, widening, and necking) at three stages: early, middle, and late hydration. Comparing with the control group (no defects), it is clear that the different defect zones have a significant impact on the hydration–temperature and deformation of the surrounding concrete, with varying degrees of influence depending on the defect type. To further distinguish the defect types, the data from the monitoring line were extracted, and the spatial distribution curves of the wall’s hydration–temperature at the same time under different the defect conditions were compared (Figure 10). It is observed that except for the widening defect zone—where the concrete temperature is significantly higher than that in the non-defect area during hydration—the concrete temperatures around the void, mud inclusion, and necking defect zones are all noticeably lower than those in the non-defect area.
For the widening defect, the elevated temperature is attributable to the greater volume of cementitious material in that region, which releases more heat during hydration. In a larger cross-section, the heat generated by cement hydration is not able to dissipate, leading to the accumulation of heat in the widening zone. This well-known “mass effect” in concrete implies that thicker or bulging sections attain higher internal temperatures than those in the normal sections. As a result, the temperature in the widening region is significantly higher than that in the normal zones, and this distinct thermal signature enables the accurate identification of widening (bulging) defects.
By contrast, void defects, mud inclusions, and necking (under-sized cross-section) defects lack cement, so little to no hydration heat is generated in those areas [51]. The void defect (air pocket) not only fails to produce heat, but also acts as a thermal insulator that blocks heat flow, causing the area around the void to remain cooler than the surrounding concrete. A mud inclusion (soil-filled void) similarly does not contribute to hydration heat, and the presence of soil (an inert material) in that zone leads to a “cold spot” during curing; although soil has higher thermal conductivity than air, it still cannot compensate for the absence of exothermic cement hydration [52]. Likewise, a necking defect (reduced cross-sectional area) contains a smaller concrete volume; accordingly, it generates less heat and has a higher surface-to-volume ratio, allowing for faster heat loss. This means the necked region will exhibit a lower temperature rise compared to that of the intact sections.
The temperature differences manifest as abrupt changes in the temperature–depth curve along the monitoring line, providing a reliable basis for identifying internal defects. Notably, cooler-than-average temperature readings along the wall indicate the presence of voids, mud inclusions, or necking (insufficient concrete), whereas warmer-than-average readings indicate the likely widening or bulging of the cross-section. These trends are consistent with the findings in the recent literature and practical thermal profiling methods, which report that internal concrete defects or inclusions lead to locally depressed temperatures, while enlarged sections yield higher temperatures (The strain distribution results at different stages show analogous trends and are discussed in Section 4.2.)
Note that the temperature distributions in the wall caused by these three types of defect shows distinct differences. At the same time, the temperature difference around the void defect is the small compared to that of the non-defect area, followed by the mud inclusion defect, with the necking defect showing the largest temperature difference. This is due to the different materials filling the defect zones, with the differences in thermal conductivity leading to variations in temperature. The void defect is filled with air, while the mud inclusion and necking defects are filled with soil. Air is a poor thermal conductor with an extremely low level of thermal conductivity, which results in low efficiency in heat transfer and dissipation. This leads to a smaller temperature difference between the concrete in the defect zone and the non-defect area. In contrast, soil has a relatively higher thermal conductivity. The particles and water molecules in the soil effectively transfer heat, causing heat to diffuse rapidly. As a result, the temperature difference around the defect zones of mud inclusion and necking defects is more pronounced.
However, there is a further distinction between the two. The heat transfer mode for these two defects differs. The mud inclusion defect is surrounded by concrete, allowing for heat exchange only between the defect zone and the surrounding concrete, causing heat to accumulate and the temperature to rise quickly. On the other hand, the soil side of the necking defect not only absorbs heat from the surrounding concrete, but also connects to the deeper soil layers, allowing for heat to dissipate into the soil. Consequently, the necking defect has a higher heat dissipation rate, and its temperature is significantly lower than that of the mud inclusion defect. This difference in heat transfer directly impacts temperature distribution during the hydration process of the two defect types.
It should be noted that for these three defect types, which all exhibit cooling characteristics, relying solely on the temperature difference from the non-defect concrete is insufficient for accurate identification. The temperature differences among the three defect types are relatively small, so the additional analysis of the strain curve characteristics is necessary. The field experiments by Rui et al. [50] demonstrated that the deployment of distributed fiber-optic sensors within piles effectively captured abnormal temperature variations along the pile depth during early hydration, thereby identifying defects, such as cross-sectional widening and narrowing. These observations align closely with the temperature distribution patterns obtained from the numerical simulations in this study for the various defect types. Furthermore, Sun et al. [20] conducted the field monitoring of temperature distributions in cast-in-place piles and found distinct inflection points in temperature curves at the defect locations, thus validating the reliability of Thermal Integrity Profiling methods for practical applications. Similarly, model experiments by Wang et al. [37] highlighted significant differences in the temperature responses between intact piles and piles with defects, consistent with the monitoring results presented in this study. These comparative analyses with existing real-world case studies from the literature provide substantial evidence of the practical applicability and validity of the proposed temperature–strain combined monitoring method. This integrated analysis will improve the accuracy of identifying and distinguishing internal concrete defects.
Figure 11 shows strain distribution curves along the wall height for both the early and late hydration stages for the walls with the four different defect types. The strain values in the widening defect zone are significantly higher than those in the non-defect region during both the early hydration compressive strain phase and the late hydration tensile strain phase. This is because the widening defect contains more cement material, which releases more heat during hydration. This results in greater volume expansion during the temperature rise, causing significant compressive strain. During the cooling phase, the higher cement content causes a larger volume shrinkage, leading to pronounced tensile strain. As a result, the strain values in the defect zone are significantly higher than those in the normal area during both the stages of hydration.
For the void defect type, during the hydration expansion and contraction of concrete, the strain around the void is smaller than that in the normal area, both for compressive and tensile strain. This is because the void region lacks cement material and does not participate in the hydration reaction. Therefore, during the expansion phase, there is no volumetric expansion or compressive effect on the surrounding concrete, leading to smaller compressive strain around the void. Similarly, during the contraction phase, the void region lacks internal constraints, meaning it does not induce tensile stress on the surrounding concrete, resulting in significantly lower tensile strain compared to that in the normal area. This distinctive strain curve characteristic is the most typical feature used for identifying void defects.
For the mud inclusion defect type, the strain curve during the early hydration phase differs from that of the void defect. In the defect zone, a peak forms, indicating larger compressive strain around the mud inclusion defect. This is because during the early hydration phase, the concrete is still in a plastic state, with an elasticity modulus lower than that in the surrounding compacted soil in the mud inclusion zone. As the temperature rises, the soil in the mud inclusion area compresses the surrounding concrete, resulting in significant compressive strain. However, as the concrete hardens, its elasticity modulus increases rapidly and soon exceeds that of the surrounding soil, causing the strain curve in the mud inclusion zone to resemble that of the void defect. At this point, the compressive strain becomes noticeably smaller than that in the non-defective region. Therefore, the occurrence of high strain in the defect zone during the early hydration phase is the most typical characteristic for distinguishing mud inclusions from void defects.
For the necking defect type, whether during the compressive strain phase in early hydration or the tensile strain phase in later hydration, the strain in the necking defect zone is significantly greater than that in the normal area. This is due to the sudden reduction in wall thickness at the necking region, causing localized stress concentration. Additionally, the compression and constraint exerted by the surrounding soil on both sides of the necking defect further amplifies the stress concentration. This results in significant strain in both the expansion and contraction phases. Therefore, the strain curve in the defect zone exhibits prominent peaks and valleys. This characteristic is the most typical feature used for distinguishing necking from void and mud inclusion defects.
In conclusion, the four defect types—necking, widening, mud inclusion, and voids—each exhibits unique temperature–strain distribution characteristics during the hydration process. These characteristics can be leveraged for the accurate identification of specific defect types. This method provides a new and effective approach for assessing the health status of engineering structures. It enables the timely detection and correction of defects during construction and allows for the long-term health monitoring of the underground continuous wall after installation, helping prevent potential issues.

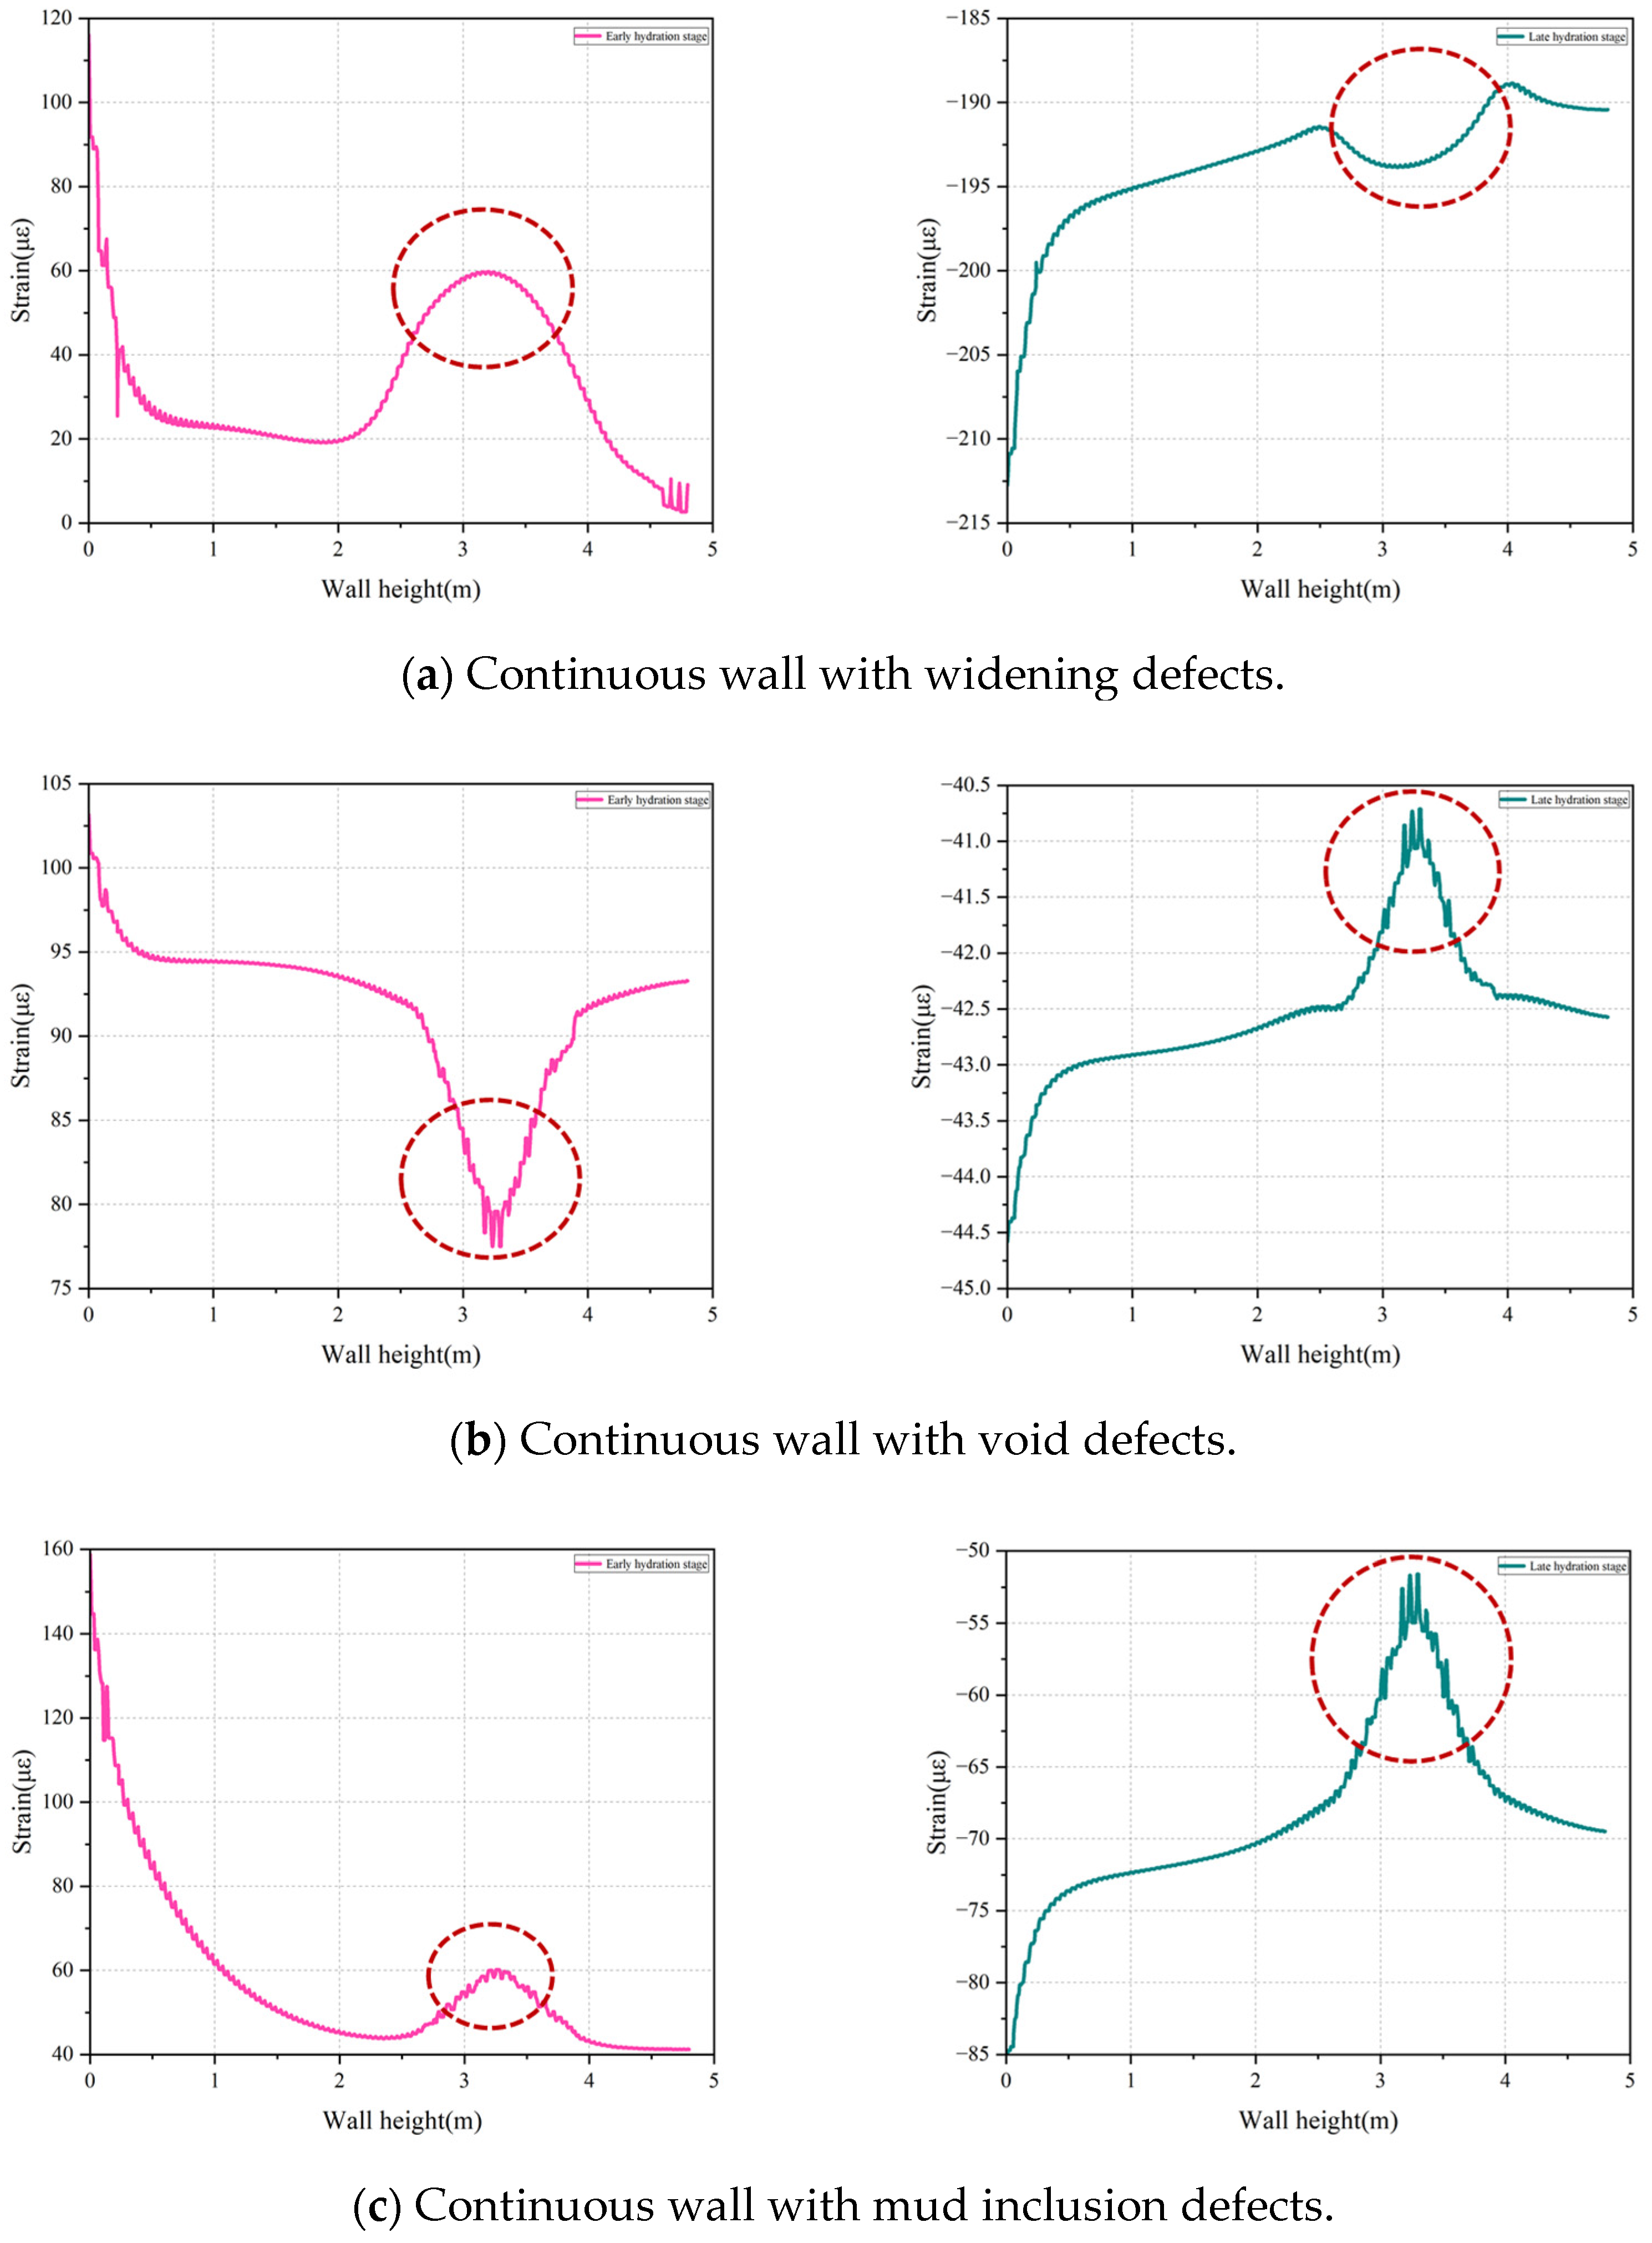
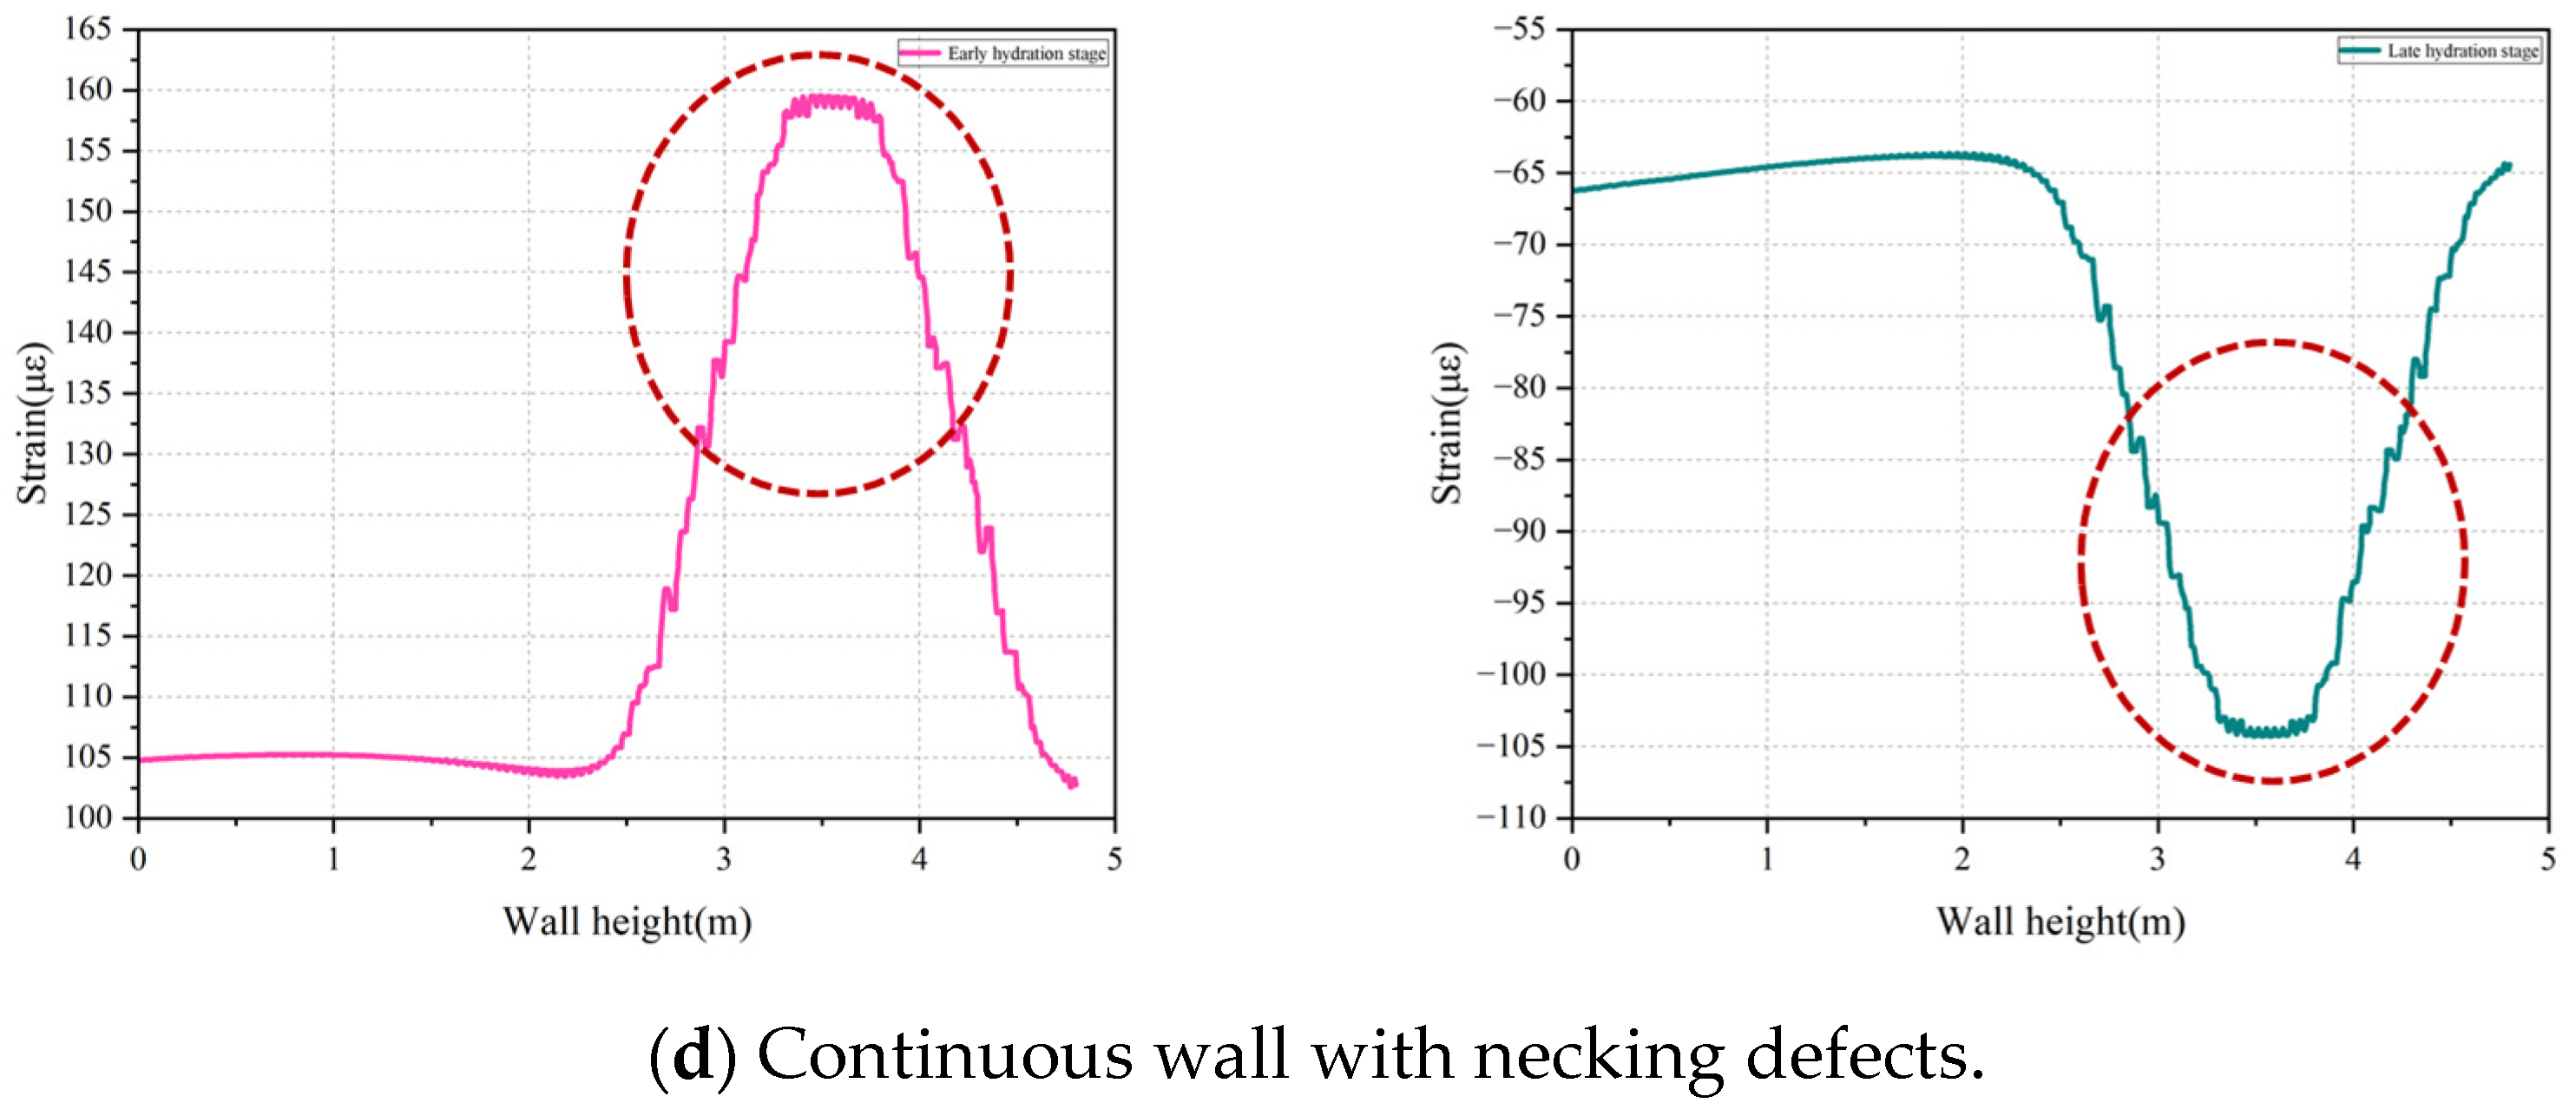
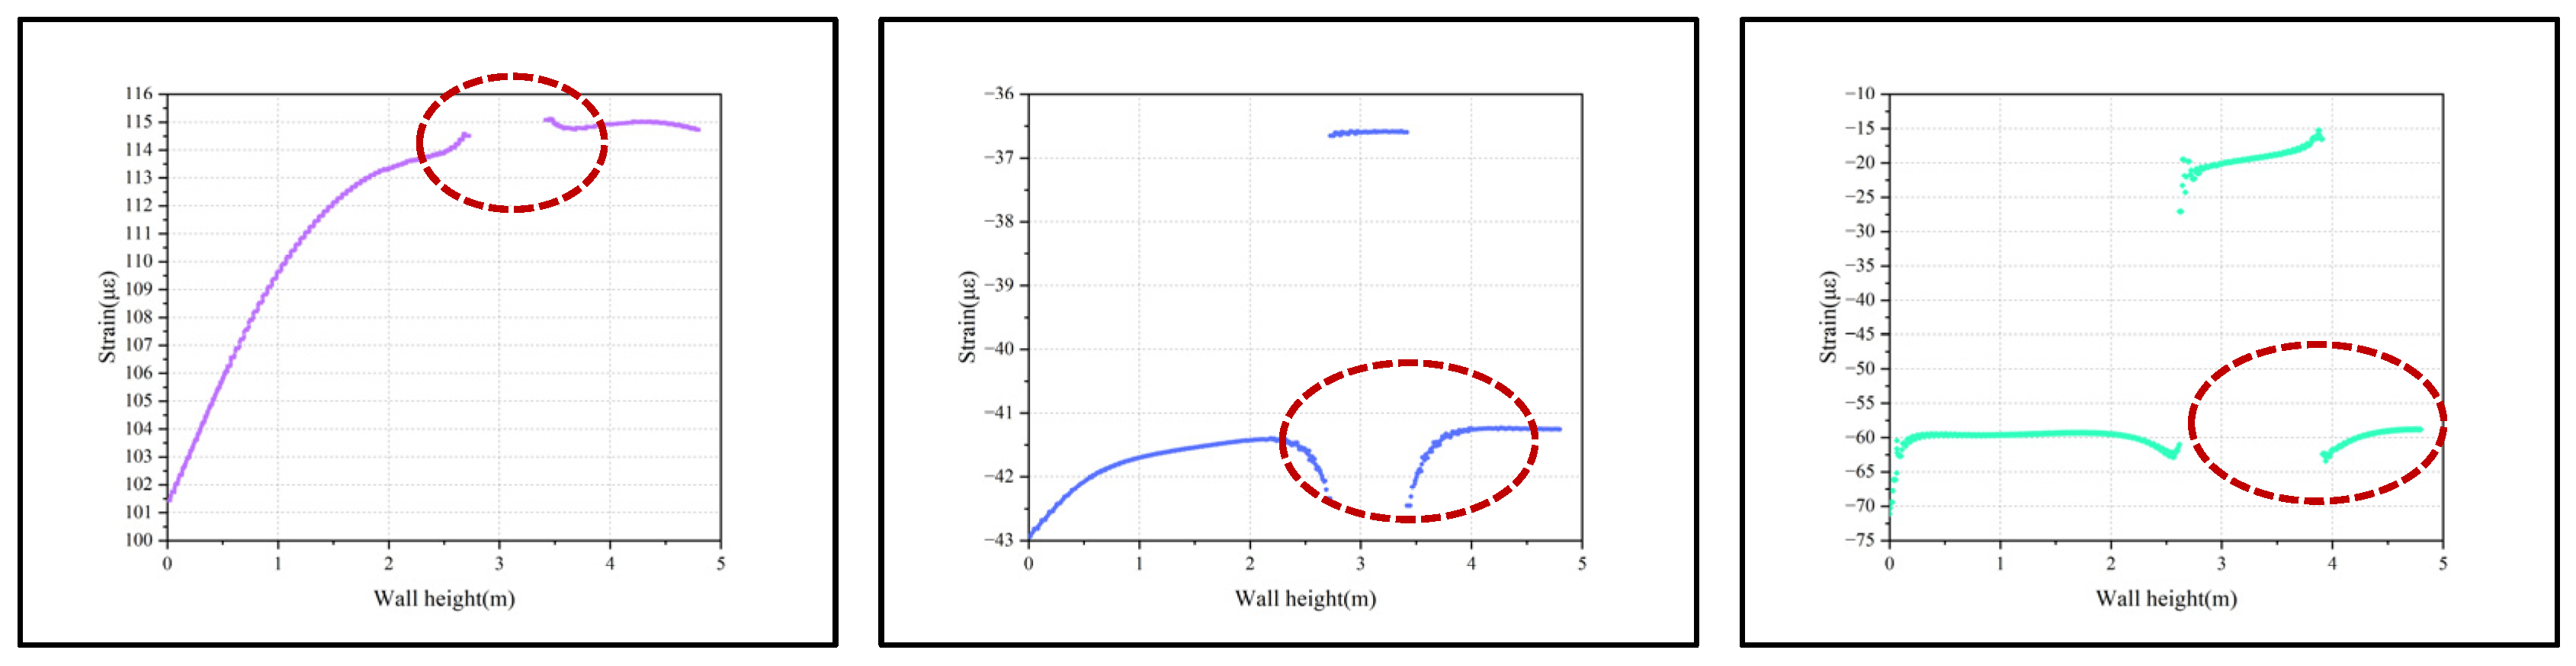
4.2. Distribution Patterns of Hydration–Temperature and Strain in the Wall When the Monitoring Line Passes Through the Defect Zone

In the previous section, we examined the case where the monitoring line does not pass through the defect zone. This section focuses on the results when the monitoring line passes through the defect zone. It is important to note that since the monitoring line is embedded within the internal framework of the wall, the monitoring line cannot pass through the protruding area of the widening defect. Therefore, only the cases where the monitoring line passes through the necking, mud inclusion, and void defects are considered in this section.
As seen in the temperature distribution patterns for the different defect types, the conclusion remains consistent with the previous section; the temperature in the different defect zones decreases variably, so no further discussion is needed. However, the strain distribution patterns differ across the defect types. When the monitoring line passes through the defect zone, the strain curve shows distinct breakpoints and layering (Figure 12), which is notably different from the strain curve when the monitoring line does not pass through the defect zone. This phenomenon occurs because the areas representing the materials intersected by the monitoring line have different thermal expansion coefficients. During both the heating and cooling phases, the responses of each material to temperature changes differ significantly, causing the strain curve to display clear layers and jumps between the different materials. This strain variation reflects the differences in the stress transfer properties of the optical fibers in different materials, serving as a crucial basis for identifying whether the monitoring line passes through the defect zone. This information can then be used to further identify the defect type.
For the void defect type, during the concrete hydration process, the strain curve of the defect-free concrete remains smooth and continuous, without noticeable jumps. When the monitoring line passes through the void defect zone, the strain drops abruptly to zero, and a clear break appears in the strain curve for the defect. This is because the internal medium of the defect is air, and the optical fiber cannot detect strain, resulting in a strain value close to zero. For the mud inclusion and necking defect types, when the monitoring line passes through the defect area, the strain curve also shows a noticeable jump, but the strain value does not drop to zero. Instead, a certain strain value remains in these defect zones, leading to a layered phenomenon in the curve. The presence of layers in the strain curve indicates the presence of soil inclusion at these positions. This is in contrast to the void defect type, where the strain curve shows a clear break. Thus, the presence of a noticeable break in the strain curve is an important indicator for identifying when the optical fiber passes through a void defect.
To further distinguish between the mud inclusion and necking defect types, it can be observed that since both the defect zones are filled with soil, their strain curves are relatively similar during the early hydration phase. However, significant differences emerge during the late hydration phase when the wall undergoes contraction. When the monitoring line passes through the edge of the mud inclusion defect zone, the strain curve forms a distinct “funnel” shape. These funnel shapes indicate a rapid increase in tensile strain at these positions, followed by a quick rebound. In contrast, for the necking defect type, the strain curve near the defect edge changes more gradually, without forming a noticeable funnel shape.
This difference can be attributed to the fact that the mud inclusion defect zone is completely surrounded by concrete and is not connected to the surrounding soil. During the late hydration phase, concrete shrinkage around the defect zone creates concentrated tensile stress, causing the strain to change abruptly at the defect’s edge. On the other hand, the edge of the necking defect zone is connected to the surrounding soil, which does not participate in the hydration reaction. Therefore, the tensile stress at the necking defect edge is lower, and the strain curve does not exhibit the sharp stress concentration seen in the mud inclusion defect. As a result, the strain curve near the necking defect edge does not form a funnel shape.
In the late hydration phase, the strain distribution at the defect edge serves as the key characteristic used to differentiate between the mud inclusion and necking defects. Based on the combined analysis of hydration–temperature and strain, the identification of jumps and layering in the strain curve can accurately distinguish whether the monitoring line passes through the defect zone, further enabling the determination of the different defect types within the concrete.
From an engineering perspective, each defect type introduces distinct geometric and material conditions that alter the hydration heat development and structural response of the concrete wall, thereby explaining the unique temperature and strain evolution observed for each case. Specifically, a widening defect increases the cross-sectional area of the wall, providing more cement material to react and release heat; a larger volume and reduced surface-to-volume ratio lead to heat accumulation and a significantly higher local temperature. This elevated thermal energy causes more pronounced expansion during early hydration (greater compressive strain) and greater contraction upon cooling (greater tensile strain), so the strains in the widening zone are much higher than those in the intact section during both the phases. In contrast, a necking defect creates an abrupt reduction in wall thickness, which causes a local stress concentration. The narrowed region is strongly confined by the adjacent soil, amplifying the strain response in that area. Therefore, even though the necking zone contains little or no cement (and thus generates a local temperature deficit similar to a void), it experiences considerably higher strain than the normal wall, with pronounced peaks in the strain curve during both the expansion and contraction stages. For a void defect, the absence of concrete means no hydration occurs in that zone, yielding a local temperature dip and eliminating any internal expansion or contraction. Consequently, the surrounding concrete experiences much less thermal strain (both compressive and tensile) near the void compared to the defect-free region, resulting in a relatively flat strain profile through the void area. The mud inclusion defect exhibits an intermediate behavior; like a void, it produces no hydration heat (causing a lower temperature in the defect region), but in the early hydration stage, the soil inclusion is stiffer than fresh concrete. This stiffness mismatch causes the expanding concrete to be constrained by the mud inclusion, leading to a pronounced compressive strain peak around the defect. As the concrete cures and its stiffness surpasses that of the surrounding soil, the inclusion’s influence diminishes, and the strain pattern around the mud inclusion begins to resemble that of a void (with much lower strain than in sound concrete). Thus, each defect type (widening, necking, void, and mud inclusion) produces a characteristic temperature and strain response that is logically consistent with its structural characteristics and the associated physical mechanisms, confirming that the observed differences in the curves are physically reasonable.

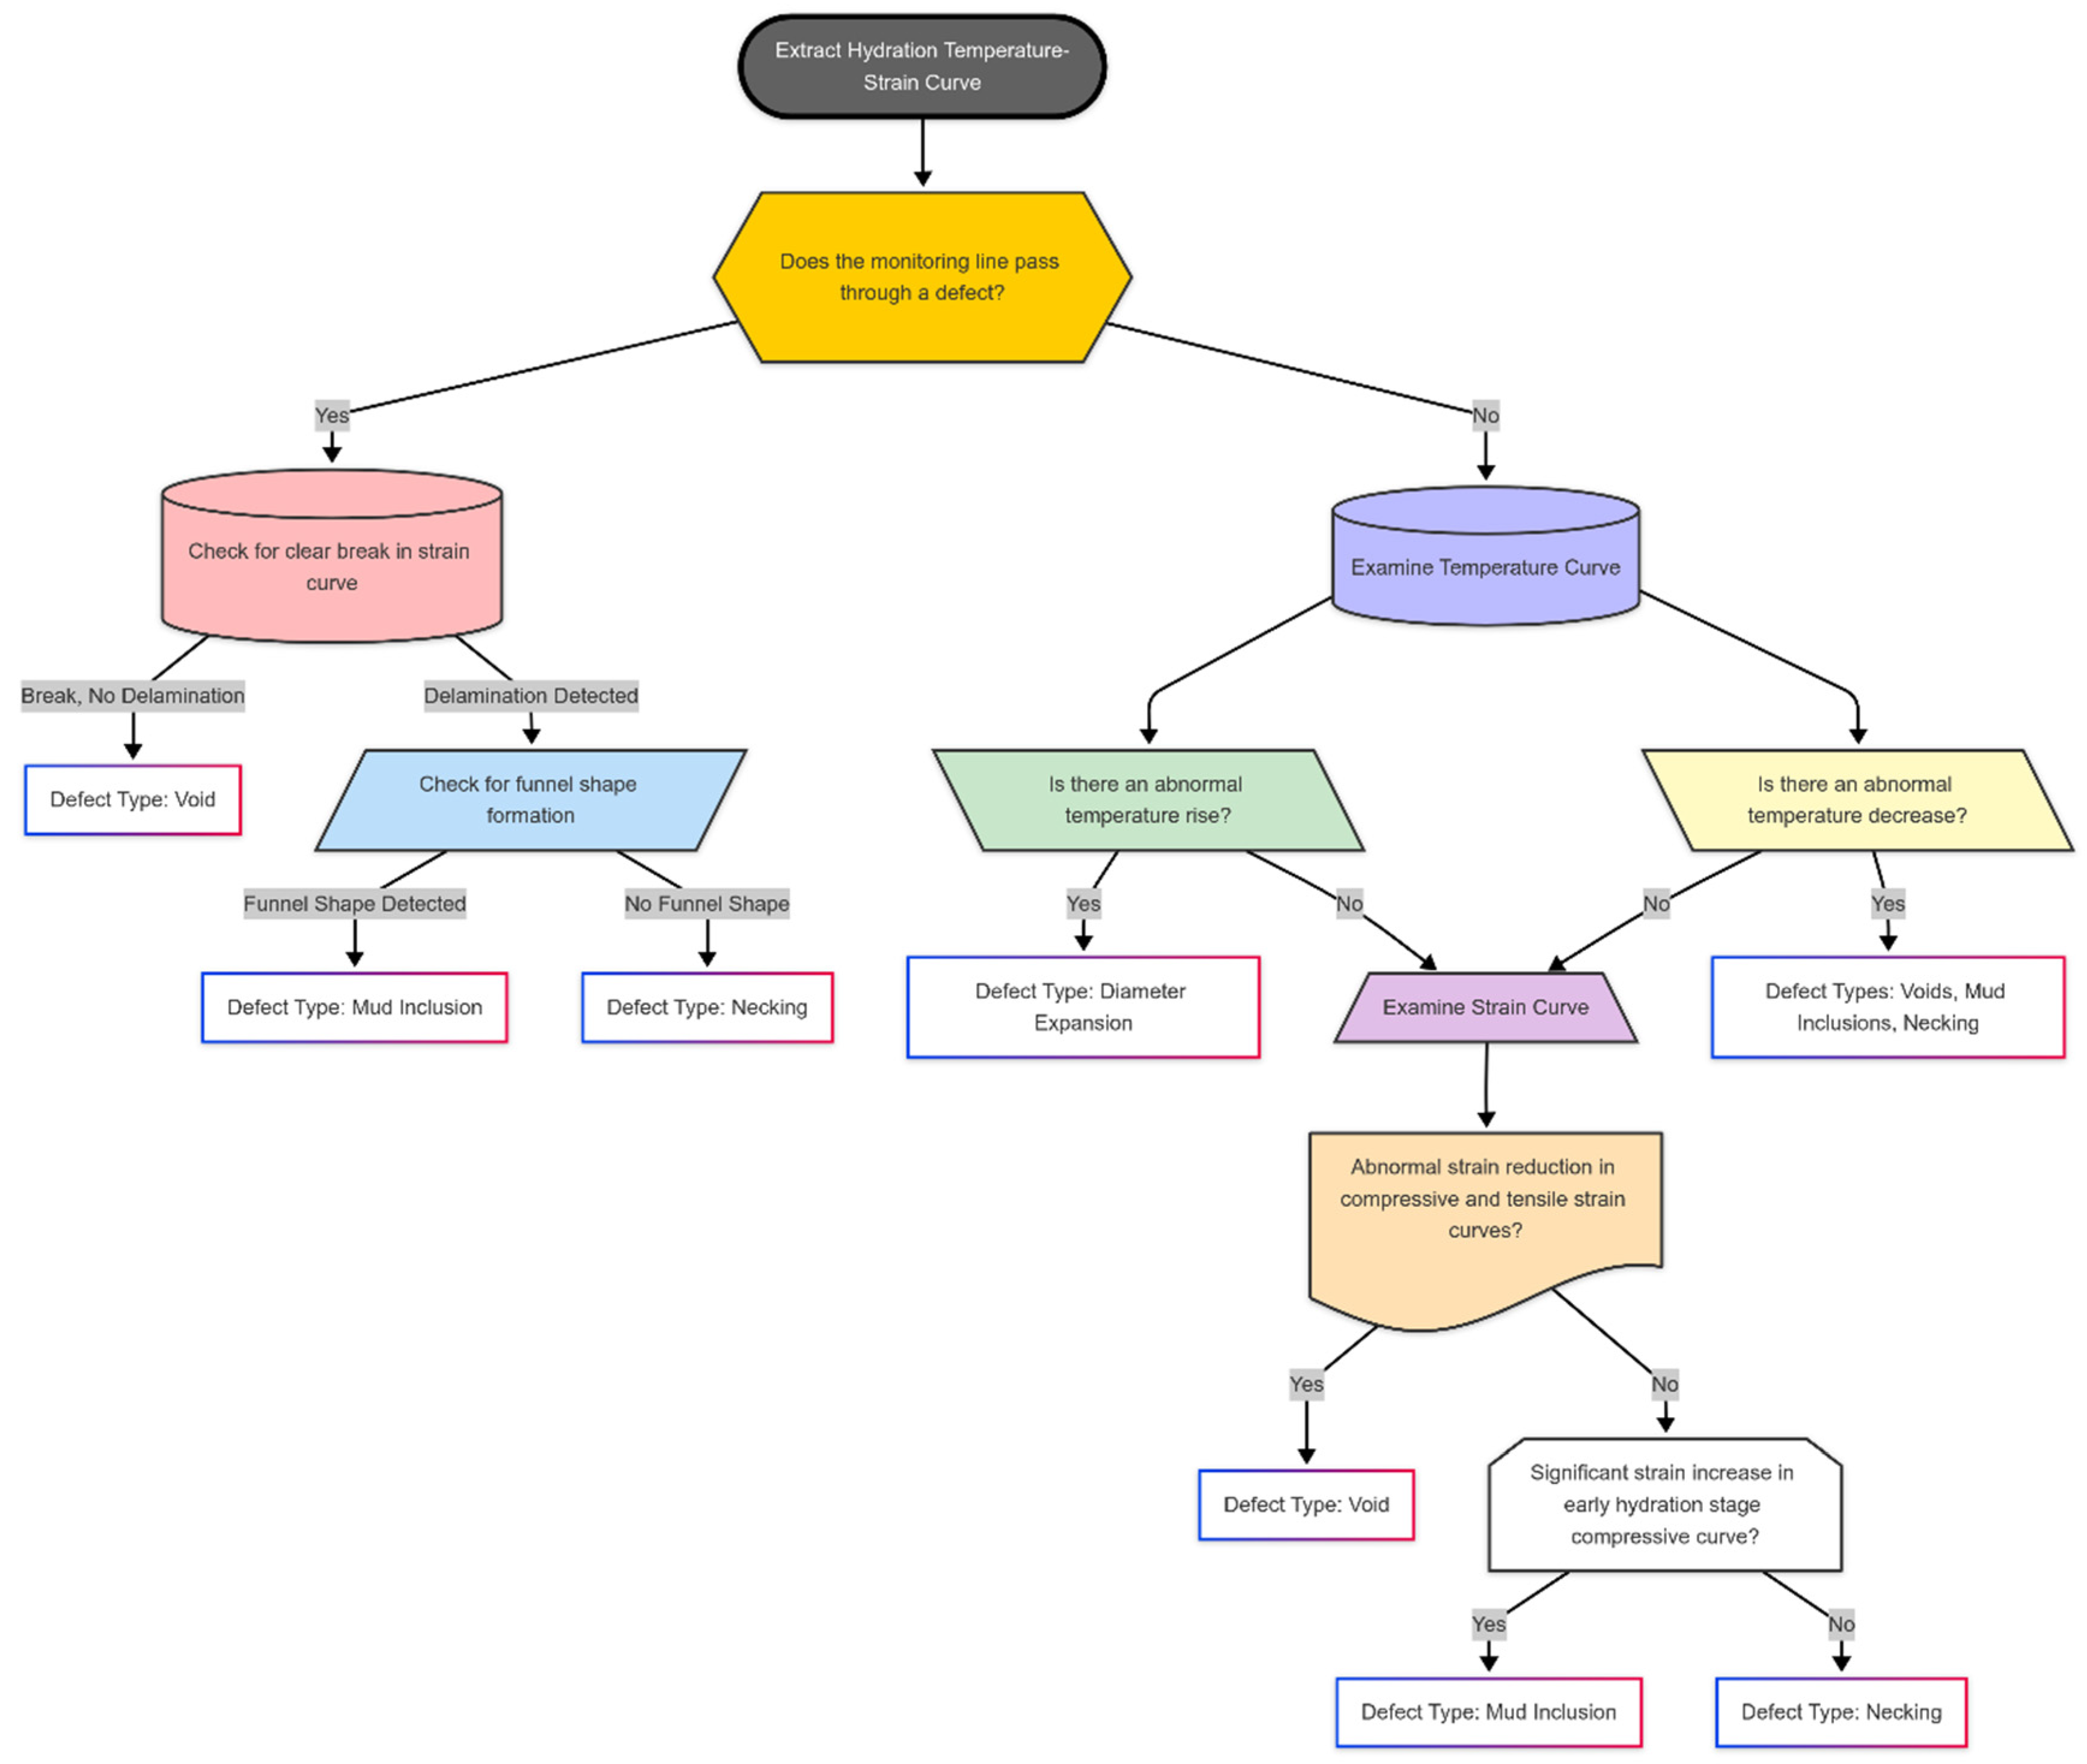
5. Concrete Defect Type Identification Process Based on Temperature–Strain Combined Monitoring and Application Study

Based on the research findings, a specific process for identifying defect types is proposed to more accurately interpret the monitoring results in practical applications (Figure 13). The process is as follows: First, construct the hydration–temperature–strain curve of the wall. Determine if the monitoring line passes through the defect zone. If the strain curve exhibits a breakpoint or layering, it indicates that the monitoring line passes through the defect zone. Conversely, if the strain curve is continuous, the monitoring line does not pass through the defect zone. The following sections explain both these scenarios, when the monitoring line passes through and when it does not pass through the defect zone.
If the monitoring line does not pass through the defect zone, the next step is to observe if the temperature curve shows an abnormal increase. If so, the defect type is identified as widening. If the temperature curve shows a significant decrease, the defect type is identified as a void, mud inclusion, or necking. The further examination of the strain curve is then performed. If both the compressive strain curve during early hydration and the tensile strain curve during later hydration show a significant reduction, the defect type is identified as a void. If the compressive strain curve during early hydration shows a significant increase and the tensile strain curve during later hydration shows a reduction, the defect type is identified as a mud inclusion. If both the compressive strain curve during early hydration and the tensile strain curve during later hydration show significant increases, the defect type is identified as necking.
If the monitoring line passes through the defect zone and the strain curve shows a clear break without layering, the defect type is identified as a void. If the strain curve exhibits layering and a distinct funnel shape appears in the strain curve during late hydration, the defect type is identified as a mud inclusion. If the funnel shape is not observed, the defect type is identified as necking.
The proposed identification process effectively categorizes and localizes the defects based on temperature–strain monitoring, providing critical information for prompt intervention during construction. Moreover, from a structural engineering perspective, identifying these defects at an early stage is essential due to their potential impact on long-term structural reliability. Voids and mud inclusions, for instance, introduce internal discontinuities that reduce the effective load-bearing cross-section, leading to stress concentrations that accelerate crack initiation and propagation around defect zones. These discontinuities also compromise durability by creating pathways for water ingress and aggressive agents, adversely affecting the wall’s watertightness and potentially accelerating steel corrosion or concrete deterioration over time. Necking defects, characterized by a localized reduction in cross-sectional area, represent structural weaknesses where elevated stresses can trigger progressive cracking and deformation, significantly diminishing he overall load-bearing capacity and stability throughout a wall’s service life. Even widening defects, despite their locally enlarged cross-section, create geometric irregularities that can induce differential shrinkage or thermal strains, initiating micro-cracks in adjacent concrete. If left unmitigated, the presence of these defects and their associated cracking can lead not only to the immediate weakening of its structural performance, but also secondary damage, such as reinforcement corrosion or increased leakage, ultimately compromising the structure’s long-term serviceability and safety.
The goal of this process is to help engineers more effectively utilize the temperature–strain combined monitoring method, enabling the more accurate and efficient detection of abnormalities in practical applications. While the proposed defect identification approach demonstrates strong capabilities in capturing and classifying various defects and their potential impacts on structural integrity, it is also important to recognize certain practical limitations inherent to this monitoring method. For instance, extremely minor or composite defects may only produce subtle thermal or strain anomalies that are challenging to reliably detect and differentiate based on current monitoring resolution. Additionally, the accuracy of defect detection is highly dependent on sensor deployment density and installation quality. Insufficient sensor coverage or improperly installed sensors could result in incomplete or inaccurate data, thereby reducing the reliability of defect classification. Moreover, the monitoring system can be sensitive to environmental disturbances, such as ambient temperature fluctuations, which may mask or mimic defect-induced anomalies in the measured temperature–strain response. Clearly acknowledging these limitations allows for a more comprehensive understanding of the method’s applicability under various field conditions, thereby guiding appropriate engineering practices and the interpretation of monitoring outcomes. These findings provide valuable insights for implementing defect prevention and control measures on-site and are expected to play a significant role in predicting and controlling defects during the concrete hydration phase.

6. Conclusions

Based on the above findings, the main conclusions of this study are summarized as follows:
  • The combination of Thermal Integrity Profiling and fiber Bragg grating strain monitoring effectively provided the detailed, real-time tracking of the concrete hydration process within underground walls. The data verified the typical three-stage hydration process (rapid temperature rise, peak temperature, and gradual cooling) and highlighted a clear linear relationship between peak temperature and protective layer thickness. Notably, the multi-parameter approach successfully detected anomalous temperature and strain patterns, proving valuable for the early detection of hidden structural defects.
  • An advanced thermal–mechanical–chemical multi-field coupled finite element model was created to simulate temperature and strain behaviors throughout the concrete hydration period, accounting for the presence of defects. This innovative model integrates chemical hydration heat generation, thermal conduction, and mechanical deformation comprehensively. The model was validated rigorously against field measurements, achieving excellent consistency between the simulation and experimental data, underscoring its potential as an effective analytical tool for studying early-stage defects in concrete structures.
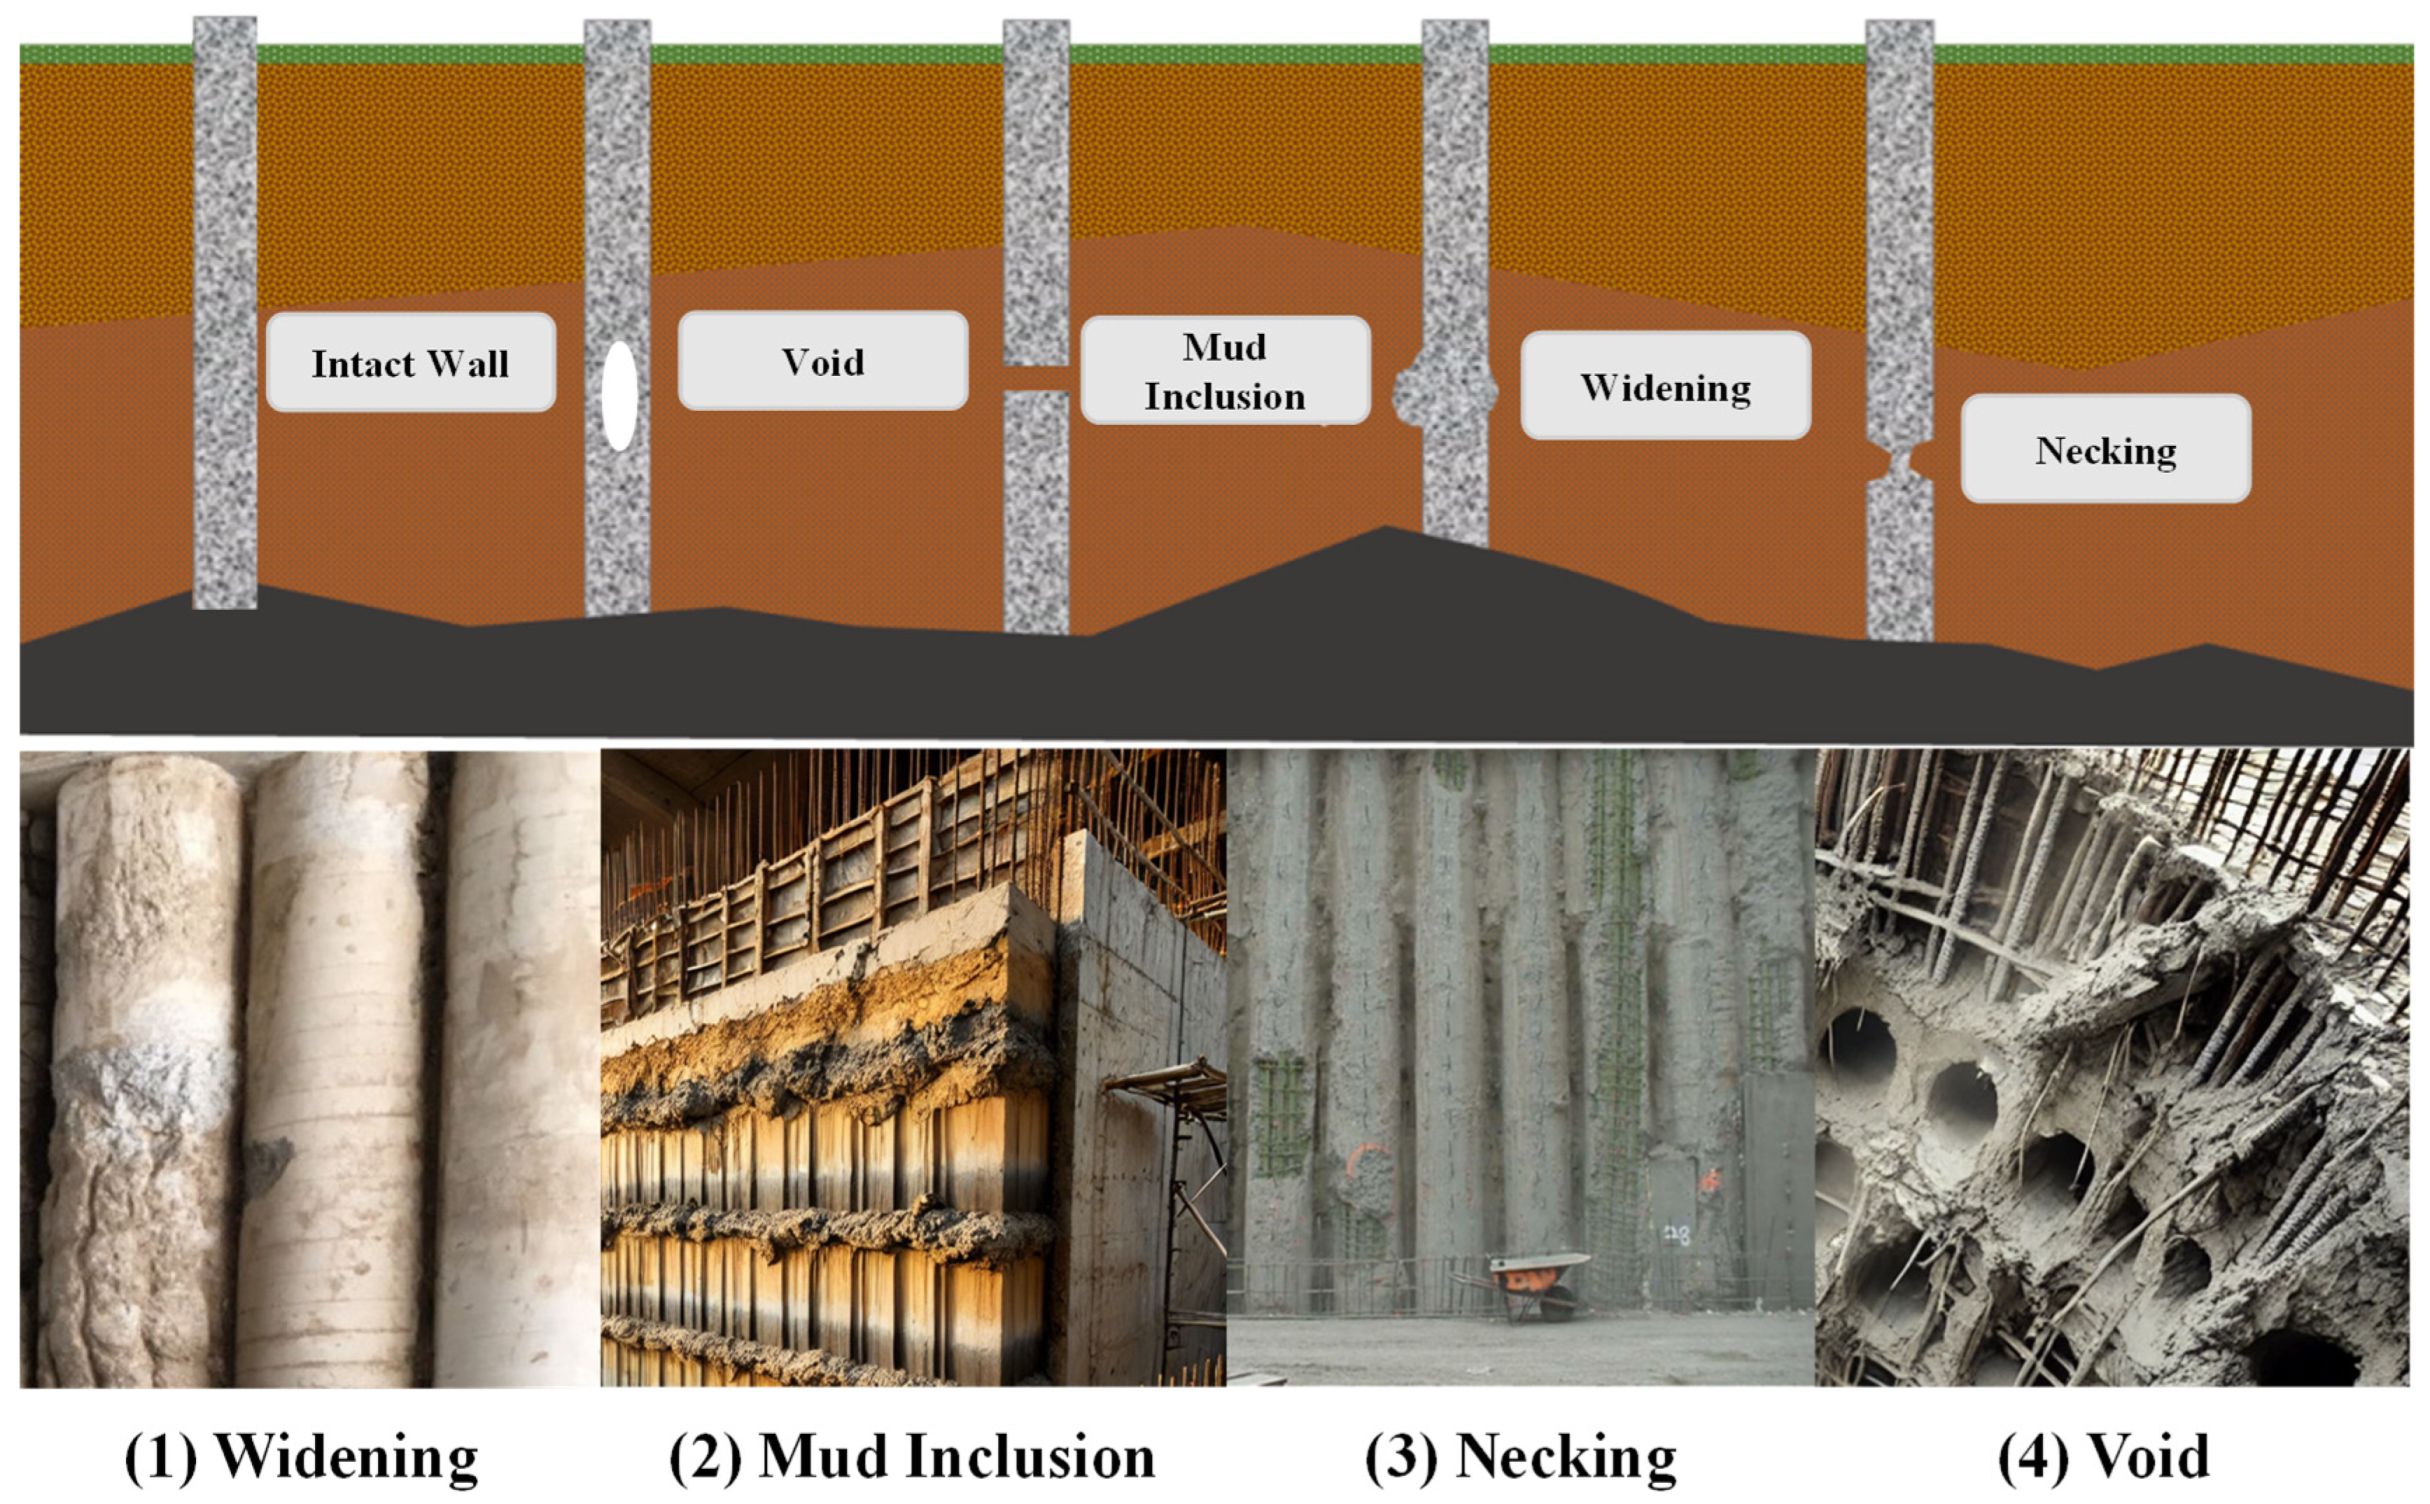
  • Defect Identification Mechanisms and Accuracy: By analyzing the combined temperature and strain data, the distinct impact mechanisms of different defect types were elucidated, enabling the accurate identification of defect nature and location. Four major defect types in the continuous wall—voids, mud inclusions, necking, and widening—were successfully distinguished by their unique temperature–strain signature patterns (e.g., variations in peak temperature drop, the heat dissipation rate, and strain anomalies during hydration). This dual-parameter approach overcomes the limitation of TIP alone by linking each observed anomaly to a specific defect mechanism.
  • This study proposes a rapid and systematic defect identification procedure based on the integrated monitoring and modeling results, which offers a new technological approach for concrete structural health assessment. This procedure was successfully demonstrated on the Weizishan Station underground wall and is readily transferable to similar underground concrete structures (e.g., diaphragm walls, deep foundation elements, and tunnel linings). The proposed multi-parameter monitoring and analysis framework significantly enhances the efficiency and precision of defect detection in recently made concrete, enabling timely intervention and long-term health monitoring.
To further enhance the practical applicability and broaden the scope of this research, future studies should focus on optimizing the monitoring process, including refining analytical algorithms and developing more effective sensor placement strategies. Additionally, exploring alternative sensing technologies, such as distributed fiber-optic sensing systems or low-cost wireless sensor networks, may provide additional capabilities and reduce deployment complexity. Finally, evaluating the adaptability and scalability of the proposed method to other structural forms, such as tunnel linings and raft foundations, and assessing its feasibility in large-scale engineering projects will be crucial for verifying and maximizing its potential impact on engineering practice.

Author Contributions

Conceptualization, X.Z.; methodology, L.L.; software, X.Z.; validation, X.L. and Y.L.; formal analysis, X.Z.; investigation, X.Z.; resources, L.L.; data curation, X.L.; writing—original draft preparation, X.Z.; writing—review and editing, X.Z.; visualization, X.Z.; supervision, X.Z.; project administration, L.L.; funding acquisition, X.L. All authors have read and agreed to the published version of the manuscript.

Funding

The authors greatly appreciate the Key R&D Plan of Shandong Province (2021CXGC011203) and the Shandong Province Housing and Urban Rural Construction Science and Technology Plan (2019-K7-12).

Data Availability Statement

Data will be made available upon request.

Conflicts of Interest

Author Linhai Lu was employed by the company Jinan Transportation Development Investment Co., Ltd. The remaining authors declare that the research was conducted in the absence of any commercial or financial relationships that could be construed as a potential conflict of interest.

References

  1. Liu, Y.X.; Zhao, J.; Zhang, Q.B. A modular automated modelling framework for cut-and-cover excavations in mixed ground conditions. Tunn. Undergr. Space Technol. 2025, 158, 106384. [Google Scholar] [CrossRef]
  2. Bai, B.W.; Liang, J.R.; Xu, H.Q.; Jiang, P.M.; Zhou, A.Z.; Lv, Y.Y. Study on hydraulic conductivity of dredged sediment-attapulgite vertical cutoff walls under confining pressure. Environ. Res. 2024, 255, 119110. [Google Scholar] [CrossRef]
  3. Choi, J.Y.; Ahn, D.H. Displacement Monitoring of Subway Tracks and Tunnels According to Adjacent Construction. Appl. Sci. 2024, 14, 1887. [Google Scholar] [CrossRef]
  4. Wu, J.R.; Chen, J. Experimental Research on the Floating Amount of Shield Tunnel Based on the Innovative Cumulative Floating Amount Calculation Method. Buildings 2024, 14, 1228. [Google Scholar] [CrossRef]
  5. Miao, R.C.; Gu, Z.H.; Wang, C.; Cui, W. Study on rock-breaking mechanism of impact trenching in underground diaphragm wall with consideration of slurry effects. Comput. Geotech. 2025, 179, 106998. [Google Scholar] [CrossRef]
  6. Peng, H.; Li, Y.J.; Niu, X.K.; Tang, H.D.; Meng, X.; Li, Z.C.; Wan, K.D.; Li, W.; Song, W. Characteristics analysis of leakage diseases of Beijing underground subway stations based on the field investigation and data statistics. Transp. Geotech. 2024, 48, 101317. [Google Scholar] [CrossRef]
  7. Liang, R.Z.; Zhang, Z.W.; Li, Z.C.; Cao, S.; El Naggar, M.H.; Xiao, M.Z.; Wu, W.B. Simplified Method for Predicting the Shield Tunnel Longitudinal Responses to Over-Crossing Tunneling Considering Circumferential Joint Effect. Int. J. Geomech. 2024, 24, 04024140. [Google Scholar] [CrossRef]
  8. Sun, Q.; Elshafie, M.Z.; Xu, X.; Schooling, J. Pile defect assessment using distributed temperature sensing: Fundamental questions examined. Struct. Health Monit.-Int. J. 2024, 23, 1701–1724. [Google Scholar] [CrossRef]
  9. Torigoe, I.; Mori, K.; Spagnoli, A. Signal processing procedure for non-destructive test of concrete structure integrity. NDT E Int. 2005, 38, 575–581. [Google Scholar] [CrossRef]
  10. Ni, S.-H.; Lo, K.-F.; Lehmann, L.; Huang, Y.-H. Time-frequency analyses of pile-integrity testing using wavelet transform. Comput. Geotech. 2008, 35, 600–607. [Google Scholar] [CrossRef]
  11. Tennyson, R.C.; Coroy, T.; Duck, G.; Manuelpillai, G.; Mulvihill, P.; Cooper, D.J.F.; Smith, P.W.E.; Mufti, A.A.; Jalali, S.J. Fibre optic sensors in civil engineering structures. Can. J. Civ. Eng. 2000, 27, 880–889. [Google Scholar] [CrossRef]
  12. Pelecanos, L.; Soga, K.; Elshafie, M.Z.E.B.; de Battista, N.; Kechavarzi, C.; Gue, C.Y.; Ouyang, Y.; Seo, H.-J. Distributed Fiber Optic Sensing of Axially Loaded Bored Piles. J. Geotech. Geoenviron. Eng. 2018, 144, 04017122. [Google Scholar] [CrossRef]
  13. Sun, Q.; Elshafie, M.; Barker, C.; Fisher, A.; Schooling, J.; Rui, Y. Thermal integrity testing of cast in situ piles: An alternative interpretation approach. Struct. Health Monit.-Int. J. 2021, 20, 2493–2512. [Google Scholar] [CrossRef]
  14. Chen, J.W.; Liao, Y.S.; Ma, F.; Tang, S.W. Effect of ground granulated blast furnace slag on hydration characteristics of ferrite-rich calcium sulfoaluminate cement in seawater. J. Cent. South Univ. 2025, 32, 189–204. [Google Scholar] [CrossRef]
  15. He, F.F.; Chen, J.; Li, C.Z.; Xiong, F. Temperature tracer method in structural health monitoring: A review. Measurement 2022, 200, 111608. [Google Scholar] [CrossRef]
  16. Zhu, J.S.; Wang, Z.Y. Experimental modeling and quantitative evaluation of mitigating cracks in early-age mass concrete by regulating heat transfer. J. Build. Eng. 2024, 96, 110641. [Google Scholar] [CrossRef]
  17. Calo, M.; Ruggieri, S.; Nettis, A.; Uva, G. A MTInSAR-Based Early Warning System to Appraise Deformations in Simply Supported Concrete Girder Bridges. Struct. Control Health Monit. 2024, 2024, 8978782. [Google Scholar] [CrossRef]
  18. Chu, I.; Kwon, S.H.; Amin, M.N.; Kim, J.-K. Estimation of temperature effects on autogenous shrinkage of concrete by a new prediction model. Constr. Build. Mater. 2012, 35, 171–182. [Google Scholar] [CrossRef]
  19. Xiao, Z.P.; Di Murro, V.; Osborne, J.A.; Zhu, H.H.; Li, Z.L. Distributed fibre optic sensing and novel data processing method for tunnel circumferential deformation—A case study of an ageing tunnel at CERN. Tunn. Undergr. Space Technol. 2024, 153, 106014. [Google Scholar] [CrossRef]
  20. Sun, Q.; Elshafie, M.Z.E.B.; Barker, C.; Fisher, A.; Schooling, J.; Rui, Y. Integrity monitoring of cast in-situ piles using thermal approach: A field case study. Eng. Struct. 2022, 272, 114586. [Google Scholar] [CrossRef]
  21. Phan, L.T.; Lawson, J.R.; Davis, F.L. Effects of elevated temperature exposure on heating characteristics, spalling, and residual properties of high performance concrete. Mater. Struct. 2001, 34, 83–91. [Google Scholar] [CrossRef]
  22. Khan, I.; Yong, G.T. Role of supplementary cementiteous materials in mitigating heat of hydration in mass concrete elements. Constr. Build. Mater. 2024, 431, 136482. [Google Scholar] [CrossRef]
  23. Hernandez-Bautista, E.; Bentz, D.P.; Sandoval-Torres, S.; Cano-Barrita, P.F.d.J. Numerical simulation of heat and mass transport during hydration of Portland cement mortar in semi-adiabatic and steam curing conditions. Cem. Concr. Compos. 2016, 69, 38–48. [Google Scholar] [CrossRef] [PubMed]
  24. Hu, J.; Ge, Z.; Wang, K. Influence of cement fineness and water-to-cement ratio on mortar early-age heat of hydration and set times. Constr. Build. Mater. 2014, 50, 657–663. [Google Scholar] [CrossRef]
  25. Zhao, D.P.; Zhu, L.; Shen, Z.D.; Miu, Z.C.; Liu, X.H. Effect of hydration heat of super-large-section tunnel-lining concrete on structural stress and its mitigation measures. Tunn. Undergr. Space Technol. 2025, 157, 106324. [Google Scholar] [CrossRef]
  26. Wang, L.G.; Wang, Y.C.; Miao, Y.C.; Ju, S.Y.; Sui, S.Y.; Wang, F.J.; Liu, Z.Y.; Jiang, J.Y. Temperature damage assessment of mass concrete based on the coupling mechanism of hydration-temperature-humidity-constraint factors. J. Build. Eng. 2024, 90, 109211. [Google Scholar] [CrossRef]
  27. Gottsäter, E.; Johansson, M.; Plos, M.; Ivanov, O.L. Crack widths in base restrained walls subjected to restraint loading. Eng. Struct. 2019, 189, 272–285. [Google Scholar] [CrossRef]
  28. Li, H.; Liu, J.; Wang, Y.; Yao, T.; Tian, Q.; Li, S. Deformation and cracking modeling for early-age sidewall concrete based on the multi-field coupling mechanism. Constr. Build. Mater. 2015, 88, 84–93. [Google Scholar] [CrossRef]
  29. Saeed, M.K.; Rahman, M.K.; Alfawzan, M.; Basha, S.; Dahish, H.A. Recycling of date kernel powder (DKP) in mass concrete for mitigating heat generation and risk of cracking at an early age. Constr. Build. Mater. 2023, 376, 131033. [Google Scholar] [CrossRef]
  30. Chu, I.; Lee, Y.; Amin, M.N.; Jang, B.-S.; Kim, J.-K. Application of a thermal stress device for the prediction of stresses due to hydration heat in mass concrete structure. Constr. Build. Mater. 2013, 45, 192–198. [Google Scholar] [CrossRef]
  31. Schackow, A.; Effting, C.; Gomes, I.R.; Patruni, I.Z.; Vicenzi, F.; Kramel, C. Temperature variation in concrete samples due to cement hydration. Appl. Therm. Eng. 2016, 103, 1362–1369. [Google Scholar] [CrossRef]
  32. Chen, B.F.; Tang, G.Q.; Lu, X.C.; Xiong, B.B.; Guan, B.; Tian, B. Thermal property evolution and prediction model of early-age low-heat cement concrete under different curing temperatures. J. Build. Eng. 2024, 82, 108020. [Google Scholar] [CrossRef]
  33. Mardmomen, S.; Chen, H.L. Prediction of the early age thermal behavior of mass concrete containing SCMs using ANSYS. J. Therm. Anal. Calorim. 2023, 148, 7899–7917. [Google Scholar] [CrossRef]
  34. Bazant, Z.P.; Baweja, S. Justification and refinements of model b3 for concrete creep and shrinkage 1. statistics and sensitivity. Mater. Struct. 1995, 28, 415–430. [Google Scholar] [CrossRef]
  35. Madsen, H.O.; Bazant, Z.P. Uncertainty analysis of creep and shrinkage effects in concrete structures. J. Am. Concr. Inst. 1983, 80, 116–127. [Google Scholar]
  36. Dwairi, H.M.; Wagner, M.C.; Kowalsky, M.J.; Zia, P. Behavior of instrumented prestressed high performance concrete bridge girders. Constr. Build. Mater. 2010, 24, 2294–2311. [Google Scholar] [CrossRef]
  37. Wang, C.; Chen, Y.; Zhou, M.; Chen, F. Control of Early-Age Cracking in Super-Long Mass Concrete Structures. Sustainability 2022, 14, 3809. [Google Scholar] [CrossRef]
  38. Dias, I.F.; Oliver, J.; Lemos, J.V.; Lloberas-Valls, O. Modeling tensile crack propagation in concrete gravity dams via crack-path-field and strain injection techniques. Eng. Fract. Mech. 2016, 154, 288–310. [Google Scholar] [CrossRef]
  39. Klemczak, B.; Knoppik-Wrobel, A. Reinforced concrete tank walls and bridge abutments: Early-age behaviour, analytic approaches and numerical models. Eng. Struct. 2015, 84, 233–251. [Google Scholar] [CrossRef]
  40. Boeckmann, A.Z.; Loehr, J.E. Evaluation of Thermal Integrity Profiling and Crosshole Sonic Logging for Drilled Shafts with Concrete Defects. Transp. Res. Rec. 2019, 2673, 86–98. [Google Scholar] [CrossRef]
  41. Farahani, M.A.; Gogolla, T. Spontaneous raman scattering in optical fibers with modulated probe light for distributed temperature Raman remote sensing. J. Light. Technol. 1999, 17, 1379–1391. [Google Scholar] [CrossRef]
  42. Zhu, H.H.; Ho, A.N.L.; Yin, J.H.; Sun, H.W.; Pei, H.F.; Hong, C.Y. An optical fibre monitoring system for evaluating the performance of a soil nailed slope. Smart Struct. Syst. 2012, 9, 393–410. [Google Scholar] [CrossRef]
  43. Schindler, A.K.; Folliard, K.J. Heat of hydration models for cementitious materials. ACI Mater. J. 2005, 102, 24–33. [Google Scholar]
  44. Ulm, F.J.; Coussy, O. Couplings in early-age concrete: From material modeling to structural design. Int. J. Solids Struct. 1998, 35, 4295–4311. [Google Scholar] [CrossRef]
  45. Briffaut, M.; Benboudjema, F.; Torrenti, J.M.; Nahas, G. Numerical analysis of the thermal active restrained shrinkage ring test to study the early age behavior of massive concrete structures. Eng. Struct. 2011, 33, 1390–1401. [Google Scholar] [CrossRef]
  46. De Schutter, G. Finite element simulation of thermal cracking in massive hardening concrete elements using degree of hydration based material laws. Comput. Struct. 2002, 80, 2035–2042. [Google Scholar] [CrossRef]
  47. Thanh-Tung, N.; Weiler, M.; Waldmann, D. Experimental and numerical analysis of early age behavior in non-reinforced concrete. Constr. Build. Mater. 2019, 210, 499–513. [Google Scholar] [CrossRef]
  48. De Schutter, G.; Taerwe, L. Degree of hydration-based description of mechanical properties of early age concrete. Mater. Struct. 1996, 29, 335–344. [Google Scholar] [CrossRef]
  49. De Schutter, G.; Taerwe, L. Fracture energy of concrete at early ages. Mater. Struct. 1997, 30, 67–71. [Google Scholar] [CrossRef]
  50. Rui, Y.; Kechavarzi, C.; O’Leary, F.; Barker, C.; Nicholson, D.; Soga, K. Integrity Testing of Pile Cover Using Distributed Fibre Optic Sensing. Sensors 2017, 17, 2949. [Google Scholar] [CrossRef]
  51. Li, Z.; Li, M.; Guo, H.; Wu, Y.; Sheng, L.; Jiao, J.; Li, Z.; Sui, W. Experimental Investigation of the Evaluation of the Cement Hydration Process in the Annular Space Using Distributed Fiber Optic Temperature Sensing. Sensors 2025, 25, 958. [Google Scholar] [CrossRef] [PubMed]
  52. Rui, Y.; Sun, Q.C. Measurement of Pile Cover Thickness Using Distributed Fibre Optic Sensors. In Proceedings of the 3rd International Conference on Information Technology in Geo-Engineering (ICITG), Guimaraes, Portugal, 29 September–2 October 2019. [Google Scholar]
Figure 1. Principle of fiber Bragg grating (FBG) monitoring system.
Buildings 15 01350 g001
Figure 2. On-site monitoring plan: (a) schematic diagram of sensor layout for monitoring hydration–temperature and strain in continuous wall; (b) on-site installation of sensors for monitoring hydration–temperature and strain in continuous wall.
Buildings 15 01350 g002
Figure 3. Evolution of temperature and strain in continuous wall during hydration: (a) evolution of hydration–temperature at different monitoring points of continuous wall; (b) evolution of internal strain in continuous wall during hydration.
Buildings 15 01350 g003
Figure 4. Numerical model construction. (a) Numerical model mesh division; (b) set monitoring points and monitoring lines.
Buildings 15 01350 g004
Figure 5. Temperature and strain evolution curves at two points of continuous wall during hydration based on numerical coupled model.
Buildings 15 01350 g005
Figure 6. Evolution curves of temperature and strain with wall height at specific moment during hydration based on numerical coupled model.
Buildings 15 01350 g006
Figure 7. Typical defect types in underground continuous walls: schematics and on-site examples.
Buildings 15 01350 g007
Figure 8. Schematic diagram of the relationship between the monitoring line layout and the defect zone location.
Buildings 15 01350 g008
Figure 9. Distribution maps of hydration–temperature and strain in continuous wall for different defect types.
Buildings 15 01350 g009aBuildings 15 01350 g009b
Figure 10. Hydration–temperature curves of wall at same moment for different defect types.
Buildings 15 01350 g010
Figure 11. Strain distribution curves along wall height for early and late hydration stages: (a) continuous wall with widening defects; (b) continuous wall with void defects; (c) continuous wall with mud-inclusion defects; (d) continuous wall with necking defects.
Buildings 15 01350 g011aBuildings 15 01350 g011b
Figure 12. Strain distribution curves along wall height when monitoring line passes through different defect zones.
Buildings 15 01350 g012
Figure 13. Concrete defect type identification process based on temperature–strain combined monitoring.
Buildings 15 01350 g013
Table 1. Material property parameters.
Material Property Name, Symbol (Unit)Value
Concrete density, ρ (kg/m3)2450
Convective heat-transfer coefficient of sidewall template (W/(m2 K))2.75
Concrete heat capacity, ct (J/(kg K))940
Heat conductivity, λ (W/(m K))2.4
Convective heat-transfer coefficient of side-wall concrete surface (W/(m2 K))6.0
Specific heat capacity of the foundation, (J/(kg K))1005
Initial temperature of concrete and environment, T0 (K)293
Solid bulk modulus, Kr (GPa)44
Table 2. Statistical validation of the finite element model against experimental measurements at two monitoring points (temperature in °C; strain in με).
Monitoring PointRMSE (Temperature)R (Temperature)RMSE (Strain)R (Strain)
Point 11.1 °C0.985 με0.96
Point 21.3 °C0.976 με0.95
Table 3. Continuous wall types and their definitions.
TypeConcept
Intact WallA continuous wall with a uniform structure and no internal defects.
VoidAn internal cavity in the continuous wall where concrete is absent.
Mud InclusionA layer of mud or weak material embedded within the continuous wall.
NeckingA local reduction in the thickness of the continuous wall.
WideningA local increase in the thickness of the continuous wall.
Disclaimer/Publisher’s Note: The statements, opinions and data contained in all publications are solely those of the individual author(s) and contributor(s) and not of MDPI and/or the editor(s). MDPI and/or the editor(s) disclaim responsibility for any injury to people or property resulting from any ideas, methods, instructions or products referred to in the content.

