Article

Safety Risk Assessment of Deep Excavation for Metro Stations Using the Second Improved CRITIC Cloud Model

1
Faculty of Civil Engineering Technology, Universiti Malaysia Pahang Al-Sultan Abdullah (UMPSA), Kuantan 26300, Malaysia
2
Faculty of Civil and Architectural Engineering, Tongling University, Tongling 244061, China
*
Author to whom correspondence should be addressed.
Buildings 2025, 15(8), 1342; https://doi.org/10.3390/buildings15081342
Submission received: 16 March 2025 / Revised: 9 April 2025 / Accepted: 15 April 2025 / Published: 17 April 2025
(This article belongs to the Section Construction Management, and Computers & Digitization)

Abstract

The safety risk evaluation of foundation pit excavations in metro stations involves multiple factors with randomness and fuzziness. This study improves the Second Improved CRITIC-Cloud Model for more precise risk assessment. The approach integrates coefficients of variation-based weighting, absolute correlation adjustments, and multidimensional cloud modeling with set pair theory. A dynamic depth-based normalization technique reduces indicator biases. Using Hefei Metro Line 7 Phase I as a case study, we analyzed seven indicators across nine construction stages. The results show that the building settlement (A2) and horizontal displacement of the support structure (A7) have the greatest impact. Comparative analysis with entropy-based methods confirms the model’s effectiveness in capturing risk transitions and improving decision making.

1. Introduction

With rapid urbanization and economic growth, numerous infrastructure projects, such as high-rise buildings, rail transit, utility corridors, and carbon reduction initiatives, have been developed. However, due to limited surface space, deep excavation for subway stations has become a representative example of efficient urban space utilization [1]. These deep excavation projects are often situated in areas with heavy traffic, high-rise buildings, and complex underground pipelines, making soil deformation during construction a common issue. If not properly controlled, it can have severe impacts on the surrounding environment, or even cause collapse [2]. Therefore, it is crucial to use scientific methods to assess the risks associated with damage in deep excavation projects.
On-site monitoring is effective in managing the excavation process and implementing appropriate measures. However, deep excavation is a complex and high-risk activity that requires advanced prediction and preventive strategies. Currently, most scholars rely on expert judgment and traditional evaluation methods for risk assessment, including single-factor evaluation [3], analytic hierarchy process (AHP) [4], fuzzy comprehensive evaluation (FCE) [5,6], grey relational analysis [7], set pair analysis [8,9], and cloud model methods [10,11,12].
Each of these methods has its strengths and limitations. Single-factor evaluation only considers individual indicators, failing to capture the comprehensive influence of multiple factors. The AHP, which integrates both qualitative and quantitative analysis, has been employed for risk assessment in deep foundation pit construction. Representative evaluation indicators include the lateral displacement of bridge pile foundations, internal forces within the piles, and ground settlement around the pile foundations. Although the resulting data are relatively straightforward to interpret, the construction of the pairwise comparison matrix is highly dependent on expert judgment, rendering the evaluation results susceptible to subjectivity [13]. The FCE method transforms qualitative assessments into quantitative outcomes through fuzzy set theory. However, the weight determination process is relatively complex and may lead to information distortion or loss. In the Huizhan Center Station project of Zhengzhou Metro Line 1 Phase I, a combined AHP-FCE approach was adopted. By monitoring key indicators such as the inclination of the retaining wall, axial forces of support, settlement of columns, external groundwater levels, and surface settlement, a safety evaluation model of the foundation pit system was established [14]. The Grey Relational Analysis (GRA) method effectively captures the trend relationships among factors, yet the selection of evaluation indices may introduce errors. The set pair analysis (SPA) method is capable of handling both certainty and uncertainty within complex systems. Nevertheless, it may overlook critical indicators with low assigned weights. In the Qi’anfu project, the partial derivatives of five connection number components were utilized to evaluate dynamic construction risks; however, the non-universality of the index system and insufficient engineering data posed limitations [15]. Cloud models combine statistical analysis with fuzzy mathematics, but traditional normal cloud models require indicators to conform to a normal distribution over an infinite range. In practice, indicators are often distributed over a finite range, making it difficult to accurately reflect their relationship with evaluation levels.
Safety risk assessment indicators for deep excavation often exhibit fuzziness and randomness within a specific range. For example, one side may have an undefined boundary even though structural damage has already occurred. Measured indicators exhibit characteristics of both certainty and uncertainty, as well as transitions between levels. Additionally, foundation pit excavation is a three-dimensional dynamic process, making it challenging to determine the trend of changes. Traditional evaluation methods struggle to describe the conversion dynamics of measured indicators between different levels, leading to discrepancies between the evaluation results and real-world situations [16].
Recently, the CRITIC method [17] has been widely used in safety assessments of hydraulic engineering and excavation projects. The CRITIC-TOPSIS method has proven effective in analyzing risk factors and ranking their impact. The CRITIC method’s advantage lies in its consideration of inter-indicator correlations, allowing for a scientific ranking of risk factors based on their degree of influence. However, while the CRITIC method can handle complex information, it still has room for improvement when addressing high degrees of fuzziness and uncertainty [18,19,20]. The improved CRITIC method, which integrates fuzzy sets and cloud models, further enhances its ability to handle uncertain information. However, this improved method also has limitations, such as correlation issues between different evaluation indicators and dealing with incomplete data. Future research should focus on optimizing the CRITIC method to enhance its precision and stability in various complex engineering applications, providing a more reliable basis for safety assessments in construction [21].
The cloud model, as a tool for handling uncertainty, has demonstrated strong adaptability and potential in project and emergency management. Its advantage lies in combining qualitative evaluation with quantitative analysis, effectively addressing fuzziness and randomness to enhance the scientific and accurate nature of risk assessments. For example, the cloud model, combined with the improved Dempster–Shafer evidence theory, has been successfully applied in subway excavation collapse risk assessments, resolving high-conflict evidence fusion issues and significantly improving the reliability and efficiency of data integration [22]. Furthermore, an improved combination weighting method integrating AHP and entropy weighting with the cloud model has been used to comprehensively evaluate metro station emergency management capabilities. Its practical application has validated the model’s effectiveness in complex system evaluations [23].
However, the cloud model faces certain challenges in practice. First, its sensitivity to parameters makes it vulnerable to subjective bias during expert weighting, resulting in unstable outcomes. Second, the model’s high computational complexity in big data scenarios can hinder real-time risk warnings. To address these issues, the improved CRITIC-Cloud Model was developed, introducing an objective weighting strategy to reduce subjectivity and enhance the rationality of indicator weight distribution and model adaptability. In subway construction risk assessments, the combination of the improved CRITIC method and the cloud model effectively identifies risk factors and proposes targeted countermeasures, mitigating potential losses [24,25].
This study adopts the Second Improved CRITIC weighting method based on cloud theory and set pair analysis (SPA) to construct a multidimensional normal cloud evaluation model, effectively overcoming the limitations mentioned above. Specifically, the coefficient of variation is introduced to replace the standard deviation in measuring indicator variability, and r k i is replaced with | r k i | , when calculating the quantitative coefficient of indicator independence, ensuring that correlations with the same absolute value are treated equally. This refinement constitutes the improved CRITIC method [26]. Additionally, the unique characteristics of foundation pit evaluation, which involve a three-dimensional dynamic process where evaluation indicators exhibit nonlinear changes with increasing excavation depth and time, are considered. Traditional methods often assign disproportionately large weights to indicators with inherently larger values, such as comparing ground settlement (2 mm) to supporting axial force (1000 kN). To address this, the ratio method (numerical normalization) is introduced, using the ratio of monitored values to either depth or limit values as evaluation indicators. This approach not only avoids the complexities of three-dimensional dynamic studies (time and depth), but also prevents weight imbalances caused by significantly large indicator values, resulting in the Second Improved CRITIC method. Set pair analysis, also known as connection mathematics, is an analytical method for handling uncertainty by integrating qualitative and quantitative aspects of decision making [27]. It allows for the analysis of systems influenced by randomness, fuzziness, and incompleteness, uncovering implicit knowledge and revealing internal patterns. The cloud model employs multidimensional cloud integration to account for the influence of each indicator, minimizing errors from low-weight factors and reducing computational complexity. By incorporating the set pair theory’s same–difference–opposite principle, the model reflects the uncertainty transition between different evaluation levels, providing a quantitative description of the relationship between measured indicators and evaluation levels. Finally, in determining the safety risk level during deep excavation, both the maximum certainty method and the Kp method are considered. Three different approaches to risk level determination are proposed, providing a reliable framework for future risk assessments of deep excavation processes.

2. Engineering Case and Methodology

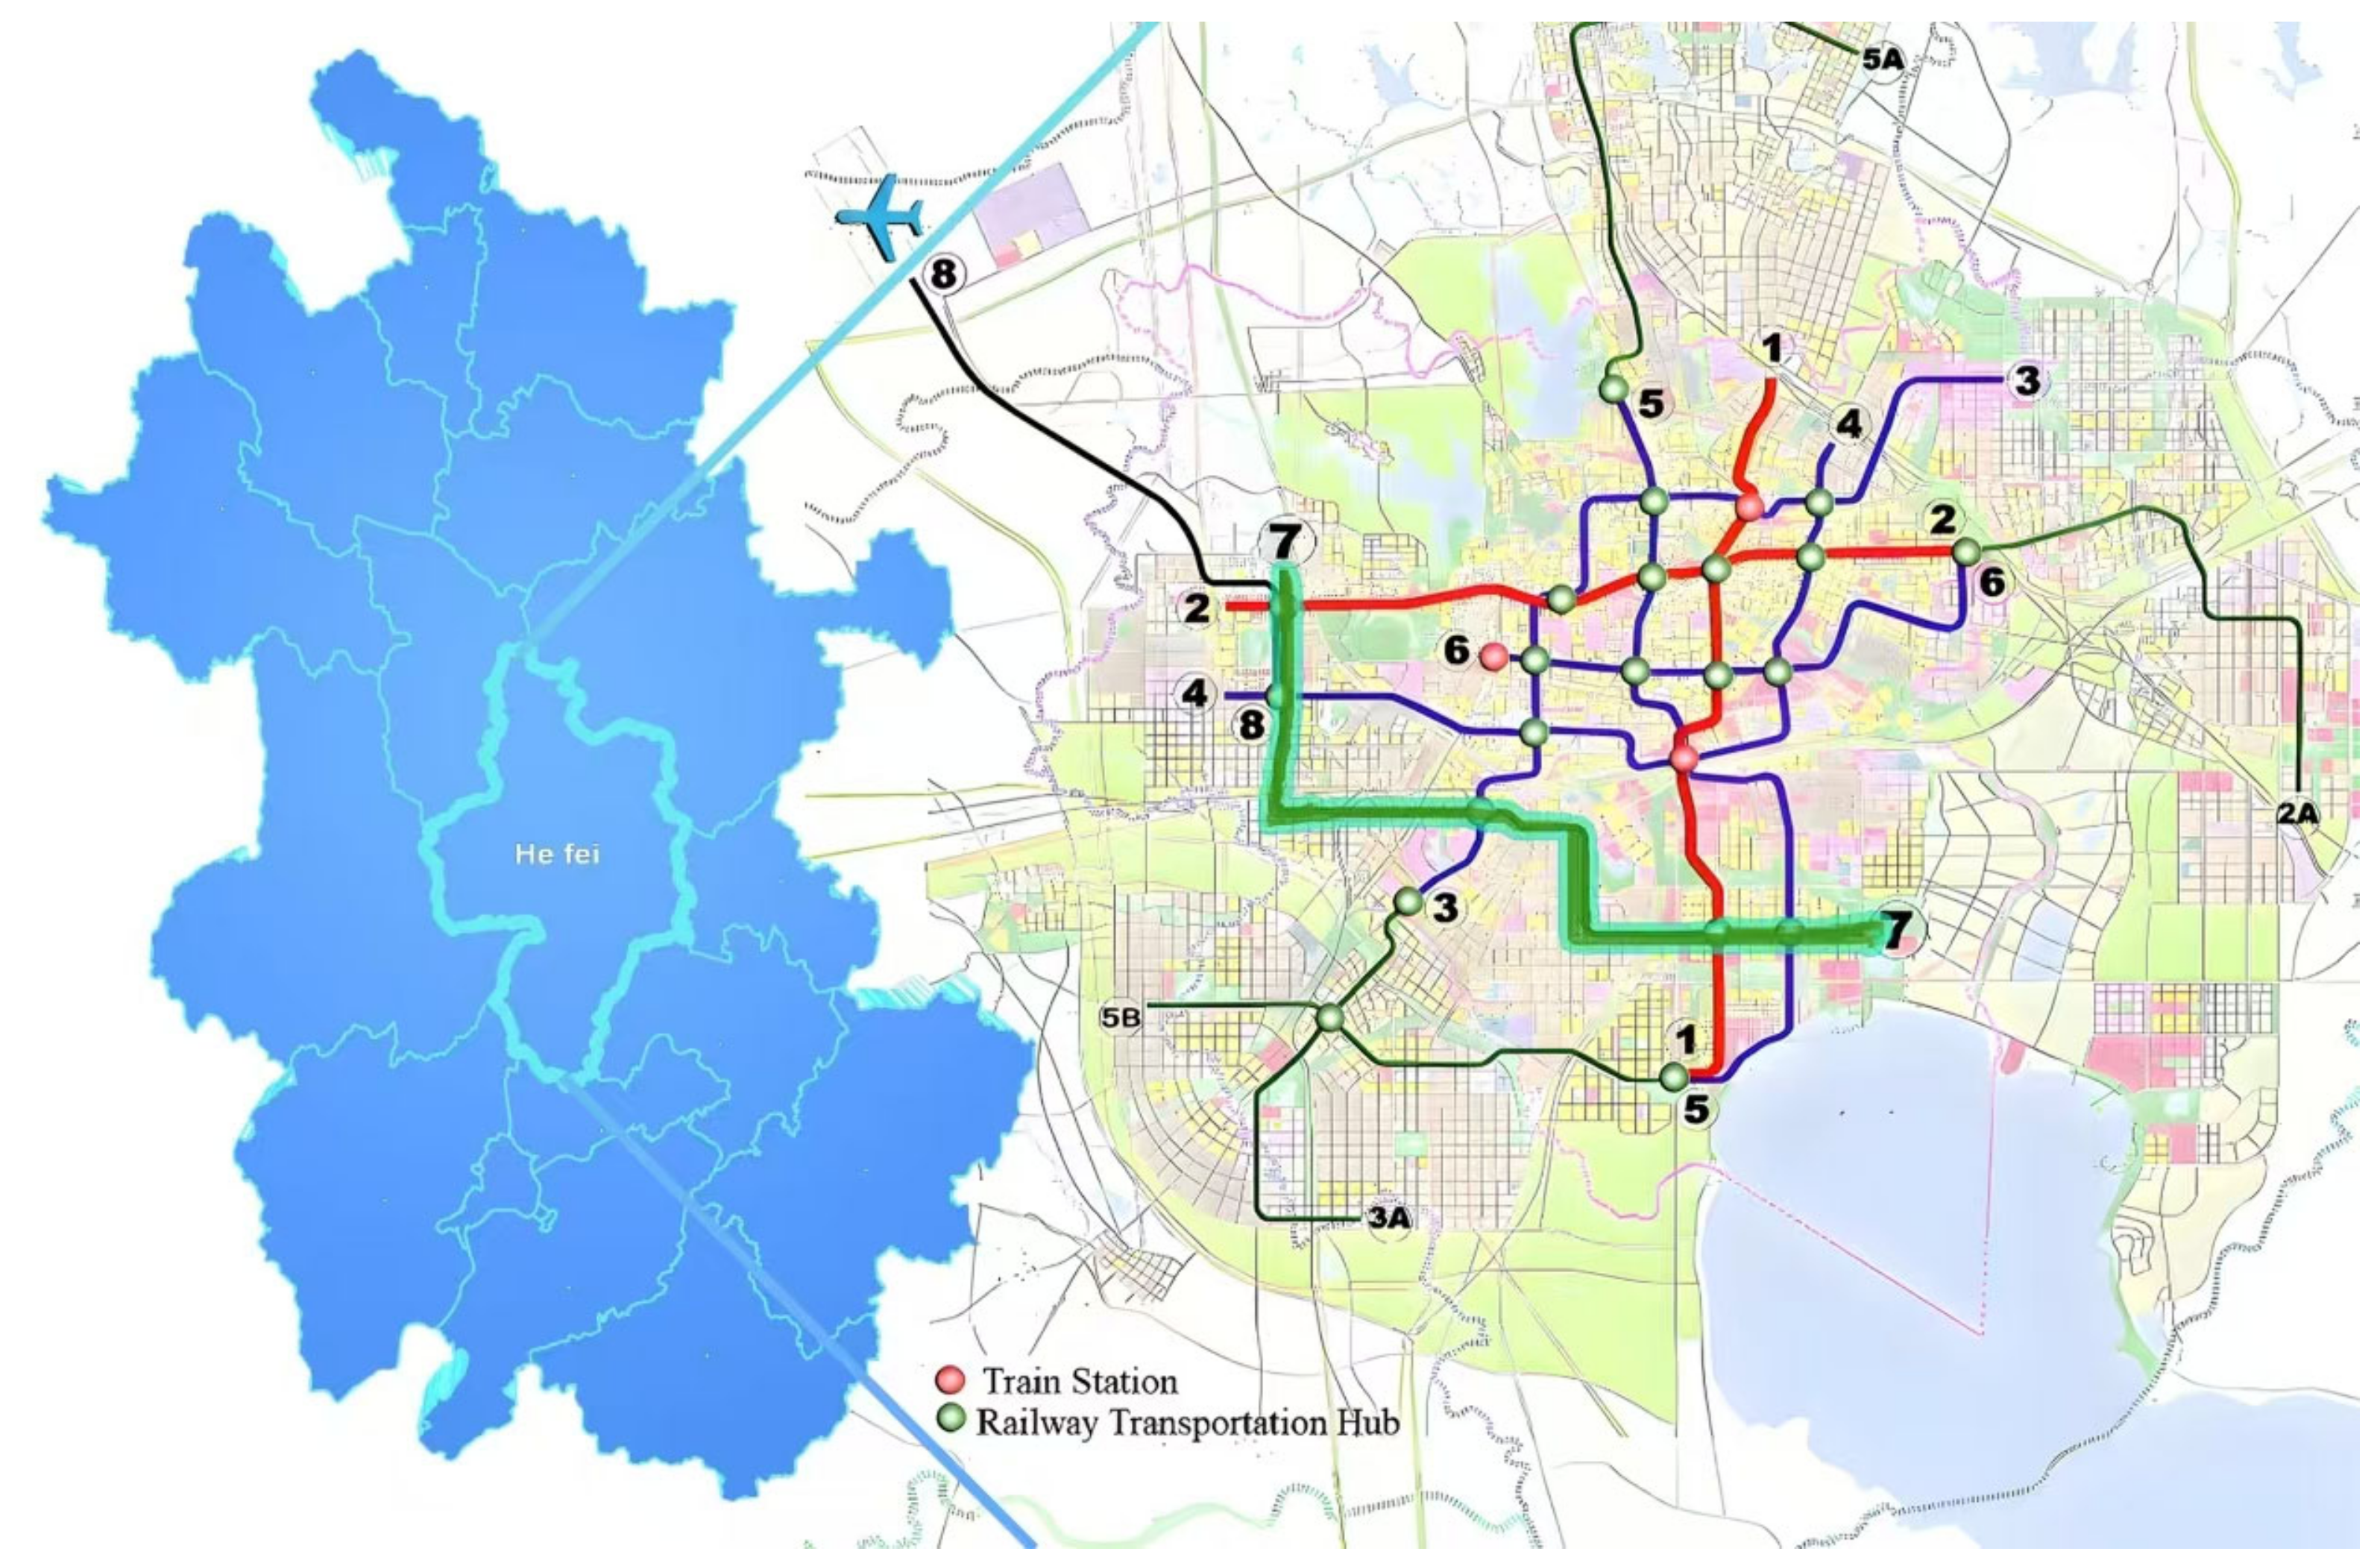
2.1. Engineering Case

This study uses the Phase 1 project of Hefei Metro Line 7 as an example (Anhui Province, China). The project starts at Soglin Road Station in the west and ends at Tianjin Road Station. The total length is approximately 18.85 km, with 15 underground stations. The eastern end well section station is 293.21 m in length, with an excavation depth of 17.45 m. The retaining structure of the foundation pit uses bored piles, while the horizontal structure employs both concrete and partial steel supports. The geological conditions along the route contain expansive soils characterized by water absorption and shrinkage upon drying, which can impact the excavation process. Additionally, the surrounding area features many high-rise buildings, roads, and a dense and complex network of underground pipelines, imposing strict requirements on the overall safety and stability of the excavation, as shown in Figure 1.
The monitoring data obtained during the excavation of the eastern end well section were selected and organized [28], as shown in Table 1. Given the prevalence of expansive soils, the large scale of the project, tight construction schedule, numerous surrounding buildings, and complex underground pipeline networks, this study identifies seven representative indicators: ground subsidence (a1), adjacent building settlement (a2), horizontal displacement at the pile top (a3), pile top settlement (a4), axial force of internal support (a5), pipeline settlement (a6), and horizontal displacement of the support structure (a7). These indicators form the basis for the safety risk evaluation system. Collectively, they reflect surface responses, structural deformations, and environmental impacts, and are capable of comprehensively characterizing major risk factors associated with metro station deep excavation. Similar sets of indicators have been widely adopted in previous studies on risk assessment for deep foundation pits and subway projects, where ground and building settlement, retaining structure displacement, pile response, and support forces are commonly used to capture structural behavior and construction-induced disturbances [29,30,31]. Pipeline deformation—given its critical role in urban infrastructure—is often considered a key indicator for evaluating construction risk [32,33]. The selected indicators are, thus, consistent with prior research and provide a representative practical basis for data-driven risk identification and dynamic assessment.
Based on the characteristics of this case, the project’s monitoring and control requirements, and the safety standards for building foundation pits, a safety risk level evaluation system was established by referencing the existing safety risk assessment criteria for deep excavation projects, as shown in Table 2 [34,35]. The safety risk levels are divided into three categories: Level I indicates a hazardous state, Level II a warning state, and Level III a safe state. During the calculation of the evaluation indicators, the excavation depth is set at 17.45 m, and the design value of the internal support axial force N is 4500 kN. ai denotes the monitored data, Ai represents the normalized value obtained using the ratio method, and Hi refers to the corresponding excavation depth.
Considering the variation of deformation with depth, and to facilitate a comparison between foundation pit monitoring data and evaluation standards, Table 1 can be modified as follows using Equation (6). Note that, except for A5, which is in units of kN/kN, all other Ai indicators are in units of mm/m, as shown in Table 3.

2.2. Cloud Model

The cloud model, first proposed by Academician Li Deyi of the Chinese Academy of Engineering [36], is a model for uncertain transformation between qualitative concepts and quantitative descriptions. It has been successfully applied in fields such as natural language processing, data mining, decision analysis, intelligent control, and image processing [37].
In deep excavation risk analysis, existing methods have incorporated multi-source monitoring data (such as support structure displacement and ground surface settlement) to construct a benchmark and identify cloud models for risk level determination, which have been validated in practical engineering applications [38]. In the assessment of water inrush risk in tunnels, studies have introduced the normal cloud model combined with integrated weighting methods to establish multi-index evaluation systems, using cloud droplets and membership degrees to quantify fuzzy and uncertain information [39]. In addition, some researchers have combined set pair analysis with seismic prediction data, employing rock mass physical parameters (including P-wave velocity, rock mass integrity, and Young’s modulus) to construct connection degree models for predicting the stability of tunnel surrounding rock [27]. These findings indicate that such methods offer strong engineering applicability and practical value for risk identification under complex geological conditions.
The multidimensional cloud was developed from the one-dimensional cloud model [40], overcoming the computational complexity encountered in traditional models when dealing with multiple evaluation indicators, categories, and samples. It has been widely applied in qualitative analysis in fields such as water resources and agriculture. However, when determining the digital characteristics of the multidimensional normal cloud model, subjectivity can introduce errors into the results [41].
Set pair analysis (SPA) is used to analyze the certainty and uncertainty of the system, based on the principles of similarity, difference, and opposition [42]. The core concept of SPA is to analyze and handle the relationships between elements in complex and uncertain systems. The theory divides the relationship between two systems or elements into three aspects: similarity (common points), difference (distinct points), and opposition (contradictory points). These three components are interdependent, forming a comprehensive framework for relationship analysis. Its advantage lies in considering similarities, differences, and oppositions within systems simultaneously, enabling a more comprehensive analysis of complex systems and avoiding the limitations of single-dimensional approaches. The flexibility of SPA in handling uncertainty and fuzziness makes it effective in dealing with real-world complexity and diversity. By emphasizing holistic thinking and systemic analysis, SPA provides better insight into the essential characteristics and development trends of systems through a comprehensive examination of similarities, differences, and oppositions. It has been widely applied in decision analysis, risk management, and systems engineering. Overall, the similarity–difference–opposition principle provides a powerful tool for understanding and managing complex uncertain systems, offering both theoretical and practical advantages [43].
The 3En rule of the cloud model represents the evaluation domain through the “3En rule” of the normal cloud [44], which is suitable for situations involving large datasets and is derived from the algebraic operations of the cloud. Specifically, 99.7% of cloud droplets fall within the interval [Ex − 3En, Ex + 3En], meaning that, for a qualitative concept, the probability of cloud droplets falling outside this interval is negligible. Thus, data in the core and edge regions of the cloud exhibit high similarity, while data in the outer regions exhibit low similarity. The cloud model uses three numerical characteristics to express concepts in natural language, capturing the uncertainty and indeterminacy inherent in natural language descriptions, particularly randomness and fuzziness. It has been successfully applied in various fields, such as industry, transportation, and medicine, to study issues related to intelligent control, decision making, and forecasting. However, the 3En rule of the cloud model has certain limitations. For instance, when dealing with high levels of uncertainty and fuzziness, the accuracy of the cloud model may be affected. To address this limitation, researchers have proposed several improvements to the cloud model, such as multilevel cloud models and fuzzy cloud models. These improvements have enhanced the cloud model’s performance in handling uncertainty problems to some extent, leading to the construction of a multidimensional cloud evaluation model.
Suppose the research object can be divided into m(j = 1, 2, 3……m) categories, and there are n(i = 1, 2, 3……n) grades of corresponding evaluation indicators. Let U(x1, x2, …, xm) be an m-dimensional quantitative domain expressed in precise numerical values, and C be a qualitative concept on U(x1, x2, , xm). If X(x1, x2, , xm) satisfies X(x1, x2, , xm)~N(Ex(Ex1, Ex2, , Exm) and (En′(En1, En2, , Enm))2), where En′(En1, En2, , Enm)~N(En(En1, En2, , Enm), (He(He1, He2, , Hem))2), and X(x1, x2, , xm), have a certainty degree u(x(x1, x2, , xm)) ∈ (0, 1), then the certainty degree of x to C is as follows.
u x x 1 ,   x 2 , , x m   = e x p j = 1 m ( x j E x j ) 2 2 ( E n j ) 2
Based on the ICD principle of SPA and the 3En rule of the cloud model, it is defined that, when the measured sample falls within the i grade interval [ C m i n   i , C m a x i ], the relationship is identity, and the cloud connection degree u ∈ [0.5, 1]; when the sample falls within [ E x i 3 E n i , C m i n i ] and [ C m a x i , E x i + 3 E n i ], the relationship is discrepancy; when the sample falls in other intervals, the relationship is contrary. Therefore, the cloud connection degree quantitatively reflects the identity and discrepancy relationships between levels and the transition trends between different levels. When the cloud connection degree is less than 0.5, the certainty of the evaluation index for the level is small, indicating a trend of transition to other levels. When the cloud connection degree approaches 0.5, the uncertainty of the evaluation index for the level is high, indicating a higher tendency for mutual transition. When the cloud connection degree approaches 1, the certainty of the evaluation index for the level is relatively high. The calculation formula for the connection cloud of the i-level for the j-th evaluation indicator is as follows [45].
E x j i = C i max j + C i min j 2
E n j i = C i max j E x j i ln 4
H e j i = k E n j i
u i ( x i ( x 1 i , x 2 i , , x m i ) ) = e x p j = 1 m ( x j i E x j i ) 2 2 ( E n j i ) 2
Here, x j i ~Normrnd ( E x j i ,   ( E n j i )2) and E n j i ~Normrnd ( E n j i , ( H e j i ) 2), where the expectation E x j i represents the central value of the domain interval; the entropy E n j i represents the measure of randomness of the indicator; the hyper-entropy H e j i represents the fuzziness of the indicator; and C m a x j i , C m i n j i are the maximum and minimum boundaries of the i-th grade standard, respectively. The k value reflects the linear relationship between E n j i and H e j i , adjusting the model’s degree of fuzziness, with k set to 0.1 in this study.
As seen in Table 2, the safety risk evaluation standards for deep excavations indicate that the evaluation indicators can approach infinity or zero. However, actual engineering conditions must be considered, as the pit may already show signs of damage or even collapse. Therefore, it is assumed that the grading standards for positive indicators in Levels I, II, and III are (−∞, Cmin), (Cmin, Cmax), and (Cmax, +∞), respectively. The left boundary for Level I can be set to 0~(0.3~0.5) Cmin, and the right boundary for Level III to (2~4) Cmax. Since this study focuses on a major safety evaluation for deep excavations, conservative values of 0.5 Cmin and 2 Cmax are adopted [46].

2.3. The Second Improved CRITIC Methods

Common methods for determining indicator weights include the analytic hierarchy process (AHP), Delphi method, and Grey Relational Analysis [47], as well as fuzzy comprehensive evaluation [48] and the entropy method [49]. The first three are subjective weighting methods, which are easily influenced by expert experience and human factors. The resulting weights can vary depending on the experts involved, leading to potential deviations from actual conditions. The latter three are objective weighting methods, which rely on data for calculation without requiring expert input. However, the entropy method cannot reduce the dimensionality of indicators and may overlook their importance, possibly resulting in weight outcomes that do not align with expectations.
In contrast, the CRITIC method considers both the variation in indicator data and their correlations. It considers not only the impact of indicator variability on weights, but also the conflicts (correlations) between indicators, making it superior to the entropy method, which only considers variability.
The CRITIC method was proposed by Diakoulaki, Mavrotas, and Papayannakis in 1995 and is primarily used to determine the weights of attributes. In this method, the attributes are non-conflicting with each other, and their weights are determined based on the decision matrix [50]. However, the CRITIC method has two main issues: (1) Since the dimensions and magnitudes of safety risk indicators in deep excavation differ, using standard deviation to measure variability is unreasonable. (2) The correlation between excavation safety risk indicators can be both positive and negative. Positive and negative correlations with the same absolute value reflect an equal degree of conflict between indicators [51]. Therefore, this method has been improved in three main aspects: First, the coefficient of variation is introduced to replace the standard deviation for measuring the variability of indicators. Second, r k i is replaced with | r k i | when calculating the quantitative coefficient of indicator independence, leading to the improved CRITIC method. Third, the ratio method is introduced to preliminarily process dynamic monitoring indicators, resulting in the Second Improved CRITIC method.

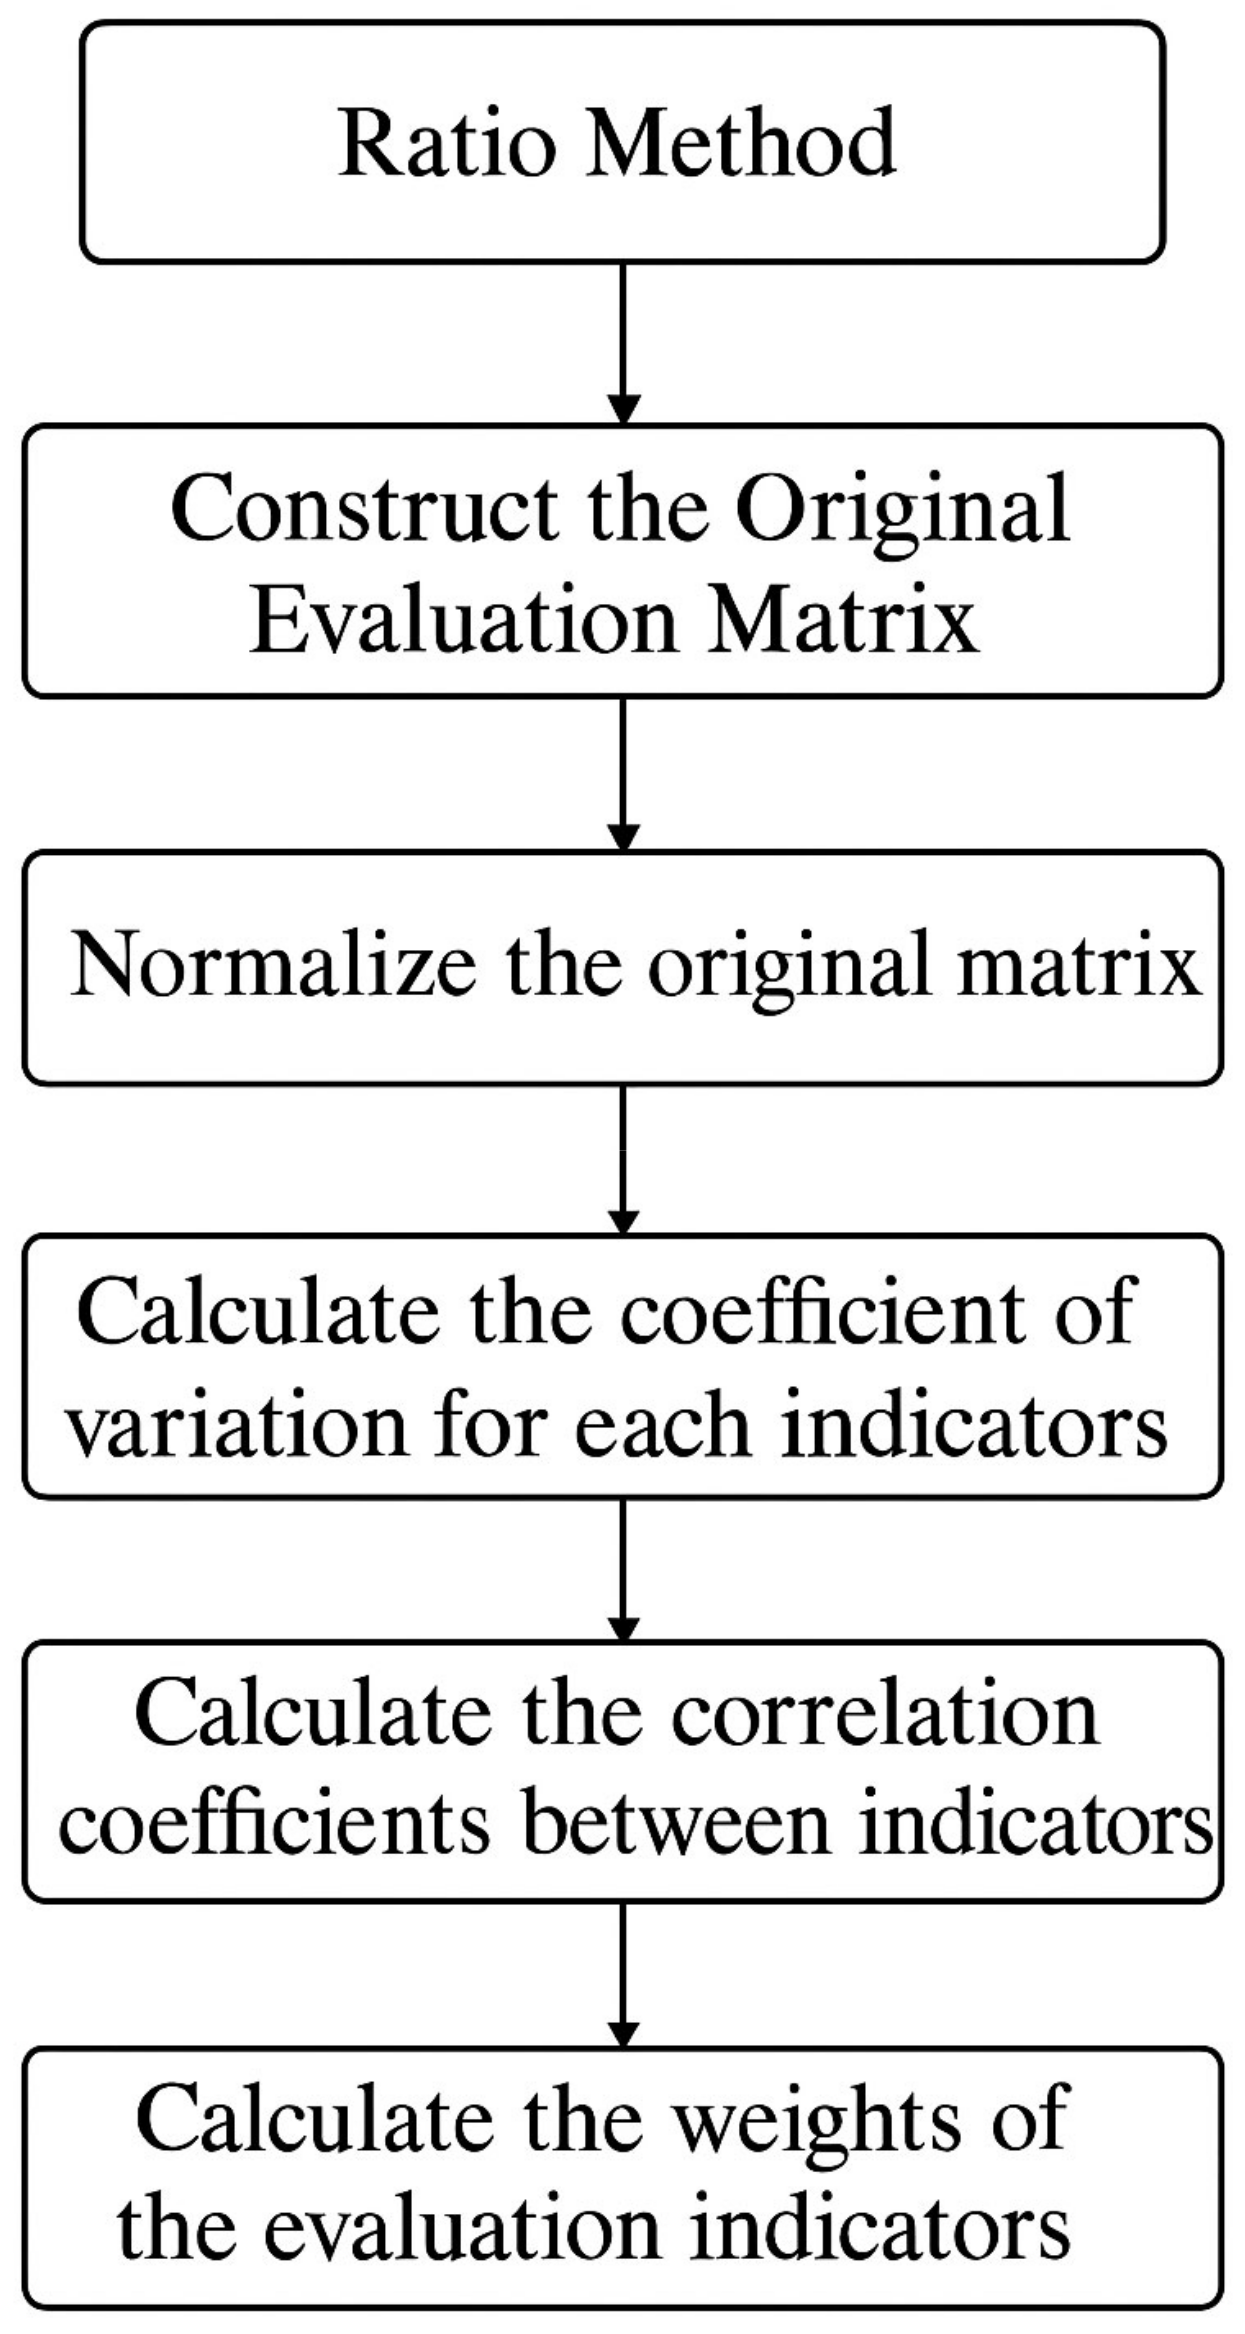
2.4. Determination of Evaluation Indicator Weights

This study uses the Second Improved CRITIC method to determine the weights of indicators in the dynamic deep excavation process, as shown in Figure 2. The main steps are as follows.
  • Ratio method
Assuming that the dynamic evaluation of the foundation pit can be divided into m objects with n corresponding evaluation indicators, each monitored value x j i is normalized to x j i , as follows.
x j i = x j i h k   i   = 1 ,   2 ,   3 n ,   j = 1 ,   2 ,   3 m ,   k = 1 ,   2 ,   3
2.
Construct the original evaluation matrix
The score xji of the i-th evaluation indicator for the j-th evaluation object constitutes the original evaluation matrix X = (xji)n.
3.
Normalize the original matrix
In this study, the Z-score method is used due to its simplicity, ease of implementation in software programming, and its ability to avoid errors caused by differences in dimensions and magnitudes [52]. The original matrix indicator values are standardized using the following formula.
x j i * = x j i x i s i   ( i = 1 , 2 , 3 n ,   j = 1 , 2 , 3 m )
x i = 1 m j = 1 m x j i  
s i = 1 m 1 j = 1 m ( x j i -   x i )
Here, x i is the mean of the i-th indicator and si is the standard deviation of the i-th indicator. The standardized evaluation matrix is X* = (xji)n.
4.
Calculate the coefficient of variation for each indicator
δ i = s i x i ( i = 1 ,   2 ,   3 n )
Here, δ i is the coefficient of variation for the i-th indicator.
5.
Calculate the correlation coefficients between indicators
(1) The Pearson correlation coefficient, as a key factor in the Second Improved CRITIC method, is primarily used to measure the conflict between evaluation indicators. First, the standardized matrix x* obtained from step (2) is used to calculate the correlation coefficient matrix R = rkl)n×n.
r k l = j = 1 m ( x j k * x k * ) ( x j l * x l k * ) j = 1 m ( x j k * x k * ) 2 ( x j l * x l k * ) 2   ( k = 1 ,   2 ,     n ;   l   =   k   +   1 ,   k   +   2 ,   ,   n )
Here, x j k * , x j l * are the standardized scores of the k-th and l-th indicators for the j-th evaluation object, respectively, and x k * , x l * are their means.
(2) When the monitoring data do not satisfy the assumptions of linearity or normality required by the Pearson correlation, or involve ordinal variables or significant outliers, the Spearman rank correlation coefficient serves as a more robust alternative [53]. By ranking the data prior to calculation, Spearman’s method reduces sensitivity to extreme values and is well suited for analyzing non-normal or nonlinear relationships, particularly those involving ranked or ordinal indicators. Unlike the Pearson correlation, which relies on raw values, the Spearman correlation replaces them with their ranks. In the case of ties, where identical values occur, average ranks are assigned to maintain consistency [54].
Compared to the Pearson correlation coefficient formula, the Spearman rank correlation coefficient replaces the original variables x j k * and x j l * with their corresponding ranks R x j k * and R x j l * . Specifically, the variables x j k * and x j l * are first sorted in ascending order, and the assigned ranks are denoted as R x j k * and R x j l * , respectively. The formula is given as follows.
r k l = j = 1 m ( R x j k * R x k * ) ( R x j l * R x l k * ) j = 1 m ( R x j k * R x k * ) 2 ( R x j l * R x l k * ) 2   ( k = 1 ,   2 ,     n ;   l   =   k   +   1 ,   k   +   2 ,   ,   n )
Based on matrix R, the independence coefficient for each indicator is calculated as follows.
Δ i = k = 1 n ( 1 | r k i | )   ( i = 1 ,   2 ,     n )
6.
Calculate the weights of the evaluation indicators
First, calculate the comprehensive coefficient for each indicator.
C i = δ i Δ i           ( i = 1 ,   2 ,     n )
Then, determine the weight coefficient.
ω i = C i i = 1 n C i           ( i = 1 ,   2 ,     n )

2.5. Determination of Safety Risk Levels for Excavation Process

After establishing the multidimensional cloud model and determining the indicator weights using the Second Improved CRITIC method, the next step in completing the safety risk evaluation for the Hefei Metro deep foundation pit project is to determine the specific risk level category. This categorization is essential for implementing appropriate safety measures to ensure construction safety.
Common methods for determining the risk level include the Maximum Comprehensive Certainty Method and the Kp Method. This study adopts a combination of both methods to obtain the certainty values of each level based on the multidimensional connection cloud model.
  • When one level’s comprehensive certainty in the sample is significantly larger than the others’ (the maximum value is at least twice the second largest), the level is determined using the Maximum Comprehensive Certainty Method.
U = max{u1, u2, …, un}
2.
When the difference between the maximum and second-largest comprehensive certainty values is small (relatively close), the Kp Method is used. The Kp value is defined as 0–1 for Level I, 1–2 for Level II, and so on for the iii-th level [55].
K p = i n i × μ i i n μ i
3.
When the comprehensive certainty values for each level fall between the two cases mentioned above—some values are close, while others differ significantly—the excavation is considered a high-risk project. In this situation, both the Maximum Comprehensive Certainty Method and the Kp Method are used, and the smaller value is taken to indicate a more dangerous state Kp.
U = min[max{u1, u2, …, un}, Kp]

2.6. Multidimensional Connection Cloud Model

Based on monitoring data and the weights derived from the second improved CRITIC method, the cloud connection degree corresponding to each risk level of the deep foundation pit is calculated. The specific cloud connection degree model is defined as follows:
  • When xi∈ [ E x i 3 E n i , E x i + 3 E n i ], it is considered as belonging to be in the identity or difference relationship:
    u i [ x i ( x 1 i , x 2 i , , x m i   ) ] = exp j = 1 m ω j ( x j i E x j i ) 2 2 ( E n j i ) 2
2.
When other intervals:
u i [ x i ( x 1 i , x 2 i , , x m i   ) ] = exp j = 1 m ω j × ( 4.5 )

3. Results

Deep excavation projects are typically located in urban centers with dense buildings, complex underground utilities, and limited construction space. Inadequate support may lead to ground settlement, pipeline damage, structural deformation, or even collapse, posing serious threats to safety and property. Additionally, construction activities often cause noise, dust, and traffic disruption, affecting daily life. Therefore, a reliable risk assessment method is essential to ensure safety while minimizing the construction period [56,57].

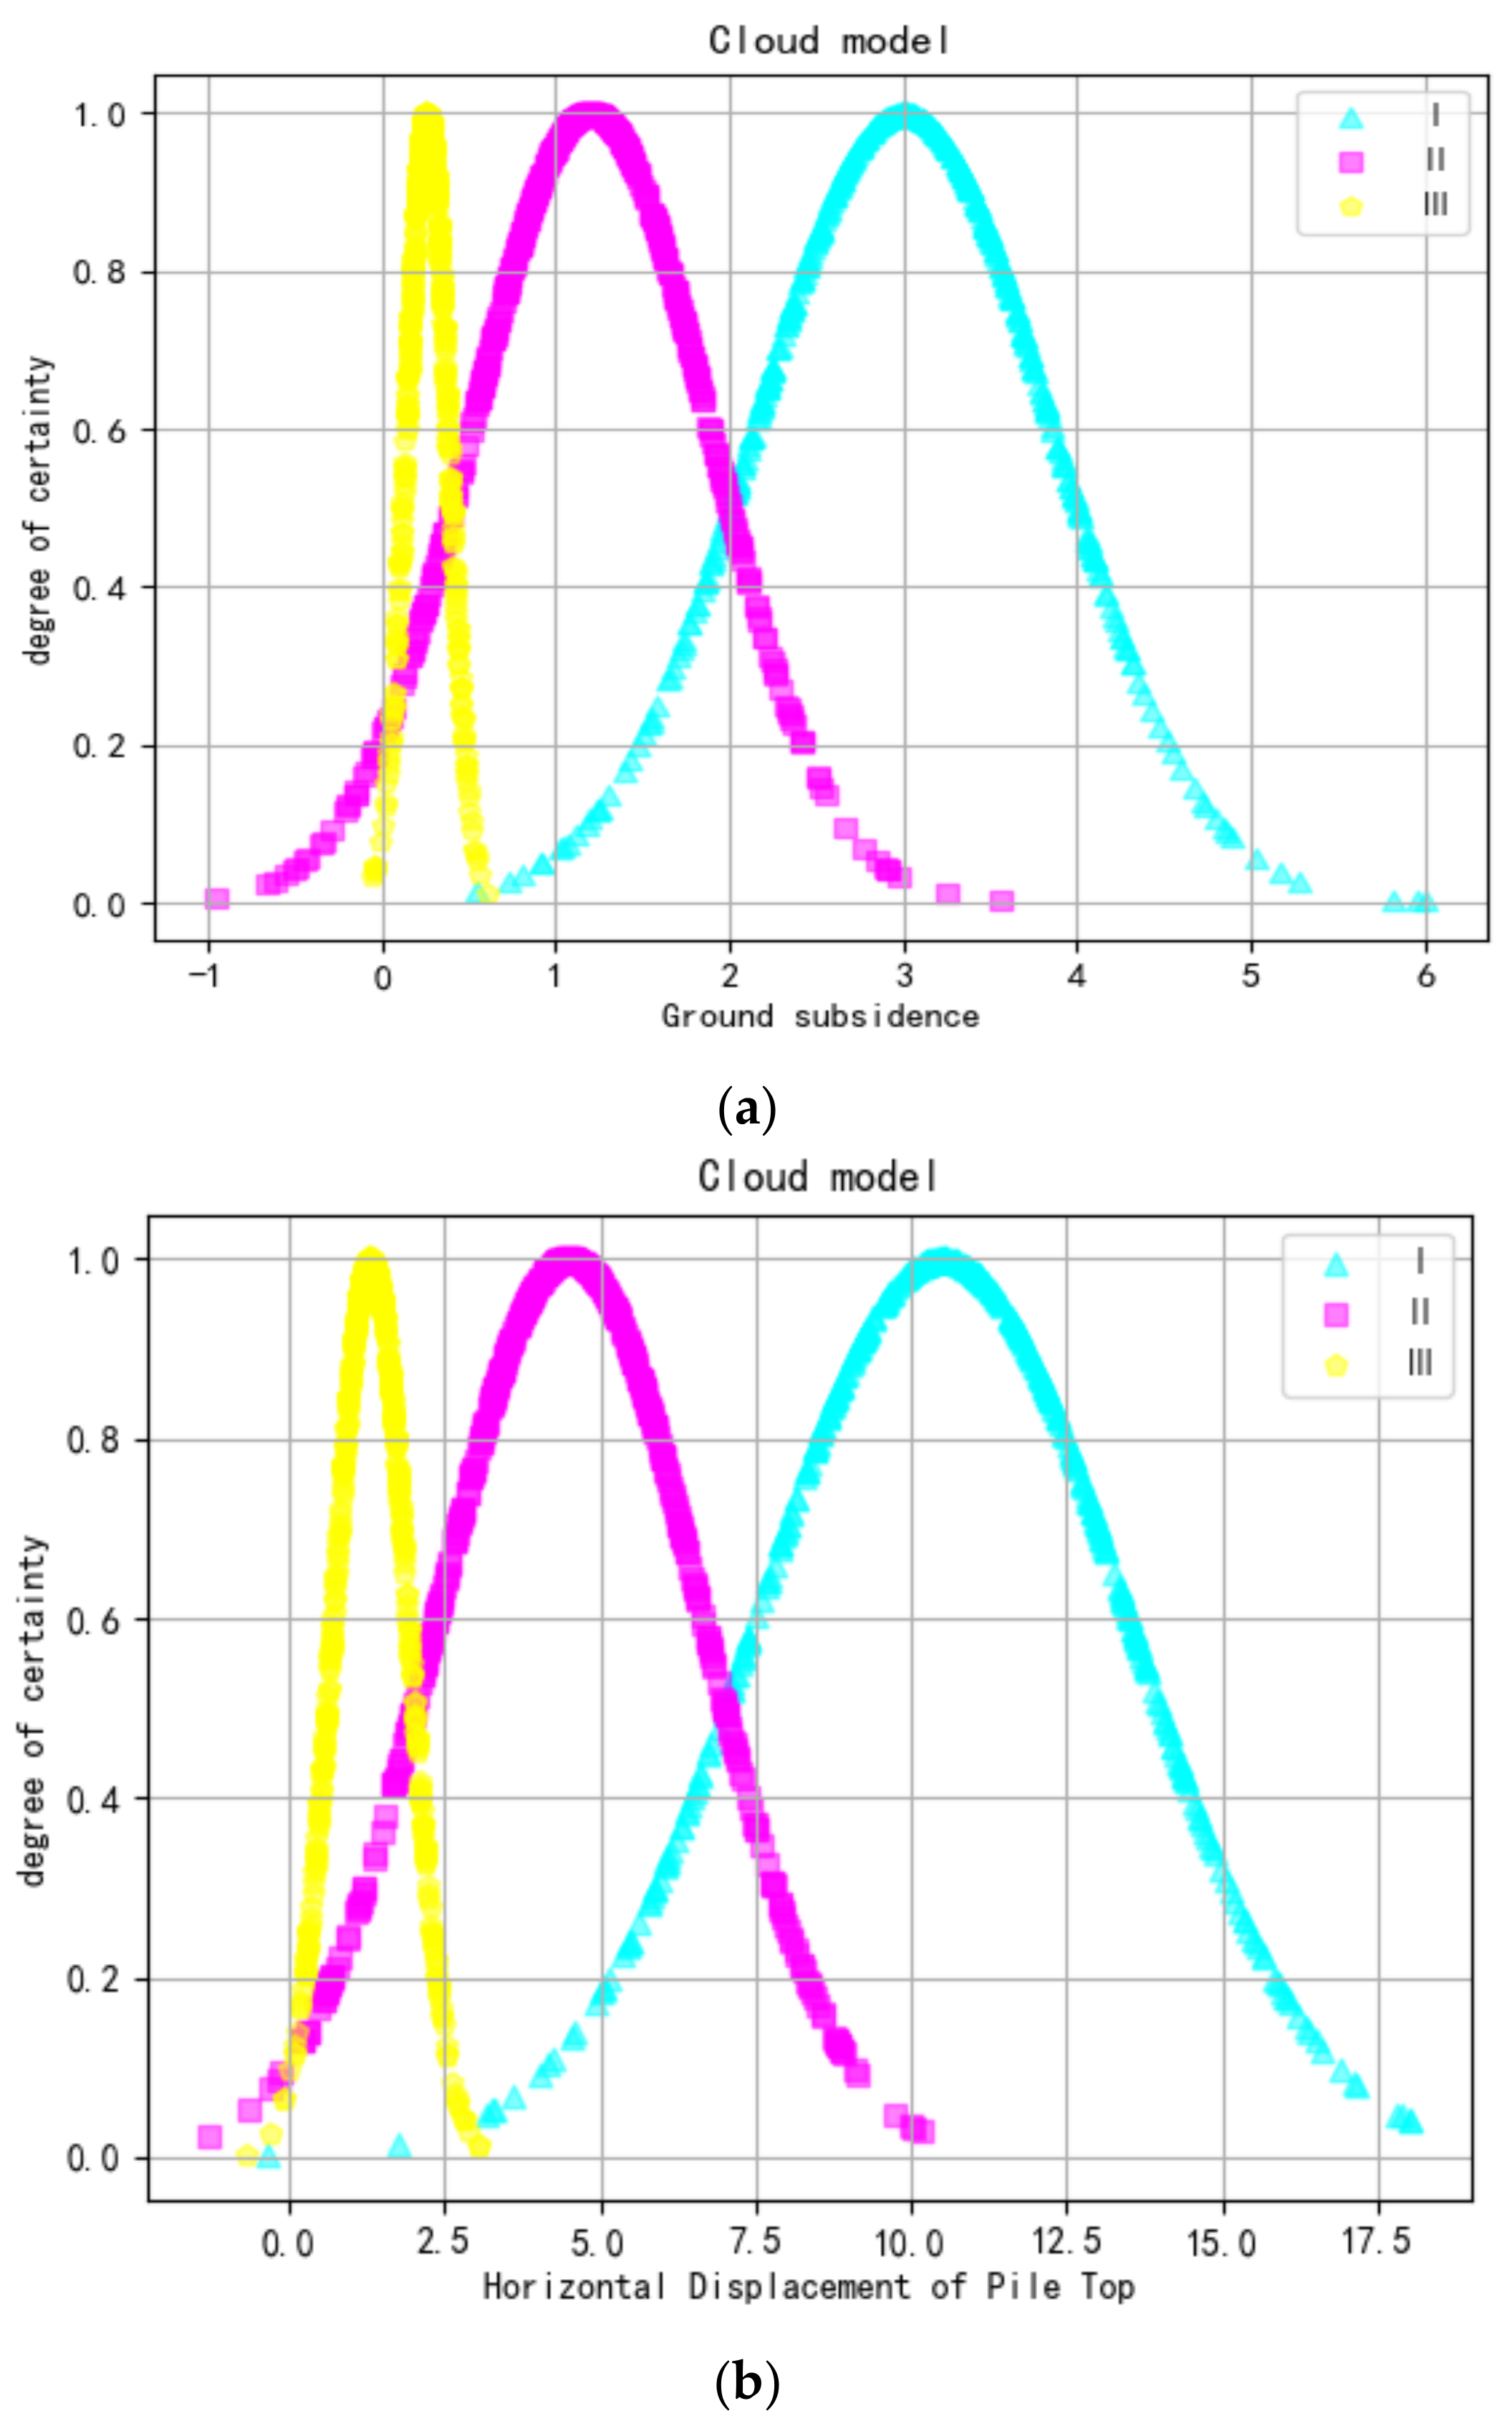
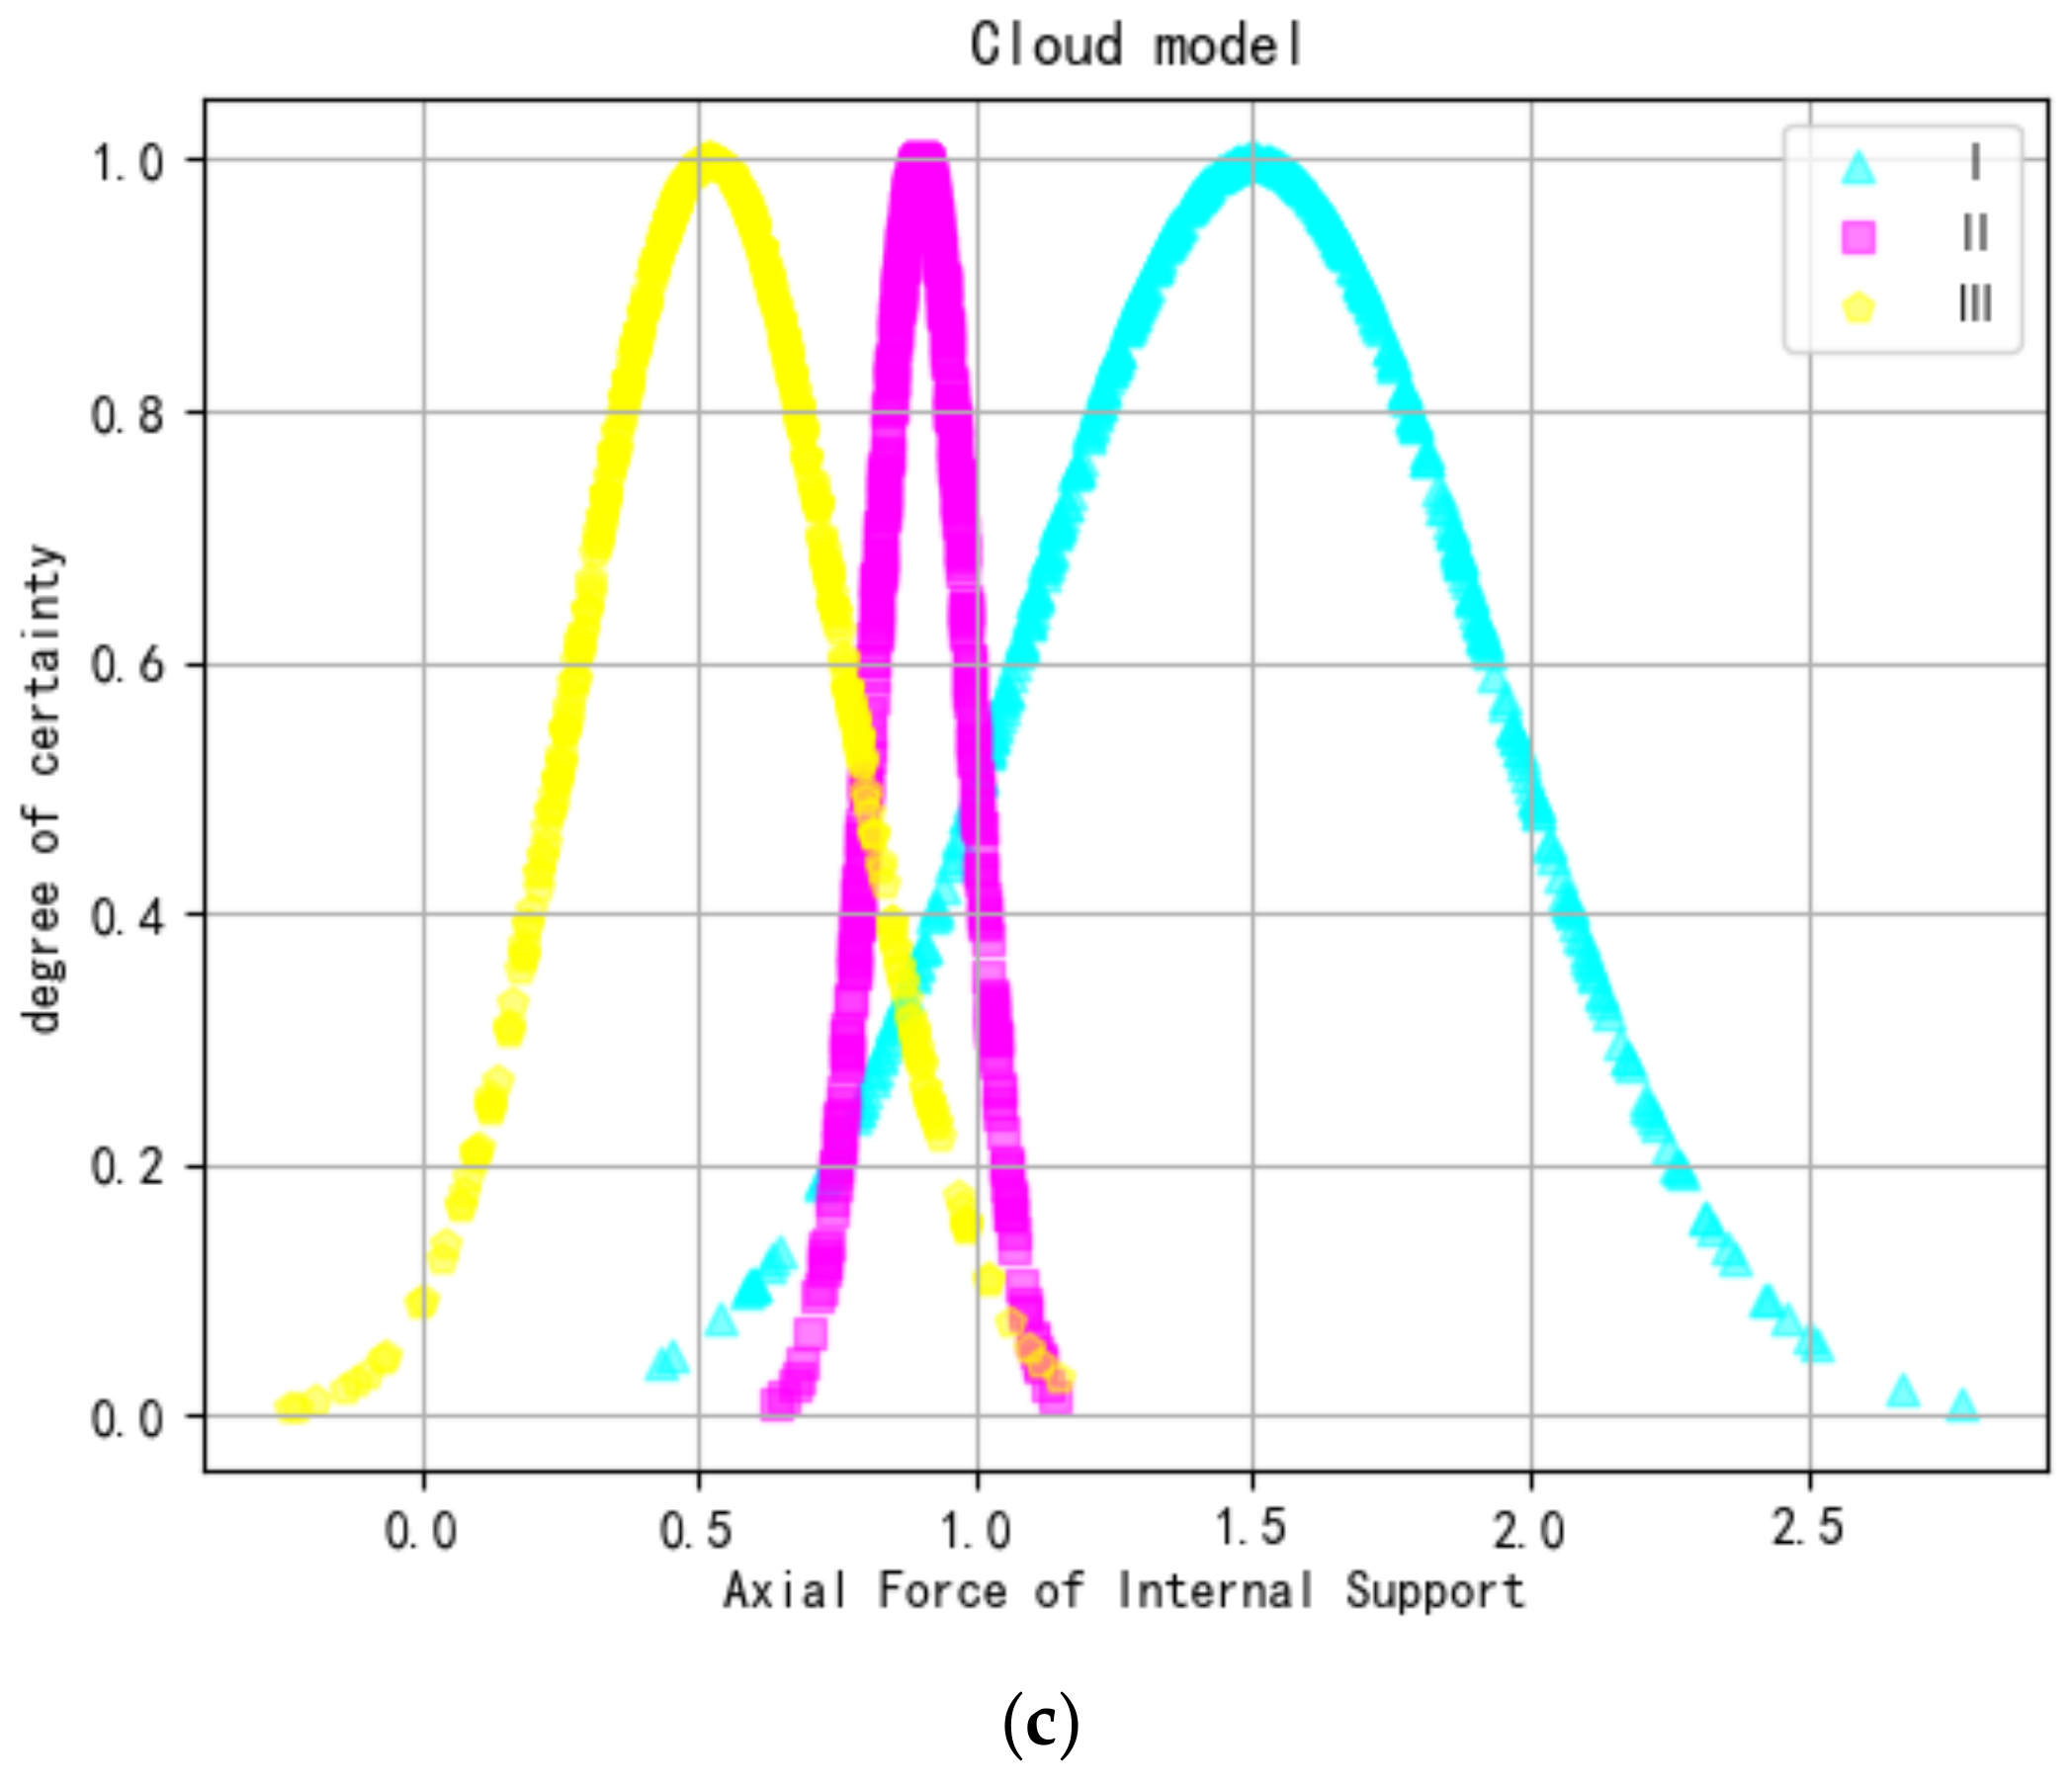
3.1. Generating Evaluation Factor Cloud Model

Based on the multidimensional connection cloud model and the foundation pit safety risk evaluation standards, the cloud numerical characteristics (Ex, En, He) of the evaluation indicators are calculated using Equations (2)~(5), as shown in Table 4. Then, the connection cloud for indicator j corresponding to level i is constructed using Equation (1). The safety risk evaluation cloud model for the metro station deep excavation process was generated using Python 3.9, as illustrated in Figure 3. In each cloud chart, the peak represents the degree of certainty, while the width indicates the value range and concentration of each indicator. For example, in Figure 3b, the purple region shows a high certainty within the interval (2, 7), with a width of 5, indicating a broader distribution. In contrast, in Figure 3c, the purple region exhibits high certainty in the narrower interval of (0.8, 1), with a width of 0.2, reflecting a more concentrated distribution. Since the numerical characteristics of evaluation indicators A1, A2, A4, and A6 are the same, they share the same cloud diagram with A1 as a representative. Similarly, as A3 and A7 have the same characteristics, A3 is chosen as a representative.
In Figure 4, the horizontal axis represents the values of evaluation indicators Ai, while the vertical axis represents the corresponding certainty. Additionally, in real-world subway deep excavation projects, environmental conditions (e.g., geology, precipitation, and climate), management level, and construction factors also play a role.

3.2. Calculating Evaluation Index Weights

This study uses the Second Improved CRITIC method to determine the weights of each evaluation indicator. The specific steps are as follows: First, the monitoring data in Table 3 are standardized using Equations (6)~(9). Next, Equation (10) is applied to calculate the coefficient of variation for each evaluation indicator. The Pearson correlation coefficients between the indicators are then calculated based on the standardized data, with the results shown in Table 5. Using these values, the independence coefficients of the evaluation indicators are determined using Equation (13). Finally, the comprehensive coefficients of each indicator are calculated using Equation (14), based on the variation and independence coefficients. Subsequently, the weights of the evaluation indicators A1, A2, A3, A4, A5, A6, and A7 are obtained using Equation (15) as follows: w = [0.09, 0.25, 0.123, 0.176, 0.047, 0.050, 0.264], as shown in Figure 4.
In comparison, the weight obtained from the Improved CRITIC method are w = [0.112, 0.288, 0.069, 0.132, 0.092, 0.058, 0.249], as illustrated in Figure 5. It is observed that the weight rankings remain mostly consistent before and after the second improvement. However, the weight of indicator A3 (pile top horizontal displacement) has significantly increased, indicating that the second improvement gives more consideration to horizontal displacement, as shown in Figure 6.
Comprehensive analysis reveals that building settlement (A2) and horizontal displacement of the support structure (A7) have the most significant impact on the safety risk of deep excavation, with their weights exceeding 0.2. Pile top settlement (A4), horizontal displacement at the pile top (A3), and ground subsidence (A1) follow, with weights between 0.1 and 0.2 or close to 0.1. The axial force of internal support (A5) and pipeline settlement (A6) have minimal influence, with weights below 0.05.
Based on the weights obtained after the second improvement, it is evident that surrounding buildings, ground subsidence, vertical displacement of piles, horizontal displacement at the pile top, and horizontal displacement of the support structure are the key factors to monitor in deep excavation projects. In contrast, pipeline settlement and axial force of internal support are generally controllable, provided that the design and construction are executed properly.
From the safety risk evaluation standards in Table 2, the values for A1, A2, A4, and A6 are identical, indicating a correlation between them. If the requirements for surrounding buildings (A2) and ground subsidence (A1) are met, the additional load on the pipelines (A6) buried in the soil will not increase significantly, resulting in minimal settlement. For the axial force of internal support (A5), safety reserves are already factored into the design, and, if construction follows the standard procedures, it usually remains within acceptable limits.
Similarly, both the horizontal displacement at the pile top (A3) and settlement (A4) of the piles should be closely monitored, aligning with common monitoring indicators for foundation pits. Before the second improvement, A3 (horizontal displacement at the pile top) was largely ignored. This adjustment is a key advantage of the improved method, contributing positively to the safety assessment of the excavation.

3.3. Foundation Pit Safety Risk Evaluation

Using the Second Improved CRITIC-Cloud Model and its formulas, the comprehensive certainty values for three foundation pit safety risk levels across nine excavation stages were obtained, as shown in Figure 7. The final evaluation grades at different depths were then determined and compared with the multidimensional dynamic evaluation method based on information entropy from the literature in Table 6.
Taking the comprehensive cloud model for 1 m excavation depth as an example, the calculation process for determining the certainty of Grades I~III is as follows: First, Equations (2)~(5) were used to calculate the numerical characteristics, as listed in Table 4. Then, the monitoring data values were substituted into Equations (19) and (20), yielding μ(I) = 0.013, μ(II) = 0.333, and μ(III) = 0.043. Since μ(II) is significantly larger than the others, the maximum membership principle indicates that the safety risk of the 1m excavation belongs to Grade II. This suggests that the initial stage of excavation is relatively dangerous, mainly because the redistribution of soil stress can easily cause settlement or displacement. Additionally, the support system is usually not fully established at this early stage, leading to lower stability. Groundwater seepage may further loosen the soil, increasing the risk of collapse. The concentration of construction loads also heightens the likelihood of pit instability, emphasizing the need for the careful monitoring of support and drainage measures during the early excavation phase.
As another example, when the excavation depth reaches 13 m, μ(I) = 0.013, μ(II) = 0.273, and μ(III) = 0.372. According to both the Kp Method and the maximum comprehensive certainty principle, this stage is classified as Grade III. However, since μ(II) = 0.273 is relatively high, there is a tendency for the evaluation level to shift towards Grade II, indicating the need for focused data monitoring. The calculation process for other samples is similar.

4. Discussion

For the safety evaluation of the eastern end well section of the Hefei Metro Line 7 Phase 1 project, the cloud model evaluation method based on the Second Improved CRITIC method yields results largely consistent with the multidimensional dynamic evaluation method based on information entropy theory. This indicates good safety during the excavation process. The only discrepancy arises when the excavation reaches 1 m: this study’s evaluation classifies it as a Grade II warning state, while the information entropy theory classifies it as a Grade III safe state. This difference merits further attention.
Analyzing individual factors based on the monitoring data, it is found that A1, A2, and A4 are at Grade II, while A3, A5, A6, and A7 are at Grade III. The fact that more indicators fall into Grade II, particularly the key indicators A1, A2, and A4, suggests that classifying the 1 m excavation depth as a Grade II warning state is more reasonable. Therefore, the cloud model evaluation method based on the Second Improved CRITIC method is effective and appropriate for assessing the safety of the excavation process.
In summary, the cloud model evaluation method using the Second Improved CRITIC method comprehensively considers multiple evaluation indicators. It employs the identity–contrary–discrepancy (ICD) principle of set pair analysis (SPA) to determine the numerical characteristics of the multidimensional normal cloud, allowing the evaluation to better reflect the actual distribution of data. Compared to the traditional cloud model, the Second Improved CRITIC method is used for weighing, introducing a quantitative coefficient of the independence degree for each indicator by replacing r k i with | r k i | and standardizing the indicators. This approach better addresses errors caused by differences in dimensions and magnitudes among safety risk control indicators in the deep foundation pit excavation process. The model processes multiple incompatible indicators and fuzzy characteristics through a multidimensional correlative cloud, reducing the influence of secondary factors and the number of indicators requiring comprehensive consideration. Finally, the evaluation method combines the Maximum Comprehensive Certainty Method and the Kp Method to propose a relatively more reasonable way to determine safety risk levels during the excavation process. This approach simplifies complex problems by accounting for the randomness and fuzziness of evaluation indicators while reflecting transitions between evaluation levels. The simplified evaluation process and convenient algorithm make the method more objective and reliable by incorporating both the differences and correlations between indicators during the weighting process. Thus, the evaluation results are more credible.
The cloud-model-based risk evaluation framework developed in this study demonstrates strong applicability and effectiveness when applied to metro station deep excavation projects. Among the selected indicators, building settlement (A2) and horizontal displacement of the supporting structure (A7) were found to be particularly sensitive to overall risk levels, which is consistent with findings from previous studies. For example, the displacement of the retaining structure has been widely recognized as a key indicator for assessing excavation stability and real-time risk levels [38,58], while building settlement has long been used in metro and urban underground projects to evaluate ground response and construction safety [30,59]. The present findings further validate the significance of these indicators in complex excavation scenarios.
In practice, the deformation control of deep excavations typically focuses on the coupled behavior between retaining wall movement and surface settlement. Such interactions can be effectively captured within multi-source data-driven risk evaluation models [29,39]. Moreover, under varying geological and loading conditions, structural responses often exhibit nonlinear and delayed characteristics. Therefore, methods capable of addressing uncertainty and fuzziness—such as the cloud model—are particularly suitable for these applications [38,60].
Beyond technical contributions, the proposed framework has potential implications for both engineering practice and regulatory policy. It can provide quantitative support for real-time warning and support system optimization and construction planning. Furthermore, dynamic risk evaluation based on monitoring data can enhance regulation by enabling performance-based supervision. If integrated into digital construction platforms such as BIM and IoT systems, the method could support intelligent risk perception and automatic warning mechanisms, thereby improving safety management in complex urban excavation environments [61,62].

5. Conclusions

The safety risk control of deep excavation using the Second Improved CRITIC-Cloud Model is of great significance. Through the dynamic excavation process evaluation of the eastern end well section of Hefei Metro Line 7 Phase I, the results demonstrate that the proposed model is both effective and feasible for assessing the safety level of foundation excavation. It can quantitatively characterize the randomness and fuzziness of safety evaluation indicators, while also capturing the interrelationships and synergistic effects among them. Compared with the traditional cloud model, the introduction of the improved CRITIC method enables the weight calculation to more fully reflect the contrast intensity and internal conflict among indicators, thus avoiding subjective weighting. By incorporating the concept of set pair analysis, the model’s adaptability to fuzziness and uncertainty is enhanced, effectively addressing the issue of the unclear classification of boundary samples in traditional cloud models. In terms of result expression, the improved model demonstrates greater stability and discrimination, contributing to more accurate risk level classification. The multidimensional connection cloud model not only comprehensively considers multiple evaluation indicators, but also effectively captures the interrelationships among them, making it particularly suitable for evaluation and decision-making scenarios involving multi-factor coupling and complex information. It provides a reliable method for assessing the dynamic excavation process of foundation pits and the safety level based on multiple indicators. The specific findings are as follows.
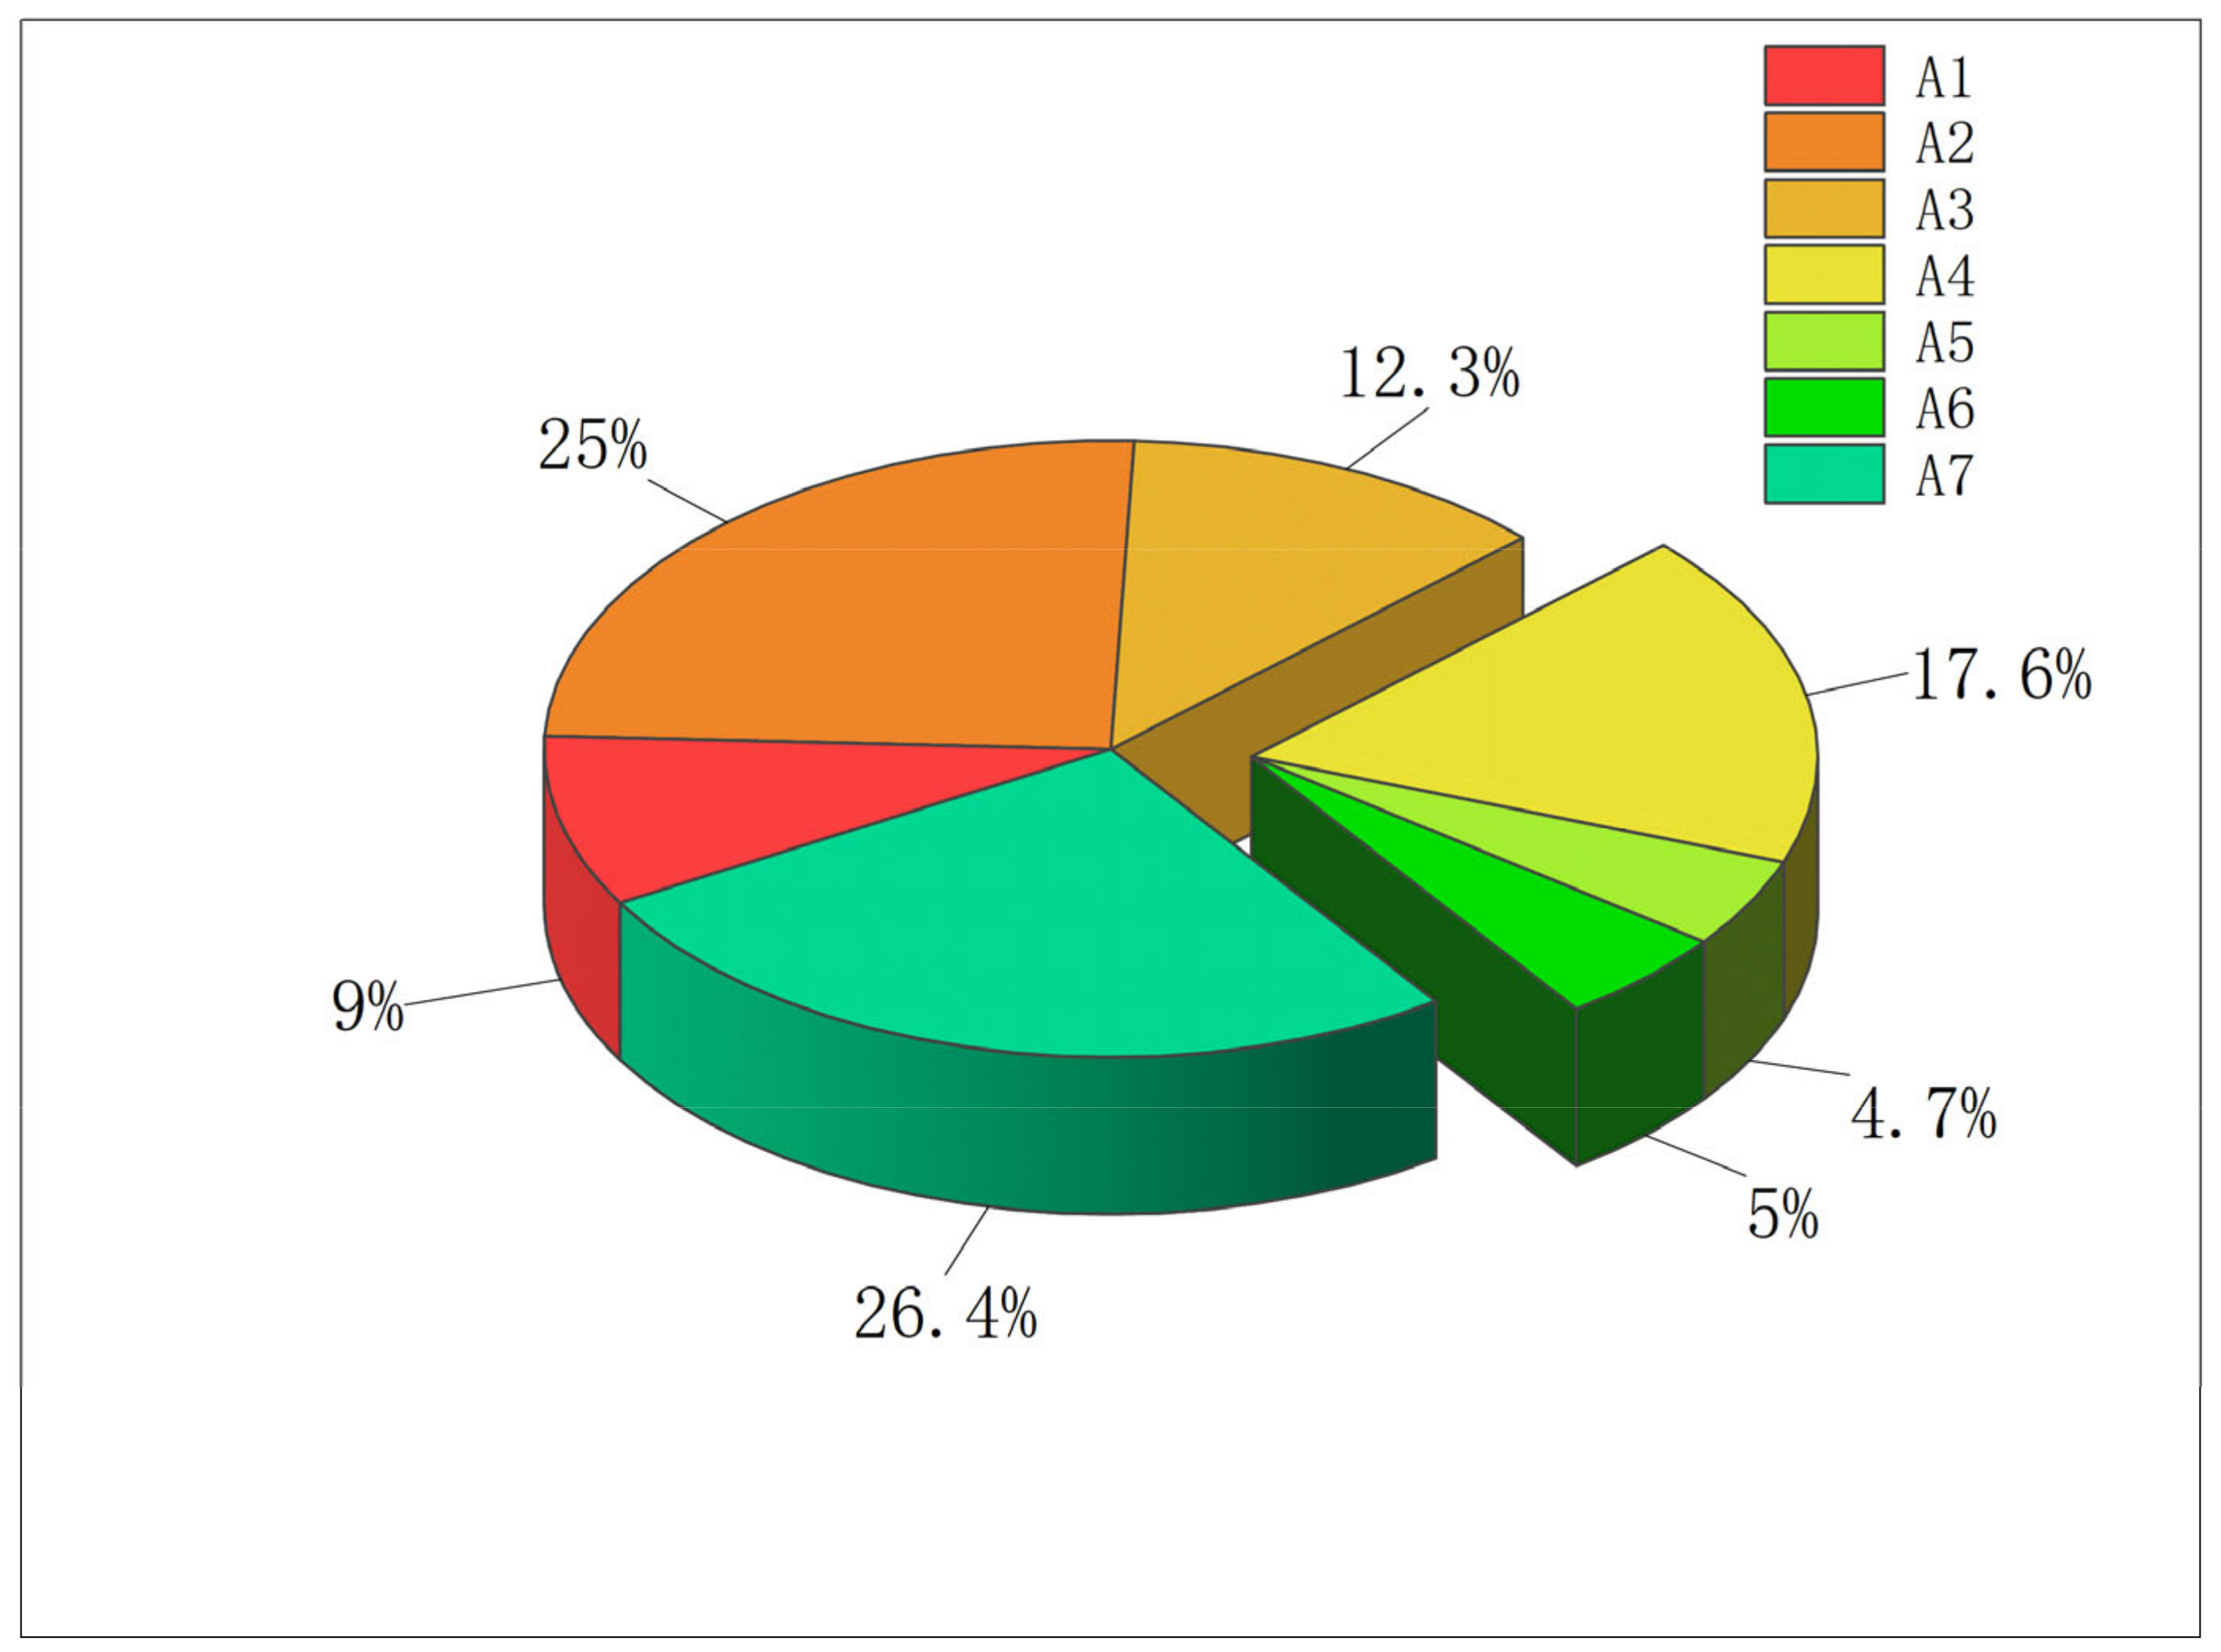
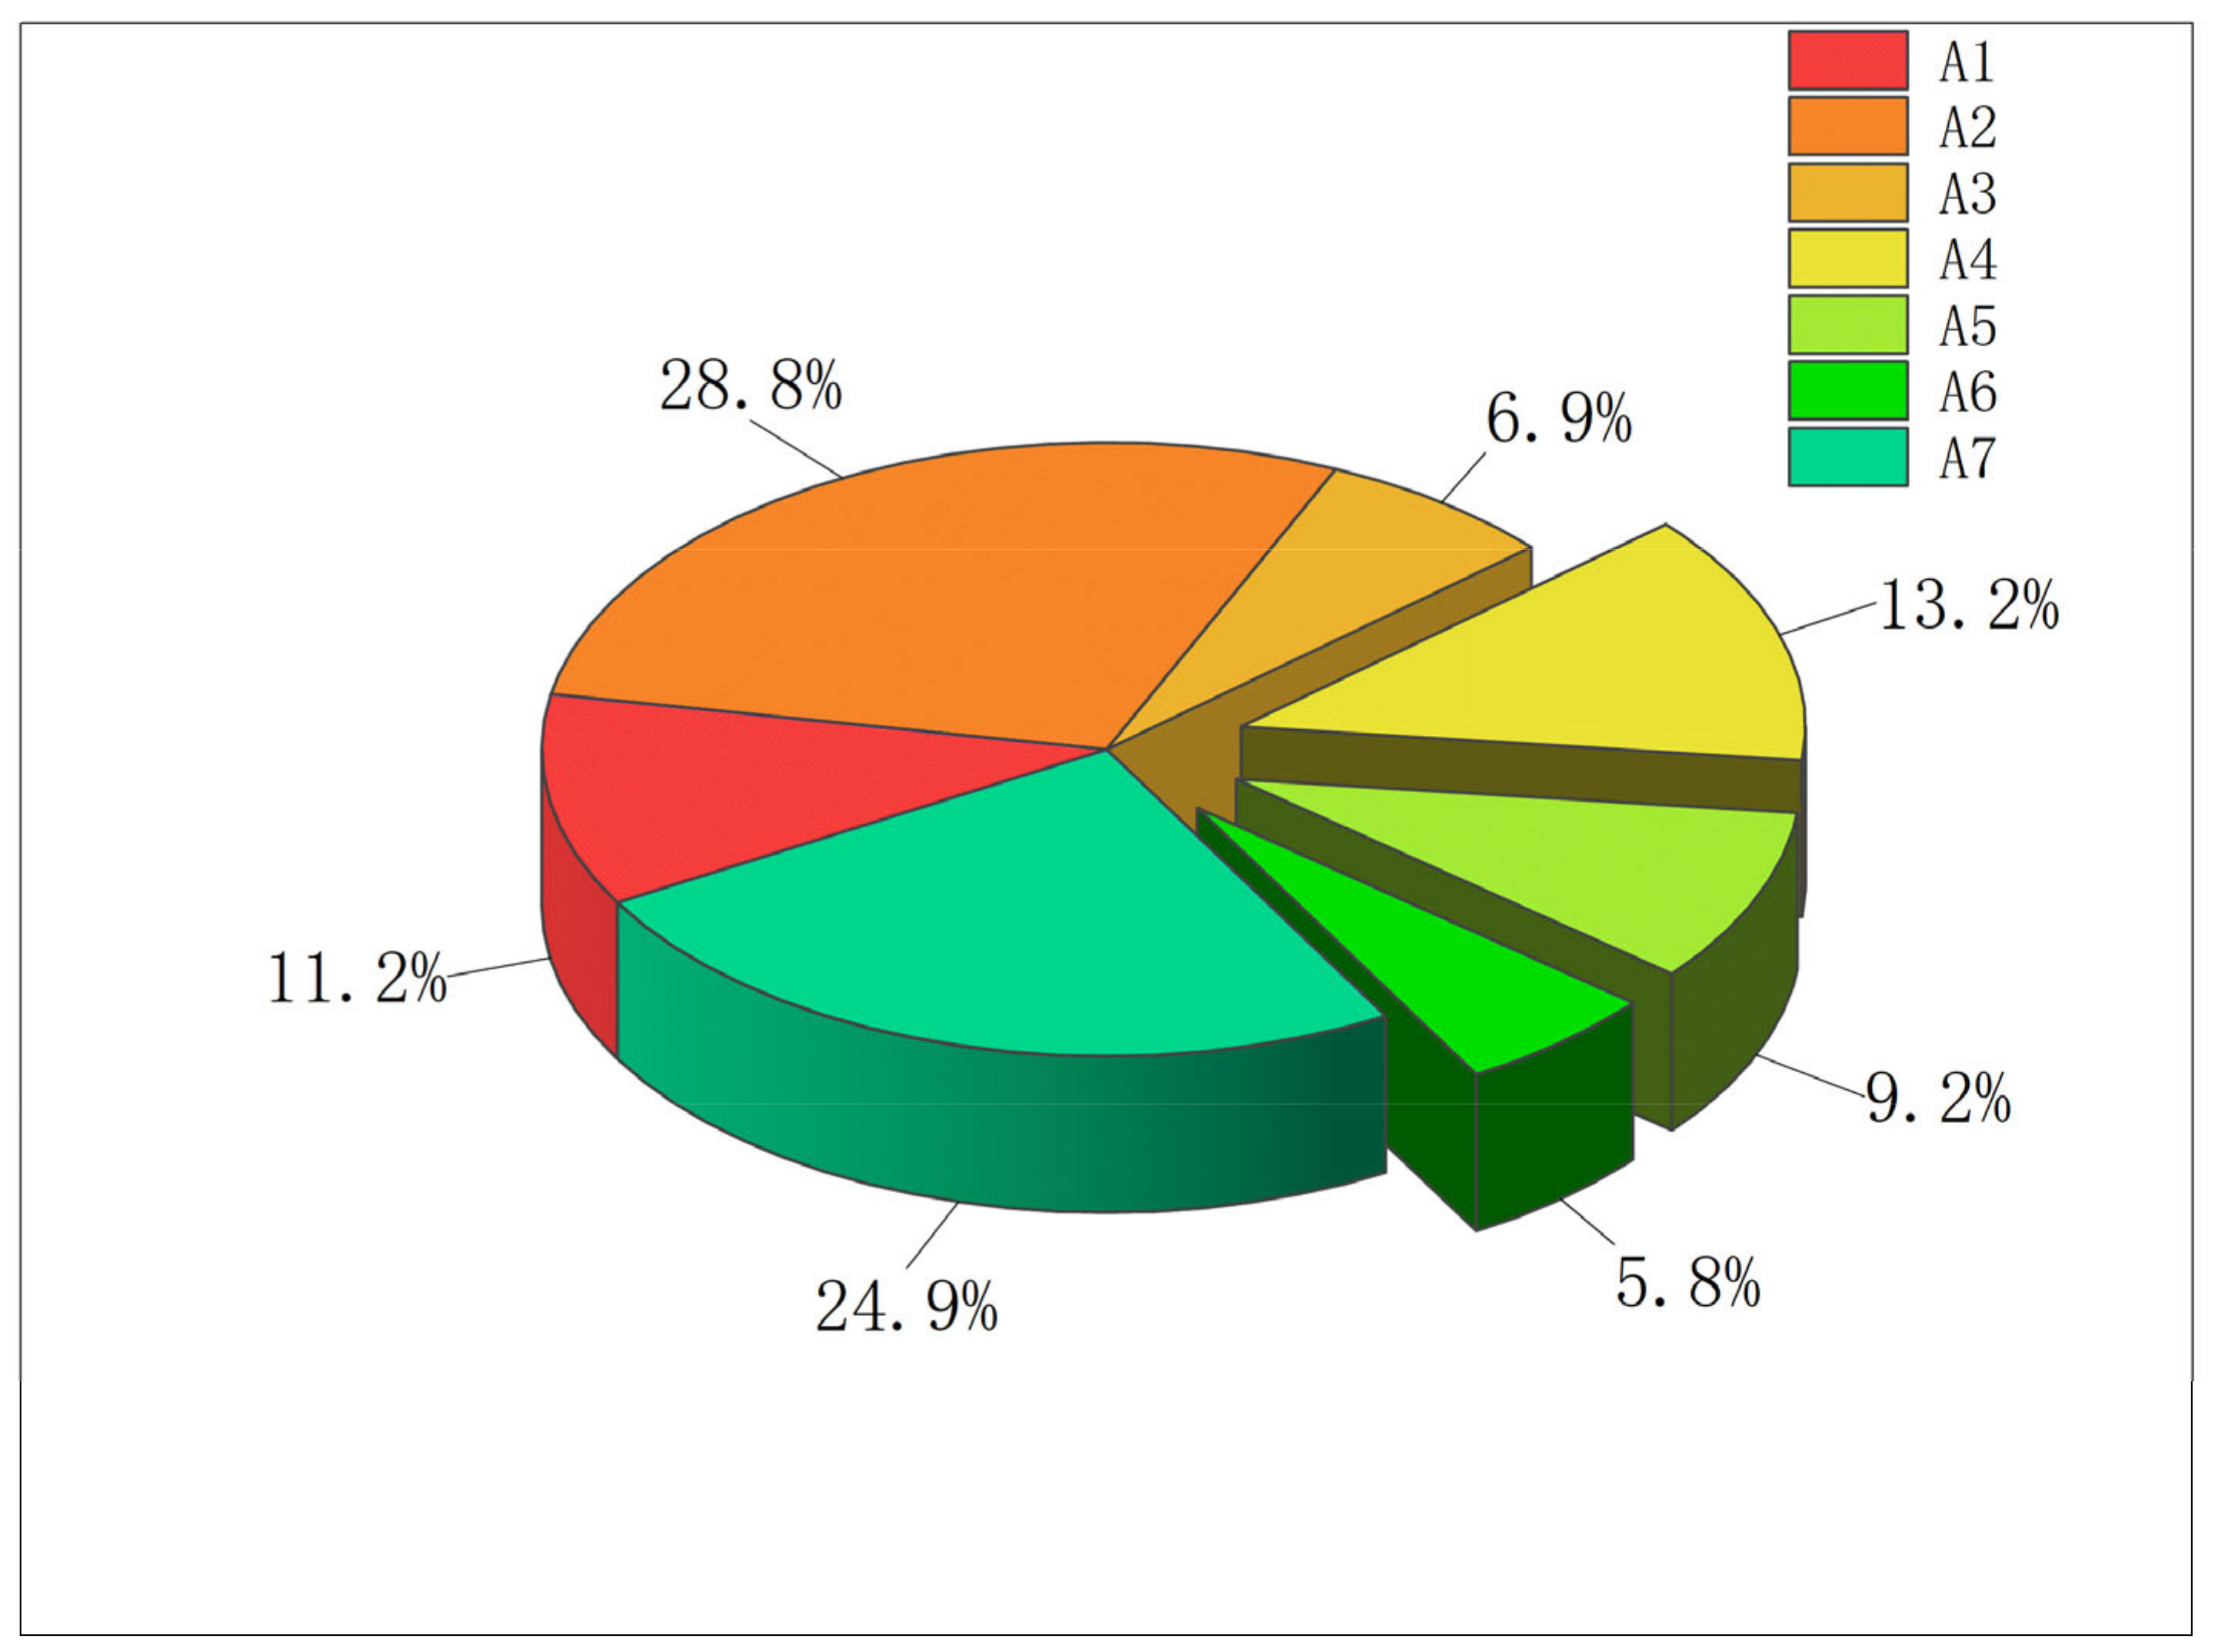
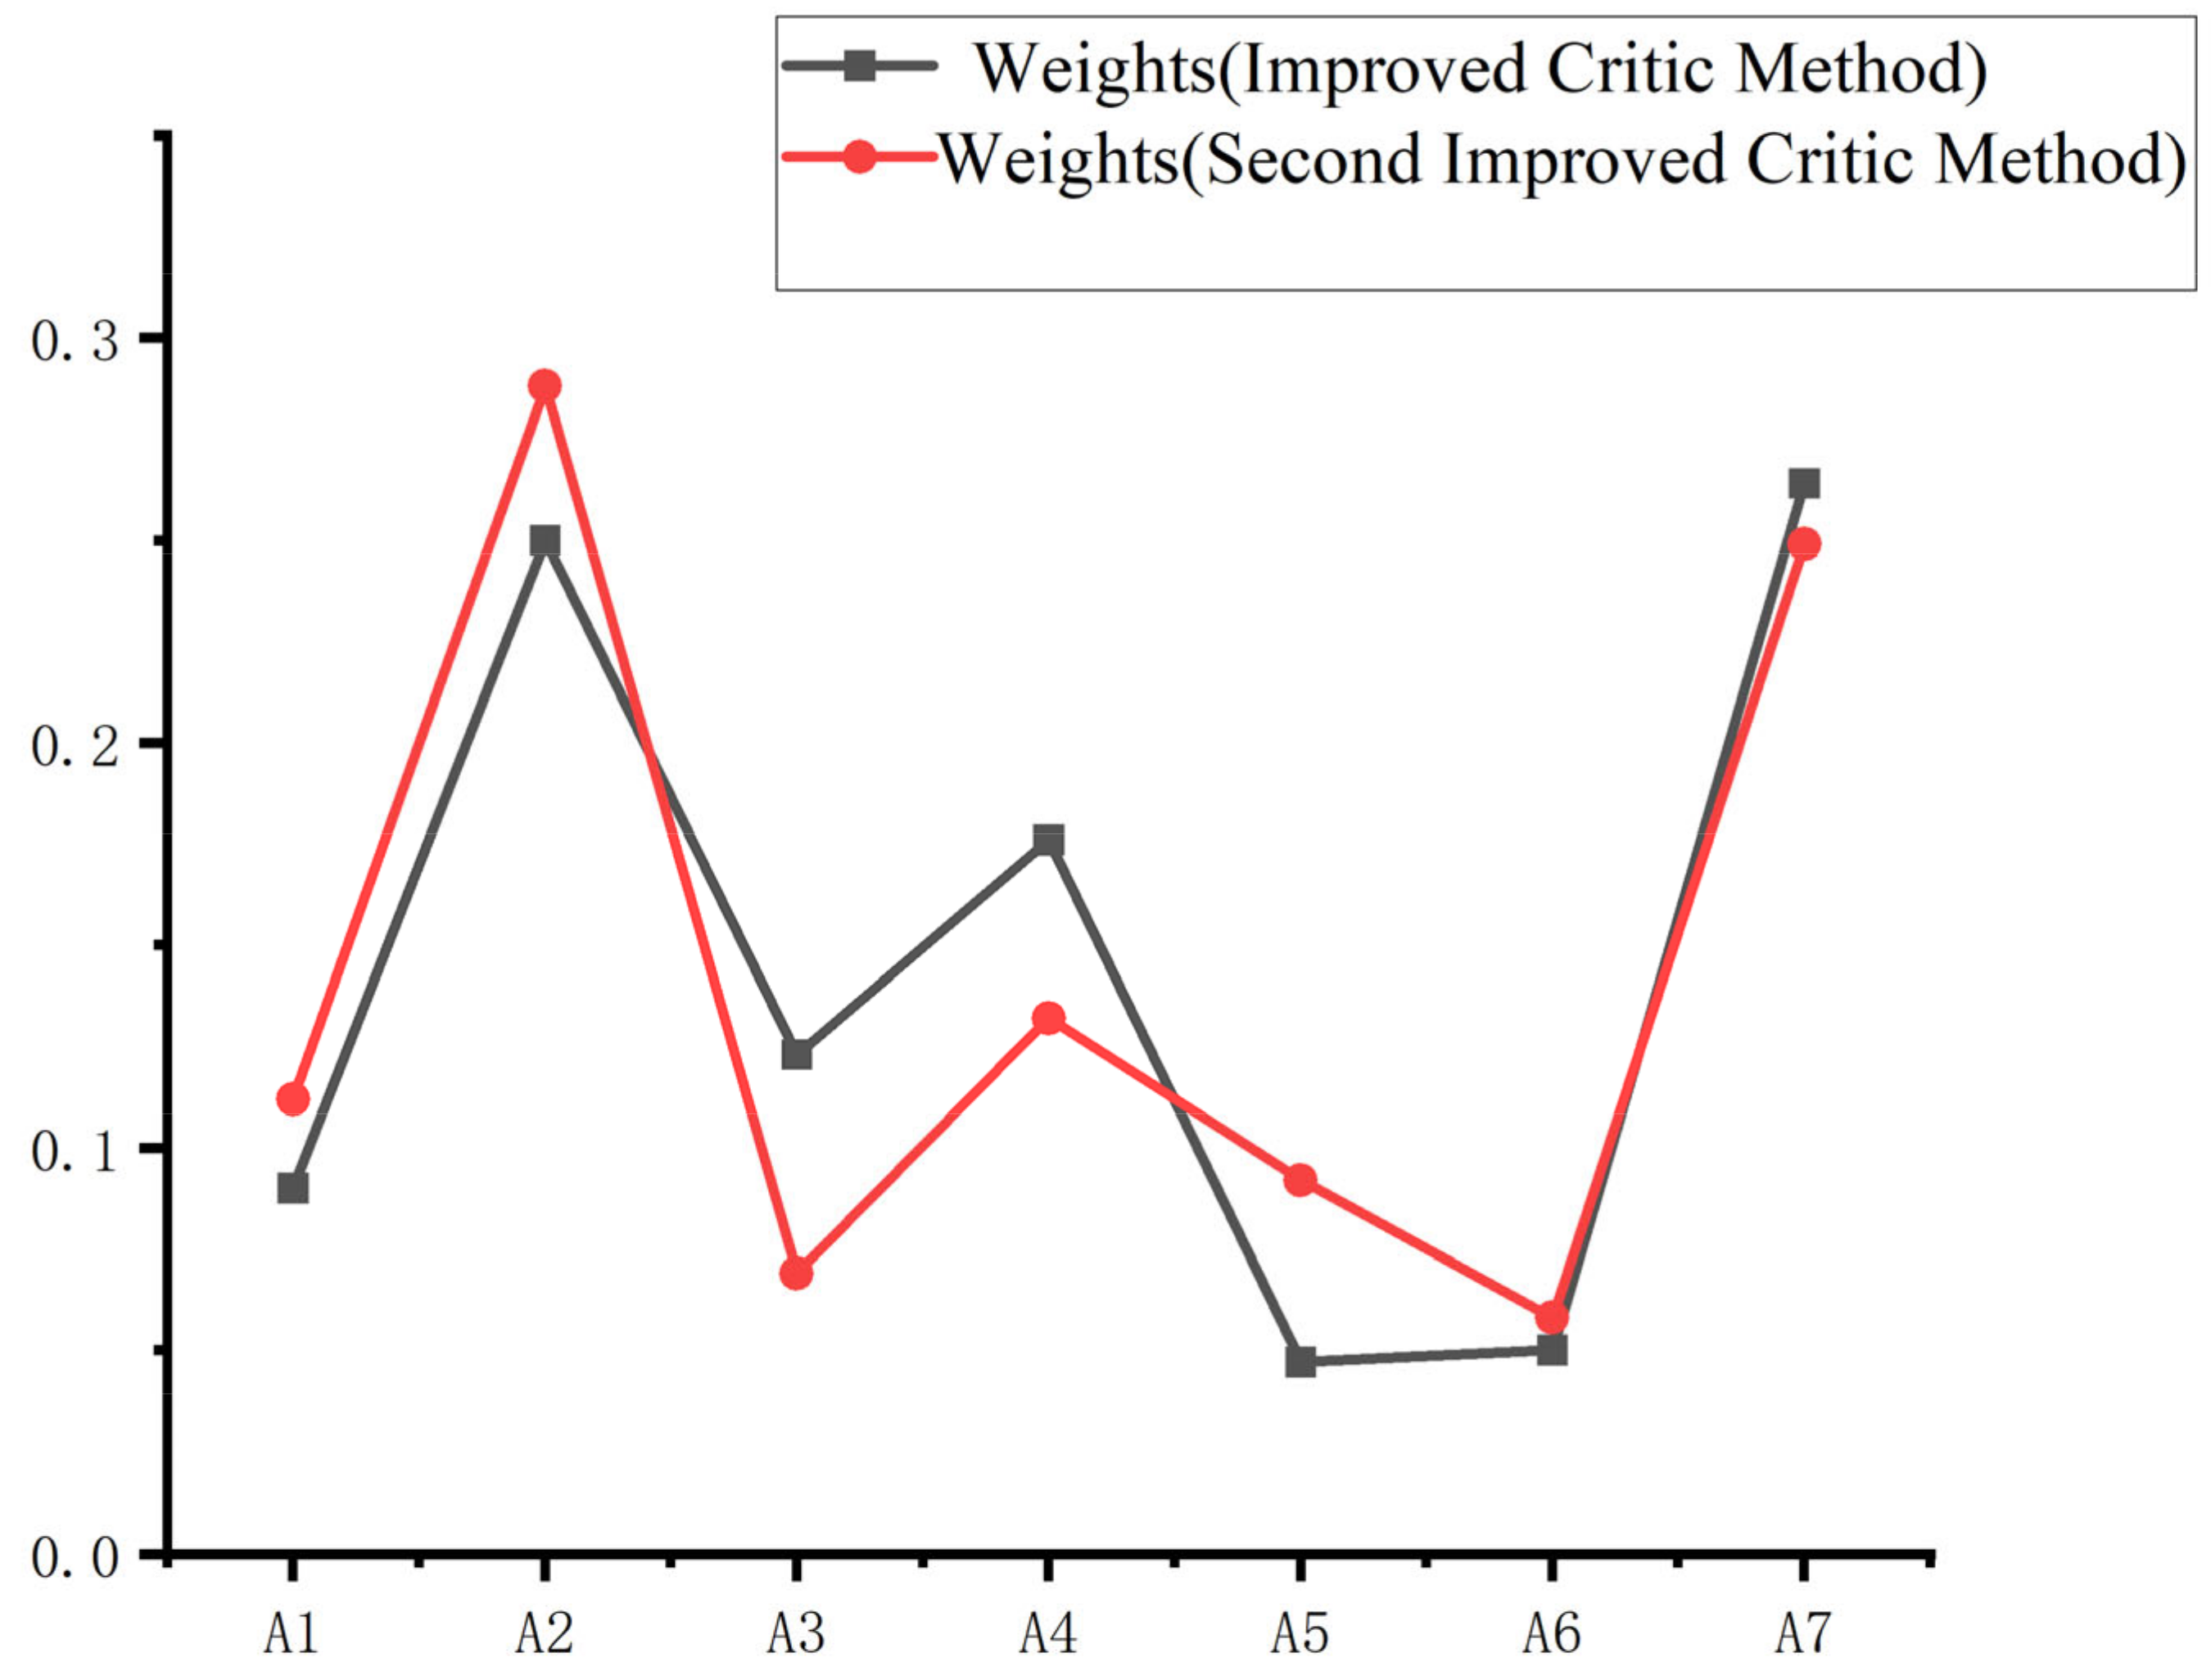
  • This study employs the Second Improved CRITIC method, which comprehensively measures the objective weights of indicators based on their comparative intensity and conflict. The weights of the evaluation indicators A1, A2, A3, A4, A5, A6, A7, were calculated as w = [0.09, 0.25, 0.123, 0.176, 0.047,0.050, 0.264]. It was found that building settlement (A2) and horizontal displacement of the support structure (A7) have the greatest impact on excavation safety risk, with weights exceeding 0.2. Pile top settlement (A4), pile top horizontal displacement (A3), and ground settlement (A1) follow, with weights between 0.1 and 0.2 or close to 0.1. In contrast, internal support axial force (A5) and pipeline settlement (A6) have weights below 0.05, making this method more reasonable and suitable for foundation pit evaluation.
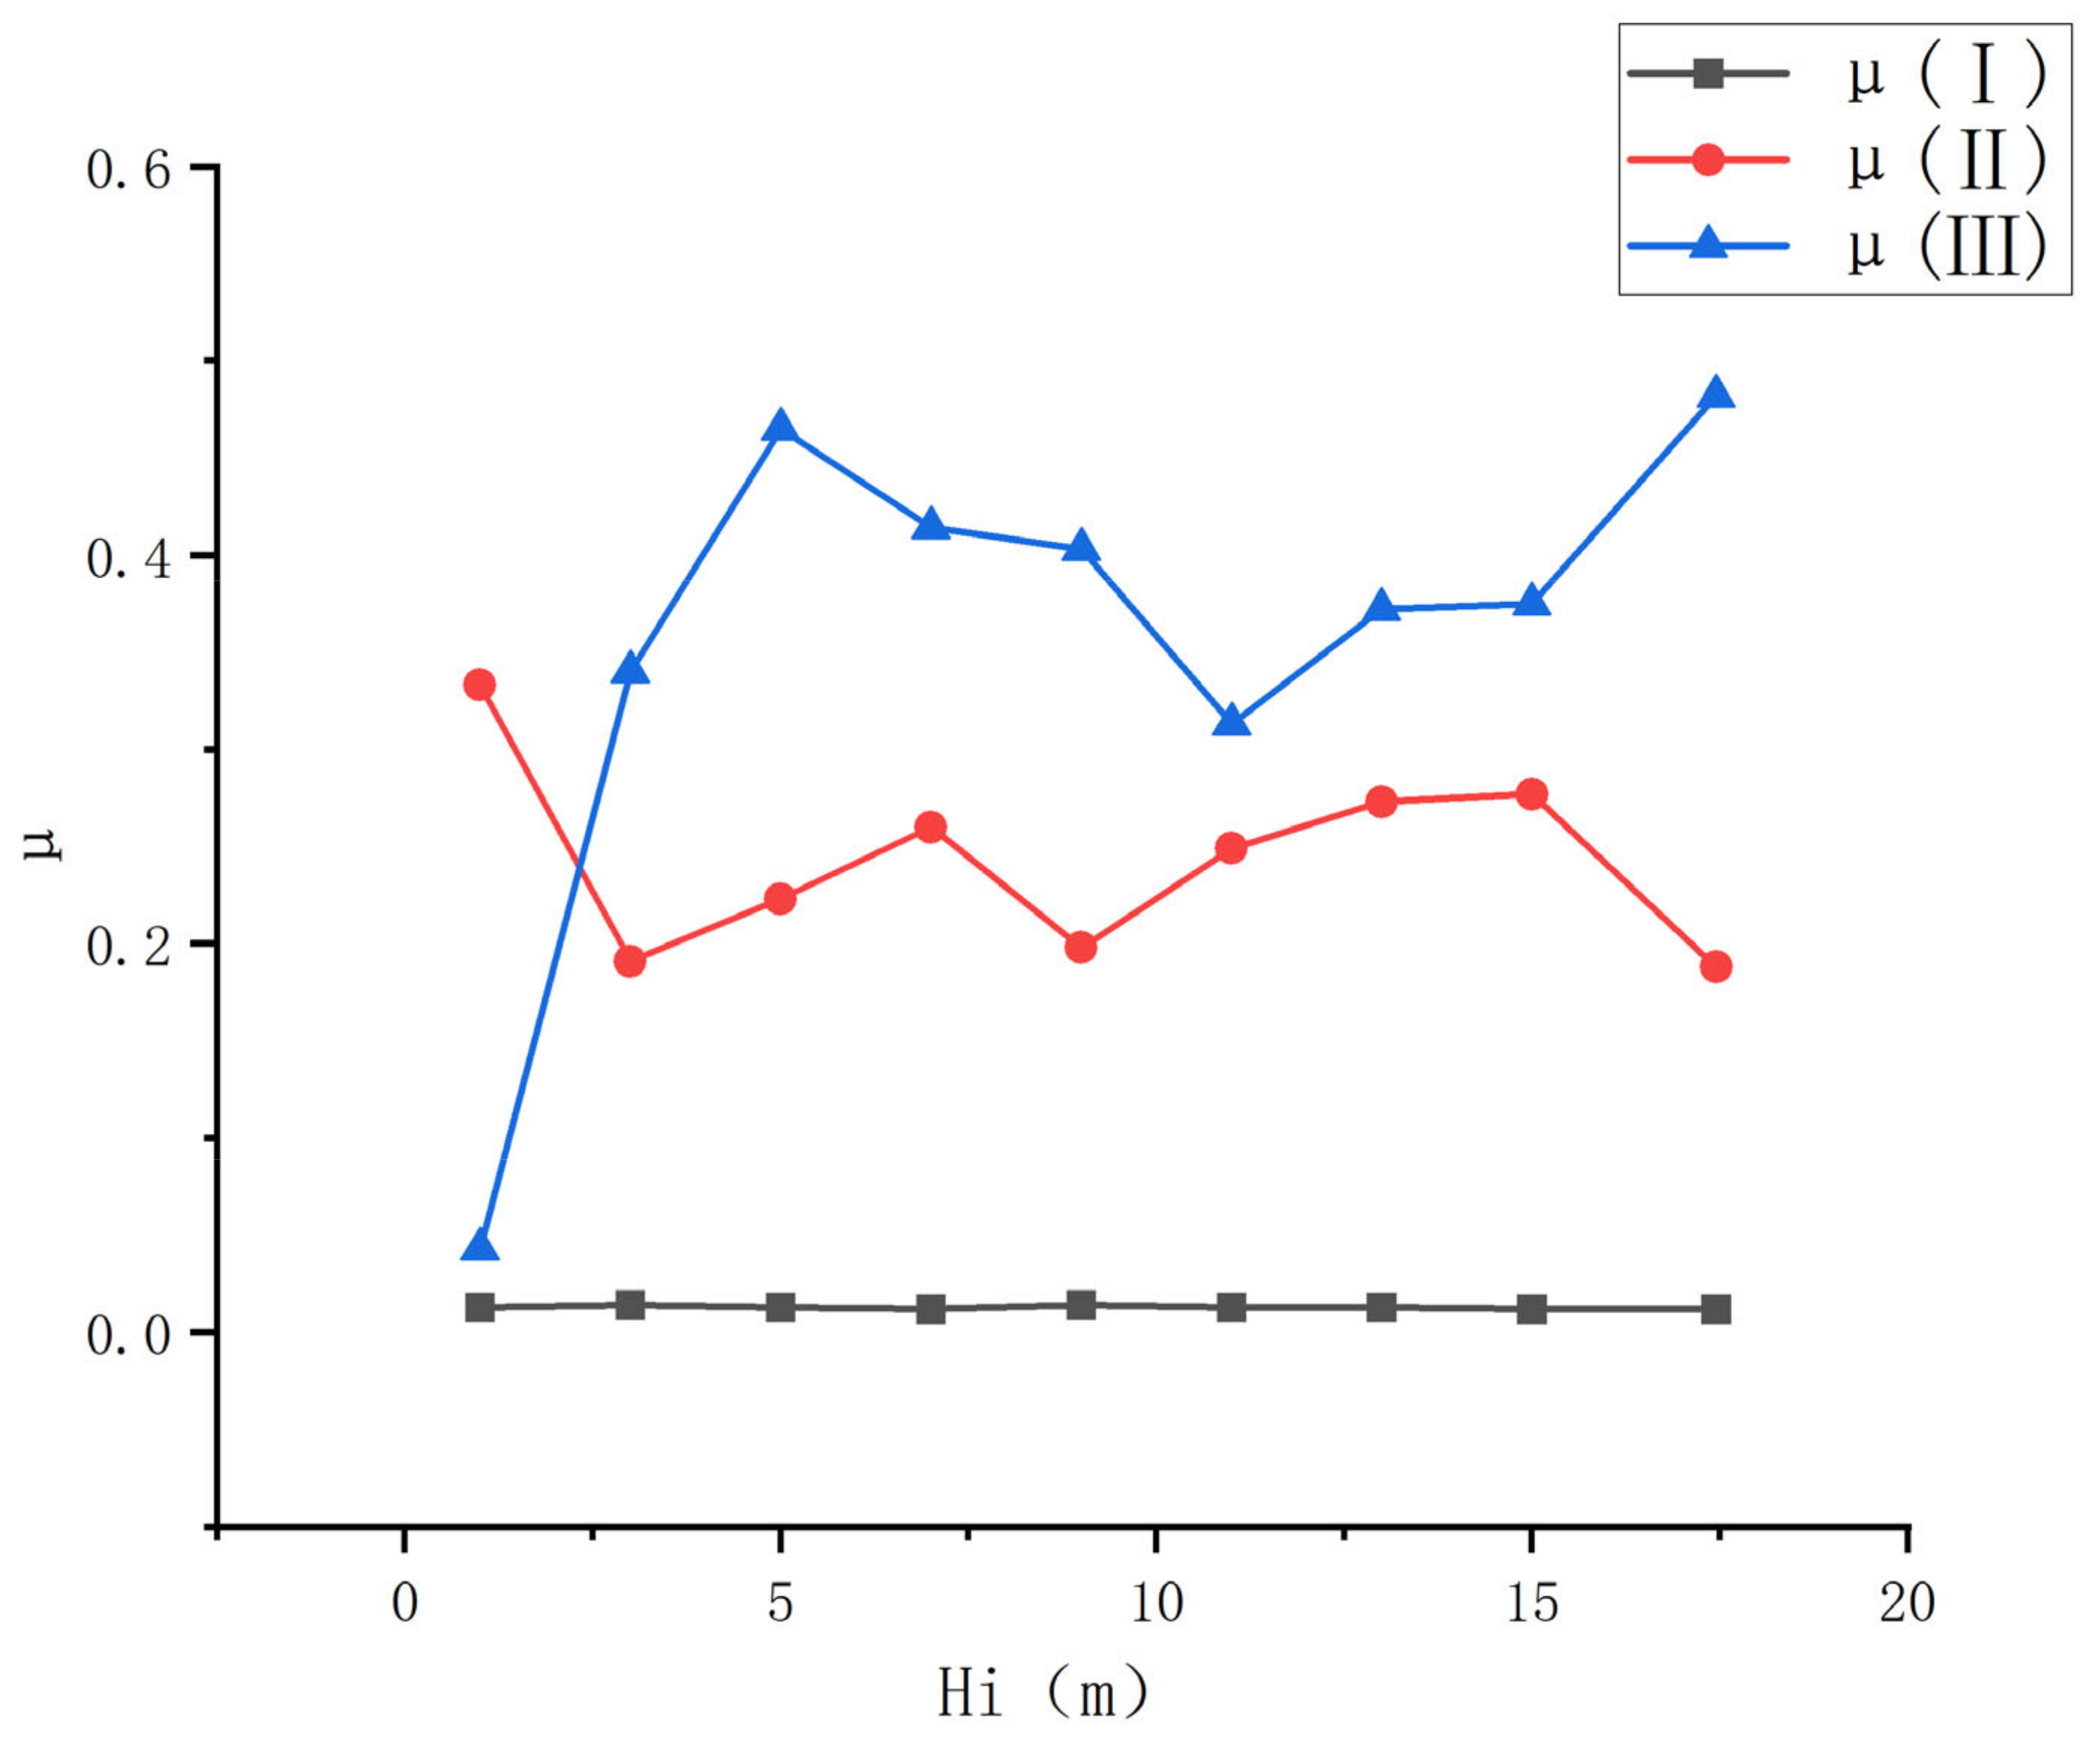
  • Based on the Second Improved CRITIC-Cloud Model, a multidimensional connection cloud model was constructed that reflects the actual distribution and interaction of each evaluation indicator during the excavation process. For the eastern end well section of Hefei Metro Line 7 Phase 1, the evaluation results at all excavation depths are found to be classified as Grade III, except for a depth of 1m, which is Grade II, respectively. This outcome is more reasonable when compared to other methods, confirming the model’s effectiveness and feasibility in evaluating excavation safety risks.
  • The proposed evaluation method quantitatively characterizes the randomness and fuzziness of evaluation indicators and reflects the interconnection and combined effect among indicators. It overcomes the limitations of traditional multidimensional connection models, providing a scientific basis for the accurate risk assessment of dynamic deep excavations and playing a crucial role in preventing risk events.
  • Although a real-time early warning system was not directly developed in this study, the proposed methodology incorporates several design considerations aimed at improving real-time applicability. Firstly, the Second Improved CRITIC method enhances computational efficiency by streamlining weight calculation through refined difference and conflict measures, thereby eliminating the need for complex matrix operations and allowing for incremental updates as new data become available. Secondly, the use of a numerical feature-based cloud model enables rapid and training-free risk classification, relying solely on simple numerical matching rather than computationally intensive models such as neural networks or Bayesian classifiers. Lastly, while validation was conducted using static monitoring data, the proposed framework is algorithmically compatible with real-time data environments, providing a foundation for integration into future engineering monitoring platforms such as those based on IoT technologies.
  • Although the Second Improved CRITIC-Cloud Model demonstrates strong comprehensive evaluation capabilities in terms of objective weight assignment and uncertainty representation, it still presents certain limitations. On the one hand, the method heavily relies on the quality of raw data and is susceptible to the influence of outliers; on the other hand, its computational complexity and model stability may be challenged in high-dimensional and complex systems. Future research may consider integrating dimensionality reduction techniques and intelligent fusion mechanisms to enhance the robustness and generalization ability of the model, thereby improving its adaptability to dynamic and evolving evaluation scenarios.

Author Contributions

Methodology, W.Z. and A.A.; Validation, X.X.; Investigation, W.Z.; Writing—original draft, W.Z.; Writing—review & editing, X.X.; Supervision, A.A.; Funding acquisition, X.X. All authors have read and agreed to the published version of the manuscript.

Funding

This work is funded by the Anhui Provincial Department of Education Key Project for Natural Science Research in Universities (Grant No. 2023AH051658) and Tongling University Talent Launch Project (Grant No. 2021tlxyrc19).

Data Availability Statement

The data presented in this study are openly available in CNKI at https://doi.org/10.13991/j.cnki.jem.2022.05.014 (accessed on 10 January 2025), reference number [28].

Conflicts of Interest

The authors declare no conflict of interest.

References

  1. Zhao, D.; Bai, J.; Chen, X.; Li, H.; He, Y.; Zhang, Q.; Liu, R. Shallow-buried subway station construction period: Comparison of intelligent early warning and optimization strategies for surface deformation risk. Tunn. Undergr. Space Technol. 2024, 153, 105978. [Google Scholar] [CrossRef]
  2. Cao, J.; Gong, H.; Chen, B.; Shi, M.; Zhou, C.; Lei, K.; Yu, H.; Sun, Y. Land Subsidence in Beijing’s Sub-Administrative Center and Its Relationship with Urban Expansion Inferred from Sentinel-1/2 Observations. Can. J. Remote Sens. 2021, 47, 802–817. [Google Scholar] [CrossRef]
  3. Yao, X.; Feng, W.; Zhang, X.; Wang, W.; Zhang, C.; You, S. Measurement and decomposition of industrial green total factor water efficiency in China. J. Clean. Prod. 2018, 198, 1144–1156. [Google Scholar] [CrossRef]
  4. Torkayesh, A.E.; Malmir, B.; Rajabi Asadabadi, M. Sustainable waste disposal technology selection: The stratified best-worst multi-criteria decision-making method. Waste Manag. 2021, 122, 100–112. [Google Scholar] [CrossRef]
  5. Wu, X.; Hu, F. Analysis of ecological carrying capacity using a fuzzy comprehensive evaluation method. Ecol. Indic. 2020, 113, 106243. [Google Scholar] [CrossRef]
  6. Lai, C.; Chen, X.; Chen, X.; Wang, Z.; Wu, X.; Zhao, S. A fuzzy comprehensive evaluation model for flood risk based on the combination weight of game theory. Nat. Hazards 2015, 77, 1243–1259. [Google Scholar] [CrossRef]
  7. Kuo, Y.; Yang, T.; Huang, G.-W. The use of grey relational analysis in solving multiple attribute decision-making problems. Comput. Ind. Eng. 2008, 55, 80–93. [Google Scholar] [CrossRef]
  8. Li, C.; Sun, L.; Jia, J.; Cai, Y.; Wang, X. Risk assessment of water pollution sources based on an integrated k-means clustering and set pair analysis method in the region of Shiyan, China. Sci. Total Environ. 2016, 557–558, 307–316. [Google Scholar] [CrossRef]
  9. Wang, Y.; Jing, H.; Yu, L.; Su, H.; Luo, N. Set pair analysis for risk assessment of water inrush in karst tunnels. Bull. Eng. Geol. Environ. 2017, 76, 1199–1207. [Google Scholar] [CrossRef]
  10. Wang, D.; Liu, D.; Ding, H.; Singh, V.P.; Wang, Y.; Zeng, X.; Wu, J.; Wang, L. A cloud model-based approach for water quality assessment. Environ. Res. 2016, 148, 24–35. [Google Scholar] [CrossRef]
  11. Wu, H.-W.; Zhen, J.; Zhang, J. Urban rail transit operation safety evaluation based on an improved CRITIC method and cloud model. J. Rail Transp. Plan. Manag. 2020, 16, 100206. [Google Scholar] [CrossRef]
  12. Wu, J.; Zhou, Z. Risk assessment of seepage failure in deep excavations based on fuzzy analytic hierarchy process and cloud model. Acta Geotech. 2023, 18, 5635–5658. [Google Scholar] [CrossRef]
  13. Feng, S.; Lei, H.; Wan, Y.; Jin, H.; Han, J. Influencing factors and control measures of excavation on adjacent bridge foundation based on analytic hierarchy process and finite element method. Front. Struct. Civ. Eng. 2021, 15, 461–477. [Google Scholar] [CrossRef]
  14. Liu, J.; Shang, W.; Yu, X.; Pi, J.; Xie, J. Risk Assessment on Deep Excavation Construction Based on Fuzzy Evaluation Theory. Chin. J. Undergr. Space Eng. 2016, 12, 825–830. [Google Scholar]
  15. Zhang, L.; Li, H. Construction Risk Assessment of Deep Foundation Pit Projects Based on the Projection Pursuit Method and Improved Set Pair Analysis. Appl. Sci. 2022, 12, 1922. [Google Scholar] [CrossRef]
  16. Cheng, W.; Yin, H.; Xie, D.; Dong, F.; Li, Y.; Zhu, T.; Wang, J. Prediction of dominant roof water inrush windows and analysis of control target area based on set pair variable weight—Forward correlation cloud model. J. Clean. Prod. 2024, 483, 144253. [Google Scholar] [CrossRef]
  17. Ilham, N.I.; Dahlan, N.Y.; Hussin, M.Z. Optimizing solar PV investments: A comprehensive decision-making index using CRITIC and TOPSIS. Renew. Energy Focus 2024, 49, 100551. [Google Scholar] [CrossRef]
  18. Wu, H.; Liu, S.; Wang, J.; Yang, T. Construction Safety Risk Assessment of Bridges in the Marine Environment Based on CRITIC and TOPSIS Models. J. Coast. Res. 2020, 108, 206–210. [Google Scholar] [CrossRef]
  19. Xu, M.; Xu, J.; Wan, Y.; Qin, J.; Wu, B.; Xie, Y. Safety evaluation of subway station construction based on CRITIC method and TOPSIS. J. Nat. Disasters 2022, 31, 157–166. [Google Scholar] [CrossRef]
  20. Bai, Z.; Liu, Q.; Liu, Y. Risk assessment of water inrush from coal seam roof with an AHP–CRITIC algorithm in Liuzhuang Coal Mine, China. Arab. J. Geosci. 2022, 15, 364. [Google Scholar] [CrossRef]
  21. Wang, H.-L.; Zhao, X.-F.; Chen, H.-J.; Yi, K.; Xie, W.-C.; Xu, W.-Y. Evaluation of toppling rock slopes using a composite cloud model with DEMATEL–CRITIC method. Water Sci. Eng. 2023, 16, 280–288. [Google Scholar] [CrossRef]
  22. Wu, B.; Zeng, J.; Zhu, R.; Yang, F.; Liu, C.; Xie, Y. A collapse risk assessment method for subway foundation pit based on cloud model and improved Dempster–Shafer evidence theory. Sci. Rep. 2024, 14, 2653. [Google Scholar] [CrossRef] [PubMed]
  23. Wang, Y.; Li, Y.; Wan, R. Assessment of Water Disaster Resilience in Mountainous Urban Metro Stations by Combination Weighting Method and Extension Cloud Model. Water 2024, 16, 3266. [Google Scholar] [CrossRef]
  24. Wang, J.; Huang, M.; Guo, J. Rock Burst Evaluation Using the CRITIC Algorithm-Based Cloud Model. Front. Phys. 2021, 8, 593701. [Google Scholar] [CrossRef]
  25. Li, K.; Liu, X.; Xiao, D.; Zhang, D.; Ye, S. Expressway Tunnel Operation Risk Assessment Model Based on Improved Critic Method and Cloud Model. In Proceedings of the 21st COTA International Conference of Transportation Professionals, CICTP 2021, Xi’an, China, 16–19 December 2021; American Society of Civil Engineers (ASCE): Reston, VA, USA, 2021; pp. 1063–1071. [Google Scholar]
  26. Wen, X.; Nie, Y.; Du, Z.; Huang, L. Operational safety assessment of straddle-type monorail vehicle system based on cloud model and improved CRITIC method. Eng. Fail. Anal. 2022, 139, 106463. [Google Scholar] [CrossRef]
  27. Bu, L.; Li, S.-c.; Shi, S.-s.; Xie, X.-k.; Li, L.-p.; Zhou, Z.-q.; Wen, Z.-j. A New Advance Classification Method for Surrounding Rock in Tunnels Based on the Set-Pair Analysis and Tunnel Seismic Prediction System. Geotech. Geol. Eng. 2018, 36, 2403–2413. [Google Scholar] [CrossRef]
  28. Ha, J.; Yang, L.; Xiao, W.; Li, J.; Kuang, D. Multi-dimensional Dynamic Evaluation on the Safety Risks in the Deep Foundation Pit Excavation of Subway Station Based on Information Entropy. J. Eng. Manag. 2022, 36, 79–84. [Google Scholar] [CrossRef]
  29. Hsieh, P.-G.; Ou, C.-Y.; Lin, Y.-L. Three-dimensional numerical analysis of deep excavations with cross walls. Acta Geotech. 2013, 8, 33–48. [Google Scholar] [CrossRef]
  30. Piciullo, L.; Ritter, S.; Lysdahl, A.O.K.; Langford, J.; Nadim, F. Assessment of building damage due to excavation-induced displacements: The GIBV method. Tunn. Undergr. Space Technol. 2021, 108, 103673. [Google Scholar] [CrossRef]
  31. Tang, C.; He, S.-Y.; Zhou, W.-H. Settlement-based framework for long-term serviceability assessment of immersed tunnels. Reliab. Eng. Syst. Saf. 2022, 228, 108801. [Google Scholar] [CrossRef]
  32. Tan, Y.; Jiang, W.; Luo, W.; Lu, Y.; Xu, C. Longitudinal Sliding Event during Excavation of Feng-Qi Station of Hangzhou Metro Line 1: Postfailure Investigation. J. Perform. Constr. Facil. 2018, 32, 04018039. [Google Scholar] [CrossRef]
  33. Pan, Y.; Qin, J.; Hou, Y.; Chen, J.-J. Two-stage support vector machine-enabled deep excavation settlement prediction considering class imbalance and multi-source uncertainties. Reliab. Eng. Syst. Saf. 2024, 241, 109578. [Google Scholar] [CrossRef]
  34. Wei, X.; Deng, Z.; Wei, G.; Ding, Z. Safety evaluation of foundation pits by extension assessment method combined with entropy law. Chin. J. Geotech. Eng. 2008, 30, 672–676. [Google Scholar]
  35. Wei, W.; Danna, L.; Di, P. Extension Evaluation on Excavation Safety of Deep Foundation Pit in Sandy Cobble Stratum Based on Entropy Method. J. Southwest Jiaotong Univ. 2021, 56, 785–791+838. [Google Scholar]
  36. Li, D.; Liu, C.; Gan, W. A new cognitive model: Cloud model. Int. J. Intell. Syst. 2009, 24, 357–375. [Google Scholar] [CrossRef]
  37. Wang, M.; Wang, Y.; Shen, F.; Jin, J. A novel classification approach based on integrated connection cloud model and game theory. Commun. Nonlinear Sci. Numer. Simul. 2021, 93, 105540. [Google Scholar] [CrossRef]
  38. Shen, S.-L.; Lin, S.-S.; Zhou, A. A cloud model-based approach for risk analysis of excavation system. Reliab. Eng. Syst. Saf. 2023, 231, 108984. [Google Scholar] [CrossRef]
  39. Wang, X.; Li, S.; Xu, Z.; Hu, J.; Pan, D.; Xue, Y. Risk assessment of water inrush in karst tunnels excavation based on normal cloud model. Bull. Eng. Geol. Environ. 2019, 78, 3783–3798. [Google Scholar] [CrossRef]
  40. Wang, M.; Wang, X.; Liu, Q.; Shen, F.; Jin, J. A novel multi-dimensional cloud model coupled with connection numbers theory for evaluation of slope stability. Appl. Math. Model. 2020, 77, 426–438. [Google Scholar] [CrossRef]
  41. Wu, D.; Yan, J.; Wang, M.; Chen, G.; Jin, J.; Shen, F. Multidimensional Connection Cloud Model Coupled with Improved CRITIC Method for Evaluation of Eutrophic Water. Math. Probl. Eng. 2022, 2022, 4753261. [Google Scholar] [CrossRef]
  42. Wang, M.; Liu, Q.; Wang, X.; Shen, F.; Jin, J. Prediction of Rockburst Based on Multidimensional Connection Cloud Model and Set Pair Analysis. Int. J. Geomech. 2020, 20, 04019147. [Google Scholar] [CrossRef]
  43. Wang, M.; Zhu, Q.; Zhu, Y.; Jin, J. Shrinkage-swelling evaluation of untreated and lime-treated expansive clays based on the asymmetric connection cloud model. Yingyong Jichu Yu Gongcheng Kexue Xuebao/J. Basic Sci. Eng. 2017, 25, 162–170. [Google Scholar]
  44. Chen, H.; Shen, Q.; Feng, Z.; Liu, Y. Vulnerability assessment in urban metro systems based on an improved cloud model and a Bayesian network. Sustain. Cities Soc. 2023, 98, 104823. [Google Scholar] [CrossRef]
  45. Tu, S.; Zheng, K.; Zhang, Y.; Deng, M. Research on Overall Risk Assessment Model Construction Safety of Freeway High Cutting Slope Engineering Based on Improved CRITIC Method and Cloud Model. Safe Environ. Eng. 2019, 26, 127–132. [Google Scholar]
  46. Wu, C.; Zhou, L.; Jin, J.; Ning, S.; Zhang, Z.; Bai, L. Regional water resource carrying capacity evaluation based on multi-dimensional precondition cloud and risk matrix coupling model. Sci. Total Environ. 2020, 710, 136324. [Google Scholar] [CrossRef]
  47. Lang, Q.; Wang, W.; Gao, C. Stability evaluation of deep foundation pit of metro based on grey correlation analysis with combined weights. J. Jilin Univ. (Earth Sci. Ed.) 2020, 50, 1823–1832. [Google Scholar]
  48. Chai, N.; Zhou, W.; Chen, Z.; Lodewijks, G.; Zhao, Y. Multi-attribute fire safety evaluation of subway stations based on FANP—FGRA—Cloud model. Tunn. Undergr. Space Technol. 2024, 144, 105526. [Google Scholar] [CrossRef]
  49. Cheng, J.; Yang, X.; Wang, H.; Li, H.; Lin, X.; Guo, Y. Evaluation of the Emergency Capability of Subway Shield Construction Based on Cloud Model. Sustainability 2022, 14, 13309. [Google Scholar] [CrossRef]
  50. Alinezhad, A.; Khalili, J. (Eds.) CRITIC Method. In New Methods and Applications in Multiple Attribute Decision Making (MADM); Springer International Publishing: Cham, Switzerland, 2019; pp. 199–203. [Google Scholar]
  51. Liu, P.; Yu, B.; Cao, H. Comprehensive evaluation method of rockburst proneness based on multidimensional normal cloud-CRITIC model. Chin. J. Rock Mech. Eng. 2020, 39, 3432–3439. [Google Scholar]
  52. Wang, Z.; Hong, J.; Liu, P.; Zhang, L. Voltage fault diagnosis and prognosis of battery systems based on entropy and Z-score for electric vehicles. Appl. Energy 2017, 196, 289–302. [Google Scholar] [CrossRef]
  53. Bishara, A.J.; Hittner, J.B. Reducing Bias and Error in the Correlation Coefficient Due to Nonnormality. Educ. Psychol. Meas. 2014, 75, 785–804. [Google Scholar] [CrossRef] [PubMed]
  54. Zhang, L.; Wang, L. Optimization of site investigation program for reliability assessment of undrained slope using Spearman rank correlation coefficient. Comput. Geotech. 2023, 155, 105208. [Google Scholar] [CrossRef]
  55. Xing, W.; Wang, H.; Fan, J.; Wang, W.; Yu, X. Rockburst risk assessment model based on improved catastrophe progression method and its application. Stoch. Environ. Res. Risk Assess. 2024, 38, 981–992. [Google Scholar] [CrossRef]
  56. Xing, H.; Xiong, F.; Wu, J. Effects of Pit Excavation on an Existing Subway Station and Preventive Measures. J. Perform. Constr. Facil. 2016, 30, 04016063. [Google Scholar] [CrossRef]
  57. Zhang, N.; Duan, H.; Sun, P.; Li, J.; Zuo, J.; Mao, R.; Liu, G.; Niu, Y. Characterizing the generation and environmental impacts of subway-related excavated soil and rock in China. J. Clean. Prod. 2020, 248, 119242. [Google Scholar] [CrossRef]
  58. Li, Y.J.; Zhou, Z.; Alcalá, J.; Yepes, V. Research on spatial deformation monitoring and numerical coupling of deep foundation pit in soft soil. J. Build. Eng. 2025, 99, 111636. [Google Scholar] [CrossRef]
  59. Lin, S.-S.; Shen, S.-L.; Zhou, A.; Xu, Y.-S. Risk assessment and management of excavation system based on fuzzy set theory and machine learning methods. Autom. Constr. 2021, 122, 103490. [Google Scholar] [CrossRef]
  60. Sahraei, R.; Kanani-Sadat, Y.; Homayouni, S.; Safari, A.; Oubennaceur, K.; Chokmani, K. A novel hybrid GIS-based multi-criteria decision-making approach for flood susceptibility analysis in large ungauged watersheds. J. Flood Risk Manag. 2023, 16, e12879. [Google Scholar] [CrossRef]
  61. Lee, P.-C.; Zheng, L.-L.; Lo, T.-P.; Long, D.-B. A Risk Management System for Deep Excavation Based on BIM-3DGIS Framework and Optimized Grey Verhulst Model. KSCE J. Civ. Eng. 2020, 24, 715–726. [Google Scholar] [CrossRef]
  62. Wang, X.; Pan, Y.; Chen, J. Digital twin with data-mechanism-fused model for smart excavation management. Autom. Constr. 2024, 168, 105749. [Google Scholar] [CrossRef]
Figure 1. Location map of Hefei Metro Line 7.
Buildings 15 01342 g001
Figure 2. Flowchart of calculation steps based on the Second Improved CRITIC method.
Buildings 15 01342 g002
Figure 3. Safety risk evaluation cloud model for subway station deep foundation pit excavation. (a) A1 (ground subsidence). (b) A3 (horizontal displacement at the pile top). (c) A5 (axial force of internal support).
Buildings 15 01342 g003aBuildings 15 01342 g003b
Figure 4. Pie chart of weights using the Second Improved CRITIC method.
Buildings 15 01342 g004
Figure 5. Pie chart of weights using the Improved CRITIC method.
Buildings 15 01342 g005
Figure 6. Comparison of weights before and after the second improvement of the CRITIC method.
Buildings 15 01342 g006
Figure 7. Certainty line graph for three risk levels at different excavation depths.
Buildings 15 01342 g007
Table 1. Monitoring data for foundation pit safety risk evaluation indicators.
Excavation Depth Hi (m)a1 (mm)a2 (mm)a3 (mm)a4 (mm)a5 (kN)a6 (mm)a7 (mm)
11.140.810.50.691346.590.620.2
32.420.961.60.951406.521.631.3
53.281.012.41.741612.212.063.65
74.671.733.22.191655.233.383.99
95.831.894.13.121726.774.334.02
116.661.994.64.051772.865.064.23
137.032.244.95.211780.545.885.88
157.652.565.35.621810.76.726.98
17.458.563.595.96.071778.596.977.51
Table 2. Safety risk assessment criteria for foundation pits.
Evaluation IndexDiscriminate IndexIIIIII
a1A1 = a1/H1>20.4~2<0.4
a2A2 = a2/H2>20.4~2<0.4
a3A3 = a3/H3>72~7<2
a4A4 = a4/H4>20.4~2<0.4
a5A5 = a5/N>10.8~1<0.8
a6A6 = a6/H6>20.4~2<0.4
a7A7 = a7/H7>72~7<2
Table 3. Discriminate index values of foundation pit safety risk monitoring data.
Excavation Depth
Hi (m)
A1A2A3A4A5A6A7
11.140.810.500.690.300.620.20
30.810.320.530.320.310.540.43
50.660.200.480.350.360.410.73
70.670.250.460.310.370.480.57
90.650.210.460.350.380.480.45
110.610.180.420.370.390.460.38
130.540.170.380.400.400.450.45
150.510.170.350.370.400.450.47
17.450.490.210.340.350.400.400.43
Table 4. Numerical characteristics of multi-dimensional correlation cloud for each evaluation index.
GradeNumerical CharacteristicsA1A2A3A4A5A6A7
IEx3.0003.00010.5003.0001.5003.00010.500
En0.8490.8492.9730.8490.4250.8492.973
He0.0850.0850.2970.0850.0420.0850.297
IIEx1.2001.2004.5001.2000.9001.2004.500
En0.6790.6792.1230.6790.0850.6792.123
He0.0680.0680.2120.0680.0080.0680.212
IIIEx0.2600.2601.3000.2600.5200.2601.300
En0.1190.1190.5950.1190.2380.1190.595
He0.0120.0120.0590.0120.0240.0120.059
Table 5. Pearson correlation coefficients between safety evaluation indices for the Hefei Metro.
Evaluation IndexA1A2A3A4A5A6A7
A11.0000.9460.7590.771−0.9200.921−0.528
A20.9461.0000.5140.901−0.8130.868−0.661
A30.7590.5141.0000.205−0.8550.673−0.014
A40.7710.9010.2051.000−0.5330.698−0.705
A5−0.920−0.813−0.855−0.5331.000−0.8280.319
A60.9210.8680.6730.698−0.8281.000−0.680
A7−0.528−0.661−0.014−0.7050.319−0.6801.000
Table 6. Safety evaluation results and comparison for the east end shaft section of Hefei Metro Line 1.
Excavation Depth
Hi (m)
Correlation Cloud AssociationMaximum Membership PrincipleKp
Value
This PaperInformation Entropy Multi-Dimensional Dynamic Evaluation
μ(I)μ(II)μ(III)
10.0130.3330.0430.333/IIIII
30.0140.1910.3400.3402.599IIIIII
50.0130.2230.4650.4652.645IIIIII
70.0120.2600.4140.4142.586IIIIII
90.0140.1980.4030.4032.633IIIIII
110.0130.2490.3130.3132.522IIIIII
130.0130.2730.3720.3722.546IIIIII
150.0120.2770.3750.3752.547IIIIII
17.450.0120.1880.4820.4822.690IIIIII
Disclaimer/Publisher’s Note: The statements, opinions and data contained in all publications are solely those of the individual author(s) and contributor(s) and not of MDPI and/or the editor(s). MDPI and/or the editor(s) disclaim responsibility for any injury to people or property resulting from any ideas, methods, instructions or products referred to in the content.

