


Leveraging Deep Learning and Internet of Things for Dynamic Construction Site Risk Management


Abstract
1. Introduction
2. Literature Review
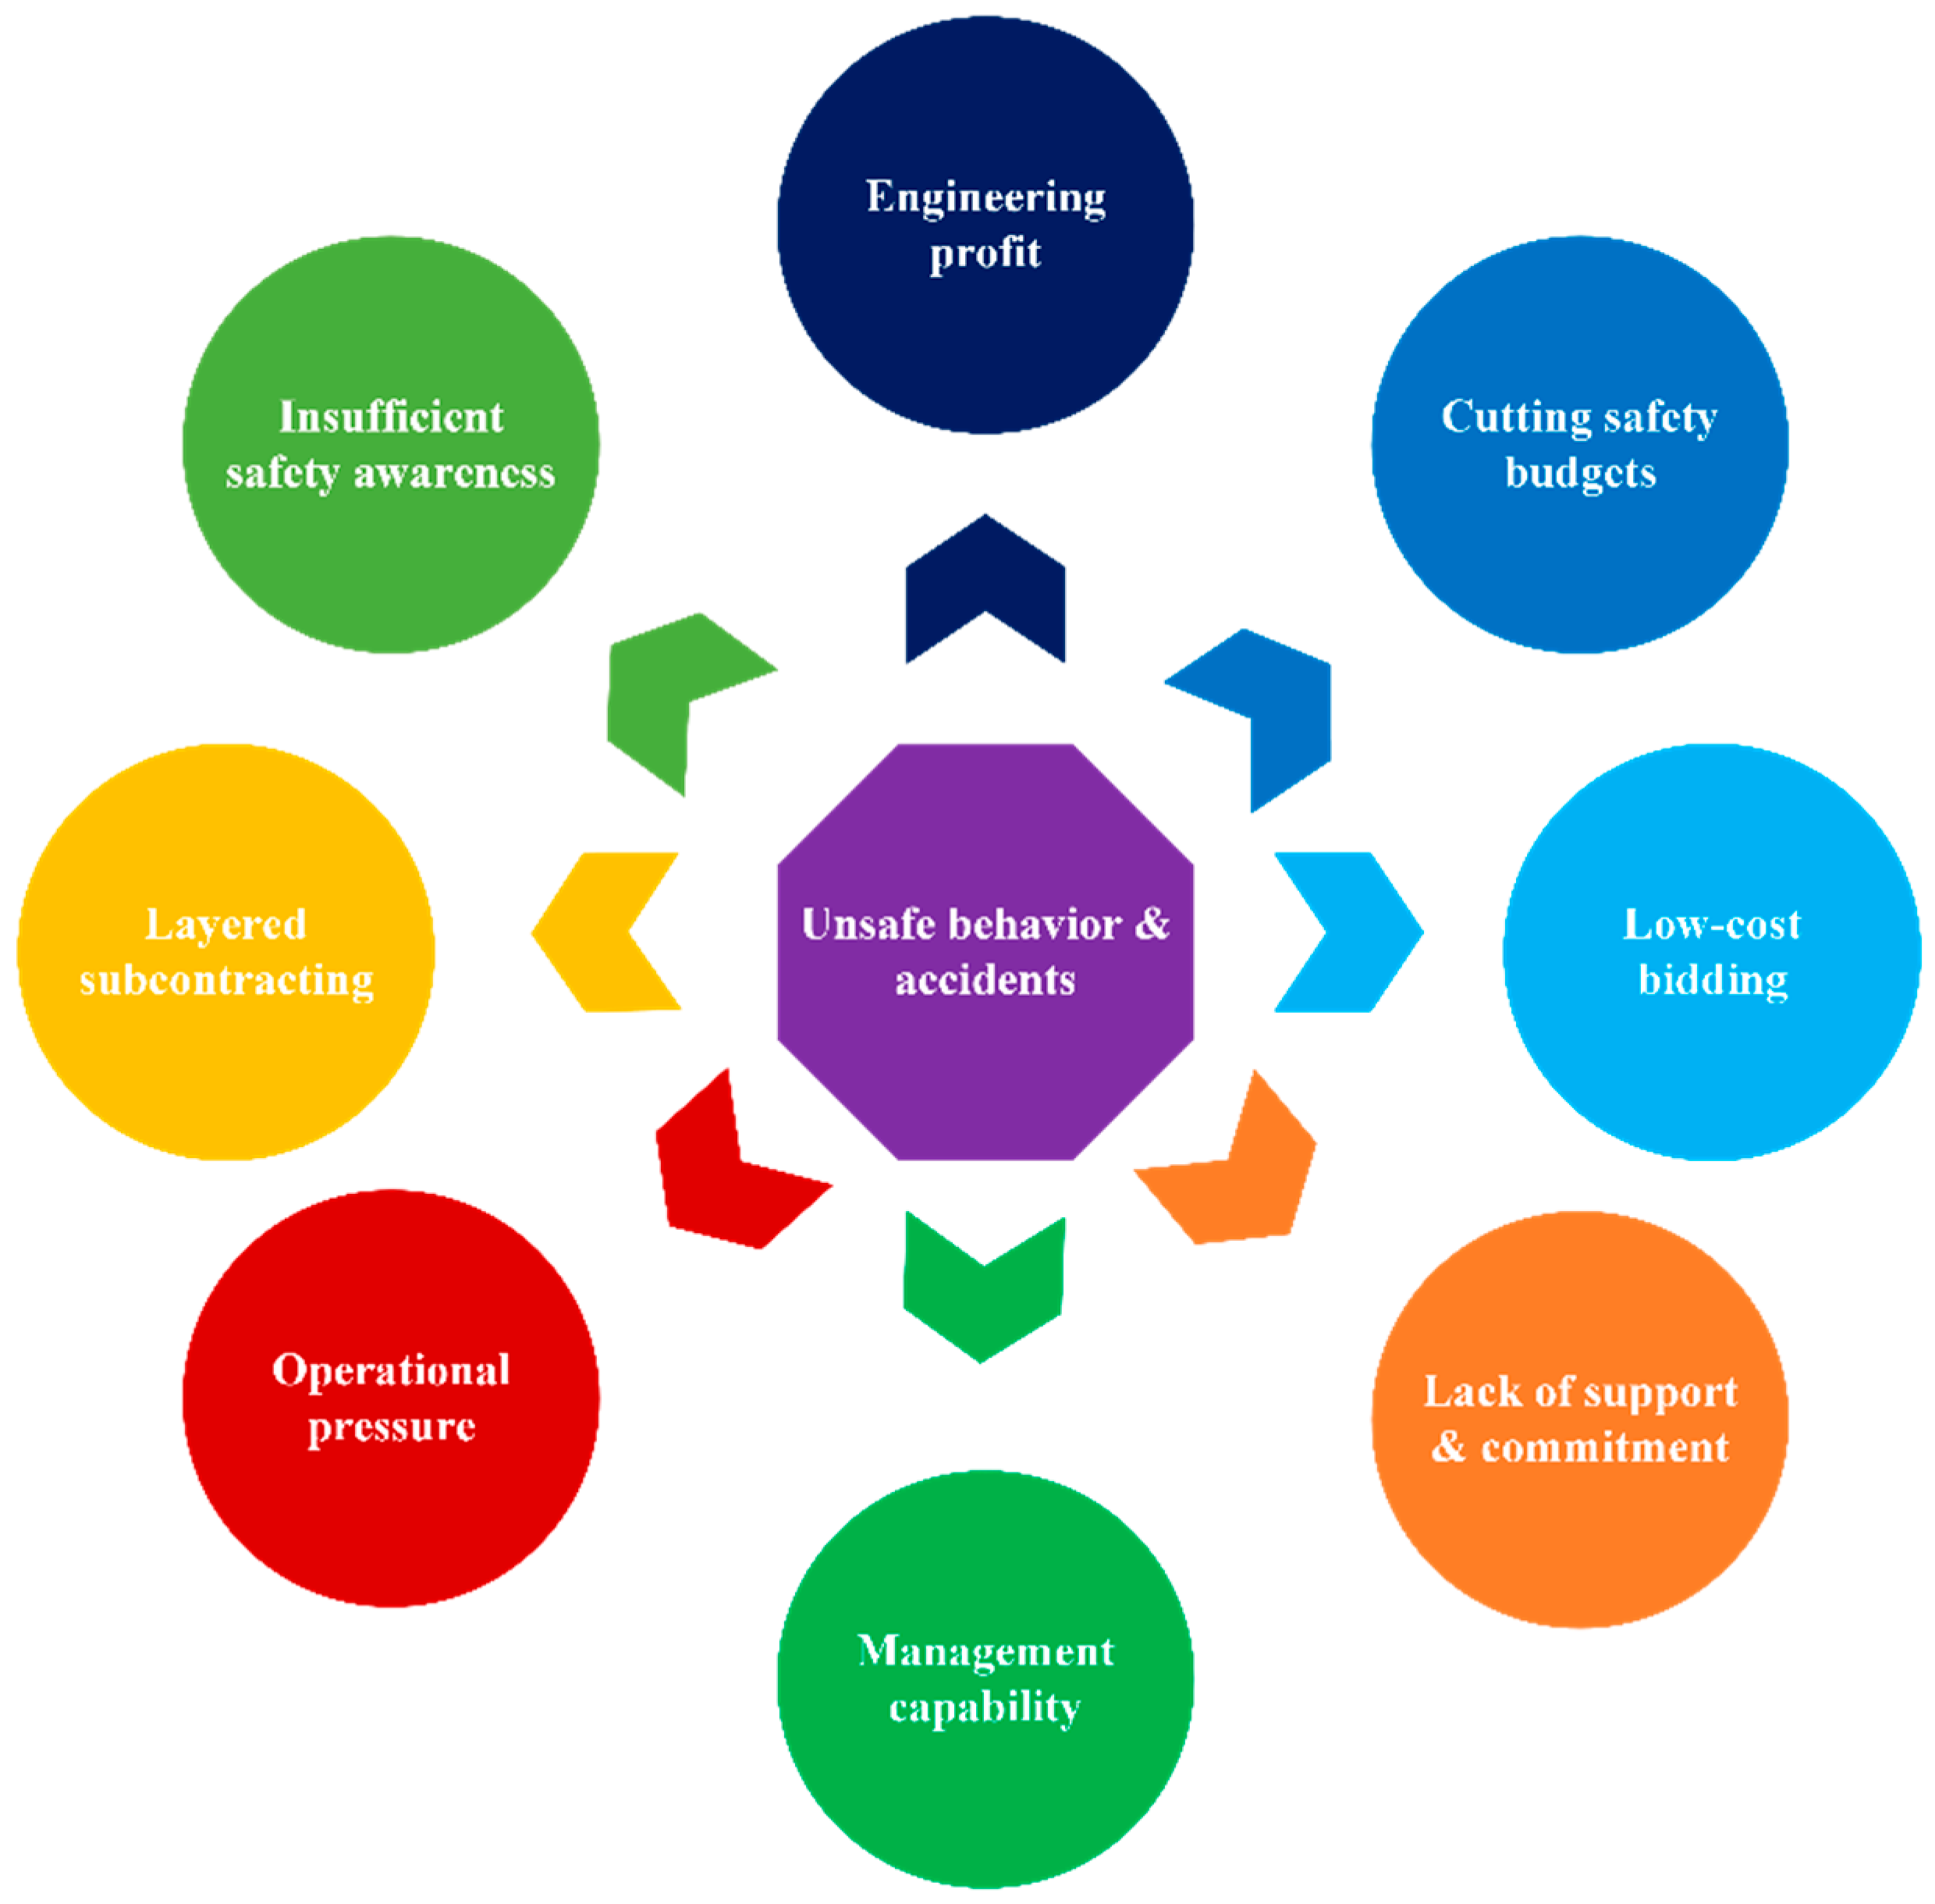
2.1. Construction Industry Safety
2.2. Integration of Automated Construction Management
3. Real-Time Object Detection Model
3.1. Data Preprocessing
- (1)
- Image Collection
- Publicly Available Datasets: The COCO dataset provides diverse human postures, enhancing worker recognition in construction environments. The ACID dataset (Architectural Construction Image Dataset) contains labeled construction machinery images, including excavators, cranes, dump trucks, and concrete mixer trucks.
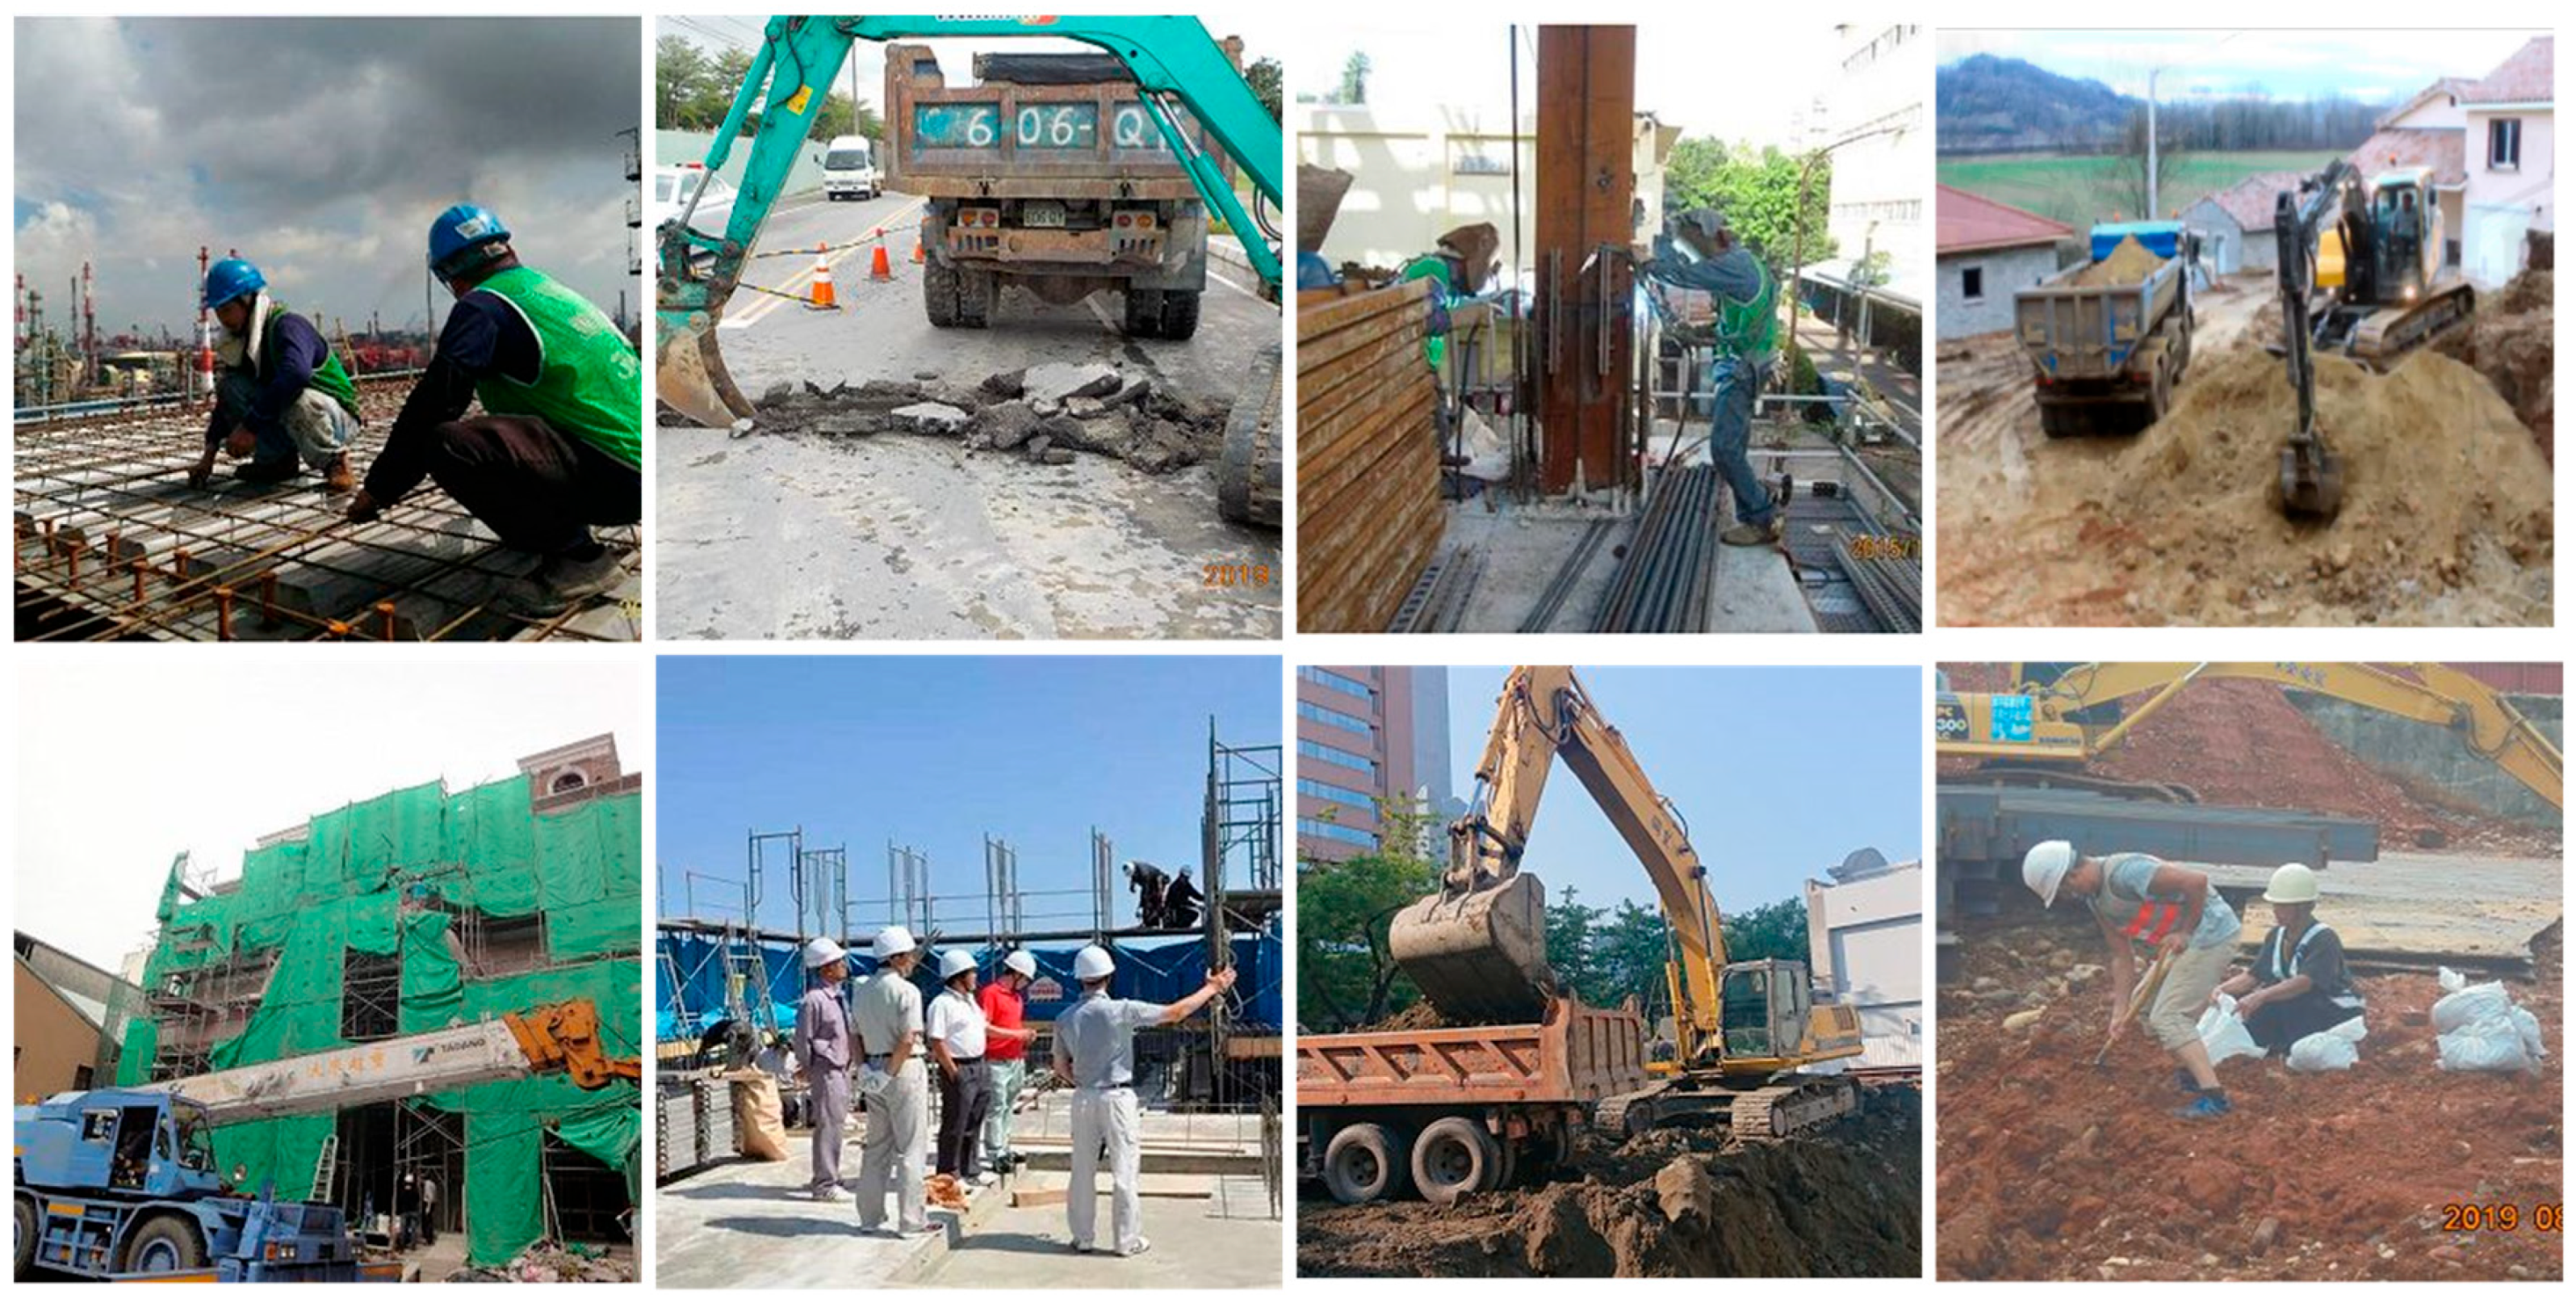
- Real-World Construction Site Images: Our research team captured images from active construction sites to ensure the dataset accurately reflects real-world conditions. These images account for weather, lighting, and background complexity variations, enhancing model adaptability.
- Creative Commons (CC) Licensed Images: Additional images were obtained through keyword-based searches (e.g., “Construction site images”, “Construction machinery images”, and “Building equipment images”). Only images with CC licenses were selected to ensure compliance with copyright regulations.
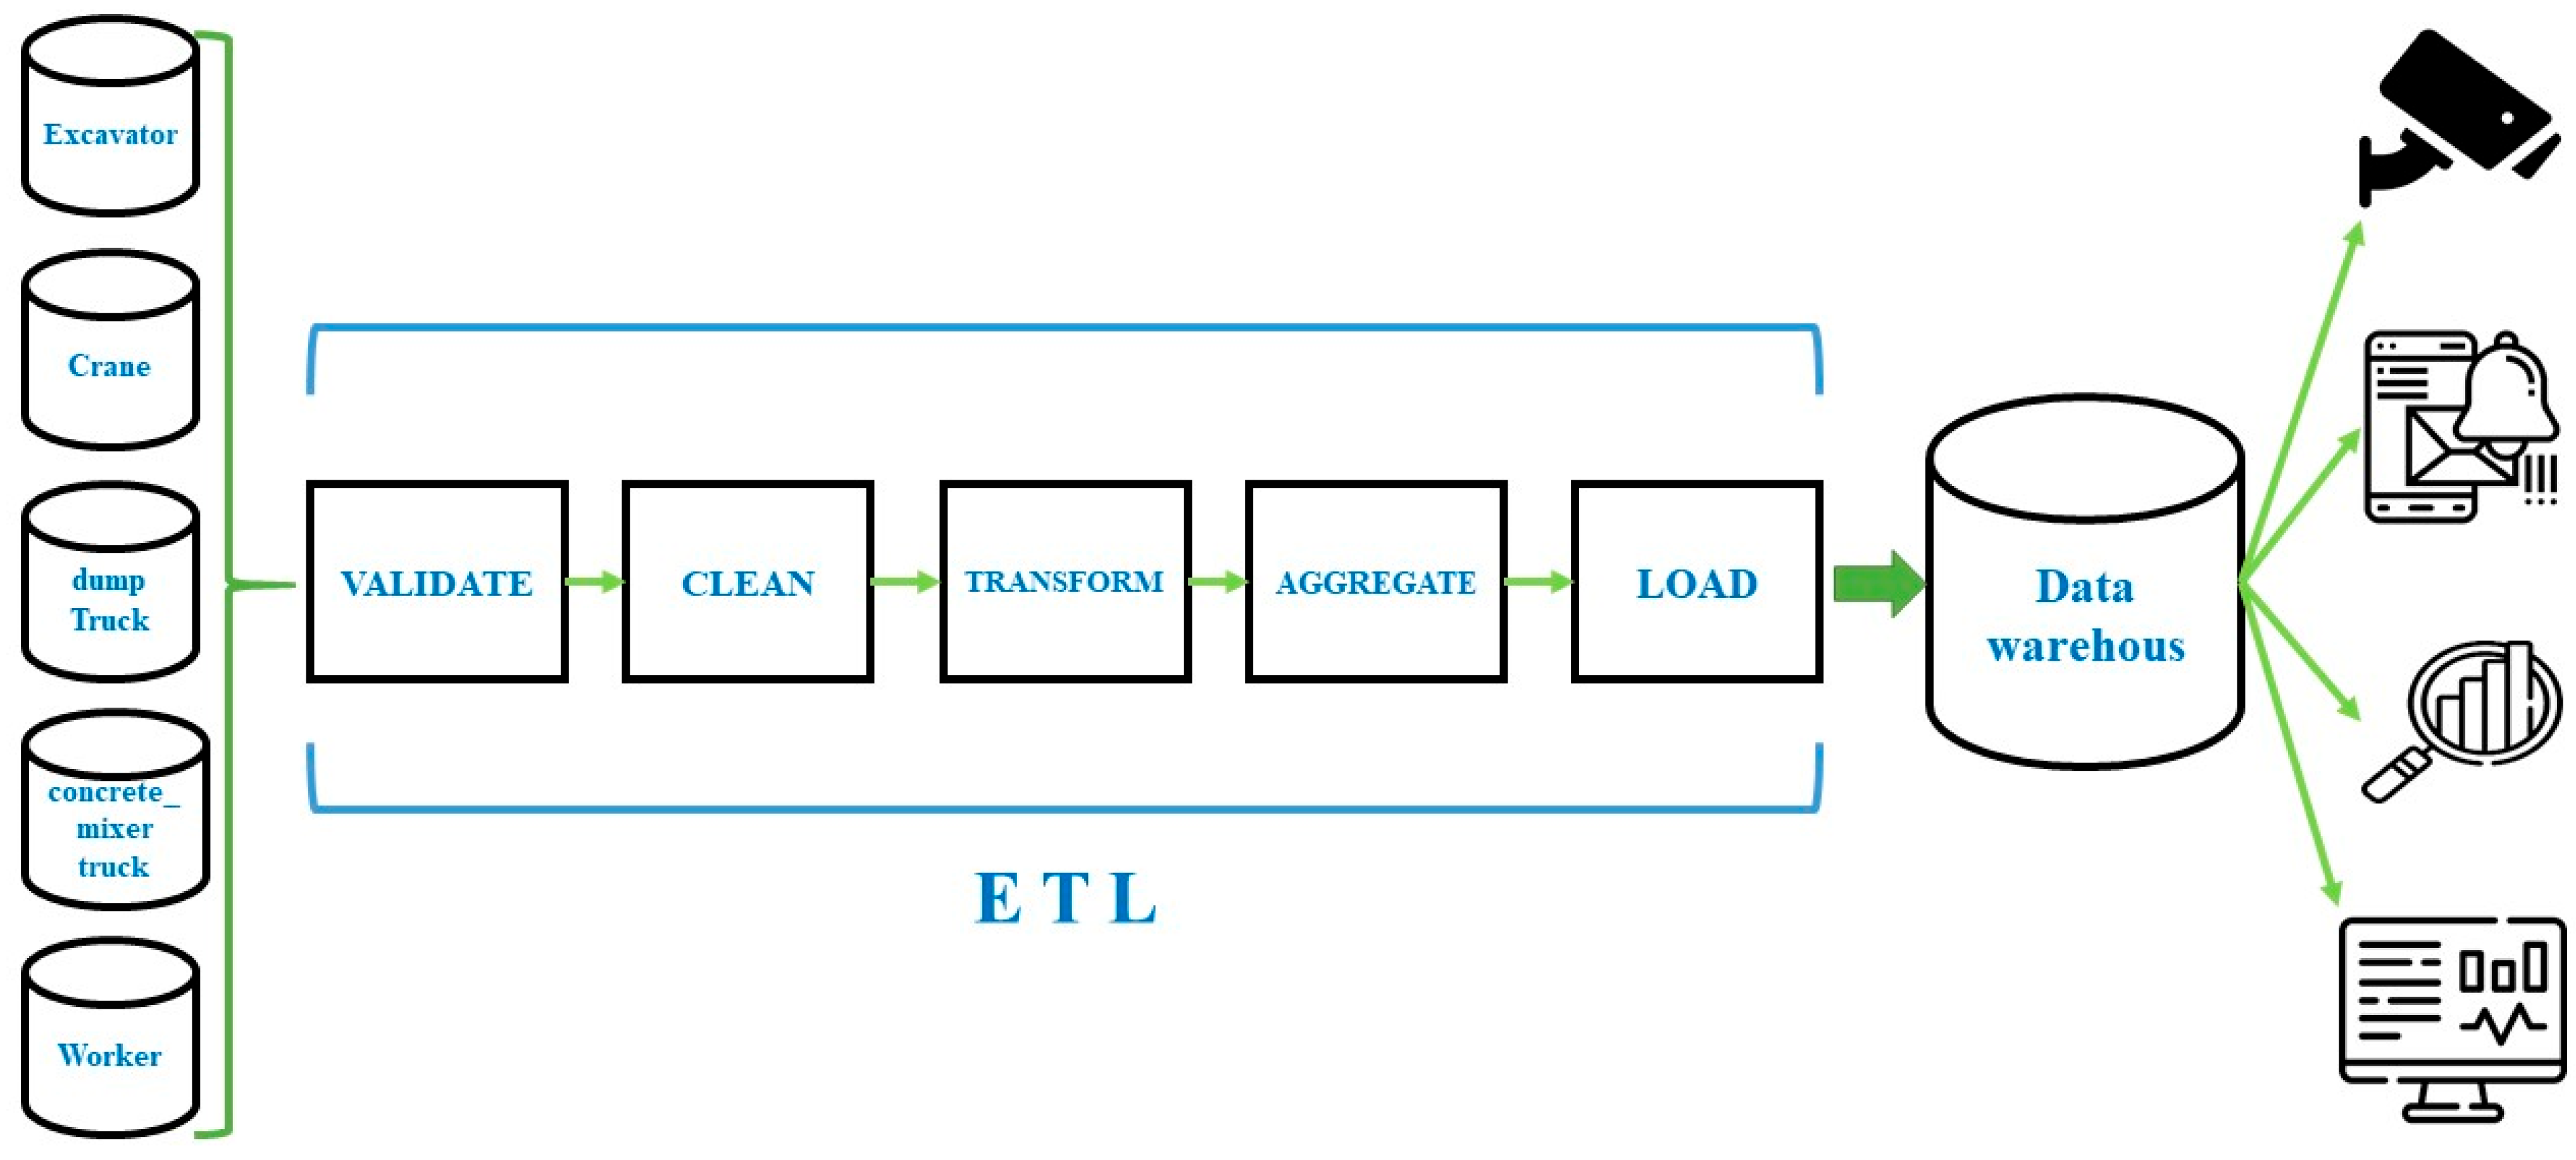
- (2)
- Extract–Transform–Load (ETL)
- ① Dataset Compilation: images of construction workers, excavators, dump trucks, cranes, and concrete mixer trucks were collected from multiple sources and captured from various angles and lighting conditions to enhance adaptability to real-world construction environments.
- ② Data Preprocessing (ETL):
- Validate: confirm that dataset images accurately represent construction workers and machinery in real construction settings.
- Clean: remove blurry, obstructed, or cluttered background images to maintain high-quality training data
- Transform: convert images to TXT format for YOLOv7 compatibility.
- Aggregate: use LabelImg to extract and label object features (e.g., an excavator’s bucket, a worker’s helmet), with YOLOv7 effectively detecting objects like workers at 15 pixels, a threshold our targets typically exceed at 320 × 320 resolution.
- Load: Structure the dataset with images, bounding boxes, and spatial coordinates. YOLOv7 was trained with a 0.01 learning rate, SGD (0.937 momentum), batch size of 12, and 300 epochs (see Section 4 for details).
- ③ Data Warehouse: The processed dataset is stored in a digital warehouse, enabling real-time integration with the IoT-based hazard warning system. This structured dataset facilitates image recognition, construction safety alerts, and statistical analysis for predictive risk assessment.
3.2. Heterogeneity Analysis in Construction Safety Systems
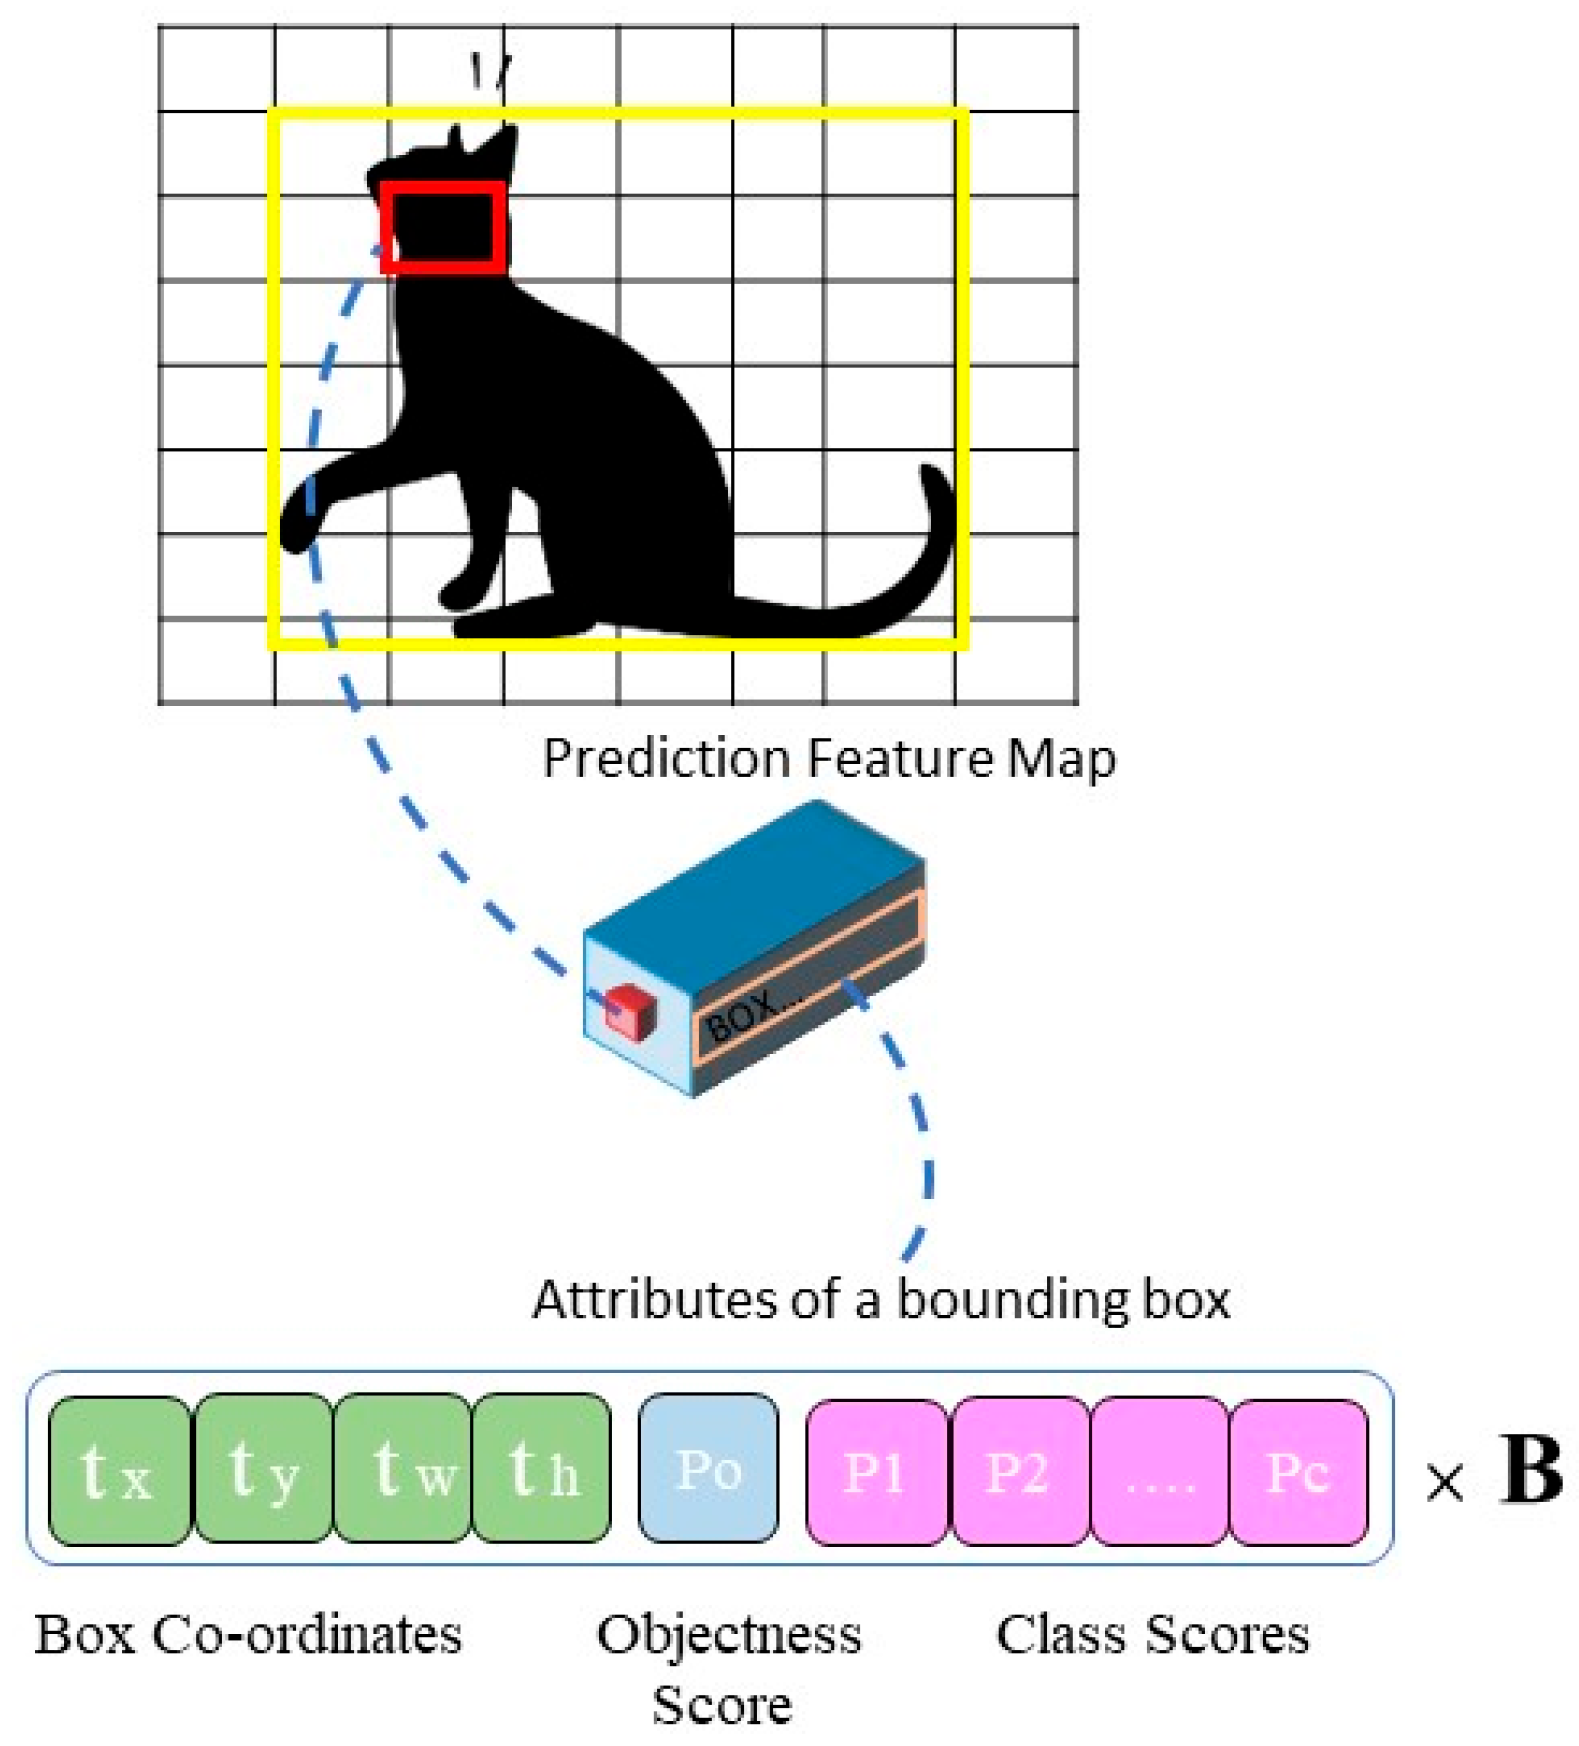
3.3. YOLO Object Detection Method
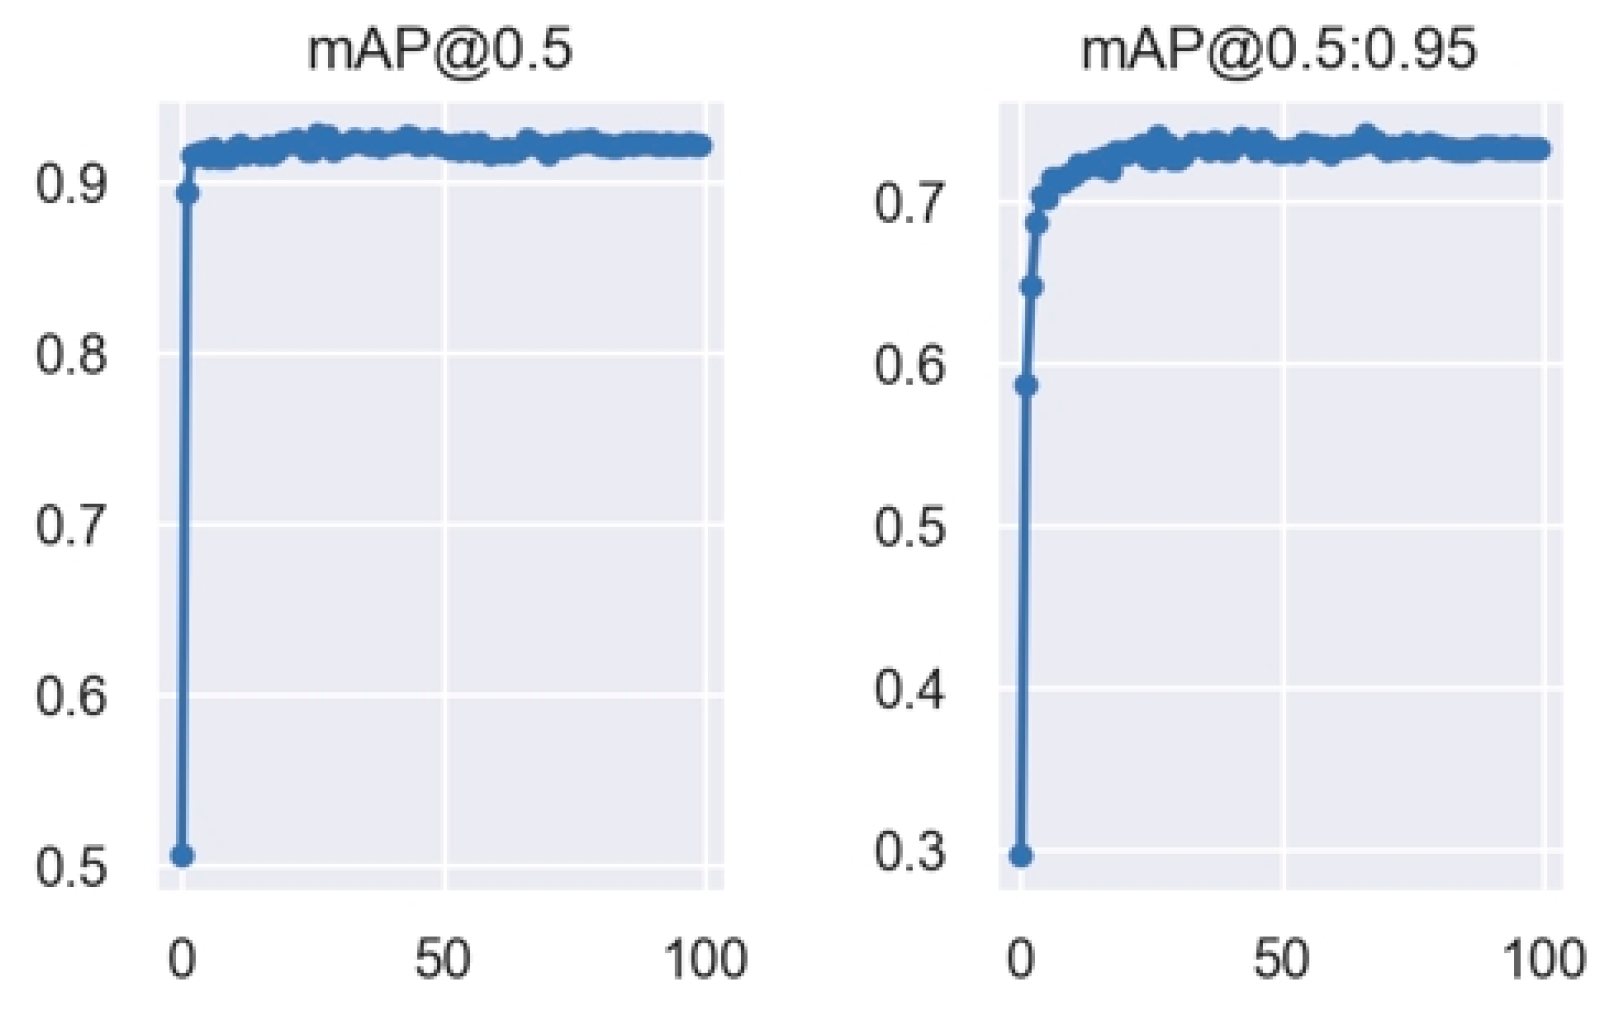
4. Experiment and Results
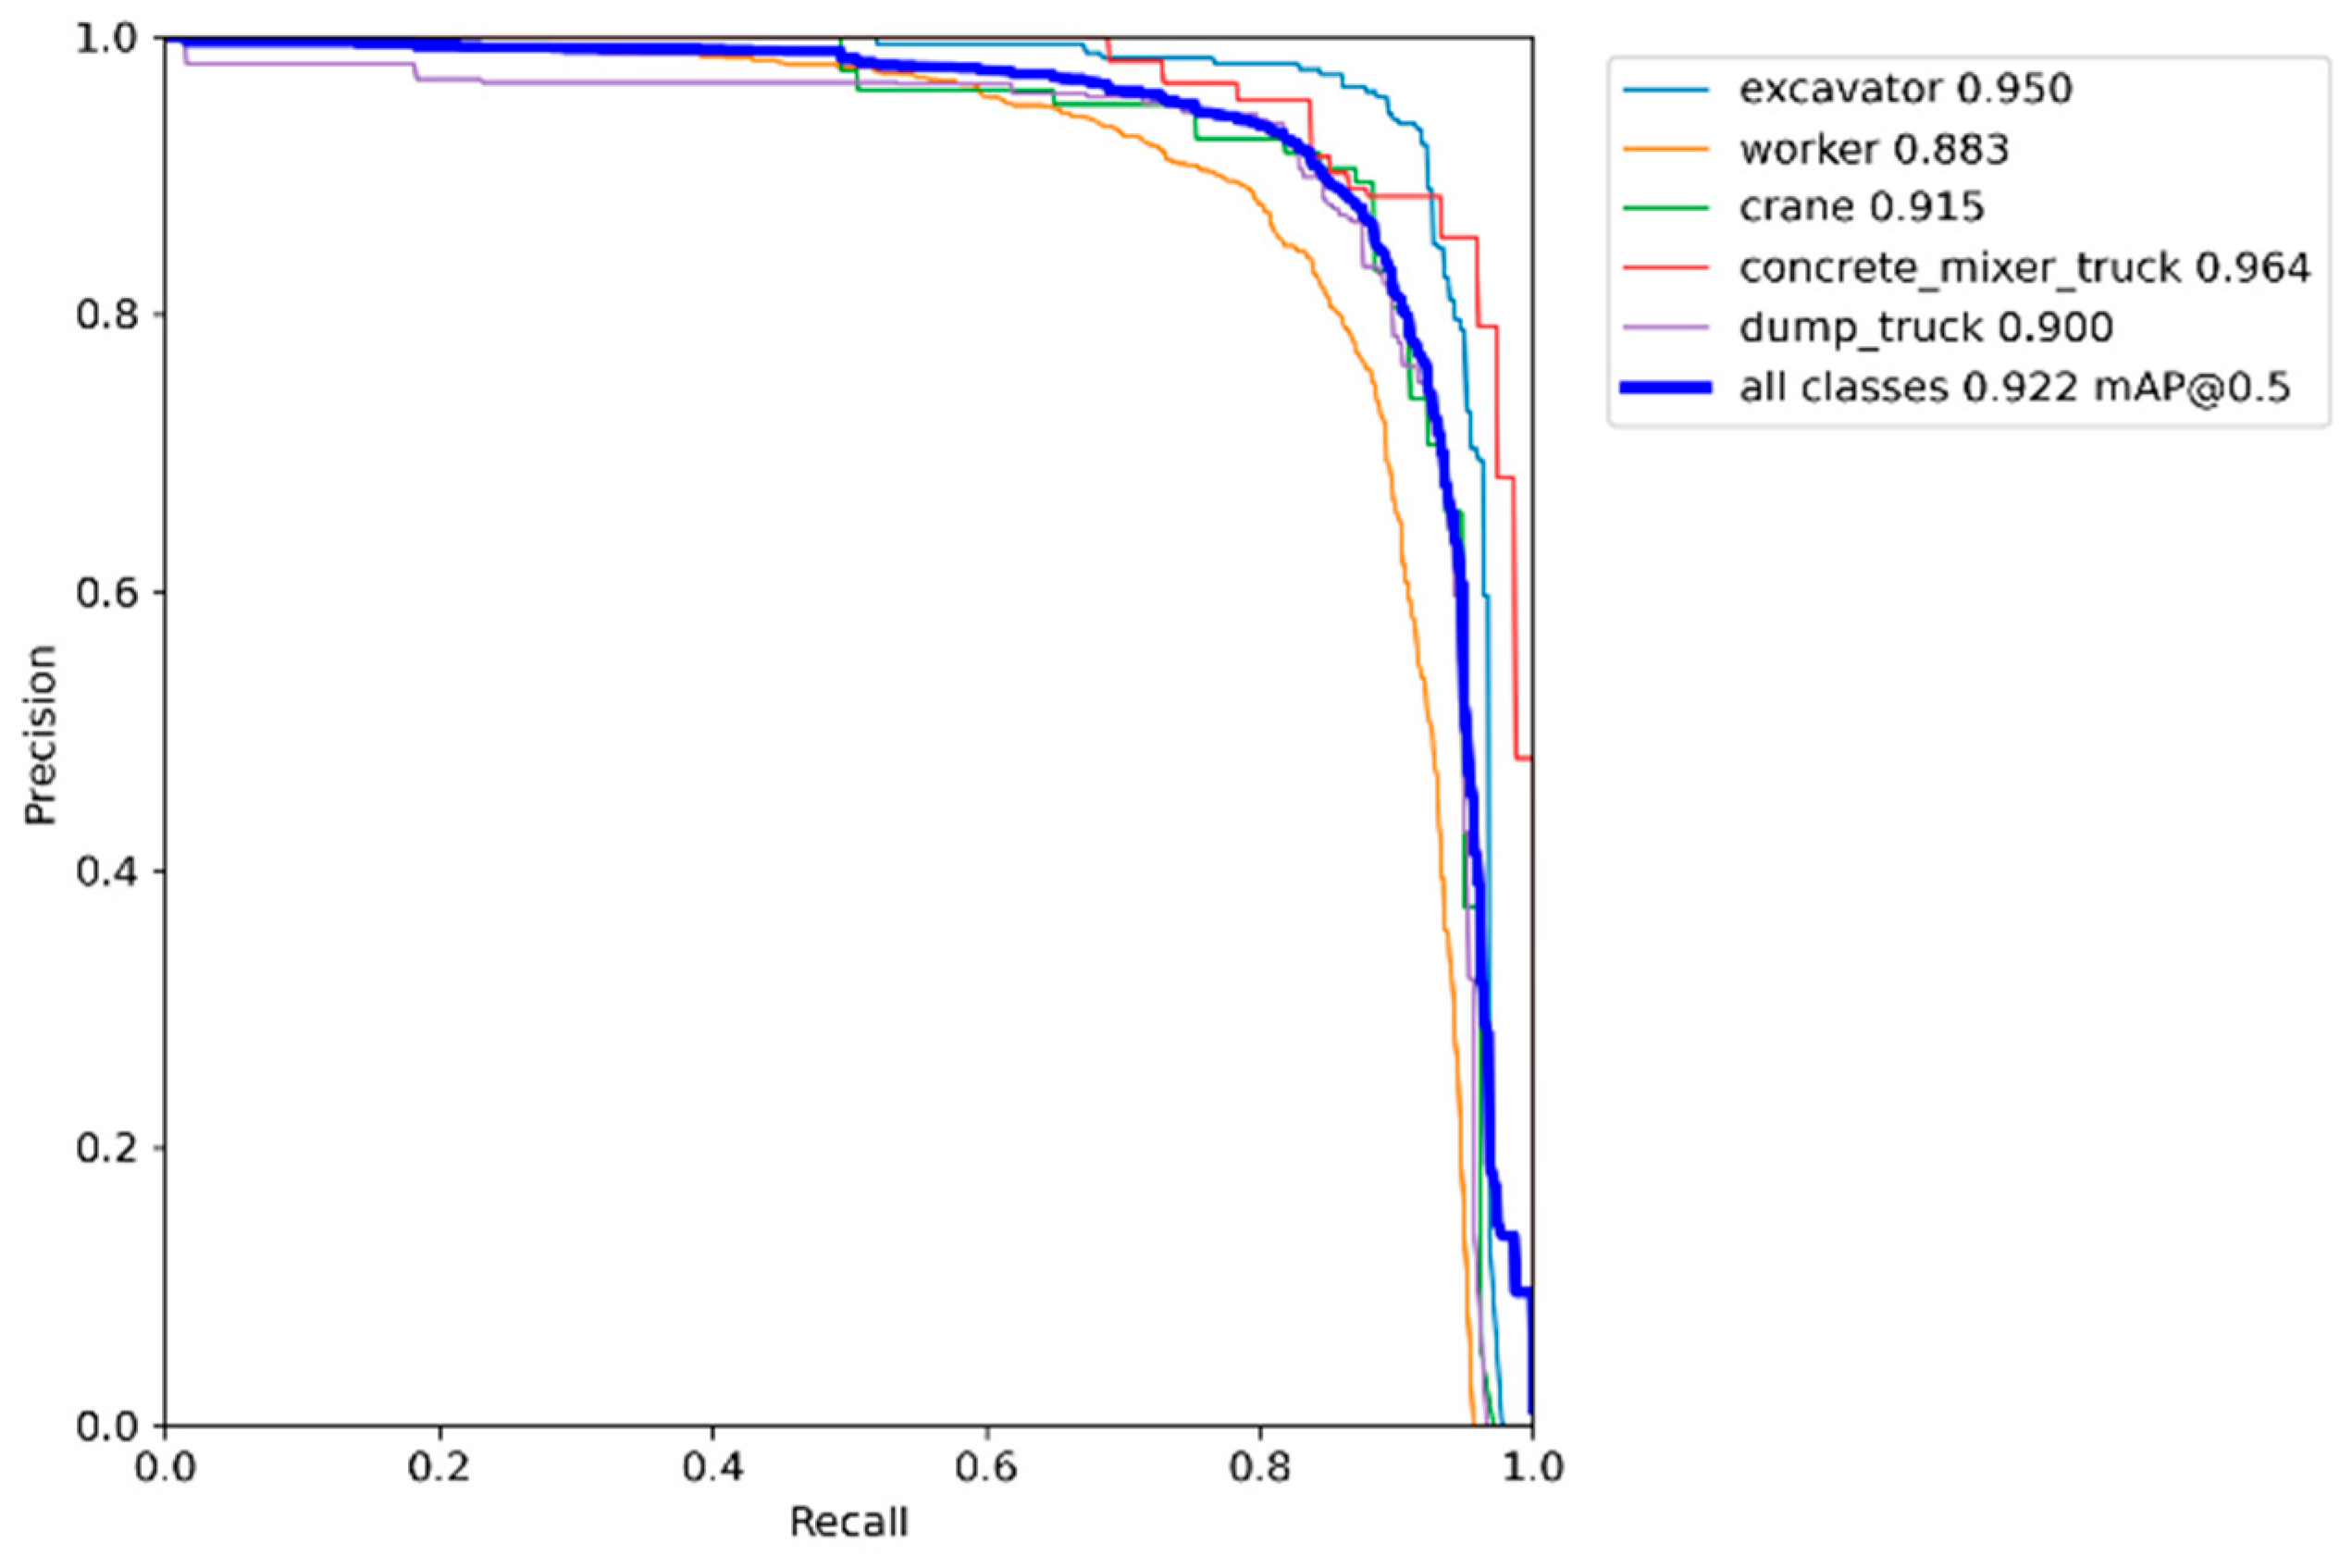
- Worker: the AP for workers slightly increases from 0.856 at 33% sample size to 0.883 at 100%, indicating that the model maintains reliable detection even with fewer samples due to the high variability captured in this category.
- Crane: the AP for cranes improves from 0.835 to 0.915 as the sample size increases, showing that additional data enhance the model’s ability to detect less frequent classes.
- Excavators and Concrete Mixer Truck: these categories maintain high AP scores even at lower sample sizes, suggesting that distinctive features aid their detection.
- Dump Truck: strong performance is demonstrated relative to sample size, maintaining stability with mid-sized datasets and exhibiting improved detection capabilities as the training sample size increases.
5. System Application and Testing
5.1. System Architecture
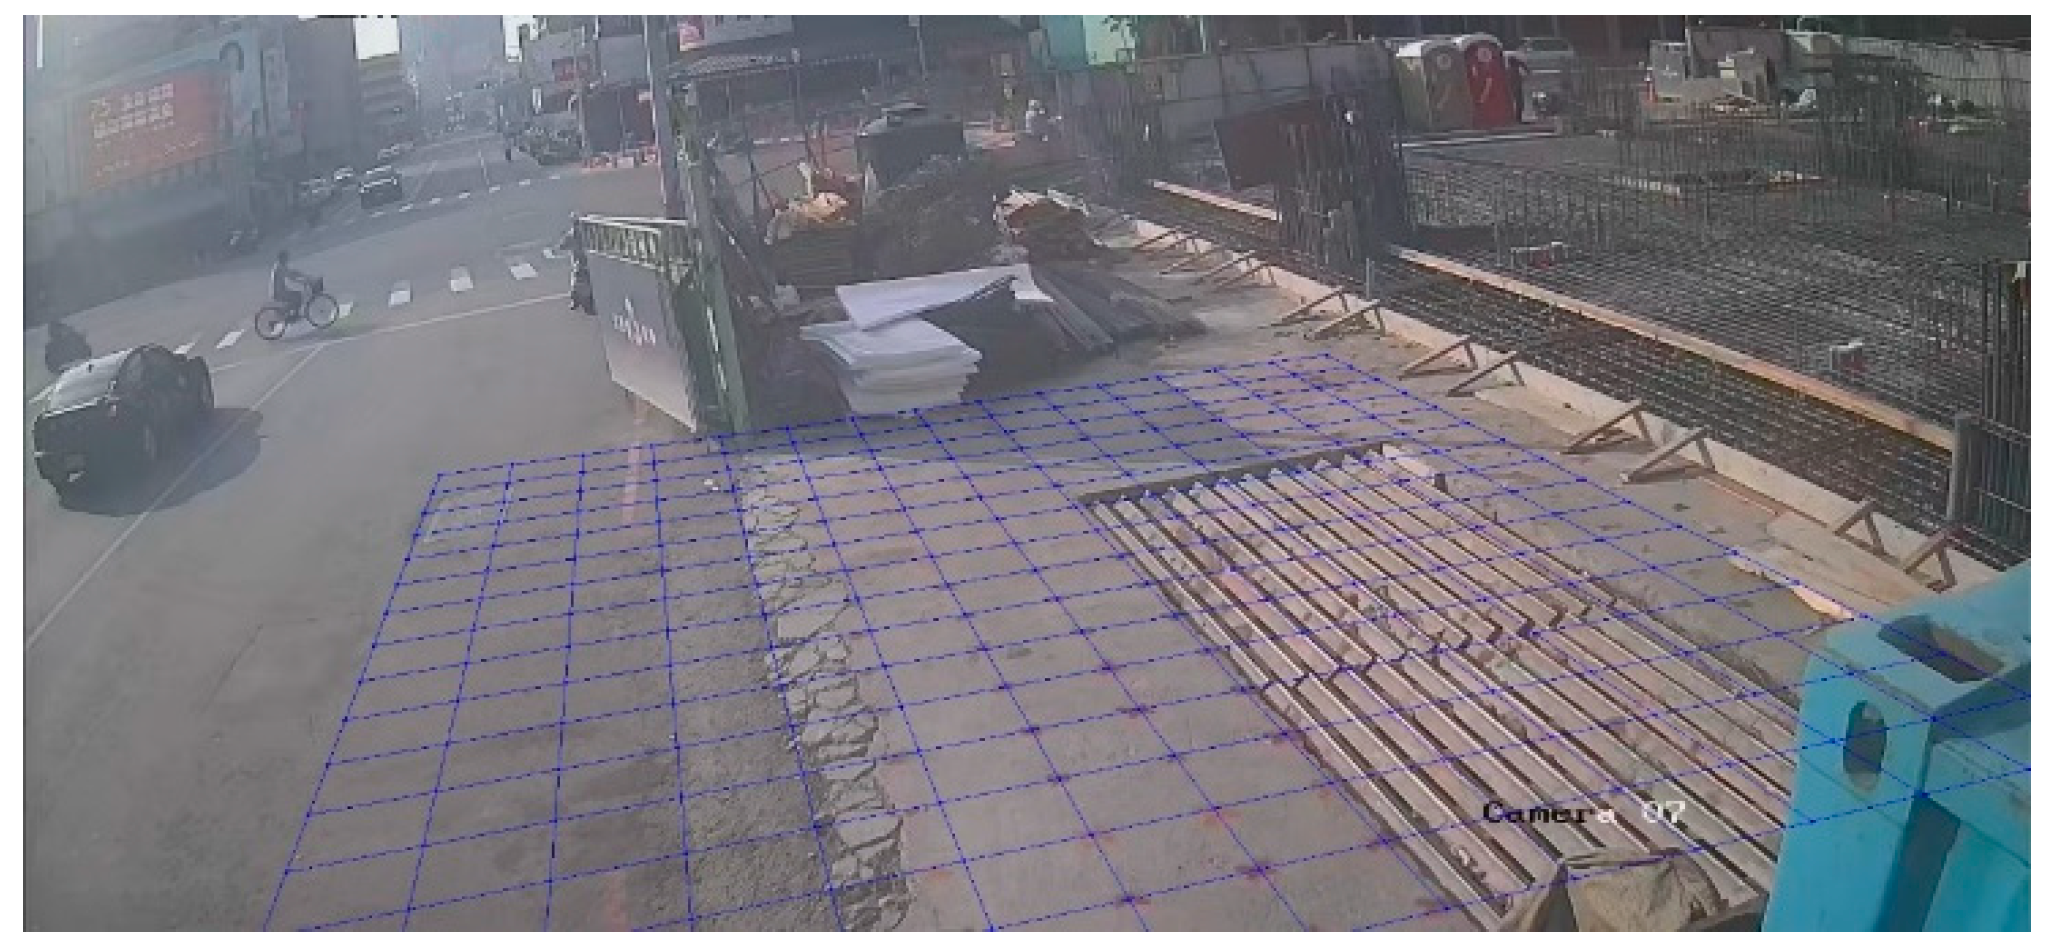
5.2. Perspective Projection Coordinate Transformation
5.3. Security Assessment Block Module
5.4. Distance Estimation Accuracy
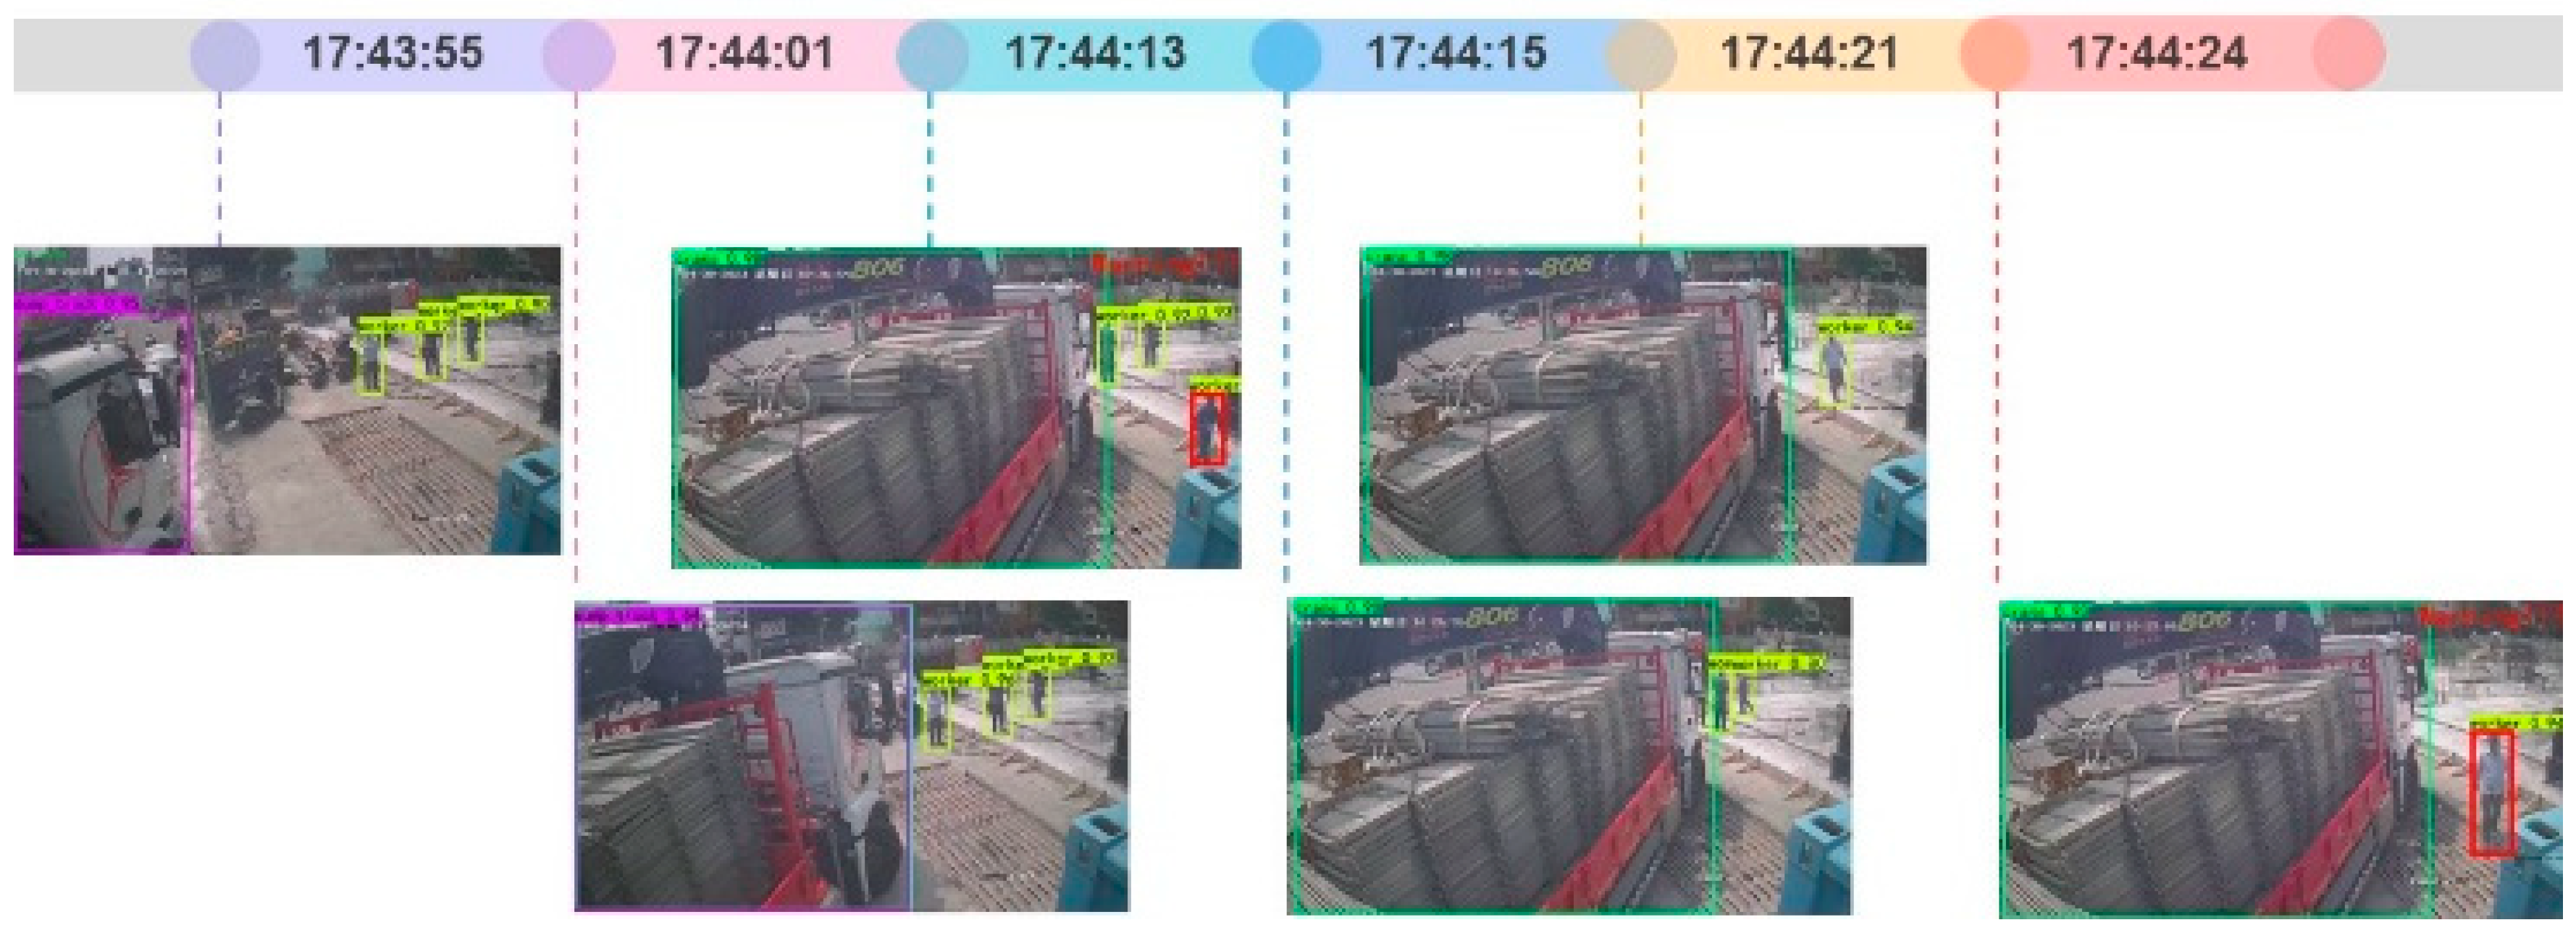
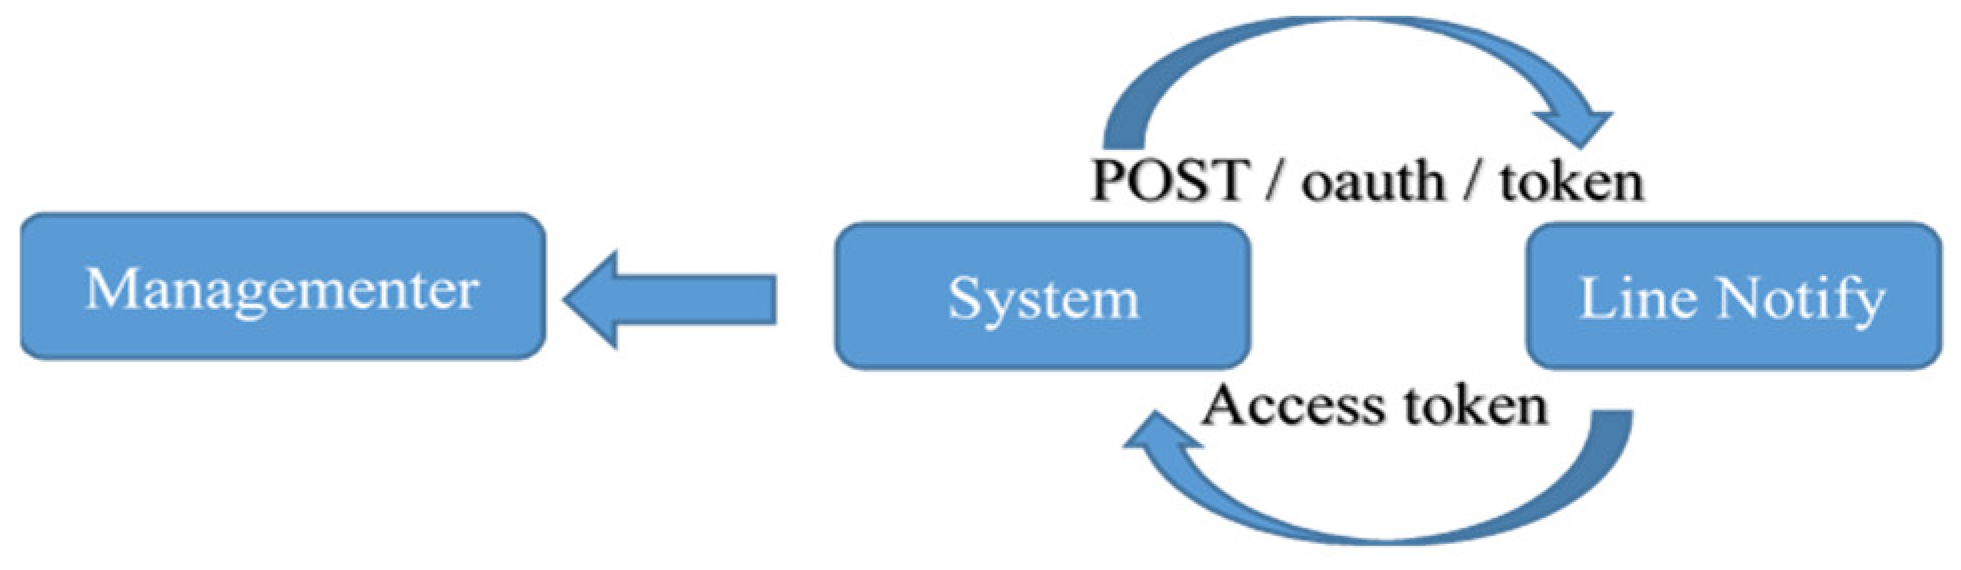
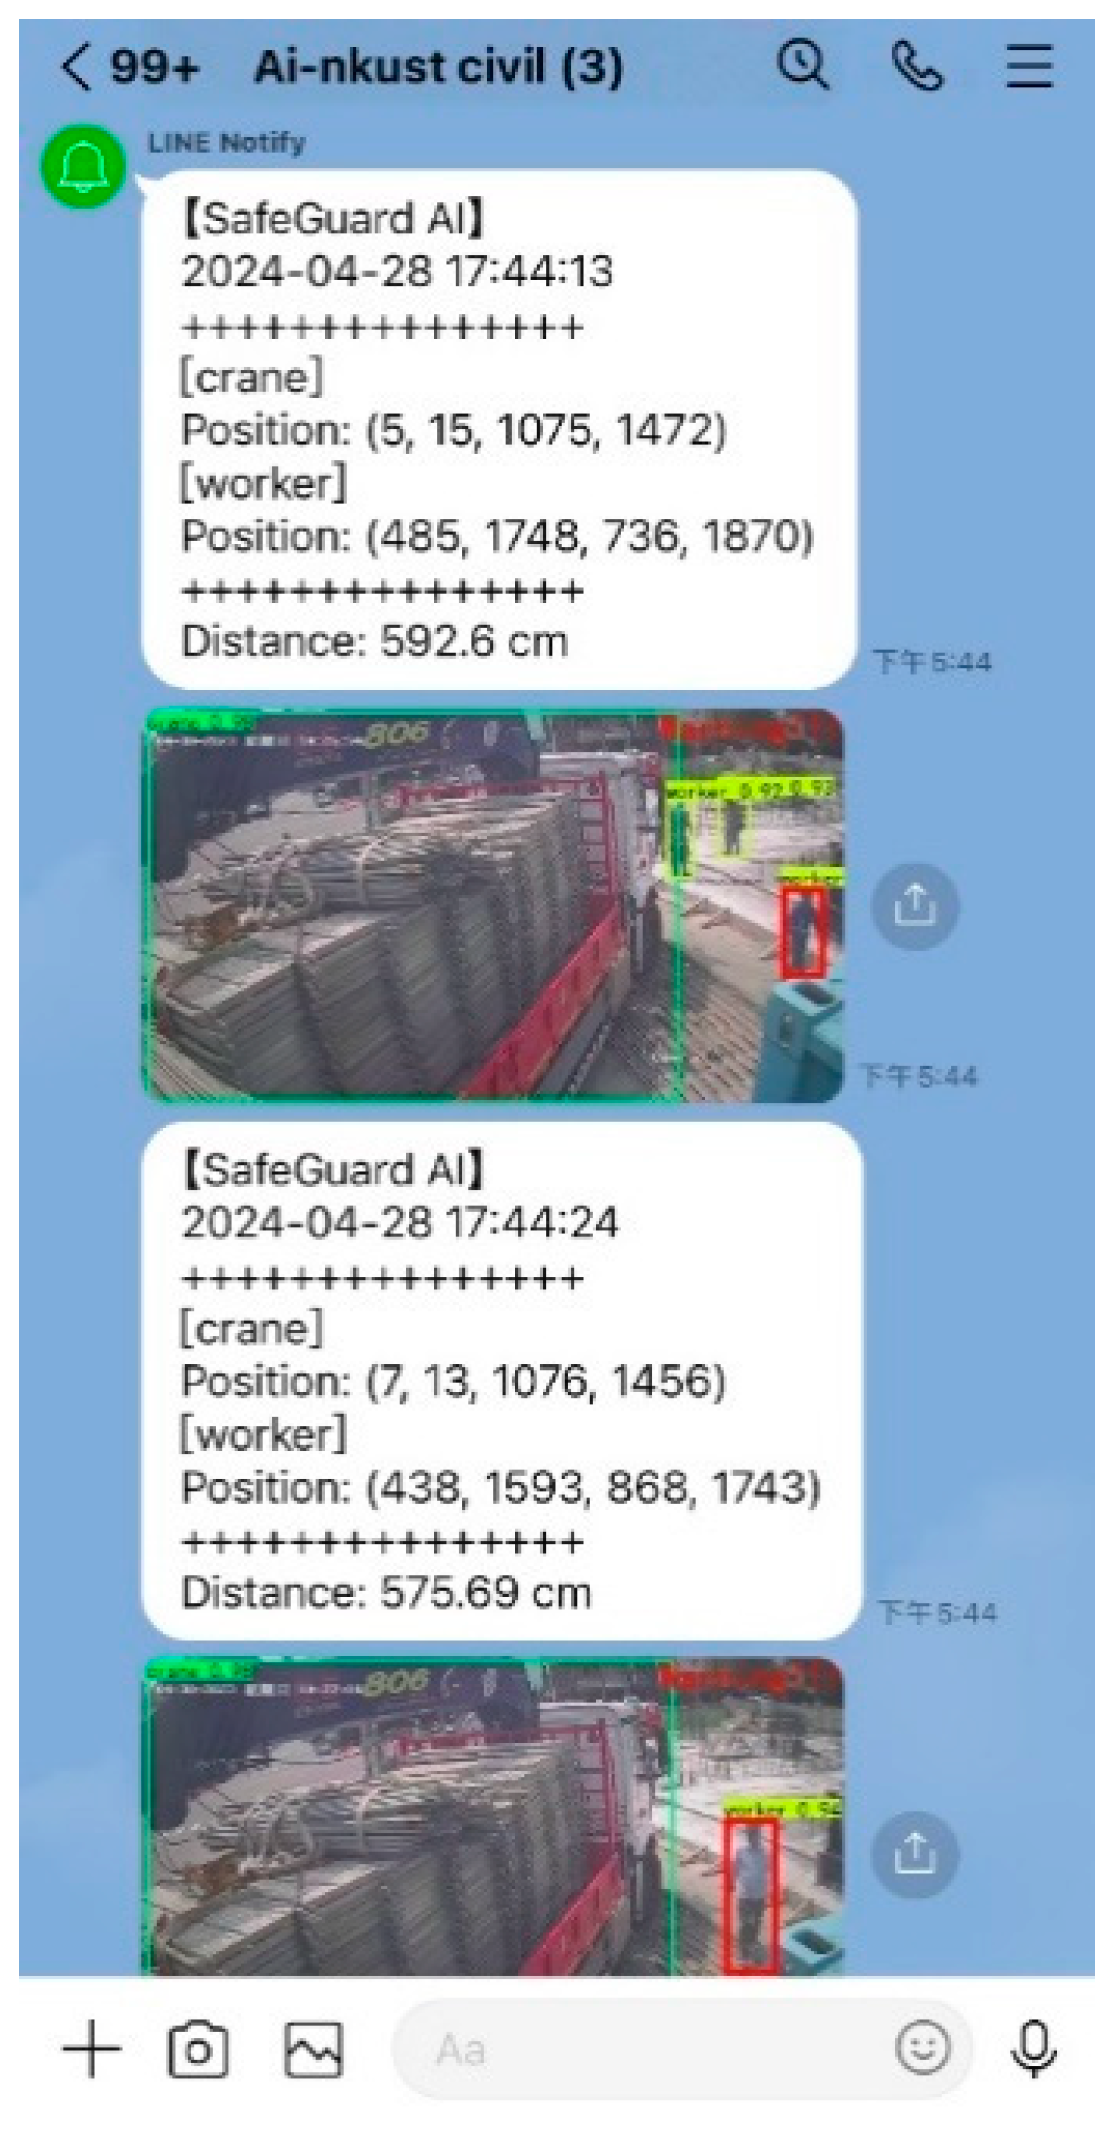
5.5. Real-Time IoT Alert System
6. Conclusions
Author Contributions
Funding
Data Availability Statement
Conflicts of Interest
References
- Schwatka, N.V.; Hecker, S.; Goldenhar, L.M. Defining and measuring safety climate: A review of the construction industry literature. Ann. Occup. Hyg. 2016, 60, 537–550. [Google Scholar] [CrossRef] [PubMed]
- Wang, H.; Zhang, Z.; Li, Y. A tripartite evolutionary game involving quality regulation of prefabricated building projects considering government rewards and penalties. Int. J. Ind. Eng. Theory Appl. Pract. 2023, 30, 8779. [Google Scholar] [CrossRef]
- Chang, H.; Trieste, J.V. Accidents Highlight Workplace Safety at Taiwan’s Construction Sites. Taiwan News, 29 November 2023.
- Chen, W.T.; Tsai, I.C.; Merrett, H.C.; Lu, S.T.; Lee, Y.-I.; You, J.-K.; Mortis, L. Construction Safety Success Factors: A Taiwanese Case Study. Sustainability 2020, 12, 6326. [Google Scholar] [CrossRef]
- Kineber, A.F.; Antwi-Afari, M.F.; Elghaish, F.; Zamil, A.M.A.; Alhusban, M.; Qaralleh, T.J.O. Benefits of implementing occupational health and safety management systems for the sustainable construction industry: A systematic literature review. Sustainability 2023, 15, 12697. [Google Scholar] [CrossRef]
- Chen, H.; Mao, Y.; Xu, Y.; Wang, R. The impact of wearable devices on the construction safety of building workers: A systematic review. Sustainability 2023, 15, 11165. [Google Scholar] [CrossRef]
- Yu, W.-D.; Hsiao, W.-T.; Cheng, T.-M.; Chiang, H.-S.; Chang, C.-Y. Describing Construction Hazard Images Identified from Site Safety Surveillance Video. In Proceedings of the 3rd International Civil Engineering and Architecture Conference, Singapore, 11–14 March 2024; pp. 937–948. [Google Scholar]
- Kang, L. Statistical analysis and case investigation of fatal fall-from-height accidents in the Chinese construction industry. Int. J. Ind. Eng. Theory Appl. Pract. 2022, 29, 7971. [Google Scholar] [CrossRef]
- Zhou, Z.; Goh, Y.M.; Li, Q. Overview and analysis of safety management studies in the construction industry. Saf. Sci. 2015, 72, 337–350. [Google Scholar] [CrossRef]
- Bohn, J.S.; Teizer, J. Benefits and barriers of construction project monitoring using high-resolution automated cameras. J. Constr. Eng. Manag. 2010, 136, 632–640. [Google Scholar] [CrossRef]
- Chen, X.; Zhu, Y.; Chen, H.; Ouyang, Y.; Luo, X.; Wu, X. BIM-based optimization of camera placement for indoor construction monitoring considering the construction schedule. Autom. Constr. 2021, 130, 103825. [Google Scholar] [CrossRef]
- Parsamehr, M.; Perera, U.S.; Dodanwala, T.C.; Perera, P.; Ruparathna, R. A review of construction management challenges and BIM-based solutions: Perspectives from the schedule, cost, quality, and safety management. Asian J. Civ. Eng. 2023, 24, 353–389. [Google Scholar] [CrossRef]
- Ozumba, A.O.U.; Shakantu, W. Exploring challenges to ICT utilisation in construction site management. Constr. Innov. 2018, 18, 321–349. [Google Scholar] [CrossRef]
- Tabatabaee, S.; Mohandes, S.R.; Ahmed, R.R.; Mahdiyar, A.; Arashpour, M.; Zayed, T.; Ismail, S. Investigating the barriers to applying the internet-of-things-based technologies to construction site safety management. Int. J. Environ. Res. Public Health 2022, 19, 868. [Google Scholar] [CrossRef] [PubMed]
- Afzal, M.; Shafiq, M.T.; Al Jassmi, H. Improving construction safety with virtual-design construction technologies—A review. J. Inf. Technol. Constr. 2021, 26, 319–340. [Google Scholar] [CrossRef]
- Dorafshan, S.; Thomas, R.J.; Maguire, M. Comparison of deep convolutional neural networks and edge detectors for image-based crack detection in concrete. Constr. Build. Mater. 2018, 186, 1031–1045. [Google Scholar] [CrossRef]
- Deng, J.; Singh, A.; Zhou, Y.; Lu, Y.; Lee, V.C.-S. Review on computer vision-based crack detection and quantification methodologies for civil structures. Constr. Build. Mater. 2022, 356, 129238. [Google Scholar] [CrossRef]
- Fang, W.; Ding, L.; Love, P.E.D.; Luo, H.; Li, H.; Peña-Mora, F.; Zhong, B.; Zhou, C. Computer vision applications in construction safety assurance. Autom. Constr. 2020, 110, 103013. [Google Scholar] [CrossRef]
- Chou, J.-S.; Liu, C.-H. Automated Sensing System for Real-Time Recognition of Trucks in River Dredging Areas Using Computer Vision and Convolutional Deep Learning. Sensors 2021, 21, 555. [Google Scholar] [CrossRef]
- Sha, M.; Boukerche, A. Performance evaluation of CNN-based pedestrian detectors for autonomous vehicles. Ad Hoc Netw. 2022, 128, 102784. [Google Scholar] [CrossRef]
- Greeshma, A.S.; Edayadiyil, J.B. Automated progress monitoring of construction projects using Machine learning and image processing approach. Mater. Today Proc. 2022, 65, 554–563. [Google Scholar]
- Yeşilmen, S.; Tatar, B. Efficiency of convolutional neural networks (CNN) based image classification for monitoring construction related activities: A case study on aggregate mining for concrete production. Case Stud. Constr. Mater. 2022, 17, e01372. [Google Scholar] [CrossRef]
- Wang, C.-Y.; Bochkovskiy, A.; Liao, H.-Y.M. YOLOv7: Trainable bag-of-freebies sets new state-of-the-art for real-time object detectors. In Proceedings of the IEEE/CVF Conference on Computer Vision and Pattern Recognition, Vancouver, BC, Canada, 17–24 June 2023; pp. 7464–7475. [Google Scholar]
- Kim, K.; Kim, K.; Jeong, S. Application of YOLO v5 and v8 for Recognition of Safety Risk Factors at Construction Sites. Sustainability 2023, 15, 15179. [Google Scholar] [CrossRef]
- Han, T.; Ma, T.; Fang, Z.; Zhang, Y.; Han, C. A BIM-IoT and intelligent compaction integrated framework for advanced road compaction quality monitoring and management. Comput. Electr. Eng. 2022, 100, 107981. [Google Scholar] [CrossRef]
- Musarat, M.A.; Khan, A.M.; Alaloul, W.S.; Blas, N.; Ayub, S. Automated monitoring innovations for efficient and safe construction practices. Results Eng. 2024, 22, 102057. [Google Scholar] [CrossRef]
- Halder, S.; Afsari, K.; Shojaei, A. Natural Interaction Modalities for Human-CPS Interaction in Construction Progress Monitoring. arXiv 2023, arXiv:2312.05988. [Google Scholar]
- Halder, S.; Afsari, K.; Chiou, E.; Patrick, R.; Hamed, K.A. Construction inspection & monitoring with quadruped robots in future human-robot teaming: A preliminary study. J. Build. Eng. 2023, 65, 105814. [Google Scholar]
- Halder, S.; Afsari, K.; Akanmu, A. A Robotic Cyber-Physical System for Automated Reality Capture and Visualization in Construction Progress Monitoring. arXiv 2024, arXiv:2402.07034. [Google Scholar]
- Lo, Y.; Zhang, C.; Ye, Z.; Cui, C. Monitoring road base course construction progress by photogrammetry-based 3D reconstruction. Int. J. Constr. Manag. 2023, 23, 2087–2101. [Google Scholar] [CrossRef]
- Wang, J.; Ouyang, R.; Wen, W.; Wan, X.; Wang, W.; Tolba, A.; Zhang, X. A Post-Evaluation System for Smart Grids Based on Microservice Framework and Big Data Analysis. Electronics 2023, 12, 1647. [Google Scholar] [CrossRef]
- Wu, S.; Hou, L.; Zhang, G.K.; Chen, H. Real-time mixed reality-based visual warning for construction workforce safety. Autom. Constr. 2022, 139, 104252. [Google Scholar] [CrossRef]
- Ekanayake, B.; Wong, J.K.-W.; Fini, A.A.F.; Smith, P. Computer vision-based interior construction progress monitoring: A literature review and future research directions. Autom. Constr. 2021, 127, 103705. [Google Scholar] [CrossRef]
- Redmon, J.; Divvala, S.; Girshick, R.; Farhadi, A. You Only Look Once: Unified, Real-Time Object Detection. In Proceedings of the 2016 IEEE Conference on Computer Vision and Pattern Recognition (CVPR), Las Vegas, NV, USA, 27–30 June 2016; pp. 779–788. [Google Scholar]
- Shafiee, M.J.; Chywl, B.; Li, F.; Wong, A. Fast YOLO: A fast you only look once system for real-time embedded object detection in video. arXiv 2017, arXiv:1709.05943. [Google Scholar] [CrossRef]
- Gao, S.; Ruan, Y.; Wang, Y.; Xu, W.; Zheng, M. Safety Helmet Detection based on YOLOV4-M. In Proceedings of the 2022 IEEE International Conference on Artificial Intelligence and Computer Applications (ICAICA), Dalian, China, 24–26 June 2022; pp. 179–181. [Google Scholar]
- Dunphy, K.; Fekri, M.N.; Grolinger, K.; Sadhu, A. Data Augmentation for Deep-Learning-Based Multiclass Structural Damage Detection Using Limited Information. Sensors 2022, 22, 6193. [Google Scholar] [CrossRef] [PubMed]
- Jacobsen, E.L.; Teizer, J. Deep Learning in Construction: Review of Applications and Potential Avenues. J. Comput. Civ. Eng. 2022, 36, 03121001. [Google Scholar] [CrossRef]
- Pinto, G.; Wang, Z.; Roy, A.; Hong, T.; Capozzoli, A. Transfer learning for smart buildings: A critical review of algorithms, applications, and future perspectives. Adv. Appl. Energy 2022, 5, 100084. [Google Scholar] [CrossRef]
- Xie, Y.; Jia, X.; Chen, W.; He, E. Heterogeneity-aware deep learning in space: Performance and fairness. In Handbook of Geospatial Artificial Intelligence; CRC Press: Boca Raton, FL, USA, 2023; pp. 151–176. [Google Scholar]
- Dwivedi, U.K.; Wiwatcharakoses, C.; Sekimoto, Y. Realtime Safety Analysis System using Deep Learning for Fire Related Activities in Construction Sites. In Proceedings of the 2022 International Conference on Electrical, Computer, Communications and Mechatronics Engineering (ICECCME), Male, Maldives, 16–18 November 2022; pp. 1–5. [Google Scholar]
- Shetye, S.; Shetty, S.; Shinde, S.; Madhu, C.; Mathur, A. Computer Vision for Industrial Safety and Productivity. In Proceedings of the 2023 International Conference on Communication System, Computing and IT Applications (CSCITA), Mumbai, India, 31 March–1 April 2023; pp. 117–120. [Google Scholar]
- Shanti, M.Z.; Cho, C.S.; Byon, Y.J.; Yeun, C.Y.; Kim, T.Y.; Kim, S.K.; Altunaiji, A. A Novel Implementation of an AI-Based Smart Construction Safety Inspection Protocol in the UAE. IEEE Access 2021, 9, 166603–166616. [Google Scholar] [CrossRef]
- Huang, C.; Pan, X.; Cheng, J.; Song, J. Deep Image Registration With Depth-Aware Homography Estimation. IEEE Signal Process. Lett. 2023, 30, 6–10. [Google Scholar] [CrossRef]
- Arunyagool, D.; Chamnongthai, K.; Khawparisuth, D. Monitoring and Energy Control Inside Home Using Google Sheets with Line Notification. In Proceedings of the 2021 International Conference on Power, Energy and Innovations (ICPEI), Nakhon Ratchasima, Thailand, 20–22 October 2021; pp. 99–102. [Google Scholar]
- Redmon, J.; Farhadi, A. Yolov3: An incremental improvement. arXiv 2018, arXiv:1804.02767. [Google Scholar] [CrossRef]
- Feng, R.; Miao, Y.; Zheng, J. A YOLO-Based Intelligent Detection Algorithm for Risk Assess-Ment of Construction Sites. J. Intell. Constr. 2024, 2, 1–18. [Google Scholar] [CrossRef]


| Author(s) | Year | Methodology | Targeted Analysis |
|---|---|---|---|
| Musarat et al. [26] | 2024 | Photogrammetry, Sensors | Safety monitoring |
| C.-Y. Wang et al. [23] | 2023 | YOLOv7 Model, Computer Vision | Object detection |
| Kim et al. [24] | 2023 | YOLOv8 model, behavioral recognition | Detection of unsafe behaviors |
| Halder, Afsari, and Shojaei [27] | 2023 | Manual inspections, progress reports | Progress tracking |
| Halder et al. [28,29] | 2023 | Sensor data, drone imagery, 360 photos | Progress tracking |
| Lo et al. [30] | 2023 | Manual data collection and analysis | Productivity analysis |
| J. Wang et al. [31] | 2023 | Manual data handling | Productivity analysis |
| Wu, S. et al. [32] | 2022 | Digital twin, mixed reality | Safety monitoring |
| Tao Han et al. [25] | 2022 | BIM-IoT-IC framework, real-time data integration | Road compaction quality monitoring |
| B. Ekanayake et al. [33] | 2021 | Sensor platforms and video analytics | Safety monitoring |
| This study | 2024 | AI, deep learning, image recognition, real-time | Safety monitoring |
| Sample Size (%) | Class | Sample Count | AP | Best F1 Score | Notes |
|---|---|---|---|---|---|
| 33% | Worker | 3636 | 0.856 | 0.82 | Reliable detection due to significant sample size |
| Excavator | 650 | 0.936 | 0.91 | High AP despite fewer samples | |
| Dump Truck | 634 | 0.877 | 0.85 | Good performance relative to sample size | |
| Crane | 260 | 0.835 | 0.8 | Lower AP, indicating need for more data | |
| Concrete Mixer Truck | 218 | 0.917 | 0.9 | Excellent performance despite fewest samples | |
| All classes | 5398 | mAP = 0.884 | 0.86 | Overall balanced performance | |
| 67% | Worker | 7348 | 0.879 | 0.82 | Consistent detection across varying conditions |
| Excavator | 1296 | 0.948 | 0.91 | Best performance in this range | |
| Dump Truck | 1286 | 0.898 | 0.87 | Stable performance for mid-sized category | |
| Crane | 517 | 0.912 | 0.85 | Improved performance with more data | |
| Concrete Mixer Truck | 438 | 0.958 | 0.9 | Strong performance for lower sample count | |
| All classes | 10,885 | mAP = 0.919 | 0.87 | Overall balanced performance | |
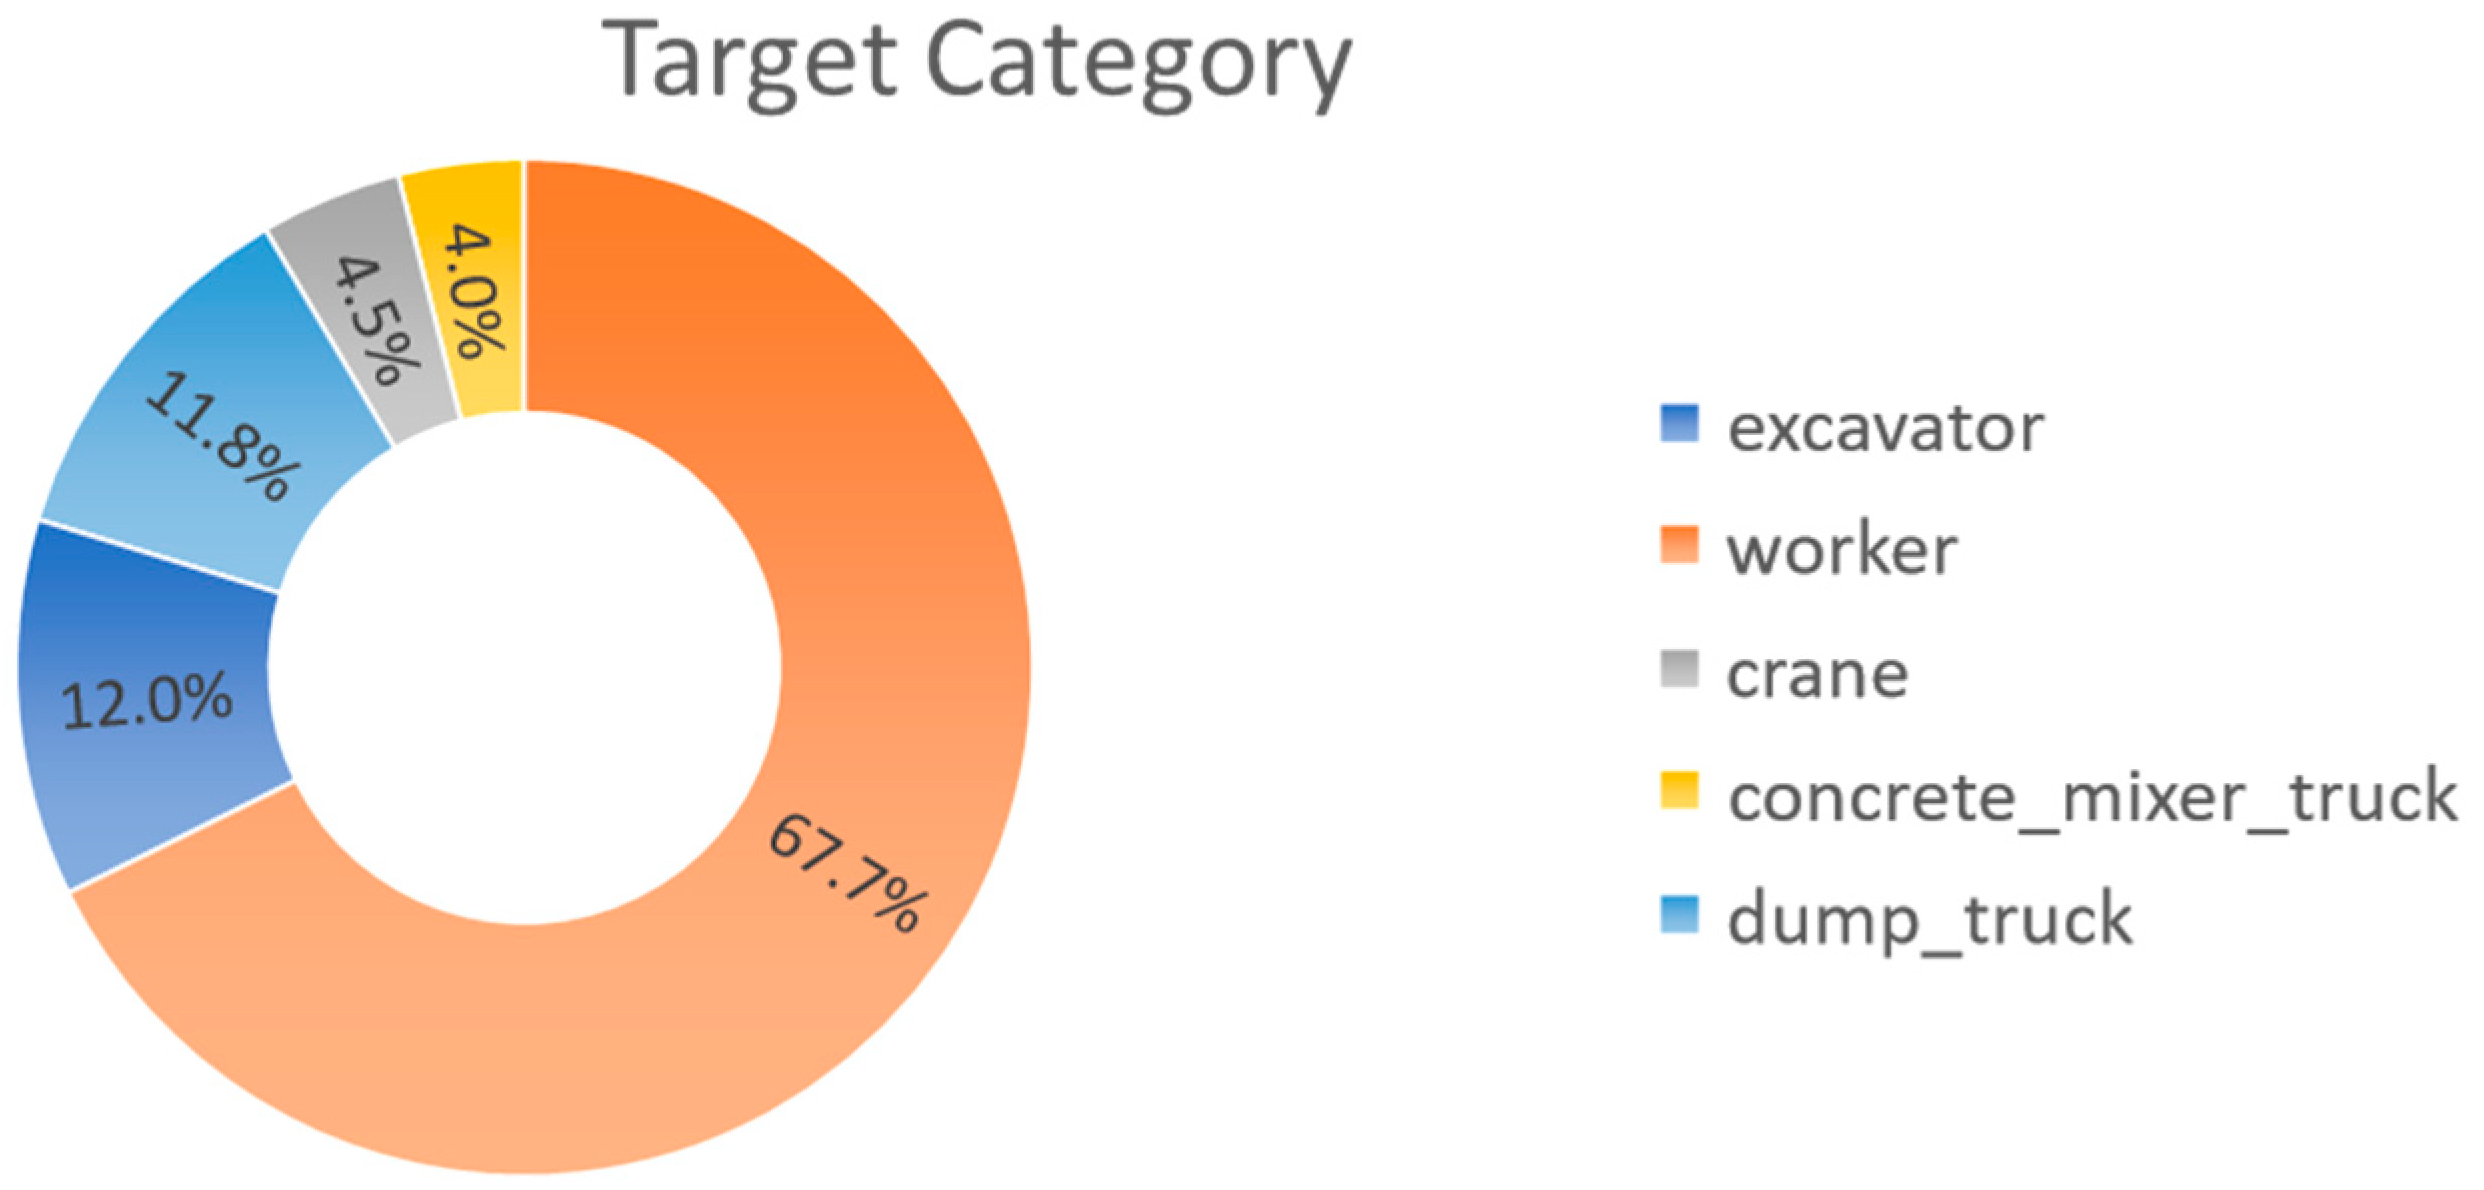
| 100% | Worker | 13,900 | 0.883 | 0.83 | Reliable detection in complex environments |
| Excavator | 2467 | 0.95 | 0.92 | Enhanced performance with distinctive features | |
| Dump Truck | 2423 | 0.9 | 0.89 | Improved detection capabilities | |
| Crane | 932 | 0.915 | 0.87 | Significant improvement with increased data | |
| Concrete Mixer Truck | 811 | 0.964 | 0.91 | Excellent performance despite relatively low sample count | |
| All classes | 20,533 | mAP = 0.922 | 0.88 | Overall balanced performance |
| Object Name | Confidence | Position | Time | |||
|---|---|---|---|---|---|---|
| Ymin | Xmin | Ymax | Xmax | |||
| Worker | 0.96 | 67 | 166 | 179 | 231 | 29 April 2024 09:05 |
| Worker | 0.96 | 18 | 248 | 193 | 300 | 29 April 2024 09:05 |
| Worker | 0.96 | 96 | 75 | 157 | 124 | 29 April 2024 09:05 |
| Worker | 0.88 | 42 | 139 | 153 | 173 | 29 April 2024 09:05 |
| Timeline | 17:43:56 | 17:44:01 | 17:44:13 | 17:44:15 | 17:44:21 | 17:44:24 | ||
| Status | Normal | Normal | Warning | Normal | Normal | Warning | ||
| Object Name | dump_truck | dump_truck | Crane | Worker | Crane | Crane | Crane | Worker |
| Confidence | 0.95 | 0.64 | 0.98 | 0.95 | 0.98 | 0.98 | 0.98 | 0.94 |
| Position | (230, 0, 1072, 613) | (20, 2, 1072, 1160) | (5, 15, 1075, 1472) | (485, 1748, 736, 1870) | (7, 30, 1076, 1458) | (4, 19, 1076, 1459) | (7, 13, 1076, 1456) | (438, 1593, 868, 1743) |
| Distance (cm) | 0 | 0 | 592.6 | 0 | 0 | 575.69 | ||
| Actual Distance (m) | Mean Estimated Distance (m) | MAE (m) | SD (m) |
|---|---|---|---|
| 1 | 1.08 | 0.08 | 0.05 |
| 2 | 2.12 | 0.12 | 0.07 |
| 3 | 3.25 | 0.25 | 0.10 |
Disclaimer/Publisher’s Note: The statements, opinions and data contained in all publications are solely those of the individual author(s) and contributor(s) and not of MDPI and/or the editor(s). MDPI and/or the editor(s) disclaim responsibility for any injury to people or property resulting from any ideas, methods, instructions or products referred to in the content. |
© 2025 by the authors. Licensee MDPI, Basel, Switzerland. This article is an open access article distributed under the terms and conditions of the Creative Commons Attribution (CC BY) license (https://creativecommons.org/licenses/by/4.0/).
Share and Cite
Lung, L.-W.; Wang, Y.-R.; Chen, Y.-S. Leveraging Deep Learning and Internet of Things for Dynamic Construction Site Risk Management. Buildings 2025, 15, 1325. https://doi.org/10.3390/buildings15081325
Lung L-W, Wang Y-R, Chen Y-S. Leveraging Deep Learning and Internet of Things for Dynamic Construction Site Risk Management. Buildings. 2025; 15(8):1325. https://doi.org/10.3390/buildings15081325
Chicago/Turabian StyleLung, Li-Wei, Yu-Ren Wang, and Yung-Sung Chen. 2025. "Leveraging Deep Learning and Internet of Things for Dynamic Construction Site Risk Management" Buildings 15, no. 8: 1325. https://doi.org/10.3390/buildings15081325
APA StyleLung, L.-W., Wang, Y.-R., & Chen, Y.-S. (2025). Leveraging Deep Learning and Internet of Things for Dynamic Construction Site Risk Management. Buildings, 15(8), 1325. https://doi.org/10.3390/buildings15081325