Article

Low-Carbon Slag Concrete Design Optimization Method Considering the Coupled Effects of Formwork Stripping, Strength Progress, and Carbonation Durability

1
Qinhuangdao Branch, Northeast Petroleum University, Qinhuangdao 066004, China
2
Department of Civil and Environmental Engineering, Hannam University, Daedeok-Gu, Daejeon 34430, Republic of Korea
3
Department of Architectural Engineering, Department of Integrated Energy and Infra System, Kangwon National University, Chuncheon-si 24341, Republic of Korea
*
Authors to whom correspondence should be addressed.
Buildings 2025, 15(8), 1316; https://doi.org/10.3390/buildings15081316
Submission received: 11 March 2025 / Revised: 9 April 2025 / Accepted: 15 April 2025 / Published: 16 April 2025
(This article belongs to the Special Issue Development in Low-Carbon, High-Performance Concrete Technology)

Abstract

Partially substituting cement with slag is an efficient approach to lowering the carbon footprint of concrete. Earlier research on low-carbon slag concrete has primarily concentrated on the optimization of material strength without considering the coupled effects of formwork stripping time, strength progress, and carbonation durability, which may lead to the risk of steel reinforcement corrosion. To address this limitation, this study introduces an optimized design approach for low-carbon slag concrete that simultaneously accounts for the formwork stripping time and carbonation durability. First, based on strength test results, a strength prediction equation which incorporates the curing age, water-to-(cement+slag) mass ratio, and slag-to-(cement+slag) mass ratio is developed. As such, the coefficients of the equation have clear physical meanings. Both the cement and slag strength coefficients increase with curing age, with the slag strength coefficient exhibiting a greater growth rate than that of cement. Second, an evaluation of concrete’s carbon emissions per 1 MPa increase in strength reveals that, for a given curing age, adopting a low water-to-(cement+slag) mass ratio and a high slag-to-(cement+slag) mass ratio effectively reduces these emissions. Parameter analysis of the carbonation model reveals that increasing the curing time before the onset of carbonation reduces the carbonation depth. Furthermore, four design scenarios are considered in this study: scenario C1 does not consider carbonation durability, with a specified strength of 30 MPa at 28 days; scenario C2 considers carbonation durability, with the same specified strength of 30 MPa at 28 days; scenario C3 does not consider carbonation durability but requires formwork stripping at 7 days; and scenario C4 considers carbonation durability and also requires formwork stripping at 7 days. Through the formulation of constraints for optimization using a genetic algorithm, the appropriate mix proportions for each design scenario are obtained. Finally, the optimization results reveal that, when transitioning from C1 to C2, the actual 28-day concrete compressive strength rises from 30 MPa to 65.139 MPa; when transitioning from C1 to C3, the actual 28-day concrete compressive strength slightly rises from 30 MPa to 30.122 MPa; and when transitioning from C3 to C4, the actual 28-day concrete compressive strength significantly rises from 30.122 MPa to 80.890 MPa. In summary, this study introduces a new approach to the material design of low-carbon slag concrete. In particular, prolonging the curing period plays a crucial role in optimizing low-carbon slag concrete mixtures.

1. Introduction

Granulated slag is a by-product of iron manufacturing in blast furnaces, which is produced by rapidly quenching molten slag with water. Composed mainly of calcium silicates and aluminosilicates, this glassy, granular material is finely ground for use as a cementitious additive, improving the strength and sustainability of concrete [1,2].
Utilizing slag as a partial substitute for cement can lower concrete’s CO2 emissions and support the sustainable advancement of the concrete industry [3,4]. To date, a multitude of studies have explored the sustainability assessment of slag concrete. Singh and Parad [5] developed a material design of concrete which reached a strength of 30 MPa at 28 days and found that, compared to Portland cement, using high-volume slag and fly ash concrete could reduce carbon emissions by 54% and energy consumption by 59%. Schack and Haist [6] produced eco-efficient concrete using slag and limestone powder, discovering that finely ground slag improved the cement’s performance. Nojoukambari et al. [7] developed ternary concrete using slag and feldspar, revealing that a mixture containing 30% slag and 10% feldspar reduced carbon emissions by approximately 33%. Fakhri and Dawood [8] manufactured green concrete with slag and other supplementary materials, reporting a 36% reduction in COCO2 emissions when the cement replacement level reached 50%. Chen et al. [9] found that substituting cement with slag and recycled brick powder significantly reduced energy consumption, COCO2 emissions, and material costs as the replacement rate increased. Shamass et al. [10] demonstrated that using 25% slag and 5% silica fume could improve the global warming potential of concrete. Yang et al. [11] analyzed the carbon emissions of concrete with varying slag contents and concluded that slag reduces concrete’s carbon footprint. Additionally, as the strength of concrete increases, the carbon emissions per 1 MPa increase in strength decrease. Kim et al. [12] found that replacing 70% of early-strength cement with slag led to a COCO2 emissions reduction of approximately 68%.
Compared to the abundant research on COCO2 emissions, research on the material formulation of low-carbon slag concrete remains relatively limited. Yeh [13] designed concrete containing slag and fly ash using neural networks and the flattened simplex–centroid method, considering five strength levels and five flowability levels. The optimal mix proportion with the lowest cost was obtained through the use of a genetic algorithm. Kim et al. [14] developed an optimal design of slag and fly ash concrete to reduce cost and carbon emissions. Shobeiri et al. [15] developed slag-and-fly-ash-enhanced concrete, employing an artificial neural network to predict strength and slump and employing a genetic algorithm to optimize COCO2 emissions and cost. The designed strength levels included 30 MPa, 40 MPa, and 50 MPa. Knight et al. [16] proposed a design method for binary cement–mineral admixture concrete, considering seven types of mineral admixtures and eleven environmental impact categories to calculate the optimal mass ratios between cement and mineral admixtures. Yang et al. [17] derived the relationship between strength and the water-to-(cement+slag) mass ratio through regression analysis, designing concrete with different mineral admixtures while considering strength and COCO2 reduction goals. Tapali et al. [18] designed blended concrete, which was optimized in terms of strength and durability, adjusting the mineral admixture replacement rates to achieve an environmentally friendly concrete that meets both performance requirements.
However, considering the existing low-carbon slag concrete design principles, the following issues arise: First, when the 28-day strength of low-carbon slag concrete is the same as that of Portland concrete, the carbonation depth of low-carbon slag concrete is higher [19,20]. Existing concrete mix design methods only consider strength and do not account for carbonation durability, which leads to insufficient carbonation resistance in low-carbon slag concrete and the potential risk of steel reinforcement corrosion. Second, the majority of existing studies on low-carbon concrete design have been focused on the material level, without considering the factor of concrete construction. Notably, the carbonation durability of low-carbon slag concrete is not only related to the mix proportions of the concrete materials, but it is also closely tied to the curing age before carbonation begins (i.e., the time of formwork removal) [19]. Finally, previous studies focused on predicting the strength of slag concrete have mostly relied on machine learning models. Although these predictions are relatively accurate, the mechanisms of strength development are not sufficiently clear, which limits the application of machine learning models in design specifications [13].
To address the shortcomings of previous studies, this study proposes a new design method for low-carbon slag concrete that takes into account compressive strength at different ages, the time of formwork removal, and the impact of carbonation durability. For the strength prediction model, this study adopts a prediction formula based on reaction mechanisms, distinguishing the contributions of cement hydration and slag reaction to the resulting strength. For the carbonation depth prediction model, the effects of concrete mix proportions, the curing age before carbonation begins (i.e., the time of formwork removal), and environmental conditions affecting carbonation durability are considered. For the mix proportion design cases, four design examples are used to differentiate the dominant factors in concrete mix design under different scenarios (i.e., strength-dominated, carbonation durability-dominated, and formwork removal time-dominated). In summary, the design method proposed in this study comprehensively considers both material and construction factors, providing significant engineering guidance for the material design of low-carbon slag concrete.

2. Strength Prediction Model

Oner and Akyuz [1] carried out comprehensive studies on the compressive strength of slag-incorporated concrete. Their tests covered a wide range of curing ages, from early age (7 days) to long-term (365 days), and included multiple slag replacement levels ranging from 0% to 60%. Given the comprehensiveness of Oner and Akyuz’s compressive strength test results [1], this study adopted their experimental data to develop regression-based predictive equations for the compressive strength of slag concrete across various curing periods.
Based on the concept of the equivalent strength coefficient proposed by Papadakis and Tsimas [2], the compressive strength of slag-incorporated concrete across various curing periods can be predicted employing the following equation:
Fc(t) = A(t) × MCE/MW + B(t) × MSG/MW + C(t)
In Equation (1), Fc denotes compressive strength (MPa); t represents age (days); A is the strength coefficient of cement (dimensionless number); B is the strength coefficient of slag (dimensionless number); C is an empirical strength coefficient (MPa); and MCE, MSG, and MW represent the mass of cement (kg/m3), mass of slag (kg/m3), and mass of water (kg/m3) in the mix proportion, respectively.
Using the strength test results at different ages and with different mix proportions reported by Oner and Akyuz [1], the strength coefficients A, B, and C for Equation (1) at various ages can be obtained. These coefficients correspond to the second to fourth columns of Table 1. Once the strength prediction equations for different ages are established, their predictions can be compared with the measured results to evaluate the performance of Equation (1). In this study, three indicators were used to assess the prediction accuracy: the root mean square error (RMSE), correlation coefficient (R), and the signal-to-noise ratio (S/N). These values are listed in the fifth to seventh columns of Table 1.
The onset of the hydration reaction in concrete corresponds to the start of mixing, which is defined as t = 0. Accordingly, the generation of hydration heat and chemically bound water also begins at t = 0. However, the development of mechanical properties does not start at t = 0, as a certain degree of hydration is required before it begins. Strength development only starts when the degree of hydration exceeds a threshold value corresponding to the strength threshold [21]. A negative value of the coefficient C indicates that the initiation of compressive strength does not occur at t = 0 but rather at a later time when t > 0; in other words, a negative value of the coefficient C is not a computational coincidence, but a true reflection of the hydration mechanism and strength development process.
In Table 1, the ages of 63, 119, and 180 days extend the analysis into the intermediate long-term range, capturing the continued strength gain of slag concrete. The reaction of slag progresses more slowly than cement hydration, often contributing significantly to strength beyond 28 days. These points (i.e., 63, 119, and 180 days) help to reveal how slag influences the evolution of strength over an extended curing period.
At all ages, the correlation coefficients between calculated and tested results exceeded 0.91, indicating a strong agreement between the predicted and experimental values. At early curing ages of 7 and 14 days, the root mean square error of the strength equation’s predictions was less than 3 MPa while, at 365 days, it was approximately 5 MPa. The signal-to-noise ratios across all ages ranged between 18.7 and 19.3, suggesting good predictive performance of the equation. The signal-to-noise ratios showed no significant fluctuations across ages, demonstrating the overall stability of the predictive equation.
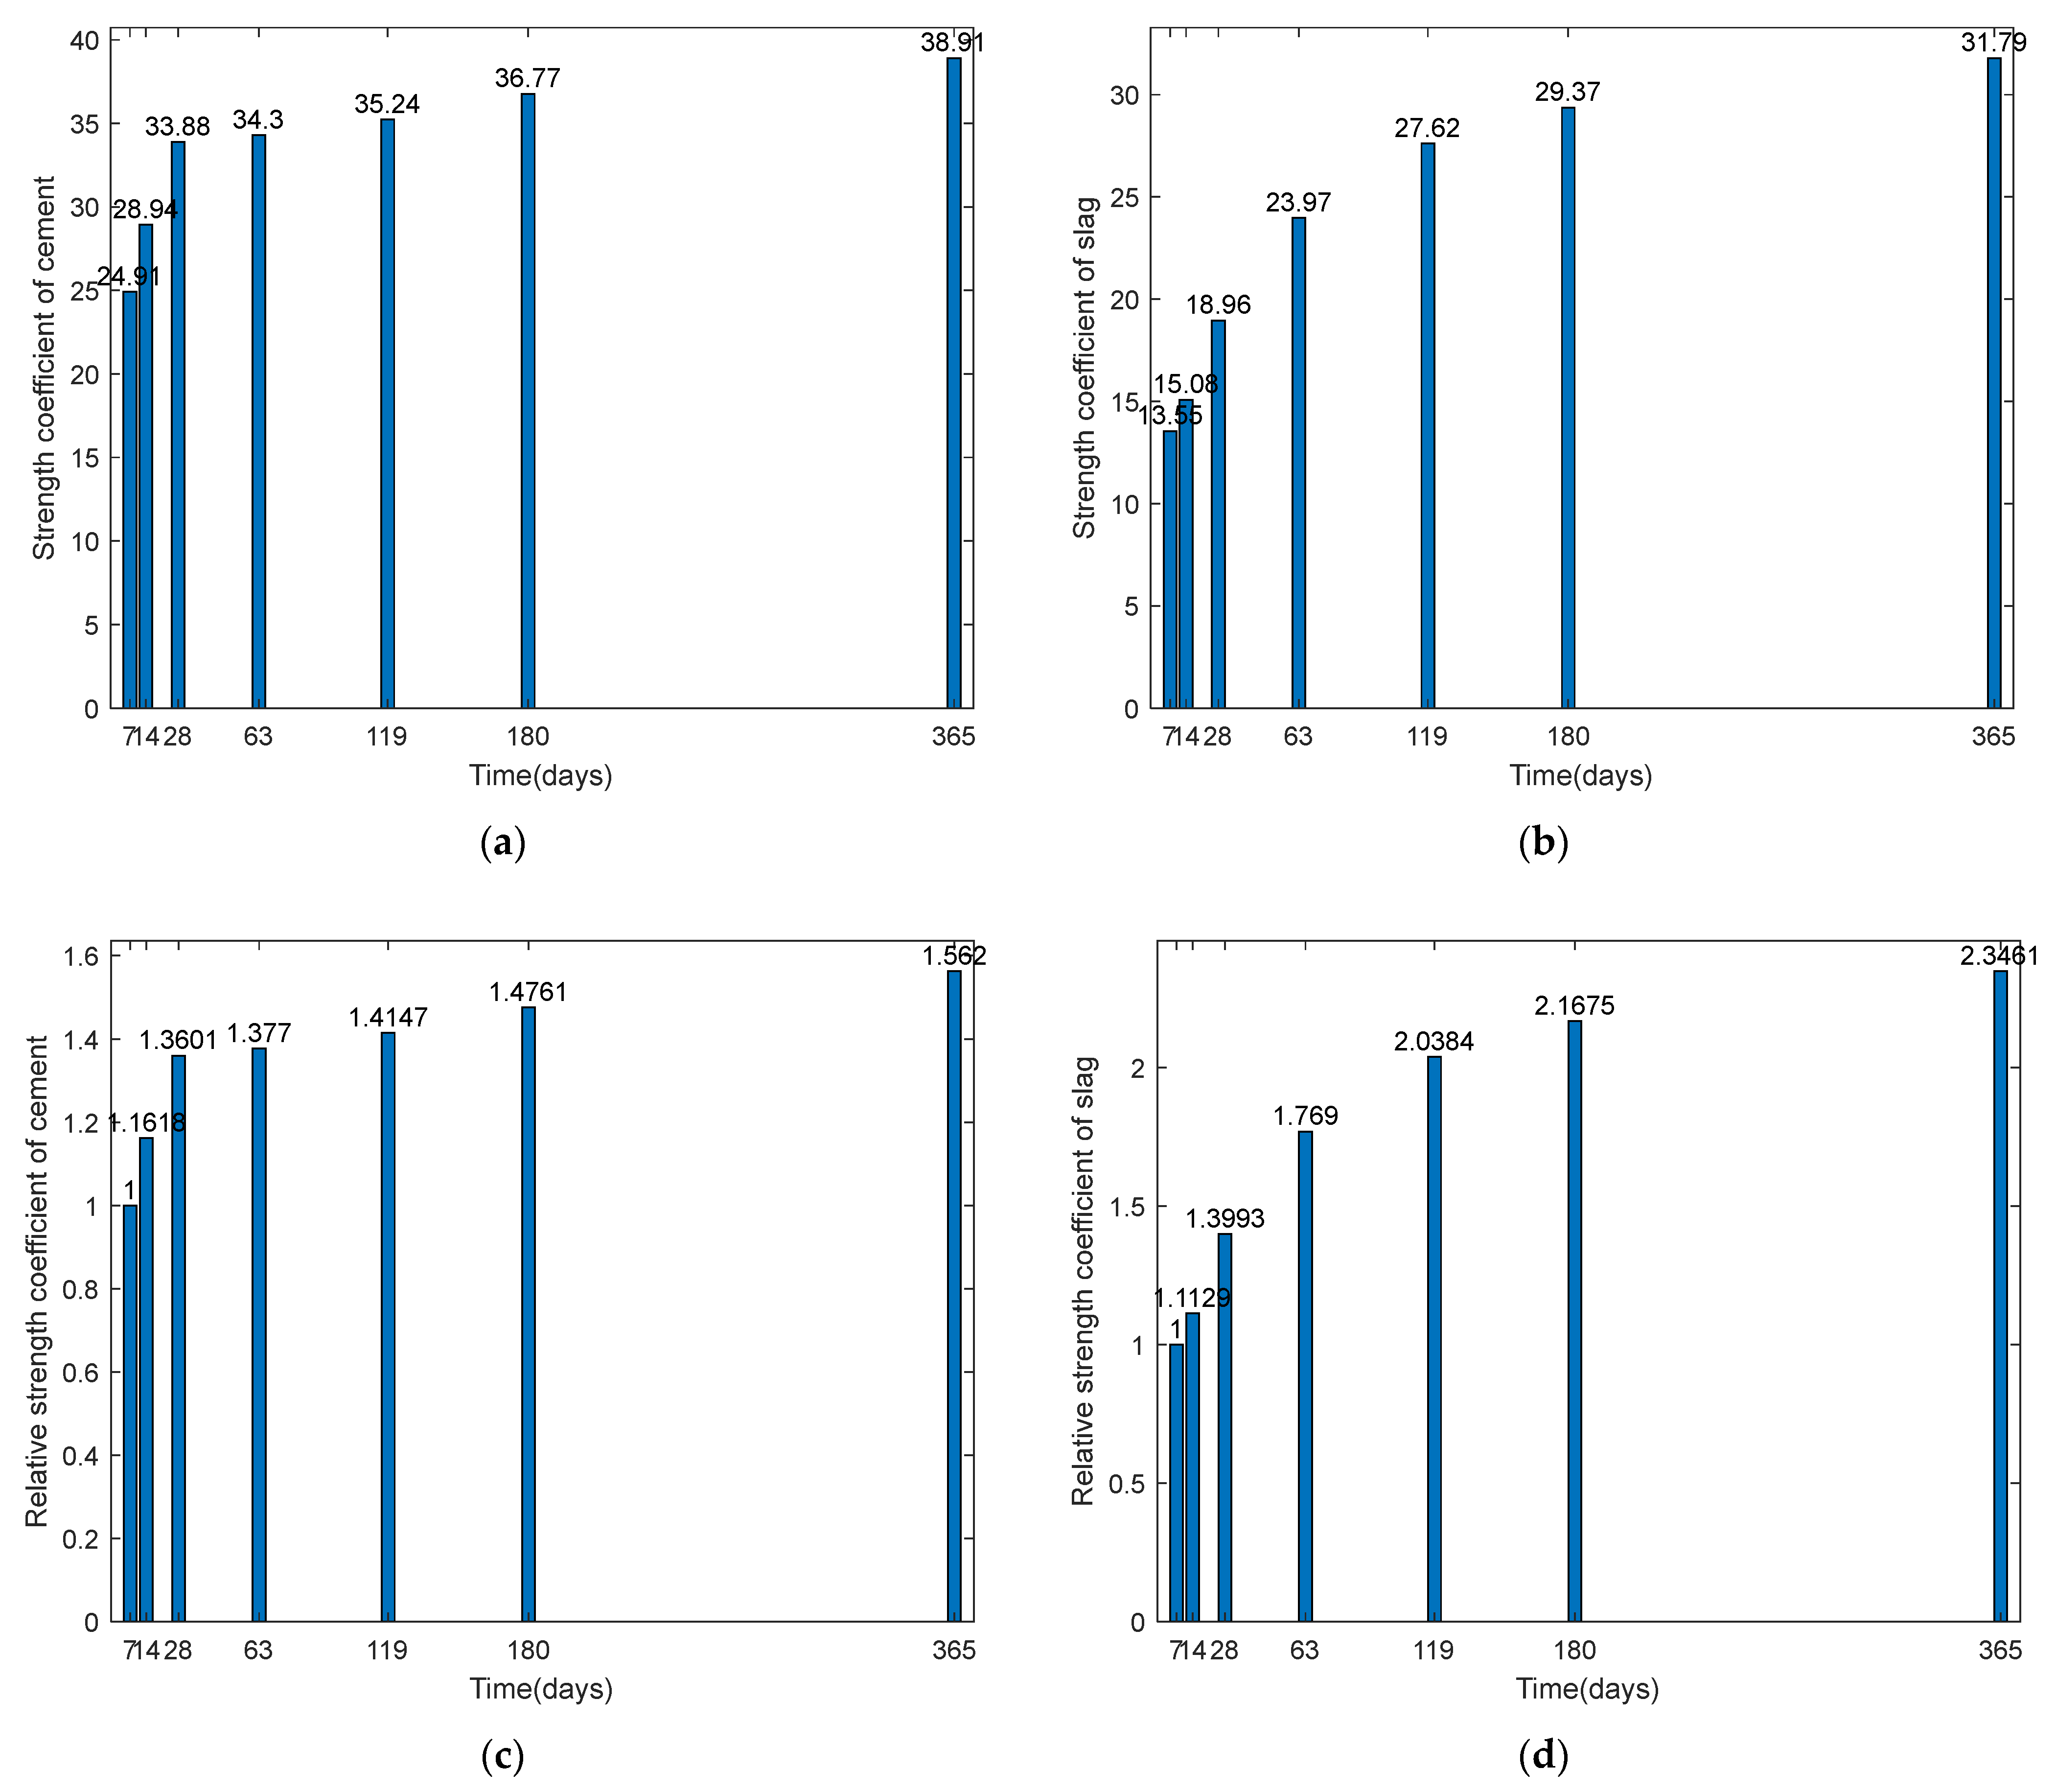
Figure 1 illustrates the relationship between the strength coefficients A, B, and age. In particular, Figure 1a,b depict the relationships between the cement strength coefficient and slag strength coefficient, respectively, with age. As age increases, both coefficients also rise, indicating that the hydration extent of cement and the reaction extent of slag increase with time. Taking the strength coefficients of cement and slag at 7 days as a reference unit (set to 1) and dividing the coefficients at other ages by the 7-day values, the relative strength coefficients for cement and slag at different ages were obtained. Figure 1c shows that, from 7 to 28 days (a 21-day span), the relative strength coefficient of cement rose by approximately 36%. From 28 to 365 days (a 337-day span), it rose by about (1.562 − 1.360)/1.360 × 100% = 14.9%. This suggests that cement reacts rapidly in the early stage, but its reaction slows significantly after 28 days. Figure 1d shows that, from 7 to 28 days (21 days), the relative strength coefficient of slag rose by about 40%, while from 28 to 365 days (337 days), it rose by approximately (2.346 − 1.399)/1.399 × 100% = 67.6%.
Comparing Figure 1c,d, the increase in cement’s relative strength coefficient is less than that of slag [22]. This is because, at 7 days, cement has already reached a relatively high reaction extent when compared to slag [3]. Although cement’s reaction extent continues to increase with age, this increase is modest. Additionally, for both cement and slag, the compressive strength growth rate was significantly higher in the early stage (before 28 days) than in the later stage (28 to 365 days). Figure 1e presents the regression equation for cement’s compressive strength coefficient versus age, showing that the coefficients across ages follow a logarithmic function of time that is consistent with strength prediction equations reported in the scientific literature on concrete materials [4]. Figure 1f shows the regression equation for slag’s compressive strength coefficient versus age, exhibiting a similar trend to Figure 1e.
Based on the trends observed in Figure 1e,f, the strength prediction equation was derived employing the method of undetermined coefficients. According to the experimental results of 224 compressive strength tests under different ages and mix proportions reported by Oner and Akyuz [1], the strength of cement–slag binary concrete at various ages can be represented by the following equation:
Fc(t)= (22.92 + 2.59 × ln(t)) × MCE/MW + (3.68 + 4.81 × ln(t)) × MSG/MW + (−12.83)
In Equation (2), the units of Fc and t are MPa and days, respectively, while MCE, MW, and MSG are measured in kg/m3. Equation (2) accounts for the effects of mix proportions and curing age on the strength of slag concrete. MCE/MW represents the mass ratio of cement to water, and the term (22.92 + 2.59·ln(t)) × MCE/MW reflects the contribution of cement hydration to strength. MSG/MW represents the mass ratio of slag to water, and the term (3.68 + 4.81·ln(t)) × MSG/MW reflects the contribution of slag’s chemical reaction to strength. The function ln denotes the natural logarithm, indicating that the strength is a logarithmic function of curing age; this is because both the degree of cement hydration and the reactivity of slag follow a logarithmic relationship with curing time [23]. 
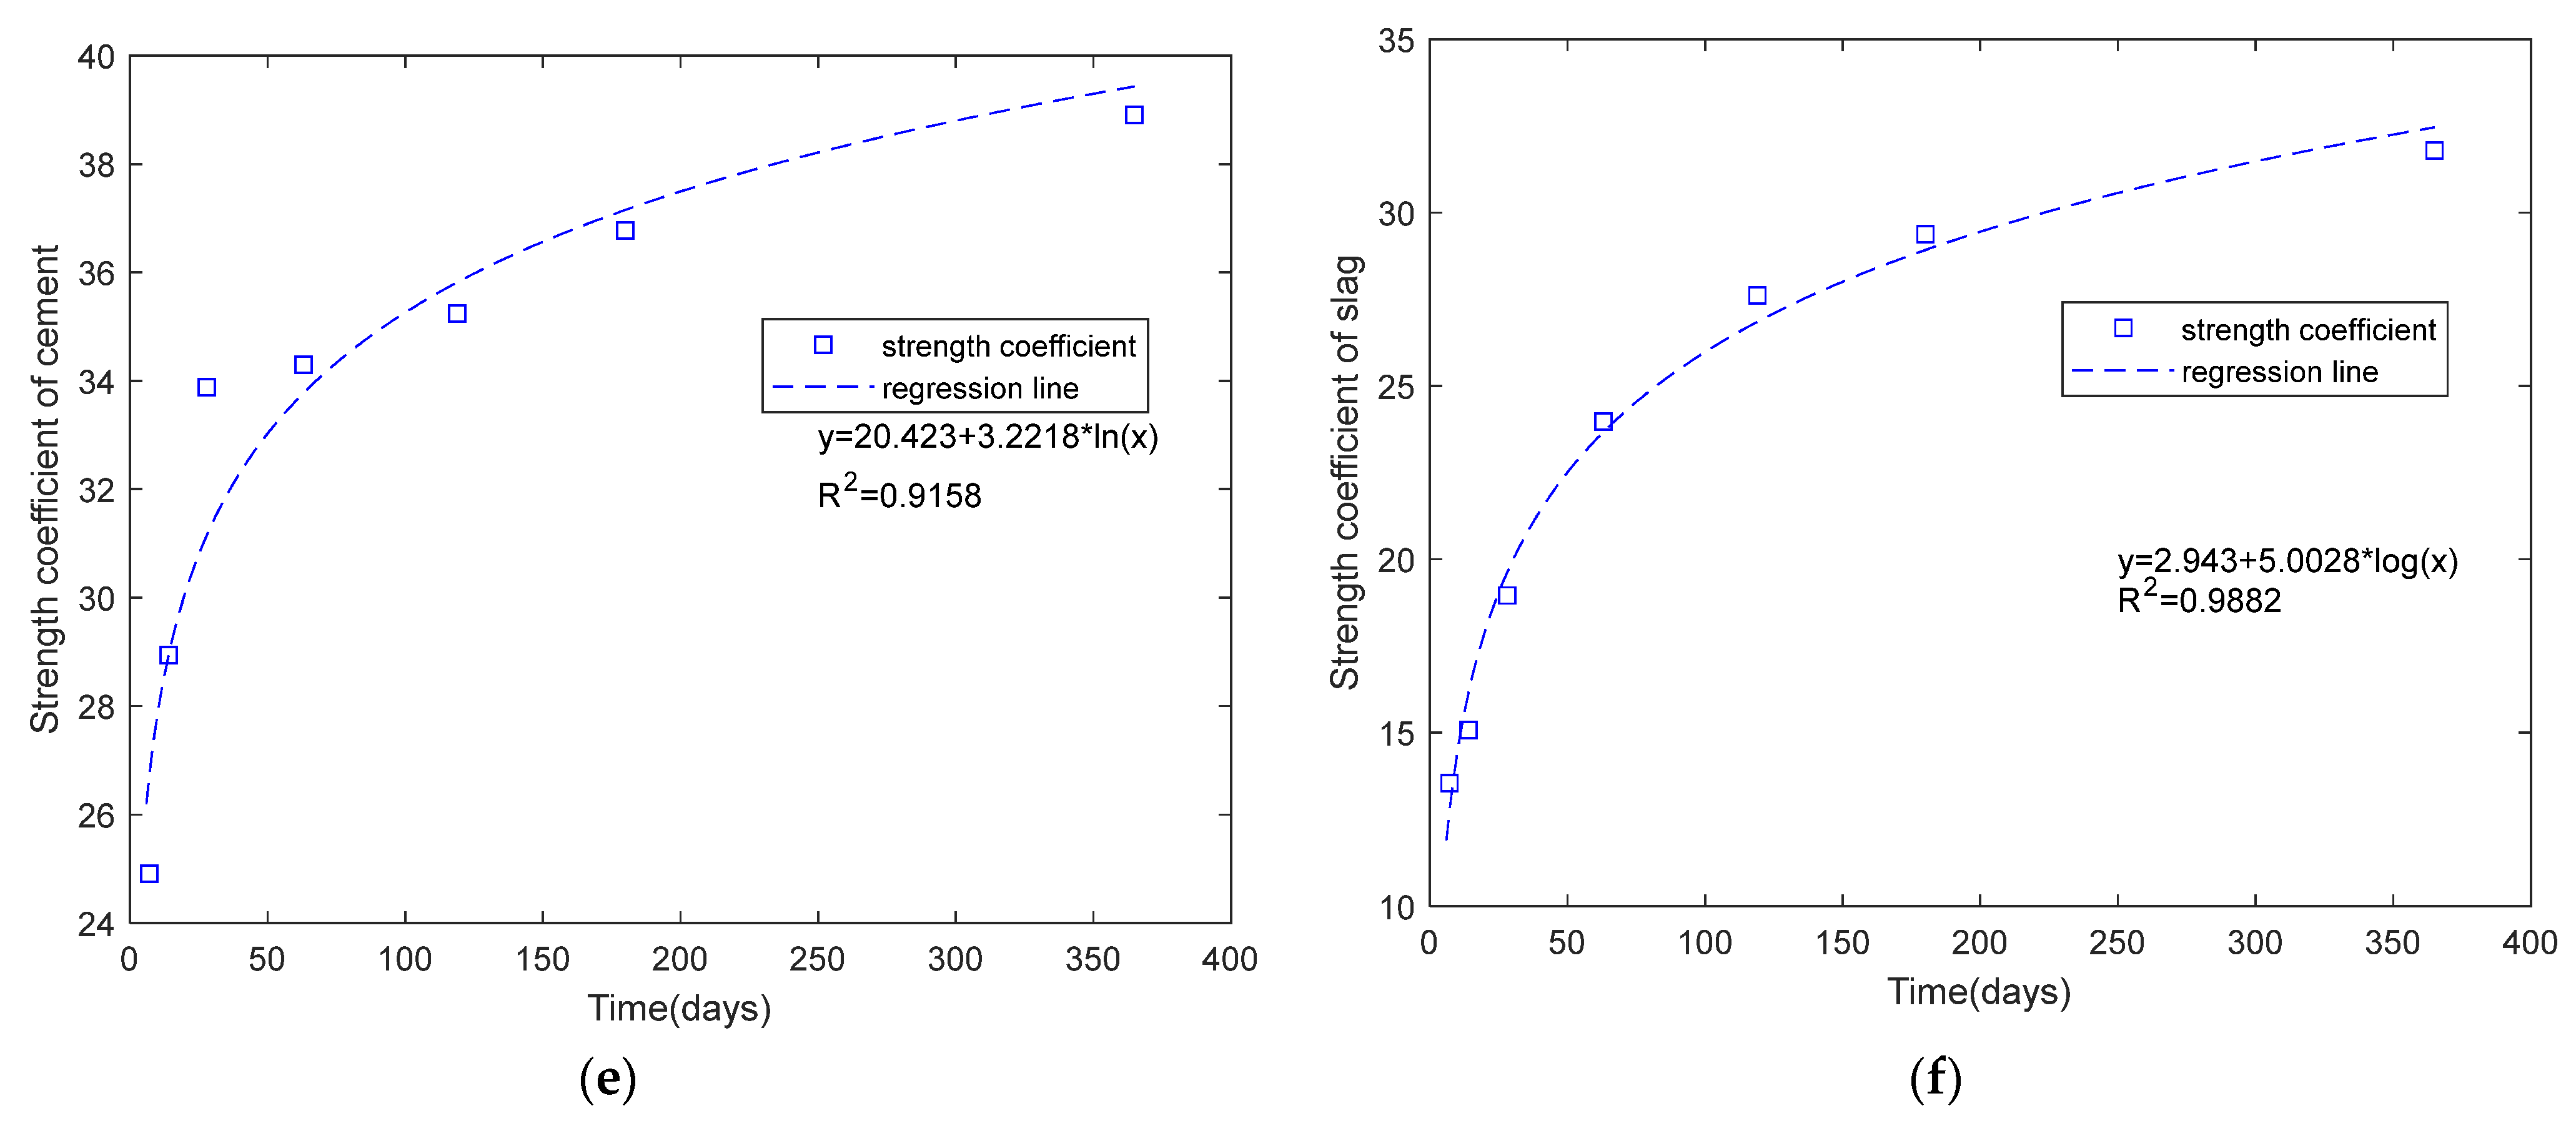
Figure 2 shows a comparison between the calculated and experimental results, with a root mean square error of 4.3175 MPa, a correlation coefficient of 0.9435, and a signal-to-noise ratio of 18.563. Notably, unlike general mechanism-agnostic machine learning regression models [24], the parameters of Equation (2) have clear physical meanings. Equation (2) distinguishes the reactions of cement and slag, accounting for the individual effects of the slag-to-(cement+slag) mass ratio and the water-to-(cement+slag) mass ratio on strength.

3. Carbon Emissions Analysis

For structural concrete, the majority of its carbon emissions come from cementitious materials. The carbon footprint of binder materials derives from the following components: the carbon emissions of the materials themselves, emissions due to transportation, and emissions from the concrete production process. For one cubic meter of concrete, the carbon emissions of cementitious materials can be calculated using the following equation:
CO2V = CO2M + CO2T + CO2P
CO2M = MCE × CO2CE + MSG × CO2SG
CO2T = MCE × CO2TCE × DCE + MSG × CO2TSG × DSG
CO2P = MCE × CO2CEP + MSG × CO2SGP
In Equation (3), CO2V represents the total carbon emissions of cementitious materials, while CO2M, CO2T, and CO2P indicate the carbon emissions from the materials themselves, transportation, and the concrete production process, respectively. Equation (4) calculates the material-specific carbon emissions, CO2M, in which CO2CE and CO2SG represent the carbon emissions per kilogram of cement and slag, respectively (CO2CE = 0.93; CO2SG = 0.0265) [11]. Equation (5) computes the transportation-related carbon emissions, CO2T, in which CO2TCE and CO2TSG represent the CO2 emissions from transporting unit masses of cement and slag over a unit distance, respectively. The values of CO2TCE and CO2TSG are closely tied to the transportation mode; for truck transport via highways, both are 0.0000518 [11]. DCE and DSG in Equation (5) are the transportation distances for cement and slag, respectively. Equation (6) calculates the carbon emissions from the concrete production process, CO2P, which primarily stem from electricity consumption; in this equation, CO2CEP and CO2SGP represent the CO2 emissions per kilogram of cement and slag during production, which are both valued at 0.00768 [11]. Based on Equations (3)–(6), when the transportation distances for cement and slag are 200 km and 300 km, respectively, the carbon emissions of 1 kg cement and 1 kg slag are 0.94804 kg and 0.04972 kg, respectively. Thus, the carbon emissions per unit volume of concrete can be calculated employing the following equation:
CO2V = 0.94804 × MCE + 0.04972 × MSG
In Equation (7), for cement, the total carbon emissions of 0.94804 kg are approximately equal to the material-specific emissions of 0.93 kg. However, for slag, when transportation and production emissions are considered, the carbon emissions rise from 0.0265 kg to 0.04972 kg, constituting an increase of 87.62%. It should be noted that, compared to cement’s carbon emissions, slag’s emissions are minimal. Despite the increase in slag’s carbon emissions, it has a negligible impact on the overall carbon emissions CO2V.
For structural concrete, the water consumption per unit volume is closely associated with the maximum coarse aggregate size. When the maximum coarse aggregate size is 25 mm, the water consumption for structural concrete commonly used in engineering is 179 kg/m3 [25,26], which corresponds to MW = 179 in the strength prediction equation.
Equation (7) is used to calculate the CO2V emissions per unit volume of concrete. In engineering, the CO2 emissions per 1 MPa strength of concrete are also of interest. The CO2 emissions per 1 MPa strength of concrete, CO2U, can be calculated employing the following equation:
CO2U = CO2V/Fc(t)
In particular, the carbon emissions per unit volume of concrete can be calculated through the following steps:
Step 1: Calculate material-related carbon emissions using Equation (4).
Assume the mass of cement and slag per cubic meter of concrete is MCE = 160 kg/m3 and MSG = 240 kg/m3, respectively, and the carbon emissions per kilogram of cement and slag are CO2CE = 0.93 kg CO2/kg and CO2SG = 0.0265 kg CO2/kg, respectively [11].
The material-related carbon emissions can then be calculated as
CO2M = MCE × CO2CE + MSG × CO2SG = 160 × 0.93 + 240 × 0.0265 = 155.16 kg CO2/m3
Step 2: Calculate transportation-related carbon emissions using Equation (5).
Assume the transportation distances for cement and slag are DCE = 200 km and DSG = 300 km, respectively.
The carbon emissions per kilogram per kilometer for transported materials are CO2TCE = CO2TSG = 0.0000518 kg CO2/km [11].
Thus, the transportation-related carbon emissions are calculated as
CO2T = MCE × CO2TCE × DCE + MSG × CO2TSG × DSG
= 160 × 200 × 0.0000518 + 240 × 300 × 0.0000518 = 5.3872 kg CO2/m3
Step 3: Calculate production-related carbon emissions using Equation (6).
During the mixing process, the carbon emissions per kilogram of cement and slag are all assumed to be CO2CEP = CO2SGP = 0.00768 kg CO2/kg [11].
The production-related carbon emissions are calculated as
CO2P = MCE × CO2CEP + MSG × CO2SGP = 160 × 0.00768 + 240 × 0.00768 = 3.0720 kg CO2/m3.
Step 4: Calculate the total carbon emissions using Equation (3).
The total carbon emissions per cubic meter of concrete are the sum of the material, transportation, and production-related emissions:
CO2V = CO2M + CO2T + CO2P = 155.16 + 5.3872 + 3.0720 = 163.6192 kg CO2/m3
Note: The above calculation considers only the carbon emissions from the binder materials (cement and slag) and does not account for emissions relating to the aggregates or mixing water.
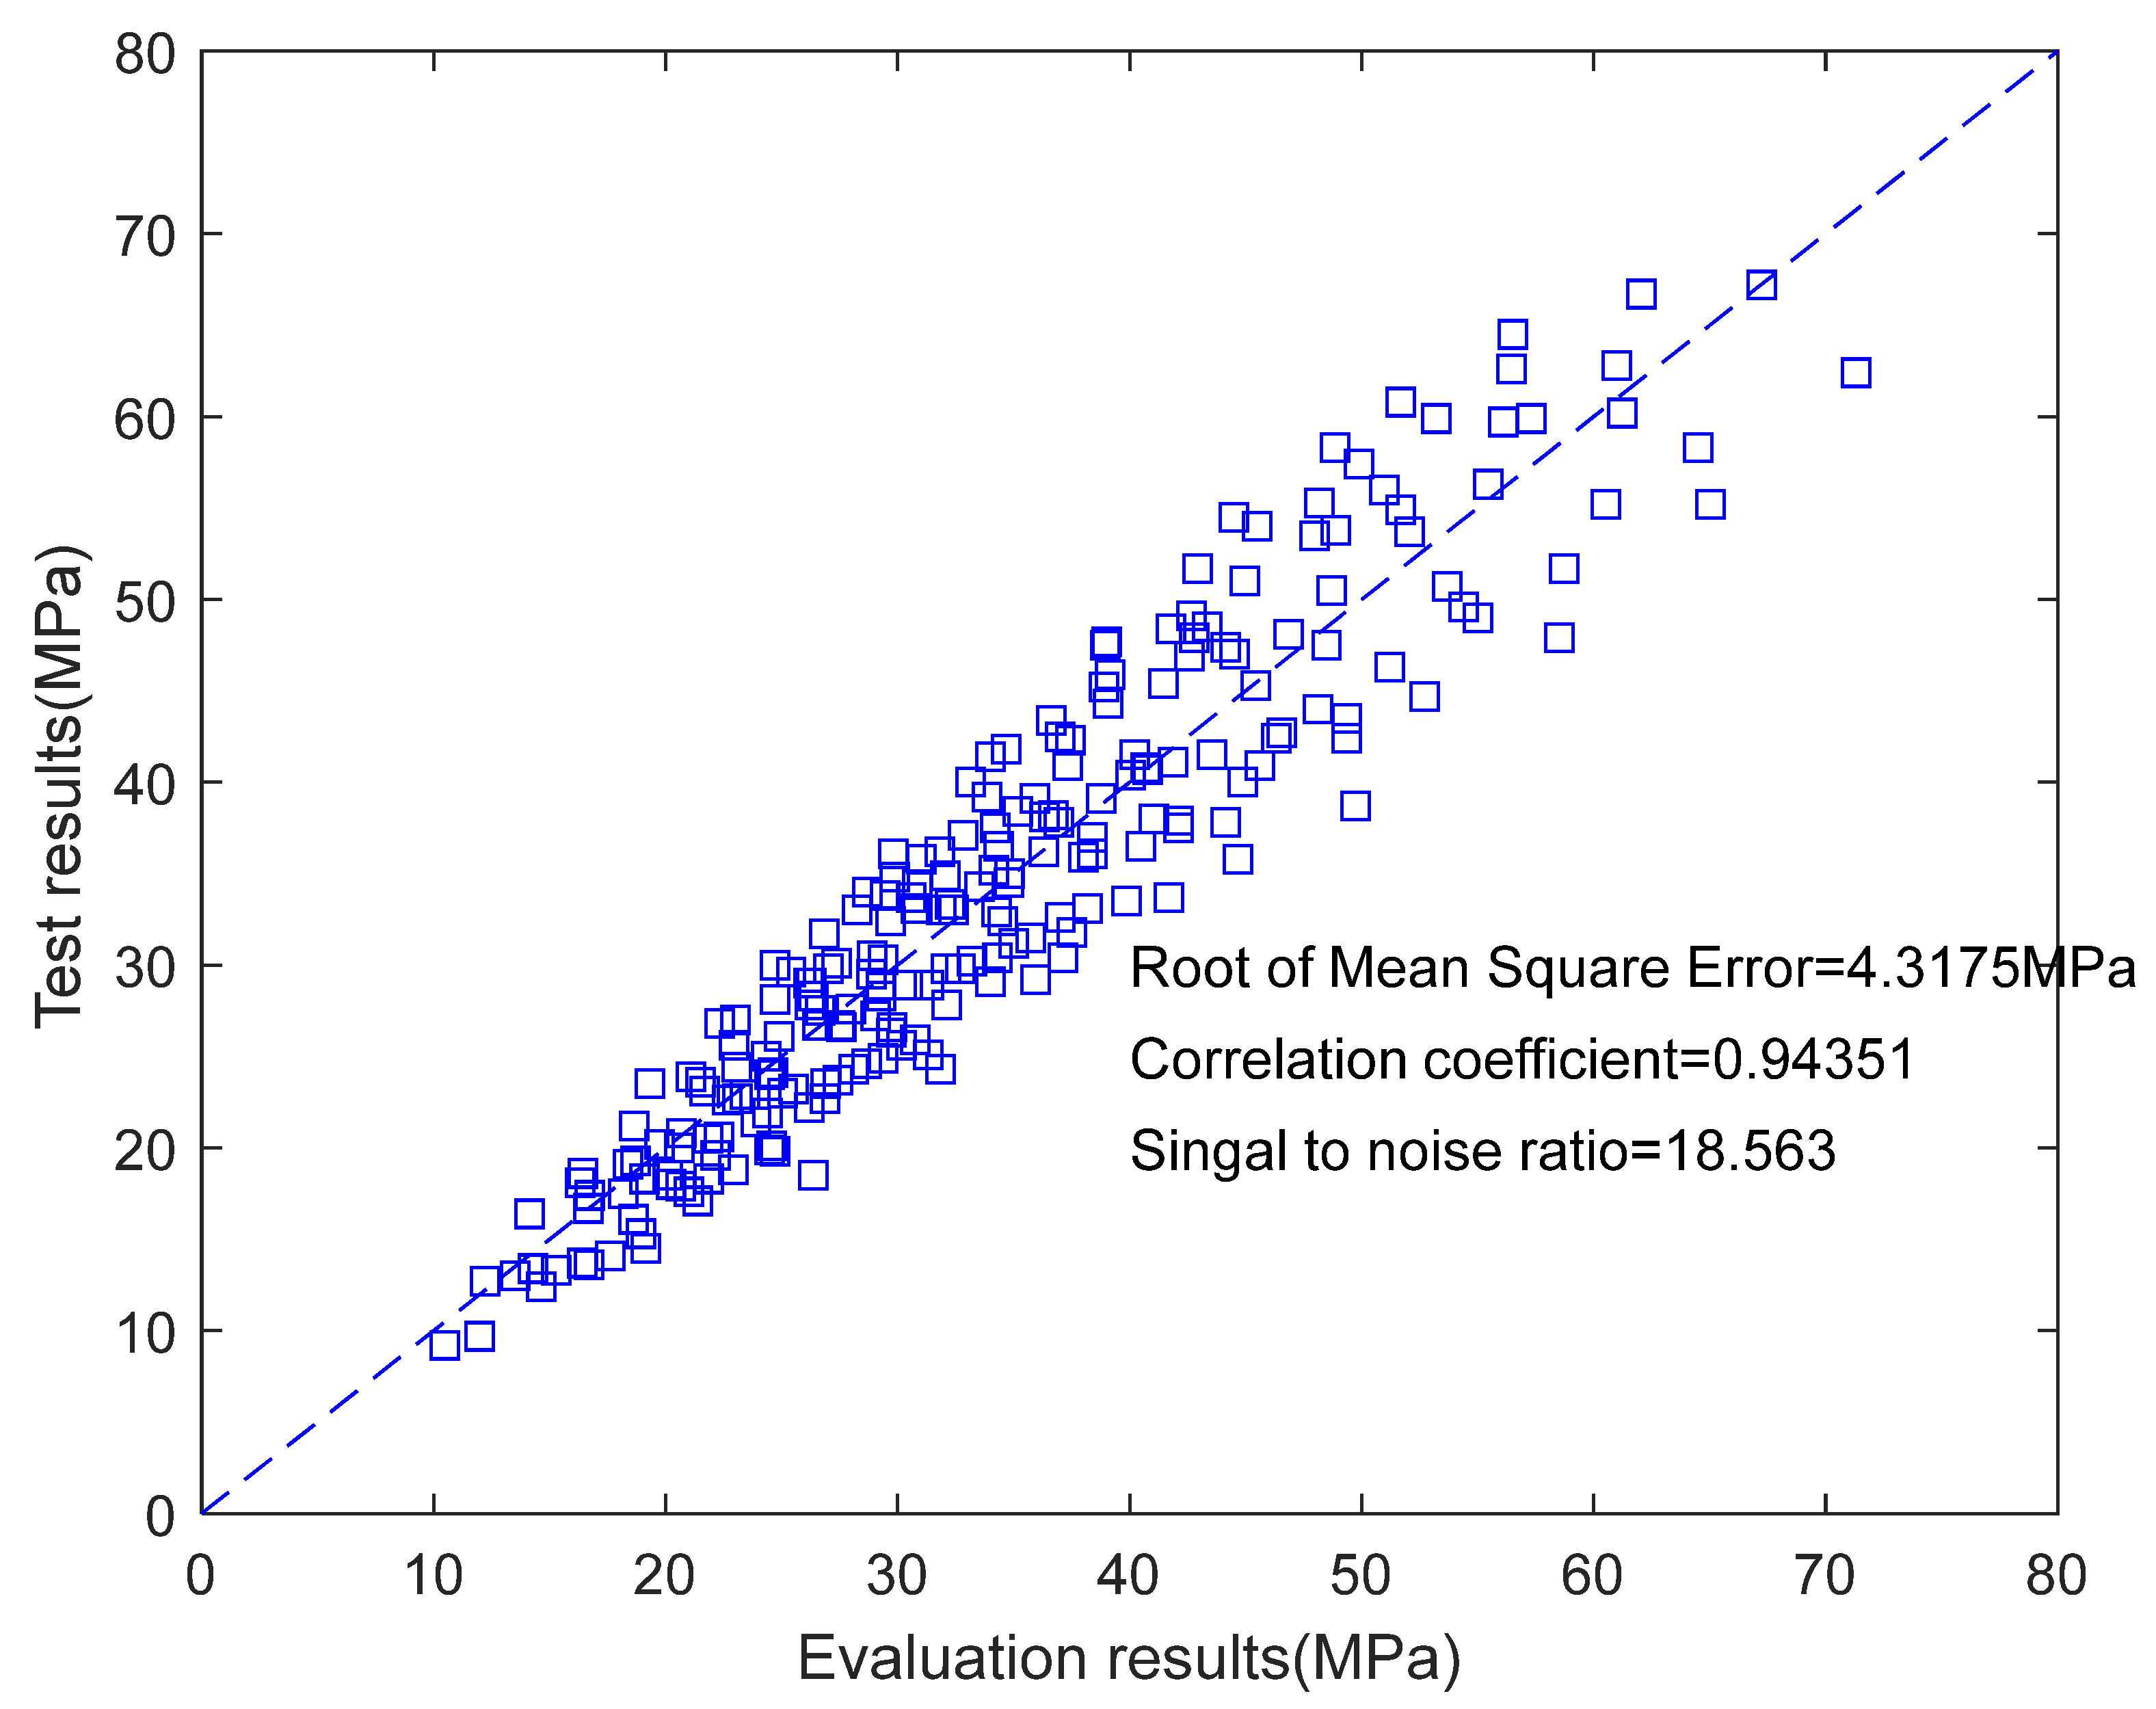
Figure 3a shows the calculated carbon emissions per unit volume of concrete CO2V. Two factors are considered in Figure 3a: the water-to-binder ratio and the slag replacement ratio. For a given water-to-binder ratio of 0.5, when the slag replacement ratio increases from 0 to 0.6, the carbon emissions per unit volume of concrete decrease from 341 to 148 kg/m3. For a given water-to-binder ratio of 0.4, when the slag replacement ratio increases from 0 to 0.6, the carbon emissions per unit volume of concrete decrease from 426 to 184 kg/m3. Figure 3a indicates that, as both the slag replacement ratio and the water-to-binder ratio increase, the carbon emissions per unit volume of concrete decrease.
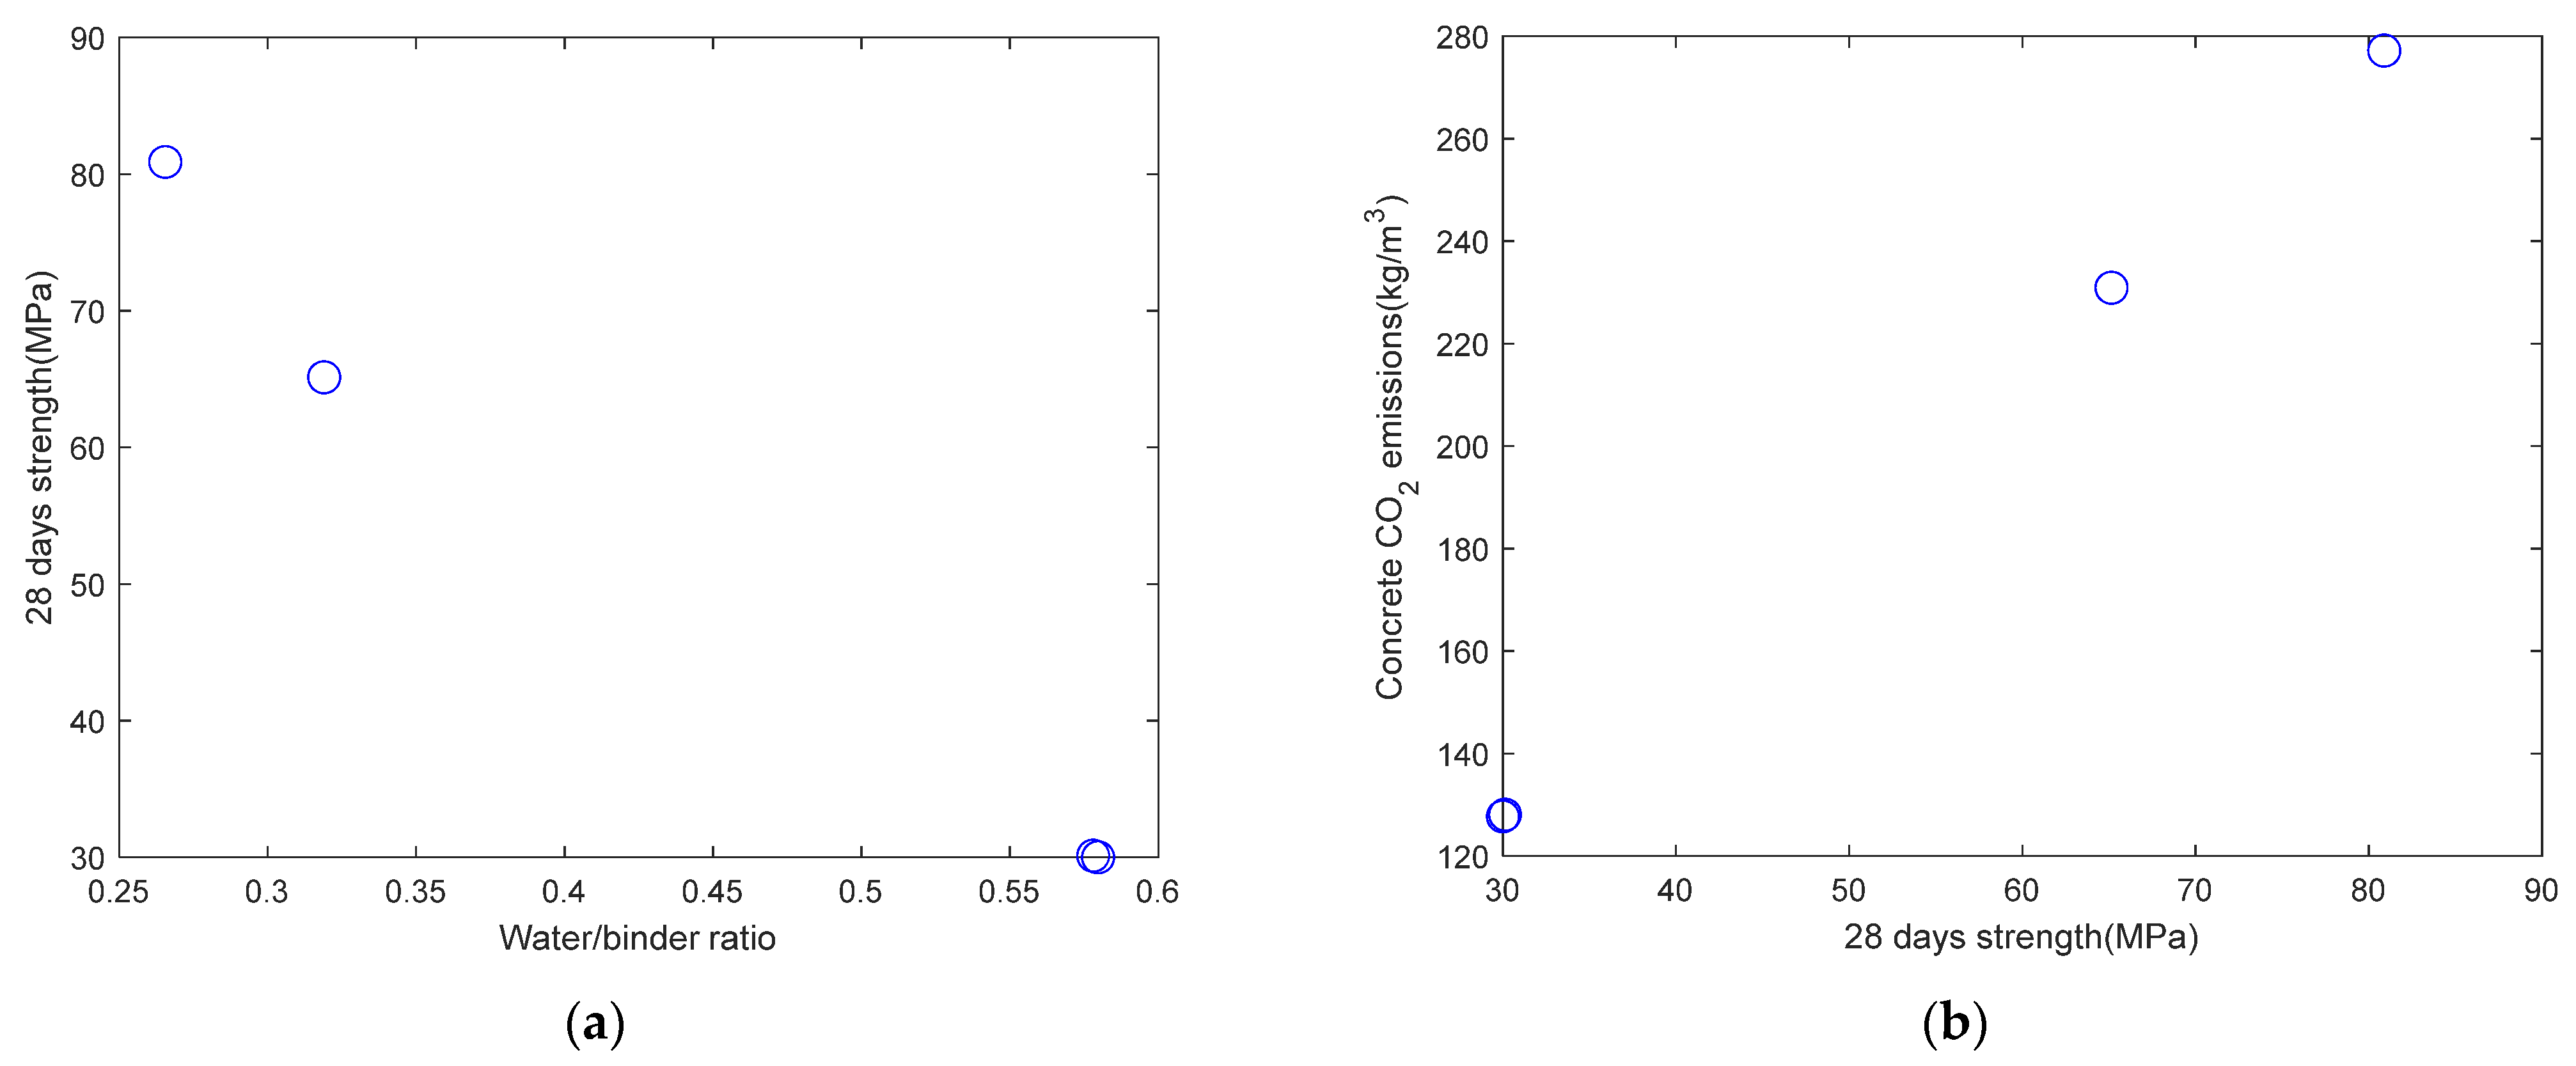
Figure 3b shows the calculated results of carbon emissions per 1 MPa strength of concrete, which are denoted as CO2U. This figure considers three factors: the water-to-binder mass ratio (0.4 and 0.5), the slag-to-binder mass ratio (ranging from 0 to 0.6 in increments of 0.1), and the testing age (28 and 63 days). First, setting a given water-to-binder mass ratio of 0.5 and a testing age of 28 days, as the slag-to-binder mass ratio increases from 0 to 0.6, and the COCO2 emissions per unit strength decrease from 6.2 to 4 kg/MPa. Similar trends are observed for other water-to-binder ratios and testing ages. Second, under a given slag-to-binder mass ratio of 0.3 and a testing age of 28 days, as the water-to-binder mass ratio decreases from 0.5 to 0.4, the COCO2 emissions per unit strength drop from 5.3 to 5 kg/MPa. Similar trends are observed for other slag-to-binder ratios and testing ages. Finally, considering a given slag-to-binder mass ratio of 0.3 and a water-to-binder mass ratio of 0.5, as the testing age increases from 28 to 63 days, the COCO2 emissions per unit strength decrease from 5.3 to 4.9 kg/MPa. Similar trends are observed for other combinations of slag-to-binder and water-to-binder ratios.
Based on the analysis of Figure 3b, for a given age, adopting a low water-to-(cement + slag) mass ratio and a high slag-to-(cement + slag) mass ratio is an effective approach to reduce carbon emissions per 1 MPa of concrete strength.

4. Calculation of Carbonation Depth

Papadakis [2,27] conducted in-depth studies on the hydration reactions and carbonation depth of cement-based materials incorporating slag admixtures. The carbonation depth was measured by spraying a 1% phenolphthalein solution on a freshly broken concrete surface. Areas that remain pink are uncarbonated (alkaline), while colorless areas indicate carbonation. The depth of the colorless zone is measured to determine the carbonation depth [27].
Through comparing experimental results with actual engineering carbonation depths, the following equations for carbonation depth, accounting for the influence of slag, are proposed:
x c = 2 D [ C O 2 ] 0 t C 0.218 × α H × ( M C E + 0.7 × M S G )
D = 6.1 × 10 6 M W 0.267 × α H × ( M C E + 0.7 × M S G ) / 1000 M C E + 0.7 × M S G ρ CE + M W ρ W 3 1 R H 100 2.2
α H = α M A X F c ( t c u r ) F c ( 365 )
α M A X = 1 exp ( 3 . 38 × M W / ( M C E + 0 . 7 × M S G ) )
In Equation (9), xc represents the carbonation depth, tc denotes the carbonation duration, D is the CO2 diffusion coefficient, [CO2]0 represents the CO2 concentration, α H denotes the extent of hydration of the cementitious materials at the onset of carbonation, and the coefficient 0.7 preceding MSG is the carbonation equivalent coefficient of slag. It can be seen from Equation (9) that carbonation depth is a function of the square root of the carbonation time.
In Equation (10), ρ CE represents the density of cement, ρ W represents the density of water, and RH denotes the relative humidity of the environment.
In Equation (11), α M A X represents the maximum hydration extent of the cementitious materials, tcur represents the curing age of concrete at the onset of carbonation, Fc(tcur) represents the concrete’s strength at the beginning of carbonation, and Fc(365) corresponds to the concrete’s strength at 365 days. Equation (11) assumes that the cementitious materials reach their maximum hydration extent at 365 days, which aligns with the findings of Oh and Jang [28]. As shown in Equation (11), with an increase in the curing age at the onset of carbonation tcur, the hydration extent of the cementitious materials rises, the CO2 diffusion coefficient decreases, and the carbonation depth consequently decreases [23]. Equation (12) is the formula for calculation of α M A X , that is, the maximum hydration extent of the cementitious materials.
Figure 4 presents the results of the parameter analysis for carbonation depth. During the parameter analysis, the CO2 concentration in the environment was assumed to be 0.04%, the temperature was set to 20 °C, the relative humidity was 0.6, and the water content per unit volume of concrete was equal to 179 kg per cubic meter. The parameters analyzed included the concrete curing time (reflecting the curing age before the start of carbonation), water-to-(cement+slag) mass ratio, and slag-to-(cement+slag) mass ratio. In the parameter analysis, two parameters were held constant while the third was varied.
As seen in Figure 4a, the water-to-binder mass ratio was fixed at 0.50 and the slag replacement ratio at 0.30 in order to analyze the effect of curing age before the start of carbonation. The curing age was divided into three levels: 7 days, 28 days, and 63 days. When the curing age before carbonation increased from 7 to 28 days, the carbonation depth of concrete after 50 years decreased from 44.08 mm to 35.98 mm, representing a reduction of (44.08 − 35.98)/44.08 = 18.37%. When the curing age increased from 28 to 63 days, the carbonation depth after 50 years decreased from 35.98 mm to 33.57 mm, representing a reduction of (35.98 − 33.57)/35.98 = 6.61%. Although the time span from 7 to 28 days is 21 days and that from 28 to 63 days is 35 days, the earlier curing period (7–28 days) revealed a more significant improvement in carbonation resistance. This is because the hydration reaction progresses rapidly in the early stages (from 7 to 28 days), whereas the reaction rate slows down in the later stages (from 28 to 63 days).
As seen in Figure 4b, the curing age before the start of carbonation was fixed at 28 days and the slag replacement ratio at 0.3 in order to analyze the effect of the water-to-binder mass ratio. For the three water-to-binder mass ratios of 0.40, 0.50, and 0.60, the carbonation depths after 50 years were 26.45 mm, 35.98 mm, and 45.74 mm, respectively. The content of carbonatable materials increased as the water-to-binder ratio decreased, leading to a decrease in carbonation depth over the carbonation duration.
As seen in Figure 4c, the curing age before the start of carbonation was fixed at 28 days and the water-to-binder mass ratio at 0.5 in order to analyze the effect of the slag-to-binder mass ratio. For slag-to-binder mass ratios of 0, 0.30, and 0.60, the carbonation depths after 50 years were 28.70 mm, 35.98 mm, and 45.14 mm, respectively. The increase in the slag-to-binder mass ratio led to an increase in carbonation depth over the carbonation duration.
In summary, the parameter analysis in Figure 4 indicates that extending the curing time before carbonation begins, reducing the water-to-binder mass ratio, and lowering the slag-to-binder mass ratio are effective strategies for improving the carbonation resistance of slag concrete.

5. Genetic Algorithm-Based Low-Carbon Concrete Design

5.1. Four Design Scenarios for Optimization

According to the design specifications [29,30] for carbonation durability, concrete was designed with a 28-day compressive strength of 30 MPa and a specified cover thickness of 25 mm.
As shown in Table 2, four design scenarios were considered based on different formwork stripping times (7 days or 28 days) and whether carbonation durability was taken into account.
C1 does not consider carbonation durability, with a designed 28-day compressive strength of 30 MPa. Specifically,
Fc(28) ≥ 30 MPa
In Equation (13), Fc(28) denotes the actual strength at 28 days.
C2 considers carbonation durability, with a designed 28-day compressive strength of 30 MPa. Specifically,
Fc(28) ≥ 30 MPa; Xc50 ≤ 25 mm
In Equation (14), Xc50 is the carbonation depth at 50 years.
The only difference between C1 and C2 is whether carbonation durability is considered (i.e., C1 excludes carbonation durability considerations, whereas C2 incorporates them).
C3 disregards carbonation durability, with the concrete requiring formwork stripping at 7 days. According to construction specifications, the concrete strength at the time of formwork stripping must reach 70% of the design strength [31]; specifically,
Fc(7) ≥ 0.7 × 30 = 21 MPa; Fc(28) ≥ 30 MPa
In Equation (15), Fc(7) denotes the actual strength at 7 days.
C4 considers carbonation durability, and the concrete requires formwork stripping at 7 days.
Fc(7) ≥ 0.7 × 30 = 21 MPa; Fc(28) ≥ 30 MPa; Xc50 ≤ 25 mm
Table 3 summarizes the objective functions of each optimization design case. The objective function for the optimization design was developed according to the carbon emissions per unit volume of concrete. The differences and similarities in the constraint conditions for each design scenario are also presented.
After defining the objective function and constraints, a heuristic algorithm can be employed to determine the optimal mix proportion. In this study, the genetic algorithm toolbox in MATLAB 2024b was utilized for this purpose [32].

5.2. Optimization Design Results for Each Scenario

Through defining optimization objectives and applying constraint conditions for different design scenarios, the optimal mix proportions corresponding to each scenario were obtained using a genetic algorithm, with the results shown in Table 4. For all four design scenarios, the slag-to-(cement+slag) mass ratio reached the maximum value of 60%. This aligns with the carbon emission analysis in Section 3, indicating that employing slag effectively reduces carbon emissions per 1 MPa strength.
Using the mix proportions provided in Table 4, the water-to-binder mass ratio and slag-to-binder mass ratio for each scenario were calculated, as presented in Table 5.
From the mix proportions in Table 4, the mass ratios of cement to water and slag to water can also be derived. Based on the strength prediction Equation (2), the compressive strengths at different ages were calculated, which are also listed in Table 5.
Additionally, using the mix proportions from Table 4 along with the curing time before the start of carbonation (i.e., the demolding time) corresponding to each design scenario, the carbonation depths in Table 5 were obtained using the carbonation depth calculation method described in Section 4. The detailed procedure is as follows:
  • Use Equation (12) to calculate the final hydration extent of the reaction.
  • Use Equation (2) to calculate the strength of concrete at various ages (e.g., 7, 28, and 365 days).
  • Use Equation (11) to calculate the degree of reaction at the start of carbonation (carbonation start times are 28 days for scenarios C1 and C2 and 7 days for scenarios C3 and C4).
  • Use Equation (10) to calculate the diffusion coefficient.
  • Finally, use Equation (9) to calculate the carbonation depth in various scenarios.
Figure 5a corresponds to the design scenario C1, which has only one constraint: the 28-day compressive strength must not be less than 30 MPa. In the C1 design scenario, the curing time before the start of carbonation (i.e., the demolding time) was set to 28 days. The calculation results show that, after a 50-year service life, the carbonation depth of the concrete reached 54.194 mm, which is significantly greater than the concrete cover thickness of 25 mm. This indicates that the carbonation resistance is insufficient to meet the durability requirements.
Figure 5b corresponds to the design scenario C2, which includes two constraints. The first is that the 28-day compressive strength must not be less than 30 MPa, and the second is that the carbonation depth after a 50-year service life, following 28 days of curing (demolding), must not exceed the concrete cover thickness of 25 mm. The design results demonstrate that the actual 28-day compressive strength of the concrete was 65.139 MPa, which is significantly higher than the required design strength of 30 MPa, and the carbonation depth after 50 years was exactly 25 mm. This indicates that, in the C2 design scenario, carbonation durability is the determining factor in the optimization process, whereas strength is not a controlling factor.
Figure 5c corresponds to the design scenario C3, which includes two constraints. The first is that the 28-day compressive strength must not be less than 30 MPa, and the second is that the compressive strength at the time of formwork removal (7 days) must not be less than 21 MPa. Here, 21 MPa corresponds to 70% of the 28-day strength (i.e., 30 × 0.7 = 21). In the C3 design scenario, the curing time before the start of carbonation (i.e., the demolding time) was set to 7 days. The design results show that the actual 28-day compressive strength of the concrete was 30.122 MPa, slightly higher than the target strength of 30 MPa. This is because, between the two constraints—namely, 28-day strength ≥ 30 MPa and 7-day strength ≥ 21 MPa—the 7-day strength requirement is the dominant constraint guiding the optimization. In the C3 scenario, the curing time before the start of carbonation was 7 days (equal to the demolding time). After a 50-year service life, the carbonation depth reached 62.173 mm, which is far greater than the concrete cover thickness of 25 mm.
Figure 5d corresponds to the design scenario C4, which includes three constraints:
(1)
The 28-day compressive strength must not be less than 30 MPa.
(2)
The 7-day compressive strength at the time of formwork removal must not be less than 21 MPa.
(3)
The carbonation depth after 50 years of service, starting from the 7th day of curing, must not exceed the concrete cover thickness of 25 mm.
The results indicate that the actual 28-day compressive strength of the concrete was 80.890 MPa, which is significantly higher than the design strength of 30 MPa. This is because, in the C4 scenario, carbonation durability was the dominant factor in the optimization process.
In summary, design scenario C1 resembles conventional concrete design methods, considering only the 28-day compressive strength. In scenario C2, the mix design is governed by the requirement for carbonation durability after 28-day curing. In scenario C3, the dominant constraint is the 7-day compressive strength required at demolding. In scenario C4, the governing factor is the carbonation durability requirement following 7-day curing. Scenarios C1 and C3 do not consider carbonation durability constraints, and the results show that, after 50 years of service, the carbonation depth exceeded the cover thickness in both cases. In contrast, scenarios C2 and C4 include carbonation durability constraints, and the associated results show that, after 50 years, the carbonation depth was equal to the cover thickness. Although both C2 and C4 ensured carbonation durability, their demolding times differed. As the demolding time shortened from 28 days in C2 to 7 days in C4, the actual 28-day compressive strength increased from 65.139 MPa to 80.890 MPa.
In design scenarios C2 and C4, in which carbonation durability was taken into account, the actual compressive strength significantly exceeded the design value of 30 MPa. This highlights the critical role of carbonation resistance in the design of low-carbon slag concrete. To meet the durability requirements, this study proposes adjusting the concrete mix proportion as a solution. This optimized mix can be considered in a manner specific to the concrete cover region; that is, to meet the carbonation durability requirement, the concrete in the cover region should have increased strength, while the concrete in other regions can be selected based on structural design needs. As the concrete strengths differ between the cover and the interior regions, appropriate construction techniques must be adopted to ensure proper bonding between the two zones [33]. The approach proposed in this study is similar to the use of ultra-high-performance concrete (UHPC) as a protective cover layer to enhance structural durability [33].
The optimization results in this study show that, for all optimized mix designs, the slag replacement ratio reached its maximum value. This is because the objective of the optimization was to minimize carbon emissions. The parameter analysis of carbon emissions per unit strength (Figure 3b) indicates that lowering the water-to-binder ratio and increasing the slag replacement ratio both contribute to reducing carbon emissions per unit strength, and the trend observed in the optimization results aligns well with the trends identified in the parameter analysis. It should also be noted that concrete strength and carbonation depth are influenced not only by the slag replacement ratio but also by the water-to-binder mass ratio. It should be noted that the conclusions of this study are based on the specific strength, carbon emissions, and carbonation depth formulas adopted herein. If these underlying formulas are modified, the optimization results may also change accordingly.
Figure 6a illustrates the relationship between the 28-day strength and the water-to-(cement+slag) mass ratio, from which it can be seen that an increase in the water-to-(cement+slag) mass ratio led to a decrease in strength. Figure 6b illustrates the correlation between 28-day strength and carbon emissions per unit volume of concrete: as the 28-day strength increased, the carbon emissions per unit volume of concrete also rose.
Overall, the trends observed in the optimized water-to-(cement+slag) mass ratio, 28-day compressive strength, and CO2 emissions per unit volume of concrete align well with actual engineering practice [34].

6. Discussion

The contributions and core findings of this study are summarized as follows:
First, in the concrete design methods proposed by the American Concrete Institute (ACI), it is commonly assumed that if the compressive strength requirement is satisfied, the durability requirement will also be met [
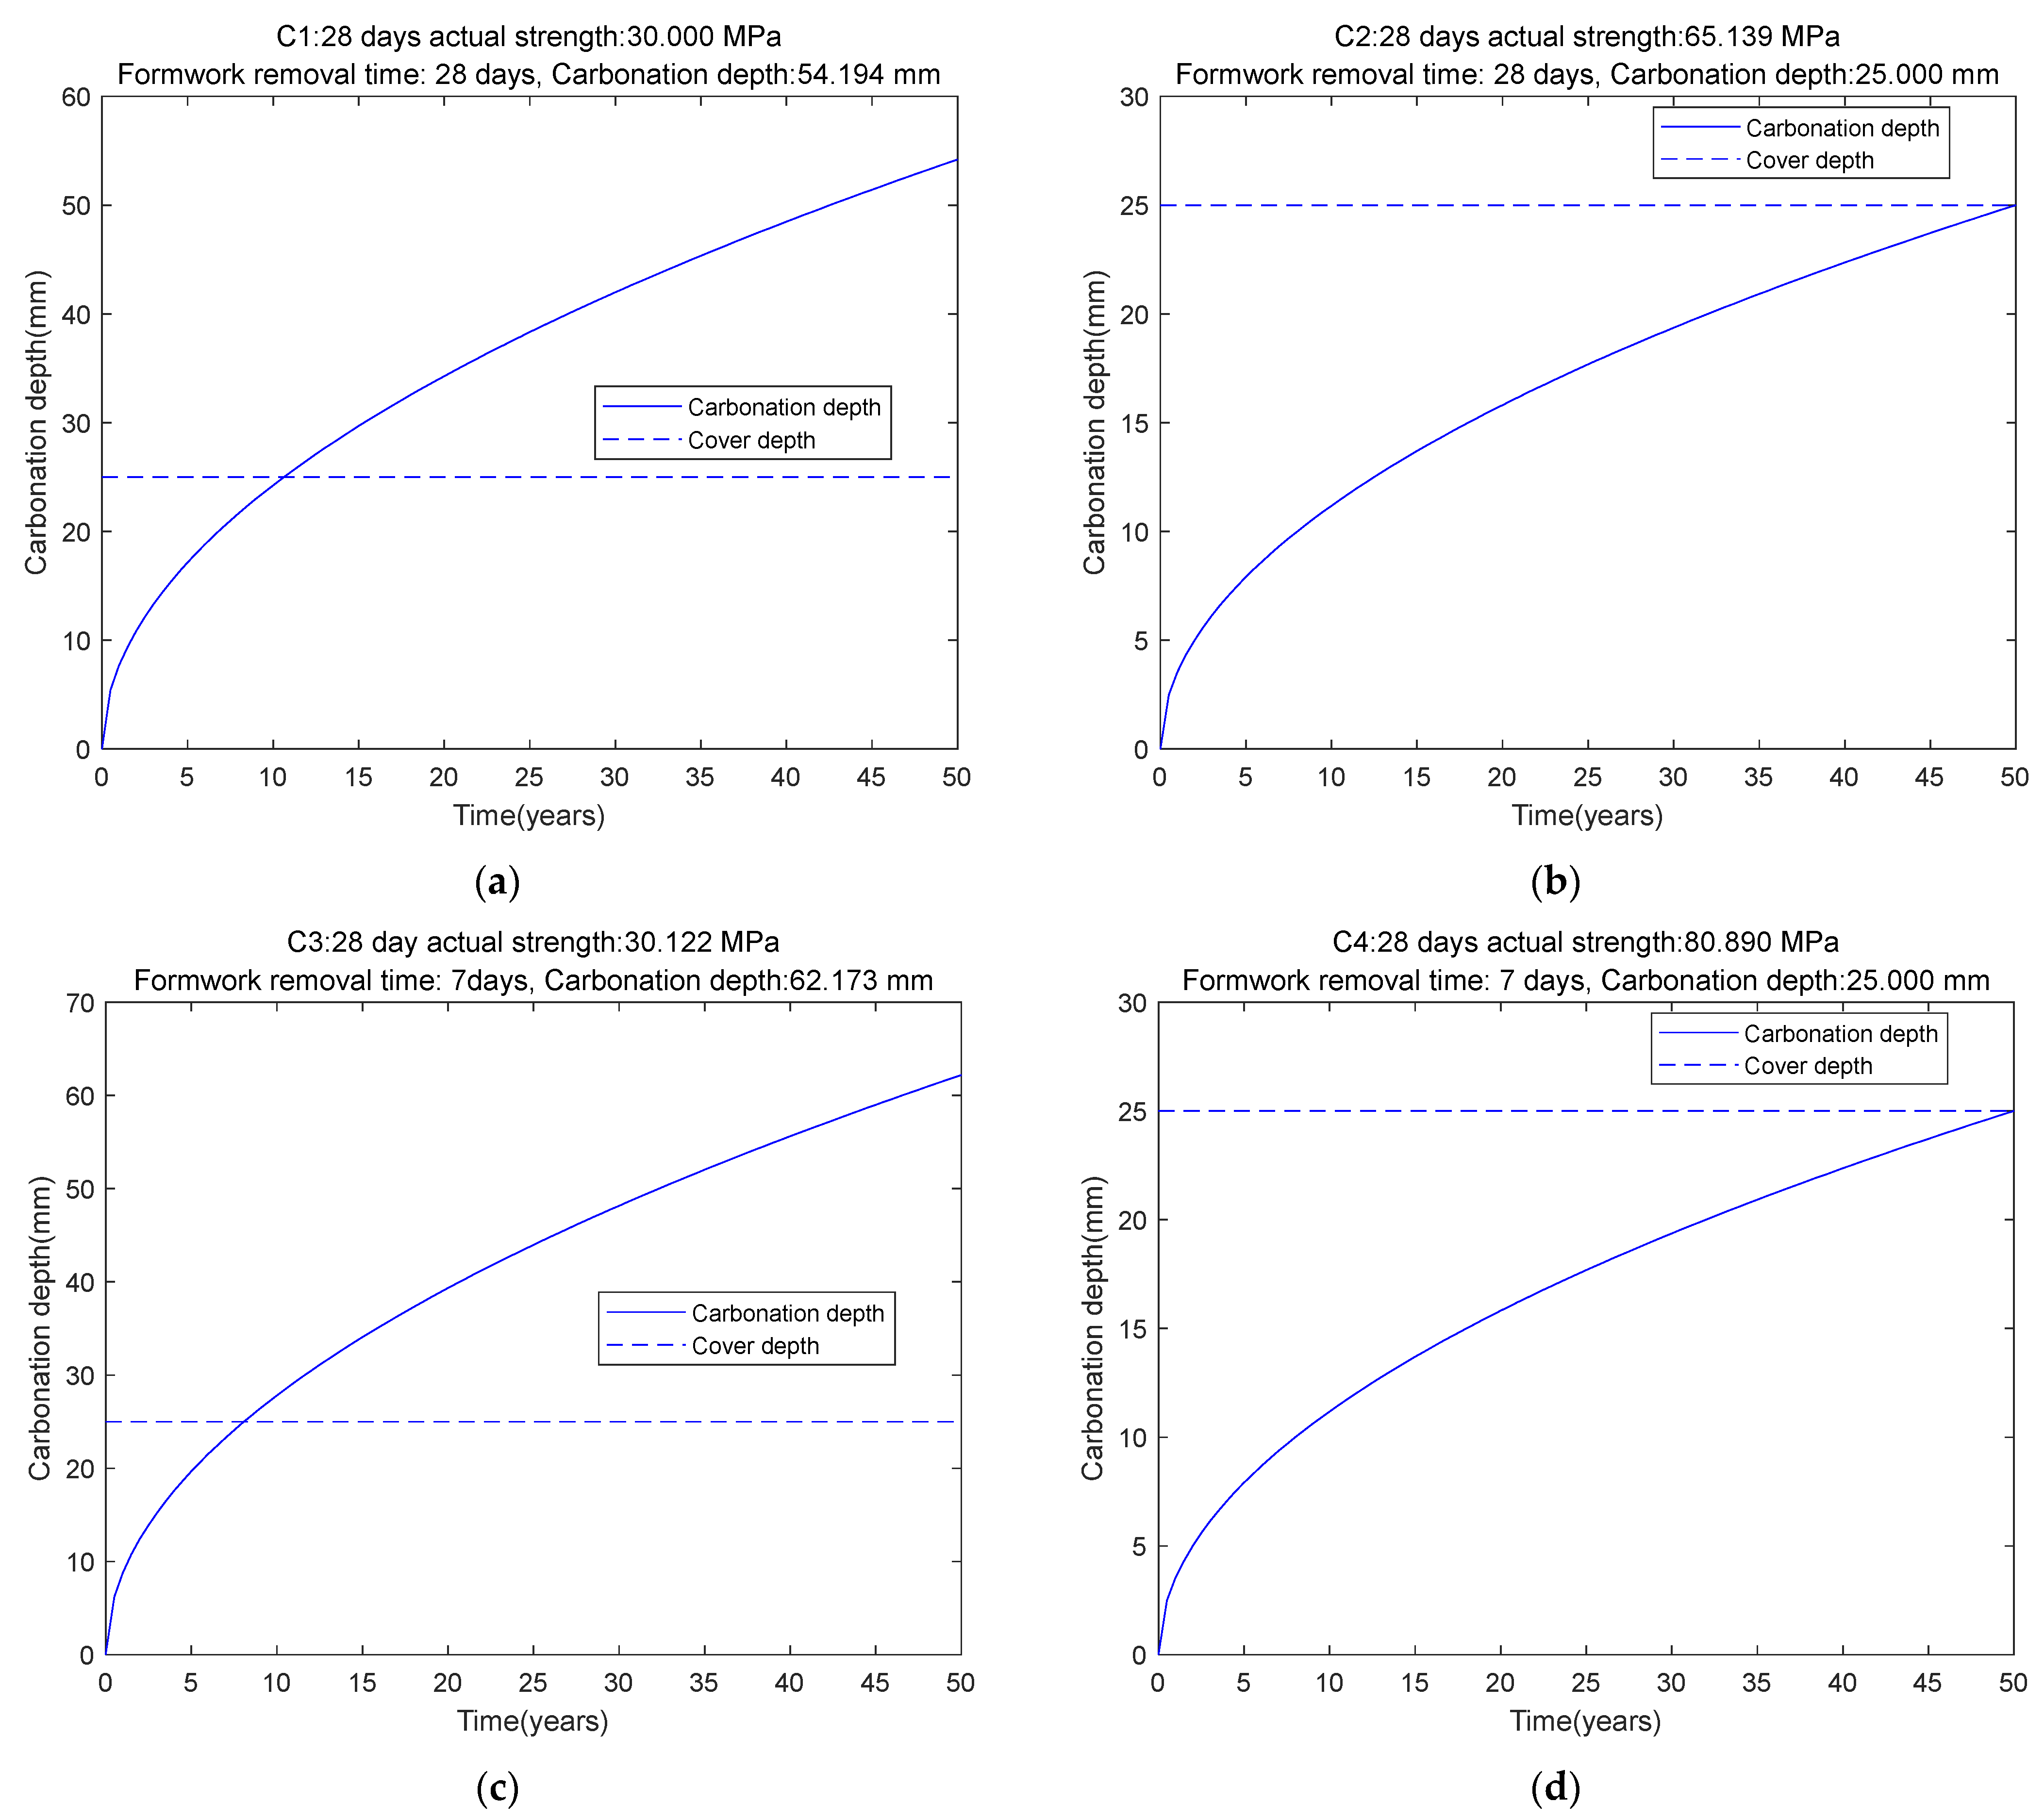
25]. However, the results of this study reveal that this assumption is not valid for low-carbon slag concrete. When only the 28-day compressive strength requirement was considered, the carbonation depth after a 50-year service life significantly exceeded the concrete cover thickness (Design Scenario C1); in other words, for low-carbon slag concrete, it is carbonation durability—not compressive strength—that governs the mix design. Through the application of a genetic algorithm, this study successfully developed low-carbon slag concrete mixtures that meet both durability- and strength-related requirements.
Second, the design of low-carbon concrete depends not only on the materials used but also closely on construction practices. Previous studies on low-carbon concrete have mostly focused on materials [13], often overlooking the impact of construction methods. In slag concrete, early formwork removal can reduce construction costs but also leads to decreased carbonation resistance and poses a risk of steel reinforcement corrosion. The design method proposed in this study takes into account both material and construction aspects. It provides a material-based solution that reduces the risk of corrosion and prevents increased repair costs due to inadequate carbonation resistance.
Finally, although previous researchers have suggested that improving the carbonation resistance of concrete in the cover region is essential for durability, they did not provide specific design methods [35]. In contrast, the mix proportions listed in Table 4 of this study offer practical solutions that satisfy both durability and construction requirements. These optimized mixes can be used for the cover region of reinforced concrete structures. Such mix designs offer several advantages: they are associated with low carbon emissions, meet structural strength requirements, fulfill durability demands, and are compatible with general construction constraints.
Currently, the method proposed in this paper is based on the experiments conducted by Oner and Akyuz [1]. When other users wish to apply the model presented in this study, they can follow these steps: First, collect local compressive strength data and perform regression analysis to determine the coefficients for the strength prediction equation (Equation (1)). Second, calculate the carbon emissions per unit volume of concrete based on local carbon emission data according to Equation (3). Third, determine the local carbonation depth according to regional climatic conditions according to Equation (9). Finally, use a genetic algorithm in conjunction with local durability design standards to obtain the optimal low-carbon concrete mix proportions. Although the results of the calculations may vary across different countries and regions, the overall procedure remains similar. From this perspective, the proposed method can serve as a general approach for designing low-carbon slag concrete.

7. Conclusions

This study introduced an optimization design approach for low-carbon slag concrete, integrating the combined effects of formwork stripping time and carbonation durability. The specific contributions relating to the proposed design method are as follows:
  • Based on strength test results, a strength prediction equation was developed that considers the curing age, water-to-(cement+slag) mass ratio, and slag-to-(cement+slag) mass ratio. The root mean square error was 4.3175 MPa, the correlation coefficient was 0.9435, and the signal-to-noise ratio was 18.563. The strength prediction equation has clear physical meanings for each coefficient. Both the cement strength coefficient and the slag strength coefficient increase with curing age, with the slag strength coefficient exhibiting a greater growth rate than the cement strength coefficient.
  • The calculated carbon emissions per 1 MPa strength of concrete indicate that, for a given curing age, employing a low water-to-(cement+slag) mass ratio and a high slag-to-(cement+slag) mass ratio is an effective approach to reducing unit-strength carbon emissions. Parameter analysis of the carbonation model showed that, when the curing time before carbonation onset increased from 7 to 28 days, the carbonation depth significantly decreased. However, when the curing time increased from 28 days to 63 days, the reduction in carbonation depth became less pronounced. This is because the hydration reaction of cementitious materials progresses rapidly in the early stages but slows down at later stages.
  • Four design scenarios were considered in this study. Scenario C1 does not consider carbonation durability, with a designed 28-day compressive strength of 30 MPa; scenario C2 considers carbonation durability, with the same designed 28-day compressive strength of 30 MPa; scenario C3 does not consider carbonation durability, but the concrete requires formwork stripping at 7 days; and finally, scenario C4 considers carbonation durability, and the concrete also requires formwork stripping at 7 days. Through setting constraints in the genetic algorithm according to different design scenarios, the optimal mix proportions under each scenario were determined.
  • The optimization results indicate that, when the design scenario changes from C1 to C2, the actual 28-day strength of concrete rises from 30 MPa to 65.139 MPa. This increase is necessary to meet the carbonation durability constraints, which require a higher cementitious material content. When the design scenario changes from C1 to C3, the actual 28-day strength slightly rises from 30 MPa to 30.122 MPa. When the carbonation durability is not considered, the actual concrete strength remains largely unchanged. When the design scenario changes from C3 to C4, the actual 28-day strength significantly rises from 30.122 MPa to 80.890 MPa, which is due to the low carbonation resistance of the concrete at an early age of 7 days. To improve carbonation durability, the content of cementitious materials must be increased, thereby enhancing the strength of the actual concrete. The observed trends in the optimized water-to-(cement+slag) mass ratio, 28-day compressive strength, and CO2 emissions per unit volume of concrete align well with actual engineering practice.
In summary, this study presented a novel approach for the material design of low-carbon slag concrete, in which prolonging the curing period before carbonation initiation significantly influences the material design. The design of low-carbon slag concrete is not only dependent on the proportions of the mix but is also closely associated with the used construction methods.

8. Future Works

Future studies need to further explore the following aspects:
First, this study did not consider the effect of slag fineness on compressive strength and carbonation resistance. Under fixed slag content and water-to-binder ratio conditions, increasing slag fineness has been shown to enhance slag reactivity, resulting in higher compressive strength and improved resistance to carbonation [36]. Future research should incorporate the influence of slag fineness into both the strength and carbonation depth models.
Second, the present study did not address the effects of slag on shrinkage and cracking. When shrinkage is restrained, tensile stress and cracking can occur which, in turn, accelerate concrete carbonation and affect the mix design of slag concrete. Future optimization design should take into account the effects of shrinkage, cracking, and different levels of tensile stress.
Third, due to differences in raw materials, the strength development and carbonation resistance of slag concrete may vary in different geographical areas. To improve the applicability of the design method, it is necessary to adjust the calculation formulas for compressive strength, carbon emissions, and carbonation depth based on experimental data and industry standards from different countries, allowing for the development of optimization design programs tailored to specific national conditions.

Author Contributions

L.-N.Z.: investigation, data curation, and writing—original draft. S.-J.K.: investigation, data curation, and funding acquisition. X.-Y.W.: supervision, methodology, and funding acquisition. All authors have read and agreed to the published version of the manuscript.

Funding

This research was supported by Industrial Technology Alchemist Project (No. 20025773, Development of metropolitan Direct Air Capture and Utilization Technologies) funded by the Ministry of Trade, Industry, and Energy (MOTIE, Korea). This work was supported by the National Research Foundation of Korea (NRF), with a grant funded by the Korea government (MSIT) (No. RS-2023–00208720).

Data Availability Statement

The data presented in this study are available from the corresponding author upon reasonable request.

Conflicts of Interest

The authors declare no conflicts of interest.

References

  1. Oner, A.; Akyuz, S. An experimental study on optimum usage of GGBS for the compressive strength of concrete. Cem. Concr. Compos. 2007, 29, 505–514. [Google Scholar] [CrossRef]
  2. Papadakis, V.G.; Tsimas, S. Supplementary cementing materials in concrete Part I: Efficiency and design. Cem. Concr. Res. 2000, 32, 1525–1532. [Google Scholar] [CrossRef]
  3. Sun, J.; Sun, M.; Su, A.; Gao, X. Influence of graphite tailings on the mechanical performance, of ultra-high performance concrete. Case Stud. Constr. Mater. 2025, 22, e04246. [Google Scholar] [CrossRef]
  4. Zhang, H.; Liang, Q.; Shao, M.; Jiang, N.; Ma, W.; Ge, Z.; Šavija, B. Optimization of low-carbon lightweight foamed concrete using ground circulating fluidized bed fly ash. J. Clean. Prod. 2025, 489, 144697. [Google Scholar] [CrossRef]
  5. Bhagath Singh, G.V.P.; Durga Prasad, V. Environmental impact of concrete containing high volume fly ash and ground granulated blast furnace slag. J. Clean. Prod. 2024, 448, 141729. [Google Scholar] [CrossRef]
  6. Schack, T.; Haist, M. Performance assessment of eco-efficient concrete with ternary blended cementitious materials considering the effect of binder component fineness. Case Stud. Constr. Mater. 2024, 20, e03154. [Google Scholar] [CrossRef]
  7. Yahyaee Nojoukambari, T.; Sadrmomtazi, A.; Kohani Khoshkbijari, R. Influence of Feldspar and Ground Granulated Blast-furnace slag as a partial cement replacement on mechanical properties and thermal durability and environmental impacts of cement mortars. J. Clean. Prod. 2023, 398, 136074. [Google Scholar] [CrossRef]
  8. Shamseldeen Fakhri, R.; Thanon Dawood, E. Limestone powder, calcined clay and slag as quaternary blended cement used for green concrete production. J. Build. Eng. 2023, 79, 107644. [Google Scholar] [CrossRef]
  9. Chen, G.; Li, S.; Zhao, Y.; Xu, Z.; Luo, X.; Gao, J. Hydration and microstructure evolution of a novel low-carbon concrete containing recycled clay brick powder and ground granulated blast furnace slag. Constr. Build. Mater. 2023, 386, 131596. [Google Scholar] [CrossRef]
  10. Shamass, R.; Rispoli, O.; Limbachiya, V.; Kovacs, R. Mechanical and GWP assessment of concrete using Blast Furnace Slag, Silica Fume and recycled aggregate. Case Stud. Constr. Mater. 2023, 18, e02164. [Google Scholar] [CrossRef]
  11. Yang, K.-H.; Jung, Y.-B.; Cho, M.-S.; Tae, S.-H. Effect of supplementary cementitious materials on reduction of CO2 emissions from concrete. J. Clean. Prod. 2015, 103, 774–783. [Google Scholar] [CrossRef]
  12. Kim, Y.; Hanif, A.; Usman, M.; Munir, M.J.; Kazmi, S.M.S.; Kim, S. Slag waste incorporation in high early strength concrete as cement replacement: Environmental impact and influence on hydration & durability attributes. J. Clean. Prod. 2018, 172, 3056–3065. [Google Scholar]
  13. Yeh, I.C. Optimization of concrete mix proportioning using a flattened simplex–centroid mixture design and neural networks. Eng. Comput. 2009, 25, 179–190. [Google Scholar] [CrossRef]
  14. Kim, T.; Tae, S.; Roh, S. Assessment of the CO2 emission and cost reduction performance of a low-carbon-emission concrete mix design using an optimal mix design system. Renew. Sustain. Energy Rev. 2013, 25, 729–741. [Google Scholar] [CrossRef]
  15. Shobeiri, V.; Bennett, B.; Xie, T.; Visintin, P. Mix design optimization of concrete containing fly ash and slag for global warming potential and cost reduction. Case Stud. Constr. Mater. 2023, 18, e01832. [Google Scholar] [CrossRef]
  16. Knight, K.A.; Cunningham, P.R.; Miller, S.A. Optimizing supplementary cementitious material replacement to minimize the environmental impacts of concrete. Cem. Concr. Compos. 2023, 139, 105049. [Google Scholar] [CrossRef]
  17. Yang, K.-H.; Tae, S.-H.; Choi, D.-U. Mixture Proportioning Approach for Low-CO2Concrete Using Supplementary Cementitious Materials. ACI Mater. J. 2016, 113, 533. [Google Scholar] [CrossRef]
  18. Tapali, J.G.; Demis, S.; Papadakis, V.G. Sustainable concrete mix design for a target strength and service life. Comput. Concr. 2013, 12, 755–774. [Google Scholar] [CrossRef]
  19. Jia, Y.; Aruhan, B.; Yan, P. Natural and accelerated carbonation of concrete containing fly ash and GGBS after different initial curing period. Mag. Concr. Res. 2012, 64, 143–150. [Google Scholar] [CrossRef]
  20. Ekolu, S.O. Model for practical prediction of natural carbonation in reinforced concrete: Part 1-formulation. Cem. Concr. Compos. 2018, 86, 40–56. [Google Scholar] [CrossRef]
  21. Schutter, G.D.; Taerwe, L. Degree of hydration-based description of mechanical properties of early age concrete. Mater. Struct. 1996, 29, 335–344. [Google Scholar] [CrossRef]
  22. Bahmani, H.; Mostafaei, H.; Santos, P.; Chamasemani, N.F. Enhancing the Mechanical Properties of Ultra-High-Performance Concrete (UHPC) Through Silica Sand Replacement with Steel Slag. Buildings 2024, 14, 3520. [Google Scholar] [CrossRef]
  23. Han-Seung, L.; Wang, X.-Y. Evaluation of compressive strength development and carbonation depth of high volume slag-blended concrete. Constr. Build. Mater. 2016, 124, 45–54. [Google Scholar] [CrossRef]
  24. Choi, J.-H.; Kim, D.; Ko, M.-S.; Lee, D.-E.; Wi, K.; Lee, H.-S. Compressive strength prediction of ternary-blended concrete using deep neural network with tuned hyperparameters. J. Build. Eng. 2023, 75, 107004. [Google Scholar] [CrossRef]
  25. Mehta, P.; Monteiro, P.J.M. Concrete: Microstructure, Properties, and Materials, 3rd ed.; McGraw-Hill Professional: New York, NY, USA, 2005. [Google Scholar]
  26. Biswal, U.S.; Dinakar, P. A mix design procedure for fly ash and ground granulated blast furnace slag based treated recycled aggregate concrete. Clean. Eng. Technol. 2021, 5, 100314. [Google Scholar] [CrossRef]
  27. Demis, S.; Efstathiou, M.P.; Papadakis, V.G. Computer-aided modeling of concrete service life. Cem. Concr. Compos. 2014, 47, 9–18. [Google Scholar] [CrossRef]
  28. Oh, B.H.; Jang, S.Y. Prediction of diffusivity of concrete based on simple analytic equations. Cem. Concr. Res. 2004, 34, 463–480. [Google Scholar] [CrossRef]
  29. CEB. Eurocode 2: Design of Concrete Structures; Ministry of Housing and Urban-Rural Development: Beijing, China, 2004. [Google Scholar]
  30. GB/T50476-2019; Standard for Design of Concrete Structure Durability. MOHURD: Beijing, China, 2019.
  31. GB 50204-2015; Code for Quality Acceptance of Concrete Structure Construction. MOHURD: Beijing, China, 2015.
  32. MATLAB, version 2024b; Mathworks: Natick, MA, USA, 2024.
  33. Jang, H.-O.; Lee, H.-S.; Cho, K.; Kim, J. Experimental study on shear performance of plain construction joints integrated with ultra-high performance concrete (UHPC). Constr. Build. Mater. 2017, 152, 16–23. [Google Scholar] [CrossRef]
  34. Lin, R.S.; Liao, Y.; Han, Y.; Oh, S.; Park, K.B.; Yang, H.M.; Wang, X.Y.; Yang, B.; Meng, L.Y. Low-CO2 Optimization Design of Quaternary Binder Containing Calcined Clay, Slag, and Limestone. Materials 2023, 16, 6385. [Google Scholar] [CrossRef]
  35. Stewart, M.G.; Wang, X.; Nguyen, M.N. Climate change adaptation for corrosion control of concrete infrastructure. Struct. Saf. 2012, 35, 29–39. [Google Scholar] [CrossRef]
  36. Sulapha, P.; Wong, S.F.; Wee, T.H.; Swaddiwudhipong, S. Carbonation of Concrete Containing Mineral Admixtures. J. Mater. Civ. Eng. 2003, 15, 134–143. [Google Scholar] [CrossRef]
Figure 1. Parameter analysis of the compressive strength prediction Equation (1). (a) Strength coefficient of cement. (b) Strength coefficient of slag. (c) Relative strength coefficient of cement. (d) Relative strength coefficient of slag. (e) Regression equation of cement strength coefficient and age. (f) Regression equation of slag strength coefficient and age.
Buildings 15 01316 g001aBuildings 15 01316 g001b
Figure 2. Comparison of experimental and predicted strength results.
Buildings 15 01316 g002
Figure 3. Concrete carbon emission analysis under varying rates of substitution of cement with slag. (a) Carbon emission analysis per unit volume of concrete. (b) Carbon emission analysis per 1 MPa strength of concrete.
Buildings 15 01316 g003
Figure 4. Parameter analysis of carbonation depth considering curing time and water/cement/slag composition of concrete. (a) Effect of curing time before carbonation onset on carbonation depth. (b) Effect of water-to-(cement+slag) mass ratio on carbonation depth. (c) Effect of slag-to-(cement+slag) mass ratio on carbonation depth.
Buildings 15 01316 g004
Figure 5. Relationship between carbonation depth and time for each optimized design. (a) Design Scenario C1. (b) Design Scenario C2. (c) Design Scenario C3. (d) Design Scenario C4.
Buildings 15 01316 g005
Figure 6. Overall trends observed for mix proportions in optimized designs. (a) Relationship between 28-day compressive strength and water-to-(cement+slag) mass ratio. (b) Relationship between 28-day compressive strength and carbon emissions per unit volume of concrete.
Buildings 15 01316 g006
Table 1. Values of strength coefficients A, B, and C at different ages and regression performance of Equation (1).
Age (Days)ABCRoot Mean Square ErrorCorrelation
Coefficient
Signal-to-Noise Ratio
724.91813.551−10.3162.688 0.912 18.908
1428.94115.083−12.9692.908 0.918 19.074
2833.88818.960−13.0143.632 0.916 19.311
6334.30123.971−12.5174.367 0.917 18.742
11935.24427.626−12.7454.733 0.924 18.743
18036.77529.374−13.6194.832 0.929 18.943
36538.91631.799−14.7035.063 0.933 19.066
Table 2. Design scenarios of low-carbon slag concrete.
Design ScenariosFormwork Stripping
Time (Days)
Carbonation Durability
C128No
C228Yes
C37No
C47Yes
Table 3. Optimization design: objective functions and constraints.
Design ScenariosAim FunctionSpecific ConstraintsCommon Constraints
C1:
Formwork stripping time 28 days,
no carbonation
Minimum (CO2V)Fc(28) ≥ 300 < MSG/(MCE + MSG)
<0.6;
0.8 < MW/(MCE + MSG)
<0.25;
MW = 179
C2:
Formwork stripping time
28 days,
with carbonation
Fc(28) ≥ 30;
Xc50 ≤ 25
C3:
Formwork stripping time
7 days,
no carbonation
Fc(7) ≥ 21;
Fc(28) ≥ 30
C4:
Formwork stripping time
7 days,
with carbonation
Fc(7) ≥ 21;
Fc(28) ≥ 30;
Xc50 ≤ 25
Table 4. Optimal mix proportions for optimization design (kg/m3).
Design ScenariosWater (kg/m3)Cement (kg/m3)Slag (kg/m3)
C1179.00123.52185.28
C2179.00224.43336.65
C3179.00123.87185.80
C4179.00269.67404.50
Table 5. Material properties of optimal mix proportions for optimization design.
Design ScenariosWater
/(Cement+Slag)
Slag
/(Cement+Slag)
7-Day Strength28-Day Strength365-Day StrengthCarbonation Depth at 50 Years
(mm)
(MPa)
C10.5800.60020.911 30.000 42.055 54.194
C20.3190.60046.419 65.139 90.874 25.000
C30.5780.60021.000 30.122 42.225 62.173
C40.2660.60057.853 80.890 112.757 25.000
Disclaimer/Publisher’s Note: The statements, opinions and data contained in all publications are solely those of the individual author(s) and contributor(s) and not of MDPI and/or the editor(s). MDPI and/or the editor(s) disclaim responsibility for any injury to people or property resulting from any ideas, methods, instructions or products referred to in the content.

