Article

Numerical Investigation and Factorial Analysis of Residual Displacement in Rocking Self-Centering Bridge Columns Under Cyclic Loading

1
School of Environment and Urban Construction, Lanzhou City University, Lanzhou 730070, China
2
School of Civil Engineering, Lanzhou University of Technology, Lanzhou 730050, China
*
Author to whom correspondence should be addressed.
Buildings 2025, 15(8), 1220; https://doi.org/10.3390/buildings15081220
Submission received: 28 February 2025 / Revised: 24 March 2025 / Accepted: 2 April 2025 / Published: 8 April 2025

Abstract

Well-designed rocking self-centering (RSC) columns are capable of achieving small residual displacement. However, quantitative assessments of residual displacement mechanisms in RSC columns remain understudied. The residual displacement is the product of the struggle between the self-centering (SC) capacity and the energy dissipation (ED) capacity. In this study, an SC factor and an ED parameter were defined to reflect the SC and ED capacity of the RSC column, respectively. The hysteretic behavior of an RSC pier under quasi-static load was studied. Based on the finite element model, the factorial analysis of two types of RSC piers was carried out, and the influence of eight common design parameters on the SC factor and ED parameters was discussed. Parametric analysis was performed to investigate the effect of the SC factor and the ED parameter with an increase in maximum displacement. According to the results of the parametric analysis, the effect of the SC factor and the ED parameter on the distribution of the residual displacement was statistically researched. A simplified formula was proposed to calculate the upper limit of the residual displacement. Furthermore, a set of predictive regression formulas was established to estimate the actual residual displacement. These regression formulas have an applicable condition that the ED parameter should be larger than 0.75. When the ED parameter is less than 0.75, the residual displacement is approximately zero. The hysteretic performance of an RSC pier is mainly determined by a single-factor effect, and the residual displacement distribution under a quasi-static load is mainly controlled by the SC factor and ED parameter.

1. Introduction

Devastating earthquakes in the past have demonstrated that reinforced concrete (RC) bridge structures are highly vulnerable to earthquakes, with extensive damage concentrated in the plastic regions of bridge piers [1,2]. This damage is likely to cause large residual displacement. It is difficult to restore a bridge structure with significant permanent displacement to its initial condition; this causes tremendous difficulties in post-earthquake recovery and huge economic losses [3]. For example, about 100 RC bridge piers were eventually demolished due to a residual displacement ratio of 1.75% after the 1995 Kobe earthquake in Japan [3]. Therefore, residual displacement is regarded as a main index to evaluate earthquake resilience, and the self-centering capacity of piers has become an important design consideration [4,5].
Based on the accelerated bridge construction philosophy, the rocking self-centering (RSC) column was proposed, and post-tensioning was considered to be an efficient way to drastically reduce residual displacement [6]. Precast segmental concrete-filled steel tubes, as suggested by Zhang et al. [7], exhibit exceptional self-centering performance and minimal plastic deformation. To date, many experimental studies have been carried out to address the seismic behavior of RSC columns [8,9,10,11,12,13,14,15,16,17,18,19]. Hewes et al. [8] performed an early cyclic test of RSC columns, and the results showed that segments of the pier basically remained elastic, and the residual displacement was very small. However, the energy dissipation (ED) capacity was extremely weak due to the lack of ED elements. To enhance the ED capacity of RSC columns, various types of dissipaters were proposed, and the ED bar is the commonest ED device among these dissipaters. The results of many cyclic tests have shown that the hysteretic curve of an RSC column equipped with ED elements is much fuller, and the ED capacity is improved, as expected [9,10,11,12,13,14,15]. Meanwhile, the added ED elements reduce the SC capacity of RSC columns, leading to the problem of residual displacement needing to be addressed if too many dissipaters are used. Some researchers have tried to use high-performance materials (e.g., shape memory alloy, fiber-reinforced polymer composite bar, and reinforcement with non-adhesive post-tensioning) to achieve a balance between SC and ED capacity [16,17,18,19,20]. Guo et al. [21] set the self-centering coefficient at approximately 1.0 to achieve a balanced trade-off between effective energy dissipation capacity and acceptable residual deformation. It can be concluded that there is a trade-off between the SC and ED capacity; the residual displacement is the product of their mutual struggle.
The harm of residual displacement has been realized gradually, and residual displacement has been regarded as an important consideration in seismic design. According to earthquake damage investigation results, the Japan Road Association code first proposed a reparability limit of 1% for RC columns [22]. Some studies focusing on the residual displacement of RC columns have been conducted; these aimed to explore the influence factors and estimate residual displacement under the influence of earthquakes. It can be concluded that residual displacement is determined by both structural properties and the characteristics of earthquake load [23,24,25,26,27,28]. However, few studies related to the residual displacement estimation of RSC columns have been reported. Li et al. [29] selected residual displacement as a performance index to conduct seismic vulnerability analysis and loss assessment of an RSC bridge system. Ou et al. [30] developed a three-dimensional model of an RSC column equipped with internal ED bars. The results of cyclic loading analyses suggested an optimum ED bar ratio of around 0.5%. Cai et al. [31] performed cyclic analyses to investigate the influence of post-tensioning force, gravity load, ED bar ratio, and aspect ratio on the residual displacement of RSC columns. Liu et al. [32] carried out parametric analyses on residual displacement under cyclic loading. Wang et al. [33] proposed a simplified formula for UHPC bridge columns with unbonded post-tensioning tendons to calculate the upper limit of residual displacement under cyclic loading. In conclusion, the residual displacement of RSC columns under cyclic loading mainly depends on structural properties. Quantitative analysis of residual displacement remains limited in previous works. Tazarv et al. [34] proposed a UHPC prefabricated column that effectively minimizes residual displacement. Jia et al. [35] introduced an intelligent high-performance material shape memory alloy (an L-shaped plate), which significantly reduces the residual displacement response of the rocking column and facilitates the prompt restoration of normal operation.
The purpose of this study is to explore the distribution of residual displacement in RSC columns under cyclic loading and achieve its prediction. Two governing parameters, including an SC factor and an ED parameter, were introduced to describe the SC capacity and ED capacity of piers. The contribution of eight common design parameters to the SC factor and ED parameter was compared. Then, the effect of the SC factor and ED parameter on the residual displacement was investigated, a set of predictive formulas for the residual displacement was obtained from regressive analyses, and an application of it was provided.

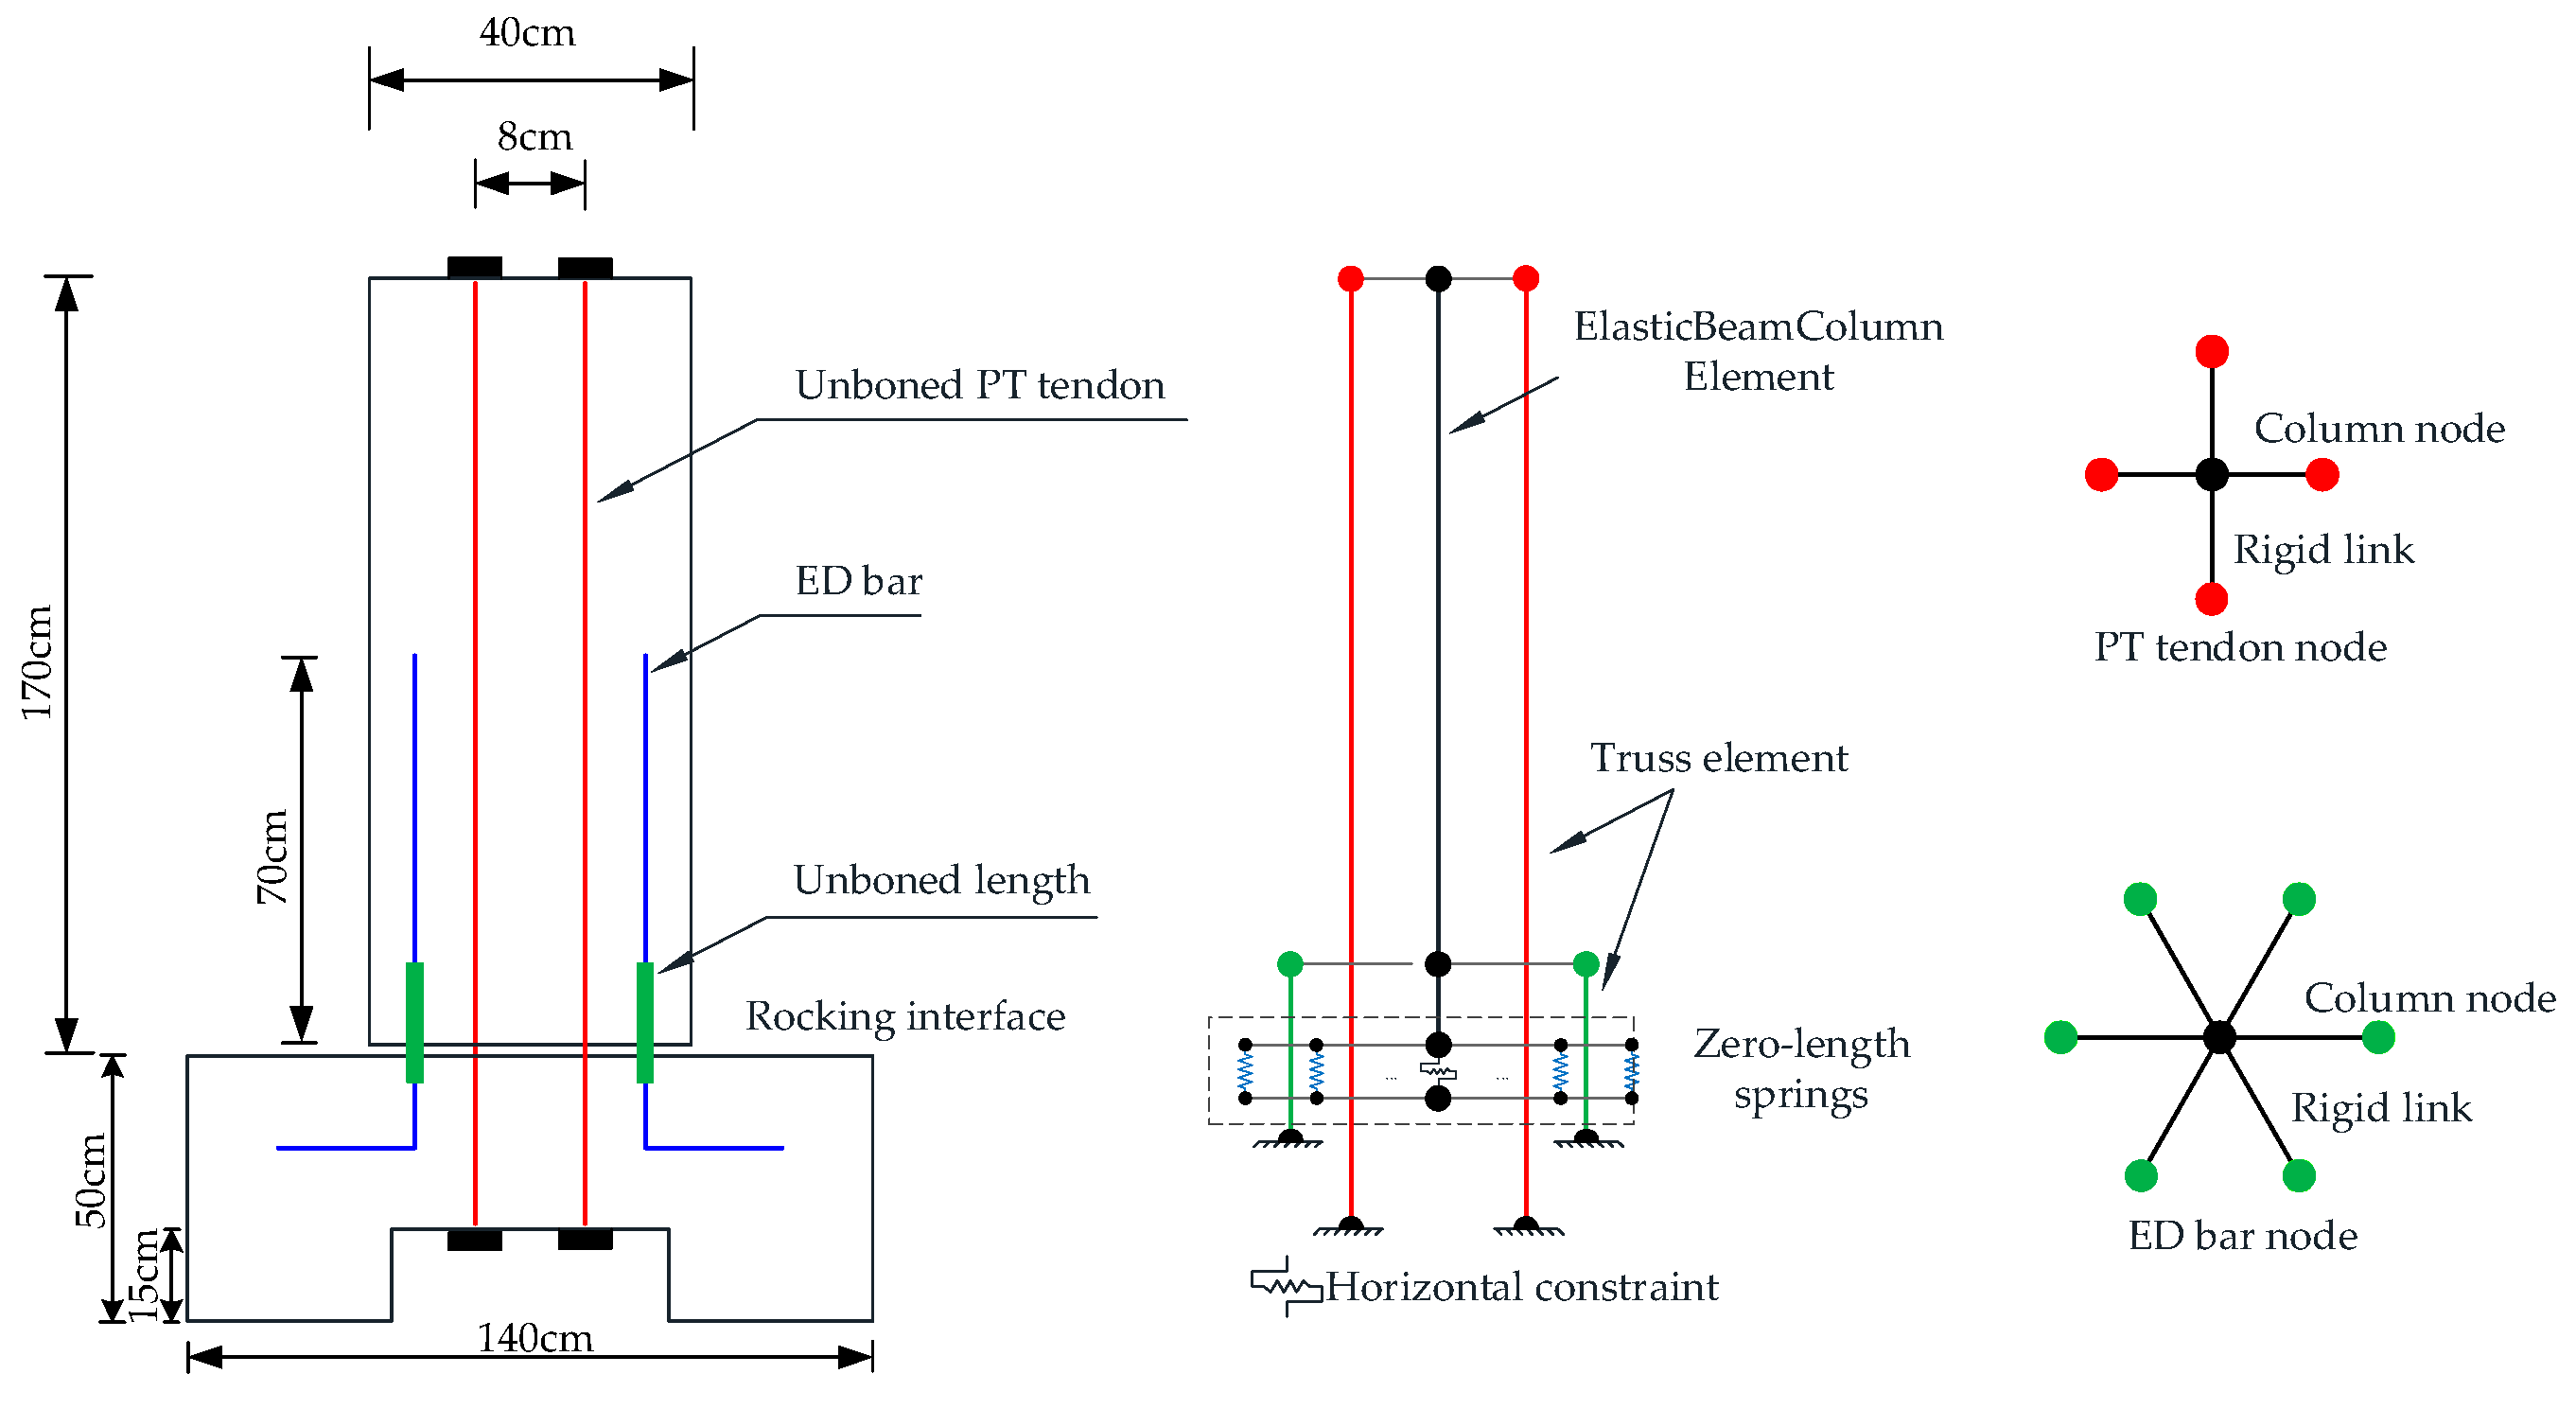
2. Simulation of RSC Columns

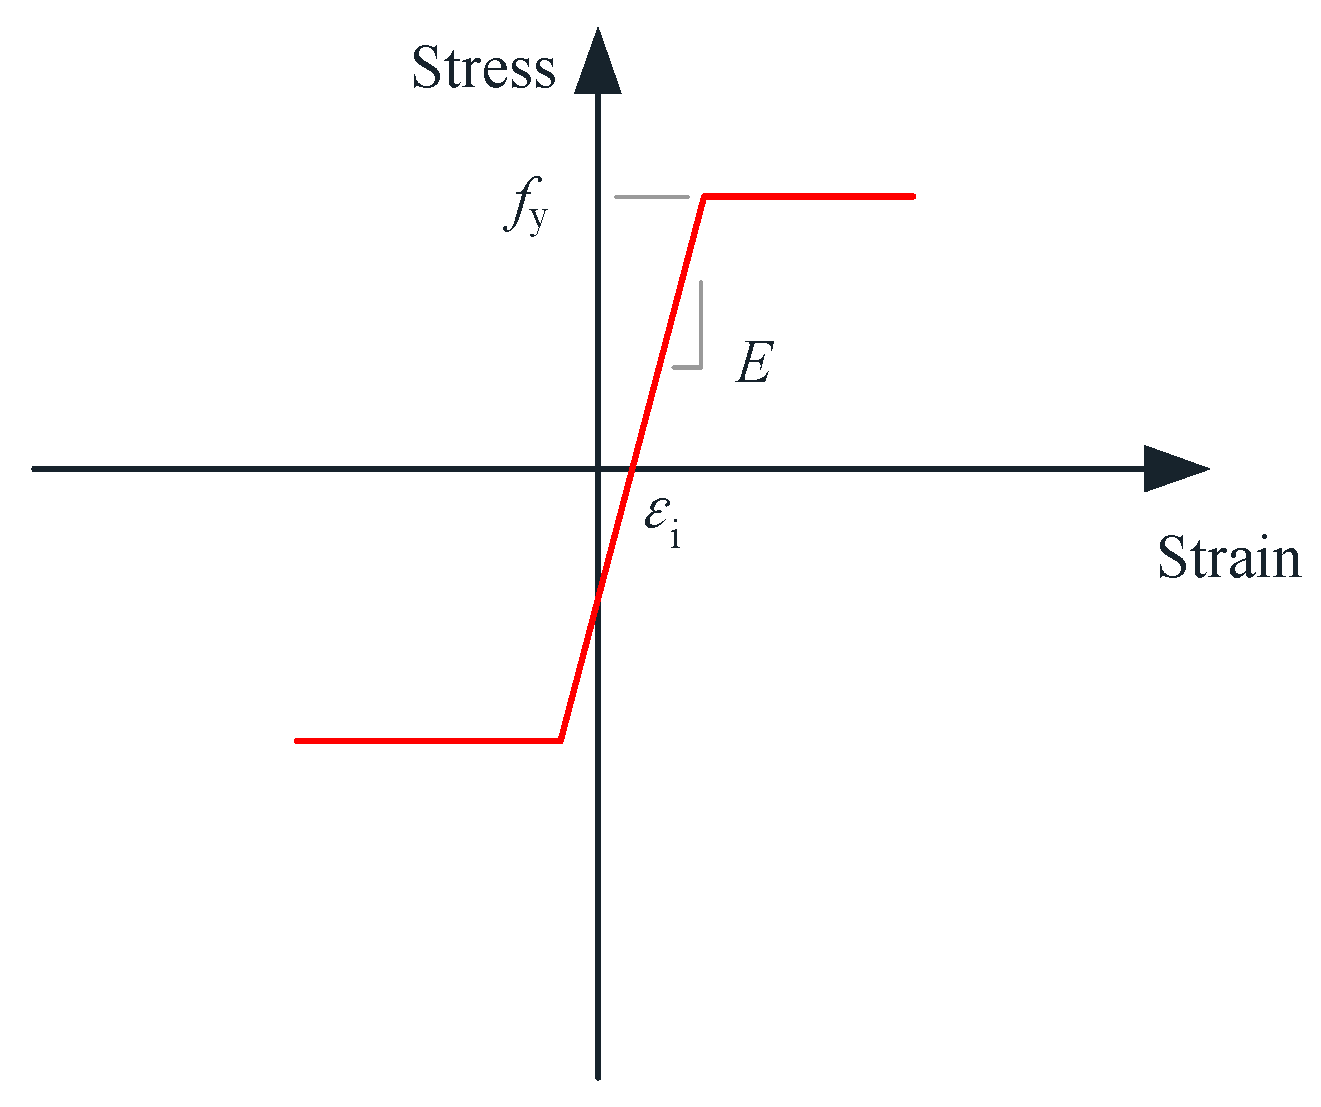
2.1. Simulation Method

To capture the hysteretic behavior of RSC columns, a numerical model was established using OpenSees. Figure 1 shows the schematic of the numerical model. The bottom segment of the structural element underwent consolidation treatment to enhance its integrity. A rigid connecting arm was employed to couple the degrees of freedom between the top node of the element and the corresponding pier node, ensuring synchronized deformation between the prestressed tendons and the pier structure. The displacement mechanism of RSC (reinforced self-consolidating) columns is predominantly governed by rigid body rotation. While minor bending deformations may occur prior to column uplift during loading phases, their contribution to the overall response remains negligible. Consequently, the adoption of elastic beam–column elements provides an appropriate and efficient modeling approach for capturing the structural behavior under consideration. This simplified approach has been used in previous studies [36,37]. A lumped mass was applied at the pier top to represent the gravity load, and a horizontal constraint was set at the bottom to prevent a relative slide between the column and the foundation. Corotational truss elements composed of elastic–perfectly plastic material were considered to model the force displacement of the unbonded post-tensioning (PT) tendons. The bottom nodes of the tendons were fixed, and the top nodes were connected to the corresponding column node with rigid links. A similar simulation method was adopted to model the unbonded segments of the energy dissipation (ED) bars. Truss elements with reinforcing steel material were used to model the ED bars, and the ultimate stress was set to 1.35 times the yield stress fy [38]. The ratio of the tangent at initial strain hardening to the initial elastic tangent can be set to 0.01–0.05 [31]; 0.03 was selected in this study. The ratio of strain corresponding to the initial strain hardening to the yield strain can be set to 3–5 [31]; 3 was selected in this study, and the ultimate strain can be set to 0.1 [39].
The stress–strain relationship of unbonded prestressed tendons was simulated by elasticPP (elastic–perfectly plastic) uniaxial material, and its material constitutive relationship is shown in Figure 2, where fpy is the yield strength of prestressed tendons, E is the elastic modulus, and εi is the initial strain. Its value can be calculated from the initial pretension force.
The total unbonded length of ED bars in the numerical model, Lub, consists of two parts. One is the designed unbonded length (L0), which can prevent the early fracture of ED bars, the other is the equivalent unbonded length (Leu) caused by the strain penetration. The Lub can be expressed as:
L u b = L 0 + L e u
If Leu = 0, the value of Lub is minimum; thus, the stress of ED bars is largest at the same lateral displacement. As a result, the strength of an RSC column will be overestimated. The value of Leu is significant, but it is difficult to determine its value precisely because of the complexity of the strain penetration. For example, Mantawy et al. [40] suggested the adoption of an iterative method to determine the value of Lub. The trial value of Lub continues to increase until the correct bridge stiffness is calibrated.
Some formulas of Leu can be found in studies related to the analytical pushover method for RSC columns [41,42]. According to the monolithic beam analogy, the strain of ED bars can be expressed as follows [41]:
ε s = [ ( Δ + 2 / 3 l s p α ε y ) ] ( L 0 + 2 l s p ) Δ ( L 0 + 2 l s p )
where Δ is the elongation of an ED bar due to the opening of the joint; εy is the yield strain of ED bars; α is the ratio of elastic strain and yield strain in reinforcement; lsp is the strain penetration taken as 0.022fydb, and fy and db are the yield stress and diameter of ED bars, respectively. All units are in MPa and mm. From Equation (2), Leu can be calculated as:
L e u = 2 l s p = 2 × 0.022 f y d b
In Bu’s study, Leu is calculated with Equation (4) [36].
L e u = 0 ,   f s f y 2.1 × ( f s f y ) ( f g ) 1.5 d b ,   f s > f y
where fs is the stress of ED bars and fg is the compression strength of grout.
By trial calculation, it can be found that the calculated results obtained from Equation (3) are generally much larger than the results of Equation (4). Therefore, Equation (3) is used to determine the maximum value of Lub. Though the precise value of Lub is hard to determine, the range of Lub can be estimated by Equation (5). Subsequently, the influence of Lub on residual displacement will be discussed.
Min L u b = L 0 < L u b < L 0 + 2 × 0.022 f y d b = Max L u b
Several compression-only springs are used to model the opening and closing of the bottom rocking interface. Generally, the simulation result will gradually become stable as the number of springs increases. These springs are uniformly distributed with equal spacing, and all springs have the same axial stiffness. The axial stiffness, k, can be calculated as [29]:
k = 2 E c A g n H
where E c = 4700 f c is the elastic modulus of the concrete; fc′ is the concrete compressive strength [36]; Ag is the gross area of the column section; H is the column height; and n is the number of zero-length springs.

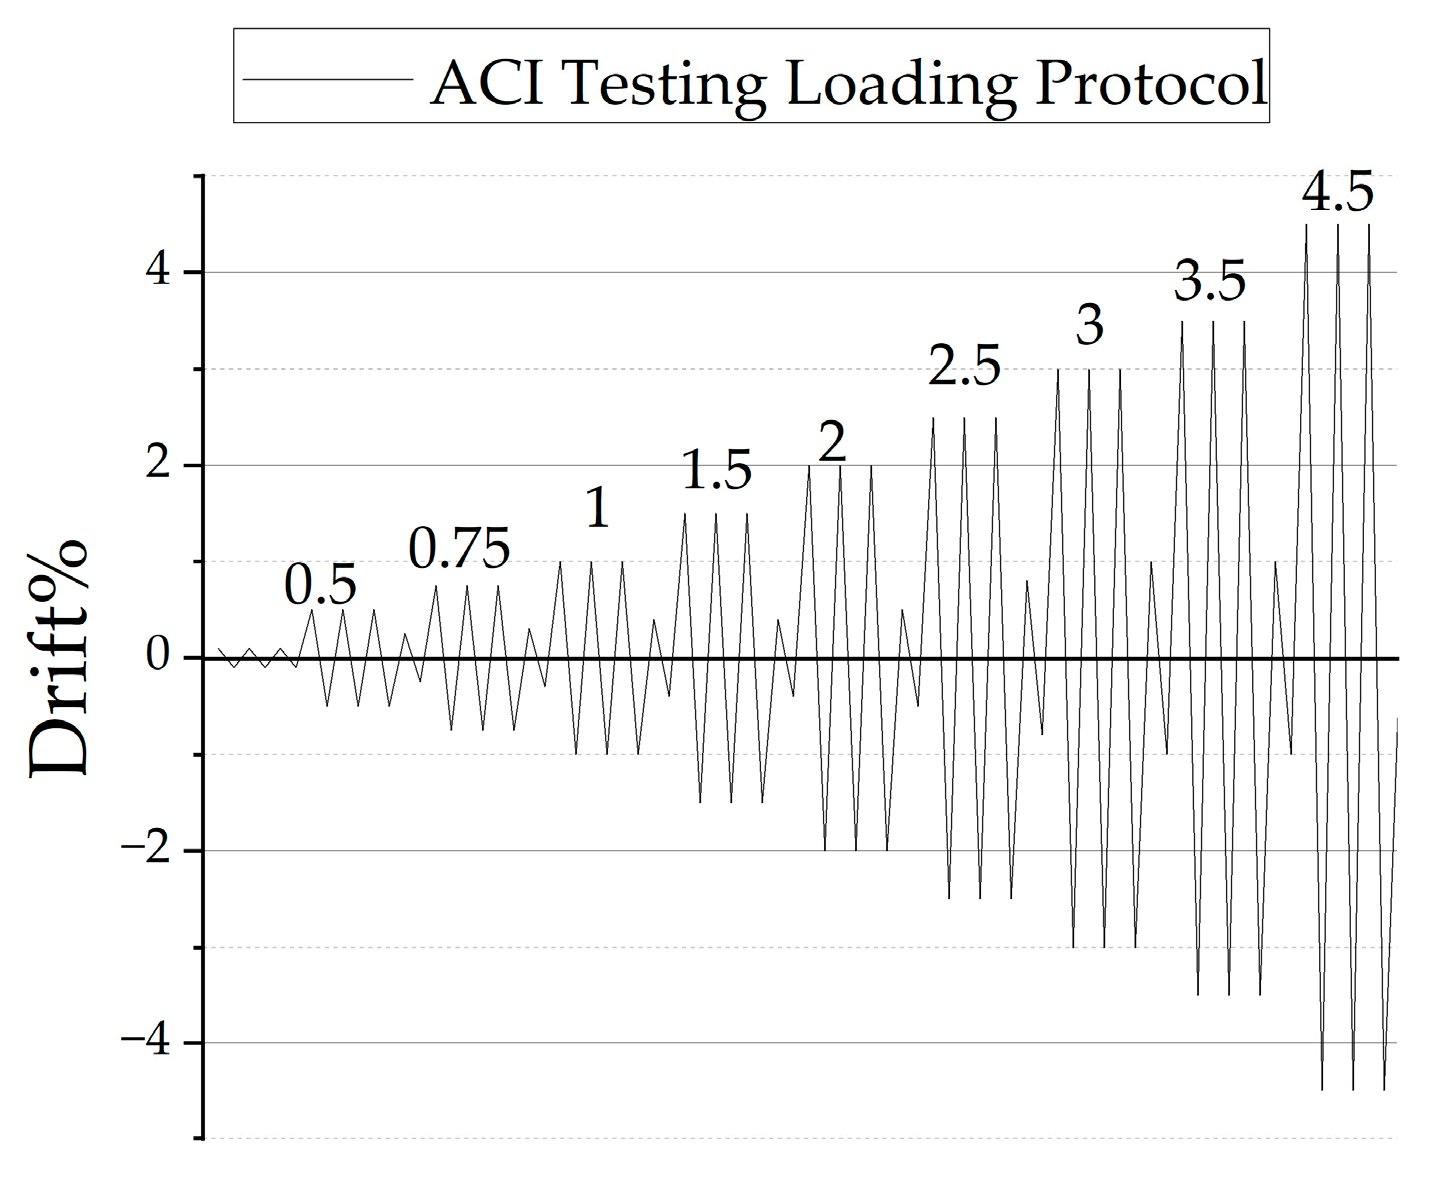
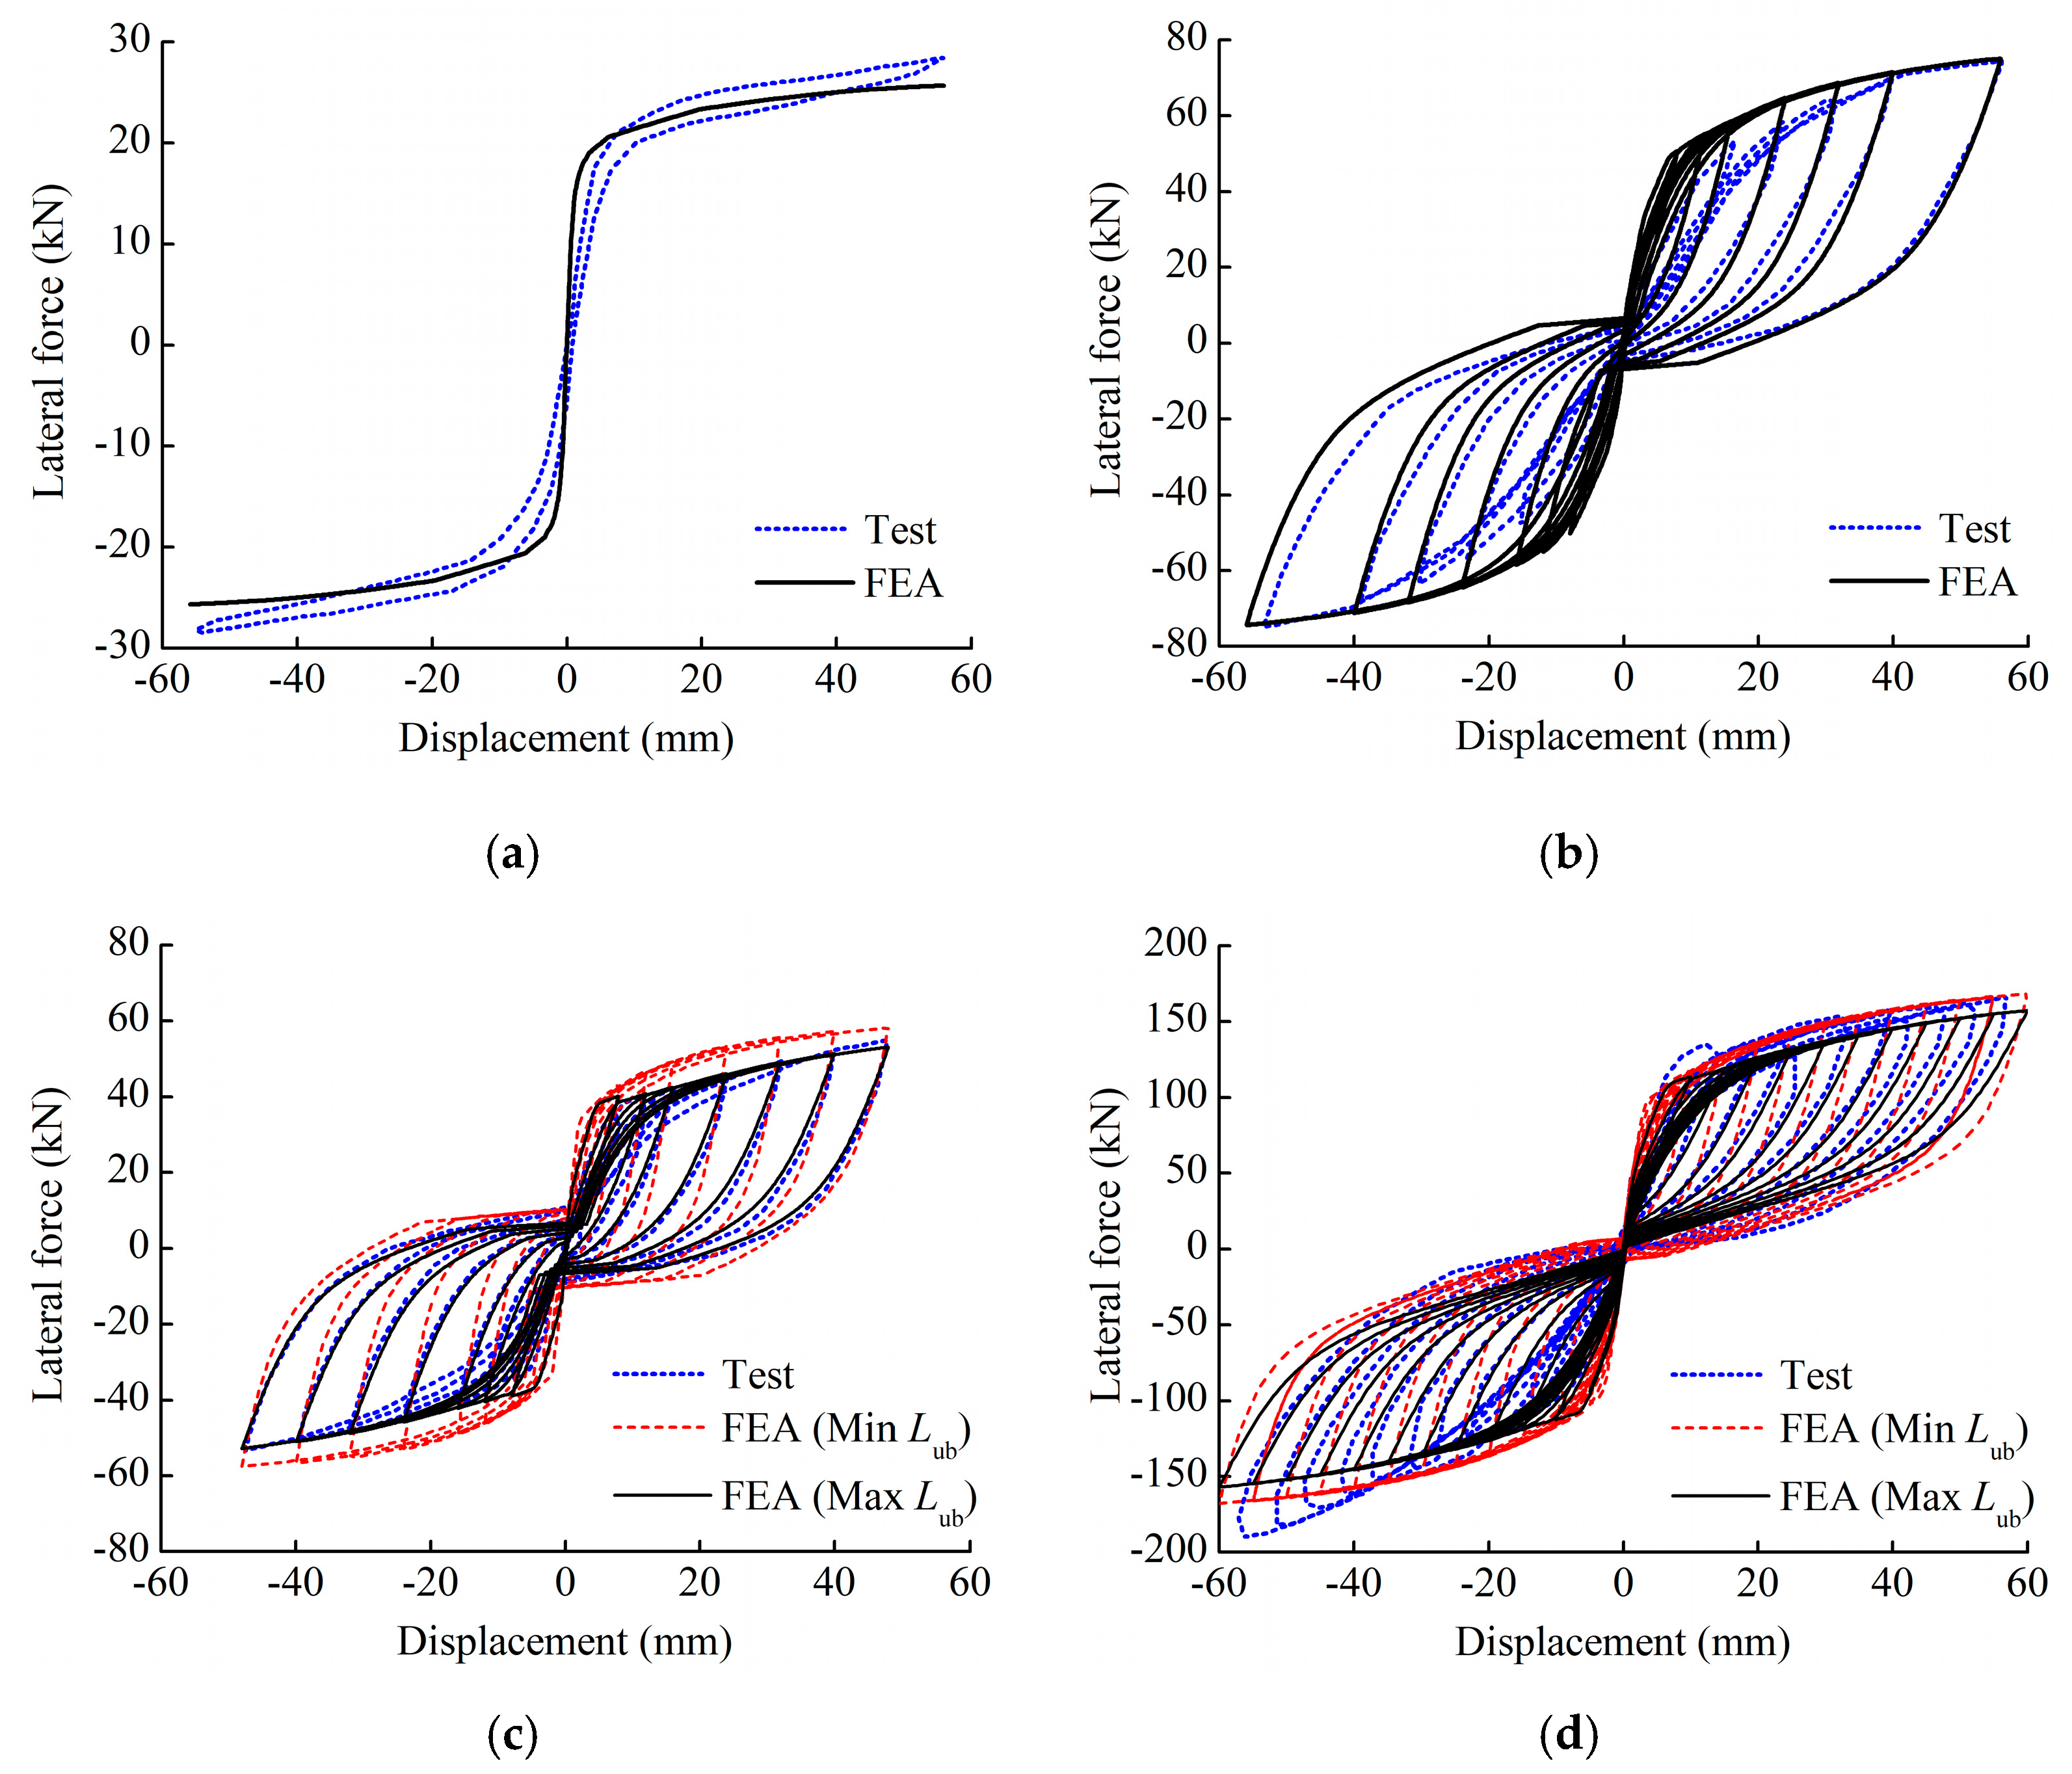
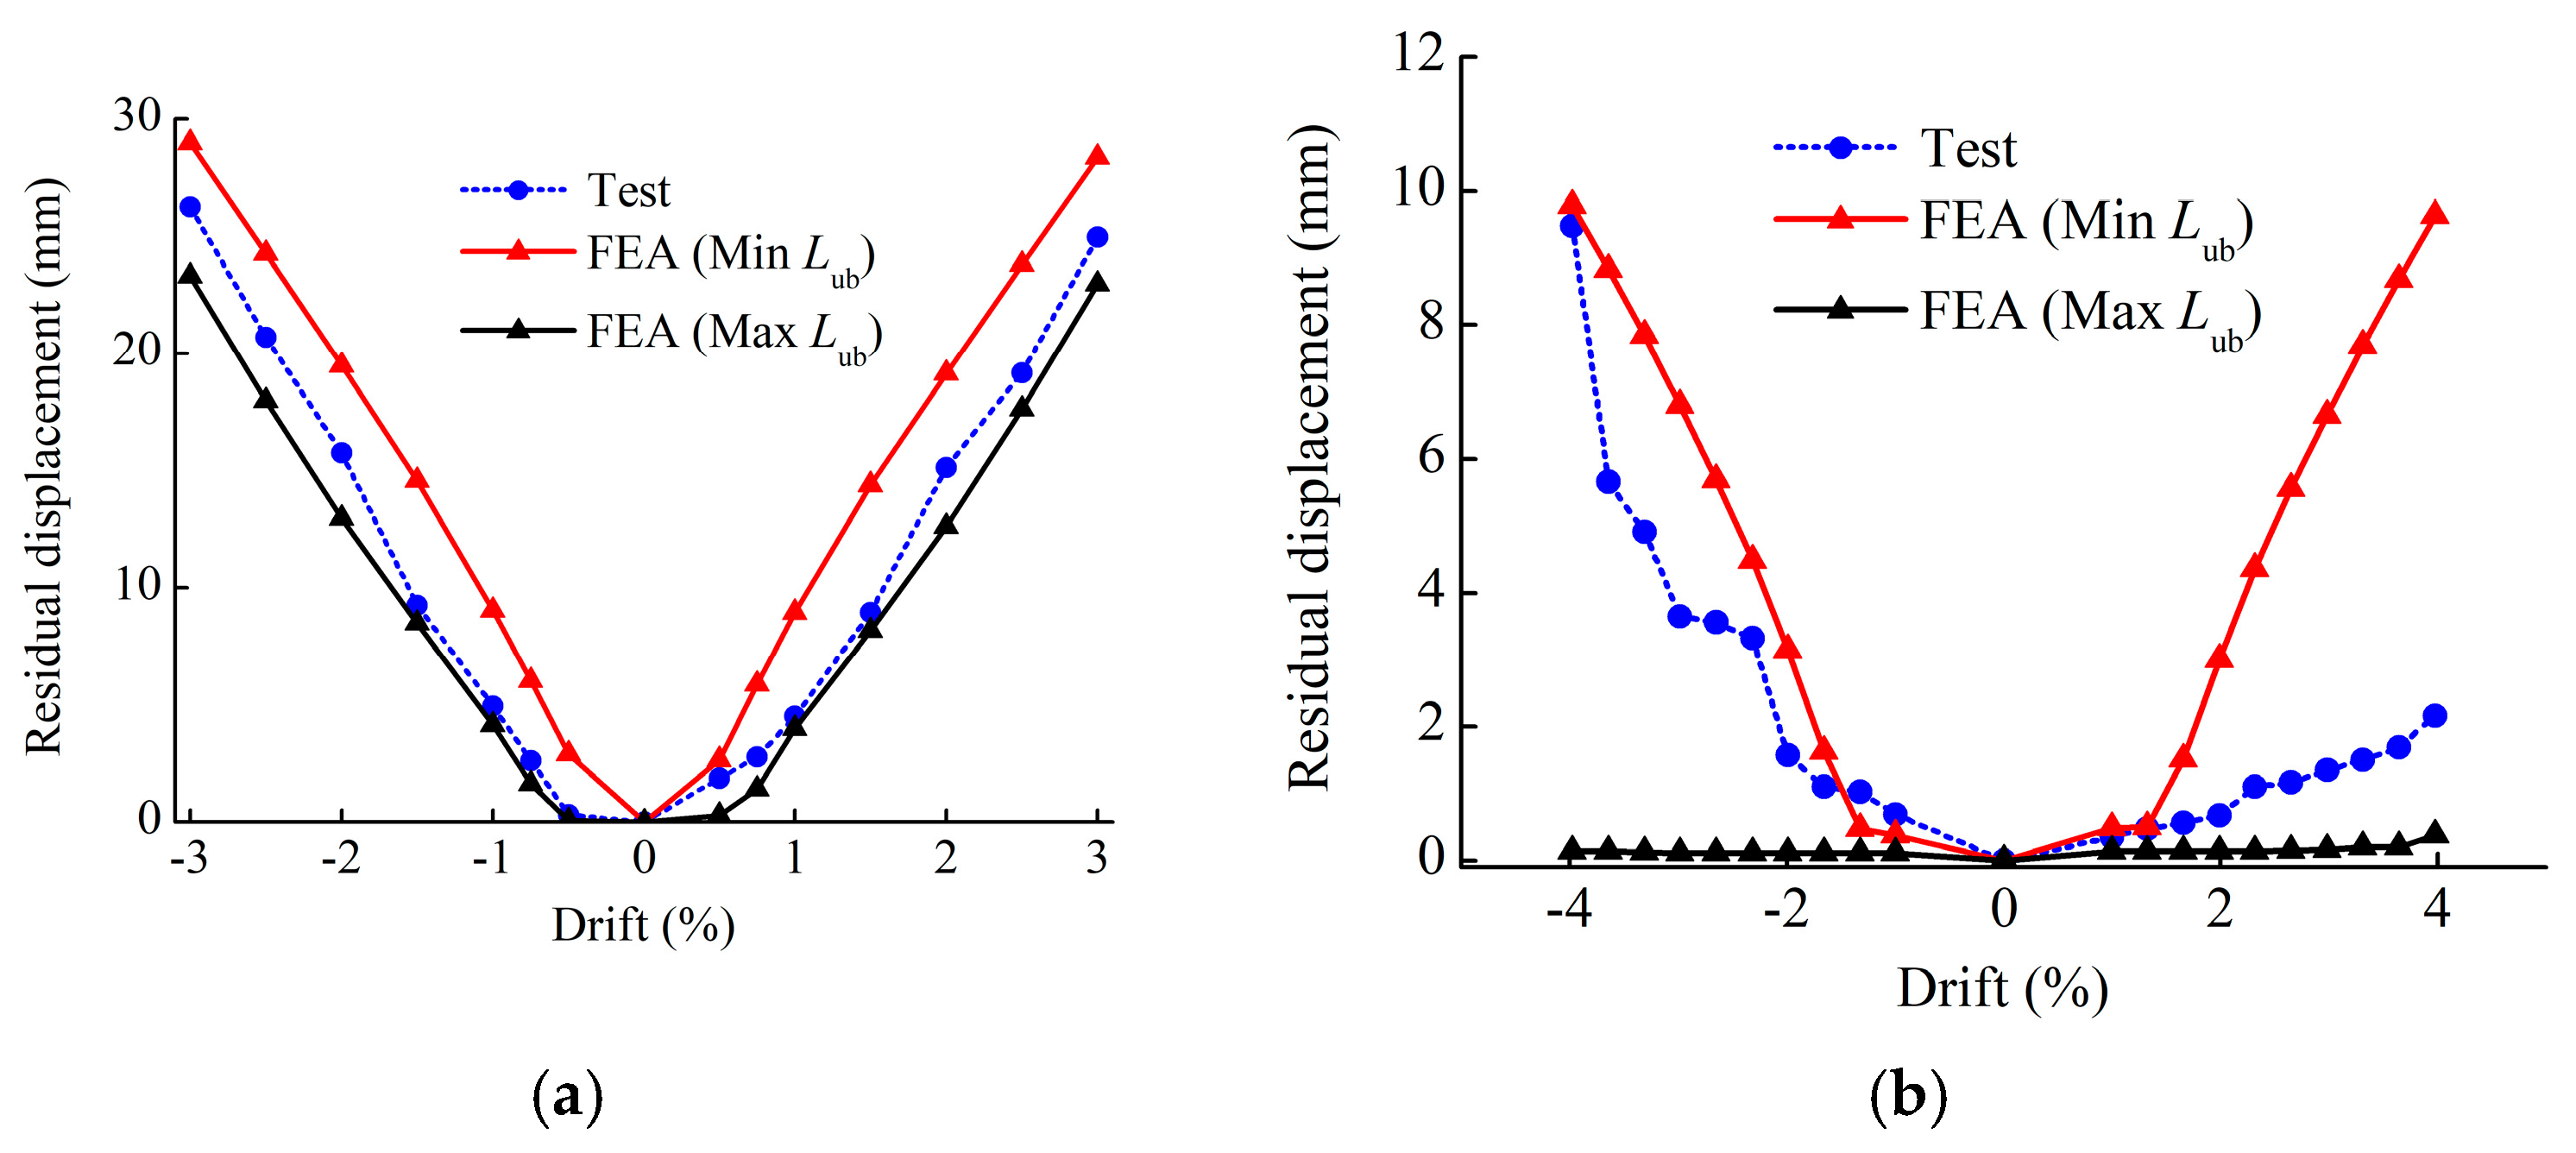
2.2. Model Validation

In order to validate the simulation method, four RSC bridge pier specimens are selected [5,43], as reported in Table 1. PT1 has no dissipation elements; it can be used to confirm the effectiveness of the modeling methods for all components in addition to ED bars. HBD2 chooses the reinforcing steel with a fuse length as the dissipation element. HBD1 and s-SCP(I-ED) dissipate energy via the internal reinforcing steel; the corresponding unbonded lengths are 50 mm and 100 mm, respectively. More detailed information about these specimens can be found in references [5,43].
Since there are few dynamic tests on RSC piers, the accuracy of the numerical model is mainly verified by comparing the hysteresis curve under a static load. Figure 3 shows the loading mode of a quasi-static load.
As shown in Figure 4, the numerical hysteretic curves are compared with the test results. For specimen PT1, as shown in Figure 4a, the simulated initial stiffness is slightly larger than the test result, and the simulated strength is slightly lower. In addition, because the elastic beam–column element is adopted to model the column, the simulated hysteretic curve is unable to reflect the low energy dissipation during the cyclic loading. On the whole, the FEA result matches well with the test result, which suggests that the simulation techniques, except for those using ED bars, are effective.
Because the reinforcing steel in specimen HBD2 has a fuse length of 50 mm, the strain will be concentrated on the fuse segment; therefore, Lub is set to 50 mm. The hysteretic curve based on FEA is plotted in Figure 4b. As for specimens HBD1 and s-SCP(I-ED), detailed comparisons between test and simulation results are presented in Figure 4c,d. The red and black curves represent the simulation results corresponding to the minimum Lub and the maximum Lub, respectively. The lateral strength of the red curves is slightly larger than the black curves because a smaller Lub will generate a larger strain under the same joint opening. A larger strain leads to a larger dissipation force. As a result, the lateral strength is improved. Meanwhile, the residual displacement per loop of the red curves is also larger than the black curves. Detailed comparisons are plotted in Figure 4. On the one hand, this phenomenon can be explained from the perspective of a larger dissipation force, which weakens the self-centering capacity of the piers. On the other hand, the increase in Lub will significantly decrease the slope of the unloading path and thus diminish the residual displacement, as shown in Figure 4c,d. The latter reason is more important because the improvement in dissipation force is very limited.
Based on the above analysis and Figure 5, it can be concluded that the proposed simulation method is effective. However, there is uncertainty regarding Lub in the modeling process. A conservative result for residual displacement will be obtained, in general, if the strain penetration is not considered, and it is highly possible to underestimate the residual displacement if Equation (3) is used to calculate the equivalent unbonded length.

3. Governing Design Parameters for Residual Displacement

Two design parameters, the SC factor and ED parameter, are believed to have a governing influence on the residual displacement.

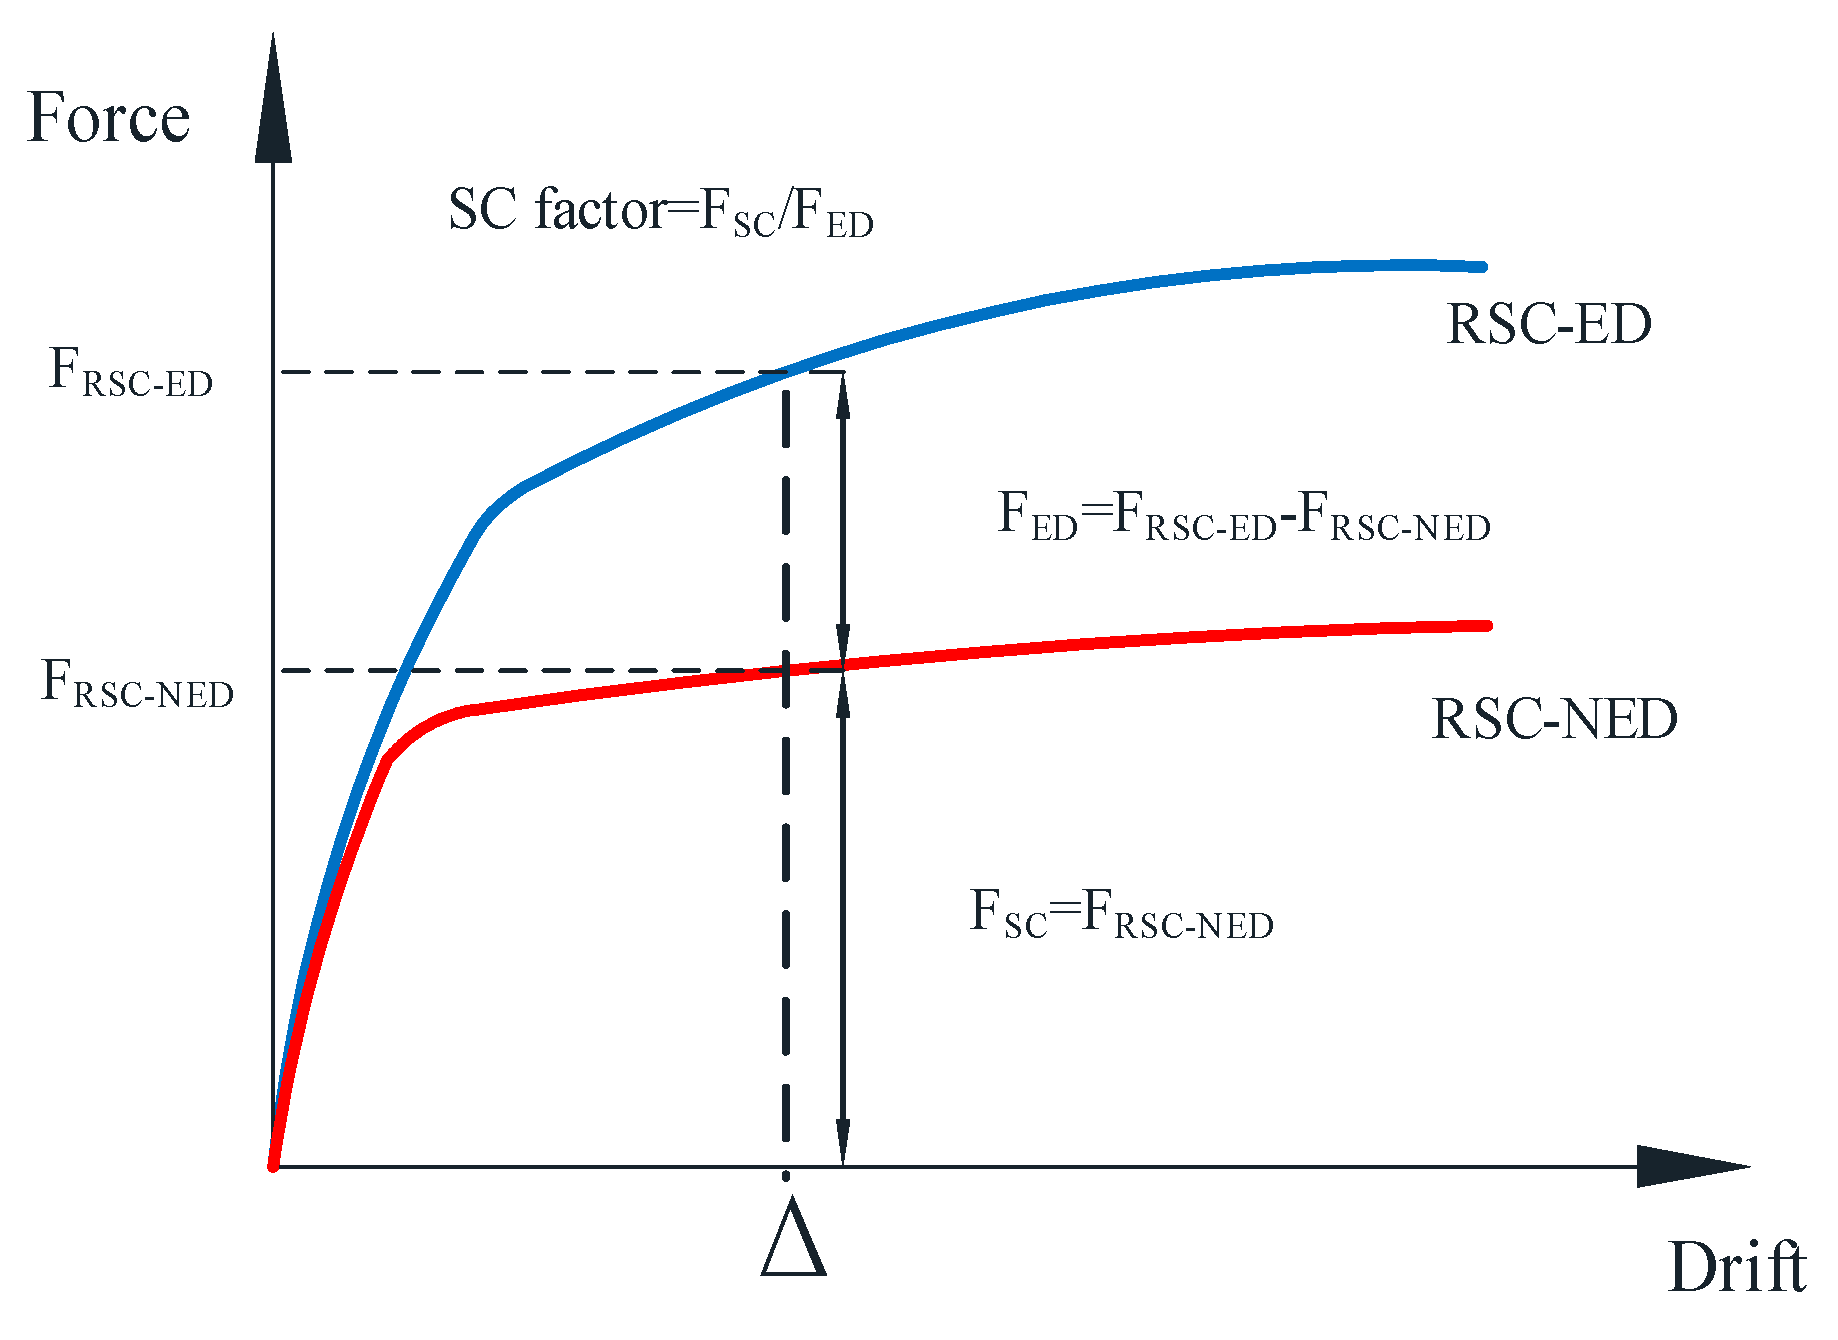
3.1. Definition and Calculation of SC Factor

Several researchers have put forward different SC factors for evaluating the self-centering capacity of RSC columns. Hieber et al. [44] proposed a recentering ratio that is equal to the ratio between the total axial force (including the gravity force and initial prestressing force) and the yielding force of ED bars. The self-centering capacity of bridge columns at different displacements is usually different, while the recentering ratio is constant for an RSC column.
The contribution ratio λSC is another SC factor, and it is typically adopted in the design of RSC systems [9,33]. λSC, in its generic form, represents the force or moment ratio between the self-centering contribution and the energy dissipation contribution, as shown in Equation (7):
λ S C = M self-centering M dissipation = F self-centering F dissipation
The self-centering and energy dissipation contribution can be derived from the monolithic beam analogy procedure [41]. However, the iterative calculation process is still relatively complicated. What is more, λSC is obtained from theoretical calculation, while the residual displacement is determined by simulation. In order to reduce error, it is better to use the simulation method to measure the self-centering performance index. For this reason, the SC factor λSC used in this study is defined as follows:
λ S C = F S C F E D
where FSC is the self-centering contribution provided by gravity load and PT tendons, and FED is the energy dissipation contribution provided by ED bars. As shown in Figure 6, the calculation of λSC requires the following two steps:
  • Step 1: Establish the numerical model of the RSC-ED columns and conduct a pushover analysis; then, the force-displacement curve can be obtained. The force FRSC-ED includes the self-centering and energy dissipation contribution.
  • Step 2: Delete the ED bar elements from the existing numerical model of the RSC-ED column. The corresponding numerical model of an RSC-NED pier is obtained. Then, perform a pushover analysis again. As a result, a force-displacement curve that only contains the self-centering contribution will be obtained. Therefore, the energy dissipation contribution FED can be derived as:
F E D = F R S C - E D F R S C - N E D

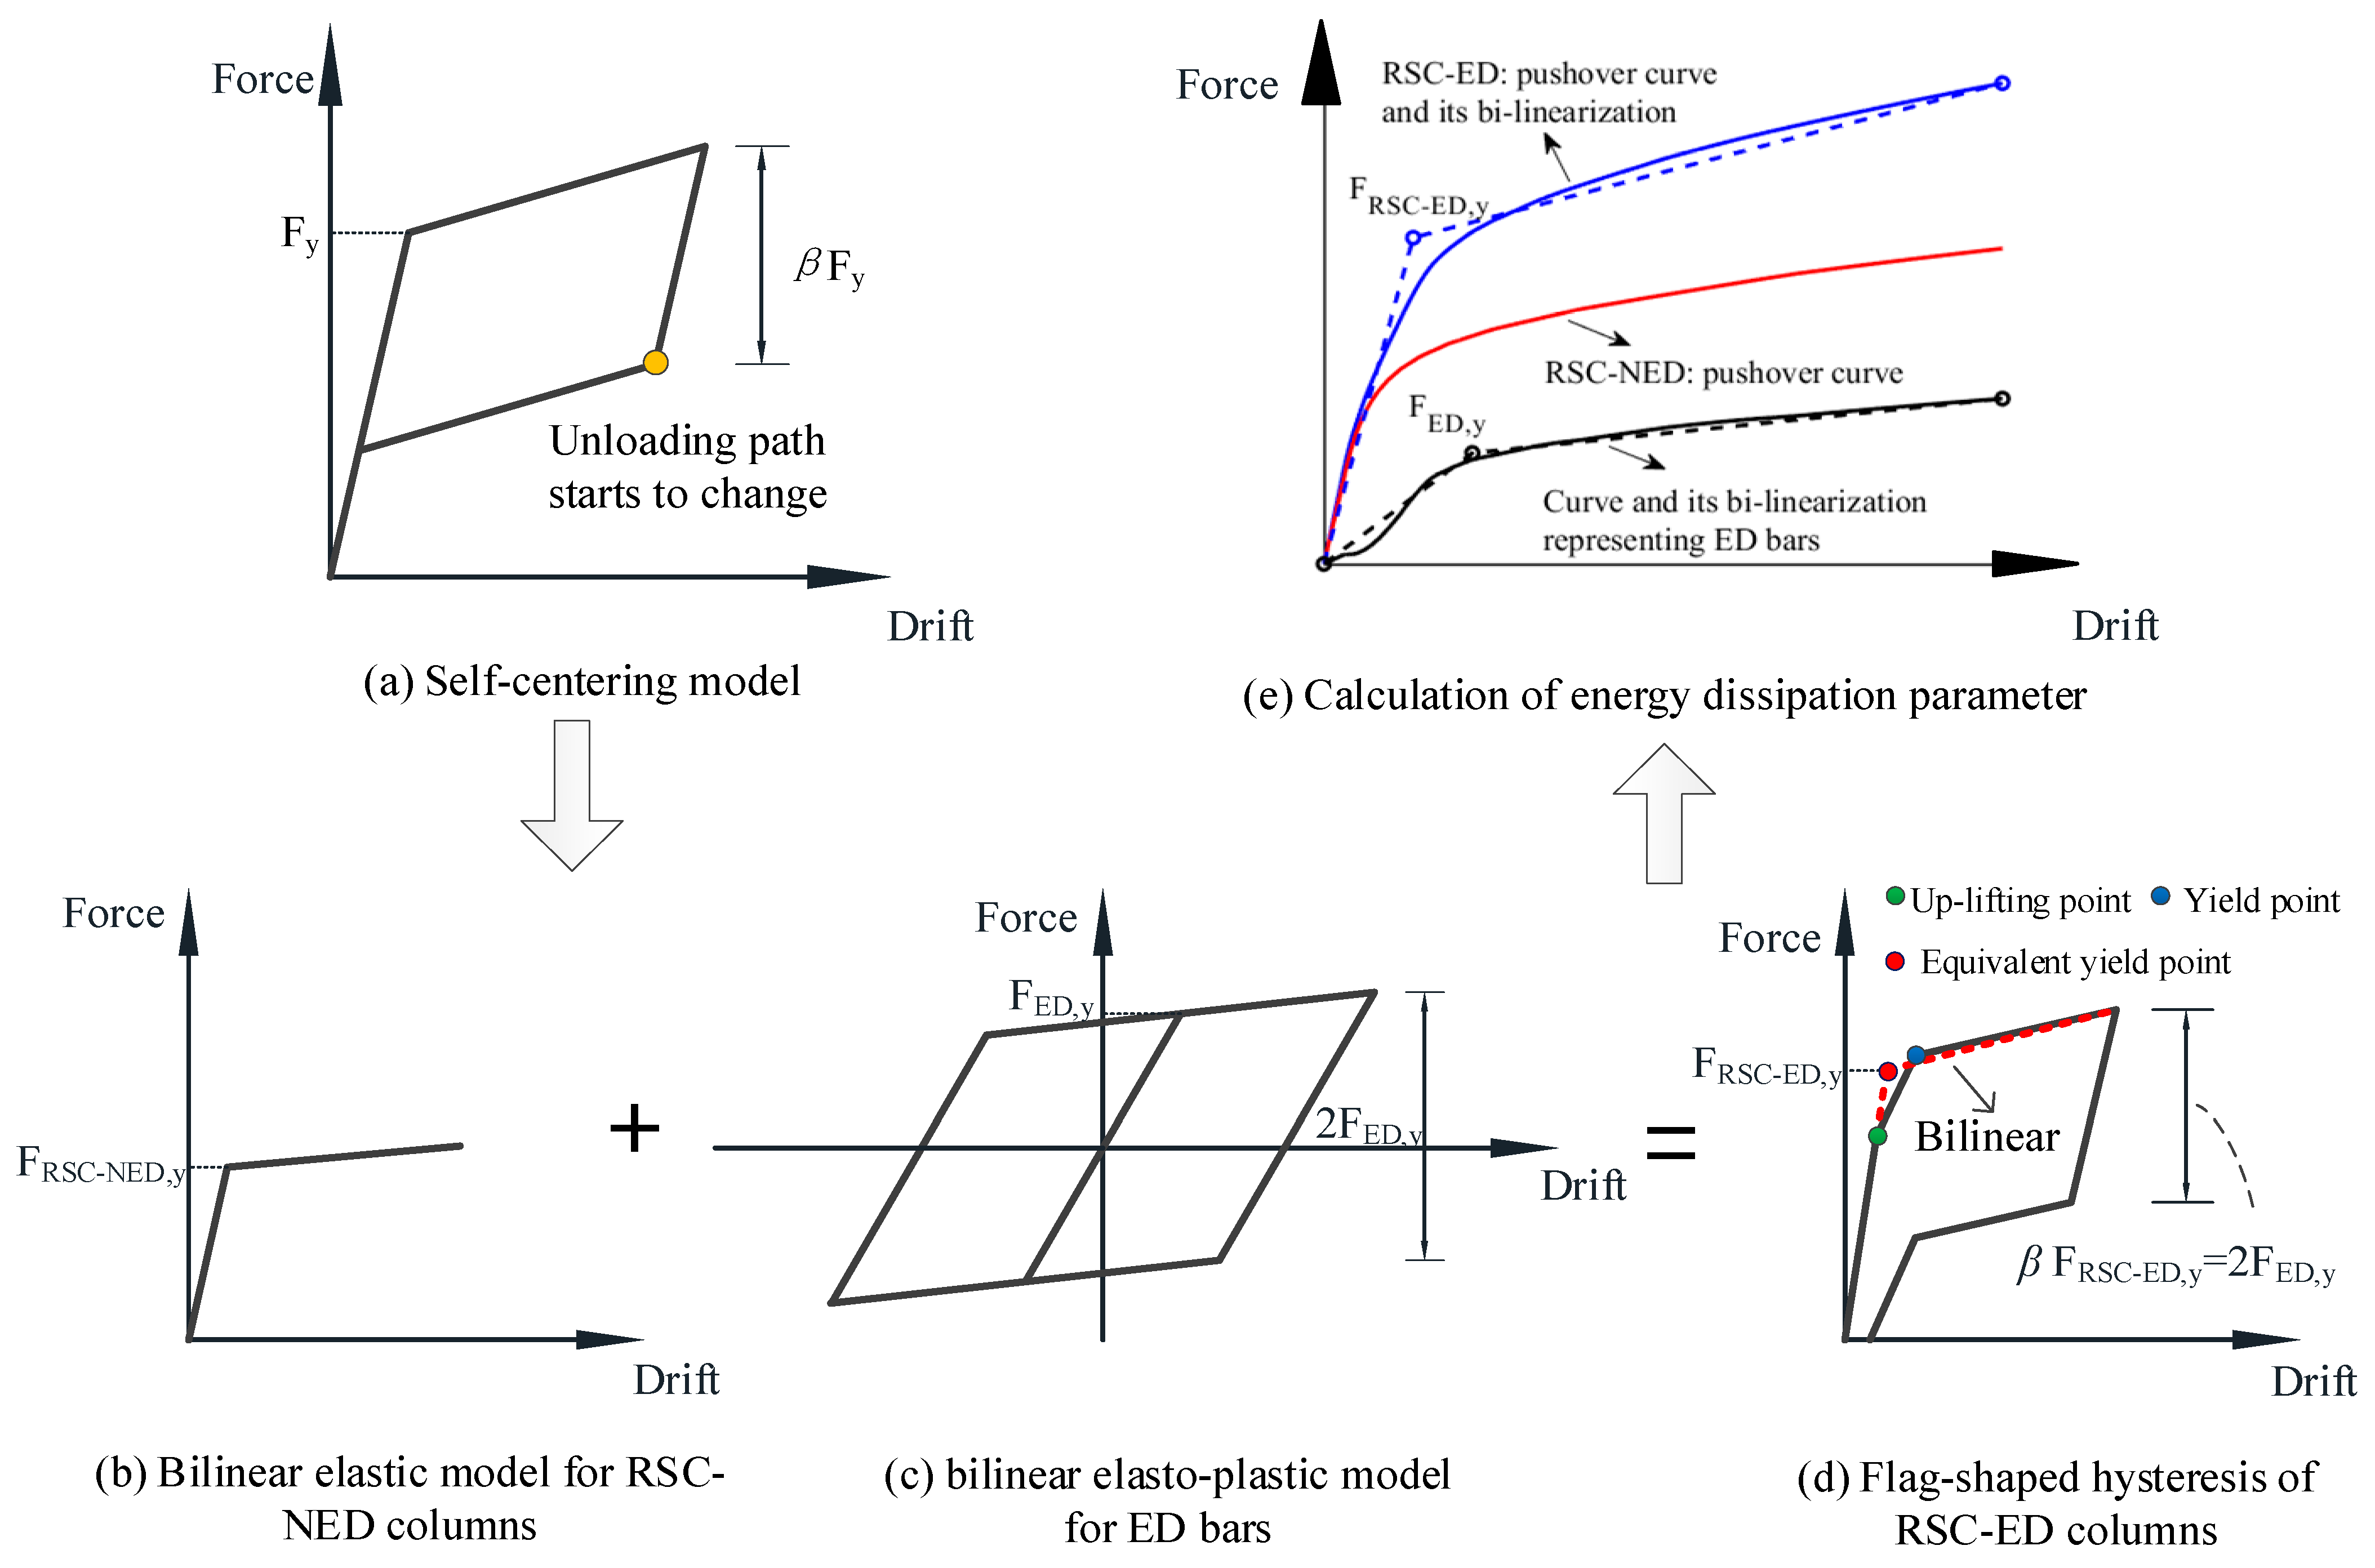
3.2. Definition and Calculation of ED Parameter

The second governing design parameter is the ED parameter. The cyclic behavior of RSC columns can be simplified into a flag-shaped hysteretic model, as shown in Figure 7a. The ED parameter β is a significant parameter in this model. This integrated methodology achieves two objectives: firstly, it rigorously quantifies the hysteretic energy dissipation capacity within self-centering structural elements, and, secondly, it strategically governs the critical transition point along the unloading trajectory through targeted control mechanisms. The smaller the ED parameter is, the earlier the unloading path changes, leading to lower residual displacement. Hence, it can be predicted that the ED parameter has a non-ignorable influence on residual displacement; recent studies related to the residual displacement of RSC systems did not consider this [2,3,4].
The self-centering model is so ideal that it is unable, in fact, to capture residual displacement. Implementing two rotational springs in parallel with appropriate hysteretic models is another simplified simulation method. The RSC column without ED bars is modeled by a bilinear elastic model, as shown in Figure 7b. The ED bar is simulated using a bilinear elastoplastic model, as shown in Figure 7c. With the coaction of the two springs, the RSC column presents a trilinear skeleton curve. To be precise, there is a reduction in stiffness after the column is lifted. Since the reduction in stiffness is very slight, the skeleton curve can be approximated to a bilinear one.
To extract the ED parameter, an equivalent linearization method is used. The ED parameter can be calculated as:
β = 2 F E D , y F R S C - E D , y
where FED,y is the yielding force of the bilinear elastoplastic model and FRSC-ED,y is the effective yielding strength of the bridge column, as shown in Figure 7d.
Equation (10) can be expressed approximately as:
β 2 F E D , y F E D , y + F R S C - N E D , y = 2 1 + F R S C - N E D , y / F E D , y = 2 1 + λ S C , y
where FRSC-NED,y is the yielding force of the bilinear elastic model and λSC,y is the SC factor that corresponds to the yield displacement. It can be found that the value of β is relatively stable, and it is smaller than 1 when the value of λSC,y exceeds 1. As shown in Figure 7e, the calculation of β requires the following two steps:
  • Step 1: Establish the FE model of an RSC-ED column and perform a pushover analysis. Then, the obtained pushover curve is bilinearized according to the equal energy principle. As a result, the parameter FRSC-ED,y can be determined.
  • Step 2: Delete the ED bar elements from the FE model and carry out a pushover analysis again. Then, the force–displacement curve representing the energy dissipation contribution can be plotted by subtraction. Conduct an equivalent linearization again, and the parameter FED,y is obtained.

4. Fractional Factorial Analysis

In the actual construction of RSC columns, the key design parameters are presented in the form of aspect ratio λ, concrete strength fc, PT tendon ratio ρPT, axial load ratio (ηG, ηPT) caused by gravity load PG and PT force PPT, ED bar ratio PED, yield stress of ED bars fy, and unbonded length L0. It should be noted that the non-dimensional parameters, the SC factor and ED parameter, can be regarded as the comprehensive embodiment of these key design parameters. This part of the study uses fractional factorial analysis to discuss the effect of each parameter on the SC factor and ED parameter at different displacements.

4.1. Design Parameters of Reference Specimen

In factorial analysis, the reference specimen RS selects the prototype of the specimen HBD1, and the specimen HBD1 is 1/3 scaled, but the design parameters of specimen RS are not strictly converted by a scale of 1:3 according to those of specimen HBD1, as shown in Table 2. For example, in order to ensure that the ED bars have an adequate deformation capacity at a larger loading displacement, the value of L0 of the specimen RS is set to 300 mm rather than 150 mm. The prototype pier of specimen HBD1 has a total mass of 180 t, but the gravity force was not applied in the test due to the limitation of the experimental prestressing. The value of PG of the specimen RS is 1800 kN. Meanwhile, PG will enhance the self-centering capacity of the specimen RS, which may lead to no residual displacement. Therefore, the value of PPT is set to 600 kN rather than 1800 kN.
Figure 8a shows the cross-section of the specimen RS. Each duct holds four PT tendons, and the diameter and tensile strength of each PT tendon are 15.2 mm and 1860 MPa, respectively. The PT tendon ratio can be easily adjusted by changing the number of PT tendons in each duct, and the ED bar ratio can be changed by altering the diameter of the ED bars in the following study. The hysteretic curve of the specimen RS is plotted in Figure 8b. For specimen HBD1, the simulation result corresponding to the maximum value of Lub matches better with the test result, as shown in Figure 4c. Thus, the maximum Lub is adopted in this part.

4.2. Two-Level Fractional Design

The purpose of this fractional factorial analysis is to evaluate the importance of the key design parameters to the residual displacement of RSC columns. Table 3 shows the key parameters and the two levels of each parameter. The ranges of the factors are determined by the investigation of 19 RSC column specimens [9,10,11,37]. The statistical results are also reported in Table 3. To prevent the PT tendon from yielding under cyclic loading, the value of Pd corresponding to its high level is set to 0.4, and the maximum loading displacement is 4%.
Factorial analysis is often used when multiple factors determine an output. However, full factorial analysis requires a great number of runs if many factors are taken into account, which may become computationally demanding. In this study, the analysis includes eight factors, and each factor has two levels. A complete factorial analysis requires 256 runs. In order to improve efficiency, one-eighth factorial analysis is performed, which decreases the number of runs required to a total of 32.
The approach that Montgomery proposed [45,46] is used to perform the fractional factorial analysis. The construction of a one-eighth factorial analysis consists of two parts. The first part is a basic design, which contains a complete fractional factorial combination (the first five columns in Table 4). The other part includes three generators (the last three columns in Table 4), which determine the factors that are not included in the basic design. − and + are the symbols for low level and high level, respectively. The levels of the last three factors are determined by using generating relations.

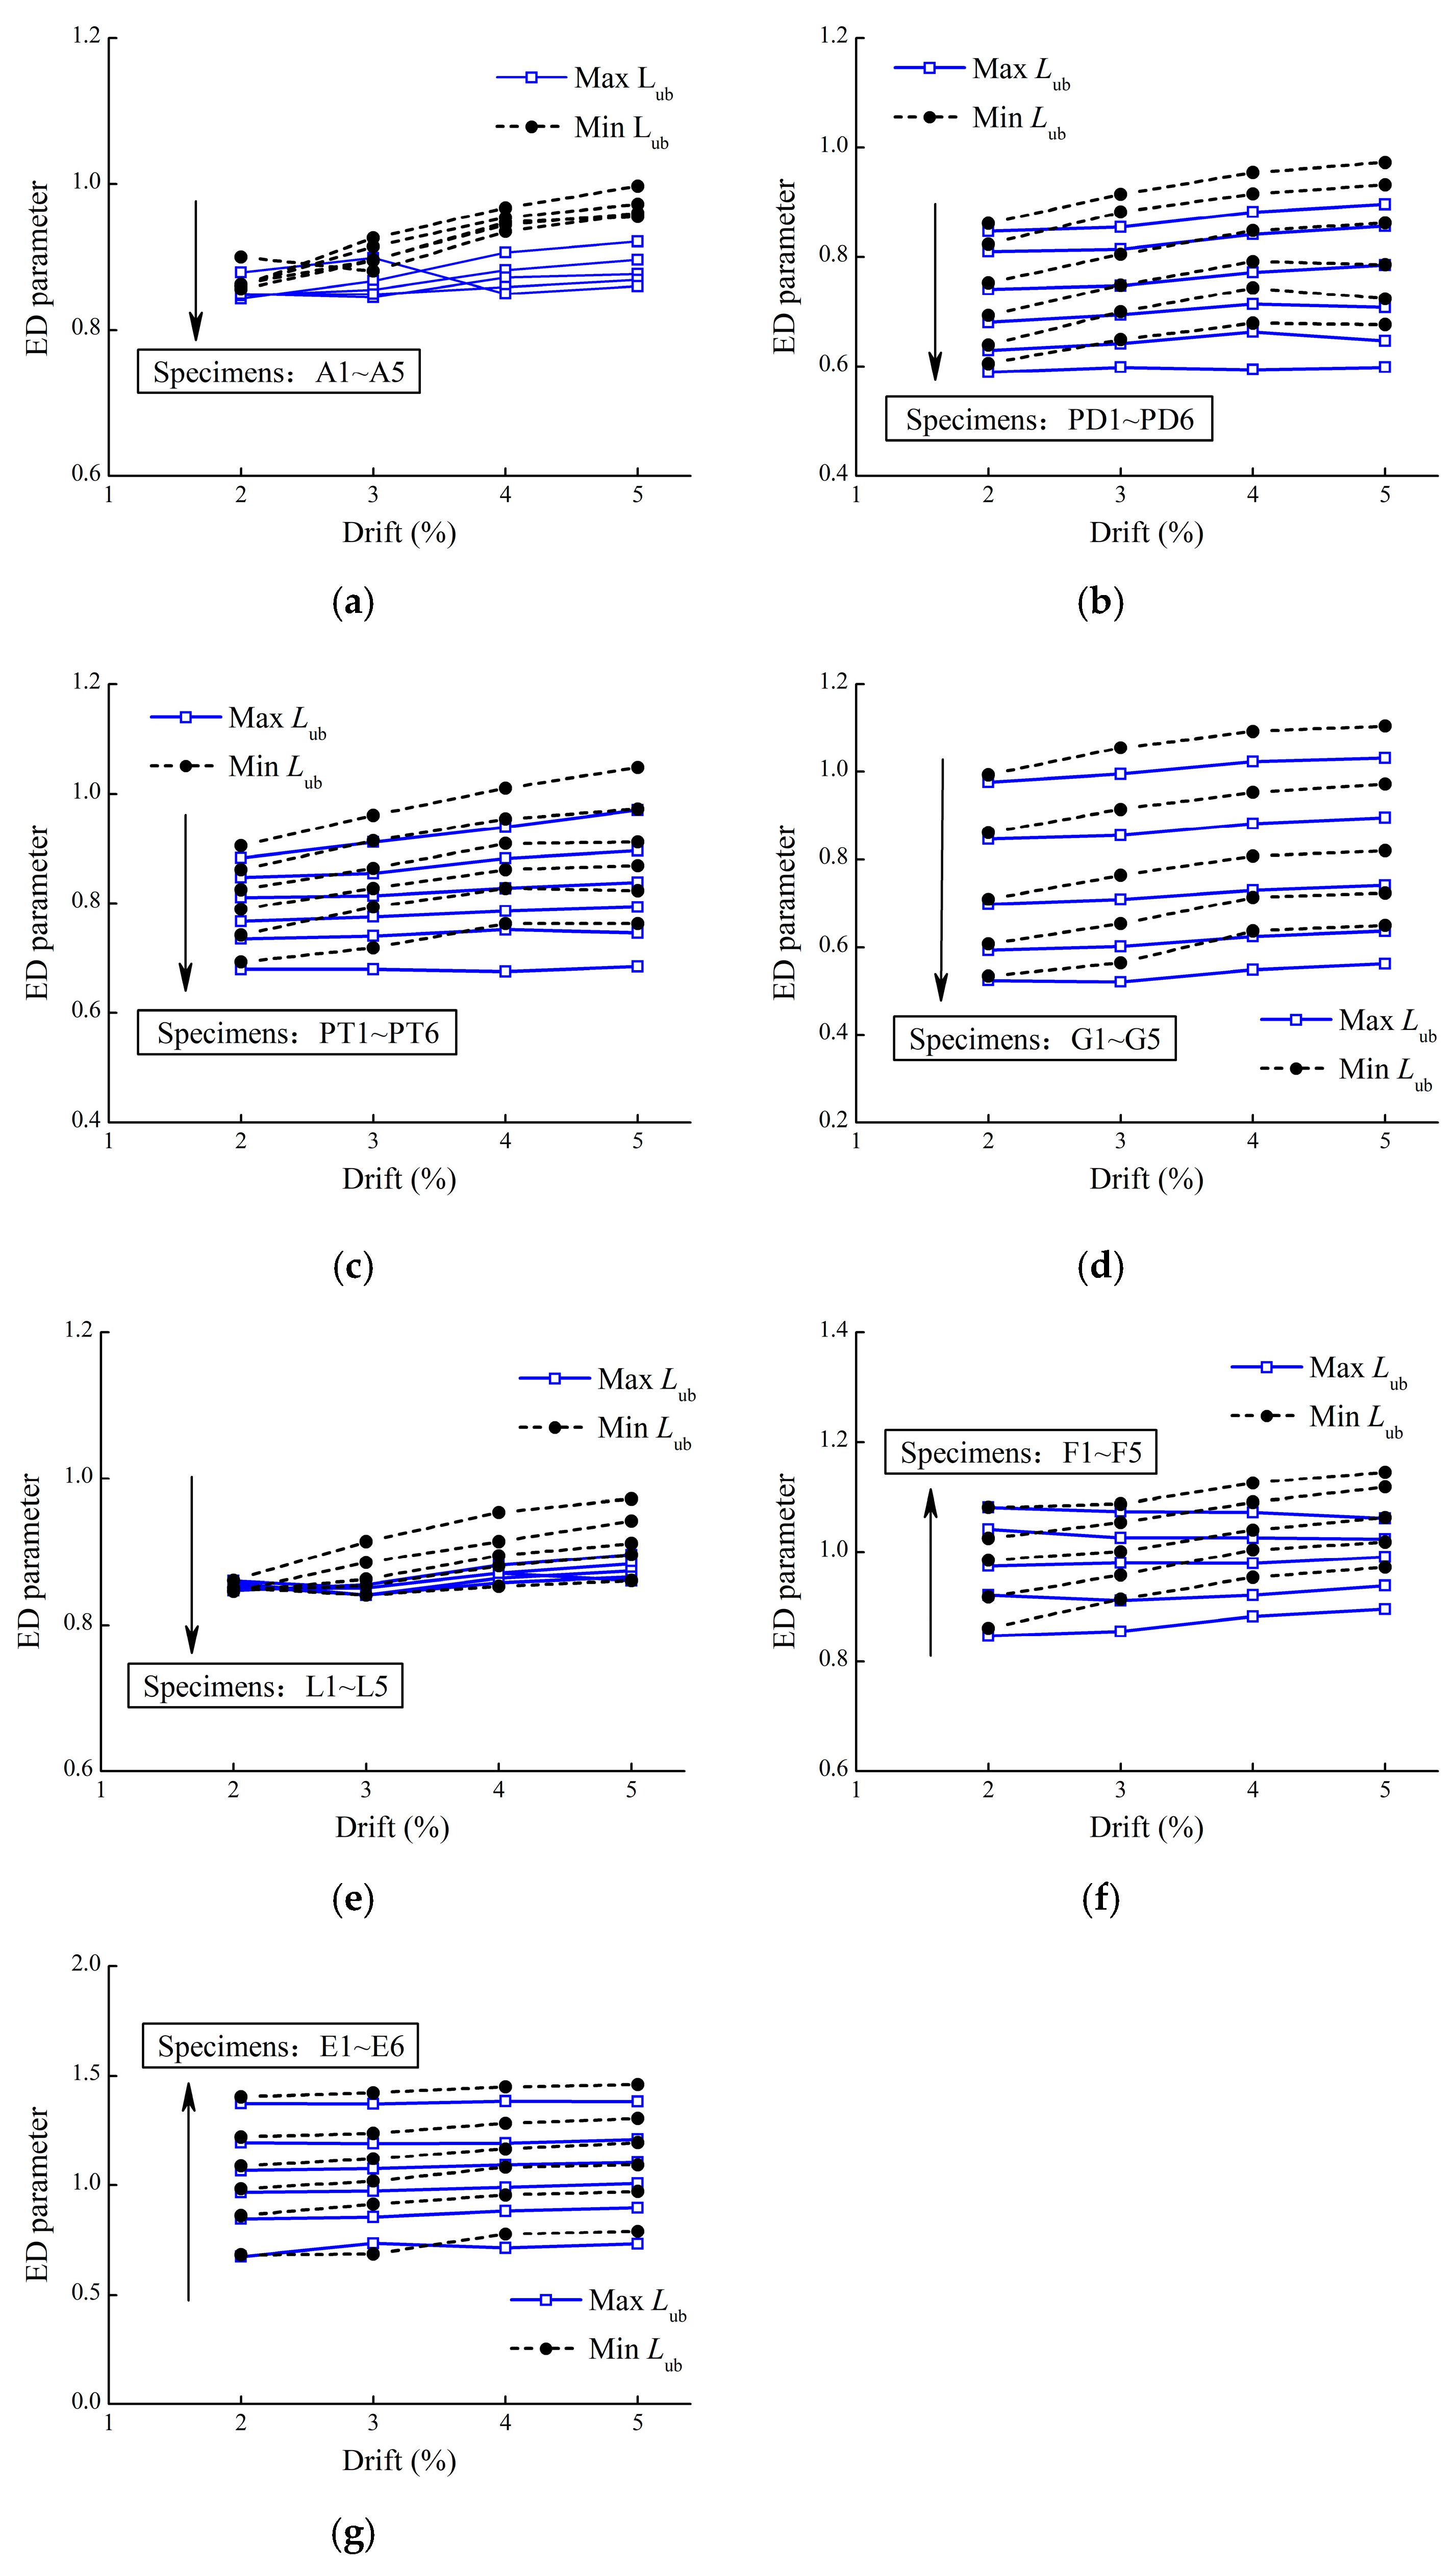
4.3. Results of Factorial Analysis

Based on the earthquake damage investigation results, the Japan Road Association (JRA) code proposed a residual displacement limitation of 1% for RC columns to measure whether the columns could be repaired or not [22]. If the residual displacement does not exceed 1%, the damaged column can generally be repaired. Because the residual displacement is always smaller than the peak displacement, the SC factor and ED parameter at 1% displacement are not considered to be significant.
The effect of each key parameter on the SC factor at 2%, 3%, and 4% displacement is compared, as shown in Figure 9. Except for λ, fy, and ρED, the other five parameters have a positive influence on the SC factor. At the considered levels of the parameters, the most important parameters are ρED, fy, ρTP, and ηG; the contribution of L0 can be neglected. The change in the contribution provided by each parameter is presented in Figure 9d. It can be observed that the change in the contribution provided by λ and ηG is the most notable. With an increase in displacement, the contribution of λ increases from 1.9% to 10.5%, while the contribution of ηG declines from 17.4% to 8.9%. This is because the larger aspect ratio and displacement aggravate the P−Δeffect. Meanwhile, the contribution of ρTP grows by about 5%, which indicates that self-centering capacity is more dependent on ρTP at large displacements. The total contribution is very stable and exceeds 83%, no matter which displacement is considered, and no intense interaction between the parameters is observed.
As shown in Figure 10, the contribution of each factor to the ED parameter at 2%, 3%, and 4% displacement is compared. fc, Pd, ρTP, and ηG have a negative effect, fy and ρED have a positive effect, and the effect of λ and L0 is approximately zero. The most significant parameters are ρED, fy, ηG, and ρTP. As shown in Figure 10d, the contribution of these parameters, excluding fy, basically remains the same; the contribution of fy decreases from 21.5% to 14.9% as the displacement increases from 2% to 4%. On the other hand, the total contribution at the three loading displacements reaches 94%; thus, it can be concluded that the ED parameter is dominated by the effect of a single factor, and the interaction between the factors is very slight. Here, the ED parameter β is fitted with a linear regression model that can be expressed as follows:
β = a 0 + a 1 x 1 + a 2 x 2 + a 3 x 3 + a 4 x 4 + a 5 x 5 + a 6 x 6
where x1, x2, x3, x4, x5, and x6 are the normalized parameters representing the effect of fc, Pd, ρTP, ηG, fy, and ρED. For example, x1 = (λ − 45)/15. The normalized parameters range from −1 to 1 (corresponding to low and high levels). The obtained corresponding coefficients of the regression model are provided in Table 5.

5. Formula for Predicting Residual Displacement Under Cyclic Loading

The purpose of this part is to explore the effect of the SC factor and ED parameter on the distribution of the residual displacement and predict the residual displacement under cyclic loading. Because there are two directions during a full cycle, the residual displacement Dres is defined as follows:
D r e s = D r e s + D + r e s 2
where D−res and D+res are the residual displacements corresponding to the negative and positive loading directions, respectively.

5.1. Parametric Study

In order to obtain enough data to analyze the distribution of residual displacement, a parametric study is first carried out. Table 6 is the working condition design table. There are five or six working conditions for each parameter. Each specimen has a special denotation that corresponds to a value in the parameter. For example, for the aspect ratio λ, five specimens are designed and tagged with A1, A2, A3, A4, and A5. Among these tags, A1 corresponds to a value of 3.6.
Figure 11 shows the influence of each parameter on the SC factor. The arrow represents what kind of trend the sc factor shows as the X-axis increases. The uncertainty of Lub in the simulation process is considered. It can be concluded that the value of the SC factor corresponding to the minimum Lub is always less than that corresponding to the maximum Lub, which indicates that the self-centering capacity of bridge columns will be underestimated if strain penetration is not considered. The uncertainty of Lub has little influence on the change tendency of the SC factor. The SC factor presents a downward trend as the displacement increases.
As shown in Figure 11a, the five specimens (A1–A5) have a similar SC factor at 1% displacement. With an increase in displacement, the SC factor of the specimen with a larger aspect ratio descends more rapidly because of the P−Δeffect. Specimen A1 is different from other specimens: its SC factor demonstrates slight growth when the displacement exceeds a certain value. Increasing Pd, ρPT, ηG, and L0 are all benefits that improve the self-centering force. Thus, their increase will enhance the SC factor, as shown in Figure 11b–e. The improvement effect of Pd and ηG on the SC factor is very similar and dependent on the displacement. As shown in Figure 11b,d, a larger Pd and ηG can generally generate a larger SC factor, but the self-centering capacity is not stable, which decreases sharply as the displacement increases. As shown in Figure 11c, it can be concluded that increasing the PT tendon ratio is an effective method to strengthen the stability of the self-centering capacity. Compared with Pd, ρPT, and ηG, the effect of L0 on the SC factor is very limited, as shown in Figure 11e. The value of L0 increases from 300 mm to 700 mm, while the increase in the SC factor does not exceed 0.3. Increasing fy or ρED aids in improving the energy dissipation capacity. Thus, their increase will reduce the SC factor, as shown in Figure 11f,g. The greatest reduction in the SC factor occurs when ρED increases from 0.46% to 0.69%, as shown in Figure 11g.
Similarly, Figure 12 shows the influence of each parameter on the ED parameter. It can be observed that the ED parameter corresponding to the minimum Lub is frequently larger than that corresponding to the maximum Lub. With an increase in displacement, the ED parameter shows a slight uptrend. It remains stable, on the whole, and its greatest growth does not reach 0.2. As shown in Figure 12a–e, by increasing λ, Pd, ρPT, ηG, and L0, one is able to reduce the ED parameter. For ηG, Pd, and ρPT, in particular, their reduction effect is more remarkable, and the effect of λ and L0 is relatively limited. By increasing fy and ρED, one can improve the ED parameter, as shown in Figure 12f,g.

5.2. Regression Analysis

As shown in Figure 13, the data obtained from the parameter analysis are collected to investigate the influence of the SC factor on the residual displacement distribution. The black points correspond to the maximum Lub, and the red points correspond to the minimum Lub. The red points are located at the upper boundary of the black points. The upper limit of the residual displacement is dominated by two key coordinate points: (2, 0) and (0, Dmax). Point (2, 0) indicates that the residual displacement is equal to zero if the SC factor reaches 2; point (0, Dmax) indicates that the residual displacement is equal to the maximum displacement if the SC factor is 0. The upper limit of residual displacement Dupres at different displacements can be expressed as Equation (14). Wang et al. (2019) [33] proposed a formula for the RSC UHPC bridge column with a hollow section to calculate the upper limit of residual displacement, as shown in Equation (15). Equation (14) is very similar to Equation (15). The only difference is that Equation (15) is based on the assumption that the residual displacement is equal to zero when the SC factor is 2.5. Therefore, Equation (15) is more conservative, as shown in Figure 13. However, this does not mean that the concrete material or the section shape have a great influence on the upper limit of residual displacement. In [33], the SC factor, defined as the moment contribution ratio, is obtained by theoretical calculation, while the residual displacement is obtained from the numerical results, which amplifies the error.
D u p r e s = D m a x × ( 1 0.5 λ s c )
D u p r e s = D m a x × ( 1 0.4 λ s c )
In addition, the residual displacement exhibits a feature of linear distribution. However, there are some special points at which the SC factors exceed 1, while the corresponding residual displacement is very small and approximately zero. These special points show an entirely different pattern of distribution. In order to explain the phenomenon, the source of these special points is verified. It is found that most of them are obtained from the specimens PD1–PD6, PT1–PT6, and G1–G5. Pd, ρPT, and ηG all have a great negative effect on the ED parameter. Thus, the influence of the ED parameter on the residual displacement distribution is studied, as shown in Figure 14. When the ED parameter exceeds 0.75, the residual displacement is very sensitive to it. Within the range of 0.75 to 1.0, in particular, the residual displacement grows rapidly as the ED parameter increases; when the ED parameter exceeds 1.0, the residual displacement increases smoothly. Meanwhile, the distribution of residual displacement is stratified because the residual displacement depends heavily on the maximum displacement. On the other hand, it can be concluded that the residual displacement is close to zero when the ED parameter is less than 0.75, which is not related to the maximum displacement.
As shown in Figure 15, the data in Figure 13 are collected, and the points in which the ED parameter is larger than 0.75 are removed. It can be found that most of the special points are filtered out, and the filtered data exhibit a more obvious linear distribution characteristic. Regression analyses are performed for the filtered data, and the relation between the residual displacement at a certain displacement and the SC factor is established as follows:
D r e s , 2 % = 1.4 λ s c + 1.936
D r e s , 3 % = 1.972 λ s c + 2.974
D r e s , 4 % = 2.515 λ s c + 3.973
D r e s , 5 % = 3 λ s c + 4.9
where Dres,2%, Dres,3%, Dres,4%, and Dres,5% are the residual displacements at 2, 3, 4, and 5% displacement. It should be noted that this set of formulas can be used to estimate the residual displacement under cyclic loading on the premise that the ED parameter exceeds 0.75. If the parameter is smaller than 0.75, the residual displacement can be ignored. The correlation coefficients of Equation (16a), Equation (16b), Equation (16c), and Equation (16d) are 86.6%, 85.6%, 85.4%, and 84.8%, respectively.
Too great a value of L0 is a significant cause of the discreteness of the formulas. As shown in Figure 15, numerous points descend faster as the SC factor increases. This occurs because a value of L0 that is too great will change the unloading path and aggravate the pinching effect. Meanwhile, the SC factor is not sensitive to L0. As a result, the residual displacement is reduced at the cost of a slight reduction in strength and energy dissipation capacity. A comparison of the hysteretic curves between specimens L1 and L5 is provided as an example and shown in Figure 16. In fact, an unbonded length that is too long will not be designed, in general, because it may lead to the buckling of ED bars. As a result, it is unnecessary to pay a great deal of attention to the effect of L0.
Palermo et al. (2007) [9] conducted a cyclic loading test on four RSC bridge pier specimens. The specimens were named PT1, HBD1, PT2, and HBD2. The only difference between specimen PT1 (PT2) and HBD1 (HBD2) was that the former lacked ED bars. The SC factors and ED parameters of specimens HBD1 and HBD2 can be obtained from the test results. A comparison of the test results with the predictive residual displacement is provided in Table 7.
Analysis of Table 7 reveals that variations in the self-centering (SC) factor and energy dissipation (ED) parameters among tested specimens directly correlate with divergent residual displacement responses. Significantly, within identical structural configurations, the magnitude of displacement is identified as a critical parameter influencing both the SC factor and ED parameter.

6. Conclusions

This paper uses the numerical method to investigate and predict the residual displacement of RSC columns under cyclic loading. RC piers are categorized into two types: RSC-ED piers equipped with energy-dissipating bars and RSC-NED piers without such bars. The SC factor and ED parameter are regarded as important parameters that govern residual displacement. To explore the impact of design parameters on the hysteretic performance of RSC piers, factorial analysis is employed. The effects of eight key design parameters on equivalent stiffness, equivalent yield strength, post-yield stiffness ratio, and residual displacement are examined. Additionally, the influence of seven key parameters on the self-resetting coefficient and energy dissipation parameters is analyzed. The effect of the SC factor and ED parameter on the residual displacement distribution is statistically analyzed. During the process, the uncertainty of energy-dissipating steel bars of a set length in the numerical model is considered in order to refine residual displacement predictions, leading to a more conservative estimation approach. Finally, regression analysis is used to establish a predictive formula for the residual displacement of RSC piers, providing valuable guidance for their design. Based on the analyses, the following conclusions can be drawn:
  • Simplifying the strain penetration of energy-consuming steel bars to equivalent unbonded segment lengths can lead to an underestimation of self-resetting capacity and residual displacement. Ignoring the strain penetration of ED bars will underestimate the self-centering capacity of RSC columns and conservative residual displacement will be obtained. Therefore, when establishing RSC pier models, it is essential to consider the impact of strain penetration to enhance the accuracy of prediction outcomes.
  • The total contribution of the eight parameters to the SC factor and ED parameter is stable and maintained at approximately 84% and 95%, respectively. No significant interaction between these factors is observed. Due to the P−Δeffect, the contribution of the gravity loading ratio to the SC factor will decrease rapidly as the displacement increases, and the effect of the aspect ratio will grow.
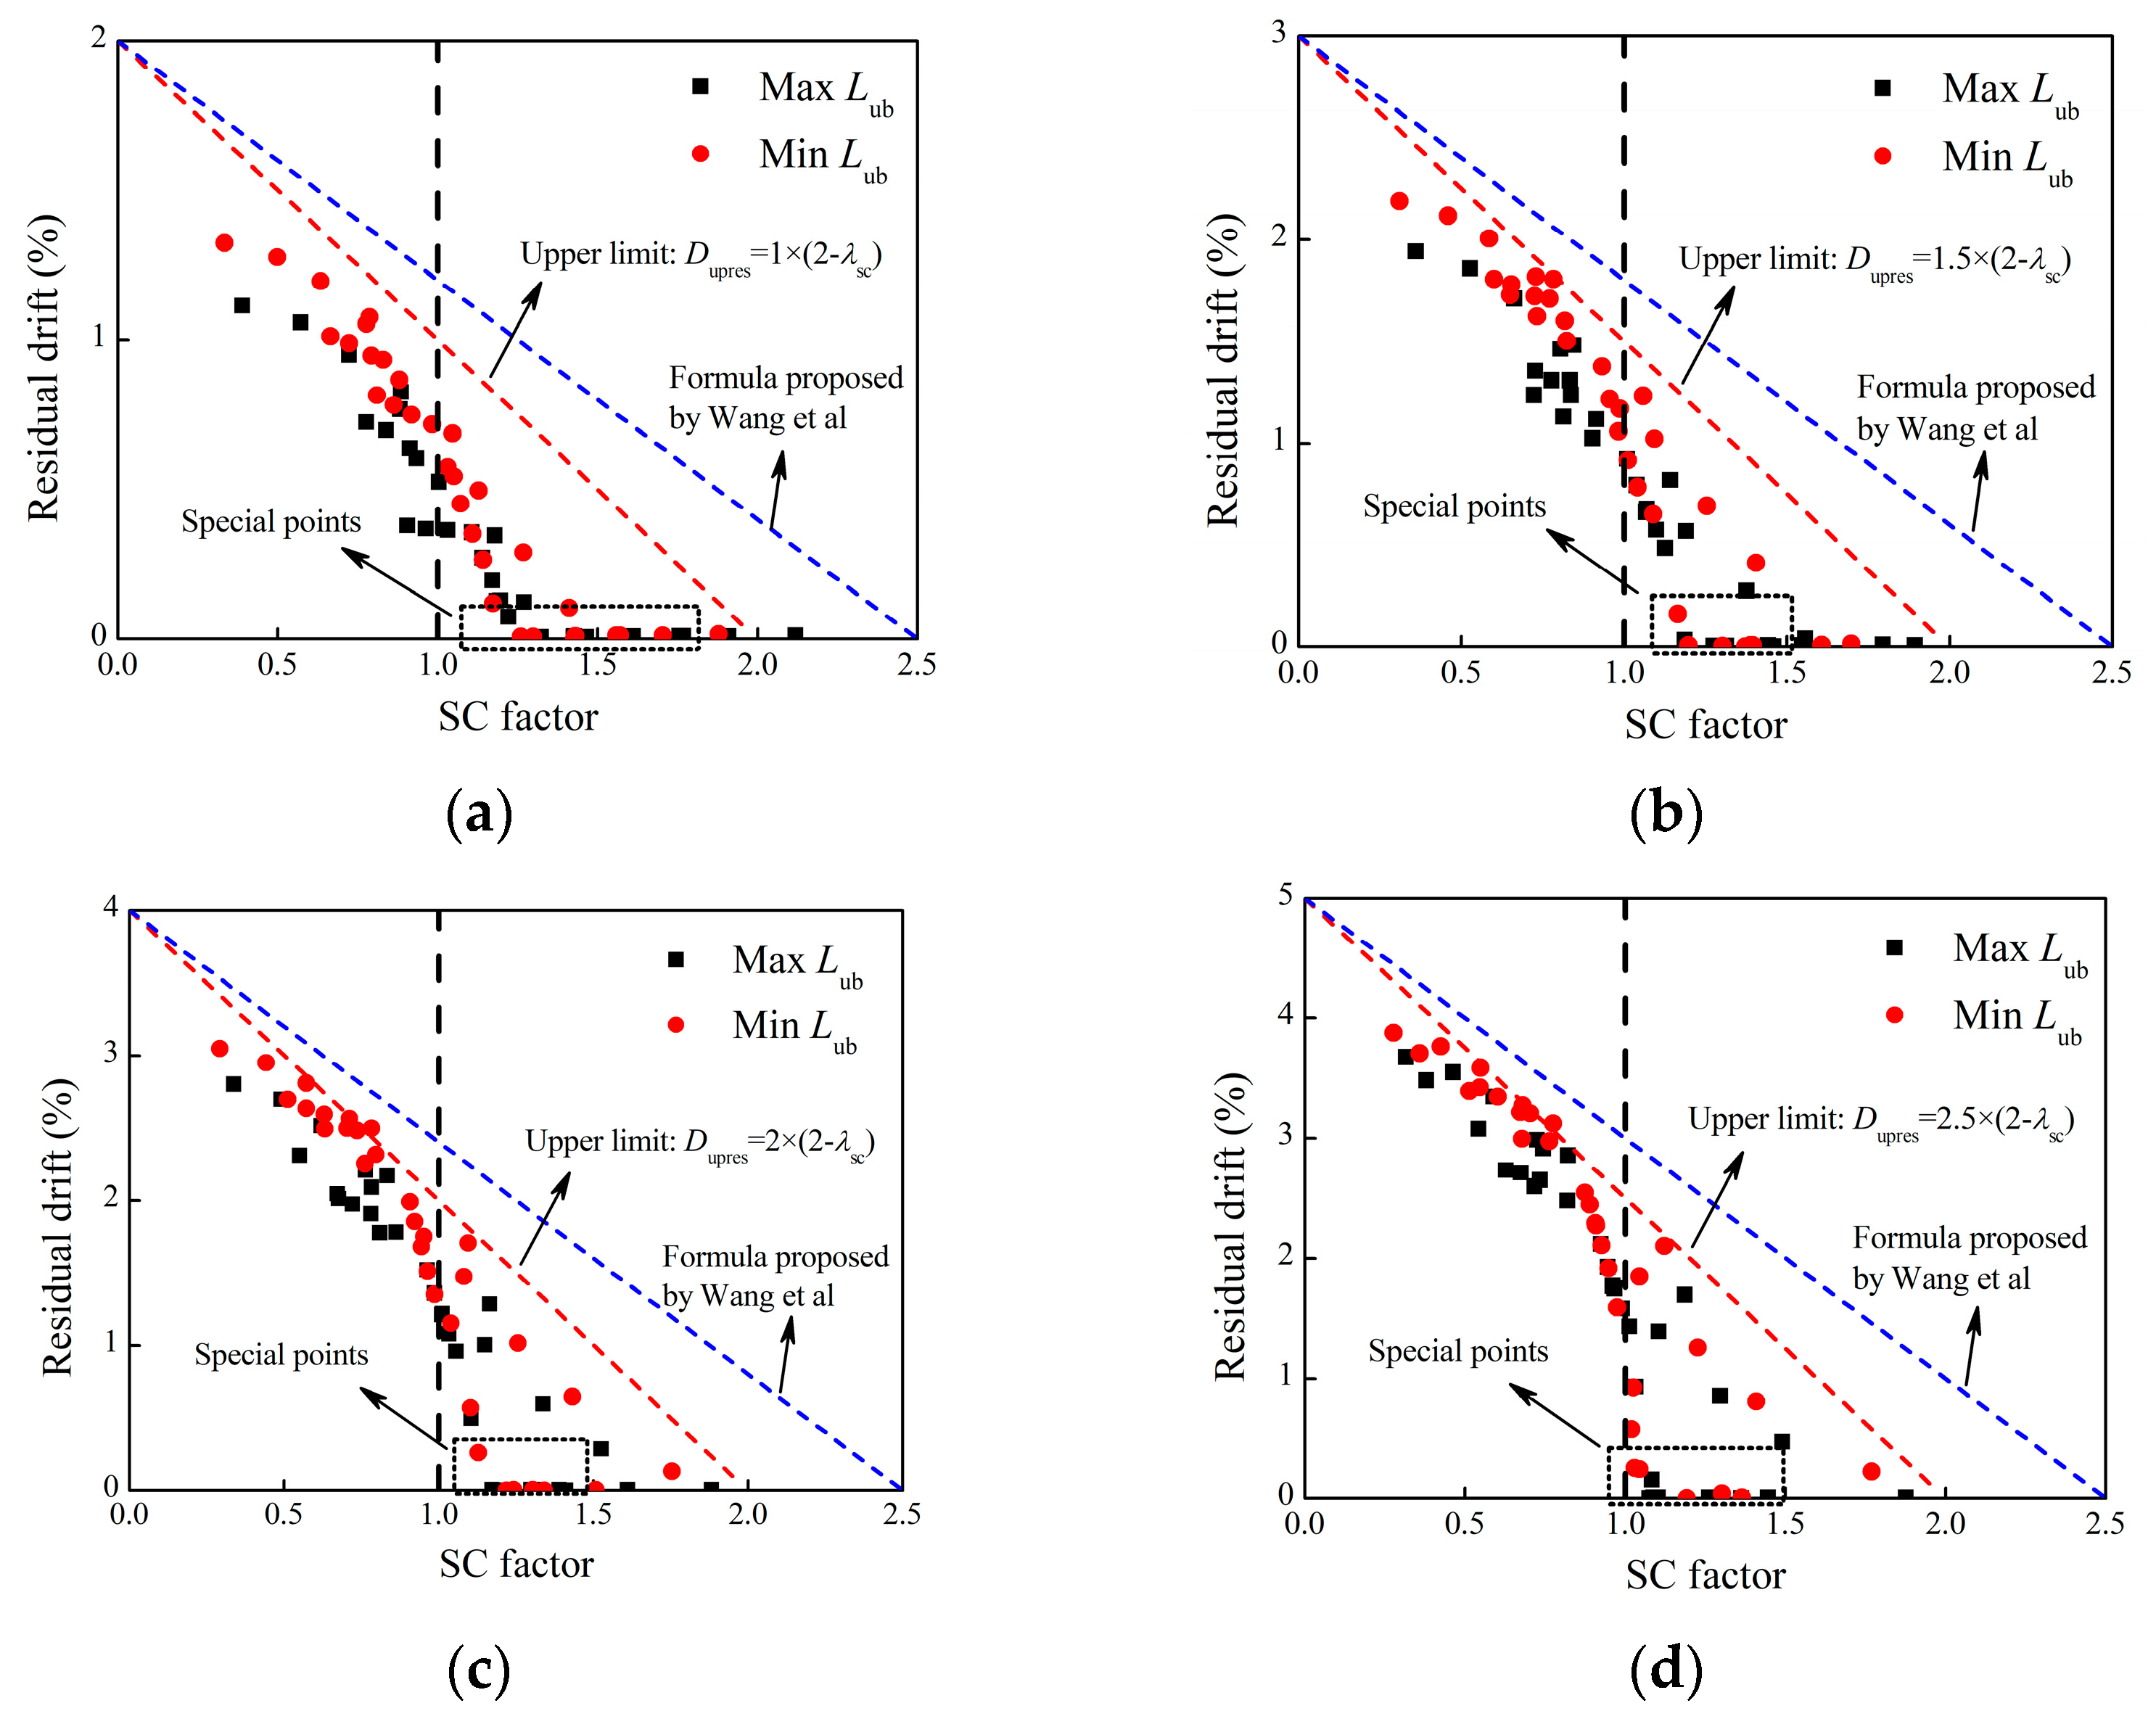
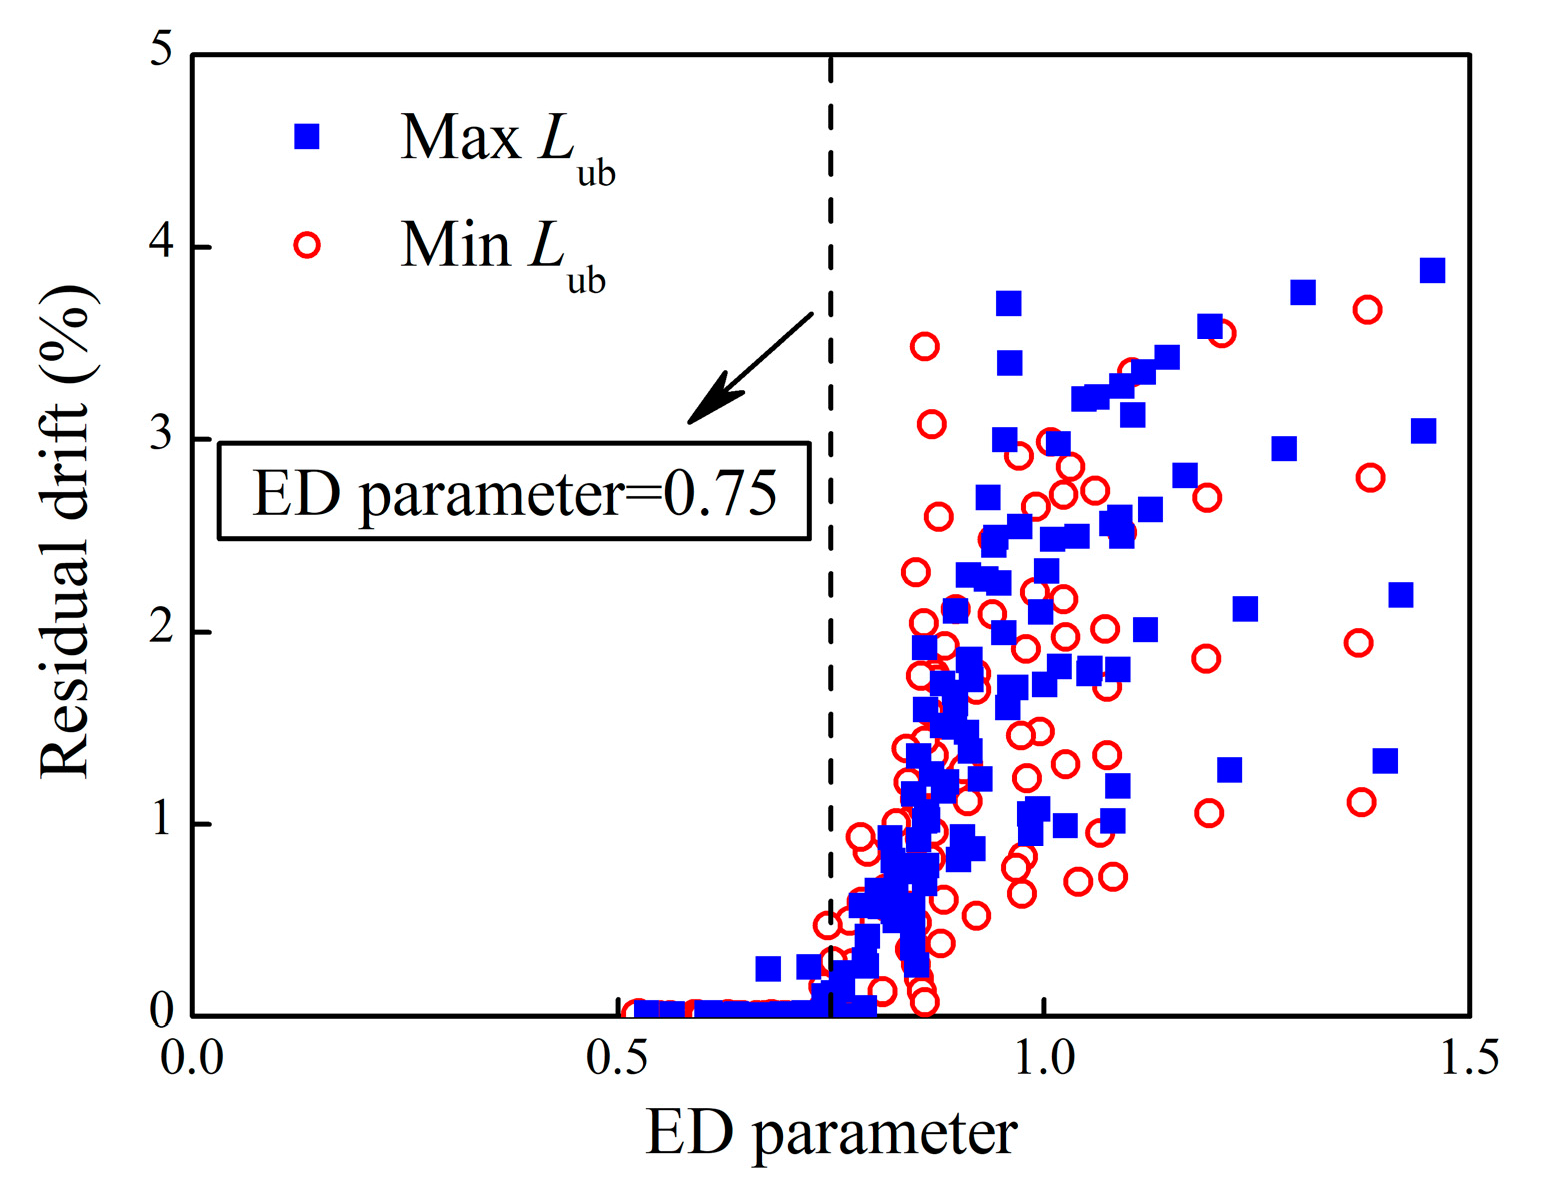
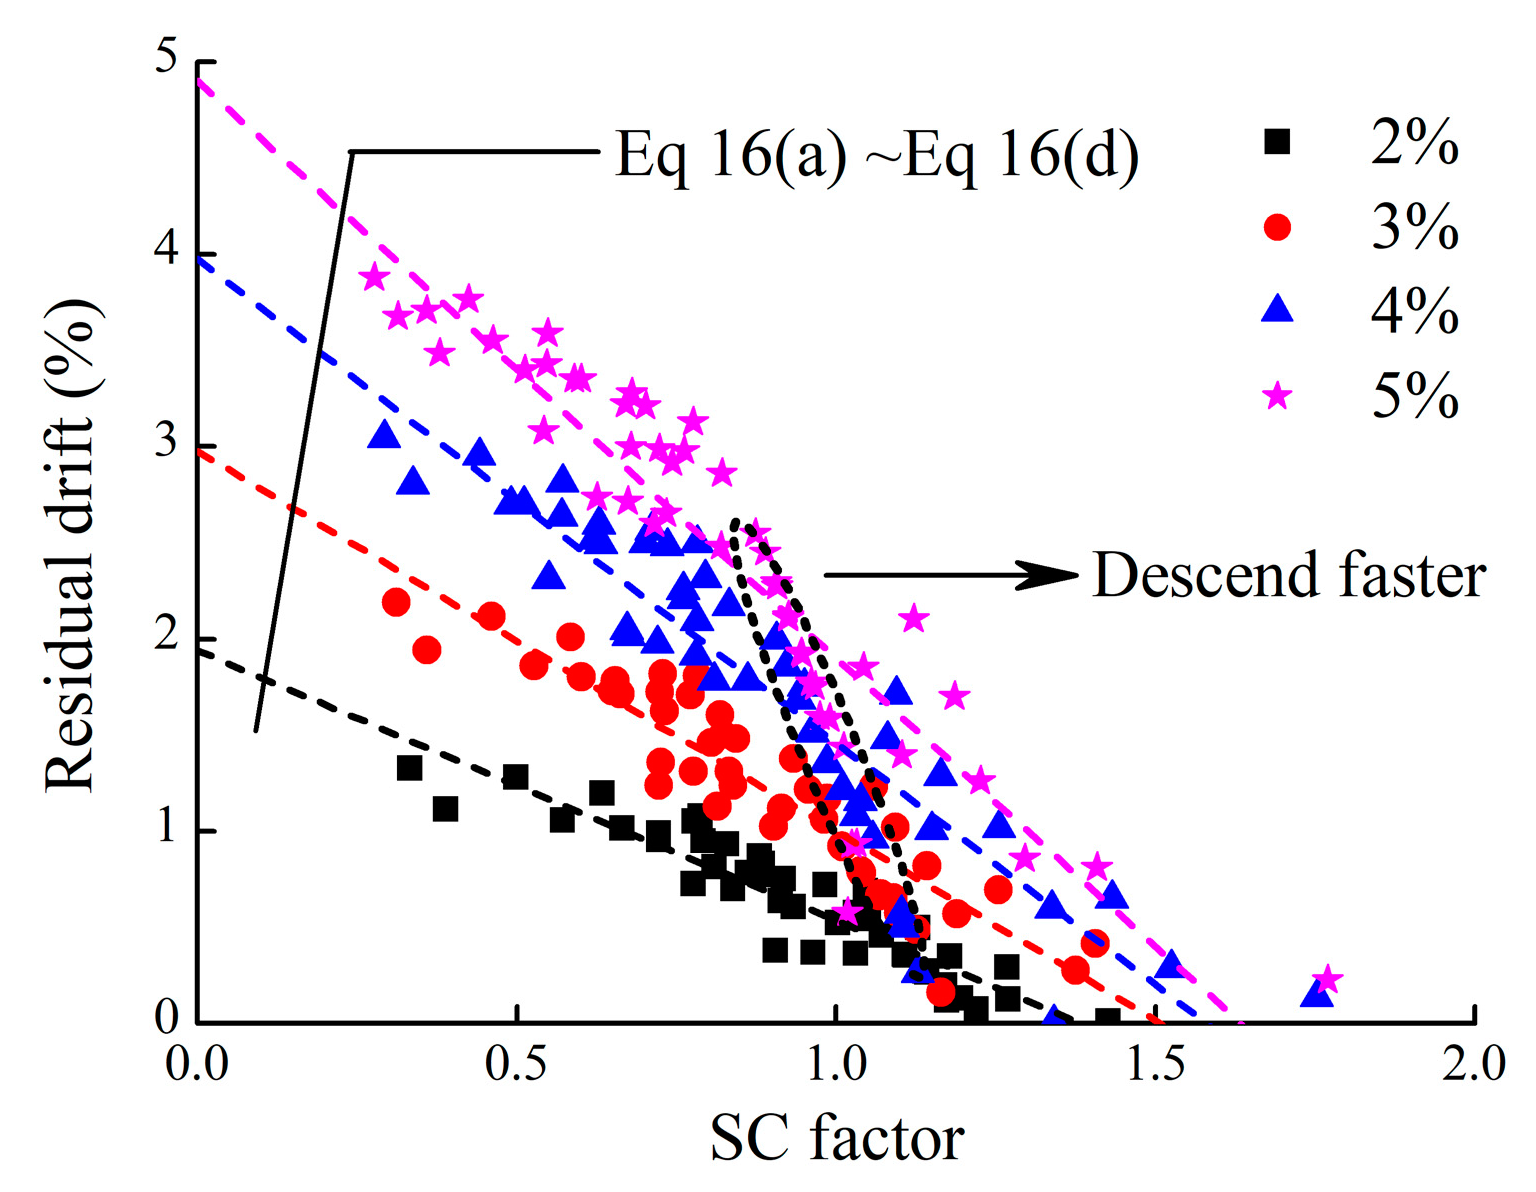
  • The SC factor, ED parameter, and maximum displacement dominate the distribution of residual displacement under cyclic loading. When the SC factor exceeds 2.0 or the ED parameter is smaller than 0.75, the residual displacement can be neglected. In other situations, the residual displacement can be estimated using the upper limit formula and the regression formula. This implies that, during the design of RSC piers, controlling residual displacement can be achieved by adjusting the rocking self-resetting factor and energy dissipation capacity parameters.
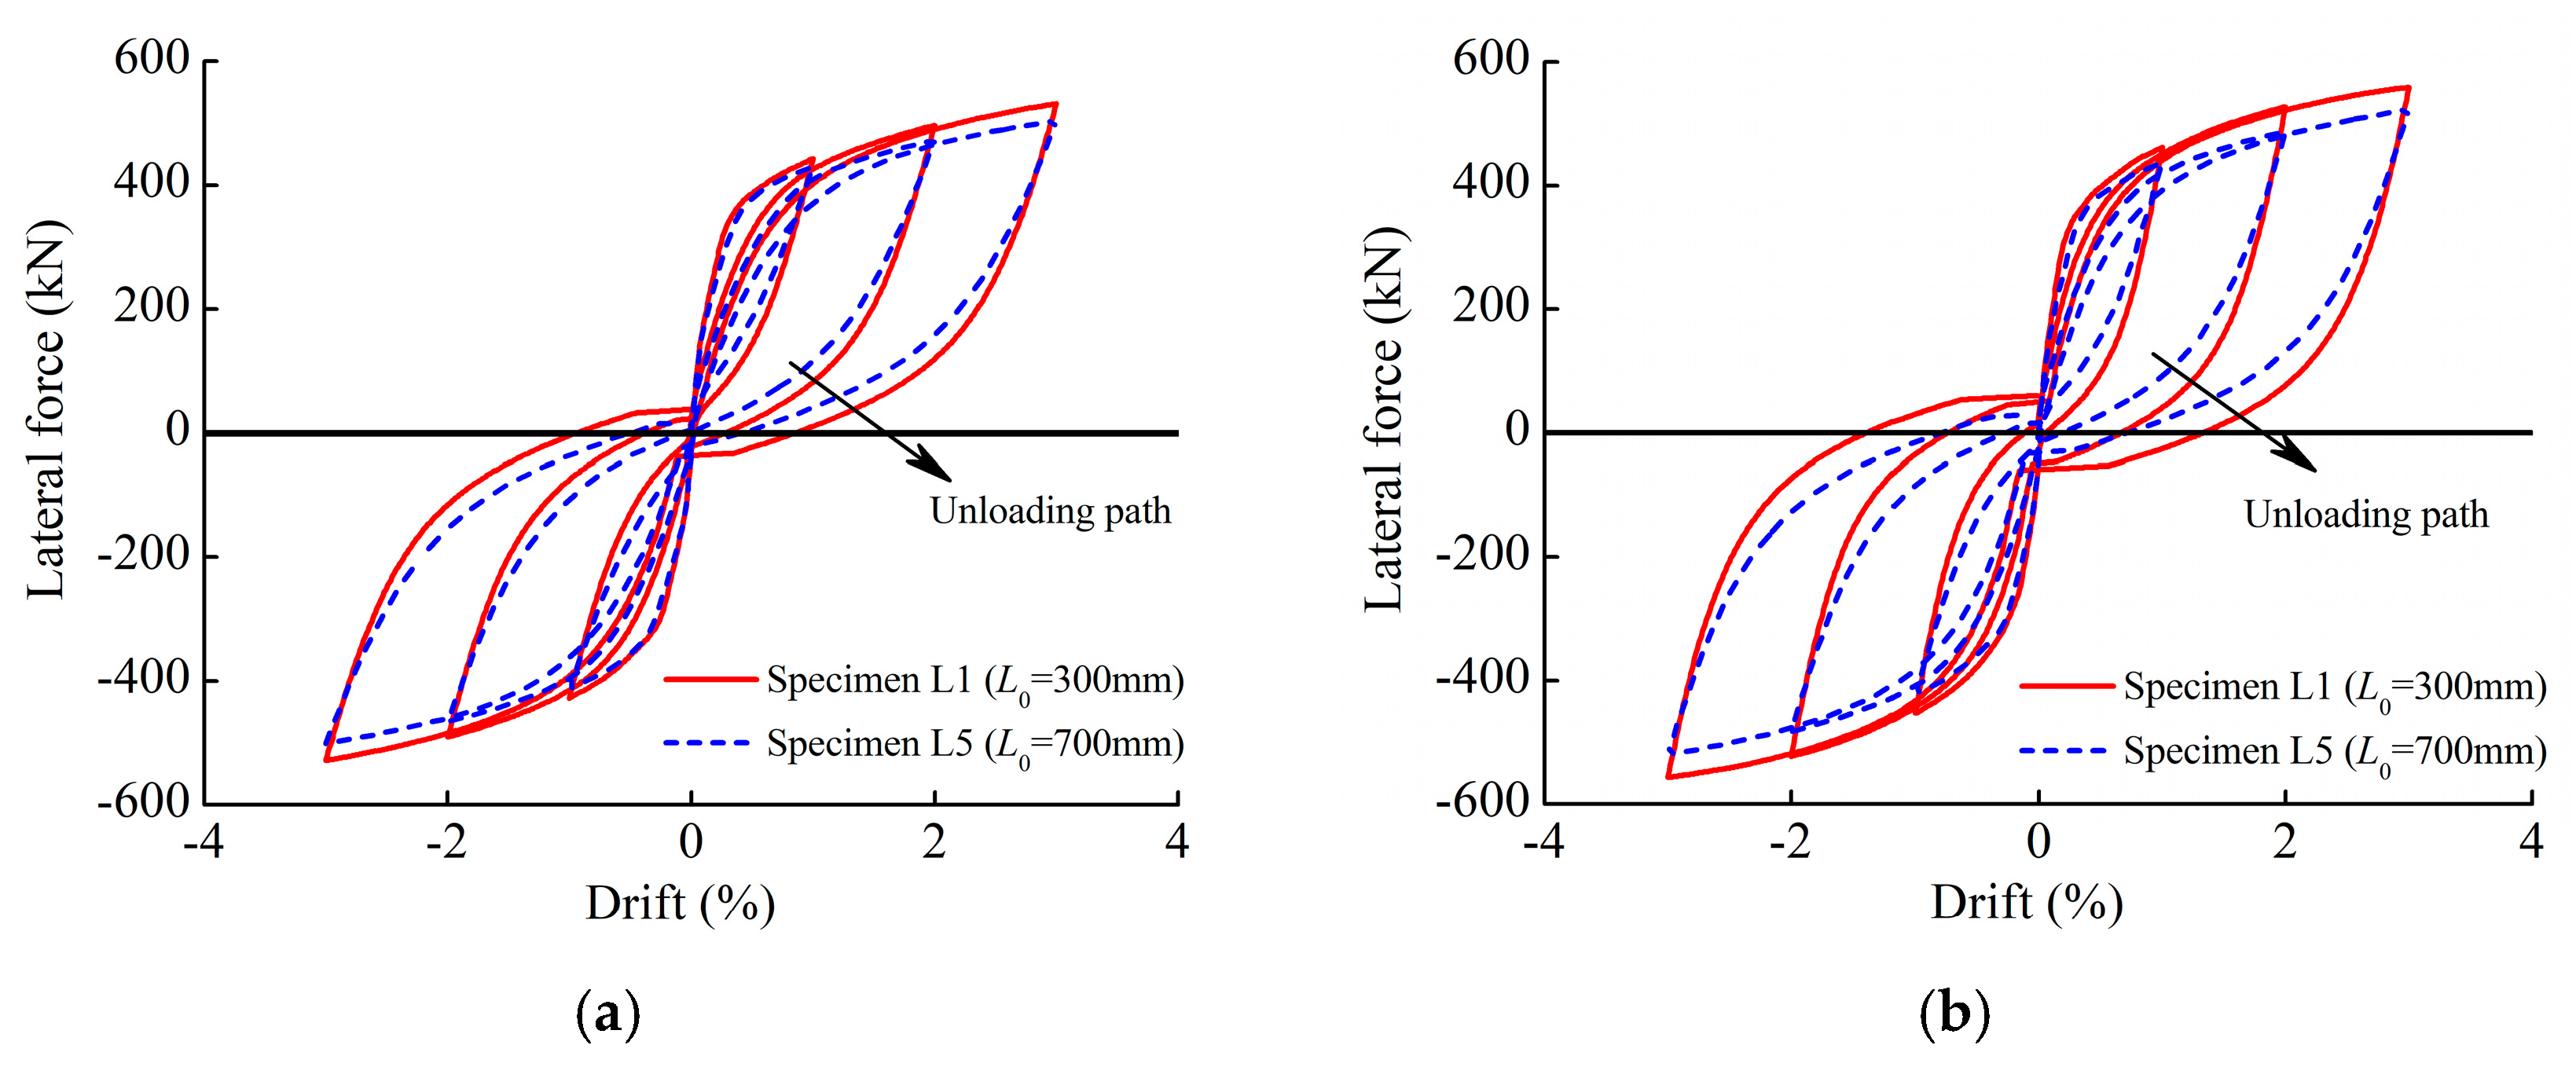
  • The unbonded length of ED bars has little influence on the SC factor and the ED parameter. However, if the unbonded length is too long, the residual displacement can effectively be diminished because of the changed unloading path. This means that, when designing RSC piers, the length of unbonded energy-dissipating steel rods can be adjusted as needed to achieve the desired self-resetting capacity, energy-dissipating capacity, and residual displacement control effect.

Author Contributions

Conceptualization, Y.S.; methodology, Y.S.; software, H.Q.; validation, H.Q.; formal analysis, H.Q.; investigation, H.Q. and Y.D.; resources, Y.S.; data curation, H.Q. and Z.Z.; writing—original draft preparation, H.Q.; writing—review and editing, Y.D.; visualization, Z.Z.; supervision, J.F; project administration, J.F.; funding acquisition, Y.S. All authors have read and agreed to the published version of the manuscript.

Funding

This work was supported by the National Natural Science Foundation of China (Grant No. 52468071) and the Doctoral Research Fund of Lanzhou City University (Grant No. LZCU-BS2023-26).

Data Availability Statement

The data presented in this study are available on request from the corresponding author.

Conflicts of Interest

The authors declare that they have no known competing financial interests or personal relationships that could have appeared to influence the work reported in this paper.

Abbreviations

The following abbreviations are used in this manuscript:
RCReinforced concrete
RSCRocking self-centering
SCSelf-centering
EDEnergy dissipation

References

  1. Han, Q.; Du, X.; Liu, J. Seismic damage of highway bridges during the 2008 Wenchuan earthquake. Earthq. Eng. Eng. Vib. 2009, 8, 263–273. [Google Scholar] [CrossRef]
  2. Shi, Y.; Zhong, Z.; Qin, H.; Sun, Z. Toggle buckling-restrained brace systems and a corresponding design method for the seismic retrofit of bridge bents. Eng. Struct. 2020, 221, 110996. [Google Scholar] [CrossRef]
  3. Kawashima, K.; Macrae, G.A.; Hoshikuma, J.I.; Nagaya, K. Residual displacement response spectrum. J. Struct. Eng. 1998, 124, 523–530. [Google Scholar] [CrossRef]
  4. Uma, S.R.; Pampanin, S.; Christopoulos, C. Development of probabilistic framework for performance-based seismic assessment of structures considering residual deformations. J. Earthq. Eng. 2010, 14, 1092–1111. [Google Scholar] [CrossRef]
  5. Palermo, A.; Mashal, M. Accelerated bridge construction (ABC) and seismic damage resistant technology: A New Zealand challenge. Bull. N. Z. Soc. Earthq. 2012, 45, 123–134. [Google Scholar]
  6. Marsh, M.L.; Wernli, M.; Garrett, B.E. Application of Accelerated Bridge Construction Connections in Moderate-to-High Seismic Regions, NCHRP Report 698; Transportation Research Board: Washington, DC, USA, 2011. [Google Scholar]
  7. Zhang, D.; Li, N.; Li, Z.X. Seismic performance of precast segmental concrete-filled steel-tube bridge columns with internal and external energy dissipaters. J. Bridge Eng. 2021, 26, 04021085. [Google Scholar] [CrossRef]
  8. Hewes, J.T. Seismic Design and Performance of Precast Concrete Segmental Bridge Columns; University of California: San Diego, CA, USA, 2002. [Google Scholar]
  9. Palermo, A.; Pampanin, S.; Marriott, D. Design modeling, and experimental response of seismic resistant bridge piers with posttensioned dissipating connections. J. Struct. Eng. 2007, 133, 1648–1661. [Google Scholar] [CrossRef]
  10. Ou, Y.C.; Wang, P.H.; Tsai, M.S.; Chang, K.C.; Lee, G.C. Large-scale experimental study of precast segmental unbonded posttensioned concrete bridge columns for seismic regions. J. Struct. Eng. 2010, 136, 255–264. [Google Scholar] [CrossRef]
  11. Bu, Z.Y.; Ou, Y.C.; Song, J.W.; Zhang, N.S.; Lee, G.C. Cyclic loading test of unbonded and bonded posttensioned precast segmental bridge columns with circular section. J. Bridge Eng. 2016, 21, 04015043. [Google Scholar] [CrossRef]
  12. Elgawady, M.A.; Sha’lan, A. Seismic behavior of self-centering precast segmental bridge bents. J. Bridge Eng. 2011, 16, 328–339. [Google Scholar] [CrossRef]
  13. Guo, T.; Cao, Z.; Xu, Z.; Lu, S. Cyclic load tests on self-centering concrete pier with external dissipators and enhanced durability. J. Struct. Eng. 2015, 142, 04015088. [Google Scholar] [CrossRef]
  14. Shi, Y.; Zhong, Z.W.; Qin, H.G. Seismic performance and corresponding design method of rocking self-centering bridge bents equipped with lead-extrusion dampers. Eng. Mech. 2021, 38, 166–177, 203. [Google Scholar]
  15. Han, Q.; Jia, Z.; Xu, K.; Zhou, X.; Du, X. Hysteretic behavior investigation of self-centering double-column rocking piers for seismic resilience. Eng. Struct. 2019, 188, 218–232. [Google Scholar] [CrossRef]
  16. Tong, T.; Zhuo, W.; Jiang, X.; Lei, H.; Liu, Z. Research on seismic resilience of prestressed precast segmental bridge piers reinforced with high-strength bars through experimental testing and numerical modelling. Eng. Struct. 2019, 197, 10335. [Google Scholar] [CrossRef]
  17. Cai, Z.K.; Wang, D.; Wang, Z. Full-scale seismic testing of concrete building columns reinforced with both steel and CFRP bars. Compos. Struct. 2017, 178, 195–209. [Google Scholar] [CrossRef]
  18. Roh, H.; Reinhorn, A.M. Hysteretic behavior of precast segmental bridge piers with superelastic shape memory alloy bars. Eng. Struct. 2010, 32, 3394–3403. [Google Scholar] [CrossRef]
  19. Shi, Y.; Wang, D.; Qin, H.; Chen, X.; Han, J.; Zhang, Z. Strength reduction factor spectra for SDOF systems with structural fuses. Soil Dyn. Earthq. Eng. 2023, 169, 107895. [Google Scholar] [CrossRef]
  20. Wu, S.; Li, J.; Chen, X.; Guan, Z. Seismic residual displacement for structural system with partial self-centering ability. J. Bridge Eng. 2024, 95, 110123. [Google Scholar] [CrossRef]
  21. Guo, J.; Guo, B.; Nie, L.; Sun, R.; Zhao, W. Seismic resilience mechanism of self-centering dual-limb thin-walled rocking piers with replaceable energy dissipation beams. Earthq. Eng. Struct. Dyn. 2024, 53, 1803–1825. [Google Scholar] [CrossRef]
  22. Japan Road Association. Specifications for Highway Bridges-Part V Seismic Design; Marusan Publishing: Tokyo, Japan, 2002. [Google Scholar]
  23. Liossatou, E.; Fardis, M.N. Near-fault effects on residual displacements of RC structures. Earthq. Eng. Struct. Dyn. 2016, 45, 1391–1409. [Google Scholar] [CrossRef]
  24. Cheng, H.; Li, H.; Wang, D.S.; Sun, Z.; Li, G.; Jin, J. Research on the influencing factors for residual displacements of RC bridge columns subjected to earthquake loading. Bull. Earthq. Eng. 2016, 14, 2229–2257. [Google Scholar] [CrossRef]
  25. Ji, D.; Wen, W.; Zhai, C.; Katsanos, E.I. Residual displacement ratios of SDOF systems subjected to ground motions recorded on soft soils. Soil Dyn. Earthq. Eng. 2018, 115, 331–335. [Google Scholar] [CrossRef]
  26. Amiri, S.; Bojorquez, E. Residual displacement ratios of structures under mainshock-aftershock sequences. Soil Dyn. Earthq. Eng. 2019, 121, 179–193. [Google Scholar] [CrossRef]
  27. Zhan, S.; Jian, Z. Dimensional estimation of residual-displacement demands for bilinear bridges under near-fault ground motions. J. Bridge Eng. 2018, 23, 04018087. [Google Scholar]
  28. Quinde, P.; Teran, A.; Reinoso, E. Residual displacement estimation for soft soils: Application to Mexico city lake-bed. Soil Dyn. Earthq. Eng. 2019, 130, 105970. [Google Scholar] [CrossRef]
  29. Li, S.; Zhao, T.; Alam, M.S.; Cheng, Z.; Wang, J. Probabilistic seismic vulnerability and loss assessment of a seismic resistance bridge system with post-tensioning precast segmental ultra-high performance concrete bridge columns. Eng. Struct. 2020, 225, 111321. [Google Scholar] [CrossRef]
  30. Ou, Y.C.; Chiewanichakorn, M.; Aref, A.J.; Lee, G.C. Seismic performance of segmental precast unbonded posttensioned concrete bridge columns. J. Struct. Eng. 2007, 133, 1636–1647. [Google Scholar] [CrossRef]
  31. Cai, Z.K.; Zhou, Z.; Wang, Z. Influencing factors of residual displacements of precast segmental bridge columns with energy dissipation bars. Adv. Struct. Eng. 2019, 22, 126–140. [Google Scholar] [CrossRef]
  32. Liu, X.; Li, J.; Tsang, H.H.; Wilson, J.L. Evaluating self-centering behavior of unbonded prestressed bridge columns using a new performance index based on quasi-static analysis. J. Earthq. Tsunami 2018, 12, 1850001. [Google Scholar] [CrossRef]
  33. Wang, Z.; Wang, J.; Zhao, G.; Zhang, J. Design criterion for the self-centering capacity of precast segmental UHPC bridge columns with unbonded post-tensioning tendons. Eng. Struct. 2019, 200, 109706. [Google Scholar] [CrossRef]
  34. Tazarv, M.; Hart, K.; Khan, A. Rocking bridge columns with external replaceable tendons. J. Bridge Eng. 2024, 29, 04024008. [Google Scholar] [CrossRef]
  35. Jia, X.; Dong, H.; Su, C.; Han, Q. Seismic performance of the self-centering rocking columns with SMA L-shaped plates. Structures 2024, 60, 105914. [Google Scholar] [CrossRef]
  36. Ahmdi, E.; Kashani, M.M. Numerical investigation of nonlinear static and dynamic behaviour of self-centring rocking segmental bridge piers. Soil Dyn. Earthq. Eng. 2020, 128, 105876. [Google Scholar] [CrossRef]
  37. Marriott, D.; Pampanin, S.; Palermo, A. Quasi-static and pseudo-dynamic testing of unbonded post-tensioned rocking bridge piers with external replaceable dissipaters. Earthq. Eng. Struct. Dyn. 2009, 38, 331–354. [Google Scholar] [CrossRef]
  38. Priestley, M.J.N.; Calvi, G.M.; Kowalsky, M.J. Displacement-based seismic design of structures. In Earthquake Spectra; IUSS Press: Rome, Italy, 2007. [Google Scholar]
  39. Kowalsky, M.J.; Priestley, M.J.N.; Macrae, G.A. Displacement-based design of RC bridge columns in seismic regions. Earthq. Eng. Struct. Dyn. 1995, 24, 1623–1643. [Google Scholar] [CrossRef]
  40. Mantawy, I.M.; Sanders, D.H.; Eberhard, M.O.; Stanton, J.F. Modelling of debonded reinforcement in ABC connections designed for seismic zones. Eng. Struct. 2019, 198, 109351. [Google Scholar] [CrossRef]
  41. Pampanin, S.; Priestley, M.J.N.; Sritharan, S. Analytical modelling of the seismic behaviour of precast concrete frames designed with ductile connections. J. Earthq. Eng. 2001, 5, 329–367. [Google Scholar] [CrossRef]
  42. Bu, Z.Y.; Ou, Y.C. Simplified analytical pushover method for precast segmental concrete bridge columns. Adv. Struct. Eng. 2013, 16, 805–822. [Google Scholar] [CrossRef]
  43. Guo, J.; Xin, K.G.; He, M.H.; Hu, L. Experimental study and analysis on the seismic performance of a self-centering bridge pier. Eng. Mech. 2012, 29, 29–34. [Google Scholar]
  44. Hieber, D.G.; Wacker, J.M.; Eberhard, M.O.; Stanton, J.F. Precast Concrete Pier Systems for Rapid Construction of Bridges in Seismic Region; University of Washington: Seattle, WA, USA, 2005. [Google Scholar]
  45. Montgomery, D.C. Design and Analysis of Experiments; John Wiley and Sons: New York, NY, USA, 2008. [Google Scholar]
  46. Ding, Y.; Shi, Y.; Qin, H.; Wang, X. Strength Reduction Factor of Steel Frames with Stainless-Steel Braces. Buildings 2025, 15, 681. [Google Scholar] [CrossRef]
Figure 1. Finite element model and cross-sections of existing test specimens.
Buildings 15 01220 g001
Figure 2. ElasticPP stress–strain relationship.
Buildings 15 01220 g002
Figure 3. ACI testing loading protocol.
Buildings 15 01220 g003
Figure 4. Comparisons of the numerical hysteretic curve with the test results: (a) PT; (b) HBD2; (c) HBD1; (d) s-SCP(I-ED).
Buildings 15 01220 g004
Figure 5. Comparison of the numerical residual displacement with the test results: (a) HBD; (b) s-SCP(I-ED).
Buildings 15 01220 g005
Figure 6. Definition and calculation of SC factor.
Buildings 15 01220 g006
Figure 7. Definition and calculation of ED parameter: (a) self-centering model; (b) bilinear elastic model for RSC-NED columns; (c) bilinear elastoplastic model for ED bars; (d) flag-shaped hysteresis of RSC-ED columns; (e) calculation of energy dissipation parameter.
Buildings 15 01220 g007
Figure 8. Cross-section and cyclic behavior of specimen RS (unit: mm): (a) cross-section; (b) hysteretic curve.
Buildings 15 01220 g008
Figure 9. Contribution of key parameters to SC factor under different displacements: (a) 2% displacement; (b) 3% displacement; (c) 4% displacement; (d) change in contribution.
Buildings 15 01220 g009
Figure 10. Contribution of key parameters to ED parameter under different displacements: (a) 2% displacement; (b) 3% drift; (c) 4% drift; (d) change in contribution.
Buildings 15 01220 g010
Figure 11. Influence of each parameter on SC factor: (a) aspect ratio; (b) ratio between initial stress and yield stress; (c) PT tendon ratio; (d) gravity axial load; (e) unbonded length of ED bars; (f) yield stress of ED bars; (g) ED bar ratio.
Buildings 15 01220 g011aBuildings 15 01220 g011b
Figure 12. Influence of each parameter on ED parameter: (a) aspect ratio; (b) ratio between initial stress and yield stress; (c) PT tendon ratio; (d) gravity axial load; (e) unbonded length of ED bars; (f) yield stress of ED bars; (g) ED bar ratio.
Buildings 15 01220 g012
Figure 13. Effect of SC factor on residual displacement distribution: (a) 2% displacement; (b) 3% displacement; (c) 4% displacement; (d) 5% displacement.
Buildings 15 01220 g013
Figure 14. Effect of ED parameter on residual displacement distribution.
Buildings 15 01220 g014
Figure 15. Regression analysis.
Buildings 15 01220 g015
Figure 16. Comparison of hysteretic curves between specimen L1 and L5: (a) maximum Lub; (b) minimum Lub.
Buildings 15 01220 g016
Table 1. Properties of selected specimens.
SpecimenPT1HBD2HBD1s-SCP(I-ED)
Geometry350 × 350 mm2350 × 350 mm2350 × 350 mm2400 × 400 mm2
Aspect ratio4.574.574.573.78
Total axial load200 kN300 kN200 kN533.05 kN
Tendons2 × 99 mm24 × 99 mm22 × 99 mm24Φ15.2
100 kN each75 kN each100 kN each313.05 kN total
DissipationNone4-HD204-D164-D20
12.5 mm diameter fuseReinforcing steelReinforcing steel
50 mm fuse lengthL0 = 50 mmL0 = 100 mm
fy = 586 MPafy = 304 MPafy = 349 MPa
Table 2. Comparison of the design parameters of specimens HBD1 and RS.
SpecimenWidth/mmλfc/MPaED BarρED/%fy/MPaL0/mmPT TendonρPT/%PG/kNηGPPT/kNηPT
HBD13504.5754.14D160.66304502 × 99 mm20.16002000.03
RS10504.5754.120D220.6930430012D15.20.218000.036000.01
Table 3. Two levels of the considered factors.
LevelλfcPdρPTηGL0 (mm)fy (MPa)ρED
(A)(B)(C)(D)(E)(F = ABC)(G = ABD)(H = BCDE)
Range4.42~5.2932~65.90.12~0.510.13~0.65%0~0.150~400300~6000.26~1.03%
− (low)3.5300.20.20%0.021503000.46%
+ (high)6600.40.60%0.14506001.12%
Note: Pd is the ratio between the initial stress of a PT tendon and its yield stress.
Table 4. Fractional factorial design.
Case
(Level)
Basic DesignGenerated from Basic Design
λfcPdρPTηGL0fyρED
(A)(B)(C)(D)(E)(F = ABC)(G = ABD)(H = BCDE)
1−1−1−1−1−1−1−11
21−1−1−1−1111
3−11−1−1−111−1
411−1−1−1−1−1−1
5−1−11−1−11−1−1
61−11−1−1−11−1
7−111−1−1−111
8111−1−11−11
9−1−1−11−1−11−1
101−1−11−11−1−1
11−11−11−11−11
1211−11−1−111
13−1−111−1111
141−111−1−1−11
15−1111−1−1−1−1
17−1−1−1−11−1−1−1
181−1−1−1111−1
19−11−1−11111
2011−1−11−1−11
21−1−11−111−11
221−11−11−111
23−111−11−11−1
24111−111−1−1
25−1−1−111−111
261−1−1111−11
27−11−1111−1−1
2811−111−11−1
29−1−111111−1
301−1111−1−1−1
31−11111−1−11
3211111111
Table 5. Coefficient values of the regression model for β.
DisplacementCoefficients
a0a1a2a3a4a5a6
2%0.760 −0.062−0.060 −0.106 −0.154 0.148 0.179
3%0.749 −0.062−0.062 −0.115 −0.161 0.130 0.173
4%0.746 −0.063−0.061 −0.118 −0.157 0.119 0.173
Table 6. Denotations of specimens in the parametric study.
ParametersDenotationParameter Values for Each Specimen
λA1, A2, A3, A4, A5 (A1–A5)3.6, 4.6, 5.5, 6.5, 7.4
PdPD1, PD2, PD3, PD4, PD5, PD6 (PD1–PD6)0.15, 0.2, 0.3, 0.4, 0.5, 0.6
ρ PT PT1, PT2, PT3, PT4, PT5, PT6 (PT1–PT6)0.13%, 0.2%, 0.26%, 0.33%, 0.4%, 0.53%
η G G1, G2, G3, G4, G5 (G1–G5)0.03, 0.045, 0.06, 0.075, 0.091
L0L1, L2, L3, L4, L5 (L1–L5)300 mm, 400 mm, 500 mm, 600 mm, 700 mm
fyF1, F2, F3, F4, F5 (F1–F5)304 MPa, 350 MPa, 400 MPa, 450 MPa, 500 MPa
ρ ED E1, E2, E3, E4, E5, E6 (E1–E6)0.46%, 0.69%, 0.89%, 1.12%, 1.46%, 2.28%
Table 7. Comparison of the test results with predictive results.
SpecimensDisplacementSC FactorED ParameterResidual Displacement (%)
TestUpper LimitPredictive Result
HBD12%10.980.9410.54
3%0.980.971.551.531.04
HBD22%1.40.830.230.60
Disclaimer/Publisher’s Note: The statements, opinions and data contained in all publications are solely those of the individual author(s) and contributor(s) and not of MDPI and/or the editor(s). MDPI and/or the editor(s) disclaim responsibility for any injury to people or property resulting from any ideas, methods, instructions or products referred to in the content.

