
Heat Transfer Analysis of Ventilated Photovoltaic Wall Panels with Curved Ribs for Different Parametric Cavity Structures


Abstract
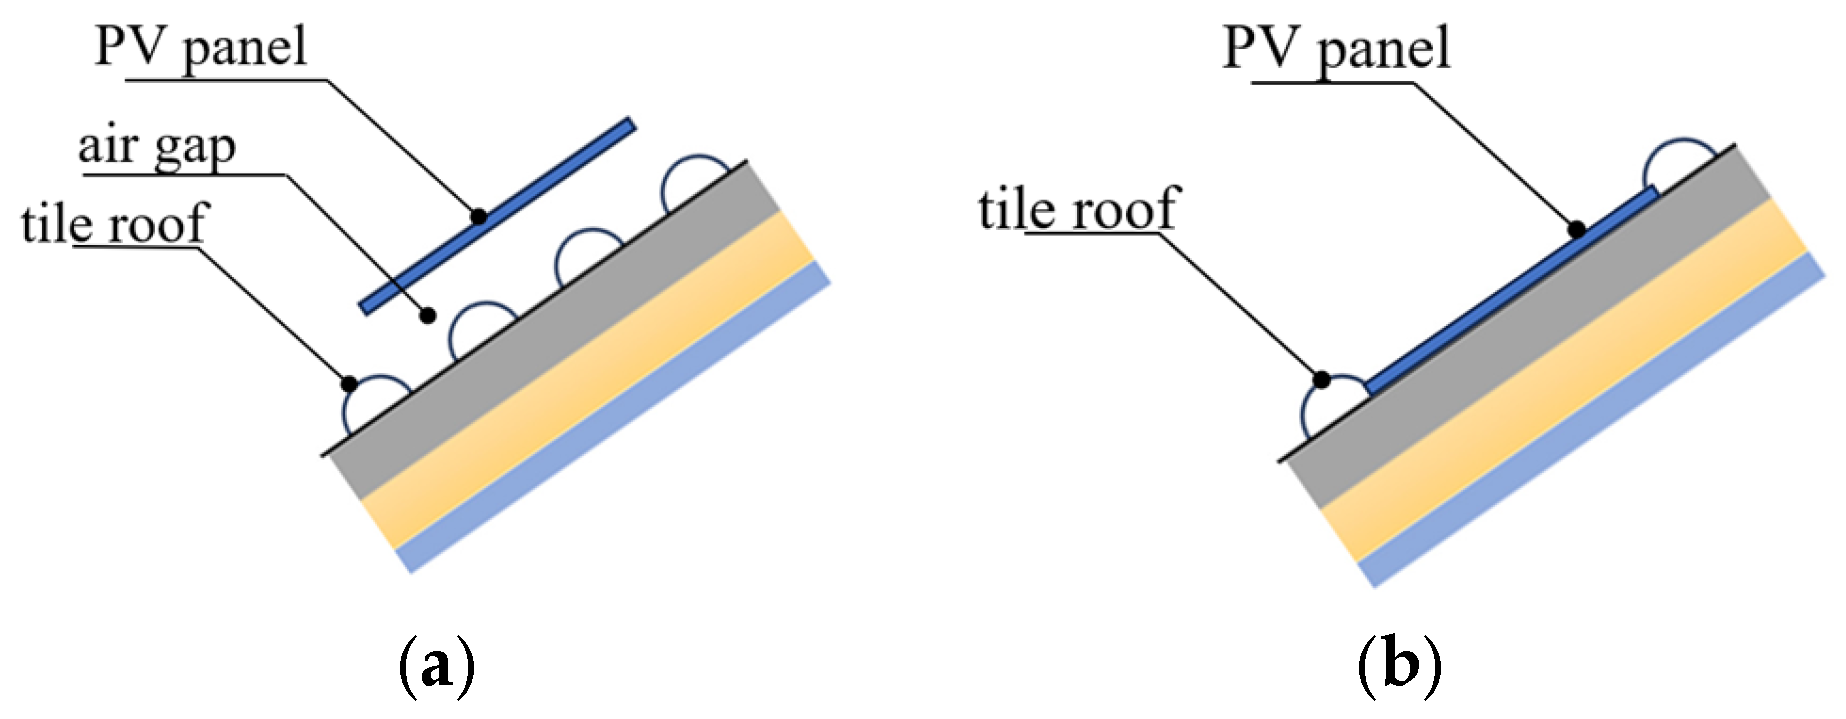
1. Introduction
2. Methods
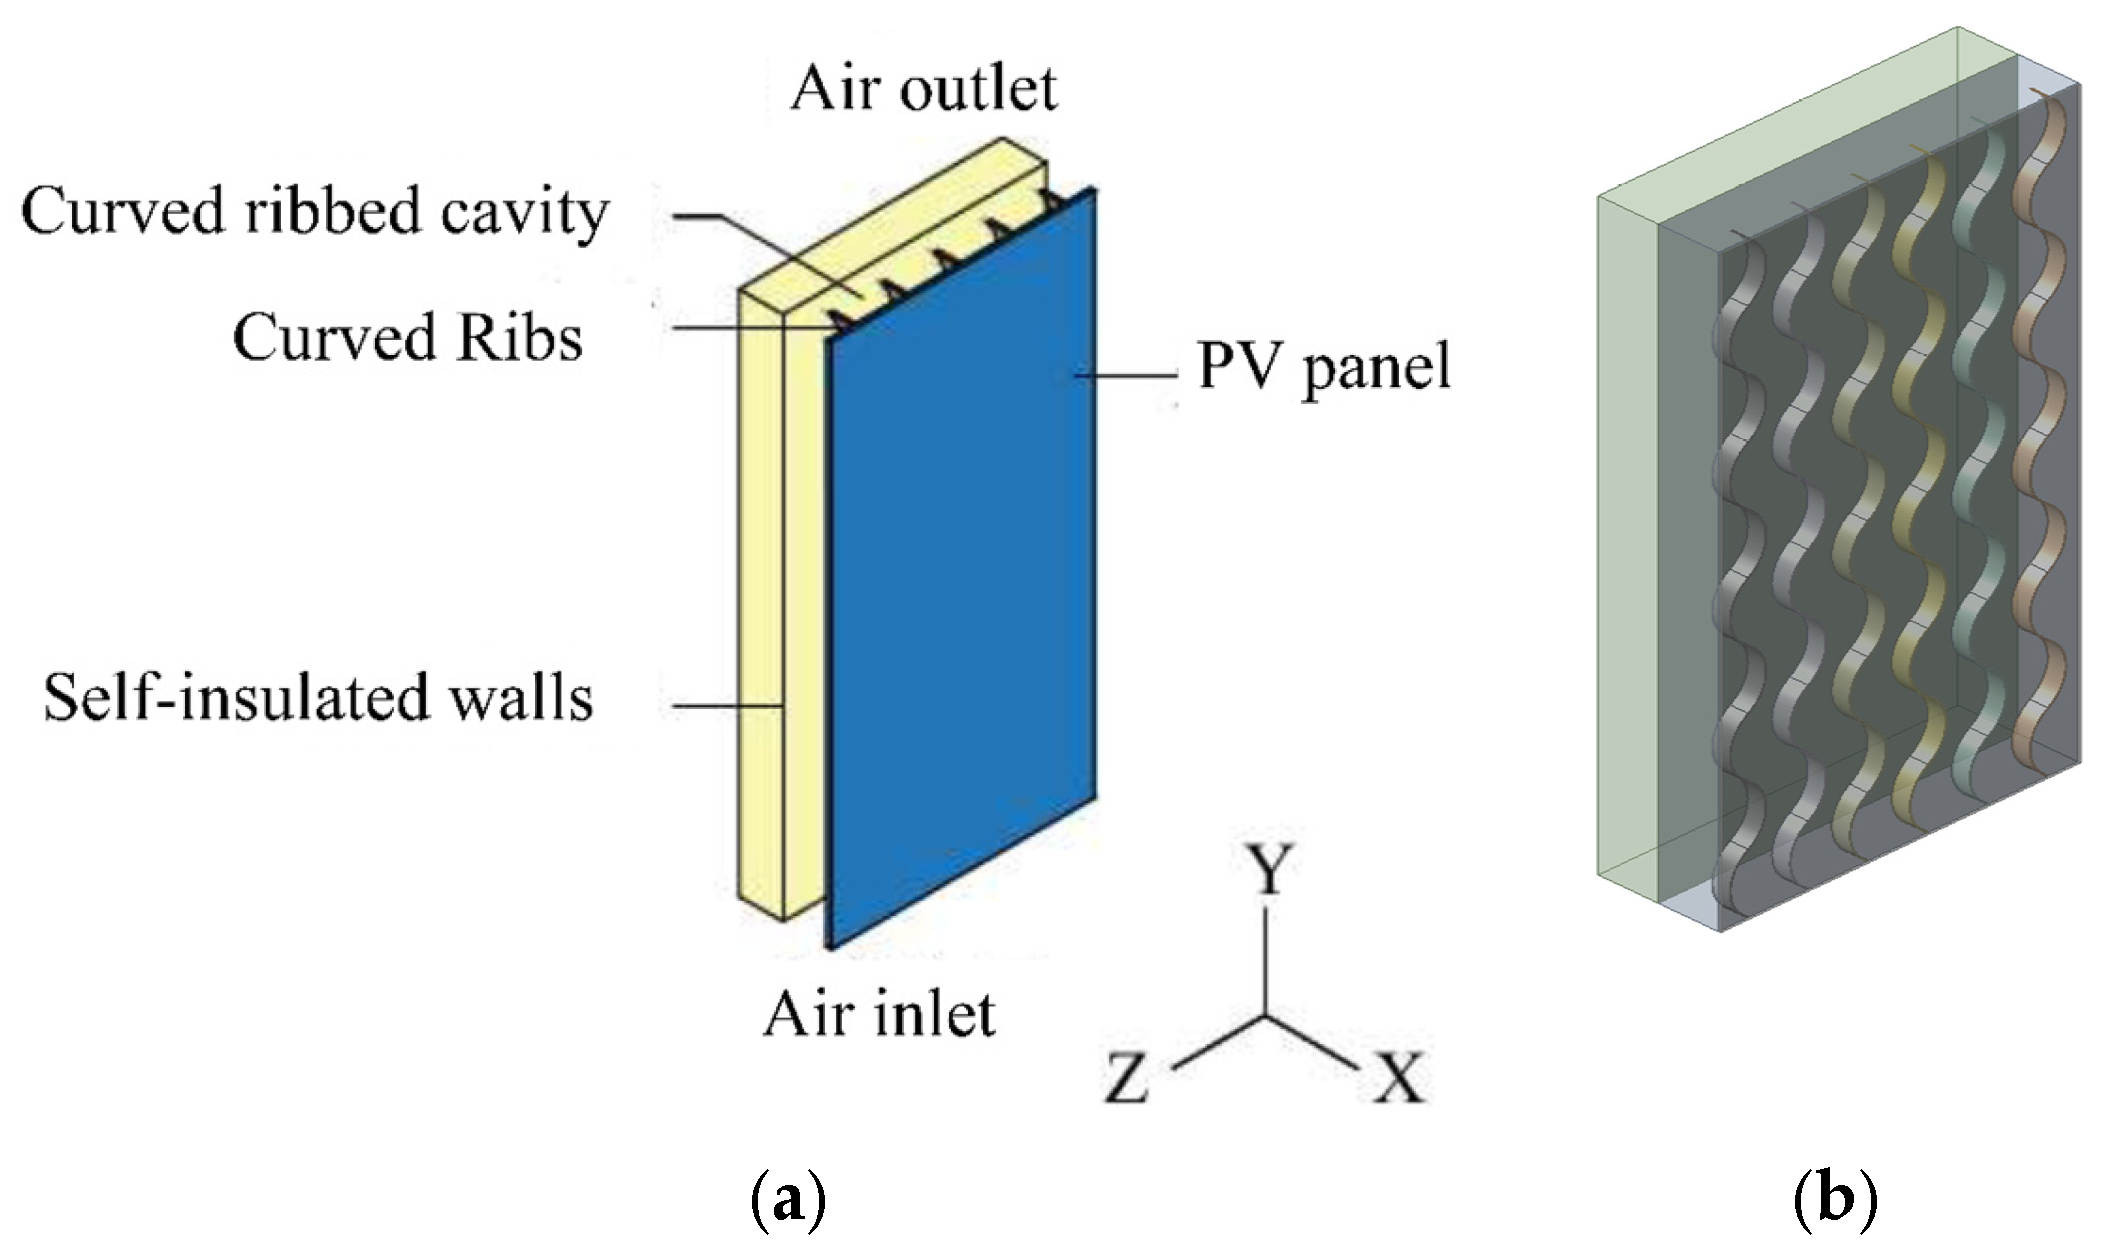
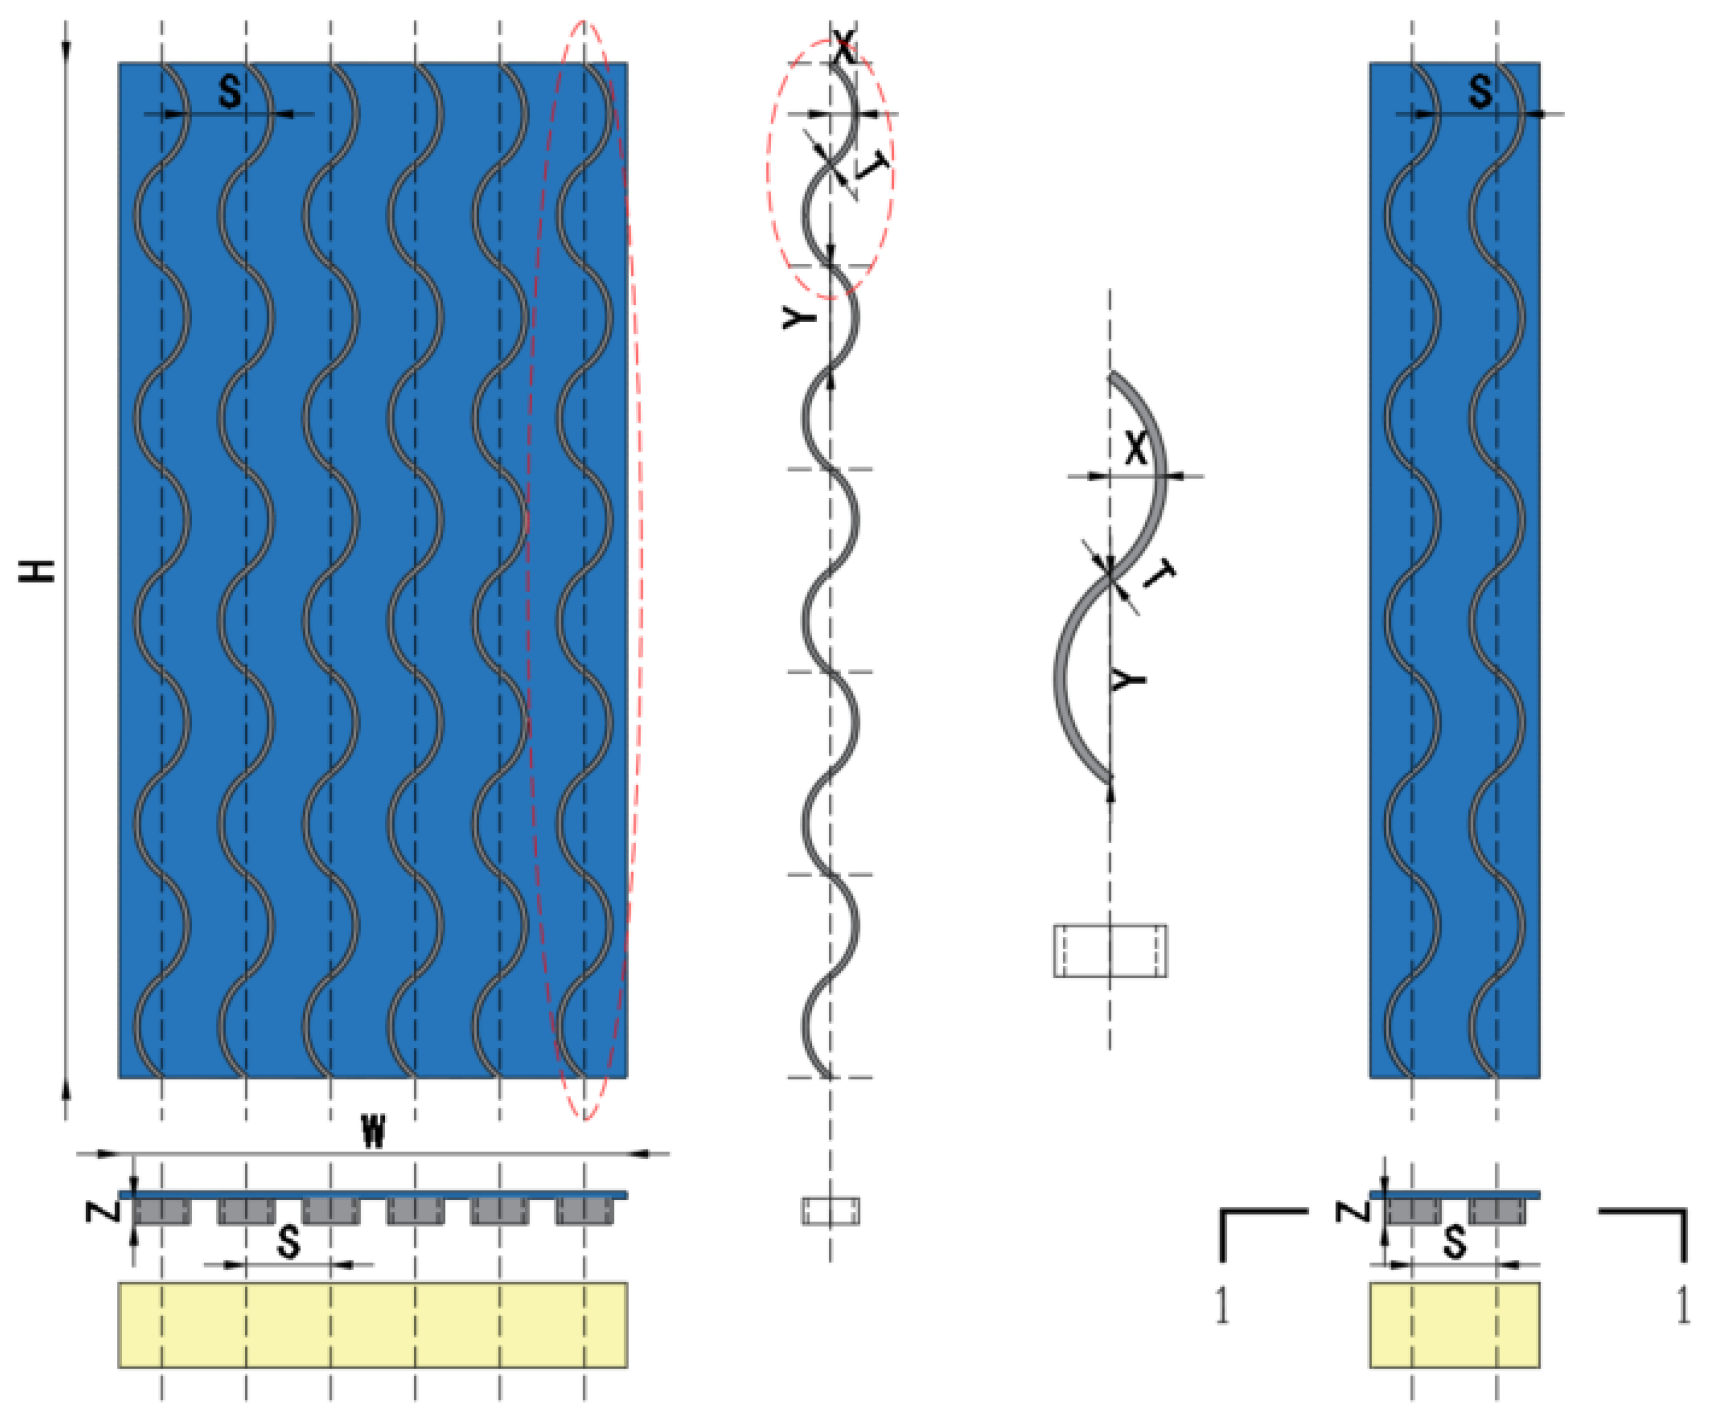
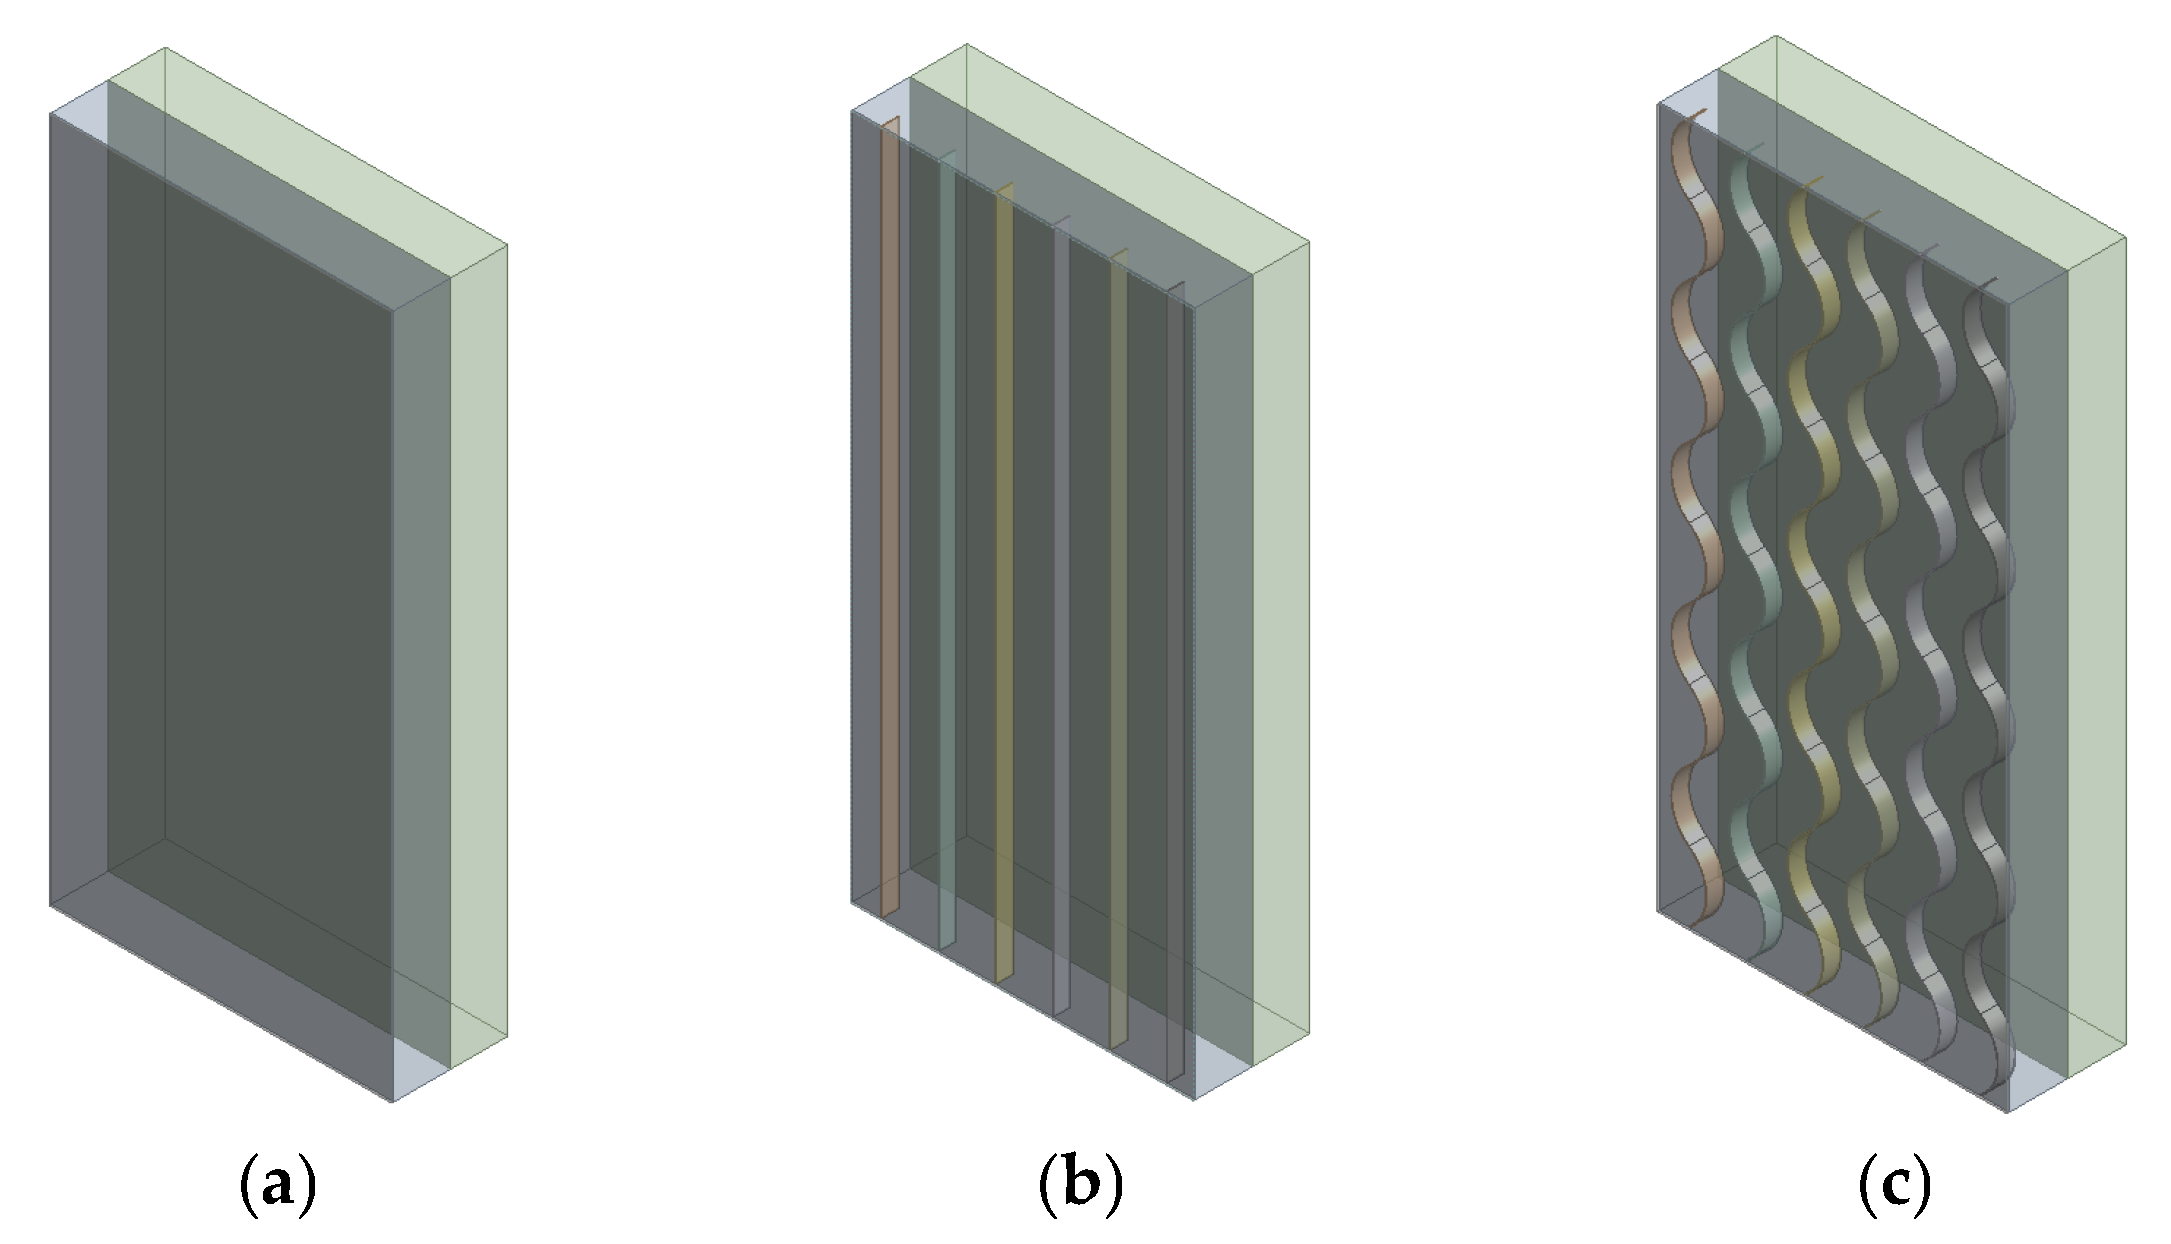
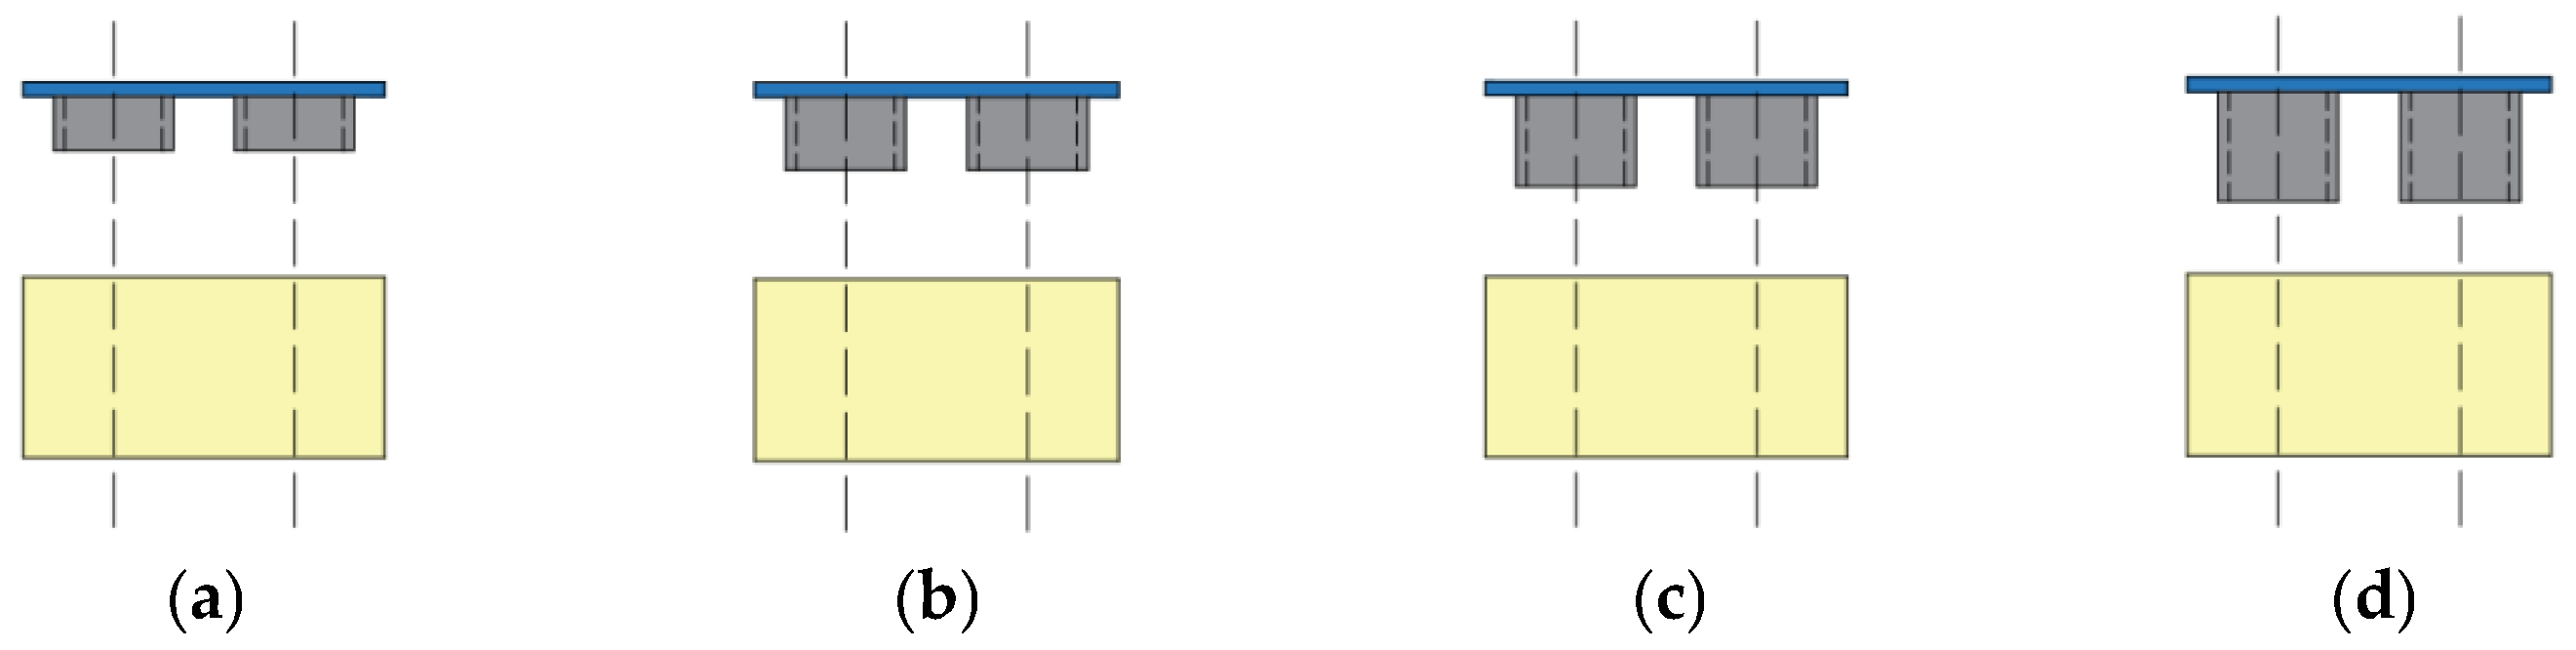
2.1. Geometric Model
2.2. Mathematical Models
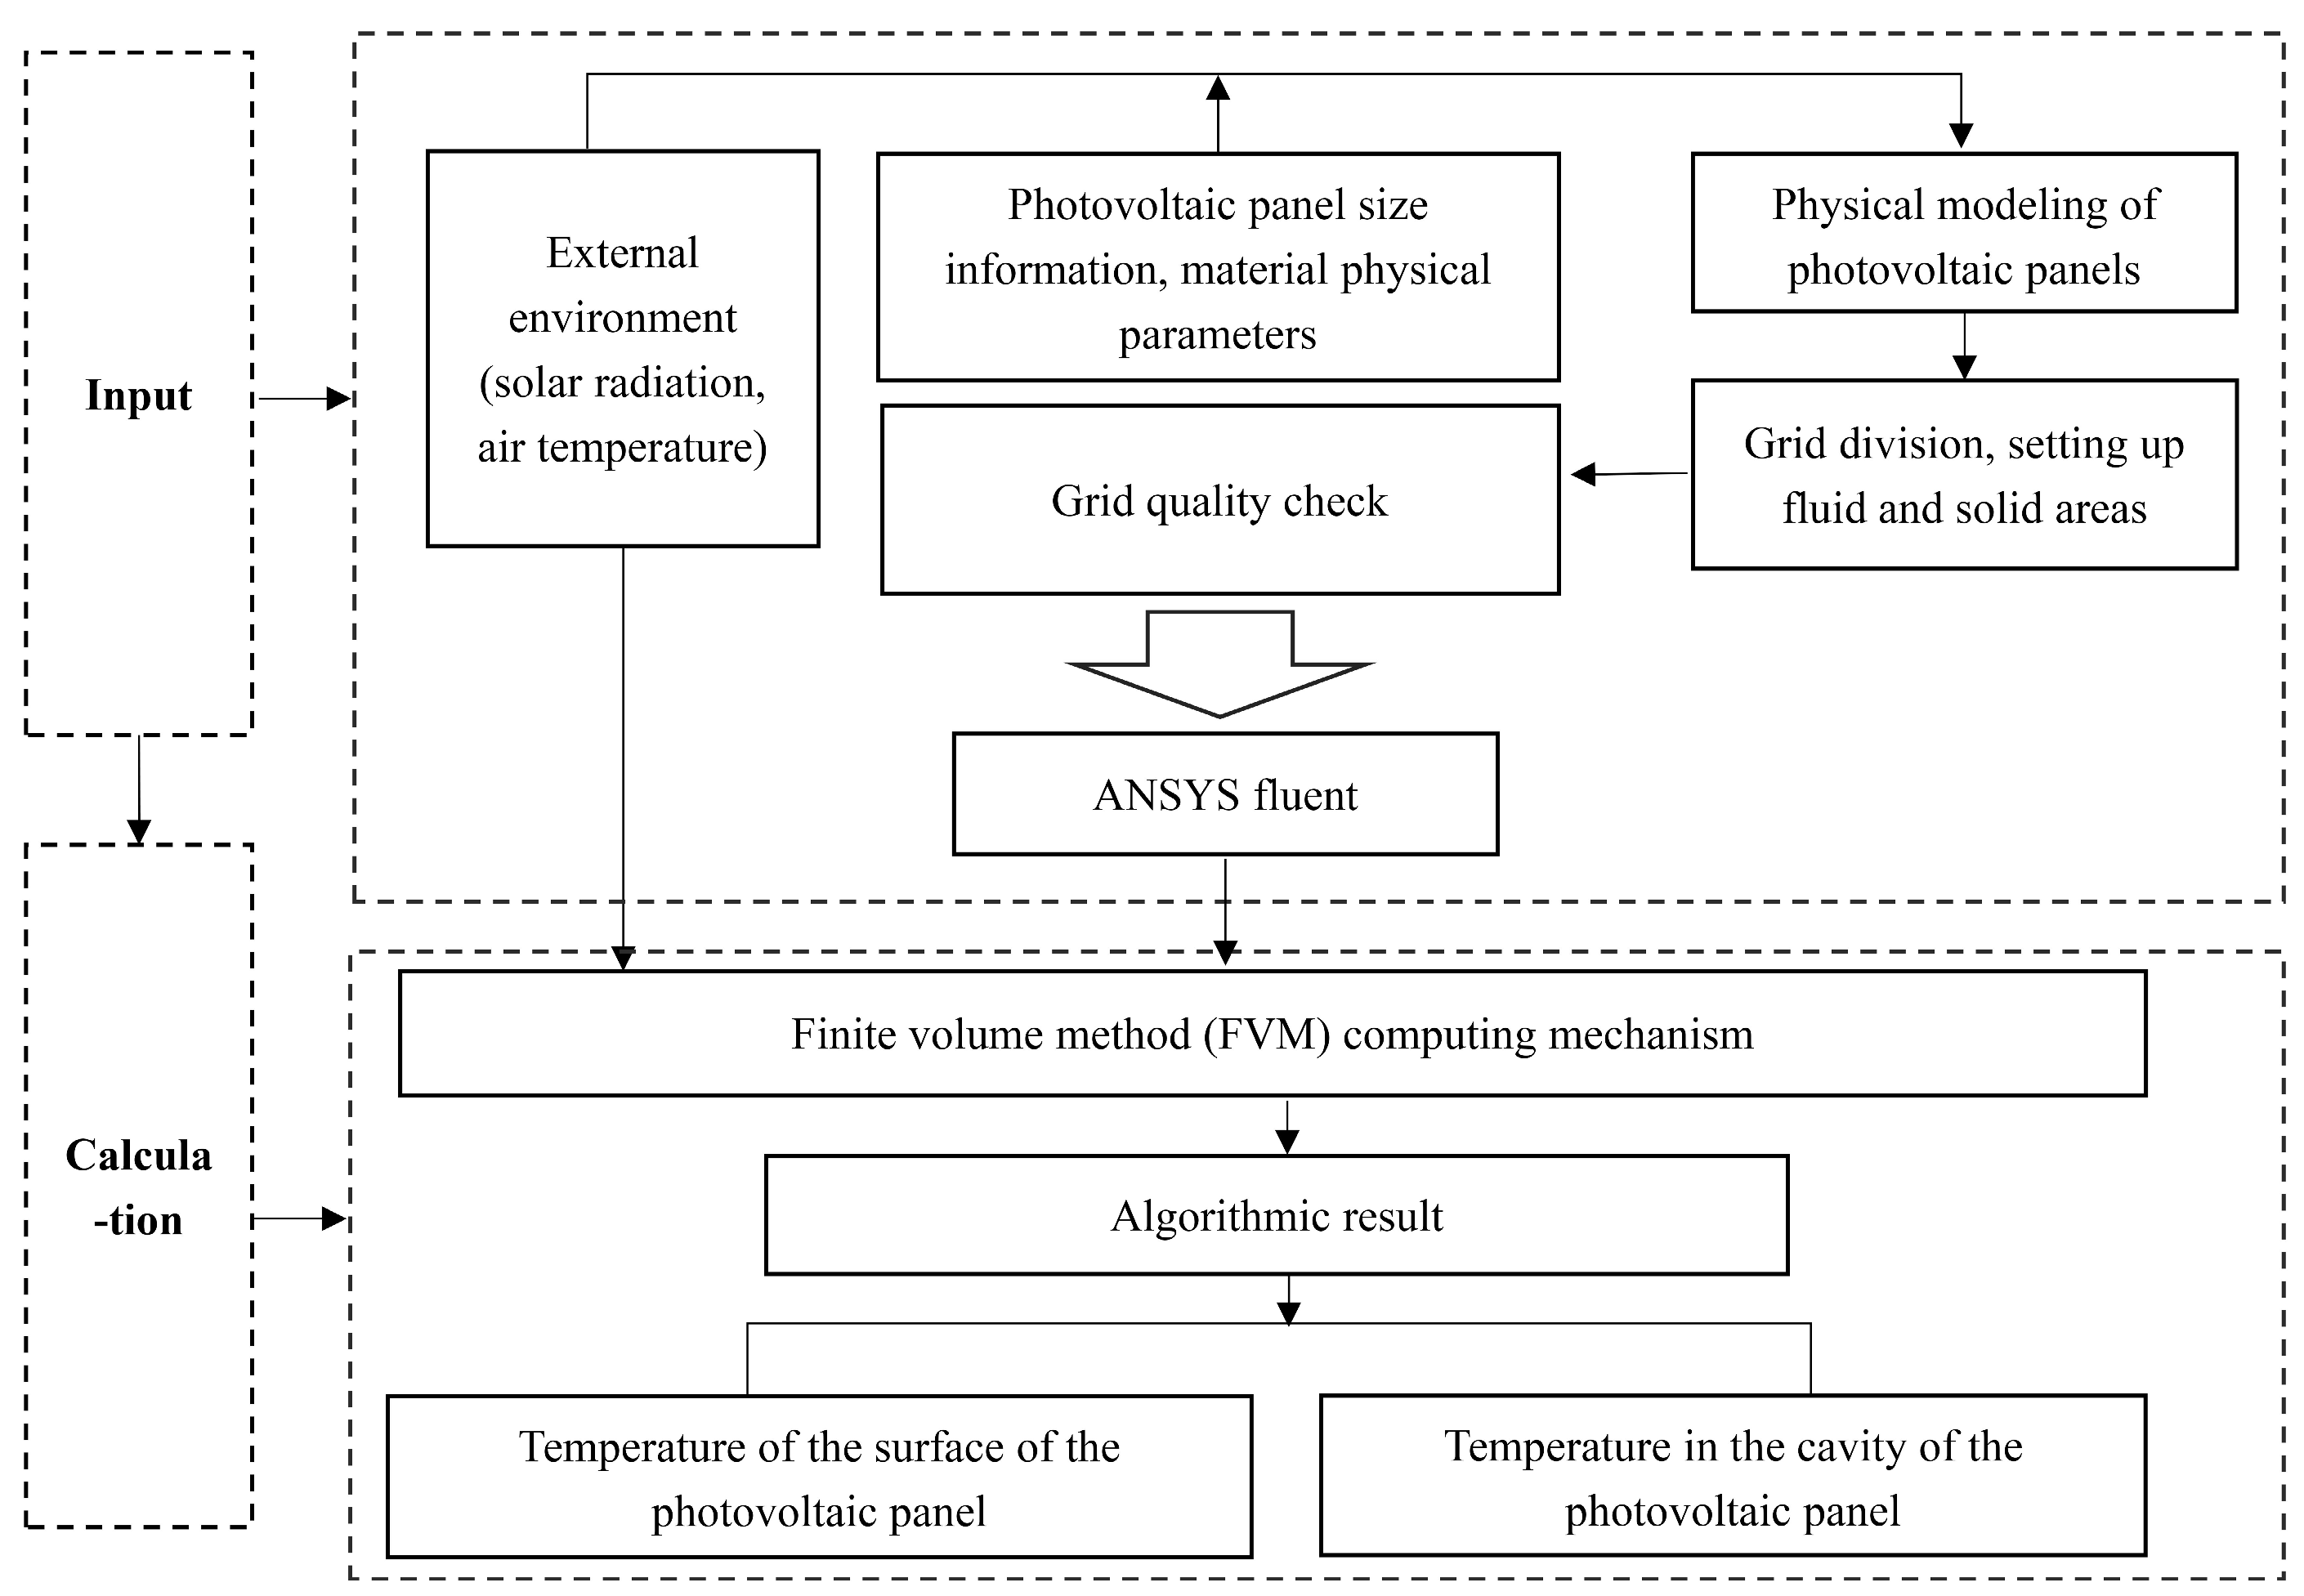
2.2.1. Computing Modules
2.2.2. Assumptions and Boundary Condition
2.2.3. Governing Equation
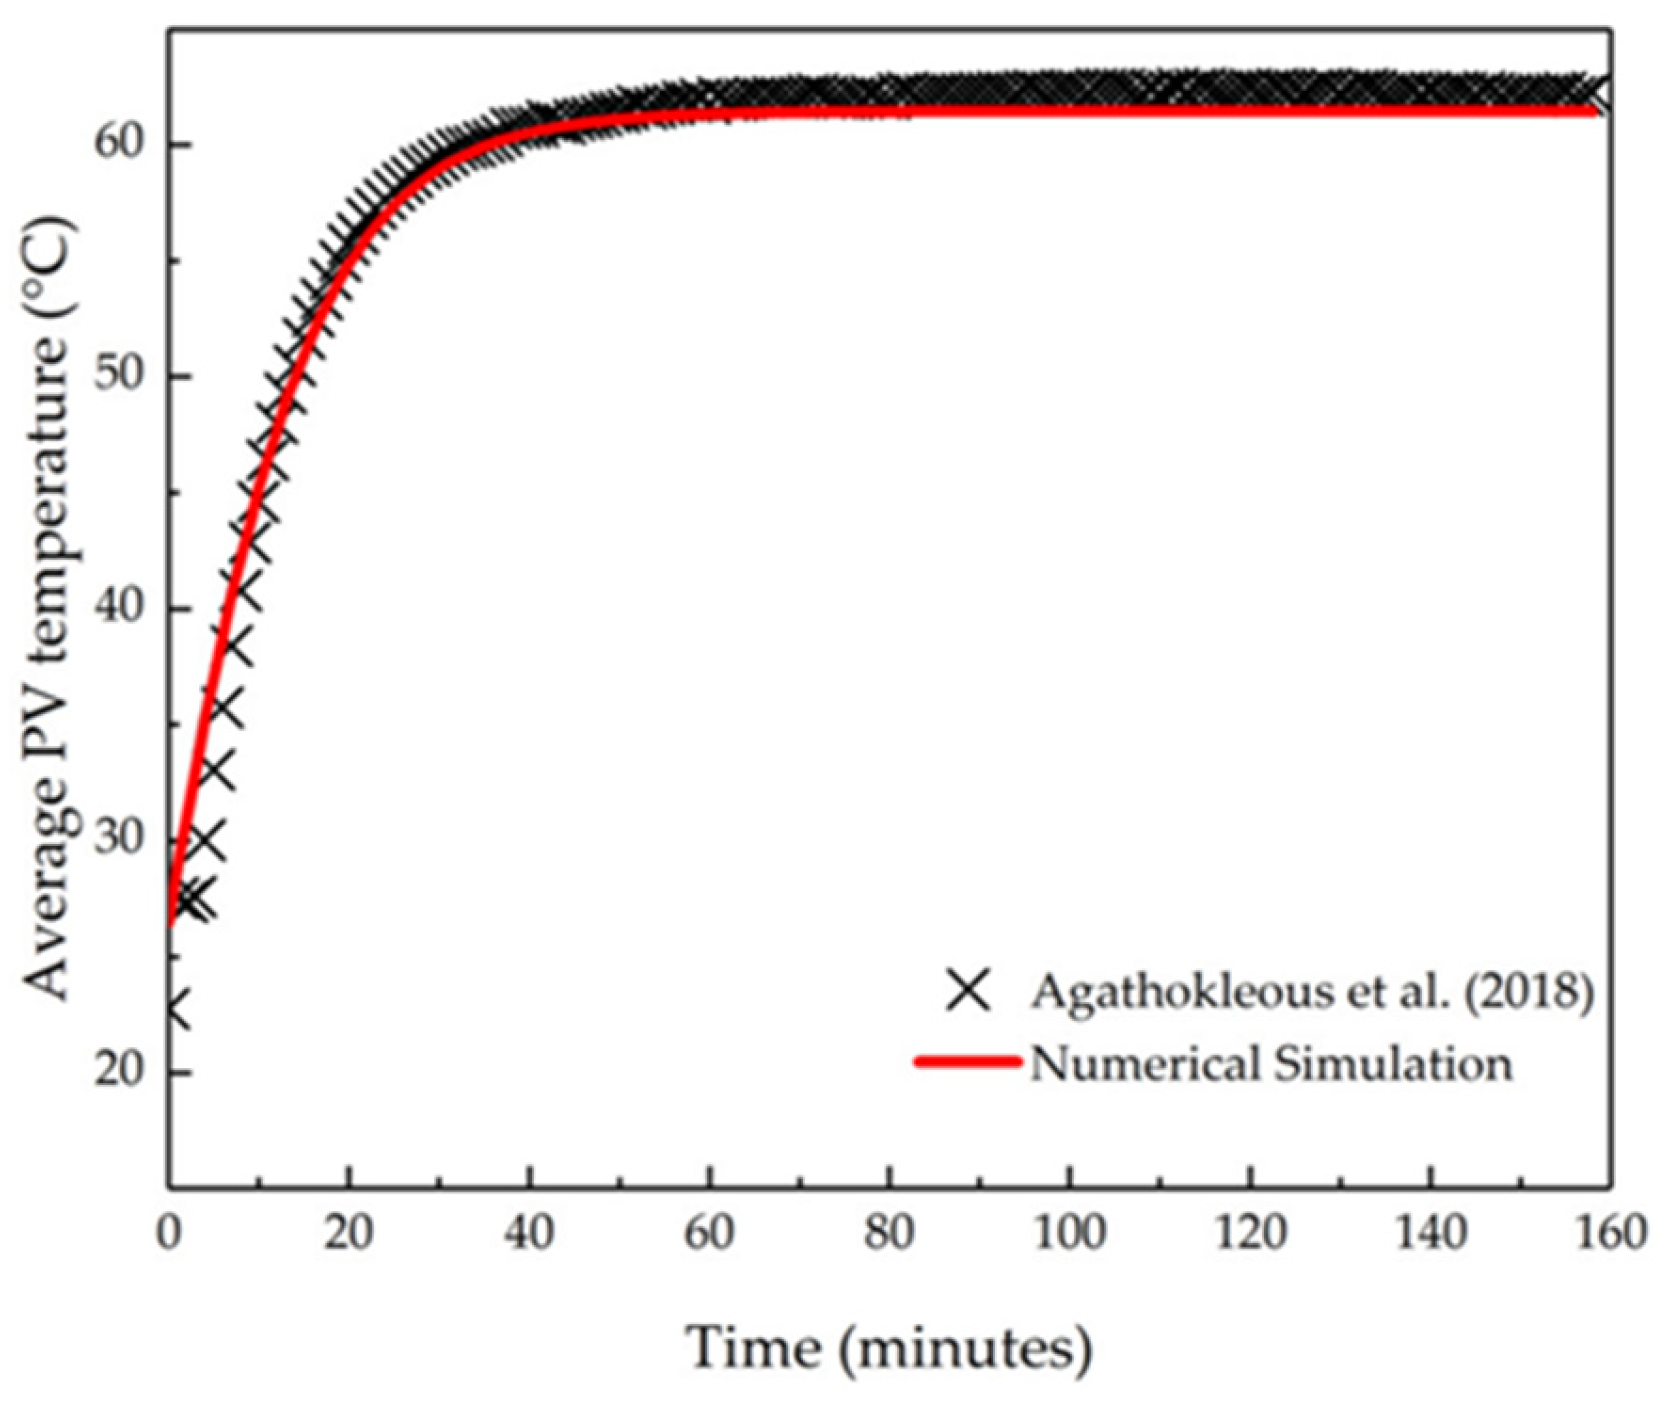
2.3. Model Validation
3. Results and Discussion
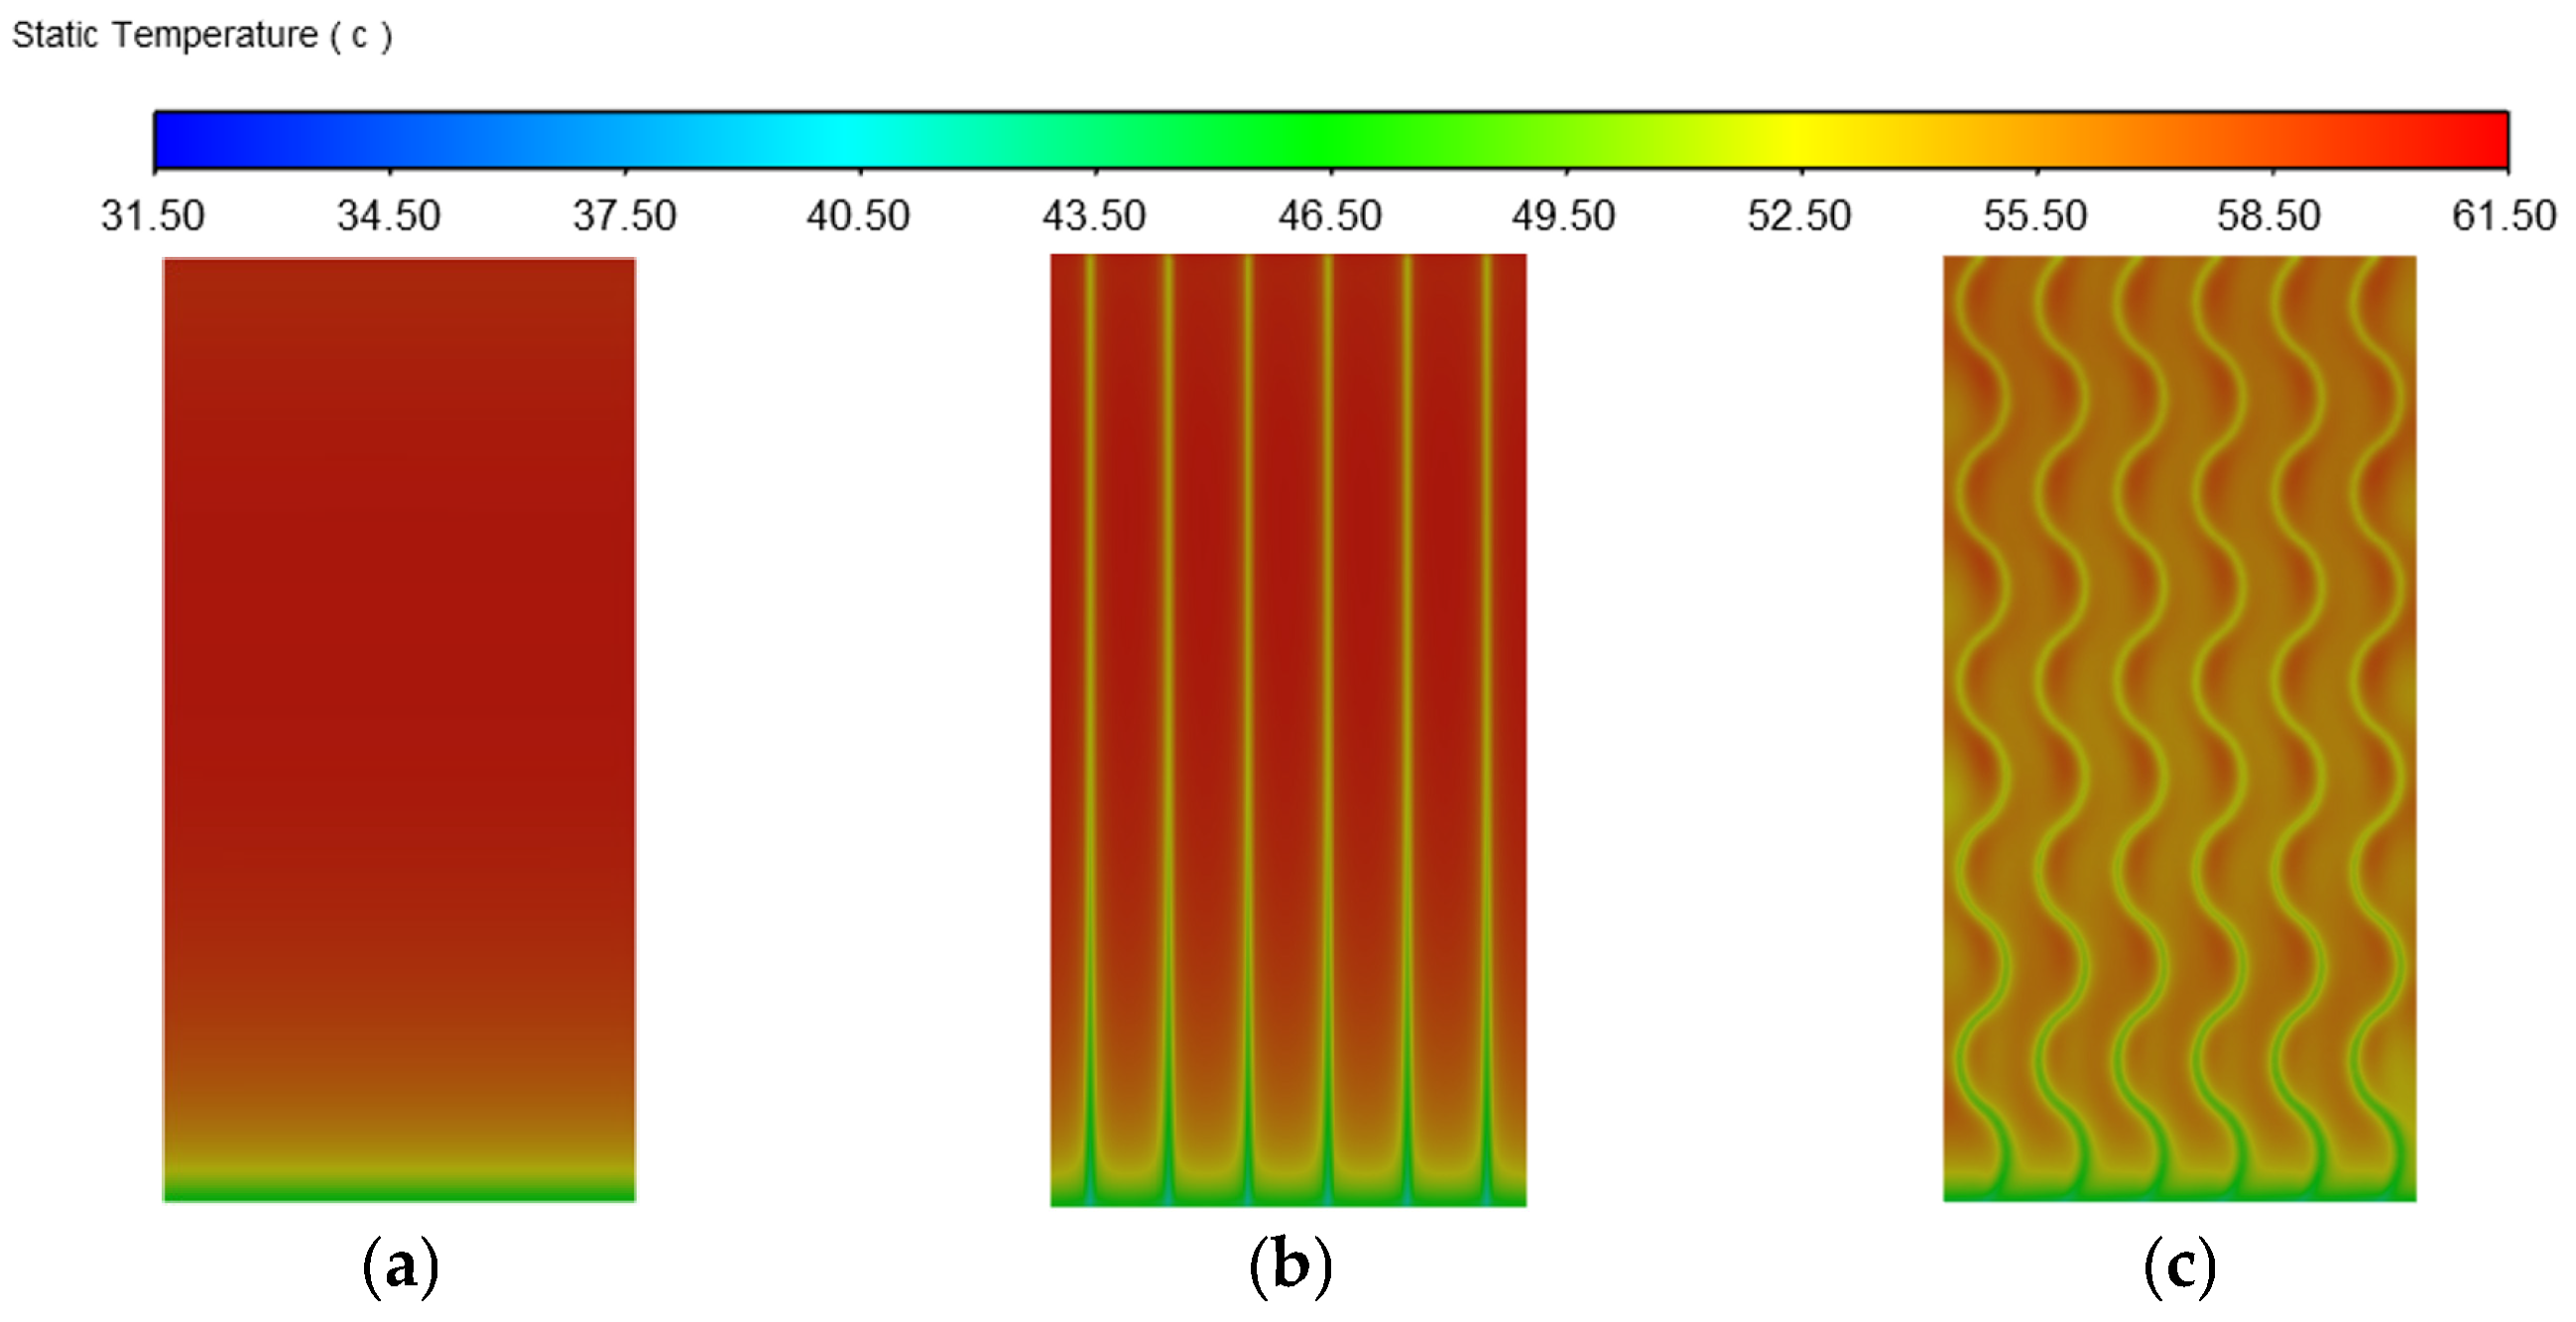
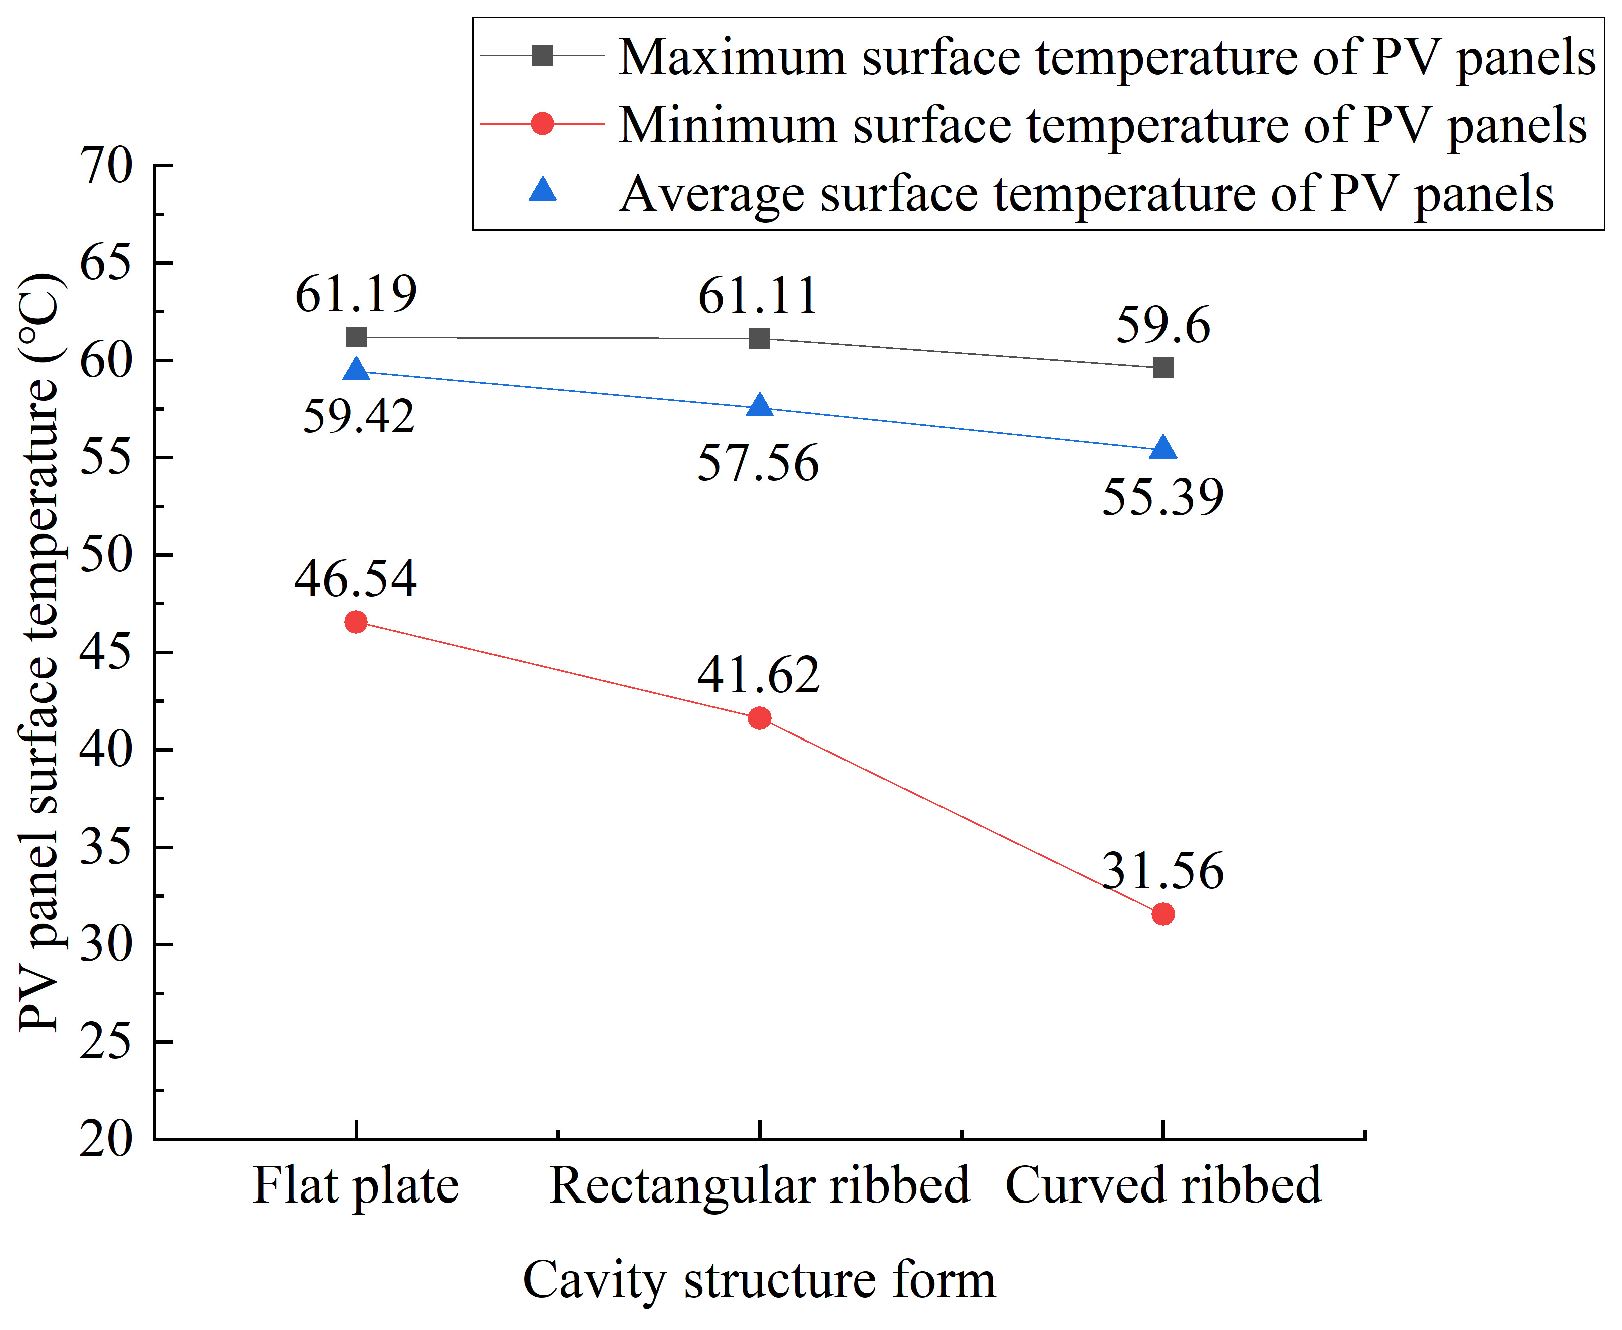
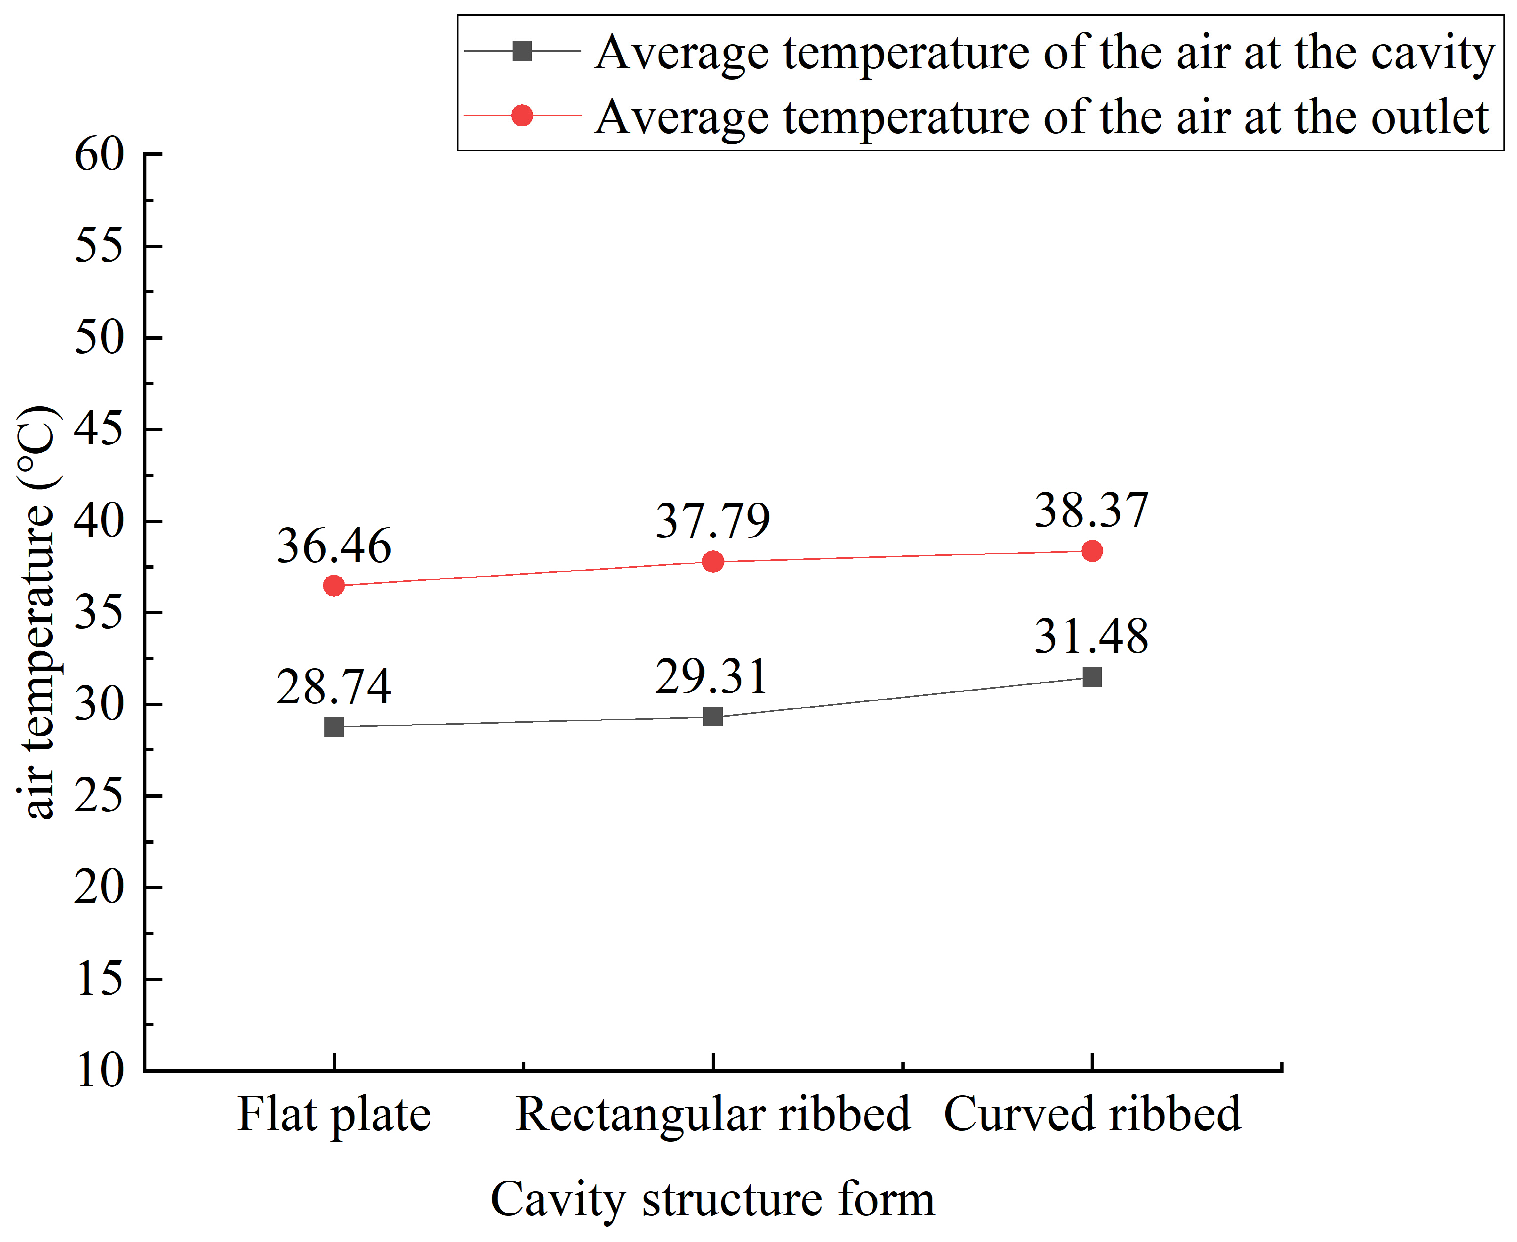
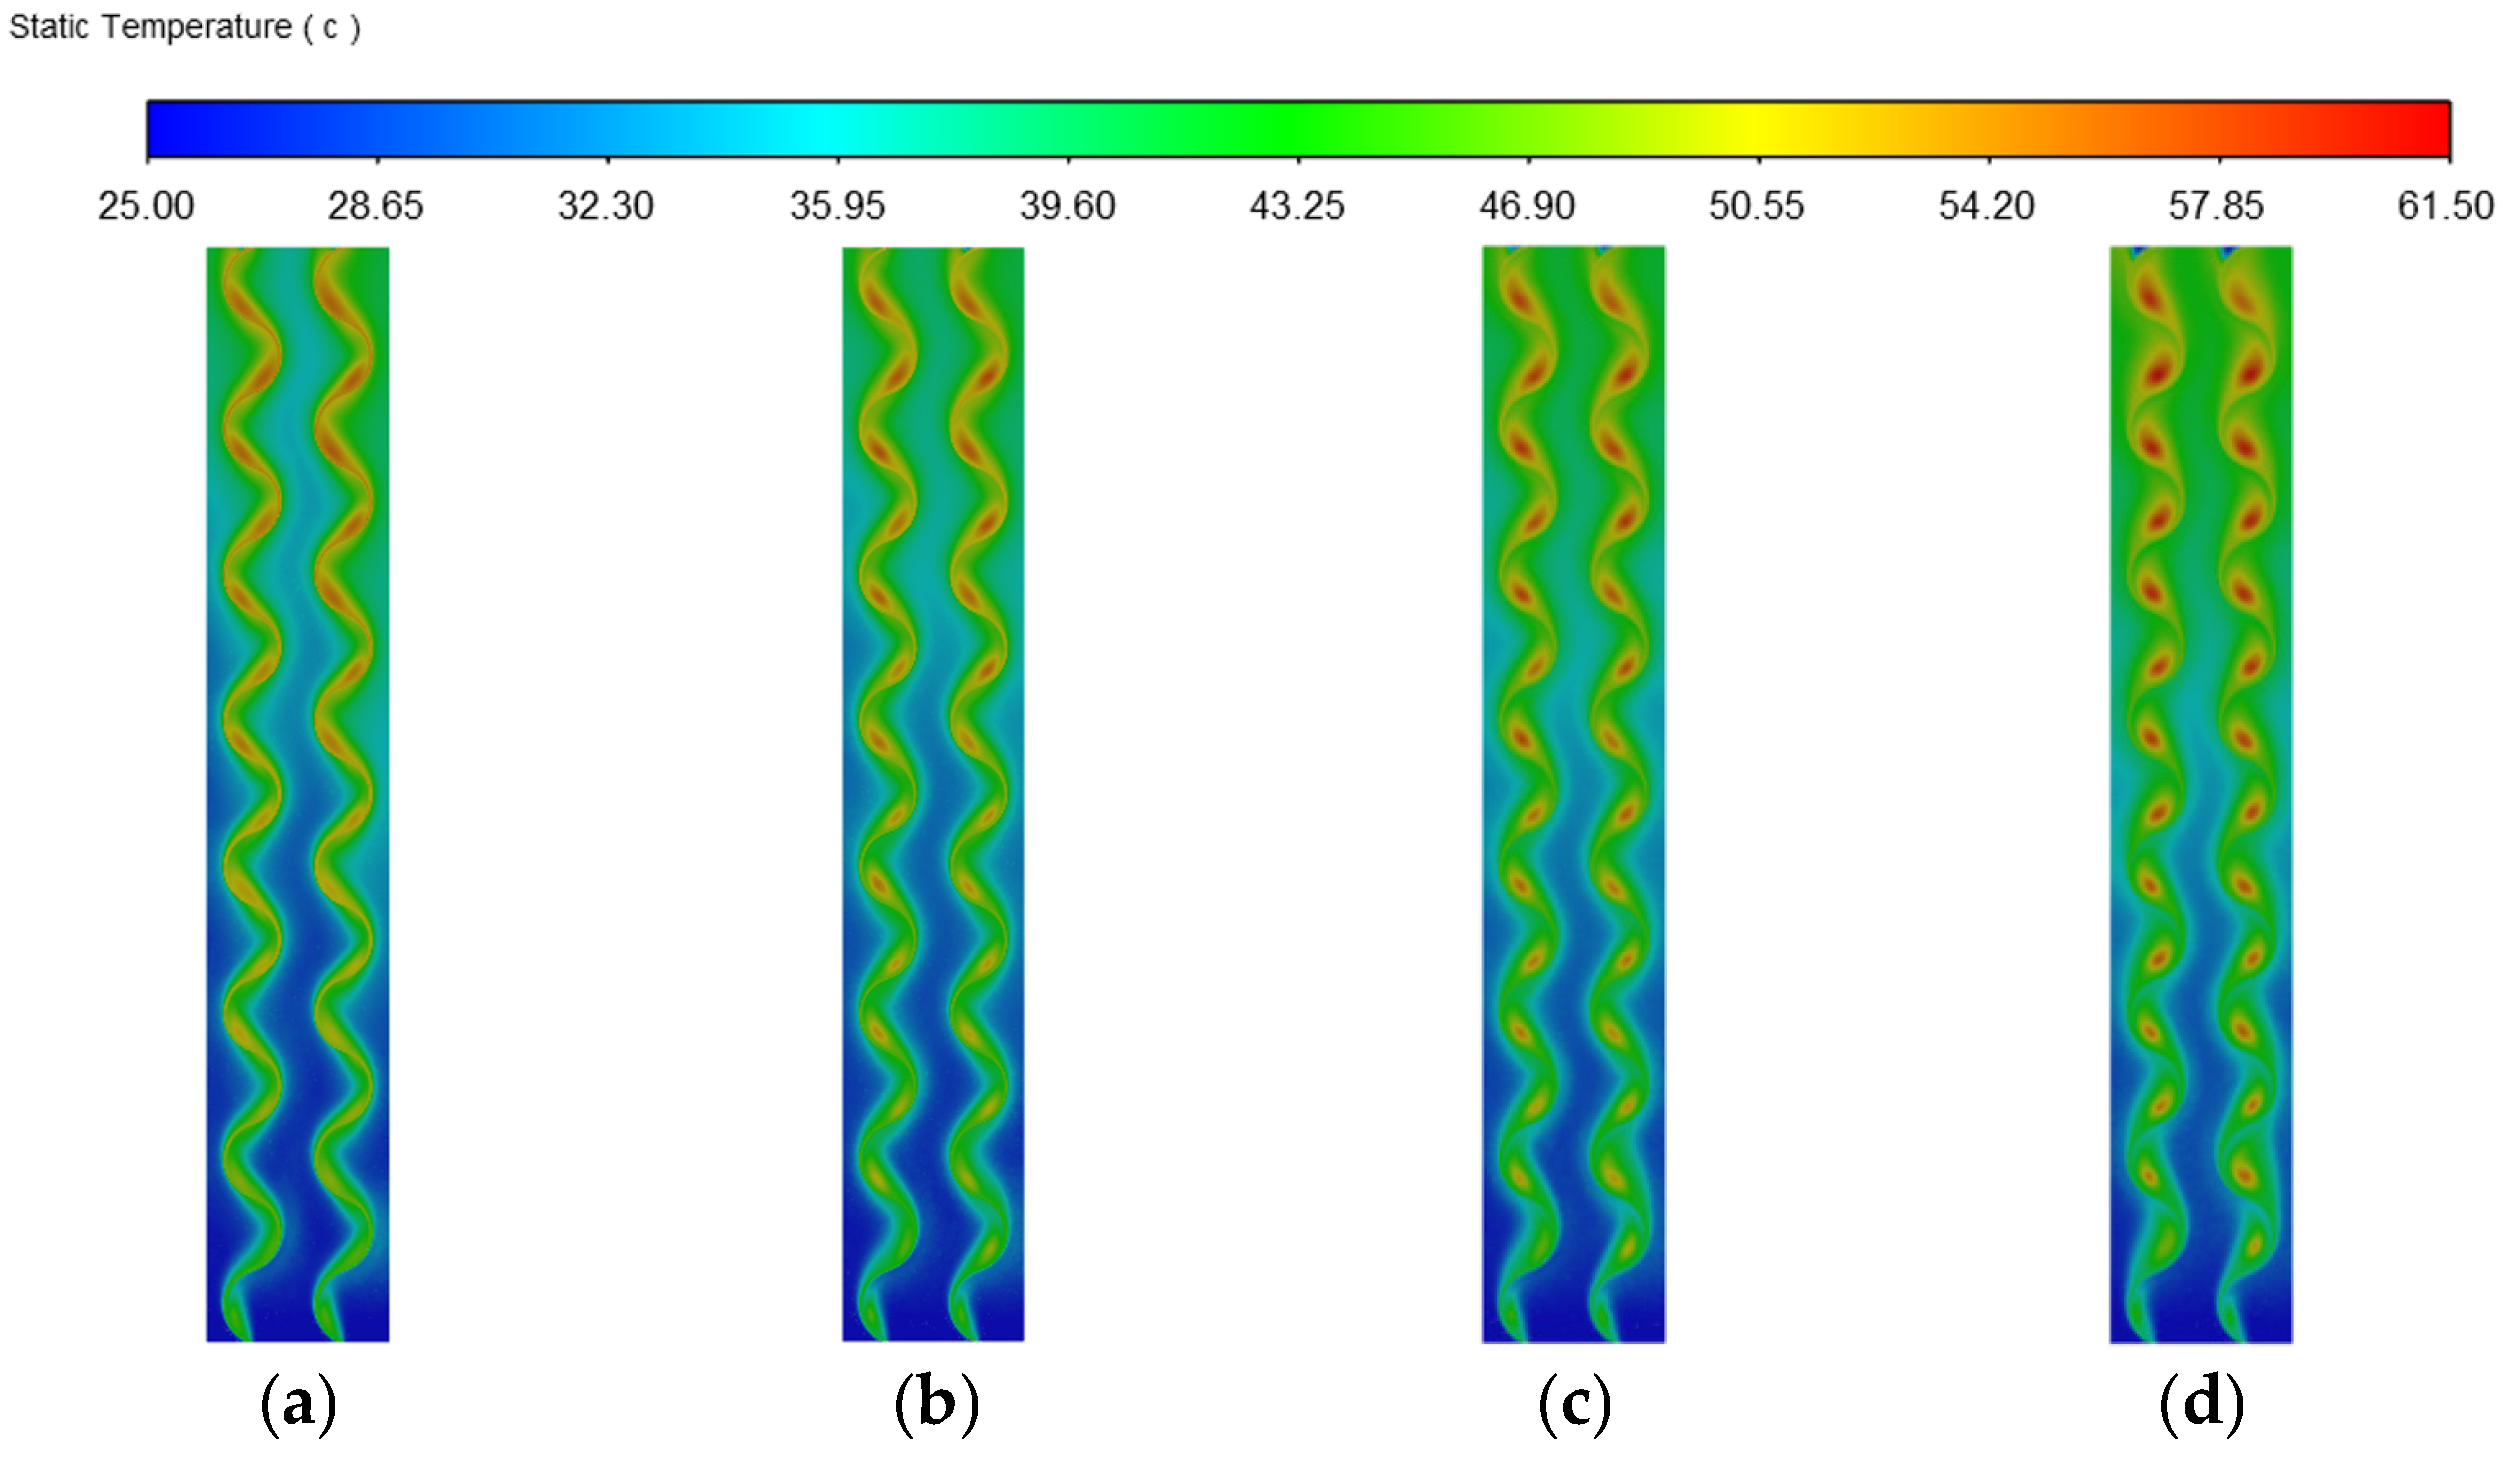
3.1. Comparative Analysis of Different Cavity Structures
3.2. Parameter Setting and Optimization Study of Curved-Rib Cavity Structure
3.2.1. Parameter Setting of the Curved-Rib Cavity Structure
3.2.2. Optimization Study of Curved-Rib Cavity Structure
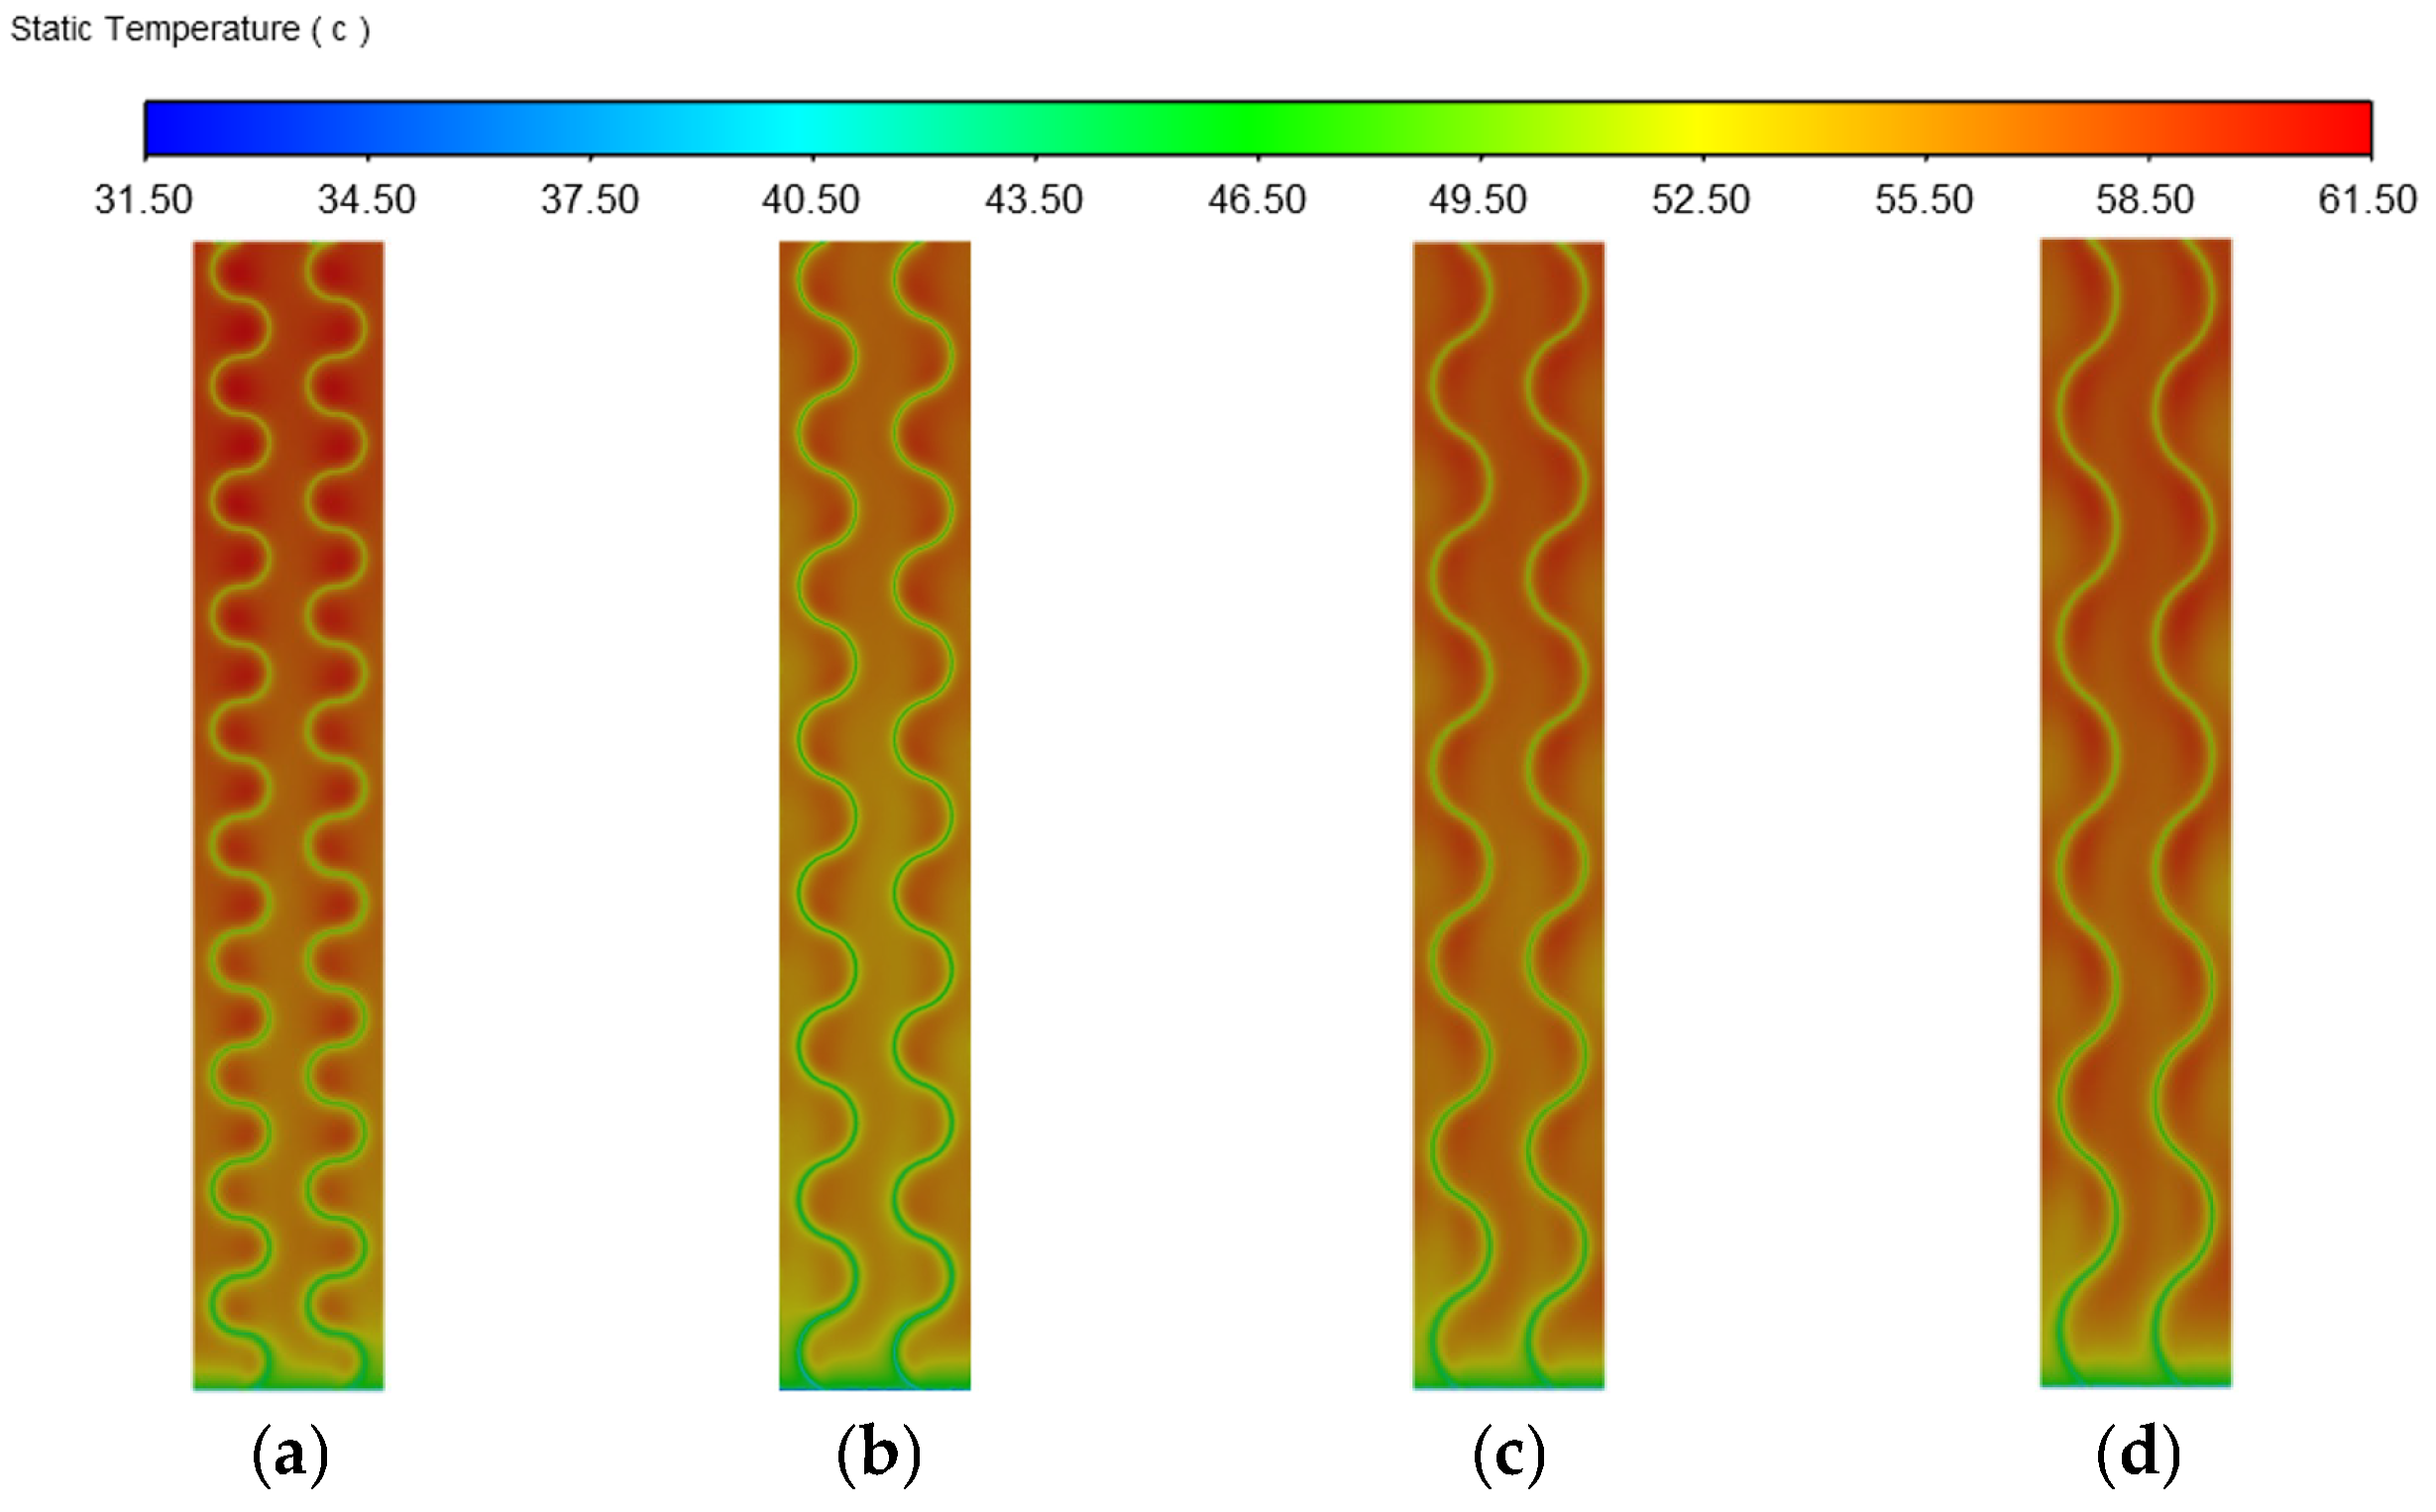
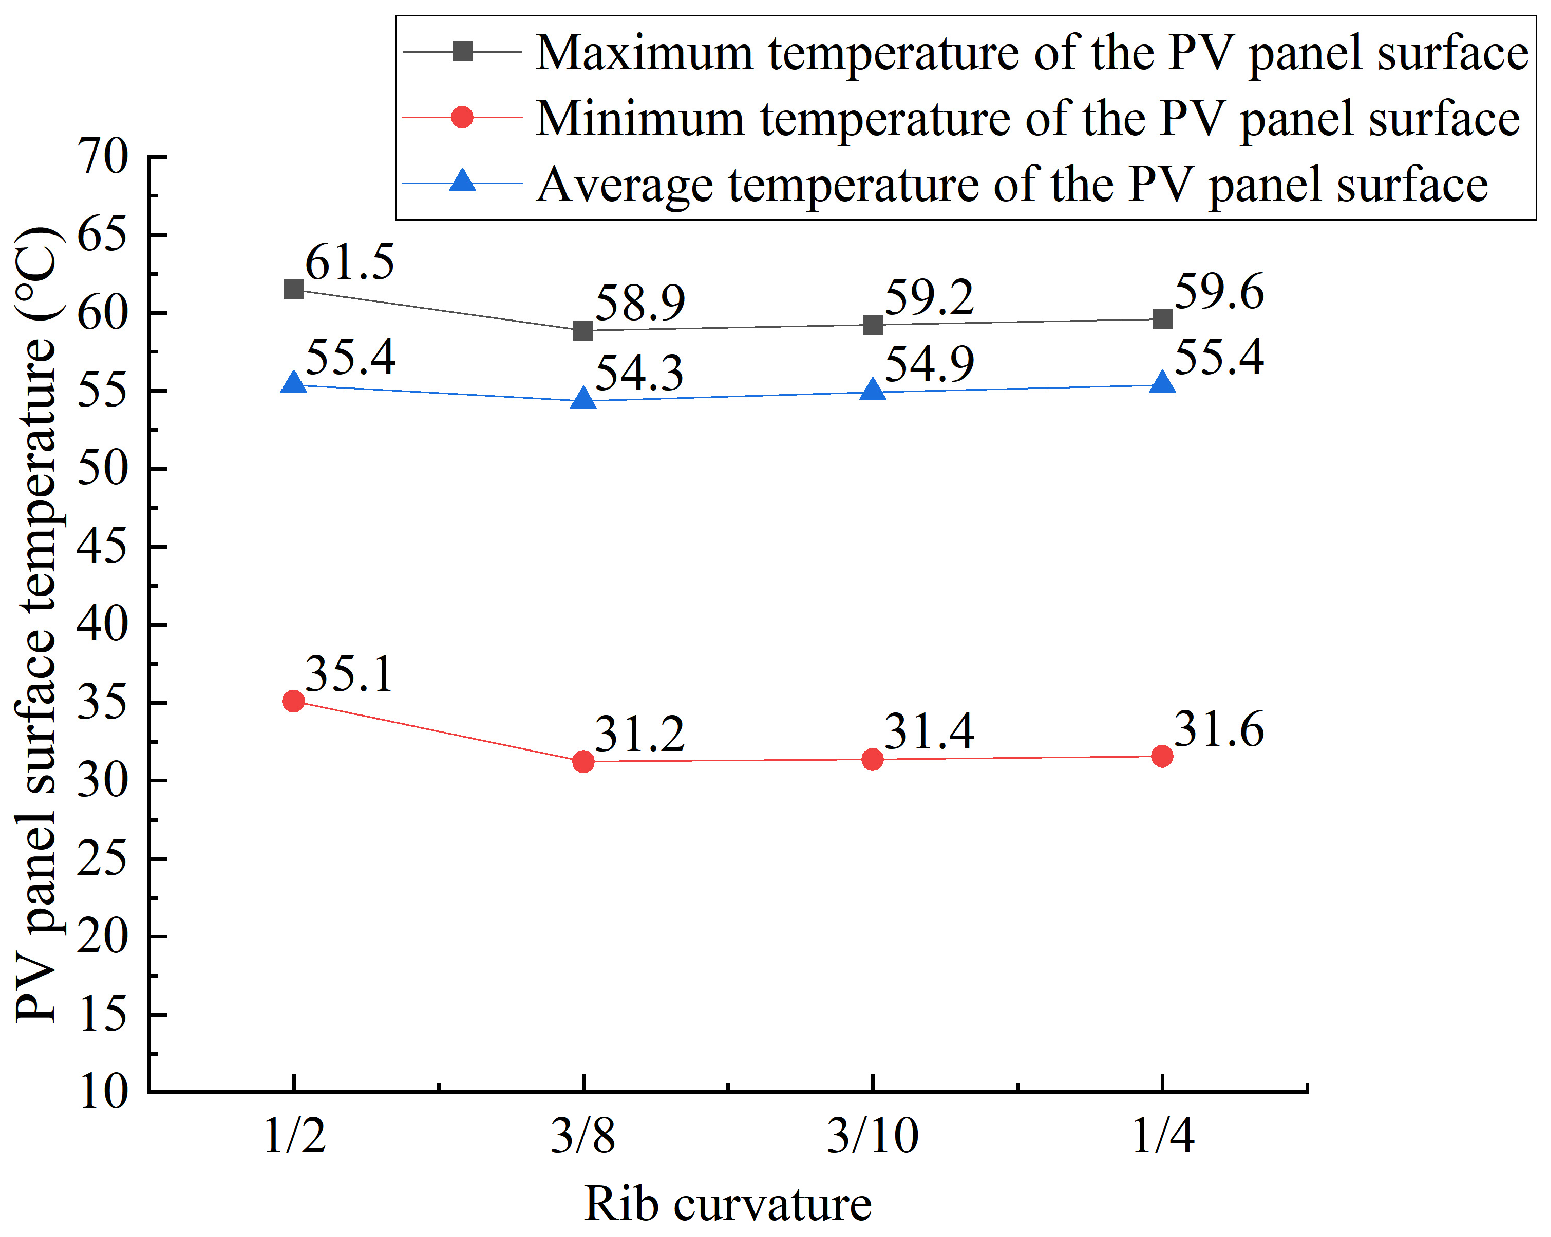
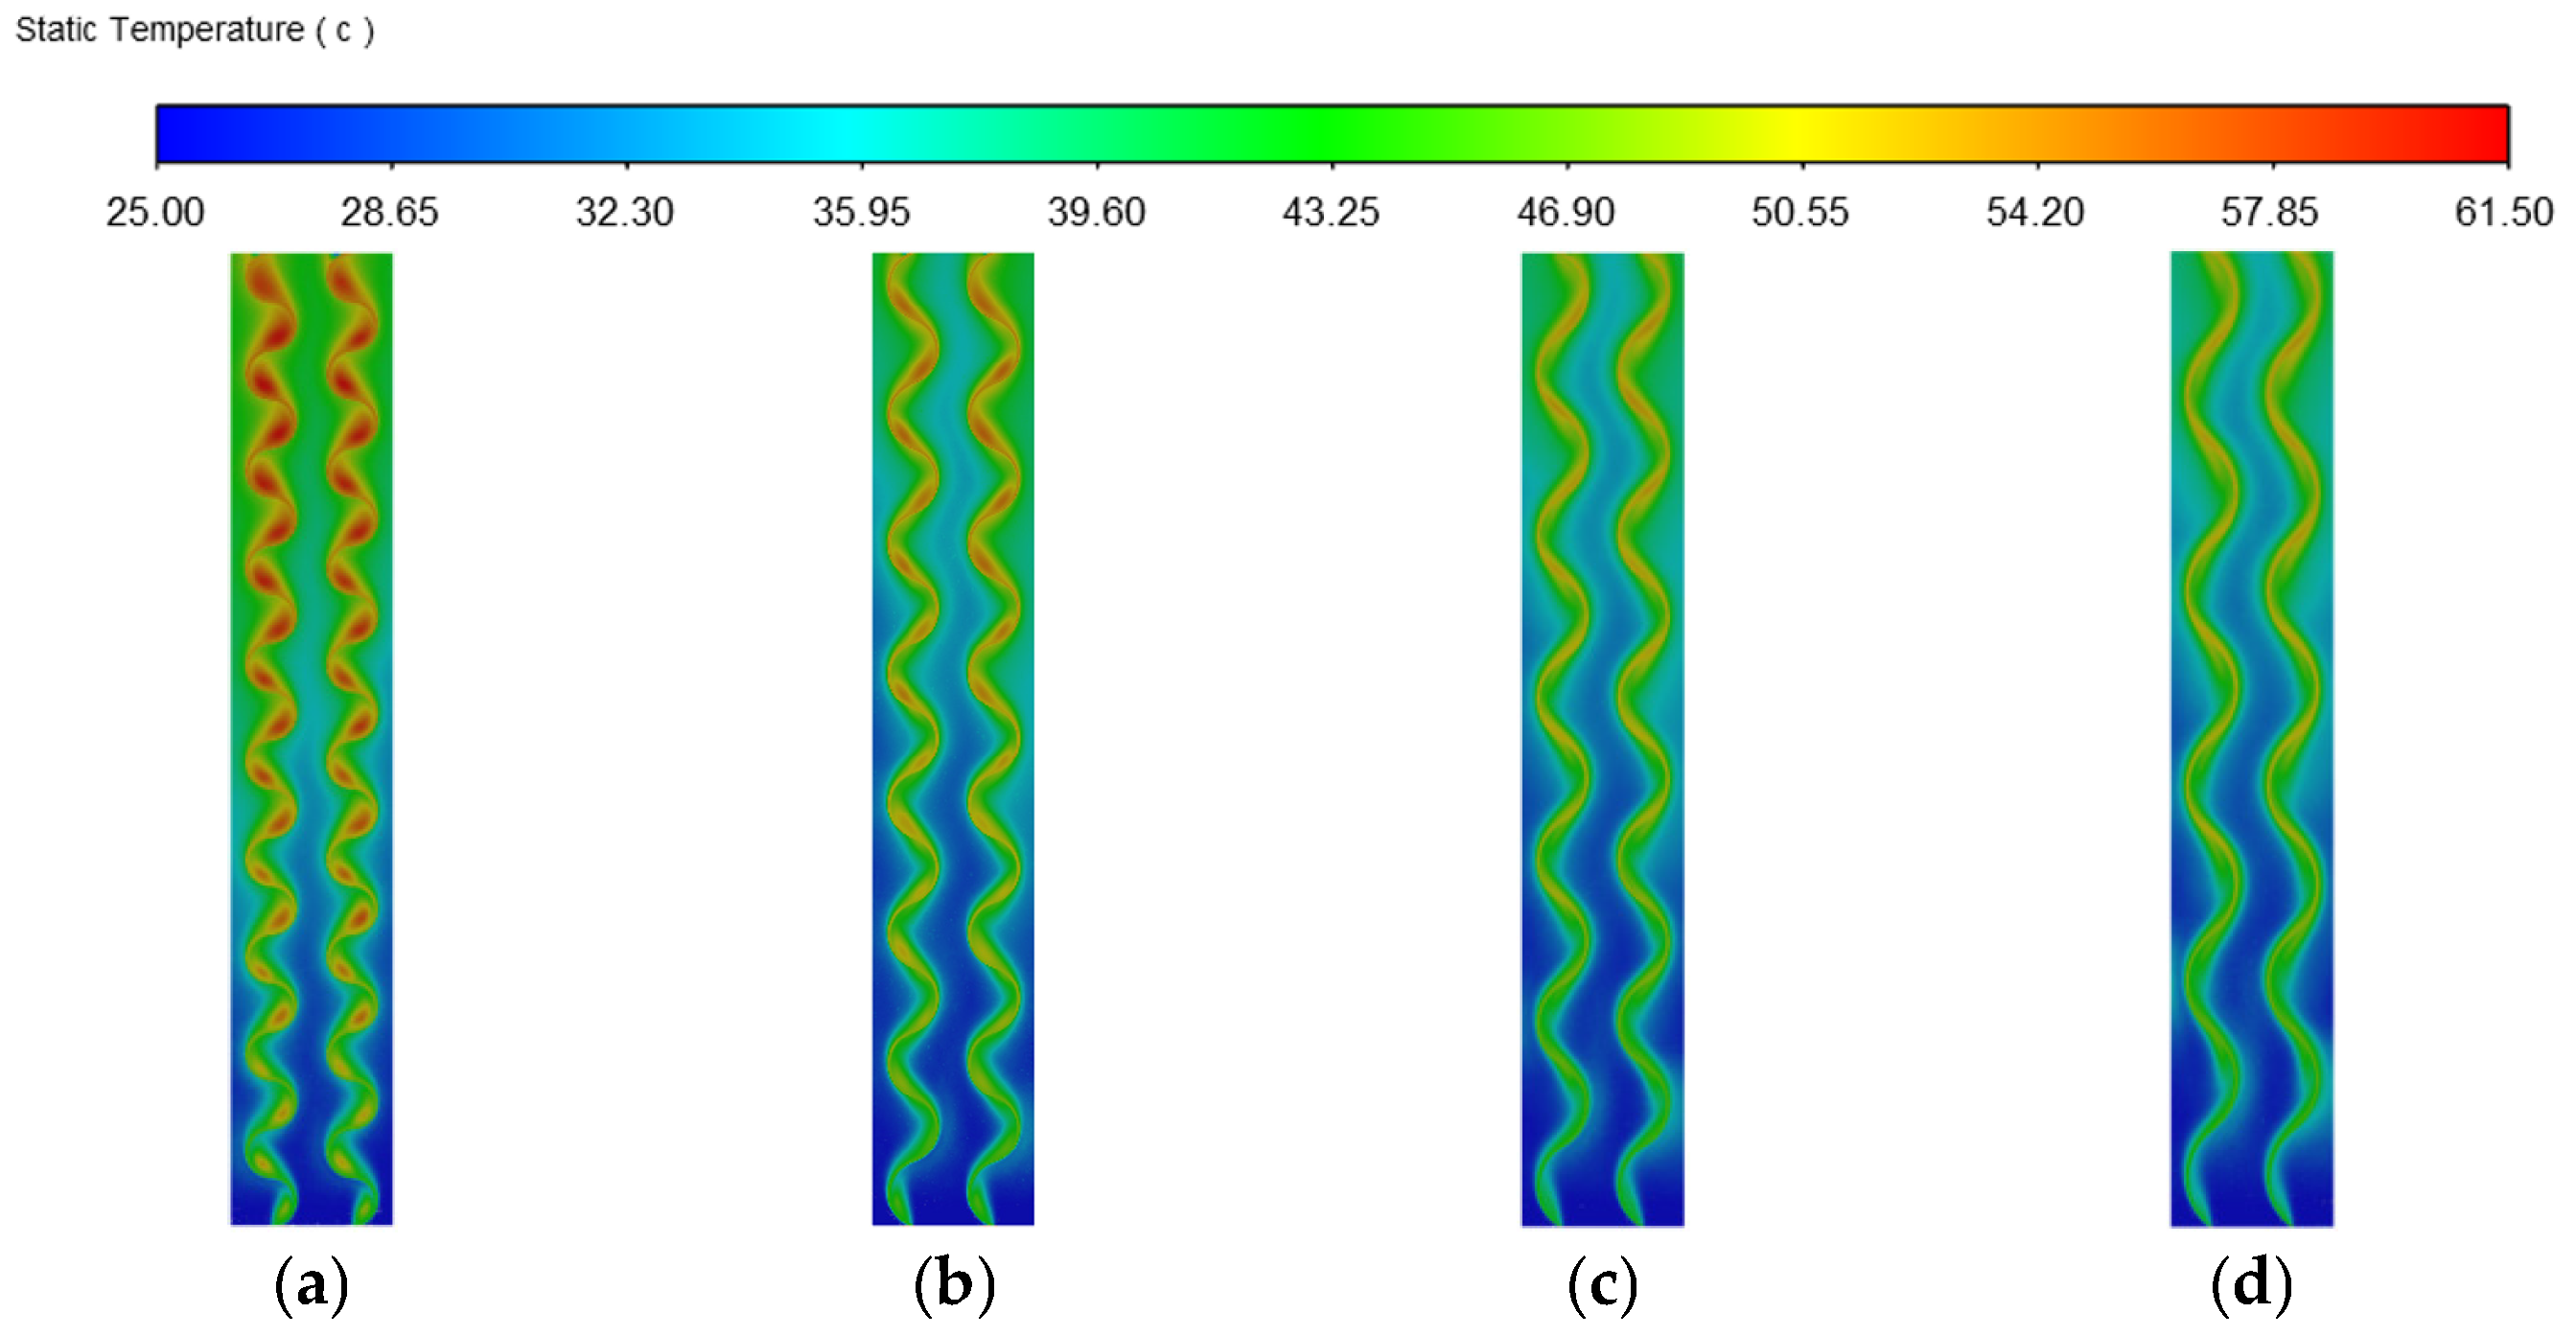
Effect of Different Rib Curvatures
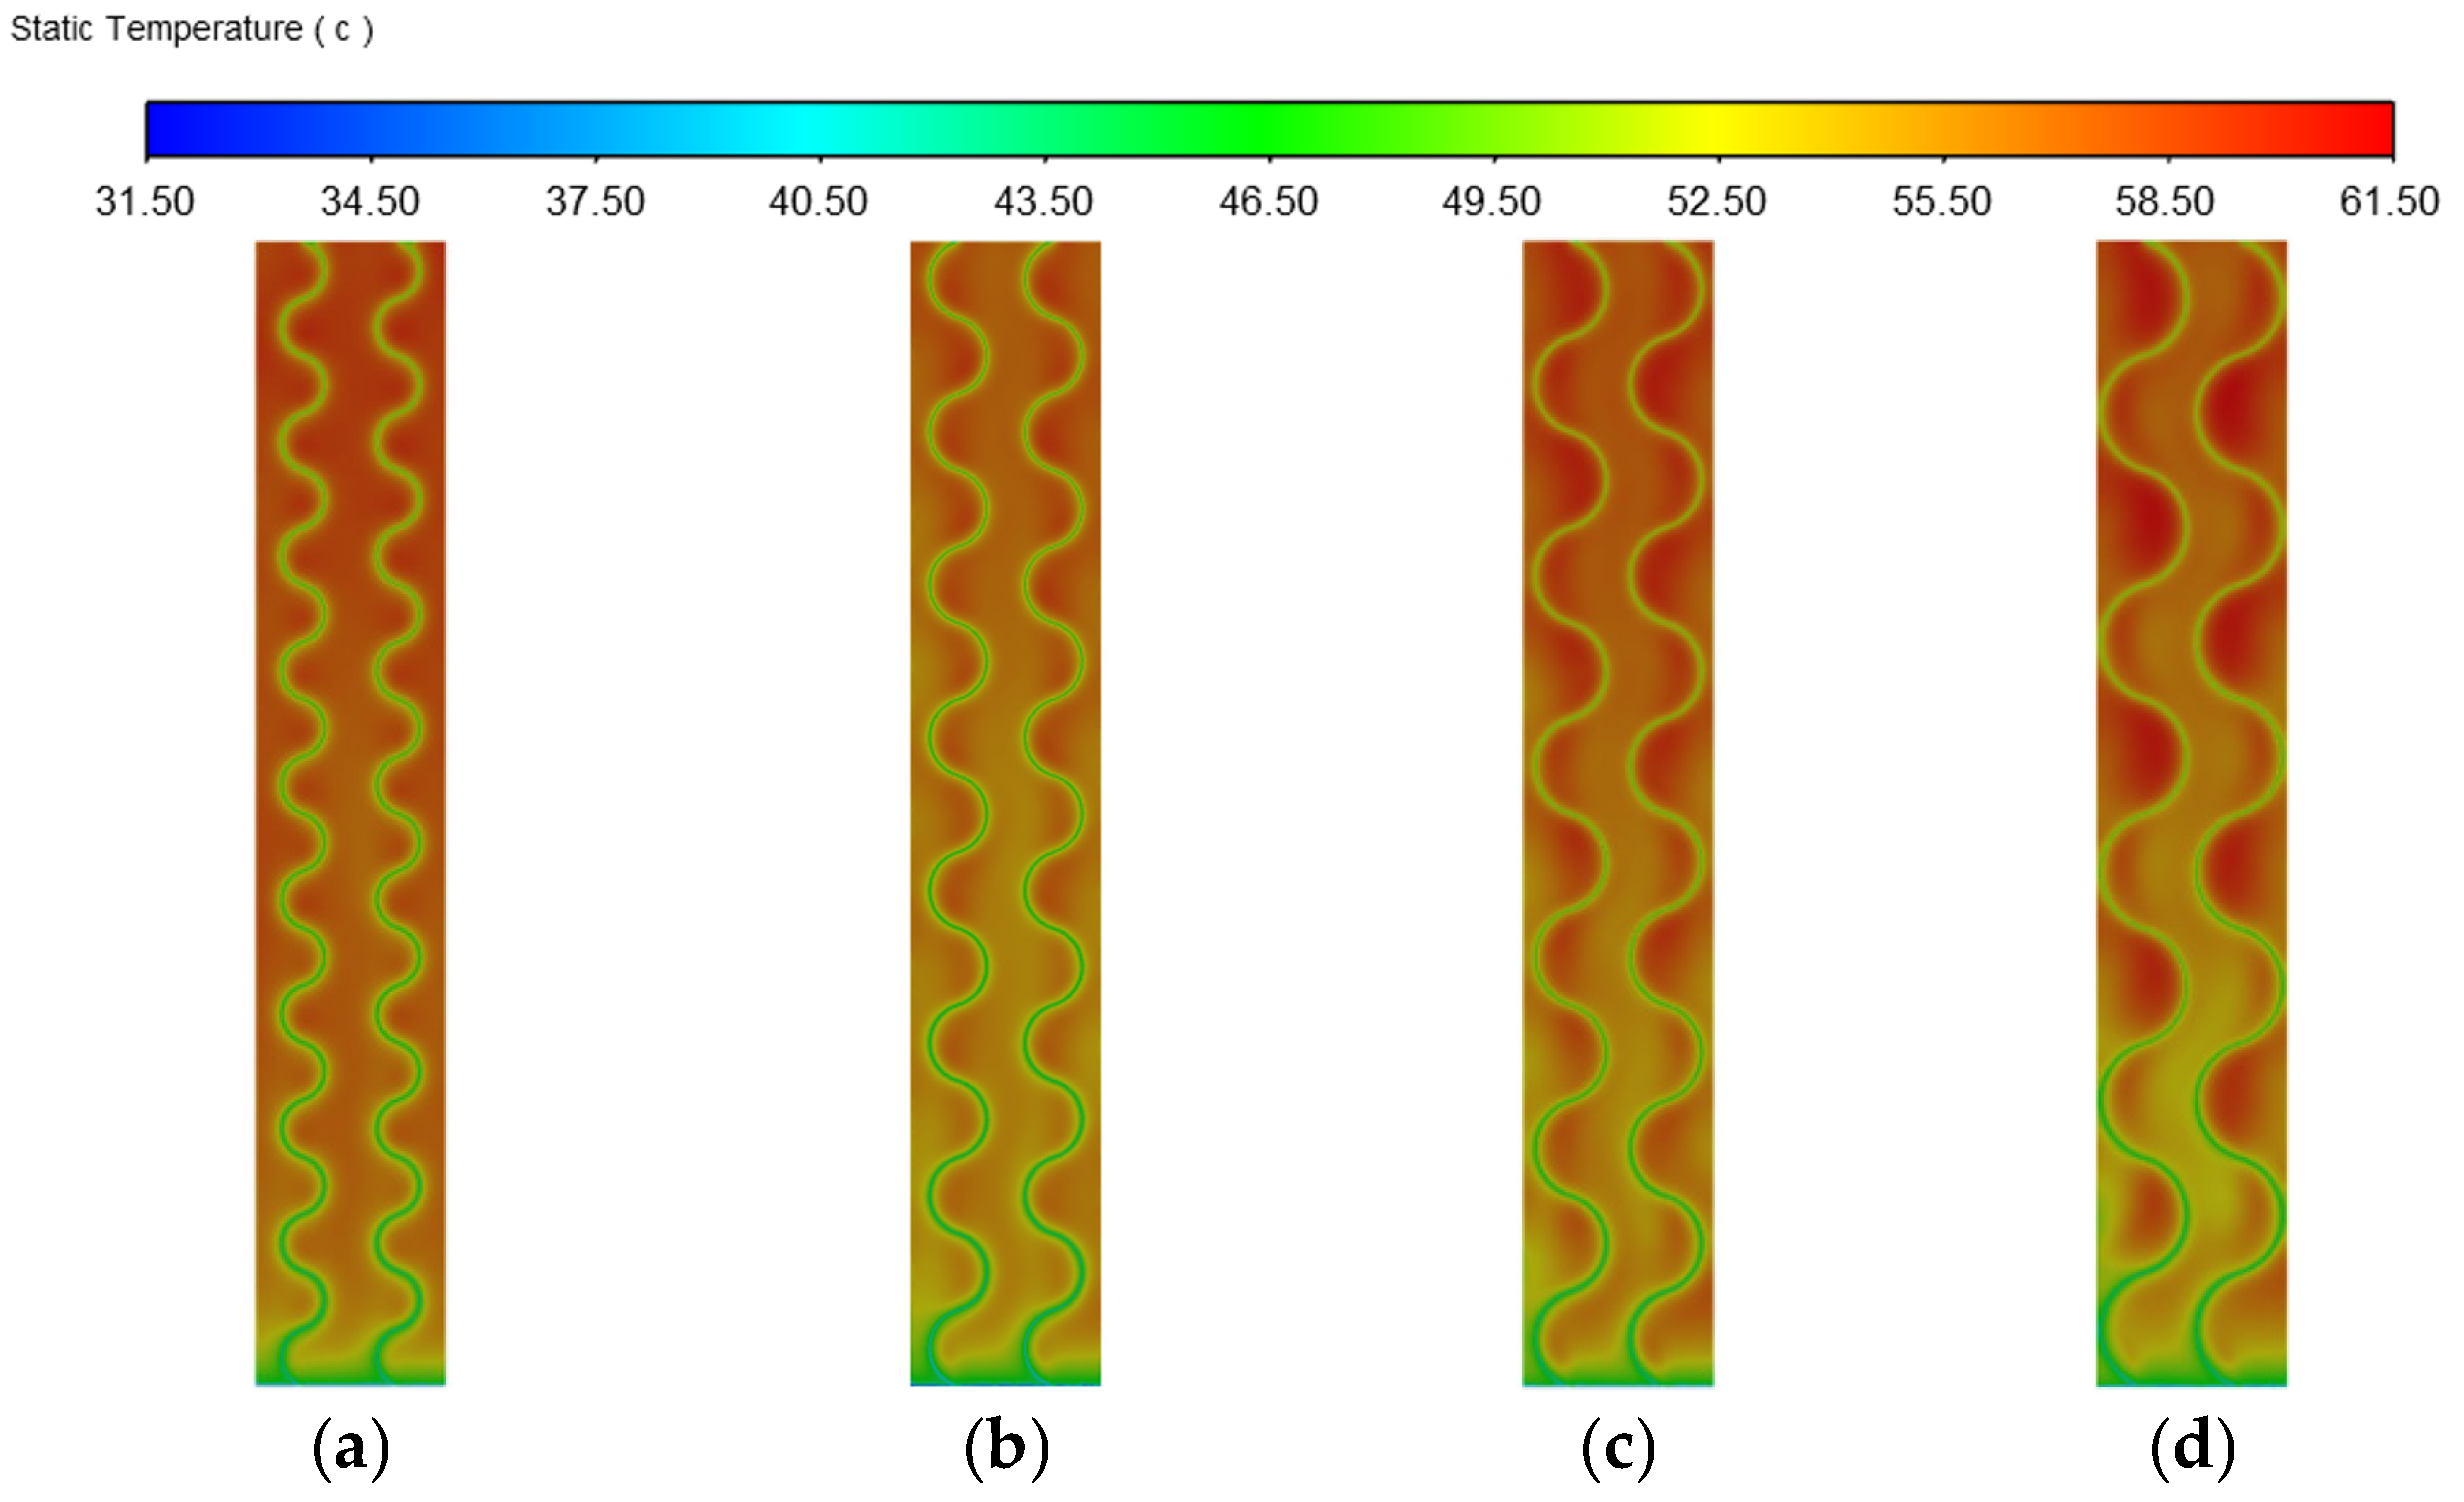
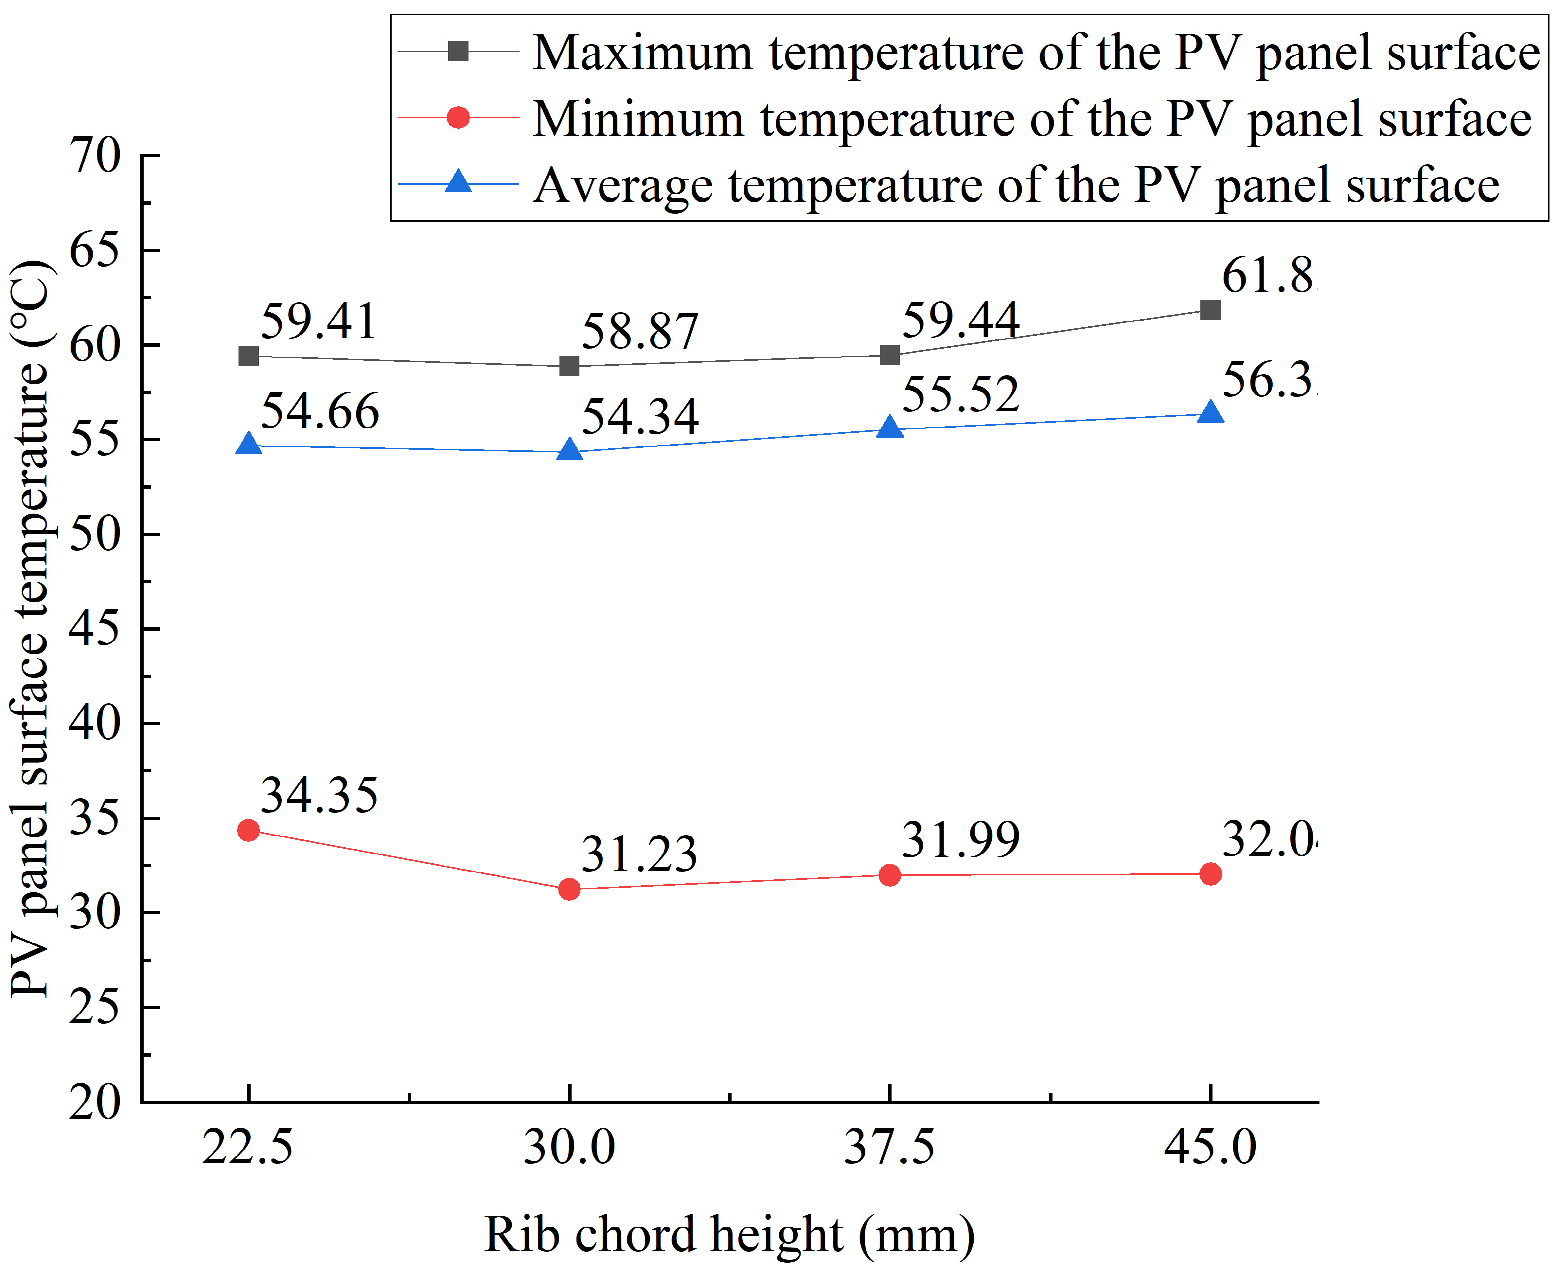
Effect of Different Rib Chord Heights
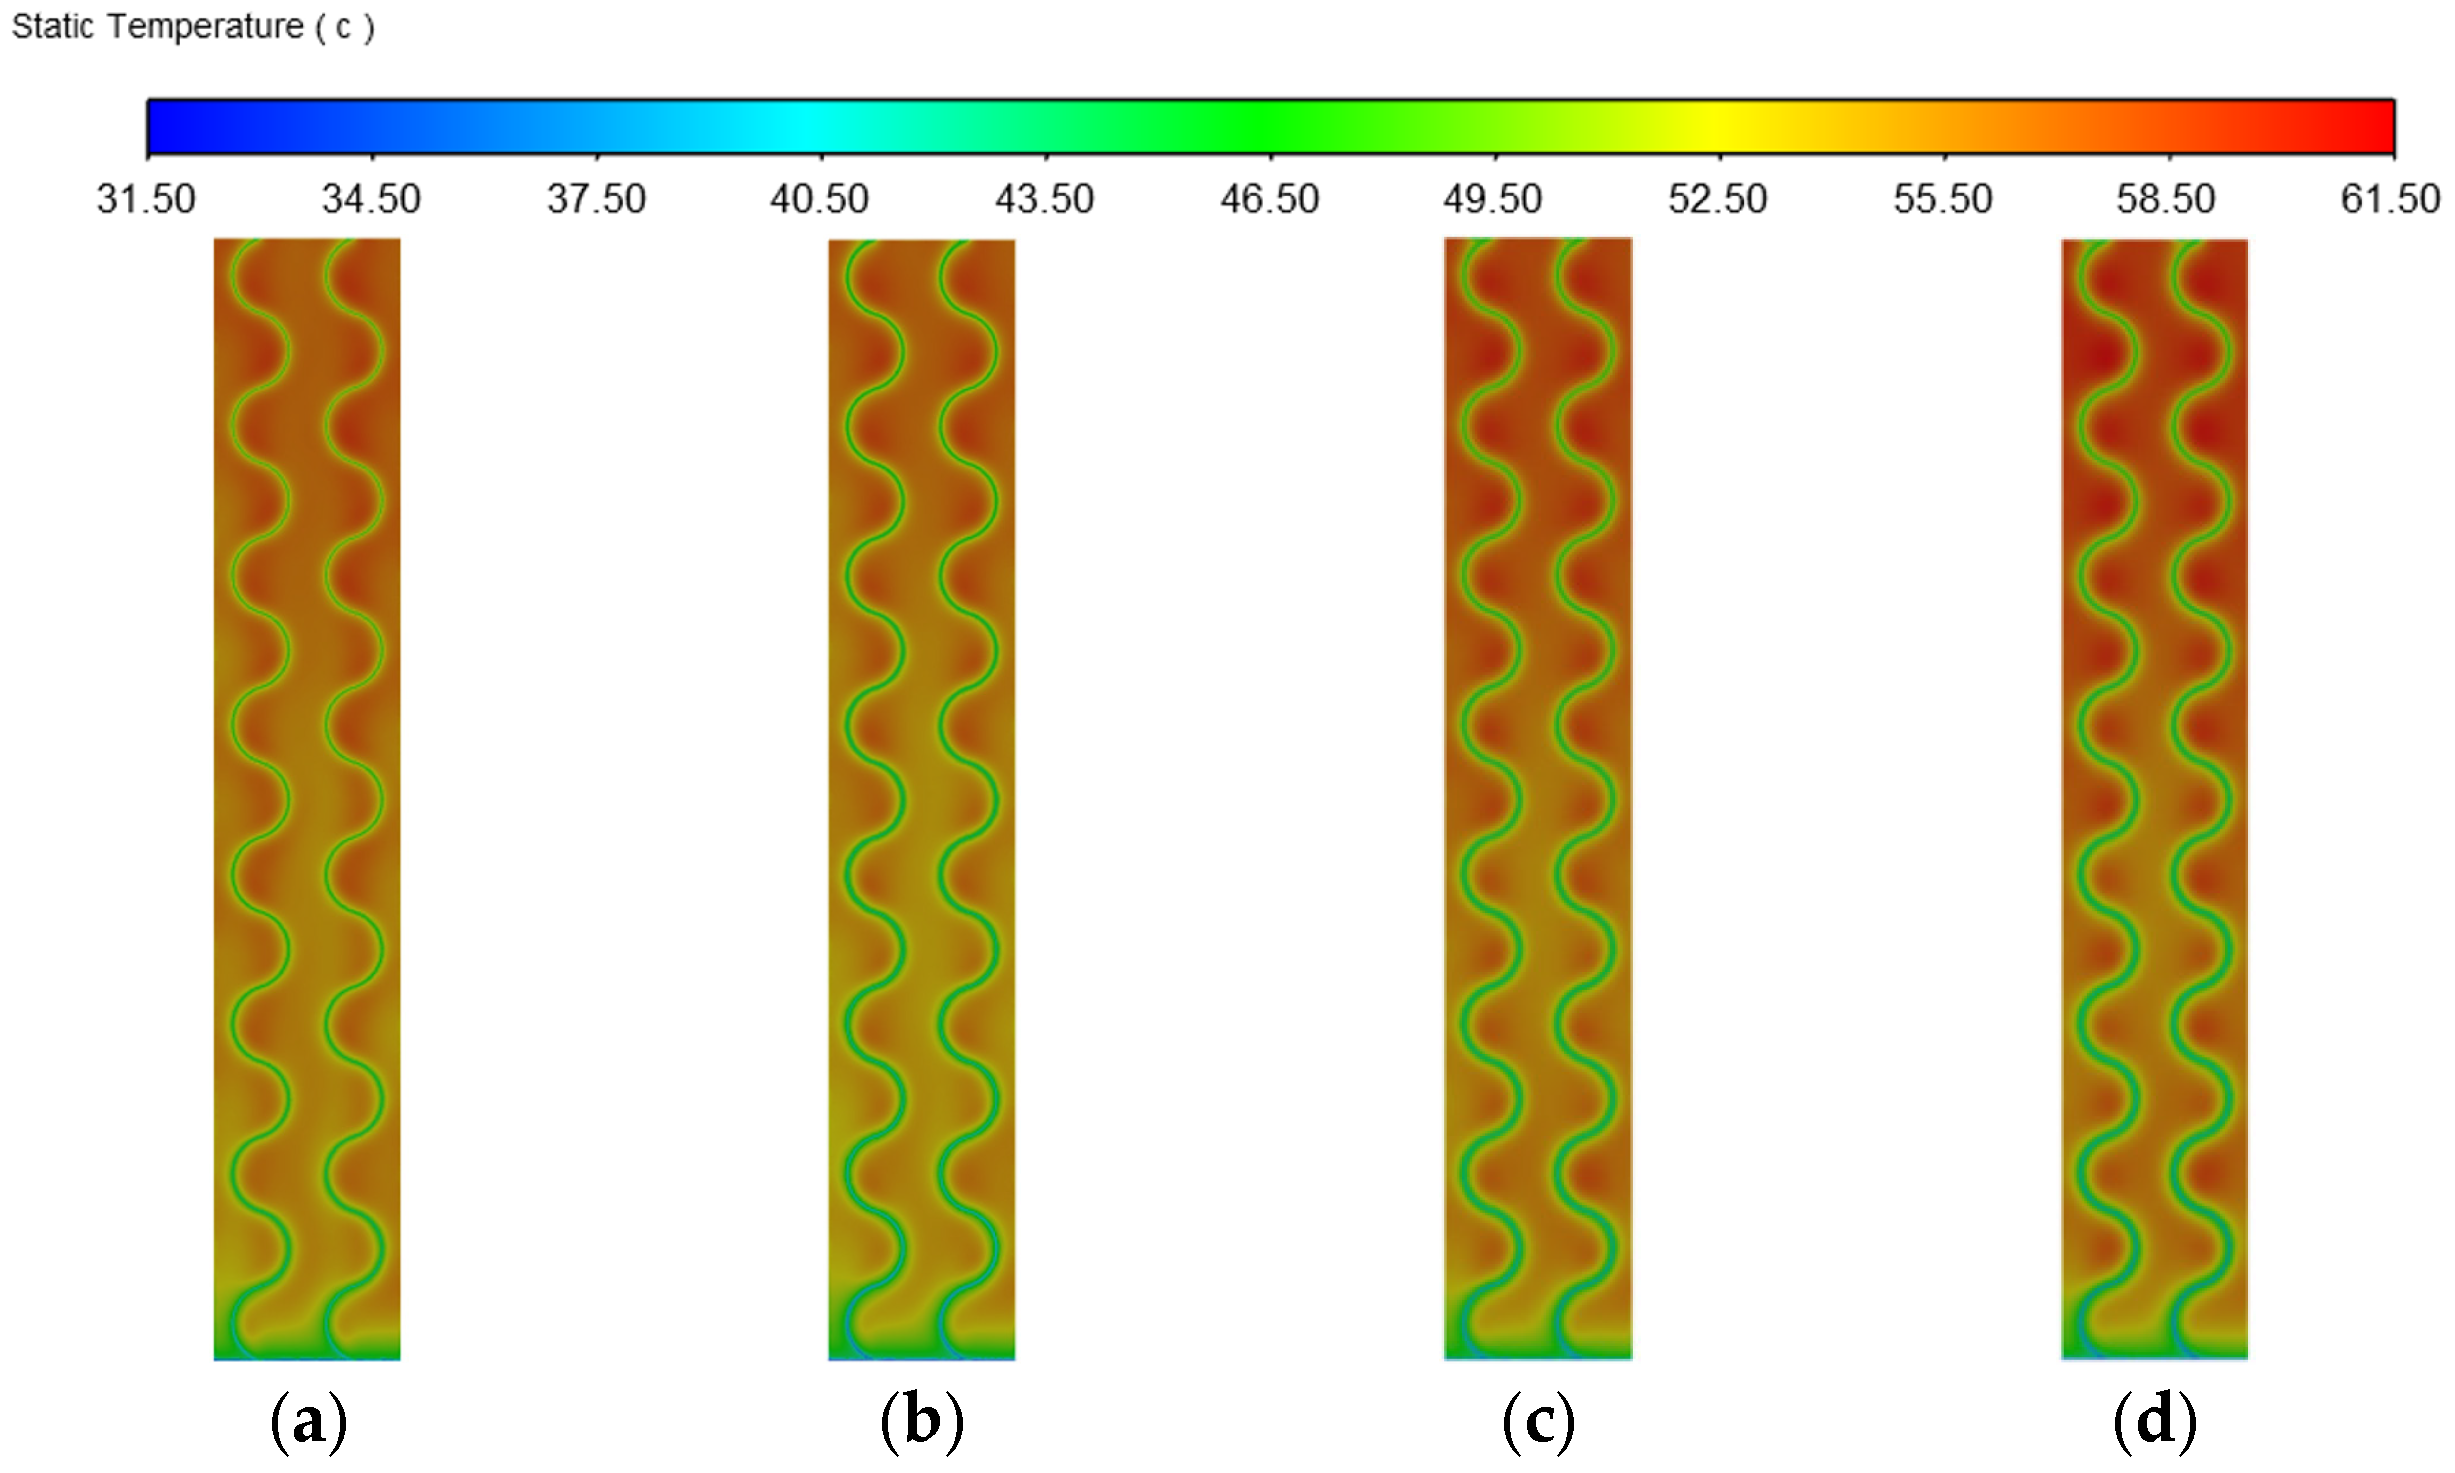
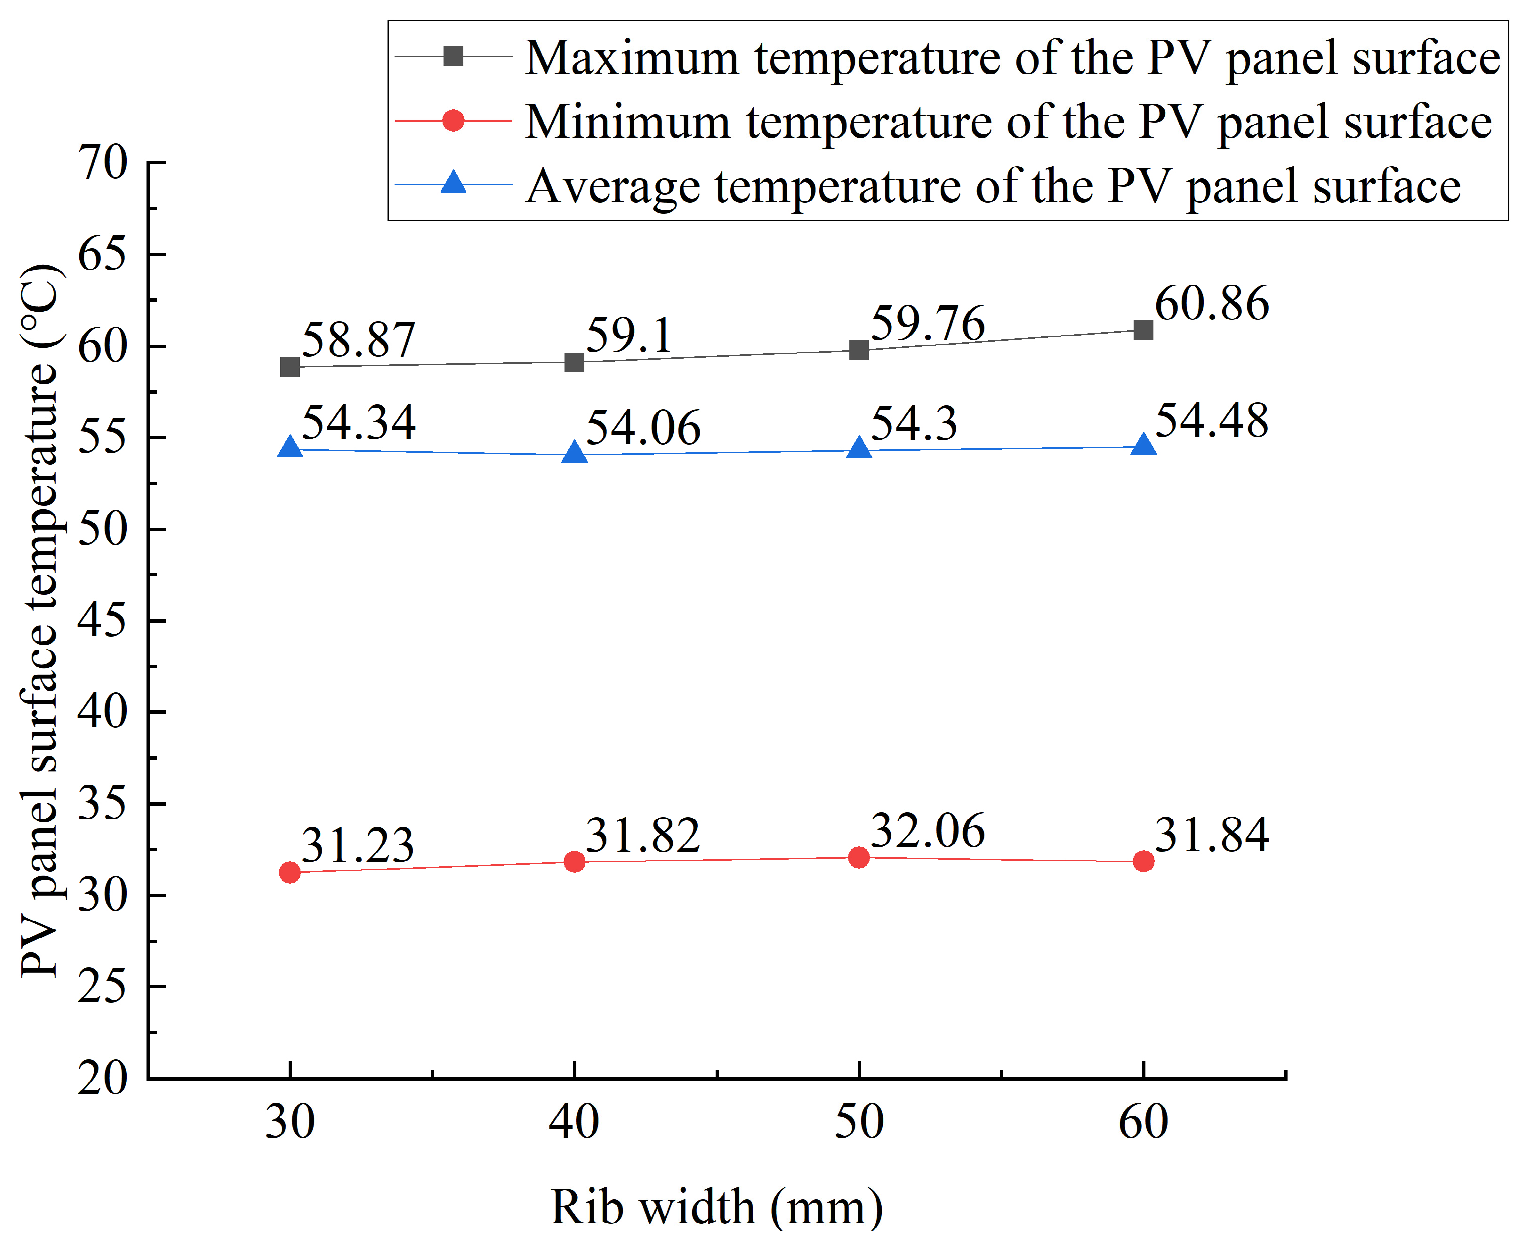
Effect of Different Rib Widths
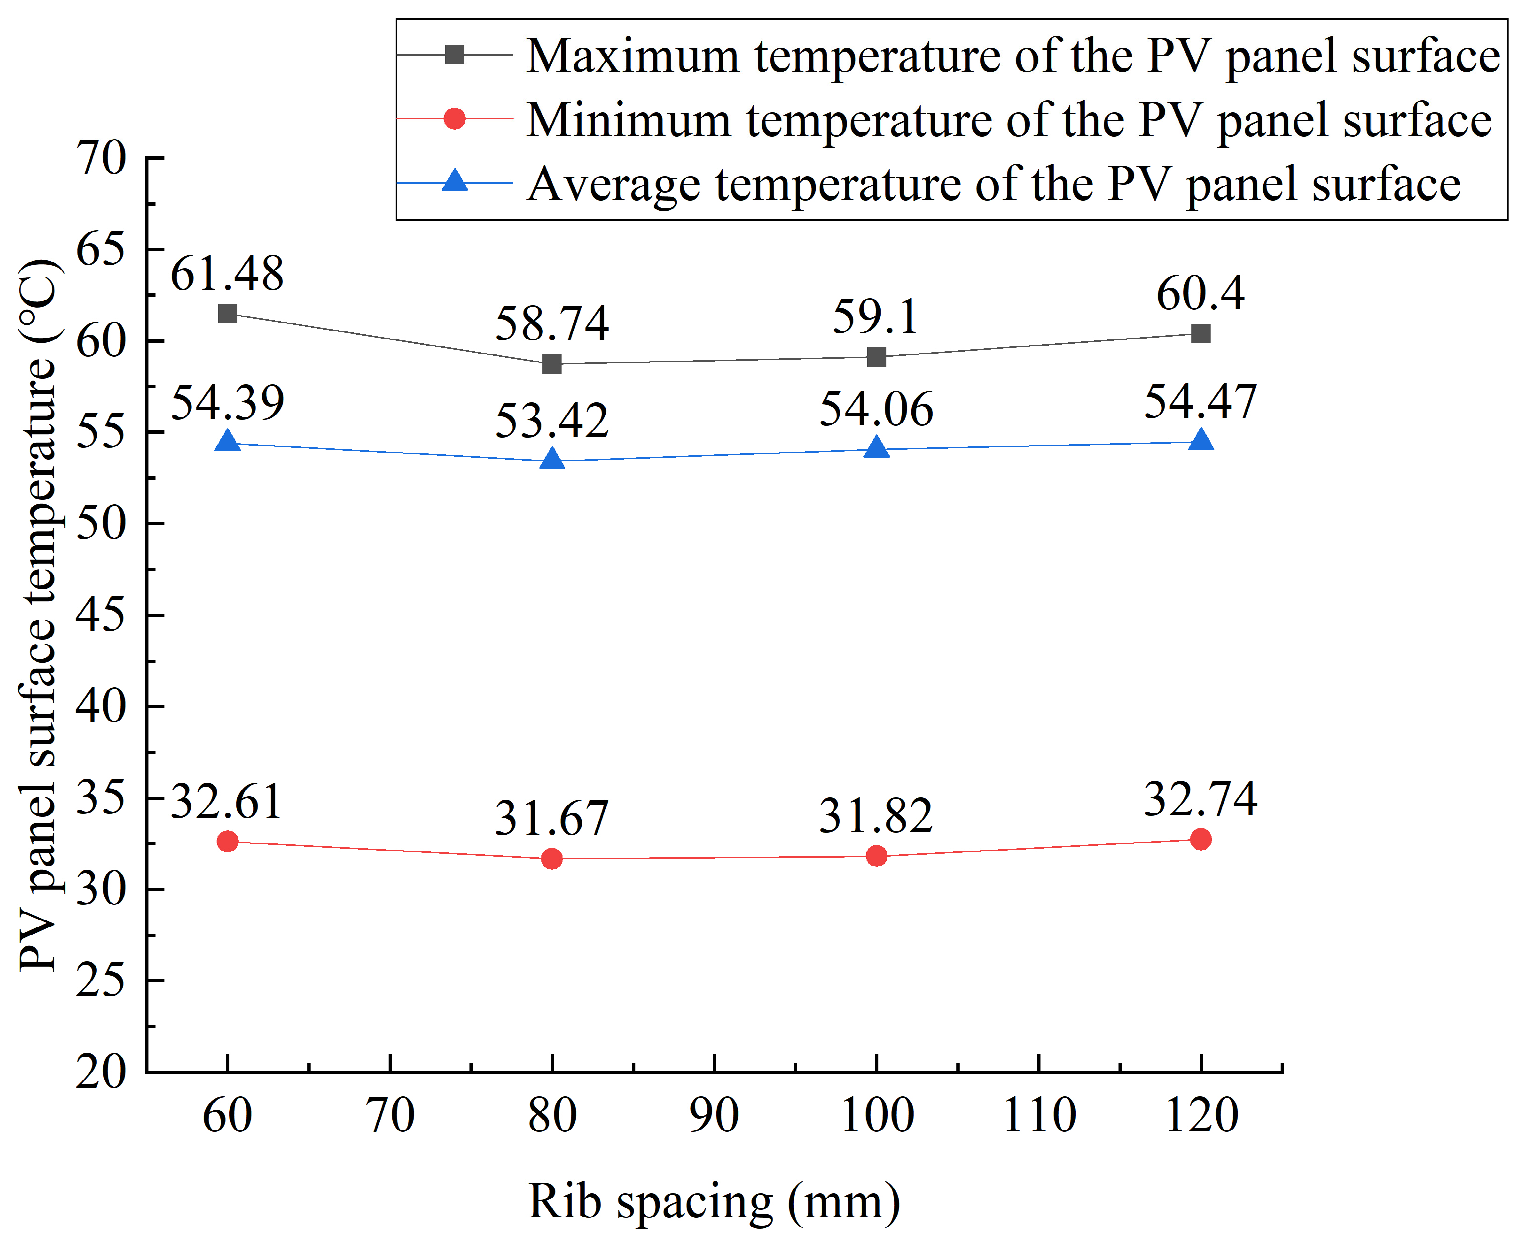
Effect of Different Rib Spacing
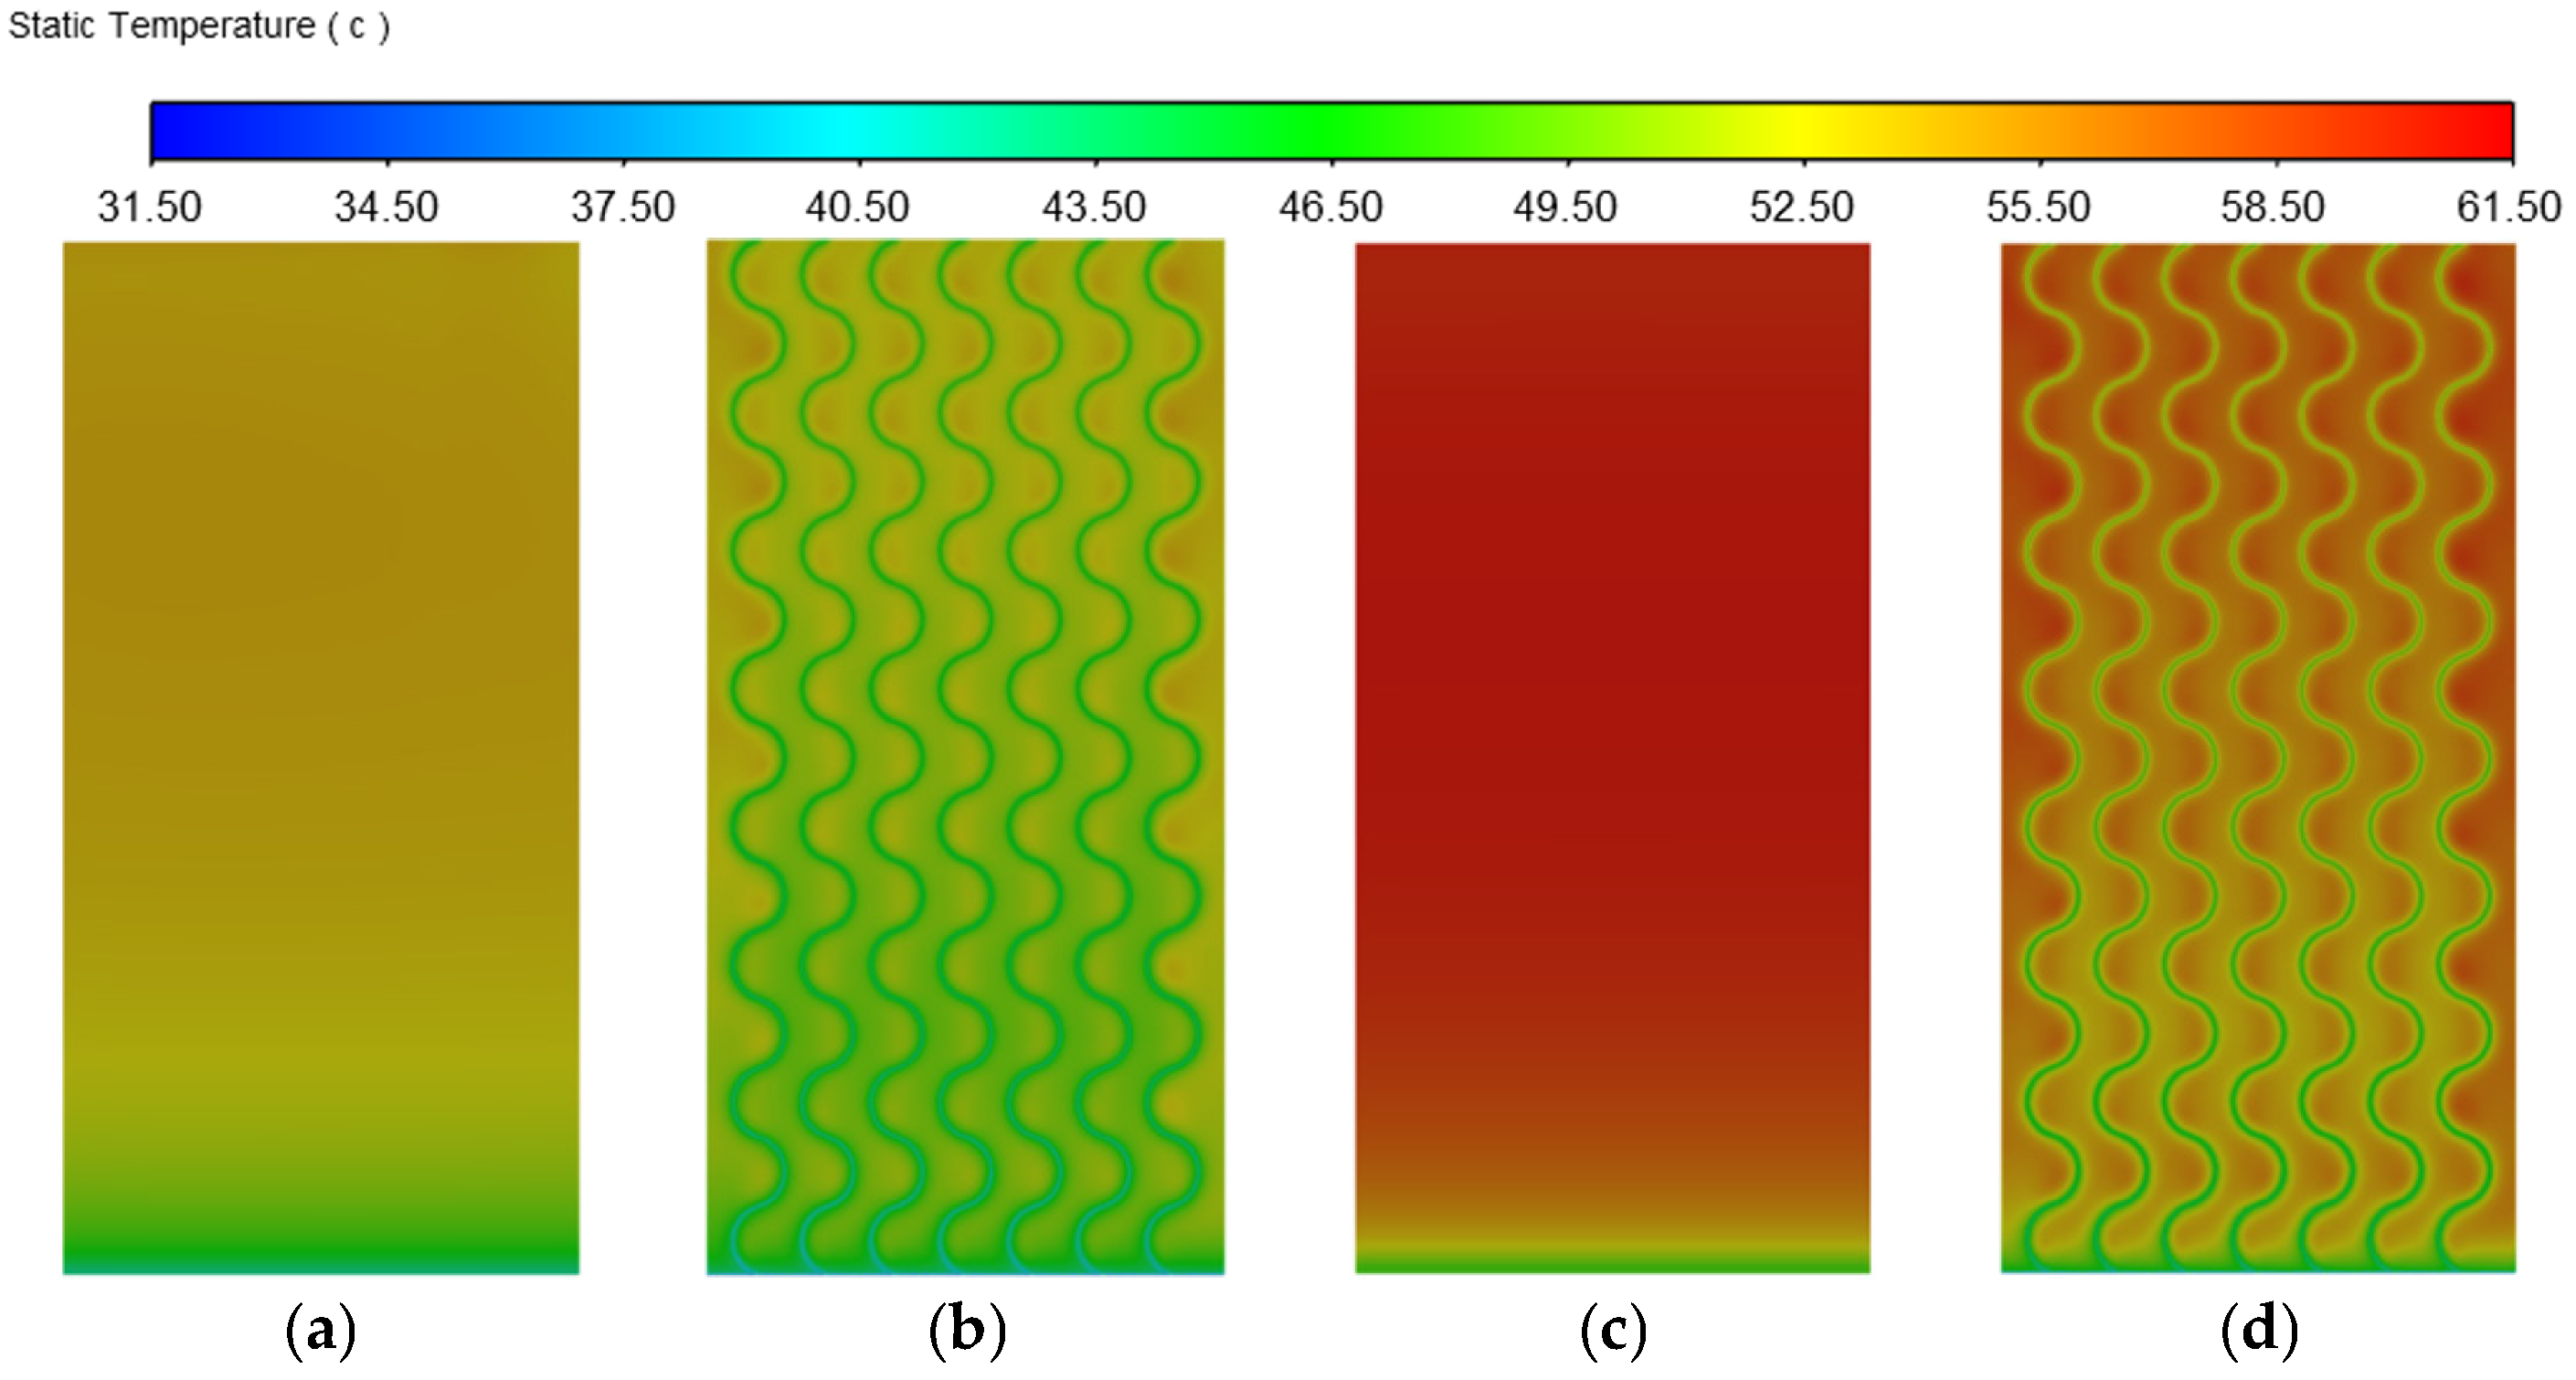
3.2.3. Effects of Solar Radiation Intensity
4. Conclusions
- (1)
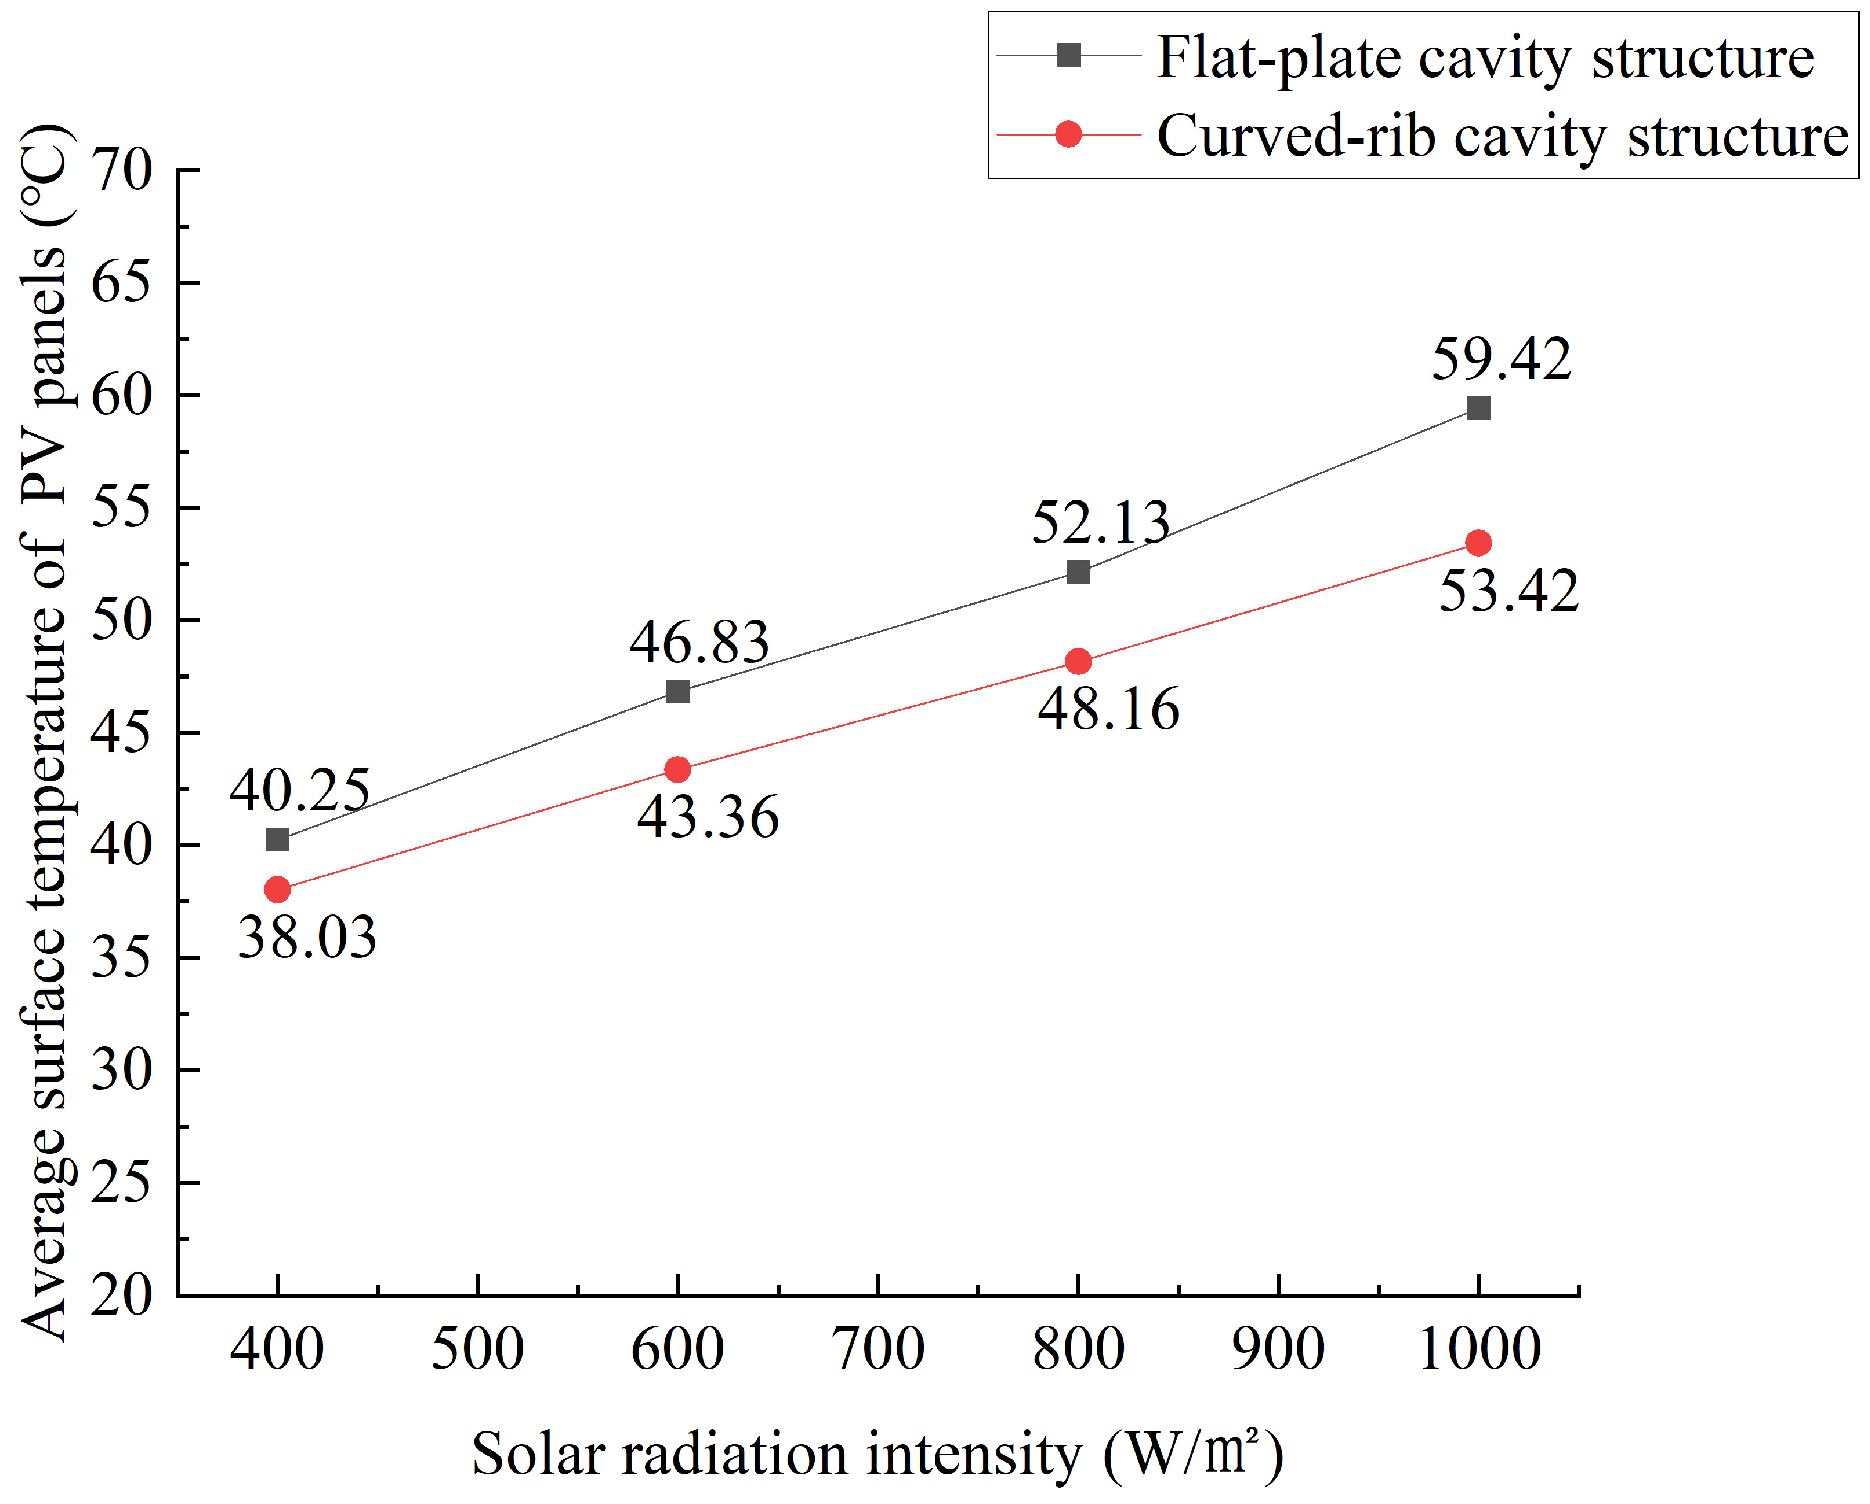
- The average surface temperatures of the flat-plate, moment-ribbed, and arc-ribbed cavity structure PV wall panels under natural ventilation conditions are 59.42 °C, 57.56 °C, and 55.39°C, respectively. The arc-ribbed cavity structure PV wall panels have the best heat dissipation effect. This result aligns with previous studies on ventilated PV systems, which have demonstrated that structured modifications such as ribbing can enhance convective cooling and reduce operational temperatures.
- (2)
- When the rib curvature is 3/8, the heat dissipation of the photovoltaic wall panel is found to be relatively optimal. If the rib height or width is set too large or too small, it is not conducive to the heat dissipation of the photovoltaic wall panel. Based on the simulations conducted in this study, the performance is relatively better when the rib height is 30 mm and the width is 40 mm. If the rib spacing is too small, the arrangement is too compact, and the hot air cannot be expelled effectively. If the rib spacing is too large, the heat exchange within the cavity is insufficient. The optimal rib spacing is between 80 mm and 100 mm. However, it should be noted that this research only simulated a limited number of configurations and did not cover the full range of possible parameter combinations. Therefore, the results are indicative of favorable configurations in the simulation range.
- (3)
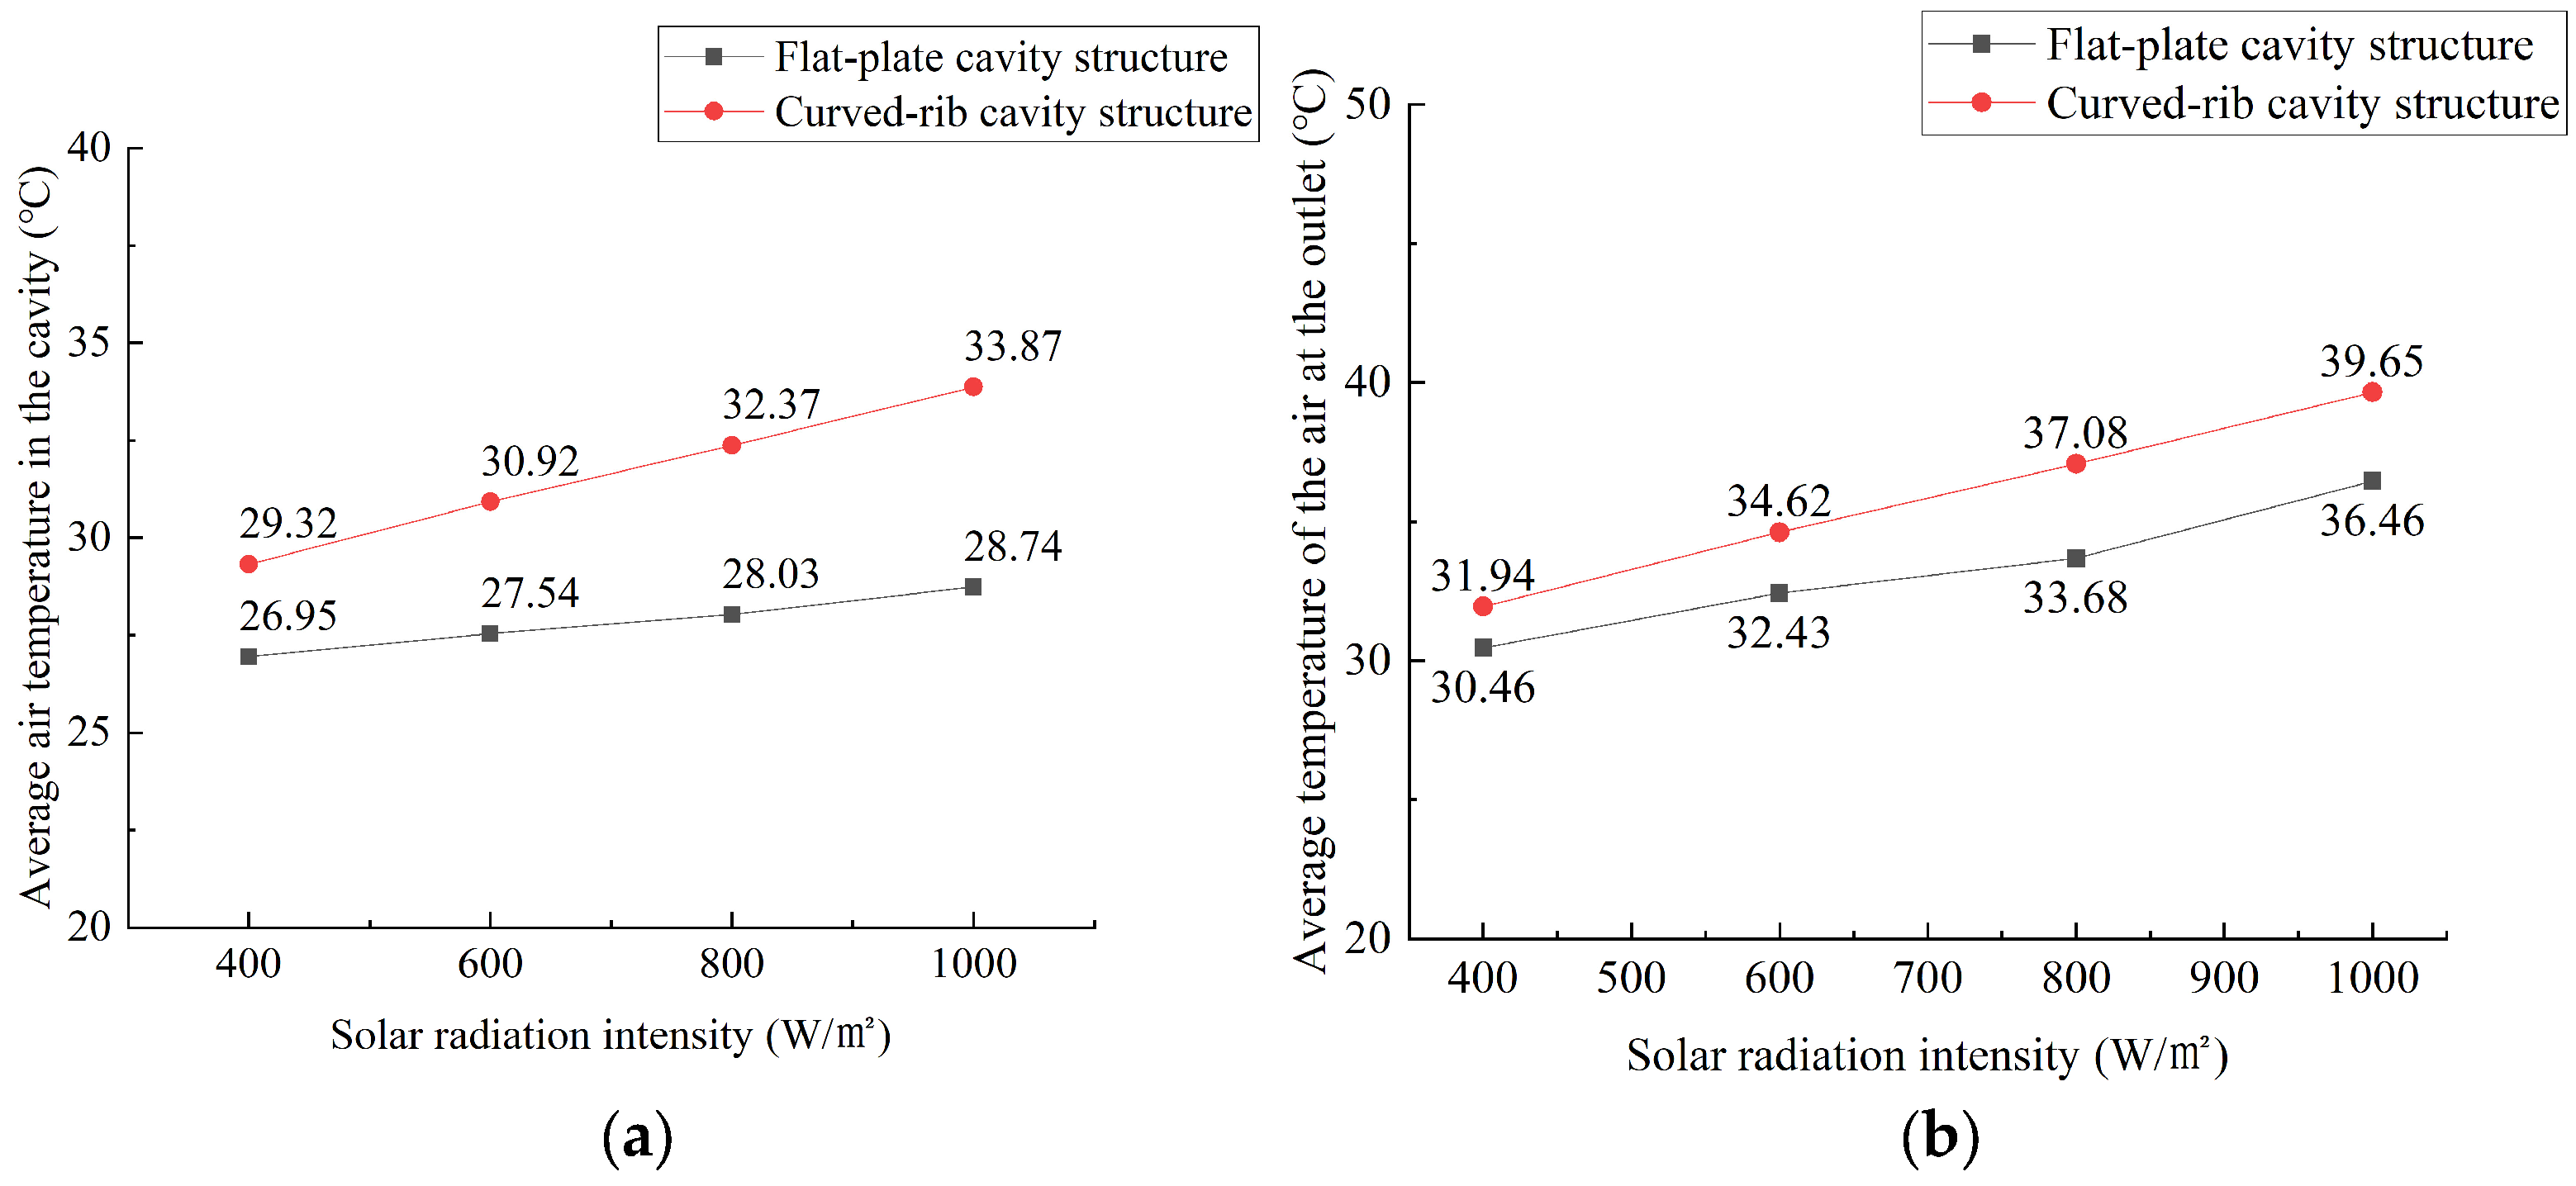
- Compared with the flat cavity structure of PV wall panels, the optimized curved-rib cavity structure can significantly reduce the average surface temperature of PV panels. With the increase in solar radiation intensity, the heat dissipation impact of the optimized structure is enhanced accordingly. When the intensity is 1000 W/m2, the average surface temperature of PV panels can be reduced by 6 °C. These results suggest that structured modifications to PV panel cavities could play a crucial role in improving thermal regulation and operational efficiency in high-temperature environments.
Author Contributions
Funding
Data Availability Statement
Conflicts of Interest
References
- IEA Buildings—Energy System. 2024. Available online: https://www.iea.org/energy-system/ (accessed on 10 December 2024).
- Chen, L.; Baghoolizadeh, M.; Basem, A.; Ali, S.H.; Ruhani, B.; Sultan, A.J.; Salahshour, S.; Alizadeh, A.A. A comprehensive review of a building-integrated photovoltaic system (BIPV). Int. Commun. Heat Mass Transf. 2024, 159, 108056. [Google Scholar] [CrossRef]
- Ranganathan, S.; Elumalai, N.; Natarajan, P.P. Numerical model and experimental validation of the heat transfer in air cooled solar photovoltaic panel. Therm. Sci. 2016, 20 (Suppl. S4), 1071–1081. [Google Scholar] [CrossRef]
- Koskela, J.; Rautiainen, A.; Järventausta, P. Using electrical energy storage in residential buildings—Sizing of battery and photovoltaic panels based on electricity cost optimization. Appl. Energy 2019, 239, 1175–1189. [Google Scholar] [CrossRef]
- Minelli, F.; D’Agostino, D.; Migliozzi, M.; Minichiello, F.; D’Agostino, P. PhloVer: A Modular and Integrated Tracking Photovoltaic Shading Device for Sustainable Large Urban Spaces—Preliminary Study and Prototyping. Energies 2023, 16, 5786. [Google Scholar] [CrossRef]
- Skoplaki, E.; Palyvos, J.A. On the temperature dependence of photovoltaic module electrical performance: A review of efficiency/power correlations. Sol. Energy 2009, 83, 614–624. [Google Scholar] [CrossRef]
- Siecker, J.; Kusakana, K.; Numbi, B.P. A review of solar photovoltaic systems cooling technologies. Renew. Sustain. Energy Rev. 2017, 79, 192–203. [Google Scholar] [CrossRef]
- Saitoh, H.; Hamada, Y.; Kubota, H.; Nakamura, M.; Ochifuji, K.; Yokoyama, S.; Nagano, K. Field experiments and analyses on a hybrid solar collector. Appl. Therm. Eng. 2003, 23, 2089–2105. [Google Scholar] [CrossRef]
- Al-Akam, A.; Abduljabbar, A.A.; Abdulhamed, A.J. Impact of Different Rooftop Coverings on Photovoltaic Panel Temperature. Energy Eng. 2024, 121, 3761–3777. [Google Scholar] [CrossRef]
- Tonui, J.K.; Tripanagnostopoulos, Y. Performance improvement of PV/T solar collectors with natural air flow operation. Sol. Energy 2008, 82, 1–12. [Google Scholar] [CrossRef]
- Sutanto, B.; Iacovides, H.; Nasser, A.; Cioncolini, A.; Afgan, I. Efficiency improvement of floating photovoltaic panels with natural convection cooling loops: Multi-physics thermal modelling. Sol. Energy 2025, 286, 113170. [Google Scholar] [CrossRef]
- Arcuri, N.; Reda, F.; De Simone, M. Energy and thermo-fluid-dynamics evaluations of photovoltaic panels cooled by water and air. Sol. Energy 2014, 105, 147–156. [Google Scholar] [CrossRef]
- Shahsavar, A.; Salmanzadeh, M.; Ameri, M.; Talebizadeh, P. Energy saving in buildings by using the exhaust and ventilation air for cooling of photovoltaic panels. Energy Build. 2011, 43, 2219–2226. [Google Scholar] [CrossRef]
- Ritzen, M.J.; Vroon, Z.A.E.P.; Rovers, R.; Lupíšek, A.; Geurts, C.P.W. Environmental impact comparison of a ventilated and a non-ventilated building-integrated photovoltaic rooftop design in the Netherlands: Electricity output, energy payback time, and land claim. Sol. Energy 2017, 155, 304–313. [Google Scholar] [CrossRef]
- Ibrahim, T.; El Hazar, M.; Hachem, F.; Khaled, M. A comprehensive experimental study of cooling photovoltaic panels using phase change materials under free and forced convection—Experiments and transient analysis. J. Energy Storage 2024, 81, 110511. [Google Scholar] [CrossRef]
- Ahmad, F.F.; Ghenai, C.; Hamid, A.K.; Rejeb, O.; Bettayeb, M. Performance enhancement and infra-red (IR) thermography of solar photovoltaic panel using back cooling from the waste air of building centralized air conditioning system. Case Stud. Therm. Eng. 2021, 24, 100840. [Google Scholar] [CrossRef]
- Kang, Z.; Lu, Z.; Song, G.; Yao, Q. A Numerical Study of Dual-Inlet Air-Cooled PV/T Solar Collectors with Various Airflow Channel Configurations. Sustainability 2022, 14, 9897. [Google Scholar] [CrossRef]
- Sahu, M.K.; Prasad, R.K. Exergy based performance evaluation of solar air heater with arc-shaped wire roughened absorber plate. Renew. Energy 2016, 96, 233–243. [Google Scholar] [CrossRef]
- Grubišić-Čabo, F.; Nižetić, S.; Čoko, D.; Kragić, I.M.; Papadopoulos, A. Experimental investigation of the passive cooled free-standing photovoltaic panel with fixed aluminum fins on the backside surface. J. Clean. Prod. 2018, 176, 119–129. [Google Scholar] [CrossRef]
- D’Orazio, M.; Di Perna, C.; Di Giuseppe, E. Experimental operating cell temperature assessment of BIPV with different installation configurations on roofs under Mediterranean climate. Renew. Energy 2014, 68, 378–396. [Google Scholar] [CrossRef]
- Zheng, Y.; Miao, J.; Yu, H.; Liu, F.; Cai, Q. Thermal Analysis of Air-Cooled Channels of Different Sizes in Naturally Ventilated Photovoltaic Wall Panels. Buildings 2023, 13, 3002. [Google Scholar] [CrossRef]
- Agathokleous, R.A.; Kalogirou, S.A. Part I: Thermal analysis of naturally ventilated BIPV system: Experimental investigation and convective heat transfer coefficients estimation. Sol. Energy 2018, 169, 673–681. [Google Scholar] [CrossRef]
- Tukkee, A.M.; Al-Kayiem, H.H.; Gilani, S.I.U. Effect of density variation method and air humidity consideration on the computational simulation of solar vortex power generation systems. Therm. Sci. Eng. Prog. 2023, 37, 101574. [Google Scholar] [CrossRef]
- Li, M.; Ma, T.; Liu, J.; Li, H.; Xu, Y.; Gu, W.; Shen, L. Numerical and experimental investigation of precast concrete facade integrated with solar photovoltaic panels. Appl. Energy 2019, 253, 113509. [Google Scholar] [CrossRef]
- Guarracino, I.; Mellor, A.; Ekins-Daukes, N.J.; Markides, C.N. Dynamic coupled thermal-and-electrical modelling of sheet-and-tube hybrid photovoltaic/thermal (PVT) collectors. Appl. Therm. Eng. 2016, 101, 778–795. [Google Scholar] [CrossRef]
- Arslan, E.; Aktaş, M.; Can, Ö.F. Experimental and numerical investigation of a novel photovoltaic thermal (PV/T) collector with the energy and exergy analysis. J. Clean. Prod. 2020, 276, 123255. [Google Scholar] [CrossRef]
- Maadi, S.R.; Khatibi, M.; Ebrahimnia-Bajestan, E.; Wood, D. Coupled thermal-optical numerical modeling of PV/T module—Combining CFD approach and two-band radiation DO model. Energy Convers. Manag. 2019, 198, 111781. [Google Scholar] [CrossRef]
- Gucyeter, B.; ASHRAE. Calibration of a Building Energy Performance Simulation Model via Monitoring Data, Proceedings of the 2018 Building Performance Analysis Conference and SimBuild, Chicago, IL, USA, 26–28 September 2018; IBPSA Publications: Verona, WI, USA, 2018; pp. 542–549. [Google Scholar]


| Geometry Name | Densities (kg/m3) | Specific Heat Capacity J/(kg·K) | Thermal Conductivity W/(m·K) |
|---|---|---|---|
| Photovoltaic panel | 1500 | 1760 | 1.04 |
| Self-insulating wall panel | 550 | 1100 | 0.14 |
| Atmosphere | 1.177 | 1006.43 | 0.0242 |
| Ribs (aluminum) | 2719 | 900 | 202.4 |
| Type of Rib | Chord Length (mm) | Chord Height (mm) | Spacing (mm) | Width (mm) | Thicknesses (mm) |
|---|---|---|---|---|---|
| Rectangular ribs | - | - | 100 | 30 | 2 |
| Curved ribs | 120 | 30 | 100 | 30 | 2 |
| Case | Rib Curvature (Chord Height/Chord Length) | Chord Height (mm) | Rib Width (mm) | Rib Spacing (mm) |
|---|---|---|---|---|
| Case 1 | 1/2 3/8 3/10 1/4 | 30 | 30 | 100 |
| Case 2 | 3/8 | 22.5 30 37.5 45 | 30 | 100 |
| Case 3 | 3/8 | 30 | 30 40 50 60 | 100 |
| Case 4 | 3/8 | 30 | 40 | 60 80 100 120 |
Disclaimer/Publisher’s Note: The statements, opinions and data contained in all publications are solely those of the individual author(s) and contributor(s) and not of MDPI and/or the editor(s). MDPI and/or the editor(s) disclaim responsibility for any injury to people or property resulting from any ideas, methods, instructions or products referred to in the content. |
© 2025 by the authors. Licensee MDPI, Basel, Switzerland. This article is an open access article distributed under the terms and conditions of the Creative Commons Attribution (CC BY) license (https://creativecommons.org/licenses/by/4.0/).
Share and Cite
Song, N.; Xu, X.; Zheng, Y.; Miao, J.; Yu, H. Heat Transfer Analysis of Ventilated Photovoltaic Wall Panels with Curved Ribs for Different Parametric Cavity Structures. Buildings 2025, 15, 1184. https://doi.org/10.3390/buildings15071184
Song N, Xu X, Zheng Y, Miao J, Yu H. Heat Transfer Analysis of Ventilated Photovoltaic Wall Panels with Curved Ribs for Different Parametric Cavity Structures. Buildings. 2025; 15(7):1184. https://doi.org/10.3390/buildings15071184
Chicago/Turabian StyleSong, Na, Xitong Xu, Yongxiao Zheng, Jikui Miao, and Hongwen Yu. 2025. "Heat Transfer Analysis of Ventilated Photovoltaic Wall Panels with Curved Ribs for Different Parametric Cavity Structures" Buildings 15, no. 7: 1184. https://doi.org/10.3390/buildings15071184
APA StyleSong, N., Xu, X., Zheng, Y., Miao, J., & Yu, H. (2025). Heat Transfer Analysis of Ventilated Photovoltaic Wall Panels with Curved Ribs for Different Parametric Cavity Structures. Buildings, 15(7), 1184. https://doi.org/10.3390/buildings15071184