
A Fuzzy Decision-Making Approach to the Health Assessment and Optimization of Architecture-Dominated Outdoor Spaces in High-Density Urban Environments

Abstract
1. Introduction
2. Literature Review
2.1. Relevant Evaluation System
2.2. Index Selection
2.2.1. Comfort
2.2.2. Diversity
2.2.3. Security
2.2.4. Ecology
2.2.5. Humanism
2.3. Health-Related Theory
2.3.1. Health Behavior Change Theory
2.3.2. Healthy City Theory
2.4. Problem Description
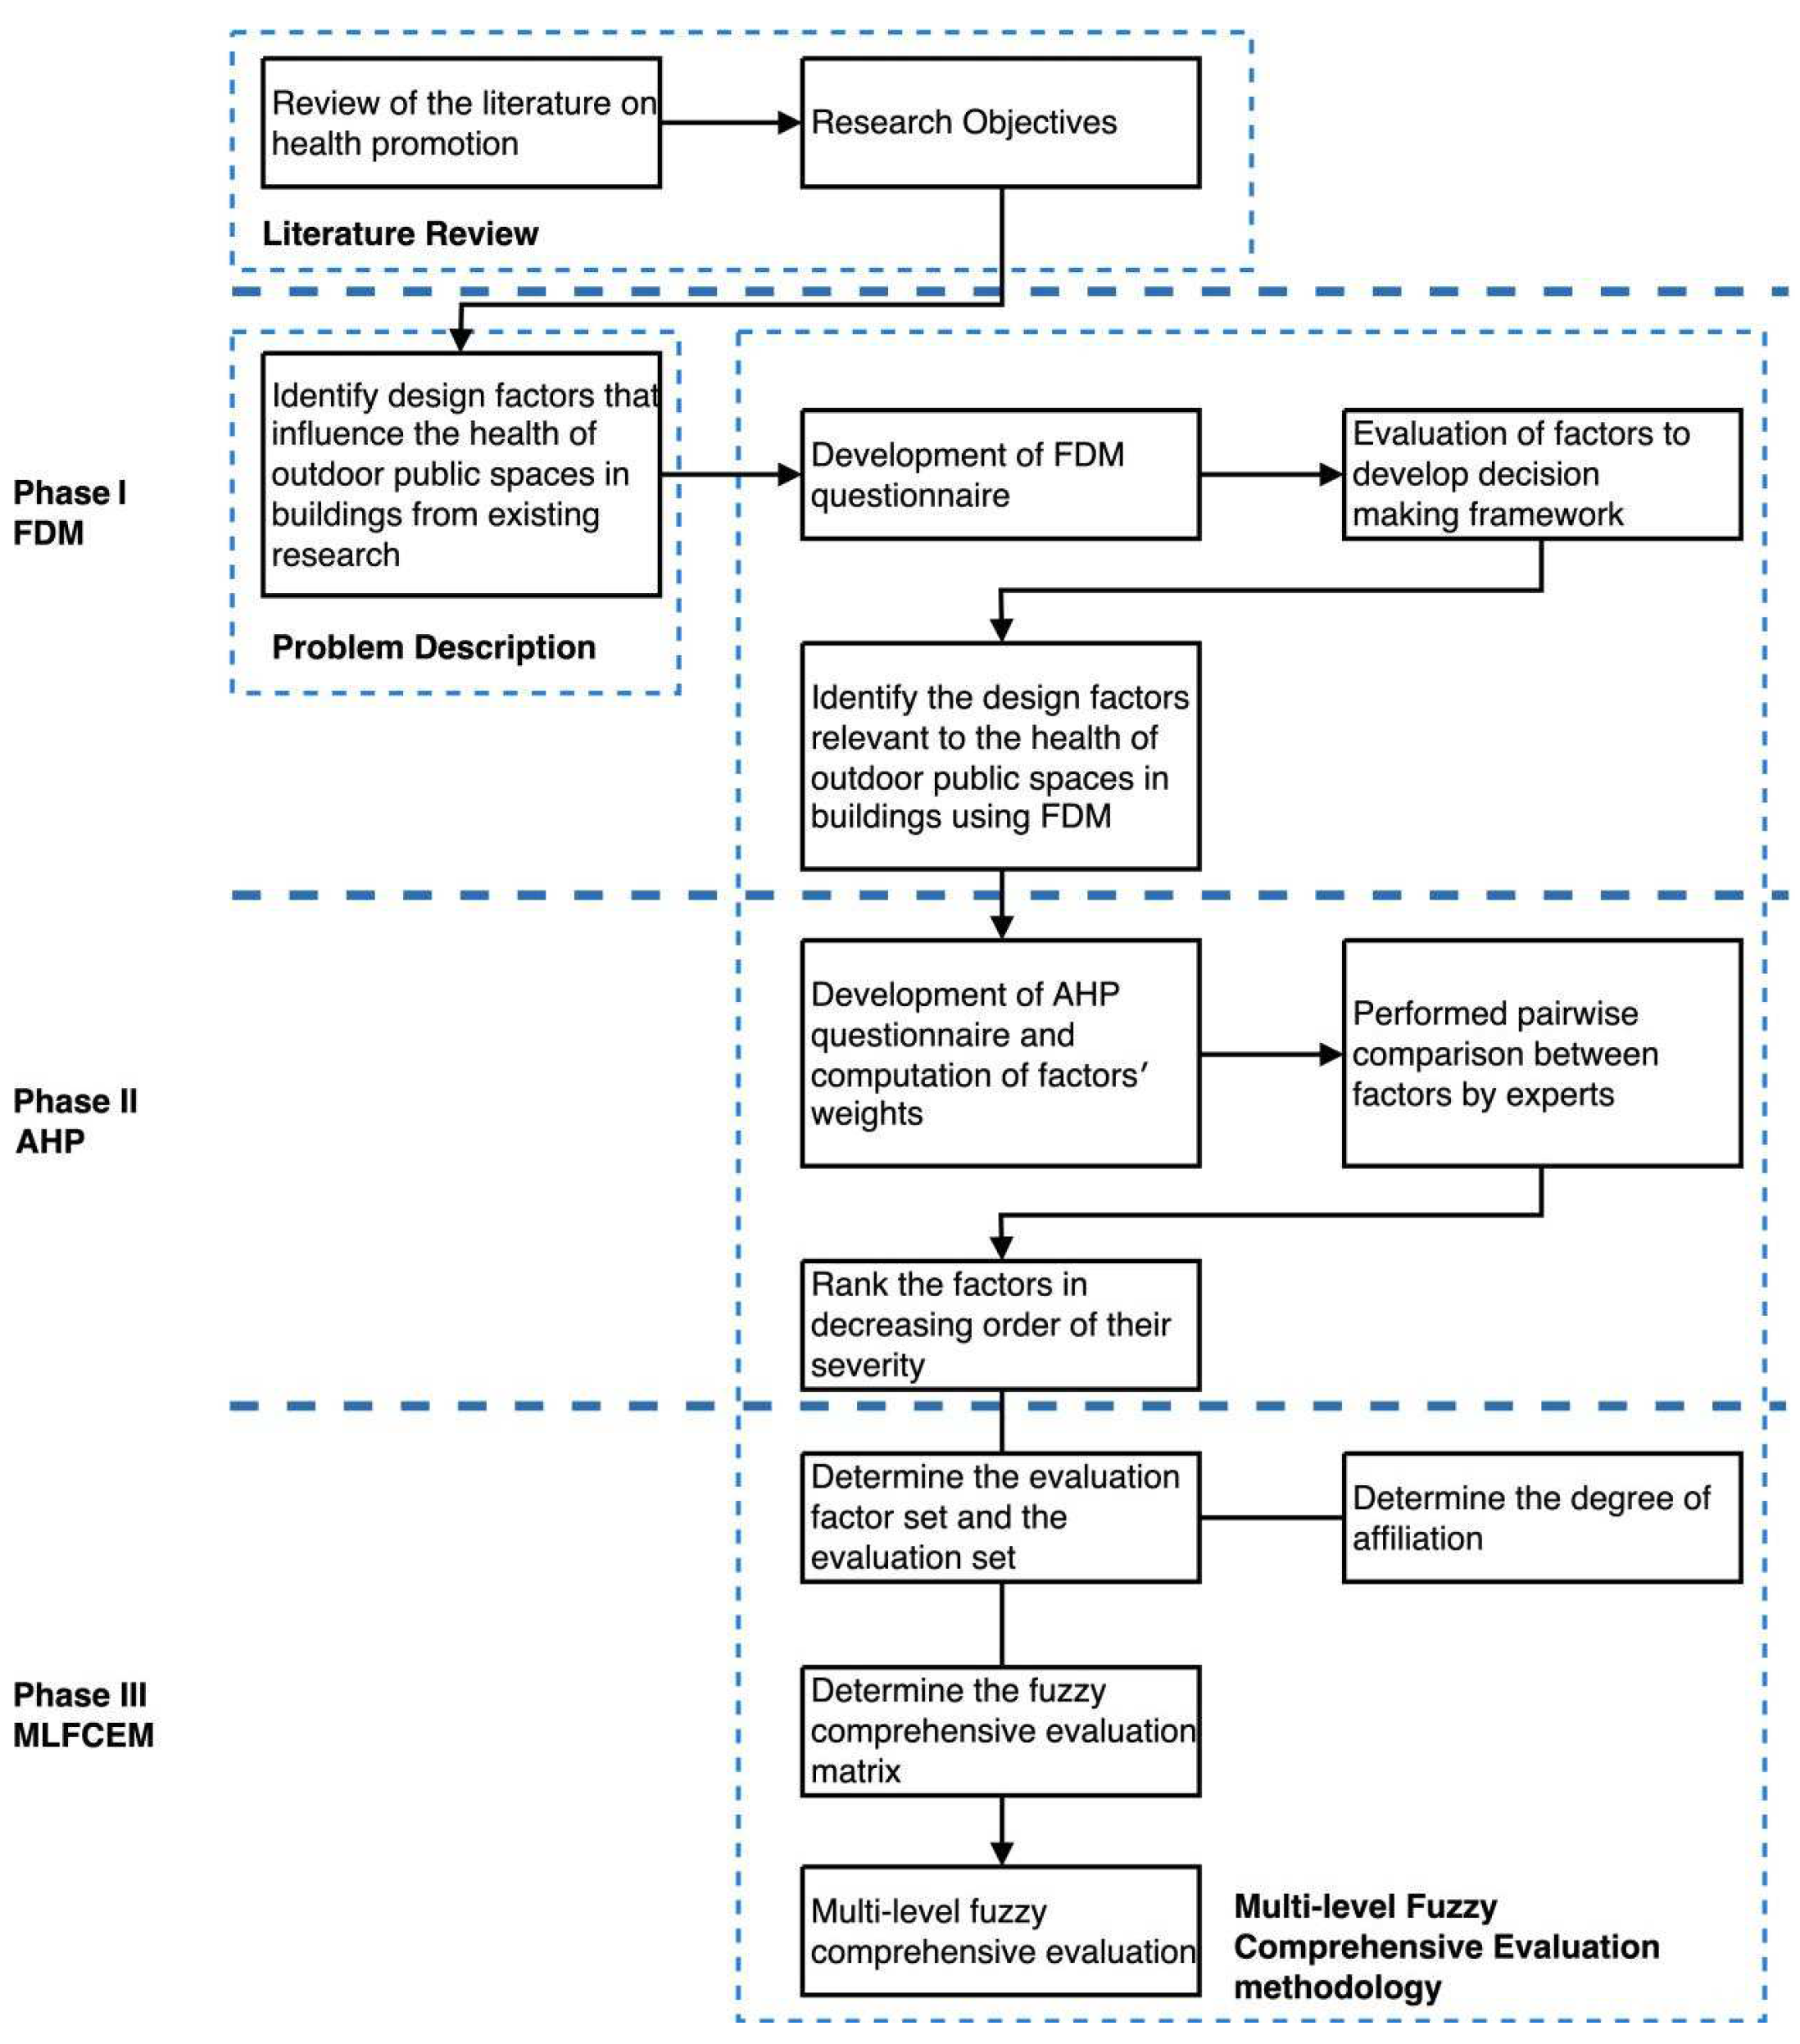
3. Research Methodology
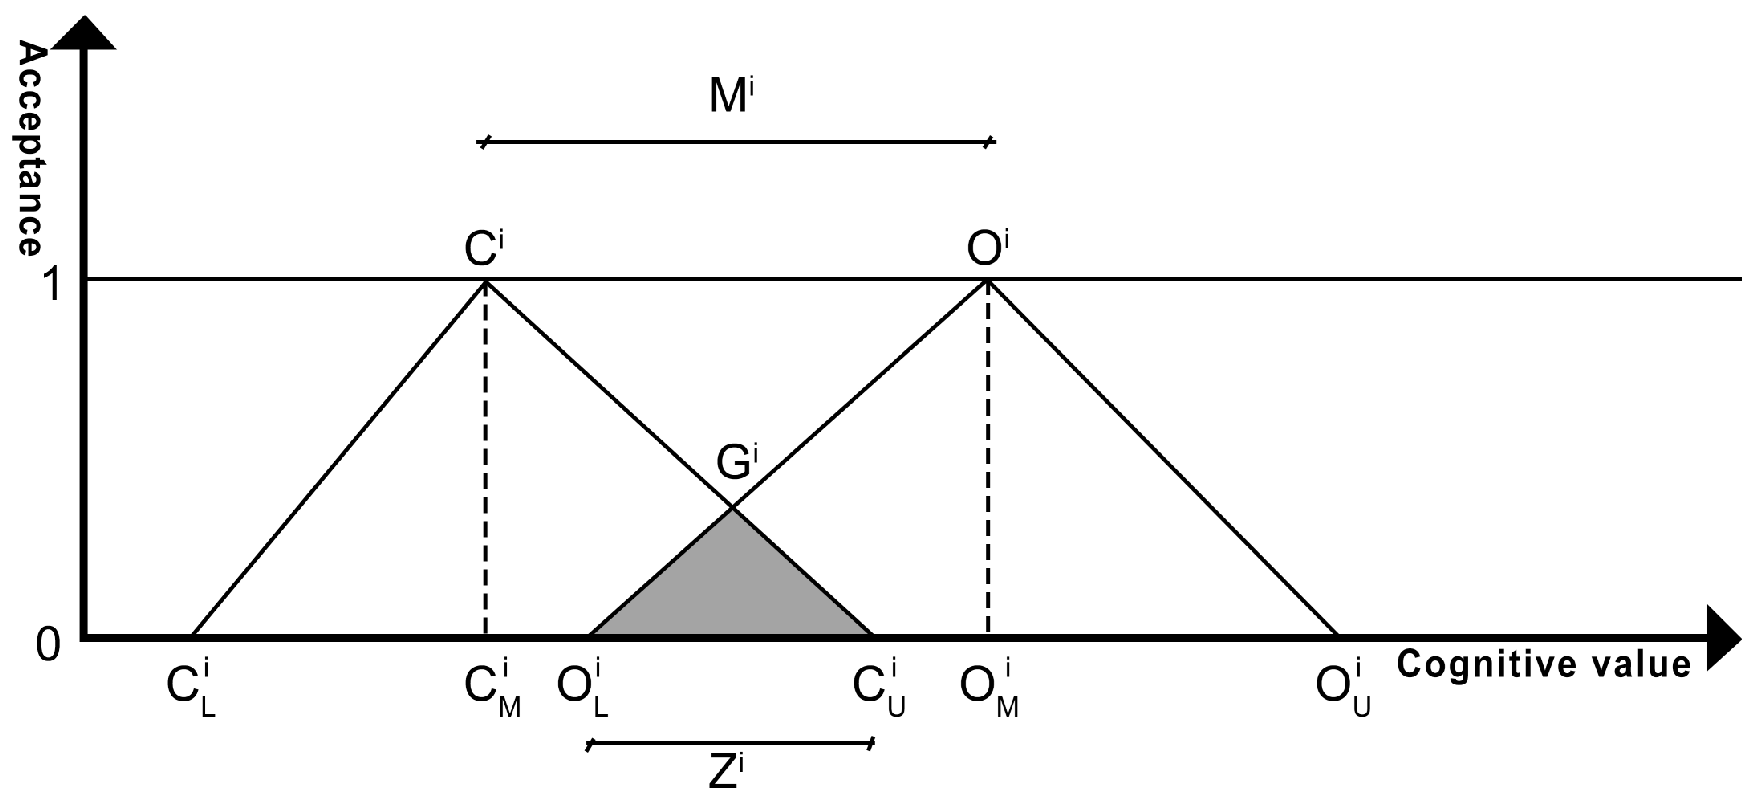
3.1. Fuzzy Delphi Method
3.2. Analytic Hierarchy Process
- Experts are instructed to compare the relative importance of indicators at the same level in pairs, based on the AHP language scale presented in Table 3.
- Use the root-finding method to calculate the approximate value of the eigenvector of the judgment matrix; the formula is as follows:
- To ensure the logical consistency and completeness of the importance judgment content and to establish scientific indicator weights, we conducted consistency checks on the judgment matrices at each level. The specific formulas are as follows:
3.3. Multi-Level Fuzzy Comprehensive Evaluation Model
- Determine the evaluation factors and comment set. The set of evaluation factors is a collection of various factors that can influence the evaluation results, denoted by U.The set of comments is a collection of evaluation results given by the evaluator to the evaluated object, denoted by V, and the results are scored on a scale of 1 to 4—that is, the set of comments can be represented as follows:
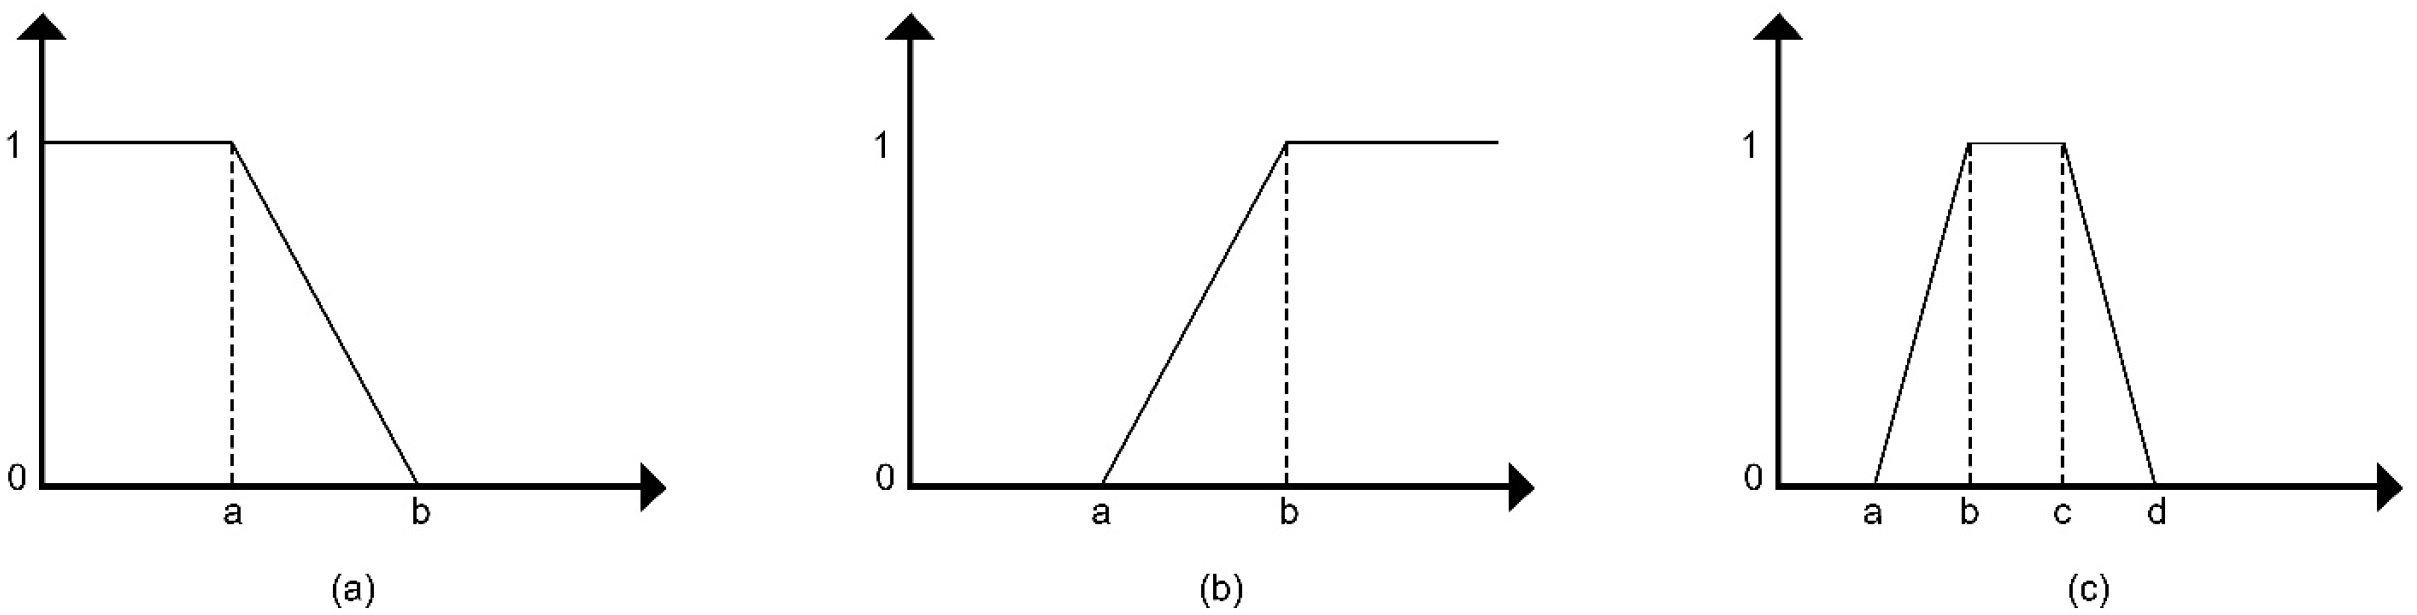
- To explain the degree of membership of indicator factors within the fuzzy set concerning health in architectural outdoor spaces, this study introduces the fundamental concept of membership degree. First proposed by Lotfi A. Zadeh in 1965, this concept was developed to overcome the limitations of traditional binary logic in dealing with the complexity of the real world [71]. The membership degree ranges from [0, 1], with higher values signifying a stronger association of the indicator with the fuzzy set.
- In this study, the evaluation index factors are divided into two categories: quantitative indicators and qualitative indicators. These types of indicators have different methods for calculating membership degrees, which will be detailed in the following sections.
- Quantitative Indicators
- 2.
- Qualitative Indicators
- Based on the previous step’s calculation results, you can construct the membership degree matrix () for each basic indicator factor in the evaluation index system, as shown below:
- Based on the weight vector obtained from the second phase operation and the fuzzy matrix obtained in the previous step, the fuzzy comprehensive evaluation conclusion vector can be obtained through weighted calculation. The algorithm formula is as follows:
- Among them,
- Based on the above calculations, the fuzzy evaluation results for each element layer can be obtained. The calculation formula is as follows:
- Calculate the fuzzy comprehensive evaluation values of all indicators at the element level in this manner, forming the fuzzy comprehensive evaluation for each element level.
- The calculation method for fuzzy evaluation at the criterion level is the same as that at the element level. After calculating the fuzzy evaluation vectors and comprehensive evaluation values for all indicators at the criterion level, the fuzzy comprehensive evaluation at the criterion level is formed.
- By performing a comprehensive analysis of the resulting data from the fuzzy comprehensive evaluations of the factor and criterion layers, we can compute the fuzzy comprehensive evaluation for the overall goal layer. The calculation process mirrors that of the fuzzy evaluations for the factor and criterion layers.
- Based on the data obtained from the above process and the established fuzzy rules, the comprehensive evaluation results of the target can be calculated. Finally, the target is evaluated based on the calculated results. This study categorizes the five evaluation results of the health assessment set for outdoor architectural spaces into good, better, average, and poor, with corresponding score ranges of (3, 4], (2, 3], (1, 2], and (0, 1], respectively. See Table 4 for details.
4. Application of the Proposed Framework
4.1. Data Collection
4.2. Study Area
4.3. Phase 1: Identification of the Relevant Factors Using FDM
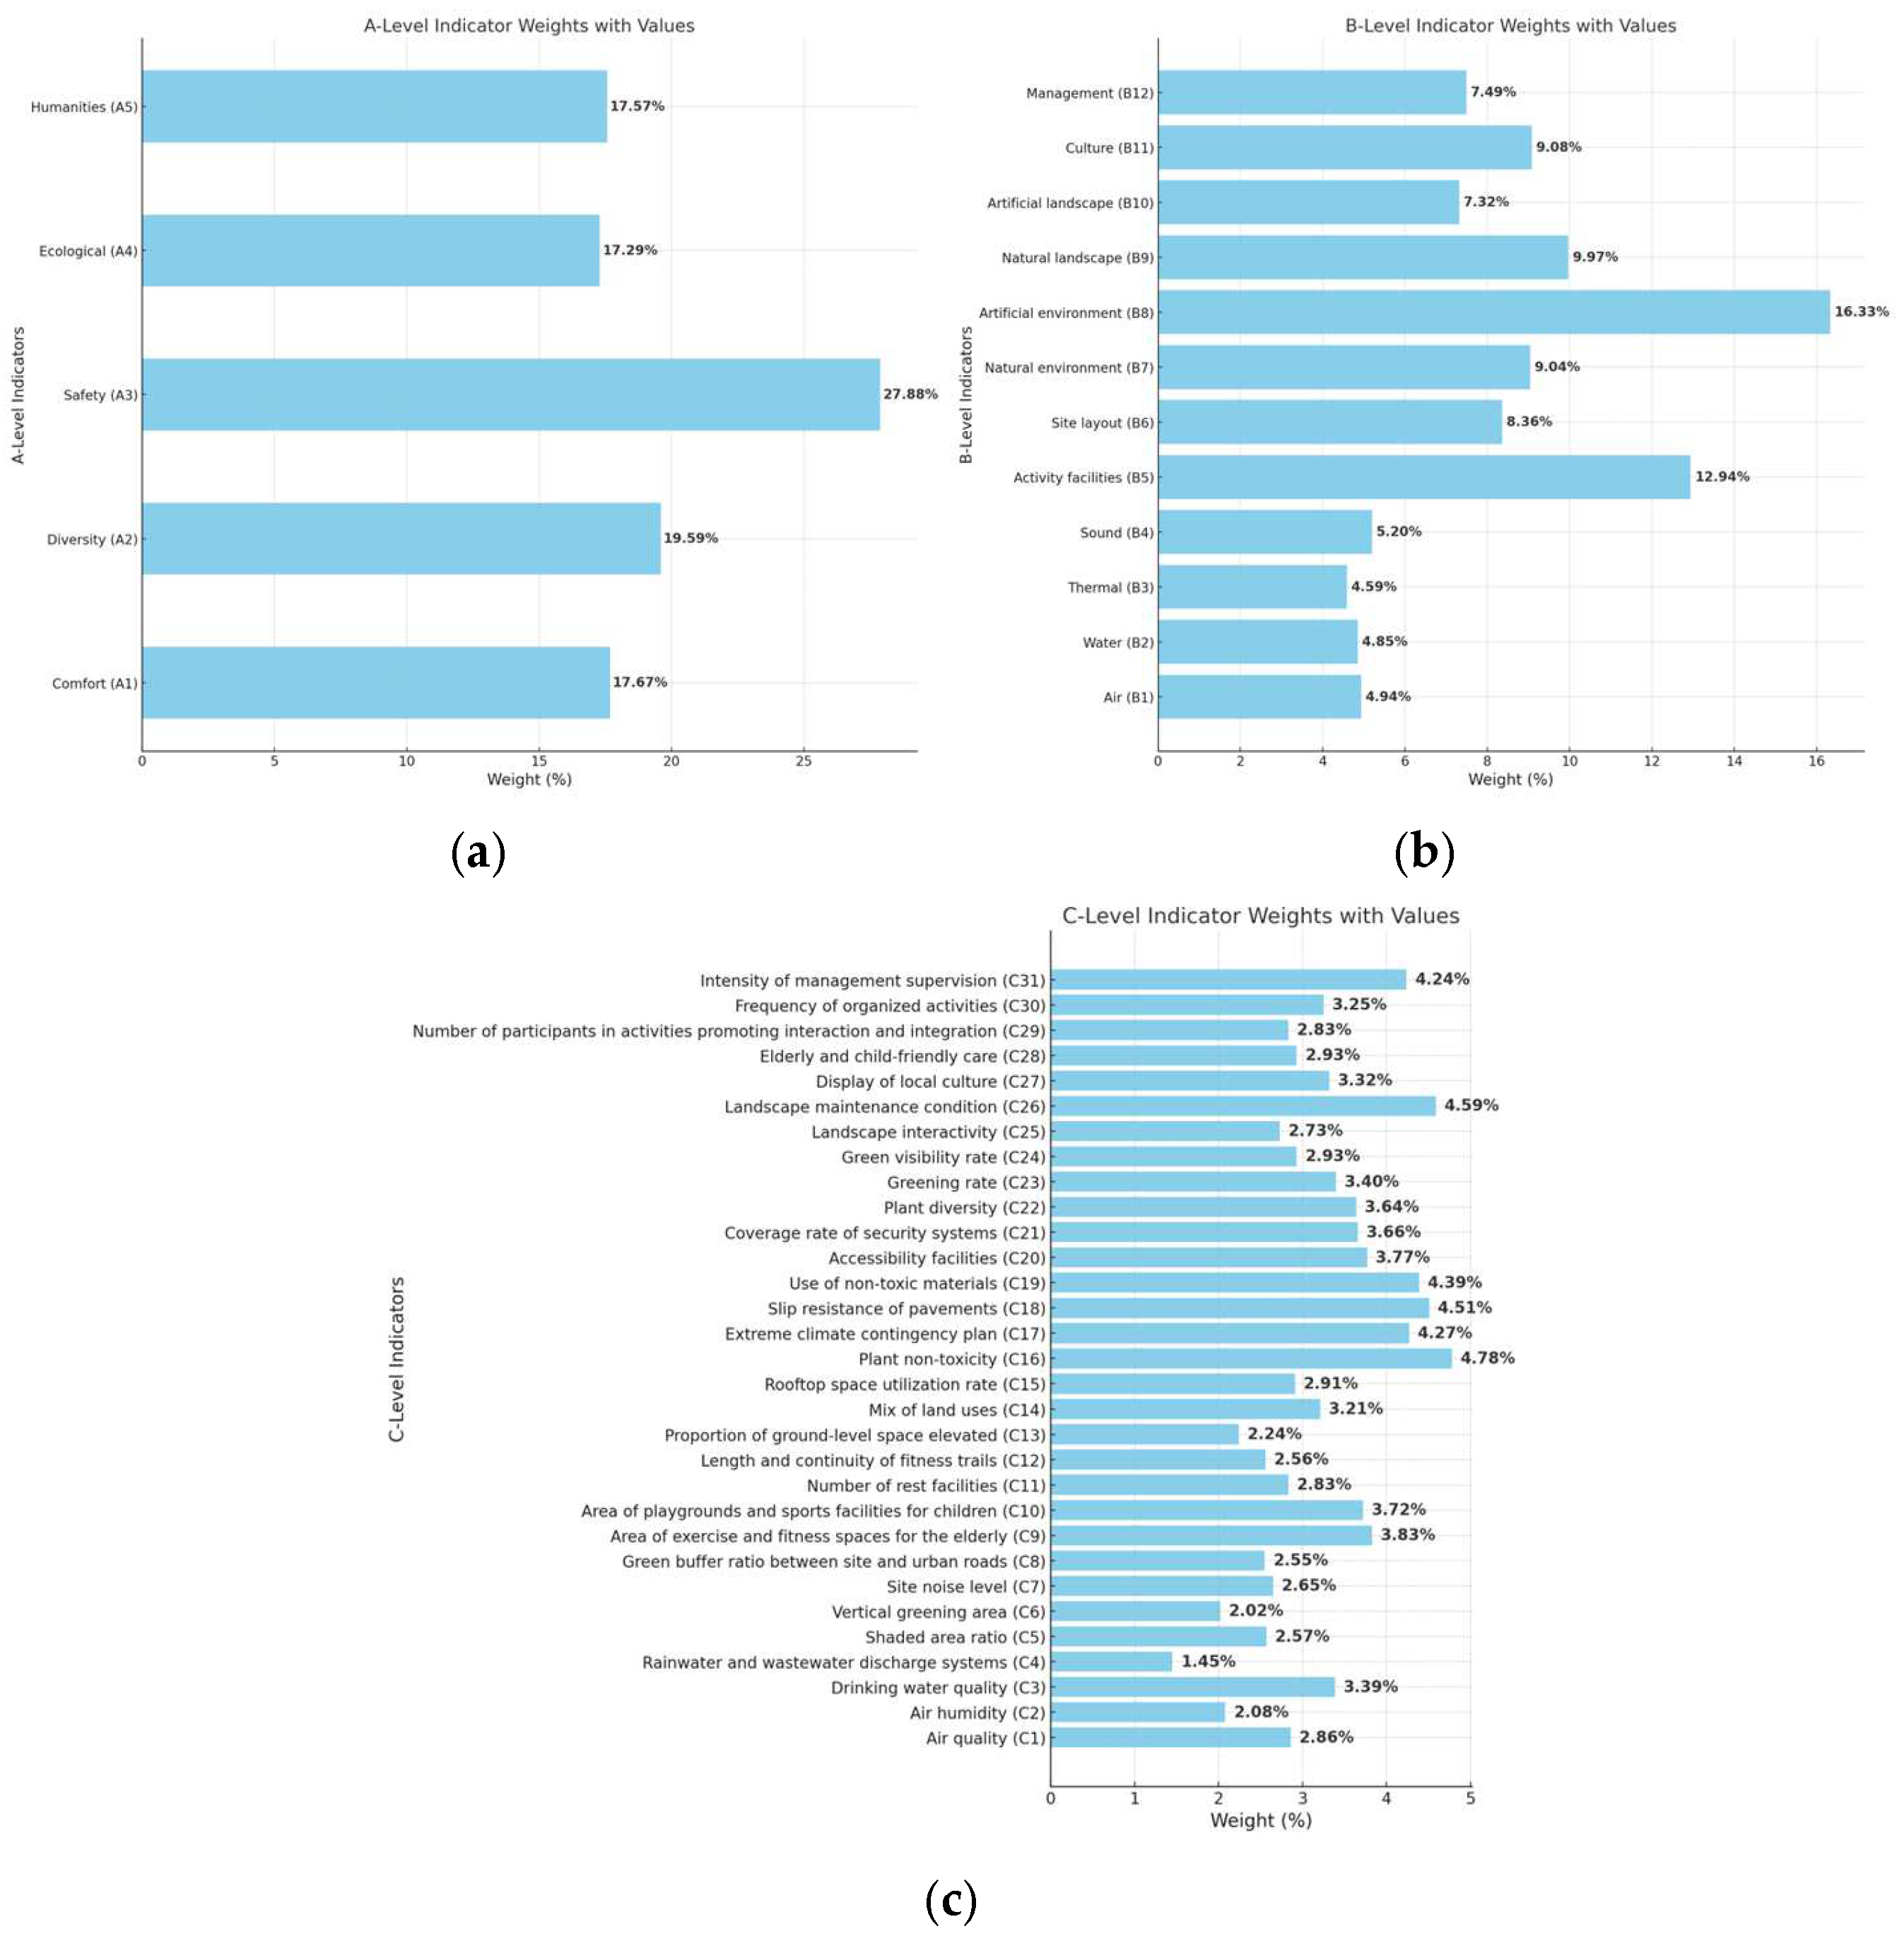
4.4. Phase 2: Calculate the Weight Using AHP
4.5. Phase 3: Establishment of Multi-Level Fuzzy Comprehensive Evaluation Model
4.5.1. Quantitative Indicators
4.5.2. Qualitative Indicators
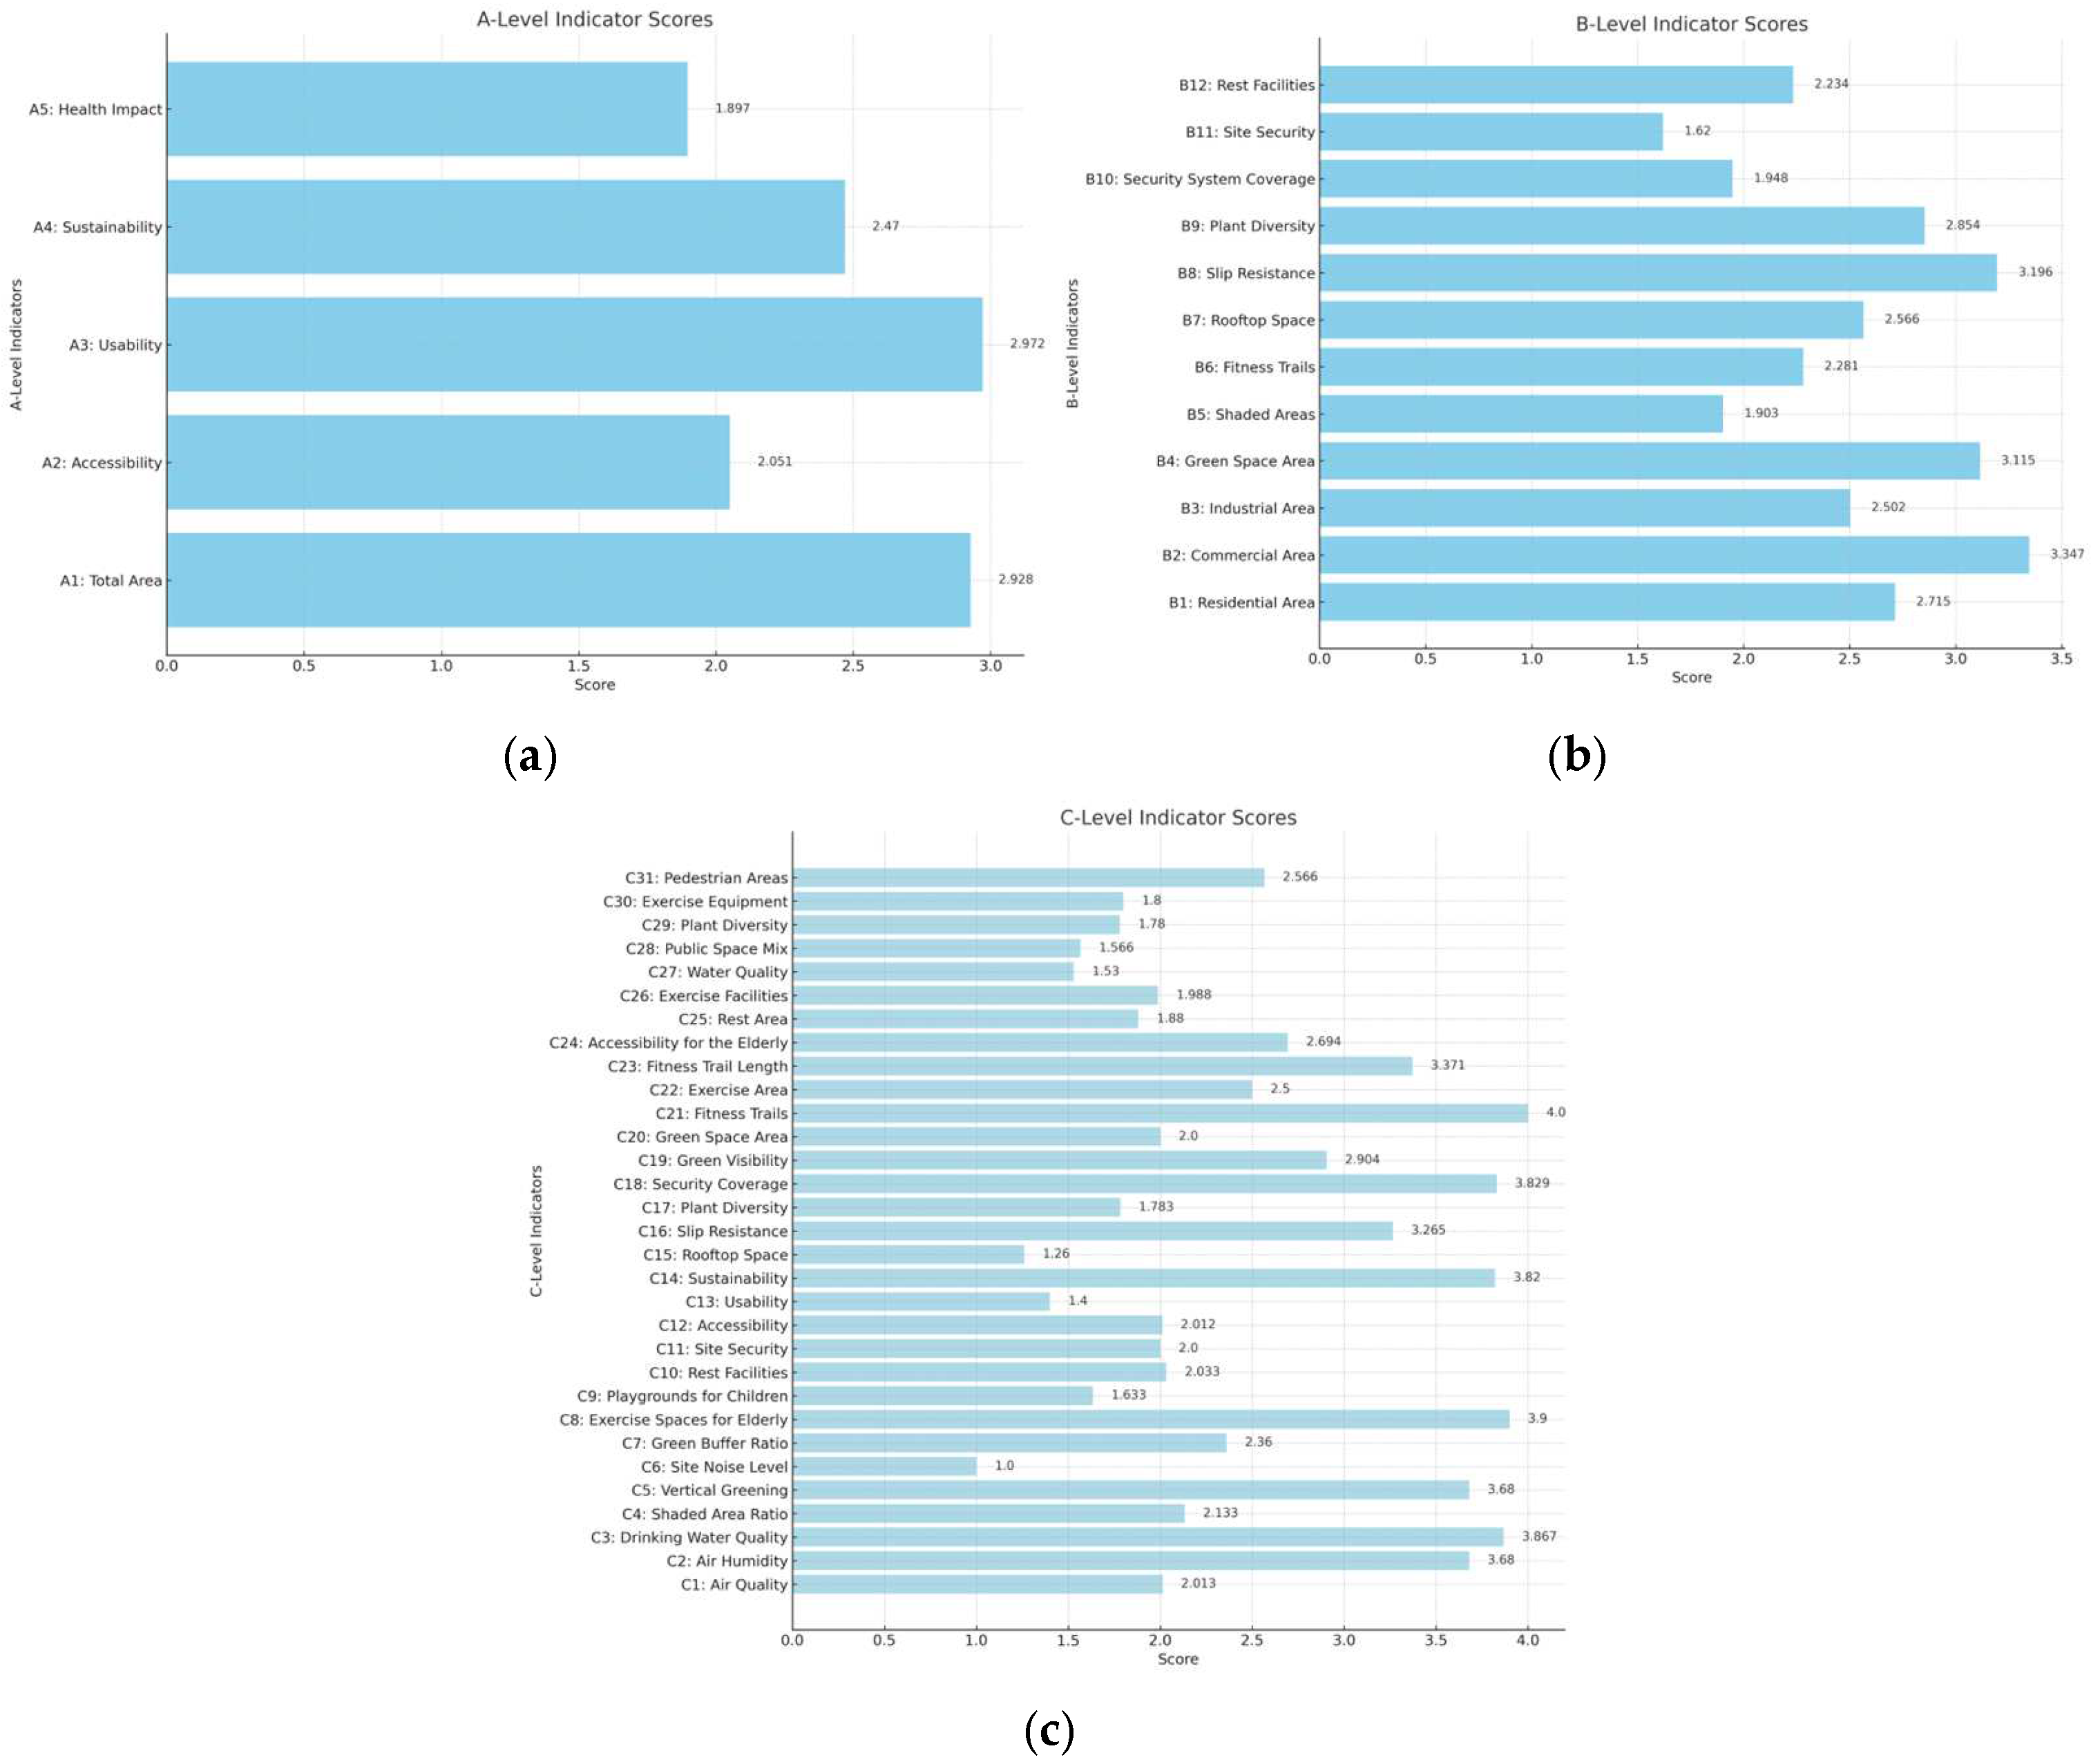
4.6. Fuzzy Comprehensive Evaluation
5. Discussion
6. Conclusions
Author Contributions
Funding
Data Availability Statement
Acknowledgments
Conflicts of Interest
Appendix A

| Evaluation Criteria | ||||||
|---|---|---|---|---|---|---|
| Comfort (A1) | ||||||
| Air (B1) | ||||||
| Air quality (C1) | 7 | 9 | 8.14 | 9 | 10 | 9.86 |
| Air humidity (C2) | 4 | 9 | 5.86 | 8 | 10 | 8.29 |
| Location and number of smoking areas (C3) | 4 | 6 | 5.14 | 5 | 8 | 7 |
| Intelligent air display system (C4) | 1 | 5 | 2.14 | 4 | 7 | 4.43 |
| Number of no-smoking signs (C5) | 2 | 6 | 4 | 4 | 8 | 6.14 |
| Water (B2) | ||||||
| Water quality for landscape use (C6) | 3 | 7 | 5.14 | 6 | 8 | 7.29 |
| Drinking water quality (C7) | 6 | 9 | 8 | 8 | 10 | 9.71 |
| Esthetic value of water features (C8) | 3 | 7 | 5 | 5 | 8 | 7 |
| Rainwater and wastewater discharge systems (C9) | 2 | 8 | 6.29 | 6 | 10 | 8.57 |
| Density of drinking water facilities (C10) | 2 | 6 | 4.29 | 5 | 8 | 6.43 |
| Illumination (B3) | ||||||
| Light pollution from nighttime illumination (C11) | 1 | 5 | 3.71 | 3 | 7 | 5.73 |
| Number of nighttime lighting fixtures (C12) | 3 | 7 | 4.86 | 5 | 8 | 7 |
| Thermal (B4) | ||||||
| Permeability rate of paved surfaces (C13) | 4 | 7 | 5.57 | 5 | 9 | 7.86 |
| Shaded area ratio (C14) | 6 | 8 | 6.71 | 7 | 10 | 8.71 |
| Vertical greening area (C15) | 4 | 8 | 5.57 | 6 | 10 | 7.71 |
| Sound(B5) | ||||||
| Site noise level (C16) | 7 | 9 | 7.57 | 8 | 10 | 9.29 |
| Green buffer ratio between site and urban roads (C17) | 4 | 8 | 5.71 | 6 | 10 | 8.14 |
| Diversity (A2) | ||||||
| Activity facilities (B6) | ||||||
| Area of exercise and fitness spaces for the elderly (C18) | 5 | 8 | 6.14 | 7 | 10 | 8.57 |
| Area of playgrounds and sports facilities for children (C19) | 4 | 8 | 5.86 | 7 | 10 | 8.57 |
| Number of rest facilities (C20) | 4 | 8 | 5.86 | 6 | 10 | 7.86 |
| Length and continuity of fitness trails (C21) | 3 | 6 | 4.57 | 5 | 9 | 6.71 |
| Site layout (B7) | ||||||
| Provision of basic cycling amenities (C22) | 1 | 5 | 2.71 | 4 | 6 | 4.57 |
| Length and continuity of bicycle lanes (C23) | 2 | 5 | 3.29 | 4 | 6 | 5 |
| Proportion of ground-level space elevated (C24) | 3 | 7 | 5 | 6 | 9 | 7.14 |
| Mix of land uses (C25) | 4 | 8 | 5.86 | 6 | 10 | 7.86 |
| Rooftop space utilization rate (C26) | 5 | 7 | 6 | 7 | 10 | 8.43 |
| Safety(A3) | ||||||
| Natural environment (B8) | ||||||
| Plant non-toxicity (C27) | 5 | 8 | 7.43 | 8 | 10 | 9.43 |
| Extreme climate contingency plan (C28) | 4 | 8 | 6.71 | 8 | 10 | 9.14 |
| Artificial environment (B9) | ||||||
| Safety of high-temperature light sources (C29) | 2 | 8 | 4.57 | 5 | 9 | 7.71 |
| Slip resistance of pavements (C30) | 7 | 8 | 7.43 | 9 | 10 | 9.43 |
| Drowning prevention facilities (C31) | 2 | 5 | 3.57 | 3 | 9 | 6.43 |
| Use of non-toxic materials (C32) | 6 | 9 | 7.43 | 8 | 10 | 9.29 |
| High-altitude falling object buffer zone (C33) | 3 | 7 | 5.29 | 5 | 9 | 7.43 |
| Pedestrian and vehicle segregation (C34) | 5 | 8 | 6.71 | 6 | 8 | 8.71 |
| Density of safety signage (C35) | 2 | 5 | 3.43 | 4 | 7 | 5.43 |
| Accessibility facilities (C36) | 6 | 8 | 7.14 | 8 | 10 | 9.16 |
| Coverage rate of security systems (C37) | 5 | 8 | 6.29 | 7 | 10 | 8.14 |
| Emergency response measures (C38) | 5 | 8 | 6 | 7 | 9 | 8.29 |
| Ecological (A4) | ||||||
| Natural landscape (B10) | ||||||
| Plant diversity (C39) | 3 | 8 | 5.29 | 6 | 9 | 7.43 |
| Greening rate (C40) | 5 | 8 | 7 | 8 | 10 | 9.43 |
| Green visibility rate (C41) | 3 | 8 | 6 | 7 | 10 | 8.43 |
| Spatial enclosure (C42) | 3 | 7 | 4.86 | 6 | 8 | 6.71 |
| Plant accessibility (C43) | 1 | 5 | 4 | 3 | 10 | 6.71 |
| Artificial landscape (B11) | ||||||
| Landscape color richness (C44) | 1 | 5 | 2.29 | 2 | 7 | 5.43 |
| Landscape interactivity (C45) | 3 | 6 | 4.14 | 6 | 9 | 6.86 |
| Number of structures (C46) | 2 | 5 | 4 | 4 | 7 | 5.71 |
| Landscape maintenance condition (C47) | 5 | 8 | 6.29 | 7 | 9 | 7.86 |
| Humanities (A5) | ||||||
| Culture (B12) | ||||||
| Display of local culture (C48) | 4 | 8 | 5.57 | 6 | 10 | 7.71 |
| Elderly and child-friendly care (C49) | 6 | 8 | 6.71 | 8 | 10 | 9 |
| Number of participants in activities promoting interaction and integration (C50) | 4 | 6 | 5.17 | 6 | 9 | 7.33 |
| Management (B13) | ||||||
| Frequency of organized activities (C51) | 3 | 7 | 4.43 | 6 | 9 | 7 |
| Frequency of plant maintenance (C52) | 3 | 6 | 4.71 | 4 | 8 | 7.14 |
| Intensity of management supervision (C53) | 5 | 7 | 6 | 7 | 10 | 8.43 |
| Quantitative Indicators | Measurement Method |
|---|---|
| C1: Air quality | The 22 national and municipal air quality monitoring points in Wuhan and their air quality index (AQI) data in the past 15 days (17 April~1 May 2024) were imported into Arc GIS (10.2) software for interpolation analysis (ordinary kriging method), and the project points were sampled and calculated |
| C2: Air humidity | Three days were randomly selected for field measurements using handheld humidity measuring instruments, from 6 a.m. to 11 p.m., every half hour, and finally averaged |
| C3: Drinking water quality | Drinking water is sampled from the site and sent to the laboratory to measure the water quality |
| C5: Shaded area ratio | Select the shaded areas in the venue at 9 o’clock, 12 o’clock, 15 o’clock, and 18 o’clock, count its proportion in the overall field, and finally take the average value of the four time periods |
| C6: Vertical greening area | Photographs of the four facades of the building were taken by a drone and imported into Adobe Photoshop (2021) to calculate the ratio of the number of green pixels to the number of pixels in the building |
| C7: Site noise level | 3 days were randomly selected for on-site measurements using a handheld decibel meter, every half hour from 6 a.m. to 11 p.m., and finally averaged |
| C8: Green buffer ratio between site and urban roads | By downloading a satellite map, the ratio of the greened part to the overall boundary is calculated by marking the greened part of the site and the road boundary of the site |
| C9: Area of exercise and fitness spaces for the elderly | By downloading a satellite map, mark the area of the site and all outdoor areas for users, and separately mark the area for the elderly, and calculate the proportion of the area |
| C10: Area of playgrounds and sports facilities for children | By downloading a satellite map, mark the area of the site and the outdoor area for the use of users, and mark the area for children separately to calculate the proportion of the area |
| C11: Number of rest facilities | By downloading a satellite map, mark the site and all the facilities for users to rest, and count the number of them |
| C12: Length of fitness trails | By downloading a satellite map, mark the continuous fitness trails in the site for users to exercise and count their length |
| C13: Proportion of ground-level space elevated | Through field investigation, the area of the ground floor overhead area in the site is counted, and the ratio of it to the overall area of the first floor is calculated |
| C14: Mix of land uses | By downloading a satellite map, mark the outdoor areas with multi-use functions and calculate the area ratio to all outdoor areas |
| C15: Rooftop space utilization rate | By downloading a satellite map, mark the area where the roof of the building can be used and calculate the ratio of it to the overall roof area |
| C18: Slip resistance of pavements | By downloading a satellite map, mark the areas of the building’s outdoor space with non-slip paving, and calculate the ratio of its area to the overall outdoor space |
| C21: Coverage rate of security systems | Through field research, the monitoring screen in the site is obtained, and the area covered by the site is drawn in Adobe Photoshop (2021), and the ratio of the area to the overall area is counted |
| C22: Plant diversity | Plant species in the site were obtained through field research |
| C23: Greening rate | By downloading a satellite map, mark the greenery in the site and calculate its area ratio to the overall site |
| C24: Green visibility rate | The green view rate was selected to quantitatively analyze the green landscape of the three-dimensional space, the four corners of the theme building of the site were selected as the sampling points, the camera was placed vertically at a height of 160 cm, and the panoramic photos were taken, respectively |
| C29: Number of participants in activities promoting interaction and integration | The number of people involved in activities that promote interaction and integration is counted and averaged from 6 a.m. to 10 p.m. throughout the week |
| C30: Frequency of organized activities | Count the number of activities organized in the venue in a month |
References
- Vijayan, S. A World Health Organization Primer—PMC. Med. Gen. Med. 2007, 9, 41. Available online: https://www.ncbi.nlm.nih.gov/pmc/articles/PMC2234304/ (accessed on 4 July 2024).
- Liu, C.; Mostafavi, A. Decoding Urban-Health Nexus: Interpretable Machine Learning Illuminates Cancer Prevalence Based on Intertwined City Features. arXiv 2023, arXiv:2306.11847. [Google Scholar] [CrossRef]
- Peterson, A.; Hirsch, J.; Sanchez, B. Spatial Temporal Aggregated Predictors to Examine Built Environment Health Effects. arXiv 2020, arXiv:2105.10565. [Google Scholar] [CrossRef]
- Peterson, A.; Berrocal, V.; Sanchez-Vaznaugh, E.; Sanchez, B. How Close and How Much? Linking Health Outcomes to Built Environment Spatial Distributions. Ann. Appl. Stat. 2020, 17, 1641–1662. [Google Scholar]
- Carmona, M. Contemporary Public Space, Part Two: Classification. J. Urban Des. 2010, 15, 157–173. [Google Scholar] [CrossRef]
- van Nes, A.; Yamu, C. Private and Public Space: Analysing Spatial Relationships between Buildings and Streets. In Introduction to Space Syntax in Urban Studies; van Nes, A., Yamu, C., Eds.; Springer International Publishing: Cham, Switzerland, 2021; pp. 113–131. ISBN 978-3-030-59140-3. [Google Scholar]
- Mahmoud, H.-T.H. Interior Architectural Elements That Affect Human Psychology and Behavior. Acad. Res. Community Publ. 2020, 1, 10. [Google Scholar] [CrossRef]
- Teriman, S.; Yigitcanlar, T.; Mayere, S. Urban Growth Management for Sustainable Urbanization: Examples from Asia-Pacific City Regions. In Proceedings of the First International Postgraduate Conference on Infrastructure and Environment, Hong Kong, China, 5–6 June 2009; Faculty of Construction and Land Use, The Hong Kong Polytechnic University: Hong Kong, 2009; pp. 229–236, ISBN 978-988-17311-2-8. [Google Scholar]
- Sahakian, M.; Anantharaman, M.; Di Giulio, A.; Saloma, C.; Zhang, D.; Khanna, R.; Narasimalu, S.; Favis, A.M.; Alfiler, C.A.; Narayanan, S.; et al. Green Public Spaces in the Cities of South and Southeast Asia. Protecting Needs towards Sustainable Well-Being. J. Public Space 2020, 5, 89–110. [Google Scholar] [CrossRef]
- Triguero-Mas, M.; Dadvand, P.; Cirach, M.; Martínez, D.; Medina, A.; Mompart, A.; Basagaña, X.; Gražulevičienė, R.; Nieuwenhuijsen, M.J. Natural Outdoor Environments and Mental and Physical Health: Relationships and Mechanisms. Environ. Int. 2015, 77, 35–41. [Google Scholar] [CrossRef]
- Wang, L.; Md Sani, N. The Impact of Outdoor Blue Spaces on the Health of the Elderly: A Systematic Review. Health Place 2024, 85, 103168. [Google Scholar] [CrossRef]
- Javadi, R.; Nasrollahi, N. Urban Green Space and Health: The Role of Thermal Comfort on the Health Benefits from the Urban Green Space; a Review Study. Build. Environ. 2021, 202, 108039. [Google Scholar] [CrossRef]
- Arnberger, A.; Eder, R.; Allex, B.; Wallner, P.; Weitensfelder, L.; Hutter, H.-P. Urban Green Space Preferences for Various Health-Related Psychological Benefits of Adolescent Pupils, University Students and Adults. Urban For. Urban Green. 2024, 98, 128396. [Google Scholar] [CrossRef]
- Altomonte, S.; Kaçel, S.; Martinez, P.W.; Licina, D. What Is NExT? A New Conceptual Model for Comfort, Satisfaction, Health, and Well-Being in Buildings. Build. Environ. 2024, 252, 111234. [Google Scholar] [CrossRef]
- Castaldo, V.L.; Pigliautile, I.; Rosso, F.; Cotana, F.; De Giorgio, F.; Pisello, A.L. How Subjective and Non-Physical Parameters Affect Occupants’ Environmental Comfort Perception. Energy Build. 2018, 178, 107–129. [Google Scholar] [CrossRef]
- Wei, W.; Wargocki, P.; Zirngibl, J.; Bendžalová, J.; Mandin, C. Review of Parameters Used to Assess the Quality of the Indoor Environment in Green Building Certification Schemes for Offices and Hotels. Energy Build. 2020, 209, 109683. [Google Scholar] [CrossRef]
- Maller, C.; Townsend, M.; Leger, L.; Henderson-Wilson, C.; Pryor, A.; Prosser, L.; Moore, M. Healthy Parks, Healthy People: The Health Benefits of Contact with Nature in a Park Context. Georg. Wright Forum 2009, 26, 51–83. [Google Scholar]
- Li, Y.; Tang, H. Health-Oriented Evaluation and Optimization of Urban Square Space Elderly Suitability: A Case Study of Yiyang City Center. Buildings 2024, 14, 2482. [Google Scholar] [CrossRef]
- Kondo, M.C.; Fluehr, J.M.; McKeon, T.; Branas, C.C. Urban Green Space and Its Impact on Human Health. Int. J. Environ. Res. Public Health 2018, 15, 445. [Google Scholar] [CrossRef]
- Briggs, D.J. A Framework for Integrated Environmental Health Impact Assessment of Systemic Risks. Environ. Health 2008, 7, 61. [Google Scholar] [CrossRef] [PubMed]
- Harris, M.J. Evaluating Public and Community Health Programs; John Wiley & Sons: Hoboken, NJ, USA, 2016; ISBN 978-1-119-15105-0. [Google Scholar]
- Judd, J. Setting Standards in the Evaluation of Community-Based Health Promotion Programmes—A Unifying Approach. Health Promot. Int. 2001, 16, 367–380. [Google Scholar] [CrossRef]
- Gupta, R.; Rathore, B.; Srivastava, A.; Biswas, B.; Peng, Y.; Peng, Z.; Feng, T.; Zhong, C.; Wang, W.; Hsu, C.; et al. Comprehensive Evaluation of Healthcare Benefits of Different Forest Types: A Case Study in Shimen National Forest Park, China. Forests 2013, 12, 207. [Google Scholar] [CrossRef]
- Fantozzi, F.; Rocca, M. An Extensive Collection of Evaluation Indicators to Assess Occupants’ Health and Comfort in Indoor Environment. Atmosphere 2020, 11, 90. [Google Scholar] [CrossRef]
- Available online: https://v2.wellcertified.com/en/ (accessed on 31 March 2025).
- Available online: https://www.fitwel.org/certification/ (accessed on 31 March 2025).
- Available online: https://bhptoolkit.uli.org/ (accessed on 31 March 2025).
- Fenger, J. Urban Air Quality. Atmos. Environ. 1999, 33, 4877–4900. [Google Scholar] [CrossRef]
- Jones, A.P. Indoor Air Quality and Health. Atmos. Environ. 1999, 33, 4535–4564. [Google Scholar] [CrossRef]
- Cho, Y.; Ryu, S.-H.; Lee, B.R.; Kim, K.H.; Lee, E.; Choi, J. Effects of Artificial Light at Night on Human Health: A Literature Review of Observational and Experimental Studies Applied to Exposure Assessment. Chronobiol. Int. 2015, 32, 1294–1310. [Google Scholar] [CrossRef]
- Omonijo, A.G.; Adeofun, C.O.; Oguntoke, O.; Matzarakis, A. Relevance of Thermal Environment to Human Health: A Case Study of Ondo State, Nigeria. Theor. Appl. Climatol. 2013, 113, 205–212. [Google Scholar] [CrossRef]
- Singh, D.; Kumari, N.; Sharma, P. A Review of Adverse Effects of Road Traffic Noise on Human Health. Fluct. Noise Lett. 2018, 17, 1830001. [Google Scholar] [CrossRef]
- Stansfeld, S.A.; Matheson, M.P. Noise Pollution: Non-Auditory Effects on Health. Br. Med. Bull. 2003, 68, 243–257. [Google Scholar] [CrossRef] [PubMed]
- Peng, Y.; Feng, T.; Timmermans, H. A Path Analysis of Outdoor Comfort in Urban Public Spaces. Build. Environ. 2019, 148, 459–467. [Google Scholar] [CrossRef]
- Kruize, H.; van der Vliet, N.; Staatsen, B.; Bell, R.; Chiabai, A.; Muiños, G.; Higgins, S.; Quiroga, S.; Martinez-Juarez, P.; Aberg Yngwe, M.; et al. Urban Green Space: Creating a Triple Win for Environmental Sustainability, Health, and Health Equity through Behavior Change. Int. J. Environ. Res. Public Health 2019, 16, 4403. [Google Scholar] [CrossRef]
- Chawla, L. Biophilic Design: The Theory, Science, and Practice of Bringing Buildings to Life. Child. Youth Environ. 2008, 18, 285–286. [Google Scholar] [CrossRef]
- Li, C.; Lee, C.-W.; Tsang, K.T.; Best, J.R. Effects of Physical Activity on Children’s Executive Function: Contributions of Experimental Research on Aerobic Exercise. Dev. Rev. 2010, 30, 331–351. [Google Scholar] [CrossRef]
- Janssen, I.; LeBlanc, A.G. Systematic Review of the Health Benefits of Physical Activity and Fitness in School-Aged Children and Youth. Int. J. Behav. Nutr. Phys. Act. 2010, 7, 40. [Google Scholar] [CrossRef]
- Smiley, A.; Ramos, W.D.; Elliott, L.M.; Wolter, S.A. Association between Trail Use and Self-Rated Wellness and Health. BMC Public Health 2020, 20, 128. [Google Scholar] [CrossRef]
- Oja, P.; Titze, S.; Bauman, A.; de Geus, B.; Krenn, P.; Reger-Nash, B.; Kohlberger, T. Health Benefits of Cycling: A Systematic Review. Scand. J. Med. Sci. Sports 2011, 21, 496–509. [Google Scholar] [CrossRef]
- Biddle, S. Exercise and Psychosocial Health. Res. Q. Exerc. Sport 1995, 64, 292–297. [Google Scholar] [CrossRef] [PubMed]
- Huang, Z. Research on the Construction of Forest Health Care Trails Based on the Perspective of Promoting Sports Health. For. Chem. Rev. 2022, 1949–1955. [Google Scholar]
- Fang, Y.; Chen, Z.; Zeng, M. Current Situation and Optimization Strategy of Roof Space in Chengdu Business District. Open J. Soc. Sci. 2024, 12, 486–500. [Google Scholar] [CrossRef]
- Williams, K.J.H.; Lee, K.E.; Sargent, L.; Johnson, K.A.; Rayner, J.; Farrell, C.; Miller, R.E.; Williams, N.S.G. Appraising the Psychological Benefits of Green Roofs for City Residents and Workers. Urban For. Urban Green. 2019, 44, 126399. [Google Scholar] [CrossRef]
- Lezzerini, L. Risk Analysis for Smart Cities Urban Planners: Safety and Security in Public Spaces. Ph.D. Thesis, Università degli Studi di Ferrara, Ferrara, Italy, 2023. [Google Scholar]
- Miguel, R. Public Space as a Tool to Improve Security or the Perception of Security in Cities. Master’s Thesis, Norwegian University of Science and Technology, Trondheim, Norway, 2024. [Google Scholar]
- Yücel, G.F.; Bazargan, N.V. A Model Proposal to Be Used in Evaluation of Urban Open Spaces: Istanbul Ortakoy Square Example. UXUC-User Exp. Urban Creat. 2020, 2, 6–21. [Google Scholar] [CrossRef]
- Oc, T.; Tiesdell, S. The Fortress, the Panoptic, the Regulatory and the Animated: Planning and Urban Design Approaches to Safer City Centres. Landsc. Res. 1999, 24, 265–286. [Google Scholar] [CrossRef]
- Li, C.; Lee, C.-W.; Tsang, K.T.; Best, J.R.; Zhang, L.; Xu, X.; Guo, Y.; Rimmer, J.H.; Riley, B.; Wang, E.; et al. Accessibility of Health Clubs for People with Mobility Disabilities and Visual Impairments. Am. J. Public Health 2005, 95, 2022–2028. [Google Scholar] [CrossRef]
- Markevych, I.; Schoierer, J.; Hartig, T.; Chudnovsky, A.; Hystad, P.; Dzhambov, A.M.; de Vries, S.; Triguero-Mas, M.; Brauer, M.; Nieuwenhuijsen, M.J.; et al. Exploring Pathways Linking Greenspace to Health: Theoretical and Methodological Guidance. Environ. Res. 2017, 158, 301–317. [Google Scholar] [CrossRef] [PubMed]
- Zhang, J.; Liu, Y.; Yin, Q. A Study on the Effect of Green Vision in Inter-House Spaces on Mental Fatigue. For. Chem. Rev. 2021, 439–455. [Google Scholar]
- Grant, C.G.; Ramos, R.; Davis, J.L.; Green, B.L. Community Health Needs Assessment. Health Care Manag. 2015, 34, 147–156. [Google Scholar] [CrossRef]
- Li, C.; Lee, C.-W.; Tsang, K.T.; Best, J.R.; Zhang, L.; Xu, X.; Guo, Y.; Rimmer, J.H.; Riley, B.; Wang, E.; et al. Mental Health and the Built Environment: Cross—Sectional Survey of Individual and Contextual Risk Factors for Depression. Br. J. Psychiatry 2002, 180, 428–433. [Google Scholar] [CrossRef]
- Dietz, L.W.; Šćepanović, S.; Zhou, K.; Zanella, A.F.; Quercia, D. Examining Inequality in Park Quality for Promoting Health Across 35 Global Cities. arXiv 2024, arXiv:2407.15770. [Google Scholar]
- Chandler, M.; Lalonde, C. Cultural Continuity as a Protective Factor against Suicide in First Nations Youth. Horizons 2008, 10, 68–72. [Google Scholar]
- De Weger, E.; Van Vooren, N.; Luijkx, K.G.; Baan, C.A.; Drewes, H.W. Achieving Successful Community Engagement: A Rapid Realist Review. BMC Health Serv. Res. 2018, 18, 285. [Google Scholar] [CrossRef]
- Dalkey, N.; Helmer, O. An Experimental Application of the DELPHI Method to the Use of Experts. Manag. Sci. 1963, 9, 458–467. [Google Scholar] [CrossRef]
- Bouzon, M.; Govindan, K.; Rodriguez, C.M.T.; Campos, L.M.S. Identification and Analysis of Reverse Logistics Barriers Using Fuzzy Delphi Method and AHP. Resour. Conserv. Recycl. 2016, 108, 182–197. [Google Scholar] [CrossRef]
- Chen, C.-W.; Wang, J.-H.; Wang, J.C.; Shen, Z.-H. Developing Indicators for Sustainable Campuses in Taiwan Using Fuzzy Delphi Method and Analytic Hierarchy Process. J. Clean. Prod. 2018, 193, 661–671. [Google Scholar] [CrossRef]
- Ishikawa, A.; Amagasa, M.; Shiga, T.; Tomizawa, G.; Tatsuta, R.; Mieno, H. The Max-Min Delphi Method and Fuzzy Delphi Method via Fuzzy Integration. Fuzzy Sets Syst. 1993, 55, 241–253. [Google Scholar] [CrossRef]
- Cheng, C.-H.; Lin, Y. Evaluating the Best Main Battle Tank Using Fuzzy Decision Theory with Linguistic Criteria Evaluation. Eur. J. Oper. Res. 2002, 142, 174–186. [Google Scholar] [CrossRef]
- Shi, G.; Yao, S.; Song, J.; Bi, W.; Qin, G.; Ni, P.; Ma, Z.; Shao, C.; Ma, S.; Ye, Z. Constructing Road Safety Performance Indicators Using Fuzzy Delphi Method and Grey Delphi Method. Expert Syst. Appl. 2011, 38, 1509–1514. [Google Scholar] [CrossRef]
- Chan, F.T.S.; Kumar, N.; Tiwari, M.K.; Lau, H.C.W.; Choy, K.L. Global Supplier Selection: A Fuzzy-AHP Approach. Int. J. Prod. Res. 2008, 46, 3825–3857. [Google Scholar] [CrossRef]
- Huang, C.-C.; Chu, P.-Y.; Chiang, Y.-H. A Fuzzy AHP Application in Government-Sponsored R&D Project Selection. Omega 2008, 36, 1038–1052. [Google Scholar] [CrossRef]
- Saaty, T.L. What Is the Analytic Hierarchy Process? In Mathematical Models for Decision Support; Mitra, G., Greenberg, H.J., Lootsma, F.A., Rijkaert, M.J., Zimmermann, H.J., Eds.; Springer: Berlin/Heidelberg, Germany, 1988; pp. 109–121. ISBN 978-3-642-83557-5. [Google Scholar]
- Vaidya, O.S.; Kumar, S. Analytic Hierarchy Process: An Overview of Applications. Eur. J. Oper. Res. 2006, 169, 1–29. [Google Scholar] [CrossRef]
- Tong, Z.; Zhang, Q. Urban Planning Implementation Evaluation: A Multilevel Fuzzy Comprehensive Evaluation Approach. Open Civ. Eng. J. 2016, 10, 200–211. [Google Scholar] [CrossRef]
- Li, L.; Shen, L. An Improved Multilevel Fuzzy Comprehensive Evaluation Algorithm for Security Performance. J. China Univ. Posts Telecommun. 2006, 13, 48–53. [Google Scholar] [CrossRef]
- Gong, L.; Jin, C. Fuzzy Comprehensive Evaluation for Carrying Capacity of Regional Water Resources. Water Resour. Manag. 2009, 23, 2505–2513. [Google Scholar] [CrossRef]
- Multi-Level Fuzzy Comprehensive Evaluation of Power Quality. In Proceedings of the 2004 IEEE International Conference on Electric Utility Deregulation, Restructuring and Power Technologies, Hong Kong, China, 5–8 April 2004.
- Zadeh, L.A. Fuzzy Sets as a Basis for a Theory of Possibility. Fuzzy Sets Syst. 1999, 100, 9–34. [Google Scholar] [CrossRef]
- Gupta, R.; Rathore, B.; Srivastava, A.; Biswas, B. Decision-Making Framework for Identifying Regions Vulnerable to Transmission of COVID-19 Pandemic. Comput. Ind. Eng. 2022, 169, 108207. [Google Scholar] [CrossRef] [PubMed]

| Evaluation Standards | Cluster | Factor |
|---|---|---|
| WELL v2™, WELL Community Standard [25] | Comfort | Air |
| Water | ||
| Light | ||
| Thermal Comfort | ||
| Sound | ||
| Diversity | Movement | |
| Community | ||
| Safety | Materials | |
| Humanities | Mind | |
| Others | Nourishment | |
| Innovation | ||
| Reference Guide for the Fitwel Certification System: Community [26] | Comfort | Community Open Space: Design |
| Outdoor Environment | ||
| Diversity | Community Composition and Location | |
| Community Open Space: Design | ||
| Safety | Emergency Preparedness | |
| Ecological | Community Open Space: Design | |
| Humanities | Community Open Space: Management | |
| Community Assets | ||
| Community Resiliency | ||
| Others | Site Access | |
| Building Certification | ||
| Healthy Food Environment | ||
| Building Healthy Places Toolkit [27] | Comfort | Ban Smoking |
| Use Materials and Products that Support Healthy Air Quality | ||
| Facilitate Proper Ventilation and Airflow | ||
| Maximize Lighting Quality | ||
| Minimize Noise Pollution | ||
| Diversity | Incorporate a Mix of Land Uses | |
| Design Well-connected Street Networks at the Human Scale | ||
| Provide High-quality Spaces for Multi-generational Play and Recreation | ||
| Build Play Spaces for Children | ||
| Ecological | Increase Access to Nature | |
| Humanities | Facilitate Social Engagement | |
| Others | Adopt Pet-friendly Policies | |
| Promote healthy food retail |
| Rating | Linguistic Terms | Description |
|---|---|---|
| 1 | Very Unimportant | Has a negligible impact on the health of outdoor public spaces, almost ignorable. |
| 2 | Very Low Importance | Minimal impact, rarely needs consideration. |
| 3 | Low Importance | Occasionally impactful, but generally not a priority. |
| 4 | Slightly Low Importance | Somewhat impactful, but not usually a key factor. |
| 5 | Moderate Importance | Noticeably affects the health of outdoor spaces, deserves attention. |
| 6 | Moderately High Importance | Significantly impacts the health of public spaces, often needs to be considered. |
| 7 | High Importance | One of the key factors affecting outdoor space health, should be prioritized. |
| 8 | Very High Importance | Has a major impact, is very critical. |
| 9 | Extremely High Importance | Almost determines the health status of outdoor spaces, must be prioritized. |
| 10 | Crucial | The most central factor, vitally important to the health of outdoor spaces. |
| Rating | Linguistic Terms | Description |
|---|---|---|
| 1 | Equally important | Both elements contribute equally to the goal. |
| 3 | Slightly more important | One element is slightly more important than the other. |
| 5 | Significantly more important | One element is significantly more important than the other. |
| 7 | Strongly more important | One element is extremely more important than the other. |
| 2, 4, 6 | Intermediate even values | Express intermediate levels of importance between adjacent odd values. |
| 1/2 to 1/7 | Reciprocal values | Indicates varying degrees to which the other element is less important. |
| Rank | Category | Interval | Description |
|---|---|---|---|
| 1 | Excellent | 3 ≤ E ≤ 4 | Highly effective in promoting social interaction and enhancing the function of the building’s outdoor public spaces, with a clear positive impact. |
| 2 | Good | 2 ≤ E < 3 | Effectively promotes social interaction and enhances the function of the building’s outdoor public spaces, with a noticeable positive impact. |
| 3 | Fair | 1 ≤ E < 2 | Ineffective in promoting social interaction or enhancing the function of the building’s outdoor public spaces, with no clear benefit. |
| 4 | Poor | E ≤ 1 | Minimally effective in promoting social interaction and enhancing the function of the building’s outdoor public spaces, with minimal positive impact. |
| Evaluation Criteria | Gray Area Value | Consensus Value | Gray Area Test Value | Decision |
|---|---|---|---|---|
| Comfort (A1) | ||||
| Air (B1) | ||||
| Air quality (C1) | 0 | 9.5 | 1.72 | Accepted |
| Air humidity (C2) | 1 | 7.075 | 2.43 | Accepted |
| Location and number of smoking areas (C3) | 1 | 6.07 | 1.86 | Rejected |
| Intelligent air display system (C4) | 1 | 3.285 | 2.29 | Rejected |
| Number of no-smoking signs (C5) | 2 | 5.07 | 2.14 | Rejected |
| Water (B2) | ||||
| Water quality for landscape use (C6) | 1 | 6.215 | 2.15 | Rejected |
| Drinking water quality (C7) | 1 | 8.855 | 1.71 | Accepted |
| Esthetic value of water features (C8) | 2 | 6 | 2 | Rejected |
| Rainwater and wastewater discharge systems (C9) | 2 | 7.43 | 2.28 | Accepted |
| Density of drinking water facilities (C10) | 1 | 5.36 | 2.14 | Rejected |
| Illumination (B3) | ||||
| Light pollution from nighttime illumination (C11) | 2 | 4.72 | 2.02 | Rejected |
| Number of nighttime lighting fixtures (C12) | 2 | 5.93 | 2.14 | Rejected |
| Thermal (B4) | ||||
| Permeability rate of paved surfaces (C13) | 2 | 6 | 2.29 | Rejected |
| Shaded area ratio (C14) | 1 | 7.71 | 2 | Accepted |
| Vertical greening area (C15) | 2 | 6.64 | 2.14 | Accepted |
| Sound (B5) | ||||
| Site noise level (C16) | 1 | 8.43 | 1.72 | Accepted |
| Green buffer ratio between site and urban roads (C17) | 2 | 6.925 | 2.43 | Accepted |
| Diversity (A2) | ||||
| Activity facilities (B6) | ||||
| Area of exercise and fitness spaces for the elderly (C18) | 1 | 7.355 | 2.43 | Accepted |
| Area of playgrounds and sports facilities for children (C19) | 1 | 7.215 | 2.71 | Accepted |
| Number of rest facilities (C20) | 2 | 6.86 | 2 | Accepted |
| Length and continuity of fitness trails (C21) | 1 | 7 | 2.14 | Accepted |
| Site layout (B7) | ||||
| Provision of basic cycling amenities (C22) | 1 | 3.64 | 1.86 | Rejected |
| Length and continuity of bicycle lanes (C23) | 1 | 4.145 | 1.71 | Rejected |
| Proportion of ground-level space elevated (C24) | 1 | 6.07 | 2.14 | Accepted |
| Mix of land uses (C25) | 2 | 6.86 | 2 | Accepted |
| Rooftop space utilization rate (C26) | 0 | 7.215 | 2.43 | Accepted |
| Safety (A3) | ||||
| Natural environment (B8) | ||||
| Plant non-toxicity (C27) | 0 | 8.43 | 0 | Accepted |
| Extreme climate contingency plan (C28) | 0 | 7.925 | 0 | Accepted |
| Artificial environment (B9) | ||||
| Safety of high-temperature light sources (C29) | 3 | 6.14 | 3.14 | Rejected |
| Slip resistance of pavements (C30) | −1 | 8.43 | 2 | Accepted |
| Drowning prevention facilities (C31) | 2 | 5 | 2.86 | Rejected |
| Use of non-toxic materials (C32) | 1 | 8.36 | 1.86 | Accepted |
| High-altitude falling object buffer zone (C33) | 2 | 6.28 | 2.14 | Rejected |
| Pedestrian and vehicle segregation (C34) | 2 | 5.45 | 2 | Rejected |
| Density of safety signage (C35) | 1 | 4.43 | 2 | Rejected |
| Accessibility facilities (C36) | 0 | 6.8 | 2.02 | Accepted |
| Coverage rate of security systems (C37) | 1 | 7.215 | 1.85 | Accepted |
| Emergency response measures (C38) | 1 | 4.54 | 2.29 | Rejected |
| Ecological (A4) | ||||
| Natural landscape (B10) | ||||
| Plant diversity (C39) | 2 | 6.36 | 2.14 | Accepted |
| Greening rate (C40) | 0 | 8.215 | 2.43 | Accepted |
| Green visibility rate (C41) | 1 | 7.215 | 2.43 | Accepted |
| The degree of empty depression (C42) | 1 | 5.785 | 1.85 | Rejected |
| Plant accessibility (C43) | 2 | 5.355 | 2.71 | Rejected |
| Artificial landscape (B11) | ||||
| Landscape color richness (C44) | 3 | 3.86 | 3.14 | Rejected |
| Landscape interactivity (C45) | 0 | 7.5 | 2.72 | Accepted |
| Number of structures (C46) | 1 | 4.855 | 1.71 | Rejected |
| Landscape maintenance condition (C47) | 1 | 7.075 | 1.57 | Accepted |
| Humanities (A5) | ||||
| Culture (B12) | ||||
| Display of local culture (C48) | 2 | 6.64 | 2.14 | Accepted |
| Elderly and child-friendly care (C49) | 0 | 7.855 | 2.29 | Accepted |
| Number of participants in activities promoting interaction and integration (C50) | 0 | 7.5 | 2.16 | Accepted |
| Management (B13) | ||||
| Frequency of organized activities (C51) | 1 | 7.5 | 2.57 | Accepted |
| Frequency of plant maintenance (C52) | 2 | 5.925 | 2.43 | Rejected |
| Intensity of management supervision (C53) | 0 | 8.5 | 2.43 | Accepted |
| Primary Indicator | Weight | Secondary Indicator | Weight | Tertiary Indicator | Weight |
|---|---|---|---|---|---|
| Comfort (A1) | 17.67% | Air (B1) | 4.94% | Air quality (C1) | 2.86% |
| Air humidity (C2) | 2.08% | ||||
| Water (B2) | 4.85% | Drinking water quality (C3) | 3.39% | ||
| Rainwater and wastewater discharge systems (C4) | 1.45% | ||||
| Thermal (B3) | 4.59% | Shaded area ratio (C5) | 2.57% | ||
| Vertical greening area (C6) | 2.02% | ||||
| Sound (B4) | 5.20% | Site noise level (C7) | 2.65% | ||
| Green buffer ratio between site and urban roads (C8) | 2.55% | ||||
| Diversity (A2) | 19.59% | Activity facilities (B5) | 12.94% | Area of exercise and fitness spaces for the elderly (C9) | 3.83% |
| Area of playgrounds and sports facilities for children (C10) | 3.72% | ||||
| Number of rest facilities (C11) | 2.83% | ||||
| Length and continuity of fitness trails (C12) | 2.56% | ||||
| Site layout (B6) | 8.36% | Proportion of ground-level space elevated (C13) | 2.24% | ||
| Mix of land uses (C14) | 3.21% | ||||
| Rooftop space utilization rate (C15) | 2.91% | ||||
| Safety (A3) | 27.88% | Natural environment (B7) | 9.04% | Plant non-toxicity (C16) | 4.78% |
| Extreme climate contingency plan (C17) | 4.27% | ||||
| Artificial environment (B8) | 16.33% | Slip resistance of pavements (C18) | 4.51% | ||
| Use of non-toxic materials (C19) | 4.39% | ||||
| Accessibility facilities (C20) | 3.77% | ||||
| Coverage rate of security systems (C21) | 3.66% | ||||
| Ecological (A4) | 17.29% | Natural landscape (B9) | 9.97% | Plant diversity (C22) | 3.64% |
| Greening rate (C23) | 3.40% | ||||
| Green visibility rate (C24) | 2.93% | ||||
| Artificial landscape (B10) | 7.32% | Landscape interactivity (C25) | 2.73% | ||
| Landscape maintenance condition (C26) | 4.59% | ||||
| Humanities (A5) | 17.57% | Culture (B11) | 9.08% | Display of local culture (C27) | 3.32% |
| Elderly and child-friendly care (C28) | 2.93% | ||||
| Number of participants in activities promoting interaction and integration (C29) | 2.83% | ||||
| Management (B12) | 7.49% | Frequency of organized activities (C30) | 3.25% | ||
| Intensity of management supervision (C31) | 4.24% | ||||
| Quantitative Indicators | Evaluation Criteria | |||
|---|---|---|---|---|
| Poor (1 Point) | Fair (2 Points) | Good (3 Points) | Excellent (4 Points) | |
| C1: Air quality (Unit: AQI) | >200 | (100,200] | (50,100] | (0,50] |
| C2: Air humidity (Unit: relative humidity, percent) | [0,20) or (80,100] | [20,30) or (70,80] | [30,40) or (60,70] | [40,60] |
| C3: Drinking water quality (Unit: amount of residual chlorine, mg/L) | [0,0.1) or >1.0 | [0.1,0.2) or (0.7,1] | [0.2,0.3) or (0.5,0.7] | [0.3,0.5] |
| C5: Shaded area ratio (Unit: percent) | [0,60) | [60,75) | [75,90) | [90,100] |
| C6: Vertical greening area (Unit: percent) | [0,10) | [10,30) | [30,50) | [50,100] |
| C7: Site noise level (Unit: noise level, dB) | >75 | (63,75] | (50,63] | [0,50] |
| C8: Green buffer ratio between site and urban roads (Unit: percent) | [0,25) | [25,50) | [50,75) | [75,100] |
| C9: Area of exercise and fitness spaces for the elderly (Unit: the total area as a percentage of the total area of the community, percent) | [0,15) | [15,30) | [30,45) | ≥45 |
| C10: Area of playgrounds and sports facilities for children (Unit: the total area as a percentage of the total area of the community, percent) | [0,15) | [15,30) | [30,45) | ≥45 |
| C11: Number of rest facilities (Unit: sites per hectare) | [0,3) | [3,5) | [5,8) | ≥8 |
| C12: Length of fitness trails (Unit: meters) | [0,300) | [300,500) | [500,1000) | ≥1000 |
| C13: Proportion of ground-level space elevated (Unit: the proportion of the area of the overhead layer to the total area of the plot, percent) | [0,15) | [15,25) | [25,40) | [40,100] |
| C14: Mix of land uses (Unit: the total mix as u percentage of the total mix of the community, percent) | [0,25) | [25,50) | [50,75) | [75,100] |
| C15: Rooftop space utilization rate (Unit: percent) | [0,25) | [25,50) | [50,75) | [75,100] |
| C18: Slip resistance of pavements (Unit: the proportion of non-slip pavement in the total pavement, percent) | [0,50) | [50,65) | [65,80) | [80,100] |
| C21: Coverage rate of security systems (Unit: percent) | [0,50) | [50,70) | [70,90) | [90,100] |
| C22: Plant diversity (Unit: plant species, species) | [0,20) | [20,30) | [30,40) | >40 |
| C23: Greening rate (Unit: relative rate, percent) | [0,20) | [20,30) | [30,40) | [40,100] |
| C24: Green visibility rate (Unit: the proportion of green vegetation in the field of view, percent) | [0,20) | [20,30) | [30,40) | [40,100] |
| C29: Number of participants in activities promoting interaction and integration (Unit: number) | [0,25) | [25,50) | [50,75) | [75,100] |
| C30: Frequency of organized activities (Unit: frequency, times/month) | [0,2) | [2,5) | [5,8) | >8 |
| Qualitative Indicators | Evaluation Criteria | Score |
|---|---|---|
| Rainwater and wastewater discharge systems (C4) | Highly efficient rainwater collection and utilization system that effectively controls runoff and reduces flooding risk. | 4 points |
| Basic rainwater collection and utilization present, controlling partial runoff. | 3 points | |
| Existing but inefficient rainwater management systems, insufficient runoff control. | 2 points | |
| Poor rainwater management, frequent occurrences of waterlogging or flooding. | 1 point | |
| Plant non-toxicity (C16) | Exclusive use of non-toxic plants, ensuring environmental and human safety. | 4 points |
| Mostly non-toxic plant species, with minor exceptions that may have slight toxicity. | 3 points | |
| Some toxic plants used, but with warning signs. | 2 points | |
| Extensive use of toxic plants without warnings. | 1 point | |
| Extreme climate contingency plan (C17) | Comprehensive contingency plans for extreme weather, with regular drills and effective responses. | 4 points |
| Basic measures in place, infrequent drills. | 3 points | |
| Initial plans for extreme weather, average implementation effectiveness. | 2 points | |
| Lack of contingency plans for extreme climates. | 1 point | |
| Use of non-toxic materials (C19) | Sole use of non-toxic, environmentally friendly materials. | 4 points |
| Primarily non-toxic materials used, with some traditional materials in minor areas. | 3 points | |
| Partial use of non-toxic materials, still reliant on some hazardous materials. | 2 points | |
| Widespread use of hazardous materials. | 1 point | |
| Accessibility facilities (C20) | Comprehensive accessibility design, facilitating easy use of facilities. | 4 points |
| Basic accessibility facilities, with minor areas of inaccessibility. | 3 points | |
| Limited accessibility facilities, inconvenient for disabled individuals. | 2 points | |
| Lack of accessibility facilities. | 1 point | |
| Landscape interactivity (C25) | Rich interactive elements that encourage public participation. | 4 points |
| Moderate interactivity, but limited in scope or type. | 3 points | |
| Few interactive elements, primarily for viewing. | 2 points | |
| No interactive elements, single-function. | 1 point | |
| Landscape maintenance condition (C26) | Well-maintained landscape with regular upkeep. | 4 points |
| Generally well-maintained with occasional neglect. | 3 points | |
| Insufficient maintenance, signs of landscape degradation. | 2 points | |
| Almost no maintenance, severe landscape degradation. | 1 point | |
| Display of local culture (C27) | In-depth display of local cultural characteristics, educational. | 4 points |
| Displays local culture to a certain extent, but lacks depth and breadth. | 3 points | |
| Occasionally references local culture, no in-depth display. | 2 points | |
| Neglects local culture, devoid of cultural elements. | 1 point | |
| Elderly and child-friendly care (C28) | Facilities well-designed to cater to the needs of the elderly and children. | 4 points |
| Partial consideration of the needs of the elderly and children, incomplete facilities. | 3 points | |
| Occasional consideration of special needs, inadequate facility support. | 2 points | |
| Neglect of the needs of the elderly and children. | 1 point | |
| Intensity of management supervision (C31) | Dedicated supervision and maintenance teams, regular inspections and upkeep. | 4 points |
| Basic supervision and maintenance, occasional oversights. | 3 points | |
| Insufficient supervision and maintenance, affecting facility use. | 2 points | |
| Almost no supervision and maintenance, poor facility condition. | 1 point |
Disclaimer/Publisher’s Note: The statements, opinions and data contained in all publications are solely those of the individual author(s) and contributor(s) and not of MDPI and/or the editor(s). MDPI and/or the editor(s) disclaim responsibility for any injury to people or property resulting from any ideas, methods, instructions or products referred to in the content. |
© 2025 by the authors. Licensee MDPI, Basel, Switzerland. This article is an open access article distributed under the terms and conditions of the Creative Commons Attribution (CC BY) license (https://creativecommons.org/licenses/by/4.0/).
Share and Cite
Huang, Y.; Yang, Y.; Tu, K.; Yang, T. A Fuzzy Decision-Making Approach to the Health Assessment and Optimization of Architecture-Dominated Outdoor Spaces in High-Density Urban Environments. Buildings 2025, 15, 1165. https://doi.org/10.3390/buildings15071165
Huang Y, Yang Y, Tu K, Yang T. A Fuzzy Decision-Making Approach to the Health Assessment and Optimization of Architecture-Dominated Outdoor Spaces in High-Density Urban Environments. Buildings. 2025; 15(7):1165. https://doi.org/10.3390/buildings15071165
Chicago/Turabian StyleHuang, Yanyan, Yi Yang, Kangwei Tu, and Tiancheng Yang. 2025. "A Fuzzy Decision-Making Approach to the Health Assessment and Optimization of Architecture-Dominated Outdoor Spaces in High-Density Urban Environments" Buildings 15, no. 7: 1165. https://doi.org/10.3390/buildings15071165
APA StyleHuang, Y., Yang, Y., Tu, K., & Yang, T. (2025). A Fuzzy Decision-Making Approach to the Health Assessment and Optimization of Architecture-Dominated Outdoor Spaces in High-Density Urban Environments. Buildings, 15(7), 1165. https://doi.org/10.3390/buildings15071165