Article

Experimental Study on Flexural Behaviors and Theoretical Compression-Bending Capacity of Unreinforced Steel Fiber Reinforced Concrete

1
School of Civil Engineering, Sichuan Agricultural University, Chengdu 611830, China
2
College of Architecture and Urban-Rural Planning, Sichuan Agricultural University, Chengdu 611830, China
3
School of Civil Engineering, Southwest Jiaotong University, Chengdu 610031, China
4
Sichuan Engineering Research Center for Mechanical Properties and Engineering Technology of Unsaturated Soils, Chengdu University, Chengdu 610106, China
*
Authors to whom correspondence should be addressed.
Buildings 2025, 15(7), 1160; https://doi.org/10.3390/buildings15071160
Submission received: 1 March 2025 / Revised: 20 March 2025 / Accepted: 26 March 2025 / Published: 2 April 2025
(This article belongs to the Section Building Structures)

Abstract

Despite ongoing research efforts aimed at understanding the structural response of steel fiber reinforced concrete (SFRC), there is very limited research on the failure characteristics and theoretical compression-bending capacity of unreinforced steel fiber reinforced concrete (SFRC without rebars, USFRC). In this study, the cube compression tests, notched beam tests, and full-scale segment compression-bending tests are carried out to investigate the flexural performance of USFRC. The crack width–bending moment curves, load–deflection curves, and ultimate load of USFRC segments are obtained. Additionally, the theoretical compression-bending capacity of USFRC segments according to Model Code 2010 is investigated and the calculation methods applicable to different fiber contents, segment sizes, and mix proportions are obtained, which can provide a basis for predicting the performance of USFRC segments in related engineering applications, and some conclusions can be drawn. The results show that steel fibers can slightly improve the compressive strength of concrete, and the improvement capacity varies with different mix proportions and fiber contents. The addition of steel fibers can also improve the compressive failure mode of concrete. The relationships among the crack width, bending moment, and eccentricity can be expressed by a multivariate linear regression equation, and the relationship between the bending moment and deflection can be fitted by a quadratic equation. Both fitting effects are good. Based on the Model Code 2010 calculation model, a calculation method for the compression-bending capacity of USFRC is proposed, and the calculation method of residual tensile strength of steel fiber is modified. The new method can predict the compression-bending capacity of USFRC more accurately.

1. Introduction

Concrete is a conventional building material widely utilized in the construction industry. However, in some areas, the mechanical properties of conventional concrete may no longer satisfy the requirements. Incorporating fibers into concrete has been shown to be an effective method to enhance its tensile strength, crack resistance, energy absorption capacity, and flexural toughness [1,2,3,4]. The reinforcing impact of fibers on concrete’s mechanical properties is generally linked to factors such as the shape, size, content, and physicochemical properties of the fibers employed [5]. Due to the diversity of fiber types, different types of fiber reinforced concrete exhibit variations in performance. Steel fiber reinforced concrete (SFRC), in particular, demonstrates high strength and good durability, with notable improvements in shear and tensile resistance, particularly in the post-cracking phase. The inclusion of steel fibers has a positive impact on the performance and crack development of concrete during construction and operation, as it can inhibit the development of cracks [6]. Although there have been studies on the crack resistance of steel fibers, research on the compressive and flexural strength of an unreinforced steel fiber segment is scarce.
Naaman [7] studied the enhancement effect of discontinuous steel fibers on the tensile strength of concrete based on concrete fracture mechanics. Olivito et al. [8] found that steel fibers have a small effect on the compressive strength of concrete, but significantly improve the tensile strength of concrete and its crack resistance. Job Thomas also discovered and confirmed that as the strength level of concrete increases, the increase in compressive strength of SFRC by steel fibers decreases [9]. Faiz Sulthan et al. investigated the mechanical properties of SFRC containing 3D, 4D, and 5D hooked steel fibers, and found that the shape of the steel fibers has no significant effect on the compressive strength of SFRC, but the greater the number of hooks, the more significant the increase in tensile strength. With an increase in volume fraction of steel fiber from 0.5% to 1.5%, the splitting tensile strength of SFRC containing 3D, 4D, and 5D hooked steel fibers increases in turn, with the SFRC containing 5D hooked steel fibers showing the greatest increase [10]. Albert de la Fuente et al. [11] proposed that the reinforcement provided by steel bars in the segment is crucial, and fibers act when cracks appear, controlling the width and spacing of cracks. Additionally, the use of fibers and a small amount of steel bars can improve the flexural performance and crack resistance of the segment. When the reinforcement area is small, an increase in steel fiber content can lead to a significant change in ultimate load. When the reinforcement area is large, an increase in steel fiber content has little effect on the ultimate capacity. Using fibers can significantly reduce the amount of steel bar when the load is relatively small.
Some researchers conducted four-point bending tests on reinforced concrete segments and SFRC segments [12,13,14]. The study found that the addition of fibers and an increase in fiber content significantly increased the stiffness and bearing capacity of the segments, and due to the higher elastic modulus of steel fibers, SFRC segments had higher flexural performance than synthetic fiber concrete segments. Xu et al. [15] conducted eccentric compression tests on SFRC segments and found that those with inclusion of steel fibers with a smaller reinforcement diameter had better crack control ability and could withstand a higher load than the plain concrete with a larger reinforcement diameter. It also concluded that SFRC segments met the requirements of bearing capacity and crack resistance at the serviceability limit state and ultimate limit state. Oh et al. [16] conducted four-point bending tests on SFRC beams with three different steel fiber volume ratios of 0%, 0.5%, and 1.0%, and the study showed that the addition of steel fibers could improve the bearing capacity, ductility, and stiffness of the beams, and the more steel fiber content, the greater the improvement, and the smaller the strain of concrete, the smaller the spacing and width of the cracks. Similar conclusions were drawn from the studies of Yang and other researchers [17,18,19,20], which found that the addition of steel fibers could improve the bearing capacity, ductility, and stiffness of beams, and reduce the spacing and width of cracks.
Some researchers have studied the flexural capacity of SFRC in accordance with existing standards. Yang et al. [21] investigated the effect of fiber on the cracking load, ultimate load, and ductility of high-strength concrete beams. In addition, they compared the experimental results with the predicted ultimate bending moment. The study showed that steel fiber increased the cracking load, ultimate load, and ductility, and also reduced the crack width of the specimens. The experimental ultimate bending moment was greater than the predicted value from the standard. Liao [22] designed and performed critical analysis on SFRC segments based on the Model Code 2010 and the ductility design requirements, and found that the minimum amount of steel fiber added should be based on the actual maximum bending moment to avoid brittle failure due to insufficient reinforcement. Issa et al. [23] studied the effect of different types of fibers on the bearing capacity of fiber reinforced concrete beams. The experimental results showed that all types of fibers used increased the ductility and had good flexural strength. The theoretical results calculated using the ACI 440 standard [24] were in good agreement with the experimental results, with an error of about 20%.
However, existing research mainly focuses on the compressive and flexural performance of steel fiber reinforced concrete, and there is limited research on the performance and applicability of unreinforced steel fiber concrete segments, and the unified theoretical model for calculating its bearing capacity has not been established. In this paper, cube compression tests, notched beam tests, and full-scale segment compression-bending tests of USFRC were conducted to investigate the effects of steel fibers on the compressive strength, flexural toughness, and bending capacity of concrete. To the authors’ knowledge, research on the bending capacity of USFRC is still in the exploratory stage in current codes and standards. This paper investigates the theoretical compression-bending capacity of USFRC segments according to Model Code 2010 and obtains calculation methods applicable to different fiber contents, segment sizes, and mix proportions, which can provide basis for predicting the performance of USFRC segments in related engineering applications.

2. Experimental Programs

2.1. Materials

In the experiment, the SFRC was composed of fly ash, fine aggregate, coarse aggregate, water reducer, water, PO42.5 grade ordinary Portland cement, and steel fiber. The coarse aggregate refers to aggregate with a nominal particle size of 5–20 mm and good gradation, while the fine aggregate is river sand with a fine modulus of 2.5 and good gradation. The steel fiber used in this study was Dramix 4D 80/60 BG (Bekaert NV, Zwevegem, Belgium), with a diameter of 0.75 mm (see Figure 1a). A total of 26 cubic specimens were prepared, including 6 plain concrete (PC) specimens without steel fiber (PCC-1–6) and 20 SFRC cubic specimens with steel fiber contents of 30 kg/m3 (SFRCC-A1–A8) and 40 kg/m3 (SFRCC-1–12), respectively. In addition, 24 SFRC notched beam specimens were prepared with steel fiber contents of 30 kg/m3 (SFRCQ-A1–12) and 40 kg/m3 (SFRCQ-1–12), respectively (see Table 1), and 8 SFRC segment specimens were prepared with steel fiber contents of 30 kg/m3 (SFRCS-A1–3) and 40 kg/m3 (SFRCS-1–5), respectively. The cubic specimens, notched beams, and segments with the same fiber content and mixing proportions were all cast in the same batch. The mix proportions of the concrete are provided in Table 1 for better clarification.

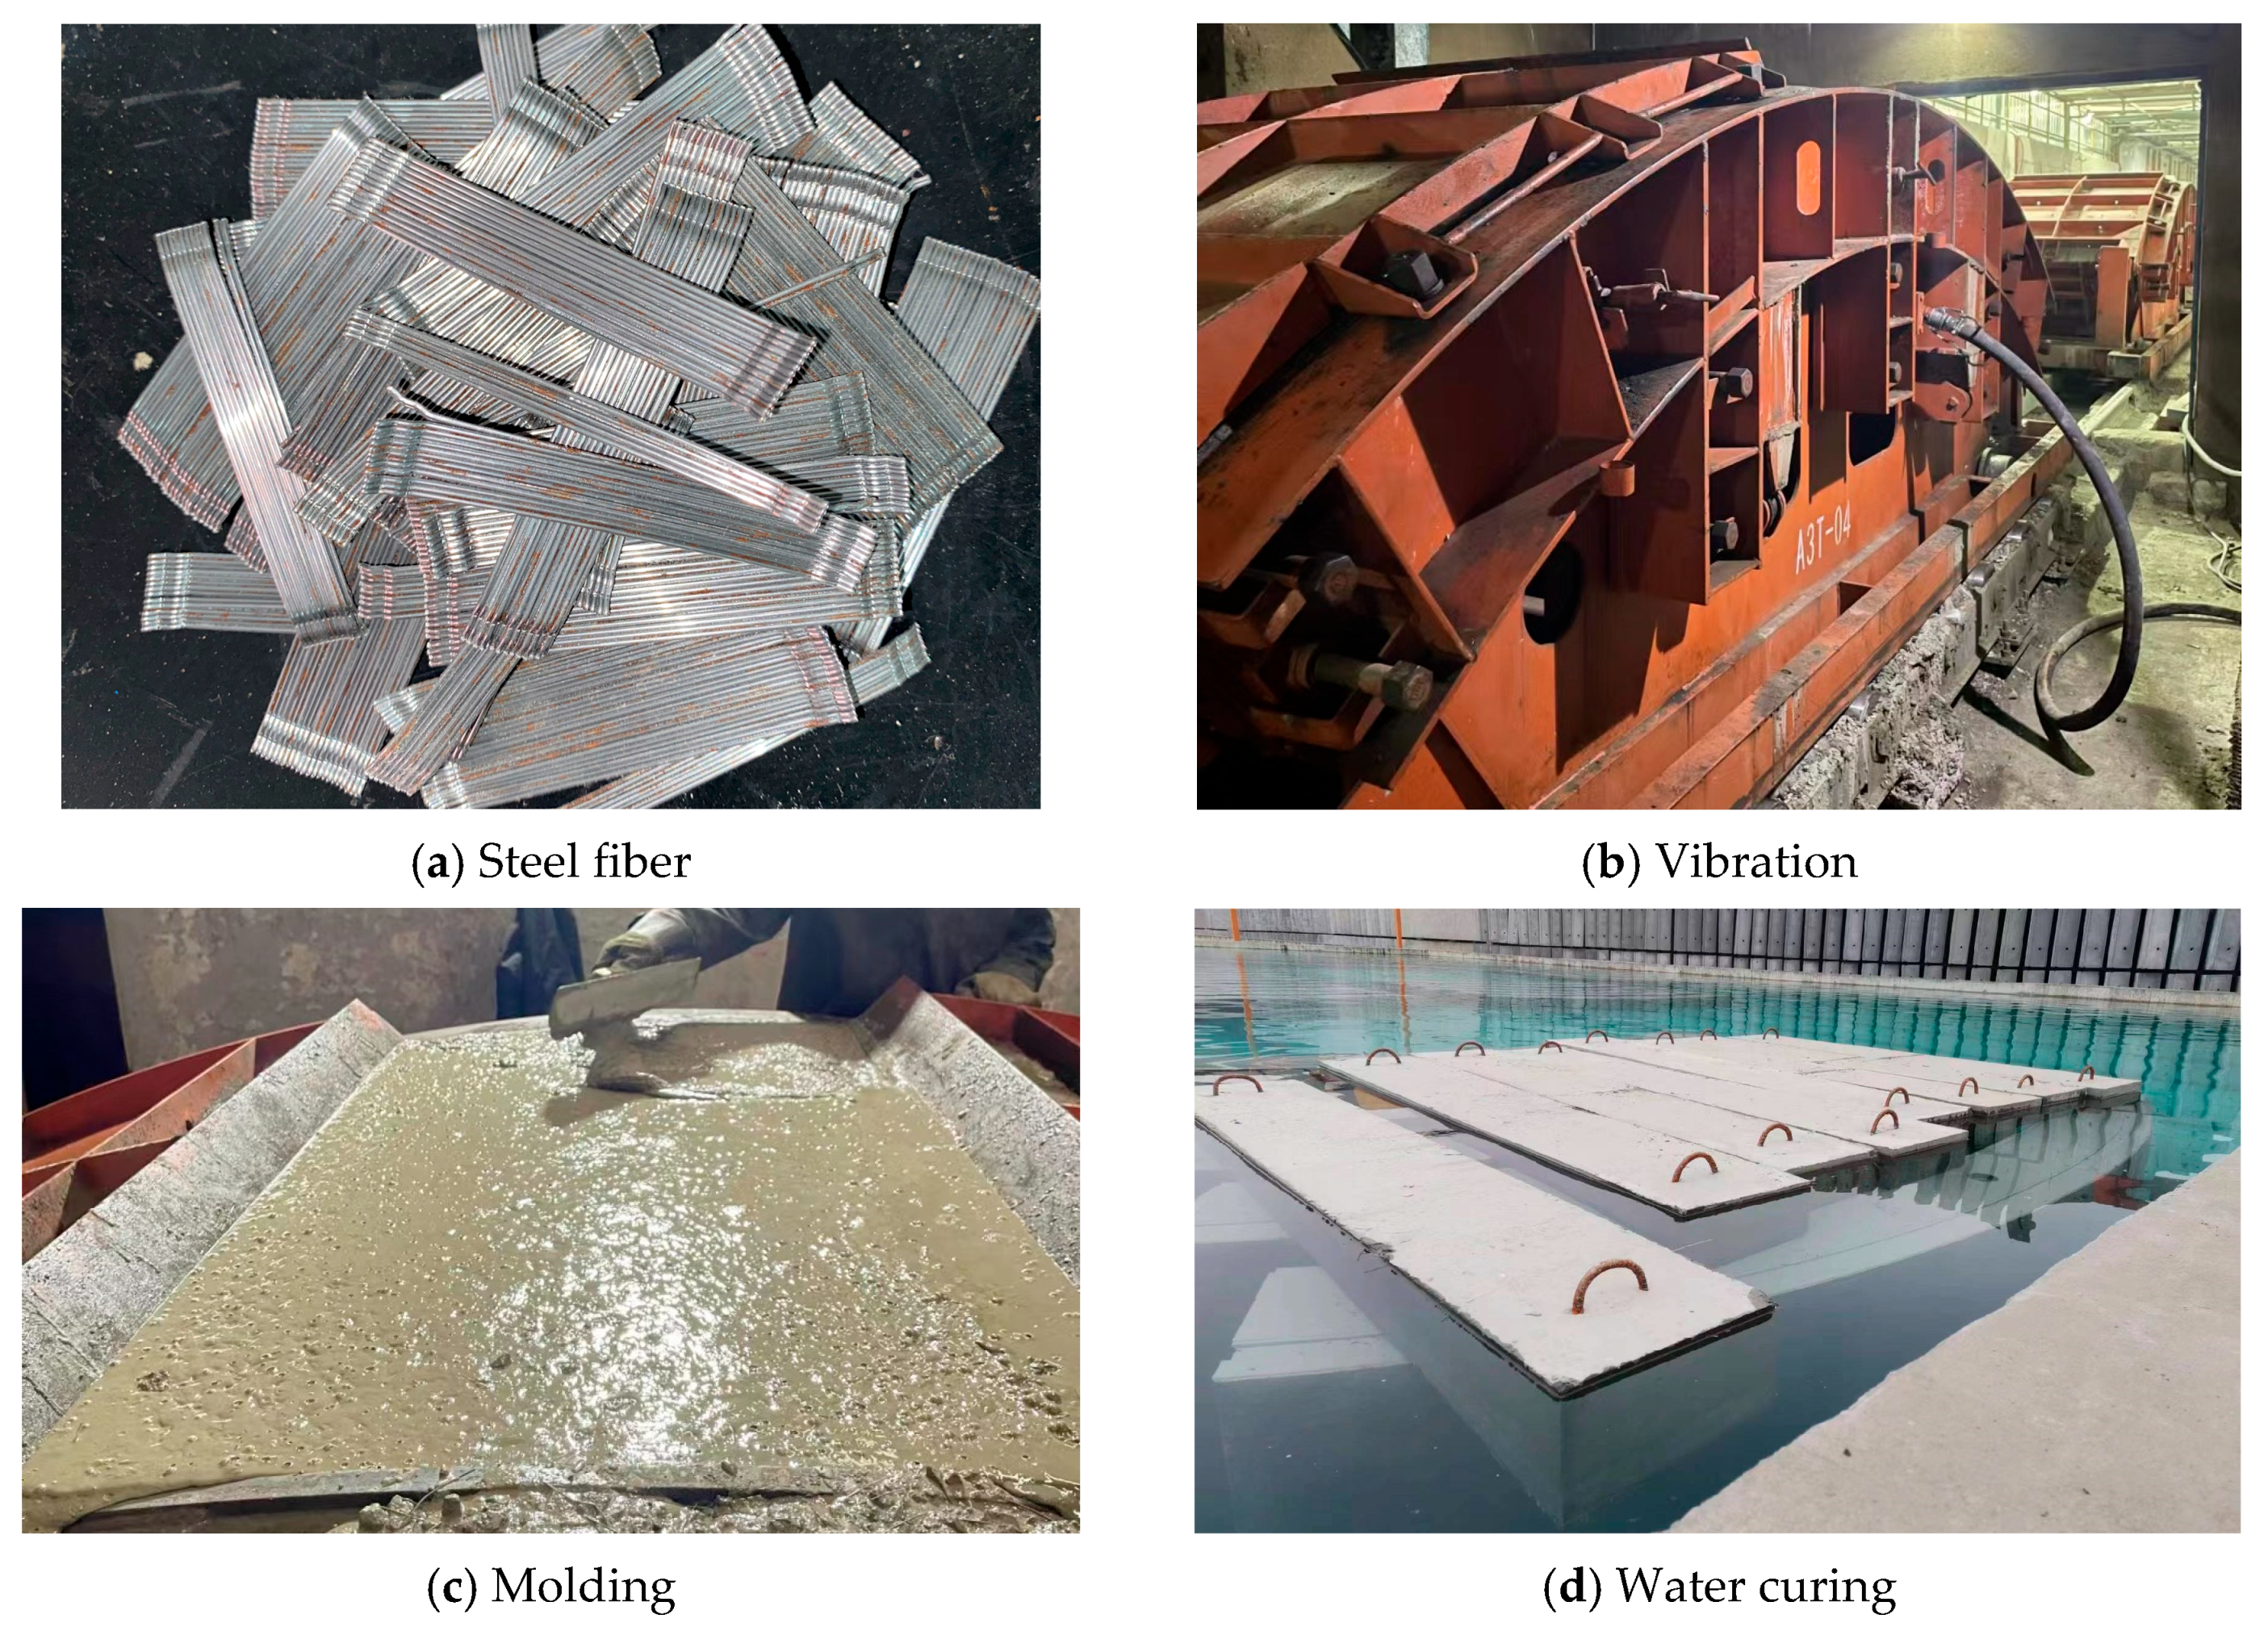
2.2. Fabrication of Specimens and Loading Method

The mixture was prepared in accordance with the specifications outlined in the Chinese code DB21/T 3165-2019 [25], which pertains to the manufacture of precast steel fiber reinforced concrete segments. Specifically, the mixture was composed of fiber, gravel, and sand, which were added to the blender and mixed for 20 s. Then, water was added and stirred for an additional 20 s, followed by the addition of cement and admixtures, which were mixed for 90–100 s. Finally, the water reducer was added and mixed for 30 s. The stirring time for SFRC was extended by 20–30 s longer than that of PC to prevent the agglomeration of steel fibers.
After mixing, the concrete was placed into a mold and filled slightly higher than the top. The concrete was vibrated in the mold for 60 s (see Figure 1b). After the surface of the specimen was swollen, the excess concrete was scraped off using a trowel, and the surface of the specimen was finally smoothed to prevent steel fiber exposure (see Figure 1c). The specimens were numbered and left in the laboratory for one day, after which the molds were removed. The specimens were then transferred to a standard curing pond for 28 days of curing (see Figure 1d). The test procedures followed the guidelines outlined in the Chinese code CECS 13:2009 [26], which provides standard test methods for fiber reinforced concrete.

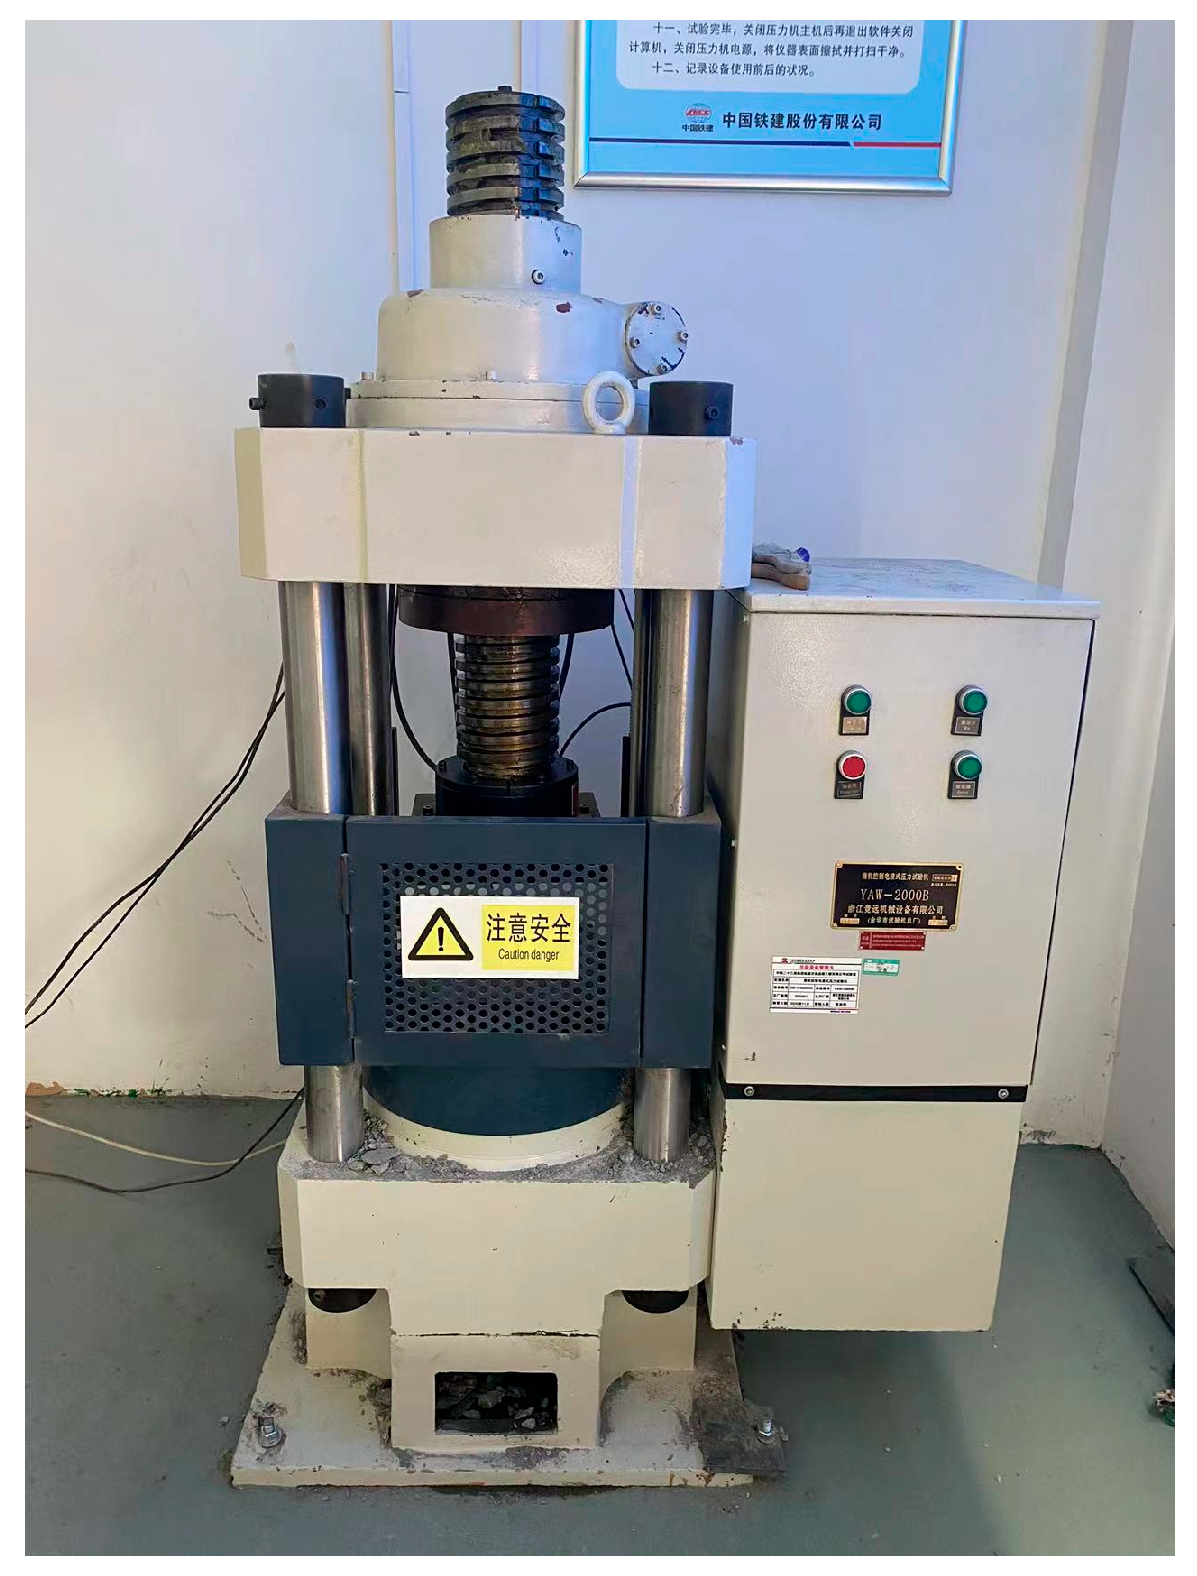
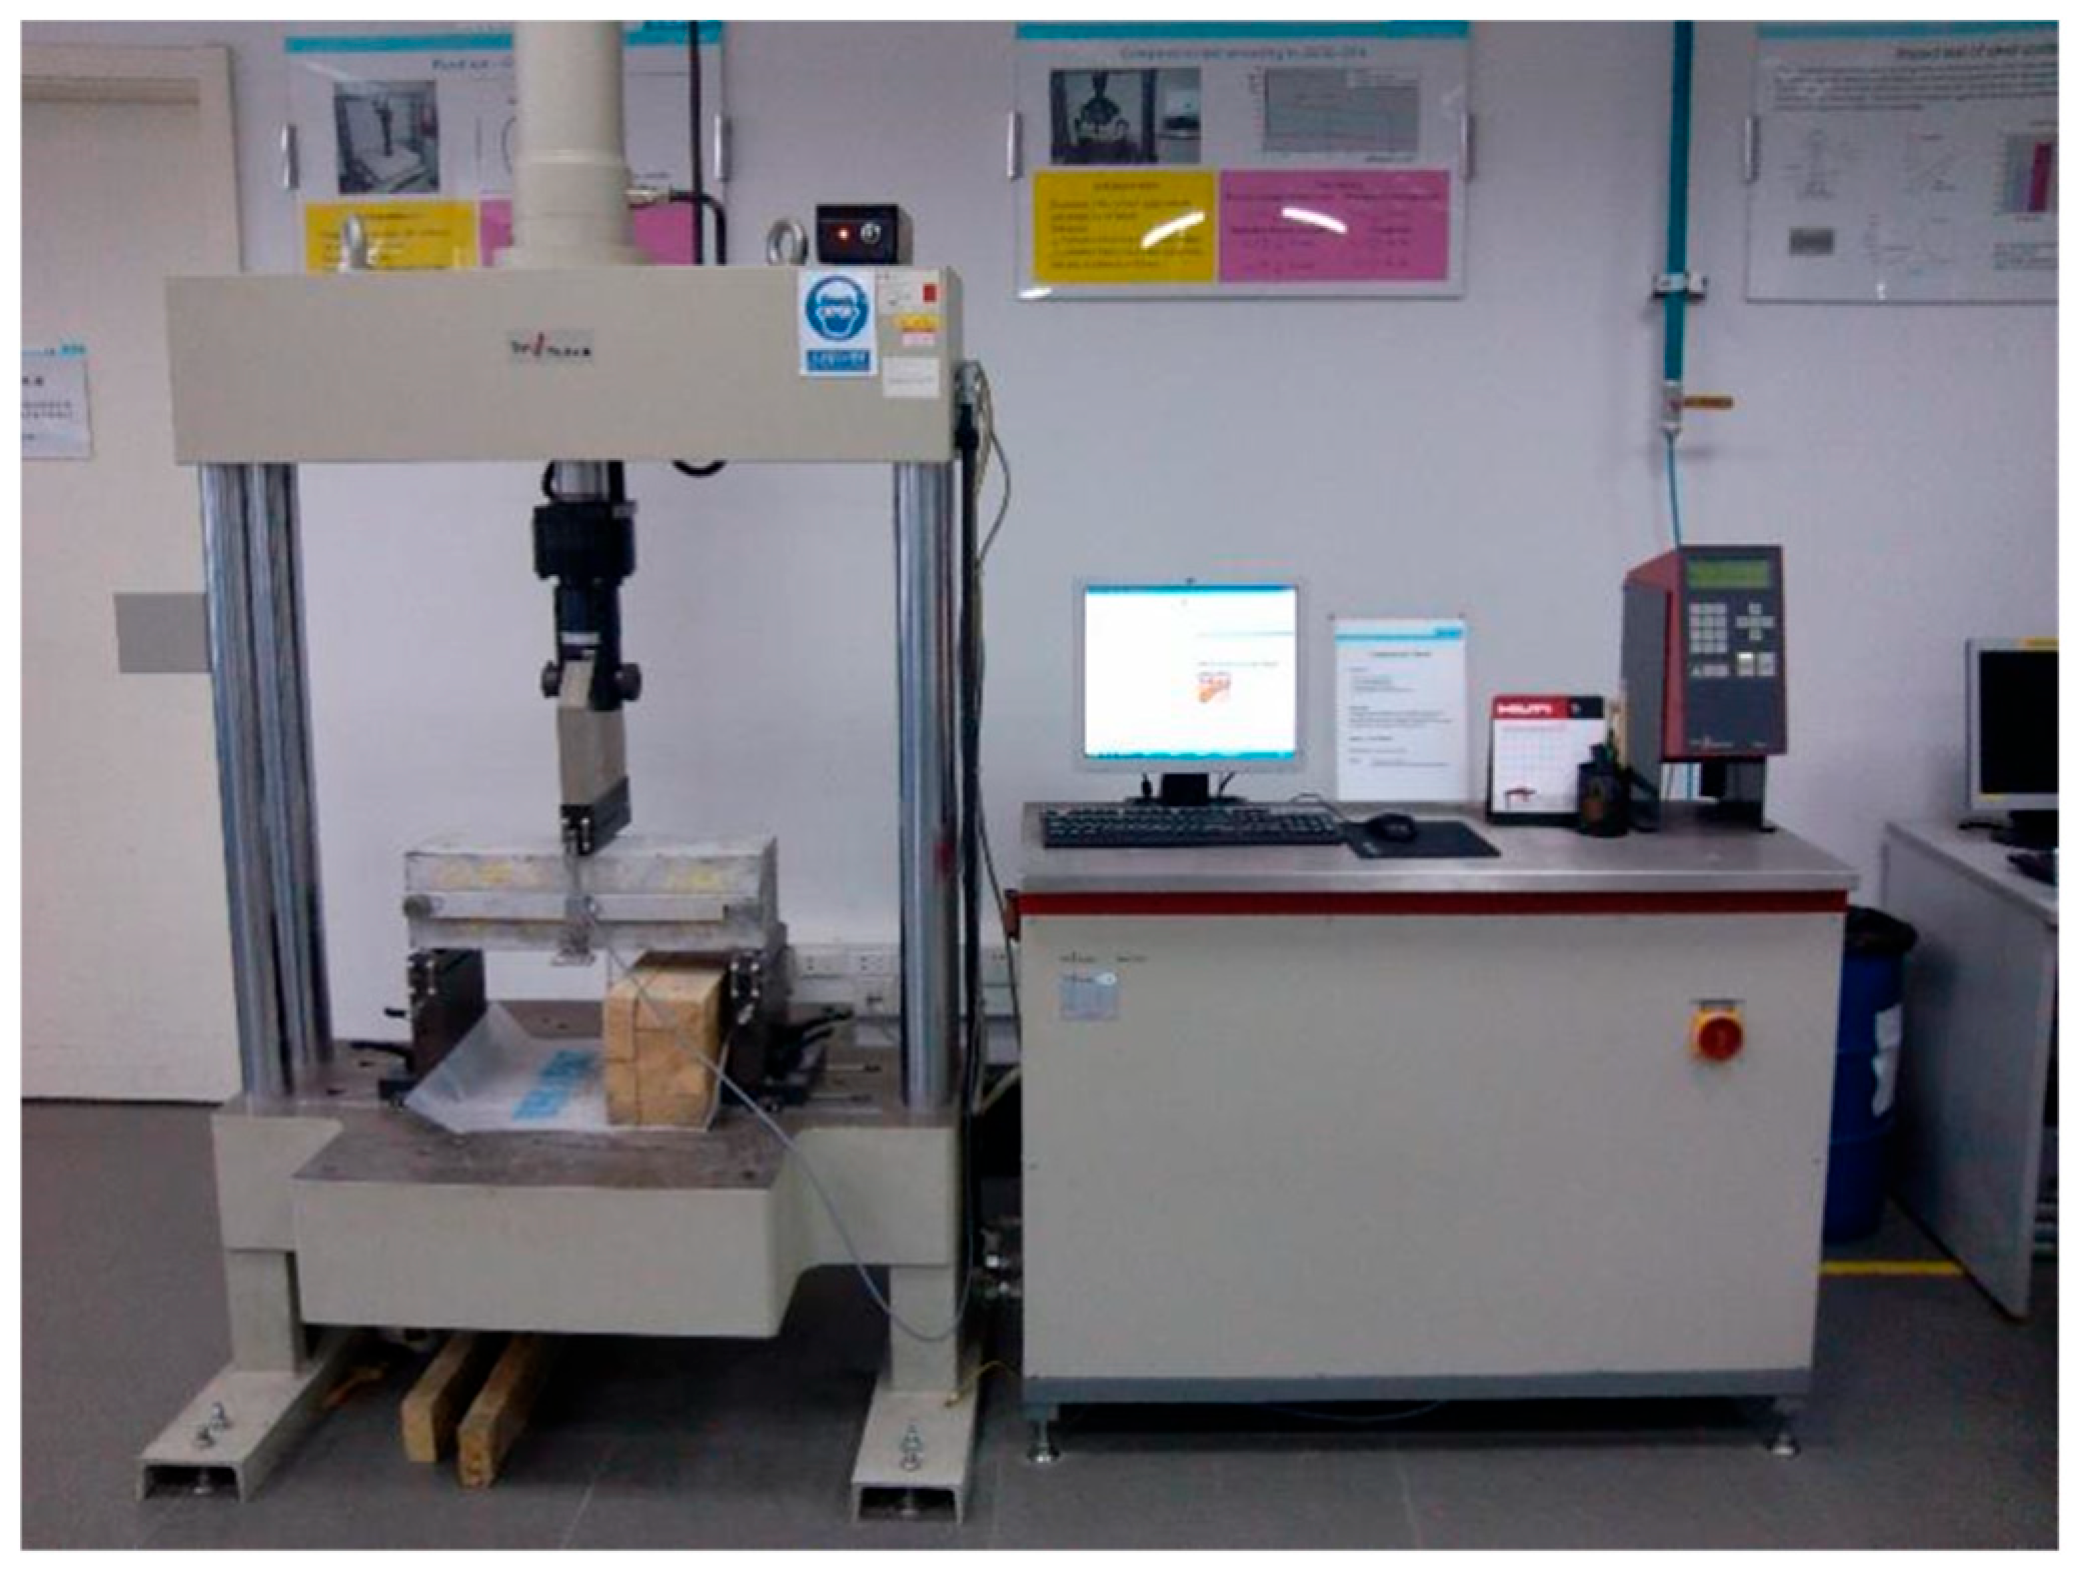
2.2.1. The Cube Compressive Strength Test and Notched Beam Test

The size of the cube compressive strength test specimen is 150 × 150 × 150 mm. According to different fiber content combinations, the test is conducted in 3 groups, with 6 specimens in the PC group, 12 specimens in the SFRC40 group and 8 specimens in the SFRC30 group. The loading device is the universal testing machine, the HUT106A type 1000 kN microcomputer controlled electro-hydraulic servo (see Figure 2). The cube compressive strength fcu is calculated according to the following Equation (1).
f c u = F max A
where Fmax is the maximum load in the test (N), and A is the compression surface area of the specimen (m2).
The notched beam tests are executed according to the EN14651 [27]. The test setup is shown in the picture below.
The test specimens have a sawcut (notch) of 25 mm in the middle of the beam, which can be seen in Figure 3. The deflection is controlled by the speed of the LVDT measurement device: (a) deflection from 0 to 0.13 mm: 0.04 mm/min, and (b) deflection from 0.13 to 3.5 mm: 0.17 mm/min. The test stops at a deflection of 3.5 mm.
For each test, the following parameters are calculated:
f L = 3 2 · F L · l b h 2
where fL is the limit of proportionality (MPa), FL is the maximum load between 0 and 0.05 mm deflection (N), l is the span of the specimen (m), b is the width of the specimen (m), and h is the effective height from the top of the notch to the top of the specimen (m).
f R , i = 3 2 · F R , i · l b h 2
where fR,i is the residual strength at the corresponding CMOD or deflection (MPa), FR,i is the load at the corresponding CMOD or deflection (N), fR,1 is the residual strength at a CMOD = 0.5 mm or at a deflection of 0.47 mm, fR,2 is the residual strength at a CMOD = 1.5 mm or at a deflection of 1.32 mm, fR,3 is the residual strength at a CMOD = 2.5 mm or at a deflection of 2.17 mm, and fR,4 is the residual strength at a CMOD = 3.5 mm or at a deflection of 3.02 mm.

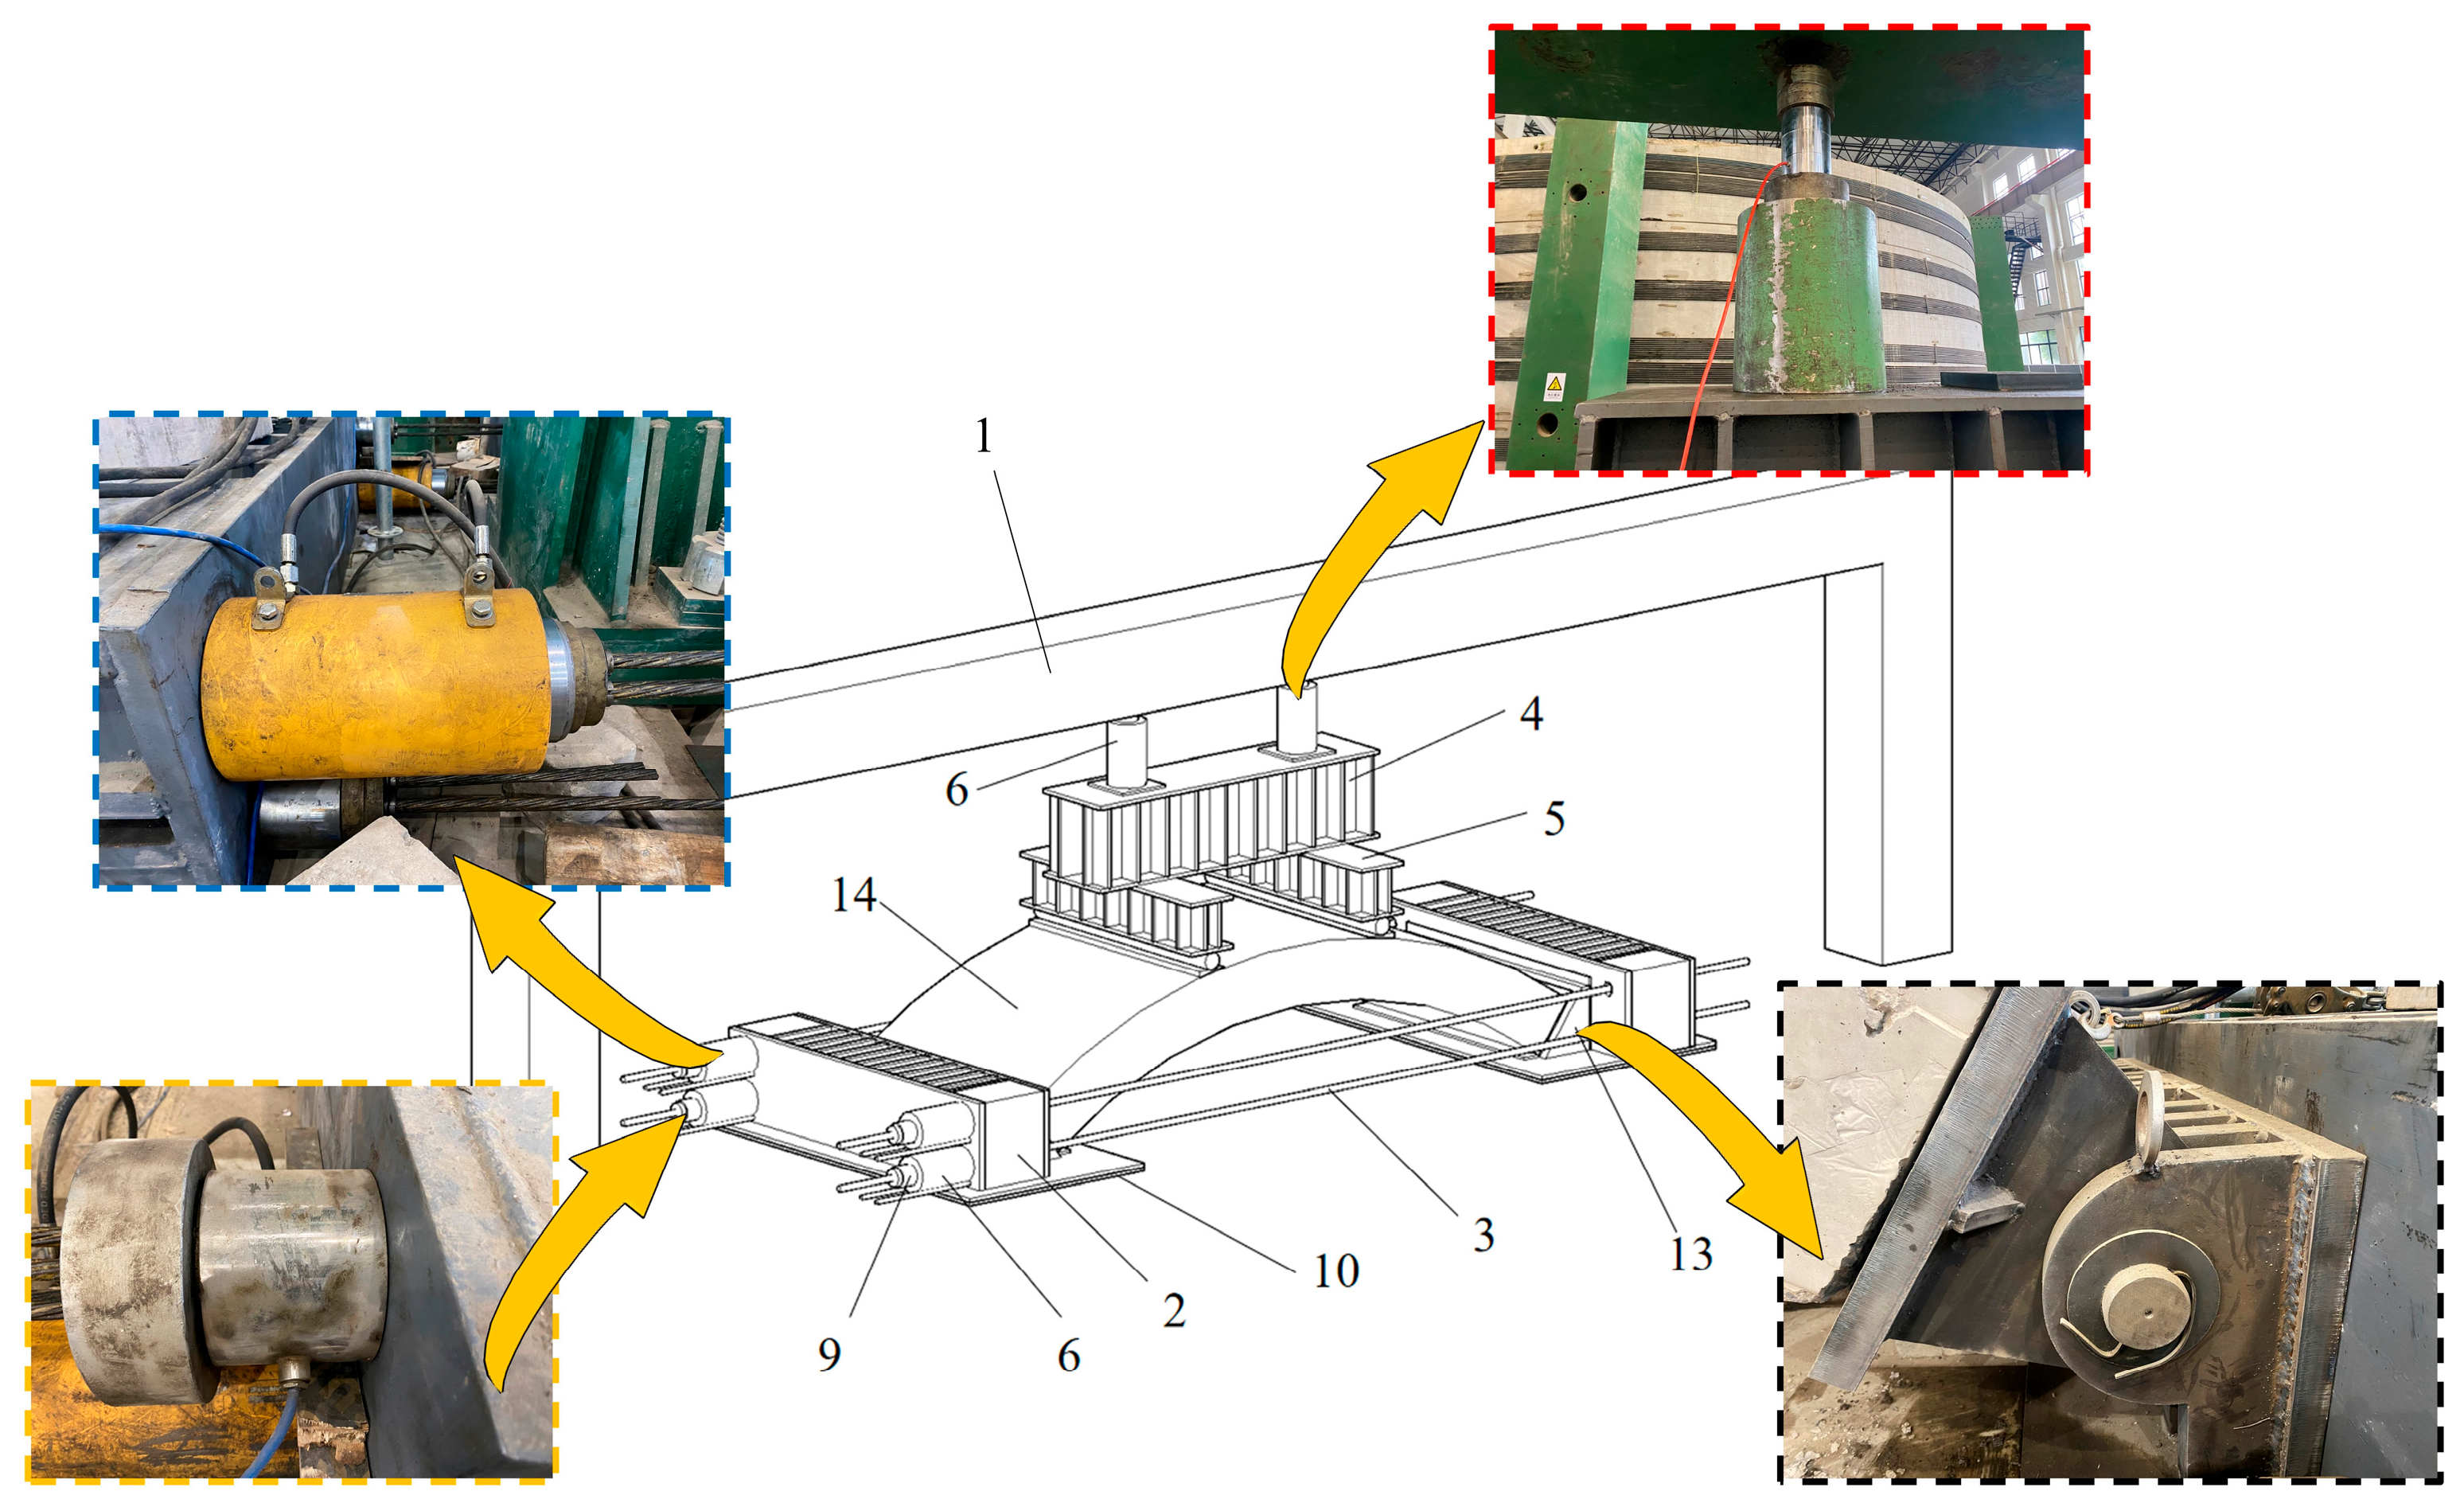
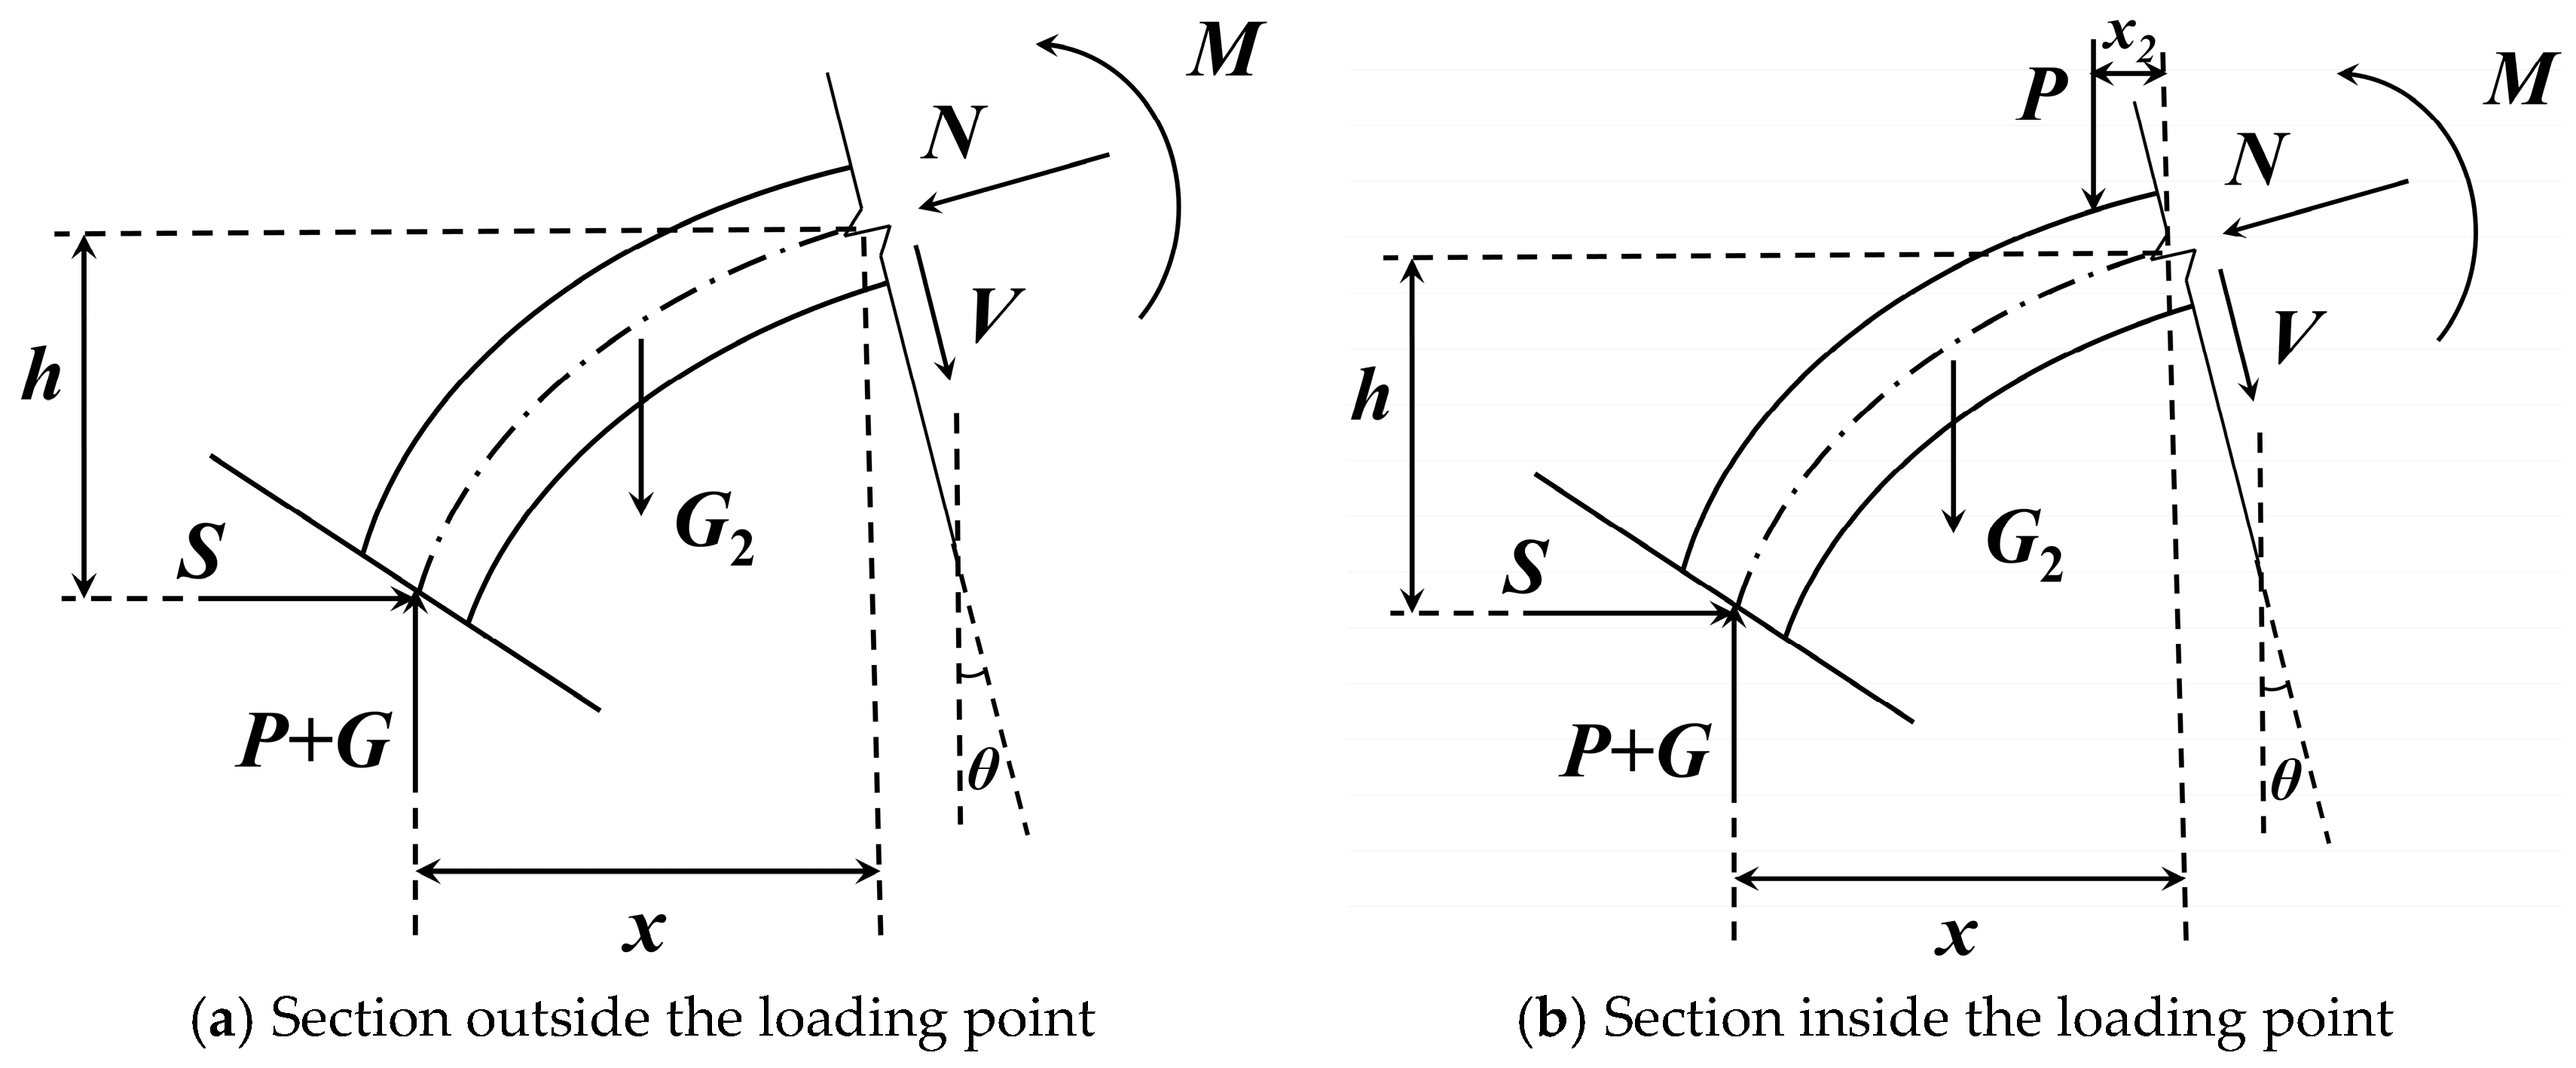
2.2.2. The Compression-Bending Test

To simulate the stress model and deformation characteristics of USFRC under actual conditions and to evaluate the applicability of the existing capacity design methods, the full-scale segment compression-bending tests were conducted. The compression-bending loading mode was employed to control the eccentricity by separately controlling the horizontal and vertical forces, which was intended to simulate the actual large eccentric loading state of the segment in practical engineering. While analyzing the deformation and failure characteristics of the segment, this study also provided a basis for exploring the ultimate capacity theory of USFRC.
To investigate the universality of the capacity calculation formulas, two types of segments with different sizes, fiber contents, and concrete mix proportions (see Table 1 and Table 2) were tested, and different loading methods were employed during the tests.
Due to the special loading mode, the loading device needs to satisfy not only the segment size requirements but also the ability to independently load in both vertical and horizontal directions. To ensure uniform loading of the segment during the loading process and avoid local stress concentration, it is necessary to ensure that the support is in close contact with the segment and can move freely in the horizontal direction. At the same time, it is necessary to avoid the bending moment generated between the segment and the support and to counteract the rotational deformation generated during the loading process. In order to ensure the accuracy of displacement measurement during the test, the testing device itself must have sufficient stiffness.
According to the abovementioned requirements, a test device for the compression-bending test was designed and manufactured. The device consists of a reaction system, gantry frame, rotating hinge support, loading and control system, pressure and displacement sensors, etc. (see Figure 4). The horizontal reaction pedestal is used to fix the specimen and bear the force from horizontal jacks, with a maximum load capacity of 5000 kN. The vertical gantry frame is anchored to the foundation with high-strength bolts, and its load capacity for vertical jacks is 3500 kN. Two vertical jacks with a maximum load of 2000 kN each and four horizontal jacks with a maximum load of 1000 kN each are installed at different corners of the horizontal reaction pedestal to avoid uneven loading of the segment. The vertical and horizontal jacks are independent of each other and can simulate different loading states with arbitrary eccentricities to replicate the actual conditions of the segment. The two horizontal reaction pedestals are connected by steel strands, which pass through the horizontal jacks and are anchored. During loading, the four horizontal jacks are simultaneously pushed outwards, and the central steel strands tighten continuously, thereby pulling the movable support at both ends to provide horizontal force. The safe load capacity of each steel strand is 200 kN, and each horizontal jack is connected to four steel strands, with a total capacity of 3200 kN.
Then, 10 mm polyethylene plates are laid under the two pedestals, and lubricating oil is applied between the plates to make the pedestals a horizontally movable support, which can compensate for the deformation of the steel strands and minimize the test error caused by frictional force. Rubber is used to pad the contact surfaces between the surface of the specimen and the supports and between the surface of the specimen and the vertical loading point to prevent local stress concentration and damage to the segment.
To avoid bending moments at the contact surfaces between the segment and the supports and to minimize the rotational deformation of the segment during loading, a rotating hinge support was designed (see Figure 4), which can withstand a safe horizontal force of 3500 kN.

3. Results

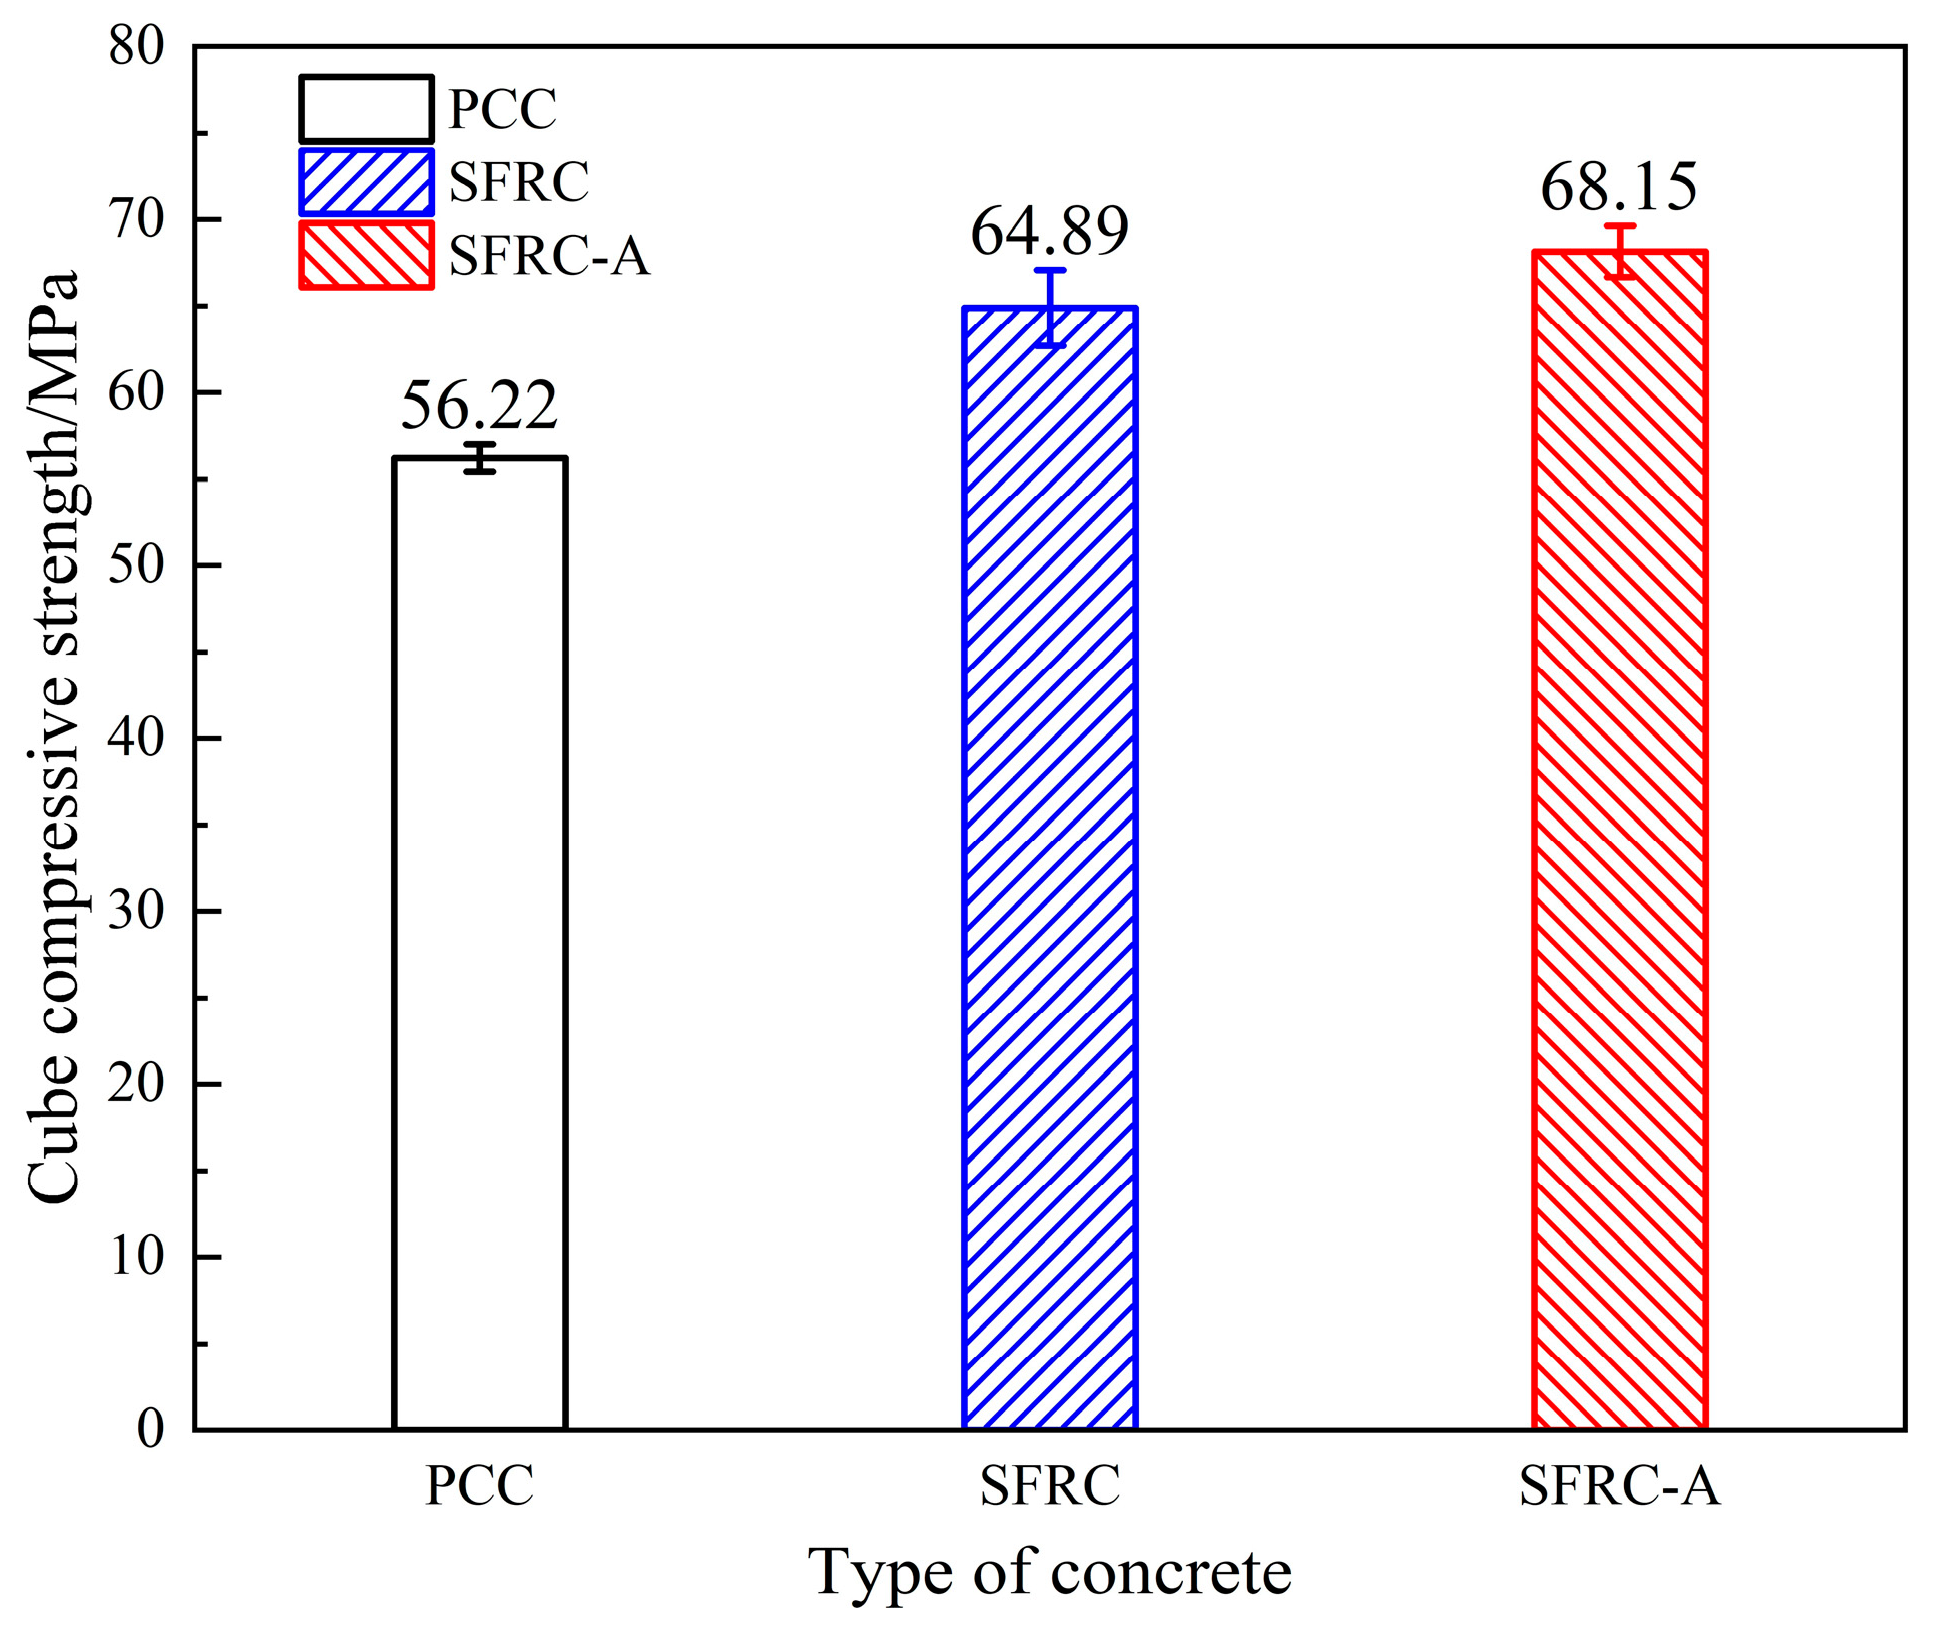
3.1. Reinforcement on Cube Compressive Strength

The Table 3 presents the results of the compressive strength test of the PCC and SFRC40 specimens from the same casting batch. It can be seen that, with the same mix proportion, the compressive strength of the concrete was slightly improved by steel fibers. The average compressive strength of the PCC specimens was 56.2 MPa, while the average compressive strength of the SFRCC specimens was 64.9 MPa, which was an increase of 15.48%. Meanwhile, the SFRC-A specimens with a different mix proportion and a 30% fiber content had an average compressive strength of 68.2 MPa, which was 5.08% higher than that of the SFRC40 specimens.
During the test process, the plain concrete cube (PCC) specimens were gradually compressed until failure, and most of the specimen was fractured and had chunks detached (see Figure 5a). On the other hand, the steel fiber reinforced concrete cube (SFRCC) specimens, when loaded to failure, produced a loud noise. However, due to the connecting effect of the steel fibers inside, the specimens did not completely break apart and almost maintained their original shape, with only partial cracking observed (see Figure 5b).
Based on the results of the compressive strength test, it can be concluded that steel fibers can slightly improve the compressive strength of concrete, and the improvement capacity varies with different mix proportions and fiber contents (see Figure 6). The addition of steel fibers can also improve the compressive failure mode of concrete.

3.2. The Residual Flexural Strength

The results of the notched beam test on USFRC notched beams from the same casting batch of USFRC segments are shown in Figure 7. Due to the similar results between the SFRC and SFRC-A specimens, only the SFRC notched beam results, which are shown in Figure 7a and Table 4, are analyzed here. It can be observed from the figure that with the increase of CMOD, the load on the notched beams first increases rapidly, reaches a peak, and then starts to decrease. When CMOD reaches 0.1–0.2 mm, the load on the notched beams gradually increases again, reaches about 1.5 times the peak load, and then slowly decreases until the end of the test. The maximum load often occurs when CMOD is around 1.50 mm.
According to Table 4, the residual tensile strength of the USFRC in different development stages of crack width is in the order of fR2, fR3, fR1, and fR4. With the increase of crack width, the residual tensile strength first increases and then decreases, indicating that the equivalent tensile strength of steel fibers on the section with the maximum crack width is not the maximum. The coefficient of variation of the residual tensile strength in different stages increases in the order of fR1, fR2, fR3, and fR4, indicating that with the gradual increase of crack width, the tensile effect of steel fibers becomes more and more dispersed, mainly related to the distribution and angle direction of the steel fibers in the concrete, as well as the bonding strength between the steel fibers and concrete. The calculation method of the standard value of residual tensile strength is shown in Equation (4). As shown in Table 5, fR2k is 6.31 MPa, which is 1.259 times fR1k, 1.405 times fR3k, and 2.270 times fR4k.
fRik = fRim(1 − ksδc)
where fRim is the average residual flexural tensile strength corresponding to the notch opening displacement CMOD = CMODi or the deflection w = wi (MPa). ks is the quantile coefficient taken according to Table 6 based on the number of samples. δc is the coefficient of variation (%), and when the number of samples is greater than 12, the δc should not be greater than 25%.

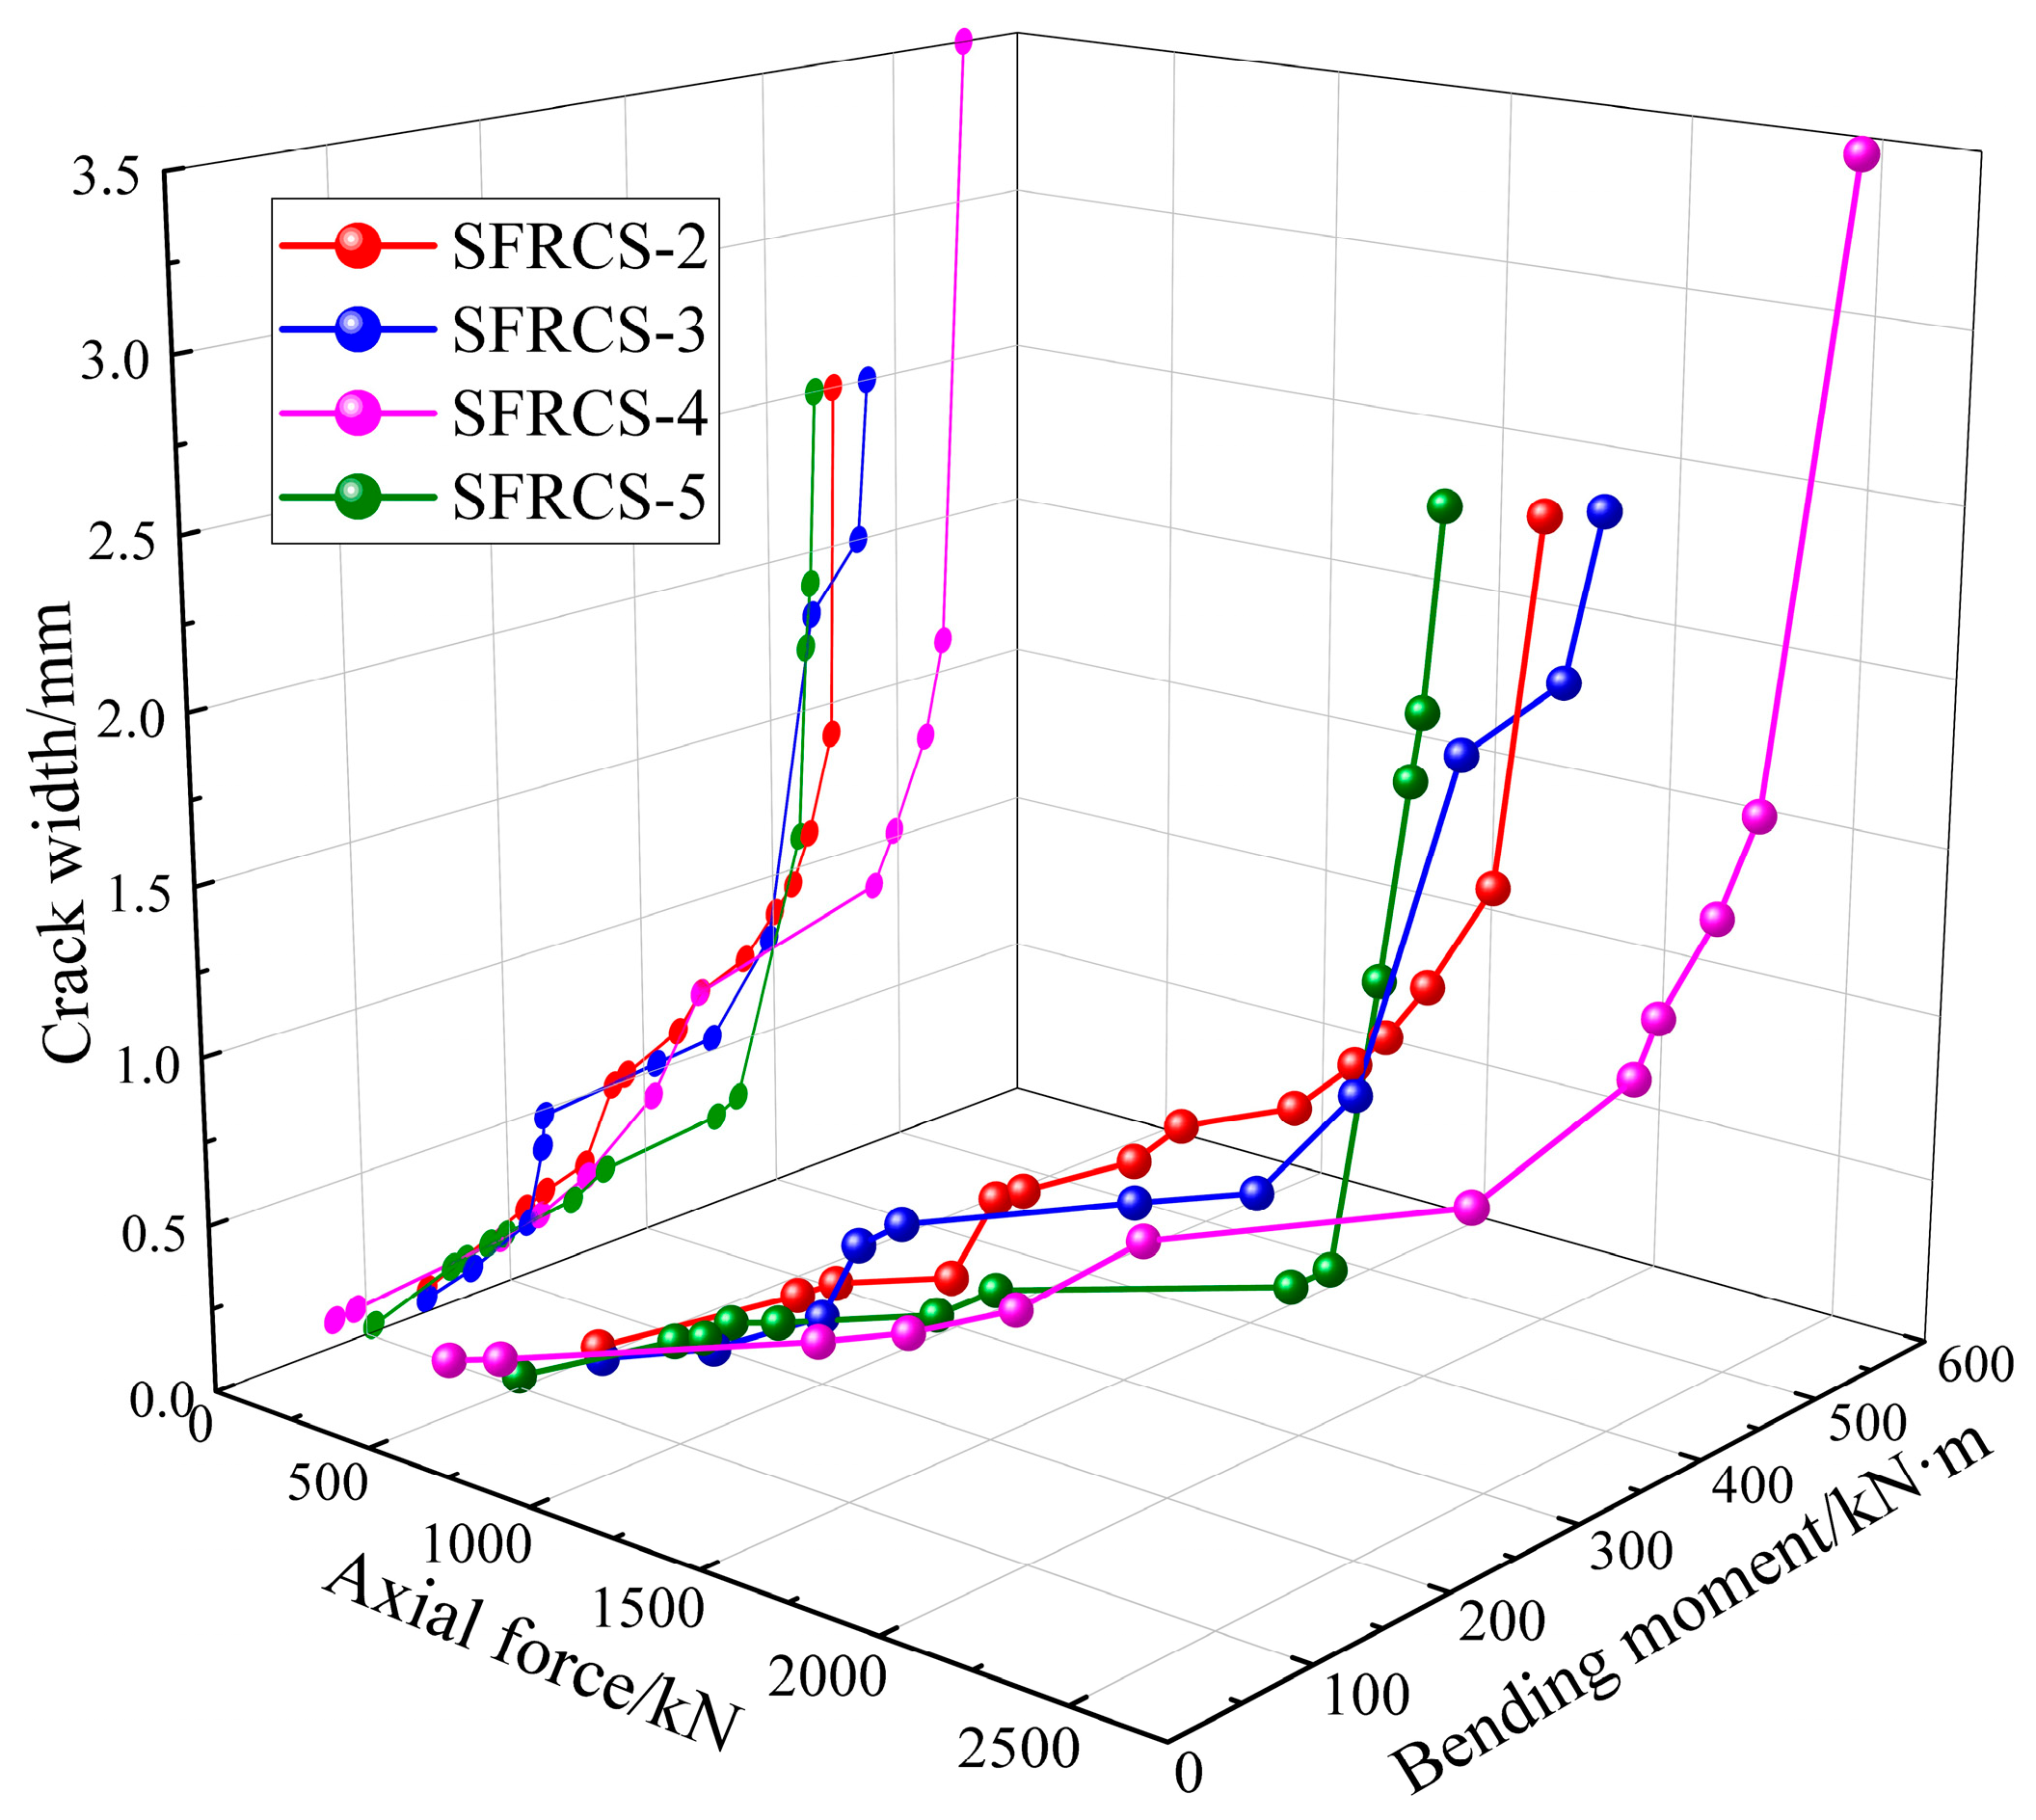
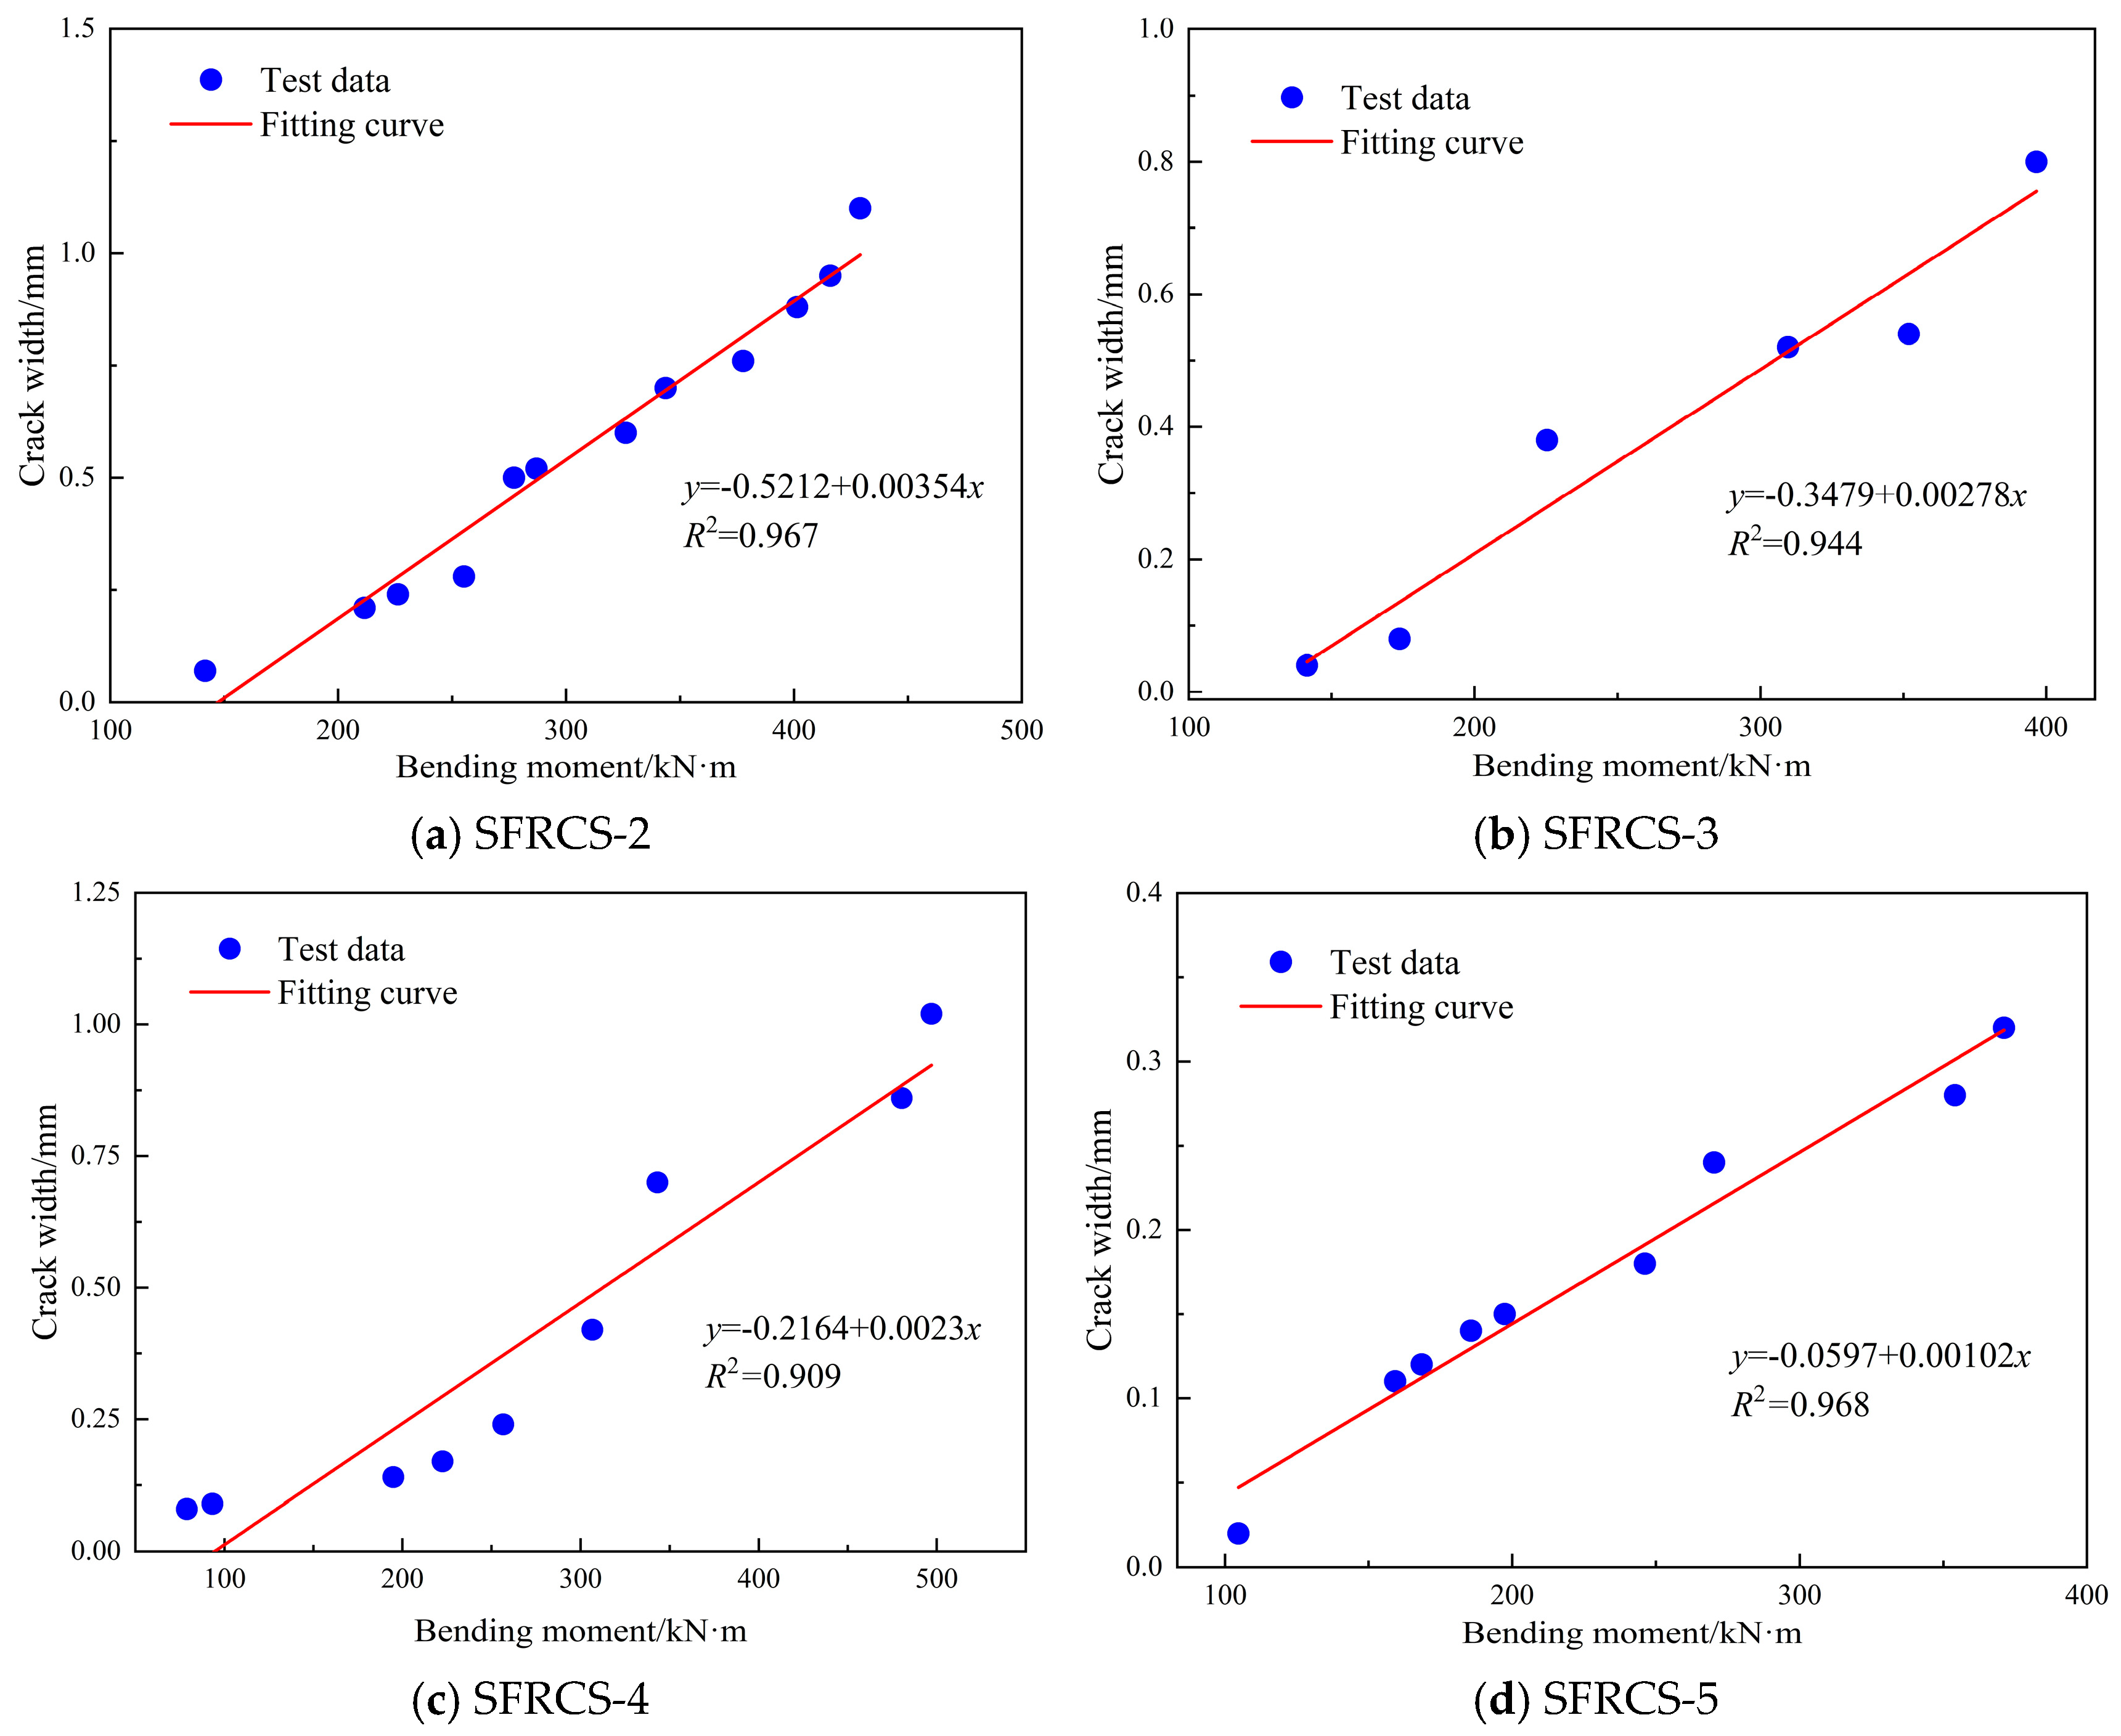
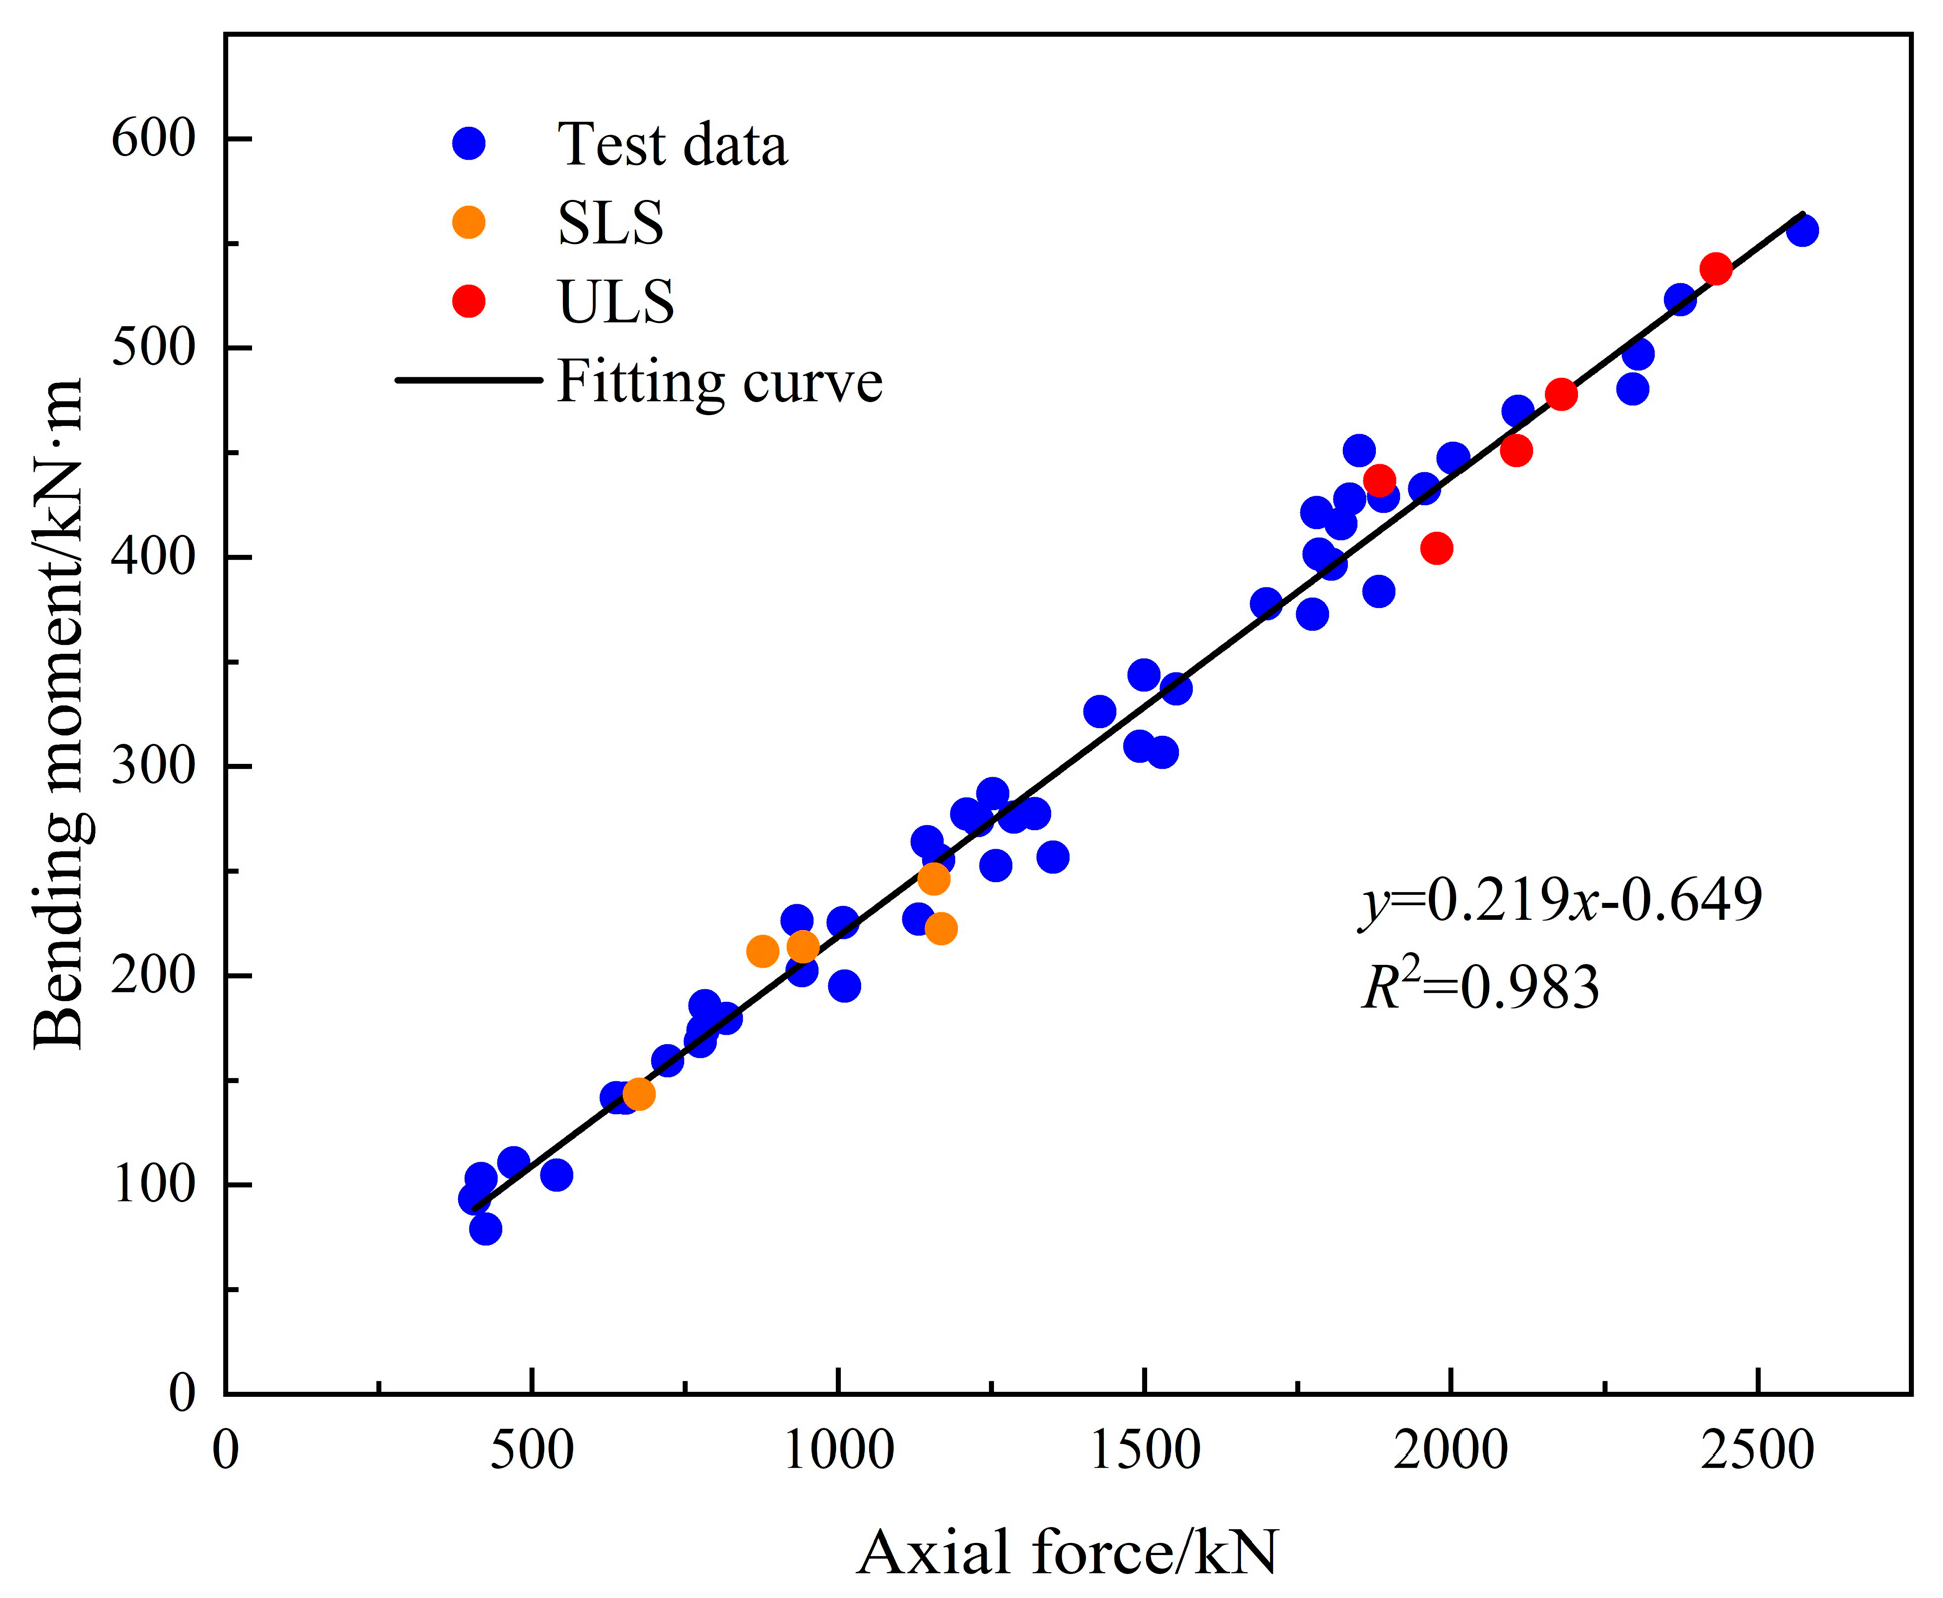
3.3. Characteristics of the Compression-Bending Capacity Curve

By conducting the segment bending test, it was discovered that the initial crack of the segment occurred on the inner arc surface in the form of a tensile crack at the loading point, rather than at the mid-span position as previously emphasized in earlier studies. The major crack always remained inside the loading point during the crack development process, and the width of the crack observed at the mid-span was significantly less than the major crack (see Figure 8). The development of segment cracks can be classified into three stages. The first stage is the crack generation stage, where the cracks first appear below one loading point, and then emerge below the other. At this stage, the height of the cracks increases rapidly. After a certain number of cracks have appeared, the development of cracks begins the second stage, where the number of cracks tends to stabilize, and fewer new cracks are observed. During this stage, the development speed of crack height slows down, while the development of crack width accelerates. When the load reaches a certain level, the height of the remaining cracks, except for the major crack, barely increases, and there is minimal change in the crack width. At this stage, the height of the major crack increases slightly, and the crack penetrates the inner arc surface, ultimately leading to its failure due to rapid development of the crack width. This is the third stage of crack development.
To investigate the correlation between crack width and applied load, it is crucial to determine the location of the crack and calculate the corresponding internal force of the section. As shown in Figure 8, the major cracks of each segment are situated inside the loading point. Therefore, by calculating the internal force of the section at the loading point under specific loading conditions and corresponding it to the width of the major cracks at that time, Figure 9 shows the relationship between the crack width and internal force of the section. As SFRCS-1, which has initial cracks, cannot show the entire process of segment cracking, only the internal force–crack width curves of SFRCS-2–5 are investigated. As shown in Figure 9, in the initial stage of crack development, the crack width increases linearly with the increase in the bending moment, and the growth rate is relatively slow. However, as the crack width expands to a certain value, especially after reaching 1.00 mm, the crack width increases nonlinearly with the increase of the bending moment, and the growth rate surpasses the linear stage by a significant margin.
During the nonlinear stage, crack development is frequently unstable, and accurate measurement of crack width is often impeded by the occurrence of concrete spalling around the crack. In contrast, during the linear growth stage, crack width development is relatively stable, and concrete spalling is less prevalent, resulting in higher precision in crack width measurement. Therefore, fitting the bending moment–crack width curve during the linear growth stage is a feasible approach to further investigate the crack development characteristics of SFRCS.
The crack development of SFRCS-2 is shown in Figure 10a. The axial force, bending moment, and crack width at the initial crack are 559.21 kN, 141.63 kN·m, and 0.07 mm, respectively. The eccentricity of internal force at the initial crack is 0.253 m. After the crack width reaches 1.10 mm, the crack width starts to develop nonlinearly. For SFRCS-3, the axial force, bending moment, and crack width at the initial crack are 572.72 kN, 141.44 kN·m, and 0.04 mm, respectively (see Figure 10b). The eccentricity of internal force at the initial crack is 0.247 m. After the crack width reaches 0.80 mm, the crack width starts to develop nonlinearly. For SFRCS-4, the axial force, bending moment, and crack width at the initial crack are 376.41 kN, 78.89 kN·m, and 0.08 mm, respectively (see Figure 10c). The eccentricity of internal force at the initial crack is 0.210 m. After the crack width reaches 0.86 mm, the crack width starts to develop nonlinearly. For SFRCS-5, the axial force, bending moment, and crack width at the initial crack are 477.24 kN, 104.72 kN·m, and 0.02 mm, respectively (see Figure 10d). The eccentricity of internal force at the initial crack is 0.219 m. After the crack width reaches 1.10 mm, the crack width starts to develop nonlinearly.
It can be observed that the development of crack width is not only related to the bending moment, but also strongly correlated with the axial force of the section. The relationship between the bending moment and axial force can be expressed by the eccentricity e. It can be seen that even with the same bending moment, there will be some differences in the crack width of the segments due to different eccentricities. Therefore, in order to further investigate the main factors affecting the development of cracks in segments, a multiple linear regression was performed on the crack width d (mm), the corresponding bending moment M (kN·m), and the eccentricity e (m). The fitting equation is shown below, with a fitting coefficient R2 of 0.85, indicating a good fitting result.
d = 0.0524e − 0.000168M + 0.0303
According to Equation (5), under the same bending moment, the larger the eccentricity, the greater the crack width. However, the crack width decreases with the increase of the bending moment, which is obviously unreasonable. The reason is that when the bending moment increases, the eccentricity also increases. Equation (5) can predict the bending moment required for a certain crack width under a certain eccentricity. It should be noted that the data used in this formula are in the linear development stage, and cannot accurately predict the relationship between the crack width, bending moment, and eccentricity in the nonlinear development stage. Through the fitting formula, it can also be found that when the eccentricity is large, there may be a situation where the bending moment is small but the segment has already suffered significant damage. Therefore, further investigation of the applicability of USFRC is needed.
Generally speaking, the crack width of concrete at the serviceability limit state (SLS) is 0.20 mm. By substituting it into Equation (5), it can be obtained that when the eccentricity reaches 3.24 m, the segment can reach the serviceability limit state after the initial load, which indicates that the USFRC is no longer applicable and steel reinforcement needs to be provided at appropriate locations. Therefore, it can be seen that steel fiber is suitable for most conditions and can replace traditional reinforced concrete under appropriate circumstances.

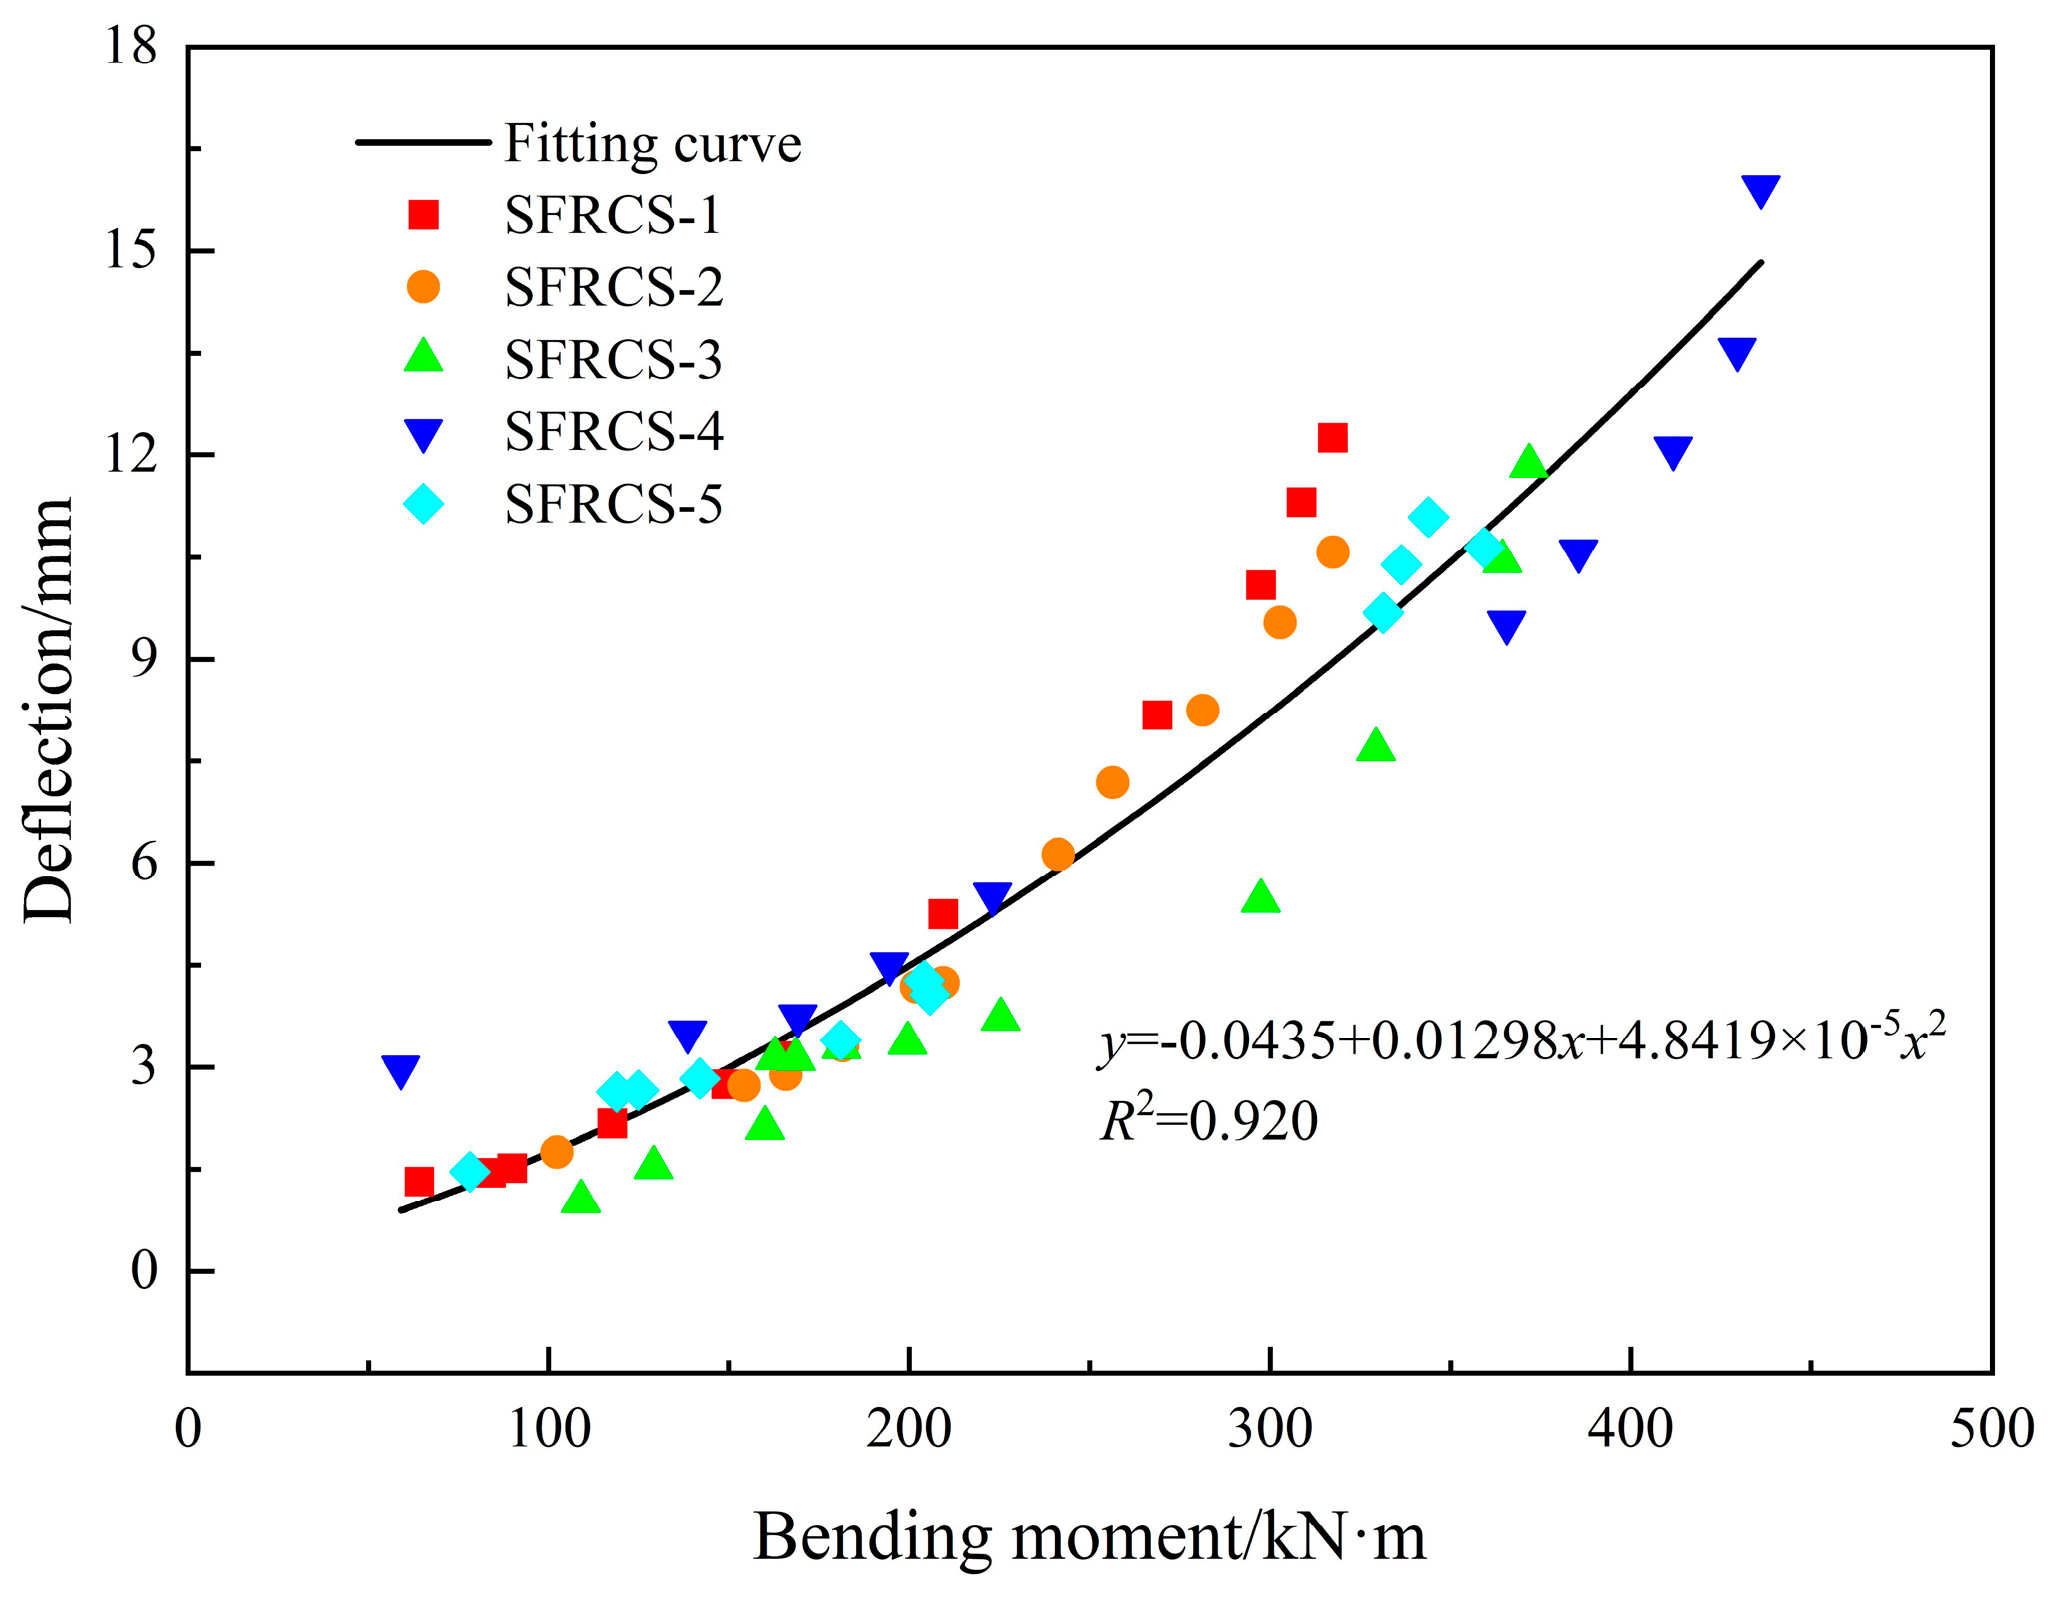
3.4. The Load–Deflection Curve

The load–deflection curve is also important for material performance. The load–deflection curves of each segment are shown in Figure 11. It can be seen that SFRCS-1 has the fastest change rate of deflection with load, mainly due to the existence of initial crack damage. The change rate of deflection of SFRCS-2 is greater than that of SFRC-4 because the loading eccentricity of SFRCS-2 is larger, i.e., the vertical force is greater under the same horizontal force, so the deflection is also greater. The change rate of deflection of SFRCS-2 and SFRCS-3 is similar, and the two segments have similar loading eccentricities. The deflection of SFRCS-5 at the same load level is similar to that of SFRCS-4 in the early stage of the test, but in the later stage, the deflection of SFRCS-5 is larger. This is because SFRCS-5 used two eccentricities during loading, and the initial eccentricity was too large, which affected the bearing capacity of the segment by causing early cracking. In order to further study the relationship between deflection and load, multiple linear regression was performed on the deflection w, eccentricity e, and bending moment M, and the fitting result is shown in Equation (6).
w = −0.0007e + 0.3853M − 0.1588
The fitting coefficient R2 of Equation (6) is 0.971, indicating that the model has a good fitting effect. It can be seen that the deflection of the segment is mainly affected by the bending moment, and the relationship with the eccentricity is not obvious. Therefore, the effect of eccentricity was ignored, and the bending moment–deflection curve was fitted. The fitting result is shown in Figure 12, and the fitting coefficient R2 is 0.920, indicating that the model has a relatively good fitting effect. The change rate of deflection gradually accelerates with the bending moment, mainly because there is an appearance of plastic deformation in the later stage, the crack width at the bottom of the segment is too large, and the tensile resistance of the steel fiber begins to decrease; on the other hand, the eccentricity increases in the later stage, which also causes the rapidly change of deflection.
Based on the above analysis, segments of the same level have similar deformation resistance, but the initial crack damage will significantly reduce their performance. The development of deflection will vary according to the loading method, especially the difference of eccentricity. The larger the loading eccentricity, the faster the deflection changes. Under the same eccentric load, the change rate of deflection is similar, but the absolute value of deflection may vary. At the same time, early cracking will affect the long-term deformation resistance of the segments.

4. Discussion

Previous studies have often focused on the internal forces of the mid-span section. However, in this study, it was found that the major crack often occurs below the loading point rather than at the mid-span position (see Figure 8). In order to better investigate the bearing capacity of USFRC, this section calculates the internal force distribution of the entire segment under specific compressive and bending loads to explore the most critical section for structural failure.

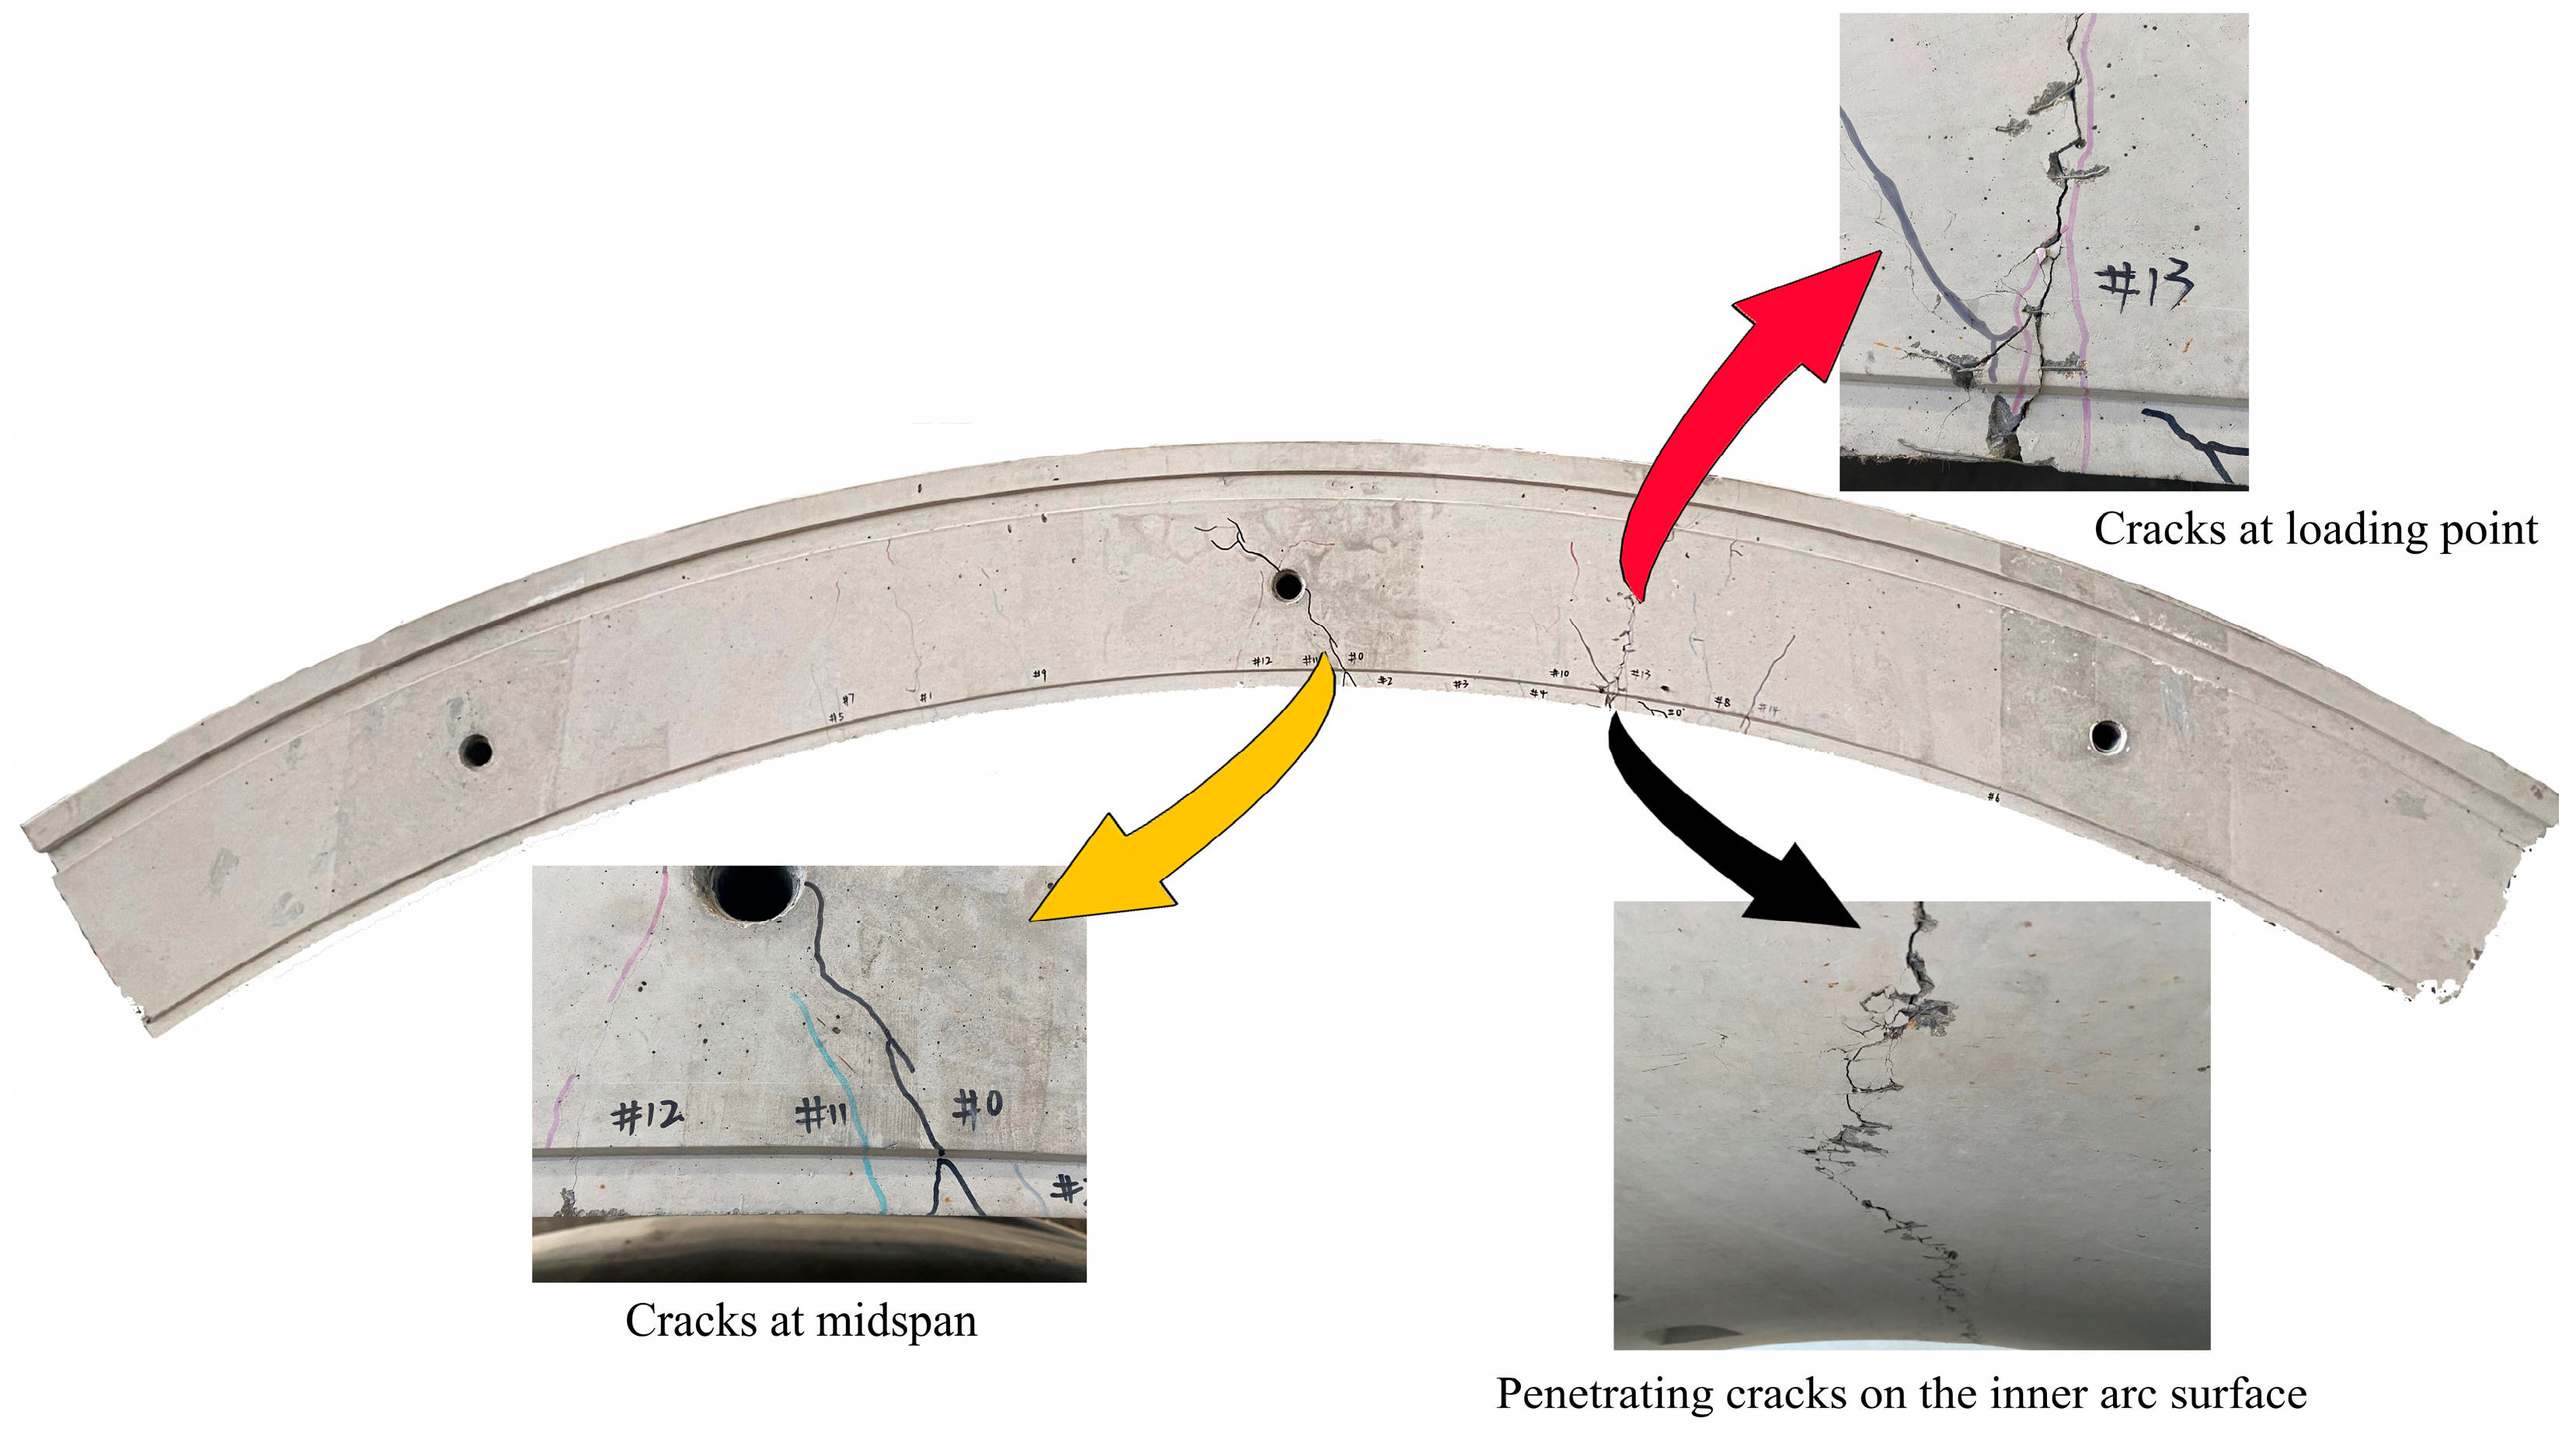
4.1. Features of Segment Surface

Since the segment is a symmetrical structure, the compression-bending load is the symmetrical load, so the axial force and bending moment of the entire segment are distributed symmetrically along the mid-span, while the shear force is distributed antisymmetrically. Therefore, to investigate the internal force distribution of the segment, it is sufficient to analyze half of the structure. To obtain the internal forces at any section of the segment, a section is cut off from the segment along the arc (see Figure 13).
The angle θ gradually decreases from θ0 (33.75°, half of the segment arc). When the section is on the outside (left side) of the loading point, the internal force distribution of the section is shown in Figure 13a. The axial force, shear force, and bending moment of the section are represented by N, V, and M, respectively. By horizontally and vertically balancing the forces, Equations (7) and (8) are obtained below:
V = (P + G) · cosθS · sinθG2 · cosθ
N = (P + G) · sinθ + S · cosθG2 · sinθ
By calculating the moment of the section, the following can be obtained:
M = (P + G) · xS · hG2 x/2
G2 = G · (1 − θ/θ0) · cosθ
h = ( 2 R sin 33.75 ° θ 2 ) 2 x 2
x = R · (sinθ0sinθ)
where R is the centroid radius of the segment (m), P is the vertical load at each loading point (kN), S is the horizontal load at each rotating hinge support (kN), G is the half weight of a segment (kN), and G2 is the weight of the structure on the left side of the section (kN).
As θ continues to decrease, when the section is located on the inner side (right side) of the loading point, the distribution of internal forces is shown in Figure 13b. Unlike Figure 13a, the vertical force P at the loading point needs to be considered for the balance of the calculation structure. By horizontally and vertically balancing the forces, Equations (13) and (14) are obtained below:
V = (P + G) · cosθS · sinθG2 · cosθP · cosθ
N = (P + G) · sinθ + S · cosθG2 · sinθP · sinθ
By calculating the moment of the section, the following can be obtained:
M = (P + G) · xS · hG2 · x/2 − P · x2
x2 = x − (R · sinθ0 − 0.62)
where x2 is the horizontal distance from the loading point to the section (m). The vertical distance from the loading point to the mid-span is 0.62 m.
Based on the above analyses, the complete internal force curve of the segment under specific horizontal and vertical loads can be obtained. Taking the hinge supports on both sides as the starting point (θ = 0°) and the ending point (θ = 67.5°), respectively, the axial force, shear force, and bending moment diagrams of the segment in the ultimate limit state (ULS) can be obtained.

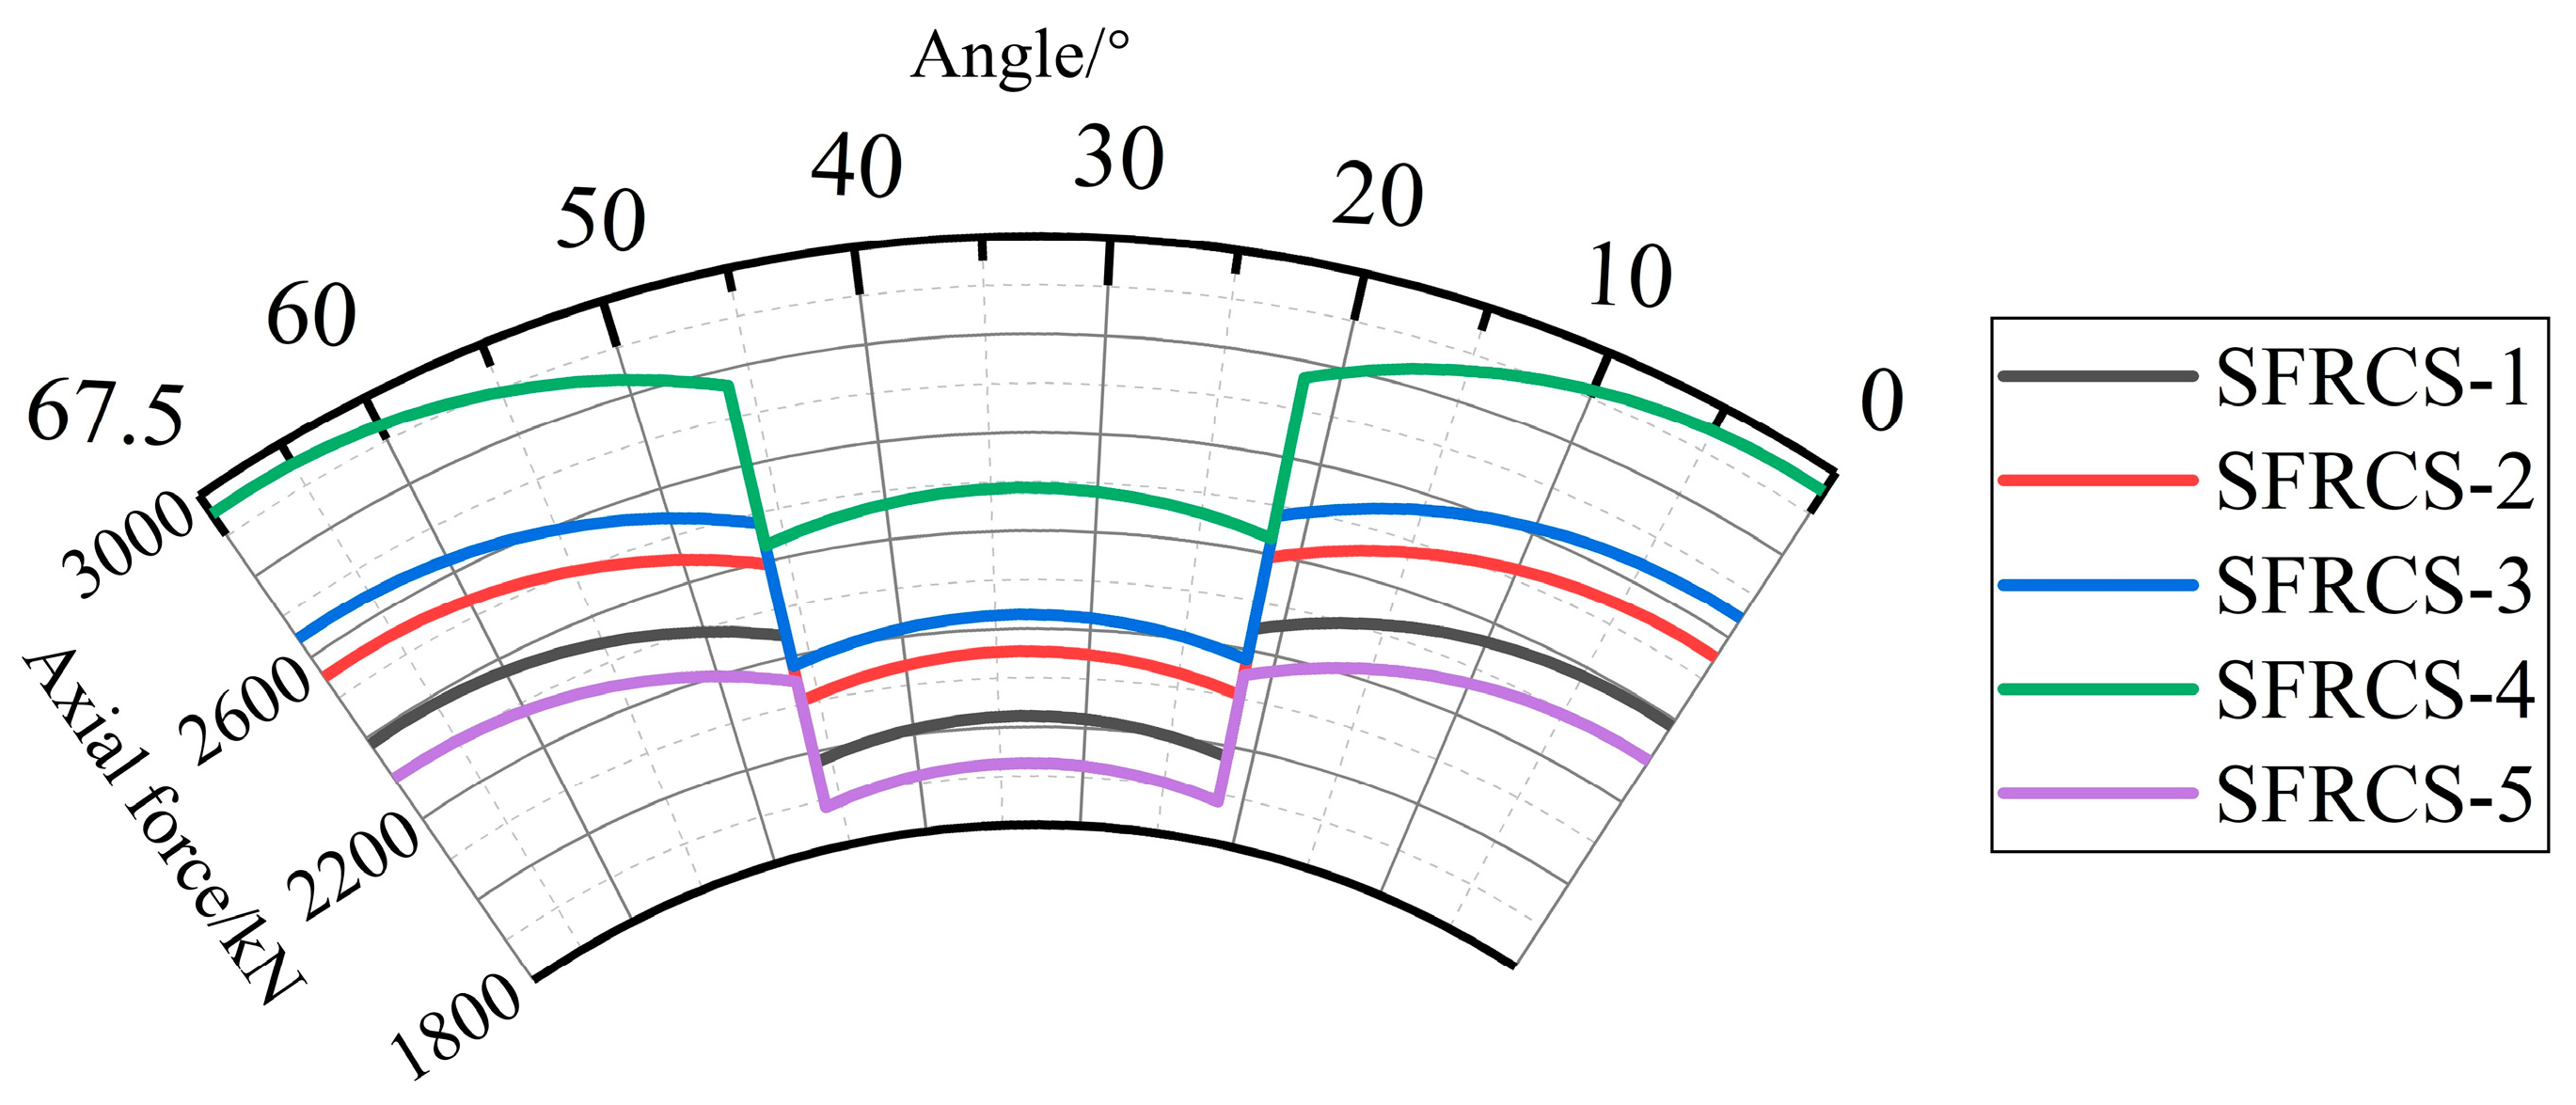
4.1.1. The Axial Force

As shown in Figure 14, the axial force of the segment begins to decrease slowly from the hinged support, experiences a sudden drop at the loading point, and then slowly increases to the mid-span position, where the axial force distribution is positive symmetrical. The maximum axial force is at the two horizontal hinged support positions and the minimum axial force is at the two loading points on the inner side (see Figure 14). When it reaches the ultimate limit state, the segments, ordered from large to small axial forces, are SFRCS-4, SFRCS-3, SFRCS-2, SFRCS-1, and SFRCS-5. The axial forces of each segment at the characteristic position are shown in Table 7.
The axial force on the inner side of the loading point of SFRCS-1 is 2431.63 kN, accounting for 97.78%, 87.90%, and 82.31% of the axial force at the mid-span, outer side of the loading point, and hinged support position, respectively. The axial force on the inner side of the loading point of SFRCS-2 is 1883.90 kN, accounting for 97.80%, 87.76%, and 81.90% of the axial force at the mid-span, outer side of the loading point, and support position, respectively. The axial force on the inner side of the loading point of SFRCS-3 is 2105.78 kN, accounting for 97.79%, 88.03%, and 82.57% of the axial force at the mid-span, outer side of the loading point, and support position, respectively. The axial force on the inner side of the loading point of SFRCS-4 is 2178.97 kN, accounting for 97.79%, 87.94%, and 82.38% of the axial force at the mid-span, outer side of the loading point, and support position, respectively. The axial force on the inner side of the loading point of SFRCS-5 is 1977.58 kN, accounting for 97.79%, 88.20%, and 82.93% of the axial force at the mid-span, outer side of the loading point, and support position, respectively. It can be seen that the proportion of the axial force on the inner side of the loading point of each segment is almost the same in the entire structure, indicating that the overall structural load is stable. For the compression-bending specimens, the structure with a smaller axial force is more prone to cracking and failure under the same level of bending moment, so the failure on the inner side of the loading point should be the focus of this experiment.

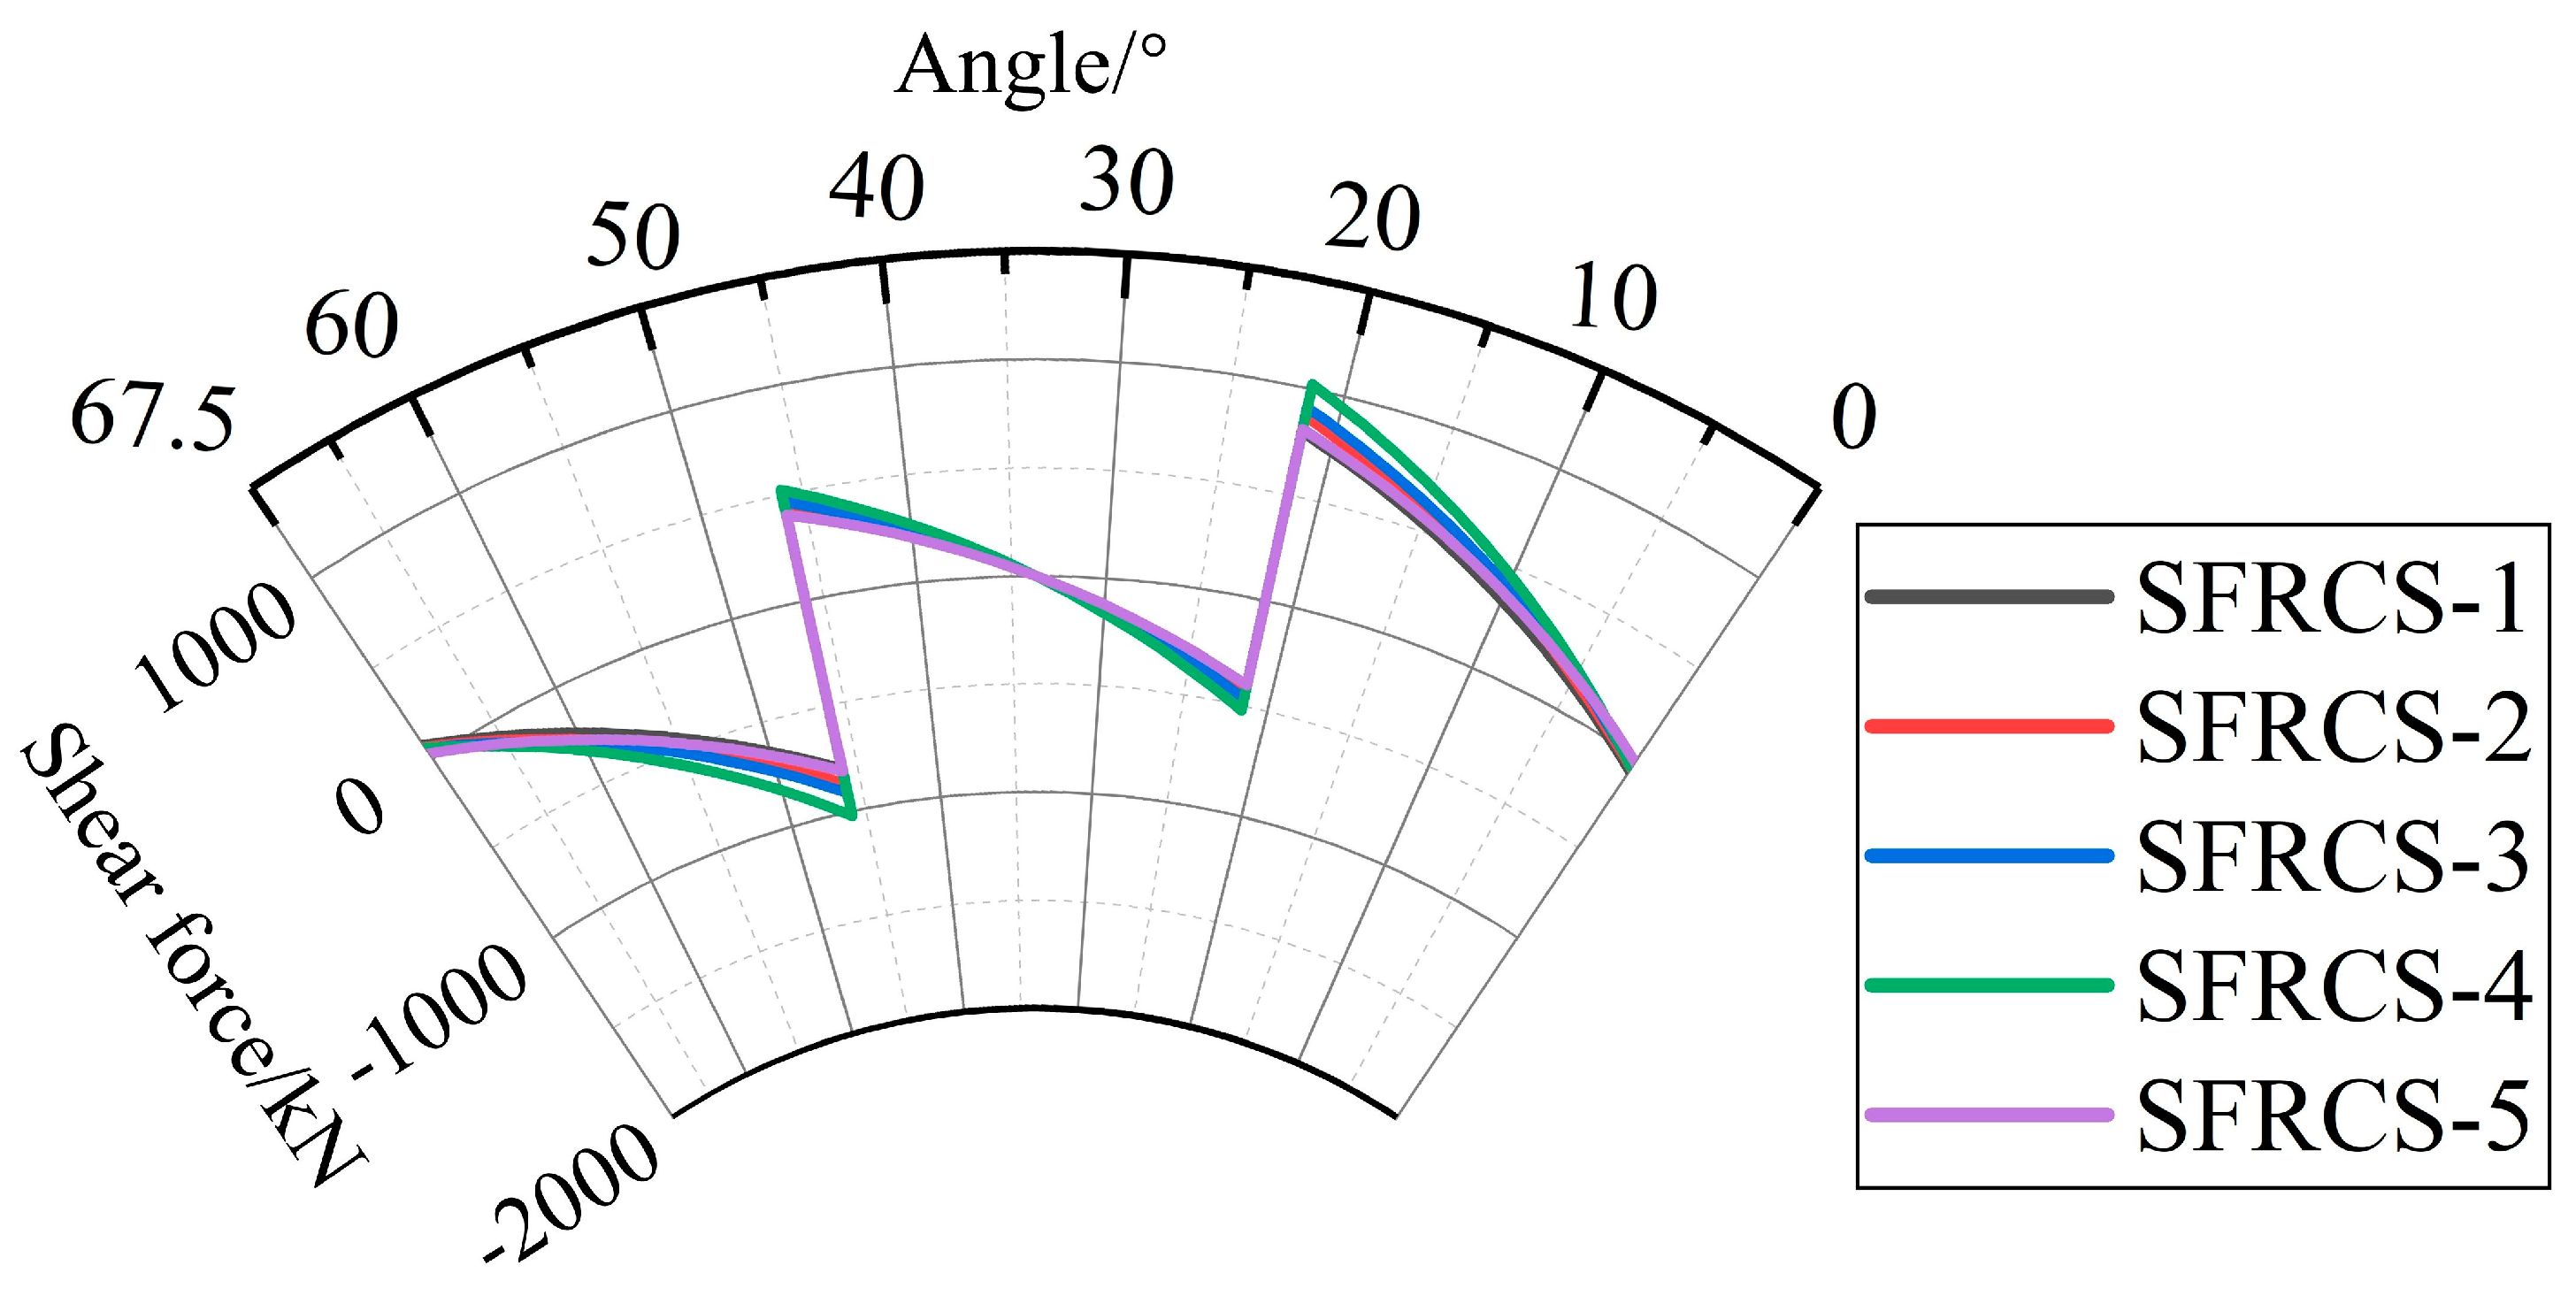
4.1.2. The Shear Force

As shown in Figure 15, the shear force is considered positive when it rotates clockwise around the section. The shear force in the segment starts from 0 kN at the hinged support, decreases slowly, has a sudden increase to a positive value at the loading point, then decreases slowly again to 0 kN at the mid-span. The shear force distribution along the mid-span is antisymmetric. The maximum positive and negative values of the shear force are located outside the two loading points, while the shear force is 0 kN at the two hinged supports. When the ultimate limit state is reached, the shear forces of the segments decrease in the following order: SFRCS-4, SFRCS-3, SFRCS-2, SFRCS-5, and SFRCS-1. The shear forces of each segment at the characteristic position at this time are shown in Table 8 below. The shear force on the inner side of the loading point of SFRCS-1 is 422.62 kN, which is 52.98% and 594.80% of the shear force at the outer side of the loading point and the hinged support, respectively. The shear force on the inner side of the loading point of SFRCS-2 is 450.42 kN, which is 51.79% and 762.92% of the shear force at the outer side of the loading point and the hinged support, respectively. The shear force on the inner side of the loading point of SFRCS-3 is 466.30 kN, which is 51.19% and 895.83% of the shear force at the outer side of the loading point and the hinged support, respectively. The shear force on the inner side of the loading point of SFRCS-4 is 521.10 kN, which is 51.00% and 950.49% of the shear force at the outer side of the loading point and the hinged support, respectively. The shear force on the inner side of the loading point of SFRCS-5 is 402.30 kN, which is 49.69% and 1613.93% of the shear force at the outer side of the loading point and the hinged support, respectively.
It can be seen that the ratio of shear forces on the inner and outer sides of each segment’s loading point is almost the same, indicating that the structure is stable as a whole. As is known to all, the shear force of the structure is the slope of the bending moment curve. The shear force changes abruptly and changes direction at the loading point, and the slope of the bending moment changes. Therefore, in this experiment, the failure mode of the inner side of the loading point should be the focus of attention.

4.1.3. The Bending Moment
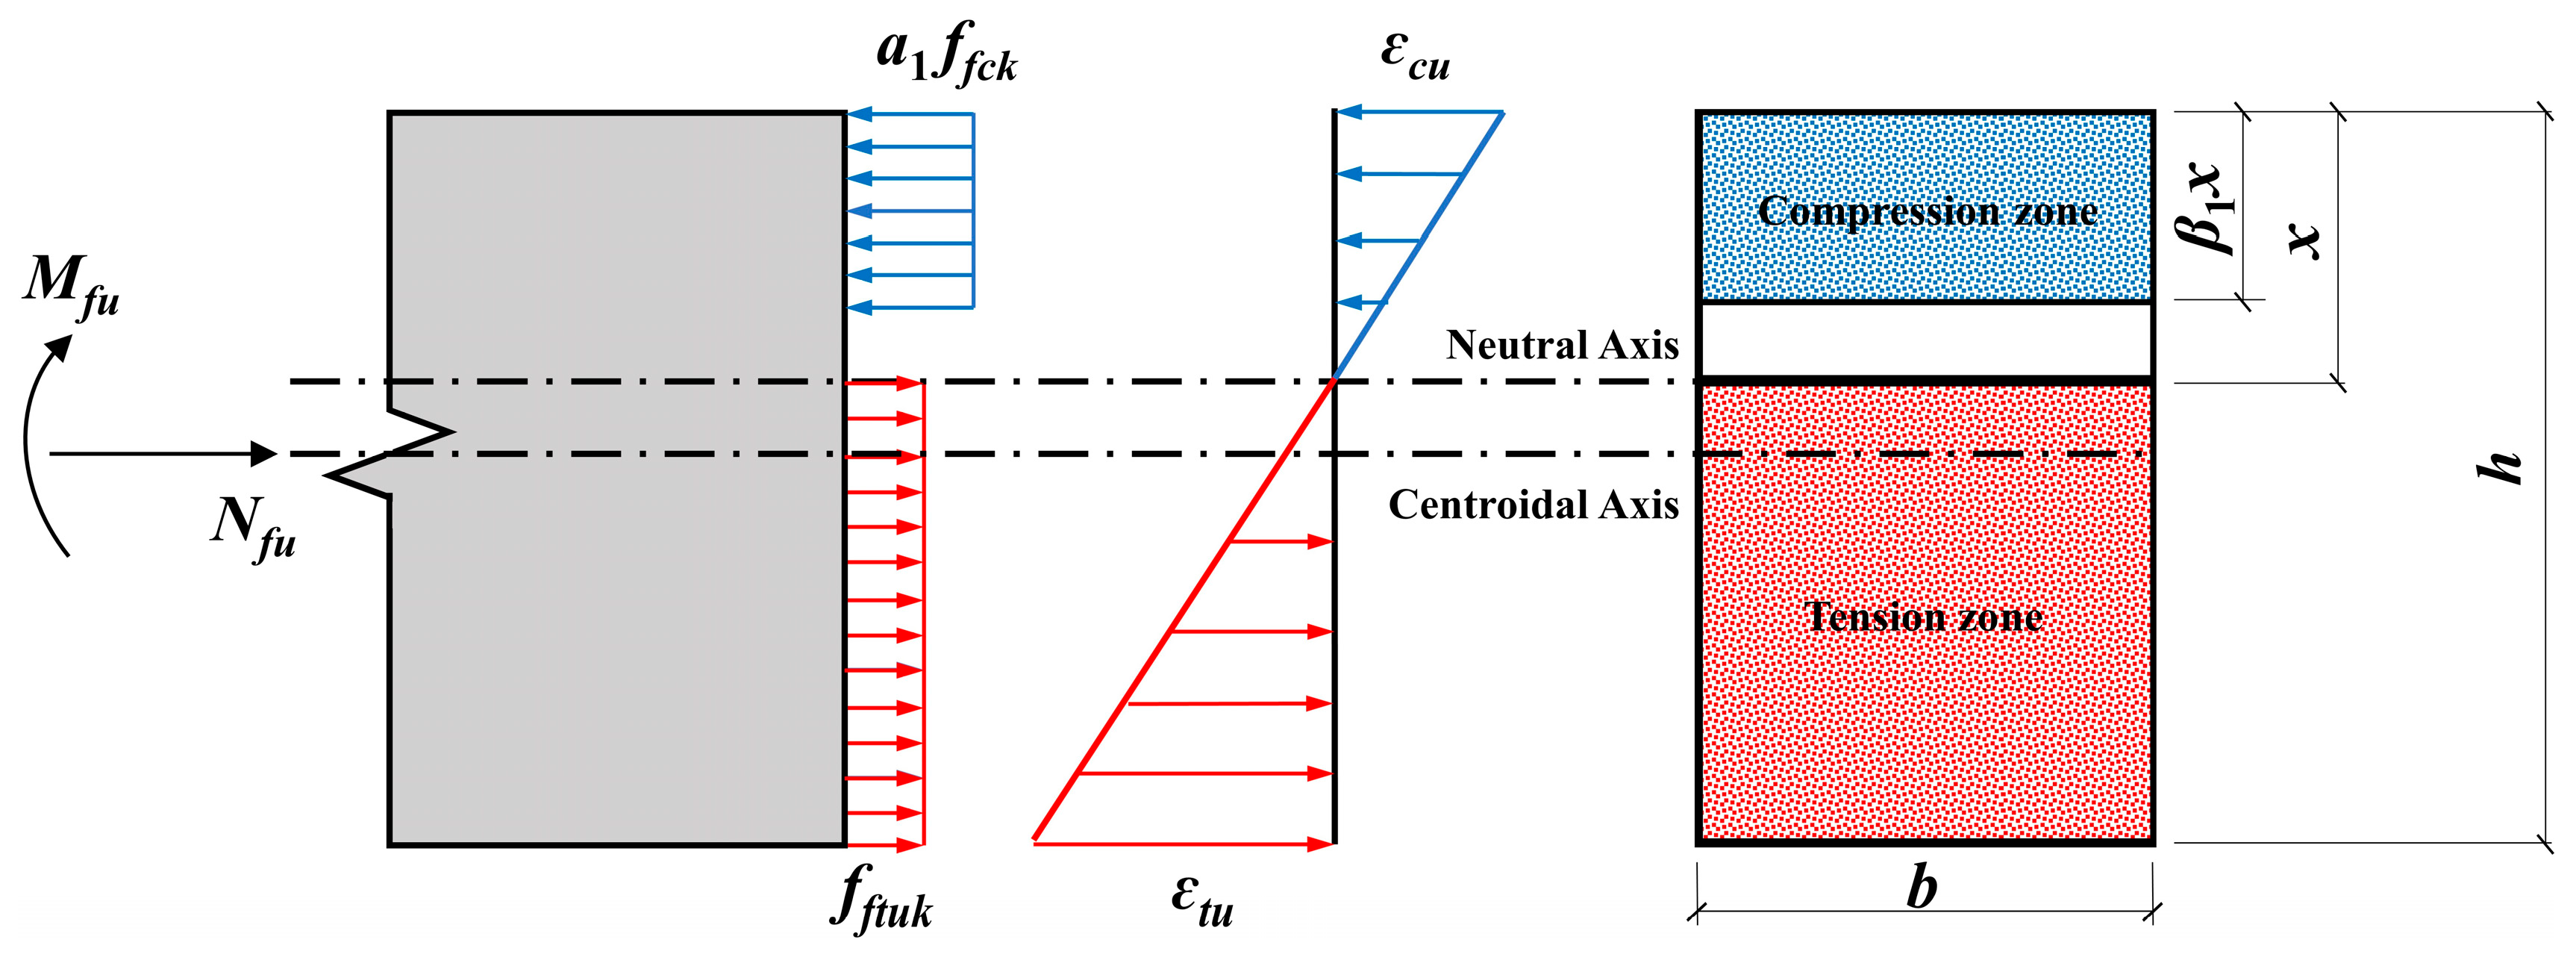
Figure 16 shows the bending moment distribution of each segment at the ultimate limit state, where a positive bending moment means that the lower side of the segment is under tension. As shown in Figure 16, the absolute value of the bending moment first increases and then decreases with the increase of θ, reaching its maximum value before returning to 0 kN·m. The speed of increase gradually accelerates while the speed of decrease gradually slows down, which is consistent with the shear force distribution. The bending moment of the segment is almost entirely tension at the lower side, with zero bending moment at the horizontal supports on both sides and a maximum bending moment at the loading point, which is significantly greater than the bending moment at the mid-span. SFRCS-1 has the smallest bending moment, and SFRCS-2 and SFRCS-5 have similar bending moment distributions and loading paths, indicating that they have similar bearing capacities. The peak bending moment of SFRCS-4 is the largest, followed by SFRCS-3.
The bending moments at the loading points for SFRCS-1, SFRCS-2, SFRCS-3, SFRCS-4, and SFRCS-5 are 404.24 kN·m, 450.91 kN·m, 477.71 kN·m, 537.71 kN·m, and 436.50 kN·m, respectively, which are 148.62%, 145.48%, 143.99%, 143.54%, and 140.52% of the bending moment at mid-span. Considering the above internal force distribution, the average bending moment at the loading point of each segment is 144.43% of the bending moment at the mid-span. The inner side of the loading point is the most unfavorable position for the whole structure, with the largest peak bending moment and the smallest axial force, resulting in the largest actual eccentricity. This is consistent with the results of the experimental tests, where cracks reaching the limit width of 2.50 mm occurred on the inner side of the loading point (see Figure 8). Therefore, when analyzing the theoretical bearing capacity of USFRC, the internal force at the inner side of the loading point rather than at the mid-span should be the focus.

4.2. Model Review

At present, the existing domestic and foreign design methods for calculating the bearing capacity of reinforced steel fiber reinforced concrete are mainly based on the adjustment of the design method of reinforced concrete components, and the residual tensile strength of steel fiber is considered to be in the tension zone of concrete. However, there are few provisions in the existing codes for the calculation method of the bearing capacity of concrete that only adds steel fibers, which is not enough for practical design work. The following is a brief introduction to a typical calculation method for the bearing capacity of reinforced steel fiber reinforced concrete which simplifies it into a calculation method for unreinforced steel fiber reinforced concrete.
In the European standard Model Code 2010 (fib Bulletin 83 [28]), the calculation model for the eccentric compressive capacity of steel fiber reinforced concrete was proposed. Similar to the assumption in other codes, it simplifies the internal stresses in the compression and tension zones of USFRC into rectangles. However, the reduction factors for compressive strength and tensile strength are different. Based on the Model Code 2010 calculation model, a calculation method for the compression-bending capacity of USFRC is proposed, and the calculation model is shown in Figure 17.
N f u = a 1   f f c k   β 1 x b     f f t u k   ( h x ) b
M f u = a 1   f f c k   β 1   x b ( x β 1 x 2 ) + f f t u k ( h x ) b h x 2 + N f u ( h 2 x )
ε c u ε t u = x h x
f f c k = 0.88   a c 1   a c 2   f f c u k
f f c u k = f c u m 1.645   σ c
f f t u k = f R 3 k 3
In these equations, Nfu is the axial force of the section where the main crack is located (kN), and Mfu is the corresponding ultimate bending moment of this section (kN·m). ffck is the compressive stress of the concrete at the edge of the compression zone (MPa), and it is obtained through Equation (20), while ac1 is the ratio of prism strength to cube strength, taking 0.76 for ordinary concrete with a strength grade of C50 and below, and 0.82 for high-strength concrete with a strength grade of C80, with linear interpolation for intermediate values. ac2 is the brittle reduction coefficient of concrete, taking 1.00 for C40 and 0.87 for C80, with linear interpolation for intermediate values. ffcuk is the standard value of the cube compressive strength (MPa), which is obtained through Equation (21). In Equation (21), fcum is the average test value of the cube compressive strength test mentioned in Section 2.2.1 (MPa), and σc is the standard deviation of the compressive strength. a1 is the reduction coefficient of the compressive strength, β1 is the reduction coefficient of the compression zone height, x is the height of the compression zone (m), h is the height of the specimen (m), and b is the width of the specimen (m). εcu is the maximum compressive strain of concrete, and its value is between 0.20% to 0.33% when the concrete at the edge of the compression zone reaches its compressive strength. εtu is the maximum tensile strain of concrete, and its value is 0.714% when the maximum crack width is 2.50 mm. fftuk is the tensile stress of the concrete at the edge of the tension zone (MPa), and it is obtained through Equation (22), while fR3k is obtained through the notched beam test mentioned in Section 2.2.2 (MPa).
By continuously varying the value of εcu and combining Equations (17)–(19), the corresponding axial force and bending moment can be obtained. Thus, all possible ultimate axial force and bending moment values can be obtained when the width of the main crack reaches 2.50 mm. By obtaining the M–N curve from these axial force and bending moment values, the axial force and bending moment values can be obtained when concrete reaches the ultimate limit state (ULS) under fixed eccentricity. The corresponding ultimate bending moment of concrete can also be determined under a certain axial force. It should be noted that the value of εcu cannot exceed 0.33%, which is the ultimate compressive strain of concrete. When the value of εcu is between 0.20% and 0.33%, ffck can be obtained through Equations (20) and (21). When the value of εcu is less than 0.20%, ffck= εcu · Ec, where Ec is the elastic modulus of concrete (MPa).

4.3. The Ultimate Strength for Compression-Bending Load

Table 9 shows the axial force and bending moment at the loading point when each segment reaches its ultimate bearing capacity, as well as the theoretical bending moment at ULS corresponding to the axial force. From Table 9, it can be seen that even SFRCS-1 with initial crack damage can pass the theoretical bearing capacity test according to the existing specification. This indicates that the existing specifications for calculating the bearing capacity of steel fiber reinforced concrete are overly safe. SFRCS-4 has the largest axial force and bending moment at the loading point, with a maximum bending moment of 537.71 kN·m, and the safety factor for the Model Code specification is 1.234. However, its eccentricity is only 0.221, which is not much different from that of other segments. Therefore, the reason for its overestimated bearing capacity is that its initial eccentricity is smaller.
SFRCS-2 and SFRCS-3, which have similar loading paths, have similar ultimate bearing capacities, with safety factors relative to the Model Code specification of 1.130 and 1.173, respectively. SFRCS-5 had a similar loading path to SFRCS-2 and SFRCS-3 in the early stages of the experiment, but its eccentricity suddenly increased in the later stages of the experiment, which led to its failure when the axial force reached 1883.90 kN. However, the safety factor of SFRCS-5 is 1.172, indicating that the ultimate bearing capacity of USFRC can still maintain the theoretical level when the eccentricity changes from small to large, demonstrating good applicability.

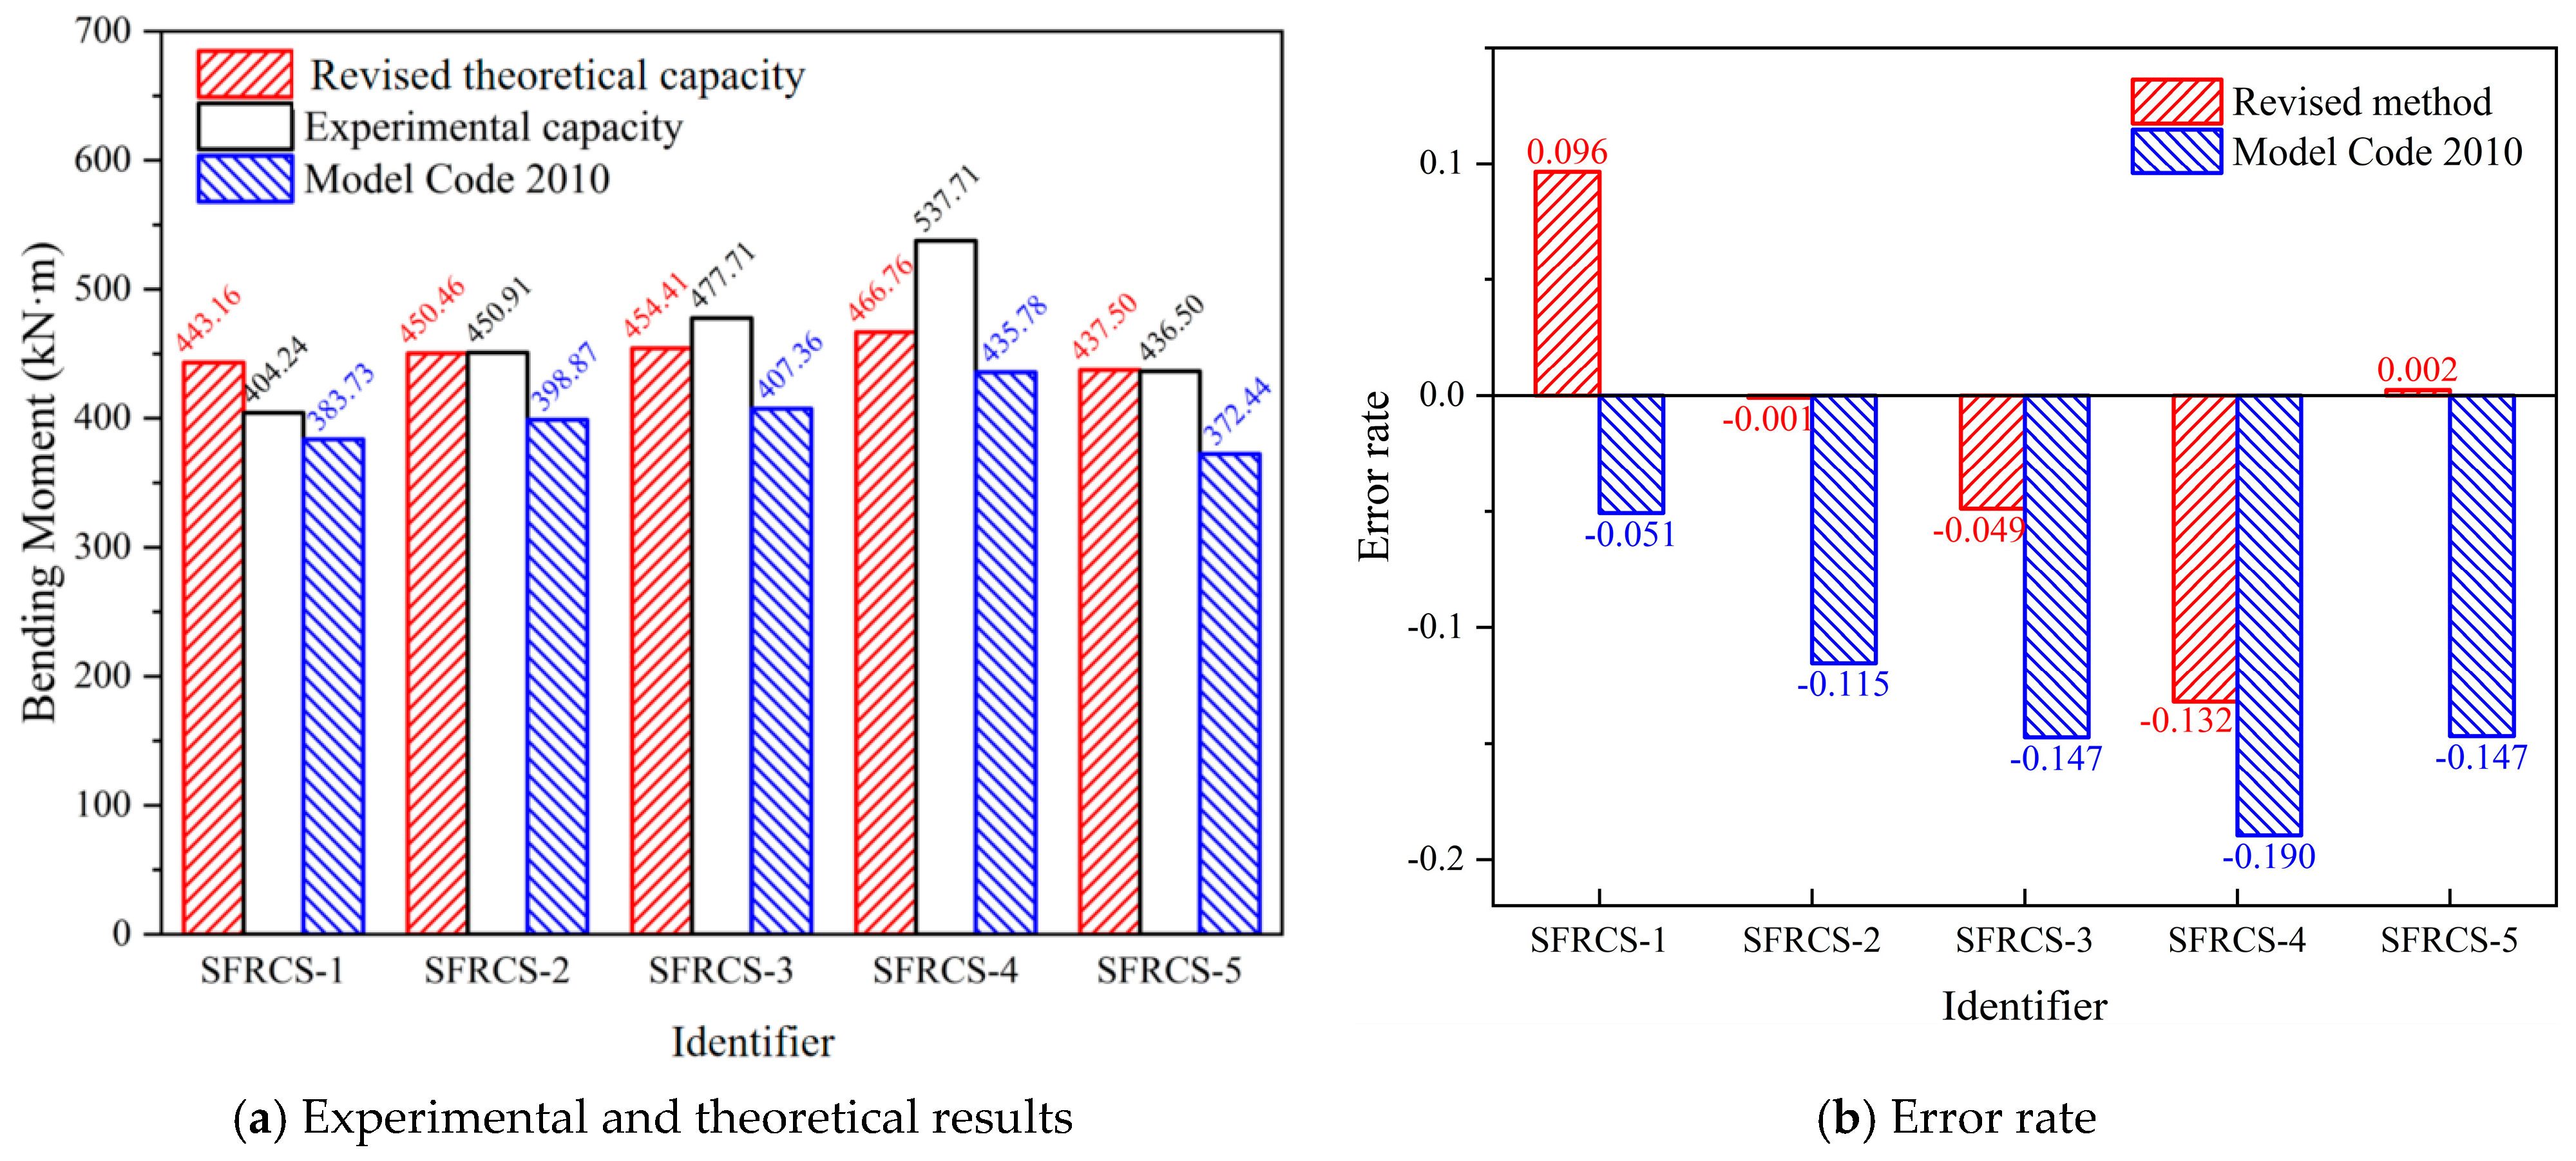
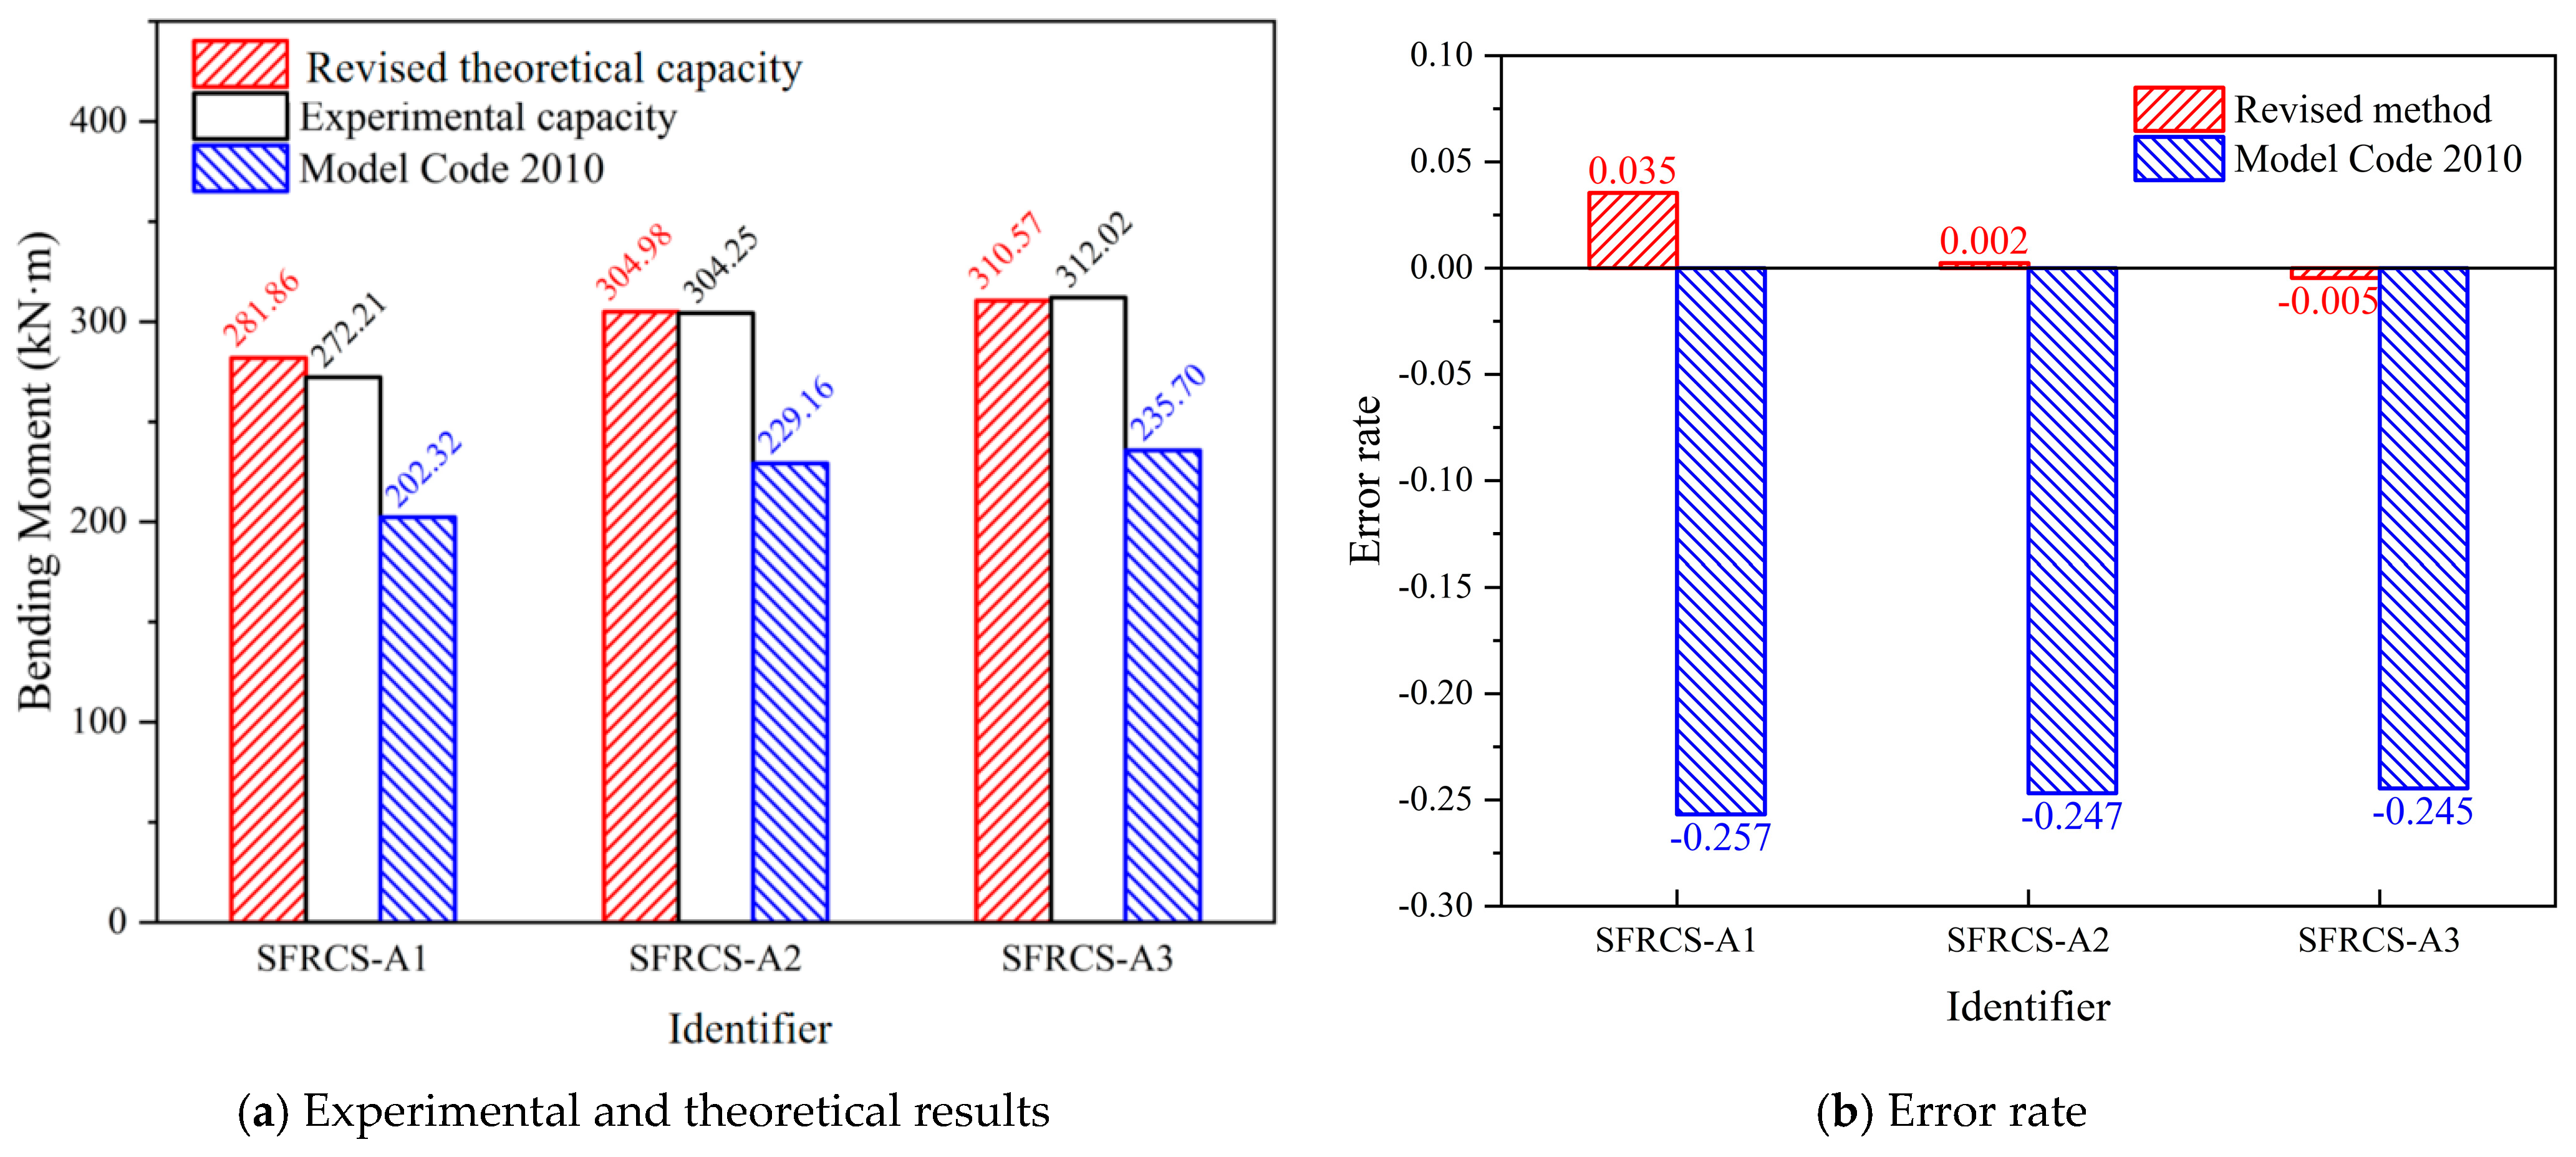
4.4. The Modification and Study of the Calculation Models

As stated in Section 4.3, the ultimate bearing capacity obtained from the existing steel fiber reinforced concrete specifications is generally safe, and the actual bearing capacity of the segments is often larger (see Figure 18). To better evaluate the ultimate bearing capacity of segments, it is necessary to revise the existing formulas.
Firstly, it is reasonable to use the notched beam test to determine the equivalent tensile strength of steel fiber. However, the existing formula fftuk = fR3k/3 in the specification is not accurate enough, as fR3 cannot accurately represent the equivalent tensile strength. When the crack width of concrete does not reach 2.50 mm, the tensile strength of the steel fiber is often greater than fR3. To better evaluate the equivalent tensile strength of steel fiber, Wang [29] proposed a calculating method for fftuk. In the notched beam test, when the CMOD reaches 2.50 mm, the crack height has often almost penetrated the entire section, which means that the entire section is under tension. Wang simplified the compressive stress as a concentrated force at the upper edge of the section, and according to the assumption of a plane section, the crack width at the lower edge of the section is assumed to be 2.50 mm, and the crack width increases linearly from top to bottom along the section. According to the results of the notched beam test, the tensile strength of the steel fiber corresponding to a crack width of 0.50 mm and 1.50 mm is fR1 and fR2, respectively. Wang equated tensile stress to a triangular distribution, but according to the Model Code 2010 and experimental observations, the tensile stress of the section should be equivalent to a rectangular distribution at ULS. The actual stress distribution of the section is shown in Figure 19. By balancing the bending moment at the top of the beam, Equations (23) and (24) can be obtained.
M = 1 75   f R 1 b h 2 + 36 75   f R 2 b h 2 + 2 75   f R 3 b h 2 = 1 2   f f t u b h 2
f f t u = 4 25   f R 1 + 12 25   f R 2 + 26 75   f R 3
However, the assumption that compressive stress is concentrated at one point is more idealized. The actual compressive stress will generate a bending moment effect on the top of the structure, which will lead to a decrease in the equivalent tensile strength of the steel fiber. Based on the comprehensive experimental results, the final formula for calculating the equivalent tensile strength of the steel fiber is obtained below.
f f t u k = 0.8 × ( 4 25   f R 1 k + 12 25   f R 2 k + 26 75   f R 3 k )
By calculating Equation (25), the equivalent tensile strength of SFRCS can be obtained to be 4.31 MPa, which is a significant improvement from the original formula of 1.50 MPa. At the same time, the reduction coefficient of compressive strength a1 is set as 0.6, and the height reduction coefficient of the compression zone β1 is set as 0.8. The theoretical bearing capacity of SFRCS in this experiment was calculated using the modified formula, as shown in Figure 20.
As shown in Figure 20, except for SFRCS-1 with initial crack damage, the revised theoretical bearing capacity is closer to the experimental bearing capacity compared to the Model Code 2010. The error rate between the revised bending moment bearing capacity of SFRCS-2 and SFRCS-5 and the experimental bearing capacity is even within 0.2%, which further reflects the rationality of the modified model. In addition, the revised theoretical bearing capacity of SFRCS-3 is 454.41 kN·m, with an error rate of 4.9% compared to the actual bearing capacity, while the error rate of Model Code 2010 is 14.7%. After revision, the error rate between the theoretical bearing capacity and the actual bearing capacity has been significantly reduced. The revised theoretical bearing capacity of SFRCS-4 is 466.76 kN·m, with an error rate of 13.2% compared to the experimental bearing capacity, while the error rate of Model Code 2010 is 19.0%. The main reason for the error of this segment being greater than 10.0% is that its initial eccentricity is small, which delays the cracking of the segment, resulting in a higher bearing capacity of the segment. Based on the comparison results of the five segments, it can be concluded that the revised bearing capacity calculation method is more accurate in predicting the true bearing capacity of USFRC segments compared to previous specifications.
To better evaluate the applicability of the revised method, the test results of the five segments are relatively limited in terms of segment size, fiber content, and test eccentricity. Therefore, three additional segment compression-bending tests were conducted with different sizes, fiber contents, and test eccentricities. The information on the segment size, mix ratio, and fiber content is provided in Section 2.1 and Section 2.2, and the results for cubes and notched beams are shown in Table 3 and Table 5. These three segments have increased test eccentricity to explore the applicability of USFRC segments and the rationality of the revised calculation formulas under large eccentricity conditions. The test results are shown in the Table 10 below.
As shown in Figure 21, the revised theoretical bearing capacity is closer to the experimental bearing capacity compared to the Model Code 2010. The error rate between the revised bending moment bearing capacity of SFRCS-A2 and SFRCS-A3 and the experimental bearing capacity is even within 0.5%, which further reflects the rationality of the modified model. In addition, the revised theoretical bearing capacity of SFRCS-A1 is 281.86 kN·m, with an error rate of 3.5% compared to the actual bearing capacity, while the error rate of Model Code 2010 is 25.7%. All the error rates of the Model Code are between 24% to 26%, which is greater than the results of five SFRCS segments, indicating that when the eccentricity is too large, the calculation error of the Model Code will increase. After revision, the error rate between the theoretical bearing capacity and the actual bearing capacity has been significantly reduced. Based on the comparison results of the eight segments, it can be concluded that the revised bearing capacity calculation method is more accurate in predicting the true bearing capacity of USFRC segments compared to previous specifications. The modified formulas can better reflect the true compression-bending capacity of USFRC, providing a theoretical basis for practical engineering design.

5. Conclusions and Future Work

Based on the above investigations, the following conclusions can be drawn.
(1) With the same mix proportion, the compressive strength of the concrete is slightly improved by steel fibers. The average compressive strength of the SFRC40 specimens was 64.9 MPa, which was an increase of 15.48%. Meanwhile, the SFRC30-A specimens with a different mix proportion had an average compressive strength of 68.2 MPa, which was 5.08% higher than that of the SFRC40 specimens.
(2) The residual tensile strength of the USFRC in different development stages of crack width is in the order of fR2, fR3, fR1, and fR4. With the increase of crack width, the residual tensile strength first increases and then decreases, indicating that the equivalent tensile strength of steel fibers when the crack width is 2.50 mm is not the maximum.
(3) The bending moment required for a certain crack width under a certain eccentricity in the linear development stage can be predicted by Equation (5). The variation of deflection with the bending moment can be fitted with a quadratic function. When the load is small, the deflection roughly varies linearly with the bending moment. As the bending moment increases, plastic non-linear deflection of concrete appears.
(4) In the compression-bending test of the USFRC segment, the maximum bending moment does not occur at the mid-span position. The axial force in the section of the loading point is the smallest, and the bending moment is the largest, which is the most unfavorable position for cracking. The main cracks of all segments occur at the section of the loading point. The average bending moment at the loading point of each segment is 144.43% of the bending moment at the mid-span.
(5) The calculation of the equivalent tensile strength of steel fiber in Model Code 2010 is not accurate enough. A new calculation method is proposed, and the compression-bending capacity calculation model is revised accordingly. The results of the revised model are closer to the actual capacity of USFRC and can accurately predict the ultimate capacity of USFRC under compression-bending load.
Finally, the revised calculation method for the compression-bending capacity of a USFRC segment is obtained. In future studies, more segments with different sizes, strengths, mix proportions, fiber contents, and loading paths should be conducted to further refine the USFRC calculation model. Meanwhile, a sophisticated USFRC numerical model should be established to reduce testing costs while increasing accuracy and repeatability. During the transportation and construction of shield tunnel segments, it is important to take precautions to prevent early cracking, as it was found in this study that premature cracking can significantly affect the ultimate performance of the segments, even if the initial crack width is less than 0.10 mm.

Author Contributions

Conceptualization, Z.W. and H.X.; Methodology, C.G. and L.W.; Software, X.R., Z.F. and Y.Y.; Validation, Y.W.; Formal analysis, Y.H.; Investigation, J.L. All authors have read and agreed to the published version of the manuscript.

Funding

This work was supported by the Sichuan Natural Science Foundation Youth Fund (Grant No. 2024NSFSC0935), Regional Science and Technology Collaborative Innovation Project of the Science and Technology Department of Xizang (Grant No. QYXTZX-RKZ2023-02), and the Shigatse Municipal Science and Technology Plan Project: Research on Directional Design of Anti-freeze, Crack-resistant, Low Rebound Sprayed Concrete Considering Xizang Area Environment and Actual Proportioning, Open Fund of Sichuan Engineering Research Center for Mechanical Properties and Engineering Technology of Unsaturated Soils (No. SC-FBHT2022-06), Sichuan Science and Technology Program (No. 2025YFHZ0321).

Data Availability Statement

The original contributions presented in the study are included in the article, further inquiries can be directed to the corresponding author.

Conflicts of Interest

The authors declare that they have no known competing financial interests or personal relationships that could have appeared to influence the work reported in this paper.

References

  1. Zhu, H.T.; Li, C.C.; Gao, D.Y.; Yang, L.; Cheng, S.Z. Study on mechanical properties and strength relation between cube and cylinder specimens of steel fiber reinforced concrete. Adv. Mech. Eng. 2019, 11, 1687814019842423. [Google Scholar] [CrossRef]
  2. Cao, Q.; Gao, Q.Q.; Jia, J.Q.; Gao, R.X. Early-Age Cracking Resistance of Fiber-Reinforced Expansive Self-Consolidating Concrete. ACI Mater. J. 2019, 116, 15–26. [Google Scholar] [CrossRef]
  3. Bolat, H.; Simsek, O. Evaluation of Energy Absorption of Macro Synthetic and Steel Fiber Reinforced Concretes. Rev. Rom. Mater. 2015, 45, 123–132. [Google Scholar]
  4. Nili, M.; Afroughsabet, V. Combined effect of silica fume and steel fibers on the impact resistance and mechanical properties of concrete. Int. J. Impact Eng. 2010, 37, 879–886. [Google Scholar] [CrossRef]
  5. Xu, S.L.; Lyu, Y.; Xu, S.J.; Li, Q.H. Enhancing the initial cracking fracture toughness of steel-polyvinyl alcohol hybrid fibers ultra high toughness cementitious composites by incorporating multi-walled carbon nanotubes. Constr. Build. Mater. 2019, 195, 269–282. [Google Scholar] [CrossRef]
  6. Tan, K.H.; Paramasivam, P.; Tan, K.C. Cracking characteristics of reinforced steel fiber concrete beams under short-and long-term loadings. Adv. Cem. Based Mater. 1995, 2, 127–137. [Google Scholar] [CrossRef]
  7. Naaman, A.E.; Argon, A.S.; Moavenzadeh, F. A fracture model for fiber reinforced cementitious materials. Cem. Concr. Res. 1973, 3, 397–411. [Google Scholar] [CrossRef]
  8. Olivito, R.S.; Zuccarello, F.A. An experimental study on the tensile strength of steel fiber reinforced concrete. Compos. Part B-Eng. 2010, 41, 246–255. [Google Scholar] [CrossRef]
  9. Thomas, J.; Ramaswamy, A. Mechanical properties of steel fiber-reinforced concrete. J. Mater. Civ. Eng. 2007, 19, 385–392. [Google Scholar] [CrossRef]
  10. Sloma, S.F. Influence of Hooked-end Steel Fibers on Fresh and Hardened Properties of Steel Fiber Reinforcement Self-Compacting Concrete(SFRSCC). J. Phys. Conf. Ser. 2019, 1198, 032005. [Google Scholar] [CrossRef]
  11. Fuente, A.D.L.; Pujadas, P.; Blanco, A.; Aguado, A. Experiences in Barcelona with the use of fibres in segmental linings. Tunn. Undergr. Space Technol. 2012, 27, 60–71. [Google Scholar] [CrossRef]
  12. Qi, M.S.; Liu, X. A Full-scale Experimental Study on Bearing Capacity of Fiber Reinforced Concrete Segments. Tunn. Undergr. Space Technol. 2019, 15 (Suppl. S1), 55–60. [Google Scholar]
  13. Liu, X.; Sun, Q.H.; Jiang, H.; Bao, H.L. Experimental Research and Theoretical Analysis of Mechanical Behaviors of Fiber Reinforced Concrete Segments. Mod. Tunn. Technol. 2018, 55 (Suppl. S2), 1080–1090. [Google Scholar] [CrossRef]
  14. Liu, X.; Sun, Q.; Yuan, Y.; Taerwe, L. Comparison of the structural behavior of reinforced concrete tunnel segments with steel fiber and synthetic fiber addition. Tunn. Undergr. Space Technol. 2020, 103, 103506. [Google Scholar] [CrossRef]
  15. Xu, H.Y.; Wang, Z.J.; Zhou, P.; Li, Z.Y.; Xu, J.X.; Tang, L.; Li, R.Y. Eccentric compression model test of steel fiber reinforced concrete lining segments. J. Build. Struct. 2018, 39 (Suppl. S2), 290–298. [Google Scholar] [CrossRef]
  16. Oh, B.H. Flexural Analysis of Reinforced Concrete Beams Containing Steel Fibers. J. Struct. Eng. 1991, 118, 2821–2835. [Google Scholar] [CrossRef]
  17. Yang, I.H.; Joh, C.; Kim, B.S. Structural behavior of ultra high performance concrete beams subjected to bending. Eng. Struct. 2010, 32, 3478–3487. [Google Scholar] [CrossRef]
  18. Mertol, H.C.; Baran, E.; Bello, H.J. Flexural behavior of lightly and heavily reinforced steel fiber concrete beams. Constr. Build. Mater. 2015, 98, 185–193. [Google Scholar] [CrossRef]
  19. Yoo, D.Y.; Yoon, Y.S. Structural performance of ultra-high-performance concrete beams with different steel fibers. Eng. Struct. 2015, 102, 409–423. [Google Scholar] [CrossRef]
  20. Biolzi, L.; Cattaneo, S. Response of steel fiber reinforced high strength concrete beams: Experiments and code predictions. Cem. Concr. Comp. 2017, 77, 1–13. [Google Scholar] [CrossRef]
  21. Yang, J.M.; Min, K.H.; Shin, H.O.; Yoon, Y.S. Effect of steel and synthetic fibers on flexural behavior of high-strength concrete beams reinforced with FRP bars. Compos. Part B-Eng. 2012, 43, 1077–1086. [Google Scholar] [CrossRef]
  22. Lin, L.; Fuente, A.D.L. Design of FRC tunnel segments considering the ductility requirements of the Model Code 2010. Tunn. Undergr. Space Technol. 2015, 47, 200–210. [Google Scholar] [CrossRef]
  23. Issa, M.S.; Metwally, I.M.; Elzeiny, S.M. Influence of fibers on flexural behavior and ductility of concrete beams reinforced with GFRP rebars. Eng. Struct. 2011, 33, 1754–1763. [Google Scholar] [CrossRef]
  24. ACI 440.1R-15; Guide for the Design and Construction of Structural Concrete Reinforced with Fiber-Reinforced Polymer (FRP) Bars. American Concrete Institute: Farmington Hills, MI, USA, 2015.
  25. DB21/T 3165-2019; Technical Specification for Precast Steel Fiber Reinforced Concrete Segments. Liaoning Provincial Administration for Market Regulation: Shenyang, China, 2019.
  26. CECS 13:2009; Standard Test Methods for Fiber Reinforced Concrete. China Association for Engineering Construction Standardization: Beijing, China, 2009.
  27. EN 14651:2005; Test Method for Metallic Fibre Concrete—Measuring the Flexural Tensile Strength (Limit of Proportionality (LOP), Residual). European Committee for Standardization (CEN): Brussels, Belgium, 2005.
  28. fib Bulletin 83:2017; Precast Tunnel Segments in Fibre Reinforced Concrete. International Federation for Structural Concrete (FIB): Lausanne, Switzerland, 2017.
  29. Wang, J.W. Study on Ultimate Limit State Design Method of Steel Fiber Reinforced Concrete Segment. Master’s Thesis, Southwest Jiaotong University, Chengdu, China, 2021. [Google Scholar]
Figure 1. The casting and curing process of specimens.
Buildings 15 01160 g001
Figure 2. The test machine for the cube compressive strength test.
Buildings 15 01160 g002
Figure 3. The test method of the notched beam test.
Buildings 15 01160 g003
Figure 4. The test devices of the compression-bending test. 1—gantry, 2—horizontal reaction beam, 3—steel strand, 4—distribution beam, 5—upper fulcrum, 6—jack, 9—force sensor, 10—polyethylene pad, 13—rotating hinge support, 14—segment.
Buildings 15 01160 g004
Figure 5. The failure modes of PC and USFRC specimens.
Buildings 15 01160 g005
Figure 6. The average cube compressive strength of PC and USFRC.
Buildings 15 01160 g006
Figure 7. The load–CMOD curve of the notched beam test.
Buildings 15 01160 g007
Figure 8. The tensile cracks at different locations of USFRC segments.
Buildings 15 01160 g008
Figure 9. The load–crack width curve of the compression-bending test.
Buildings 15 01160 g009
Figure 10. The fitting curves of crack width with the bending moment.
Buildings 15 01160 g010
Figure 11. The load–deflection curves and loading paths.
Buildings 15 01160 g011
Figure 12. The fitting curve of deflection with the bending moment.
Buildings 15 01160 g012
Figure 13. Analysis model of force on a segment section.
Buildings 15 01160 g013
Figure 14. The distribution diagram of axial force in each segment.
Buildings 15 01160 g014
Figure 15. The distribution diagram of the shear force in each segment.
Buildings 15 01160 g015
Figure 16. The distribution diagram of bending moment in each segment.
Buildings 15 01160 g016
Figure 17. Calculation diagram for an eccentric compressive normal section of USFRC.
Buildings 15 01160 g017
Figure 18. Fitting curve of the bending moment with axial force.
Buildings 15 01160 g018
Figure 19. The tensile stress distribution of the USFRC notched beam.
Buildings 15 01160 g019
Figure 20. The theoretical and actual compression-bending capacity of USFRC.
Buildings 15 01160 g020
Figure 21. The theoretical and actual compression-bending capacity of USFRC-A.
Buildings 15 01160 g021
Table 1. The mix proportions of PC and SFRC with different fiber contents.
IdentifierSF/
kg
Fly Ash/
kg
Fine Aggregate/kgCoarse Aggregate/kgWater Reducer/
kg
Water/kgCement/
kg
5.0–10.0/mm10.0–20.0/mm
PCC-107069045267811.00165380
PCC-207069045267811.00165380
PCC-307069045267811.00165380
PCC-407069045267811.00165380
PCC-507069045267811.00165380
PCC-607069045267811.00165380
SFRCC-1407069045267811.00165380
SFRCC-2407069045267811.00165380
SFRCC-3407069045267811.00165380
SFRCC-4407069045267811.00165380
SFRCC-5407069045267811.00165380
SFRCC-6407069045267811.00165380
SFRCC-7407069045267811.00165380
SFRCC-8407069045267811.00165380
SFRCC-9407069045267811.00165380
SFRCC-10407069045267811.00165380
SFRCC-11407069045267811.00165380
SFRCC-12407069045267811.00165380
SFRCC-A130706393305867.50150400
SFRCC-A230706393305867.50150400
SFRCC-A330706393305867.50150400
SFRCC-A430706393305867.50150400
SFRCC-A530706393305867.50150400
SFRCC-A630706393305867.50150400
SFRCC-A730706393305867.50150400
SFRCC-A830706393305867.50150400
SFRCQ-1407069045267811.00165380
SFRCQ-2407069045267811.00165380
SFRCQ-3407069045267811.00165380
SFRCQ-4407069045267811.00165380
SFRCQ-5407069045267811.00165380
SFRCQ-6407069045267811.00165380
SFRCQ-7407069045267811.00165380
SFRCQ-8407069045267811.00165380
SFRCQ-9407069045267811.00165380
SFRCQ-10407069045267811.00165380
SFRCQ-11407069045267811.00165380
SFRCQ-12407069045267811.00165380
SFRCQ-A130706393305867.50150400
SFRCQ-A230706393305867.50150400
SFRCQ-A330706393305867.50150400
SFRCQ-A430706393305867.50150400
SFRCQ-A530706393305867.50150400
SFRCQ-A630706393305867.50150400
SFRCQ-A730706393305867.50150400
SFRCQ-A830706393305867.50150400
SFRCQ-A930706393305867.50150400
SFRCQ-A1030706393305867.50150400
SFRCQ-A1130706393305867.50150400
SFRCQ-A1230706393305867.50150400
SFRCS-1407069045267811.00165380
SFRCS-2407069045267811.00165380
SFRCS-3407069045267811.00165380
SFRCS-4407069045267811.00165380
SFRCS-5407069045267811.00165380
SFRCS-A130706393305867.50150400
SFRCS-A230706393305867.50150400
SFRCS-A330706393305867.50150400
Table 2. The size of different USFRC segments. t is the thickness of the segment (mm), ri is the inner diameter (mm), re is the outer diameter (mm), w is the width of the segment (mm), and a is the radian of the segment (°).
Identifiert (mm)ri (mm)re (mm)w (mm)a (°)
SFRCS-135027003100120067.5
SFRCS-235027003100120067.5
SFRCS-335027003100120067.5
SFRCS-435027003100120067.5
SFRCS-535027003100120067.5
SFRCS-A135029503300150072.0
SFRCS-A235029503300150072.0
SFRCS-A335029503300150072.0
Table 3. The results of the cube compressive strength test.
IdentifierFiberContent (kg/m3)Curing Daysfcc (MPa)fcu,m (MPa)
PCC-1Plain04055.156.2
PCC-2Plain04056.5
PCC-3Plain04055.3
PCC-4Plain04056.6
PCC-5Plain04057.4
PCC-6Plain04056.4
SFRCC-1Dramix 4D 80/60BG404065.964.9
SFRCC-2Dramix 4D 80/60BG404062.0
SFRCC-3Dramix 4D 80/60BG404060.2
SFRCC-4Dramix 4D 80/60BG404064.0
SFRCC-5Dramix 4D 80/60BG404065.3
SFRCC-6Dramix 4D 80/60BG404065.0
SFRCC-7Dramix 4D 80/60BG404067.7
SFRCC-8Dramix 4D 80/60BG404068.8
SFRCC-9Dramix 4D 80/60BG404065.6
SFRCC-10Dramix 4D 80/60BG404065.7
SFRCC-11Dramix 4D 80/60BG404064.7
SFRCC-12Dramix 4D 80/60BG404063.8
SFRCC-A1Dramix 4D 80/60BG303969.368.2
SFRCC-A2Dramix 4D 80/60BG303969.4
SFRCC-A3Dramix 4D 80/60BG303965.0
SFRCC-A4Dramix 4D 80/60BG303967.3
SFRCC-A5Dramix 4D 80/60BG303969.8
SFRCC-A6Dramix 4D 80/60BG303969.0
SFRCC-A7Dramix 4D 80/60BG303967.9
SFRCC-A8Dramix 4D 80/60BG303967.5
Table 4. The flexural strength of SFRC beams.
BeamFl
(mm)
fL
(N/mm2)
fR1
(N/mm2)
fR2
(N/mm2)
fR3
(N/mm2)
fR4
(N/mm2)
Deflection 0.47 mm1.32 mm2.17 mm3.02 mm
SFRCQ-10.065.615.427.005.793.51
SFRCQ-20.065.436.478.897.255.59
SFRCQ-30.065.676.568.348.066.23
SFRCQ-40.066.106.107.888.285.81
SFRCQ-50.075.847.119.638.666.03
SFRCQ-60.066.436.618.407.326.14
SFRCQ-70.065.905.607.206.355.10
SFRCQ-80.046.126.078.348.295.86
SFRCQ-90.065.665.226.745.243.56
SFRCQ-100.055.995.767.665.744.44
SFRCQ-110.056.366.477.936.333.56
SFRCQ-120.065.866.237.715.864.22
Average0.065.916.147.986.935.00
S.D.0.010.300.550.811.191.08
C.V.13.115.129.0210.2017.1921.65
fRjk--5.016.314.492.78
fR3k/fR1k0.90
Table 5. The flexural strength of SFRC-A beams.
BeamFl
(mm)
fL
(N/mm2)
fR1
(N/mm2)
fR2
(N/mm2)
fR3
(N/mm2)
fR4
(N/mm2)
Deflection 0.47 mm1.32 mm2.17 mm3.02 mm
SFRCQ-A10.065.184.496.136.896.15
SFRCQ-A20.065.063.404.453.842.86
SFRCQ-A30.065.313.915.114.964.59
SFRCQ-A40.064.632.453.544.094.00
SFRCQ-A50.055.313.755.475.535.26
SFRCQ-A60.064.912.483.173.323.06
SFRCQ-A70.064.563.574.834.984.11
SFRCQ-A80.065.925.317.376.615.60
SFRCQ-A90.064.694.115.956.044.59
SFRCQ-A100.065.155.367.487.565.81
SFRCQ-A110.064.994.825.805.524.45
SFRCQ-A120.065.103.935.445.715.21
Average0.065.073.975.405.424.64
fRjk--2.042.722.822.53
fR3k/fR1k1.38
Table 6. The values of the quantile coefficient ks with the number of specimens.
Number of Specimens6912152025100
ks2.3362.1412.0481.9911.9321.8951.7601.645
Table 7. The distribution of axial force in each segment. The OSLP refers to the outer side of the loading point, while ISLP refers to the inner side of the loading point.
IdentifierAxial Force (kN)
SupportOSLPISLPMid-Span
SFRCS-12954.252766.262431.632486.83
SFRCS-22300.172146.781883.901926.37
SFRCS-32550.422392.112105.782153.40
SFRCS-42645.172477.702178.972228.30
SFRCS-52384.632242.271977.582022.22
Table 8. The distribution of shear force in each segment.
IdentifierShear Force (kN)
SupportOSLPISLPMid-Span
SFRCS-1−71.05797.76−422.620
SFRCS-2−59.04869.73−450.420
SFRCS-3−52.05910.78−466.300
SFRCS-4−54.821021.74−521.100
SFRCS-5−24.93809.70−402.300
Table 9. The ultimate strength of USFRC segments at ULS.
IdentifierTest Value
N (kN)/M (kN·m)
e
(m)
Model Code
(kN·m)
SFRCS-11977.58/404.240.204383.73
SFRCS-22105.78/450.910.214398.87
SFRCS-32178.97/477.710.219407.36
SFRCS-42431.63/537.710.221435.78
SFRCS-51883.90/436.500.232372.44
Table 10. The test results of SFRCS-A segments.
IdentifierHorizontal Load S
(kN)
Vertical Load P
(kN)
Axial Force N
(kN)
Bending Moment M
(kN·m)
e
(m)
SFRCS-A1762.70521.15750.38272.210.363
SFRCS-A2947.08628.55931.09304.250.327
SFRCS-A3992.85655.05975.75312.020.320
Disclaimer/Publisher’s Note: The statements, opinions and data contained in all publications are solely those of the individual author(s) and contributor(s) and not of MDPI and/or the editor(s). MDPI and/or the editor(s) disclaim responsibility for any injury to people or property resulting from any ideas, methods, instructions or products referred to in the content.

