1. Introduction
The world is witnessing an increased demand for energy, with a 1.3% growth observed in 2022. Fossil fuels comprise about 80% of the energy supply [
1]. A significant proportion of this energy is utilized by air conditioning [
2], as many designs on both urban and building levels suffer from a lack of adaptation strategies to deal with thermally uncomfortable periods in interior and exterior space. As a result, about five billion people live where space conditioning is required to maintain comfortable conditions. This figure is expected to increase to seven billion by 2050 [
3].
Integrating passive design techniques has gained increasing significance in pursuing ecological responsibility and energy efficiency in building practices [
4]. Passive design is a sustainable approach to architectural solutions that prioritizes energy efficiency by utilizing natural components and climatic conditions to lessen reliance on mechanical heating and cooling systems. In contrast to active systems, which rely on external energy sources, passive design capitalizes on the building’s inherent characteristics, surroundings, and environment for energy conservation and emphasizes creating comfortable living spaces.
Trombe Wall (TW) is a passive design technique that can significantly improve thermal efficiency and reduce energy consumption in buildings [
5]. It can potentially reduce the energy required for heating in buildings and, if used efficiently, can also impact performance during the summer [
6]. This offers a cost-effective and environmentally friendly solution to utilize solar power for natural ventilation during the summer, resulting in reduced indoor temperatures [
7]. Usually, TW consists of a glazing unit, an air gap, and a concrete wall. The concrete wall is positioned to face the south and features adjustable upper and lower openings to accommodate seasonal fluctuations. The internal mass of the wall is used to absorb and preserve solar heat [
8].
The majority of research on TW has focused on improving their heating efficiency [
9,
10], demonstrating their significant potential to reduce heating energy consumption by up to 71.7% [
6]. However, the performance of TW systems in regions with hot summers poses notable challenges. This limitation has driven researchers to investigate strategies to enhance their cooling performance to make TW systems more versatile and practical in diverse climatic conditions. TW can harness solar radiation to enhance natural ventilation during summertime, lowering inside temperatures [
7]. Efforts to enhance the TW’s summer performance focus on improving ventilation efficiency and adopting advanced methods to control heat absorption and transfer. One of these efforts tried to solve the overheating problem in the summer using external shading [
11]. Another study achieved a 73% reduction in cooling demand by adding insulation and shutters and changing the color of the massive wall [
12]. Others benefited from glazing properties to regulate solar radiation by using low-emissivity (low-e) glazing [
13] and double glazing [
14]. Also, integrated PCM (phase change material), evaporative cooling [
6], and controlling vents opening strategies [
15] could lead to a significant reduction in cooling energy during the summer. Still, TW’s summer performance and potential development as a cooling technology require further investigation.
TW research has explored various types and innovations, including shape modifications such as the classic TW, zigzag-TW, and water-TW [
16], as well as integrations like PCM-TW [
17], photovoltaic (PV)-TW [
18], and photocatalytic-thermal-catalytic TW [
19]. These studies encompassed a range of methodologies, including simulation models [
20], scaled-down prototypes [
21], and full-scale rooms with actual dimensions [
9]. However, these studies have focused primarily on their application in individual rooms. This narrow approach neglects the potential for TW systems to support multiple interconnected spaces, particularly in multi-story configurations. As a result, their applicability in more complex architectural layouts remains underexplored, limiting their broader utilization in contemporary building designs.
To maximize the efficiency of TWs and achieve optimal energy savings and occupant comfort, optimizing design parameters and control strategies is crucial [
22]. Numerous studies have explored the optimization of TW systems through design parameters, including TW dimensions and configurations [
23,
24], the massive wall properties [
25,
26], glazing types [
27], and ventilation mechanisms through vents [
28] and the air gap [
29]. Most of these studies employed parametric optimization techniques, focusing on a single design variable with limited scenarios. Few investigations have simultaneously analyzed multiple design parameters to capture their relationships, highlighting a significant gap in comprehensive TW optimization research.
Based on previous studies’ findings, TW systems’ performance efficiency is influenced by several design parameters. These parameters include TW proportions, air gap dimensions, glazing types, massive wall properties, vents, and their operational scenarios. However, most of these studies focus on examining and enhancing individual parameters independently (i.e., one factor at a time) without considering their interrelationships. Moreover, research efforts have predominantly concentrated on enhancing the heating efficiency of TWs despite the challenges associated with their application in regions characterized by hot summers.
Additionally, existing research has focused mainly on evaluating the effects of TWs on single-room configurations, leaving a significant gap in the literature regarding the assessment and optimization of a multi-story TW system. Addressing this gap represents a valuable opportunity to expand the applicability of TW technology for more complex architectural layouts.
This study contributes by developing an optimized multi-story Trombe Wall (MTW) that functions as a hybrid system for both heating and cooling. The study objectives are: (1) evaluating the thermal and energy performance of the proposed MTW; (2) optimizing the MTW design parameters to improve energy efficiency and thermal comfort in residential buildings located in hot climate regions; and (3) developing performance prediction equations to estimate the MTW’s thermal and energy performance.
The research is structured into four distinct phases. Initially, TW design parameters’ geometric and thermal ranges and limitations were identified through a comprehensive literature review. Subsequently, a case study was selected, modeled, and validated based on field surveys and on-site measurements. Following this, a two-stage multi-objective simulation-optimization approach was conducted to identify the optimal configurations for the MTW. Finally, a multiple regression analysis was performed to develop predictive equations for the MTW’s performance.
2. Research Methodology
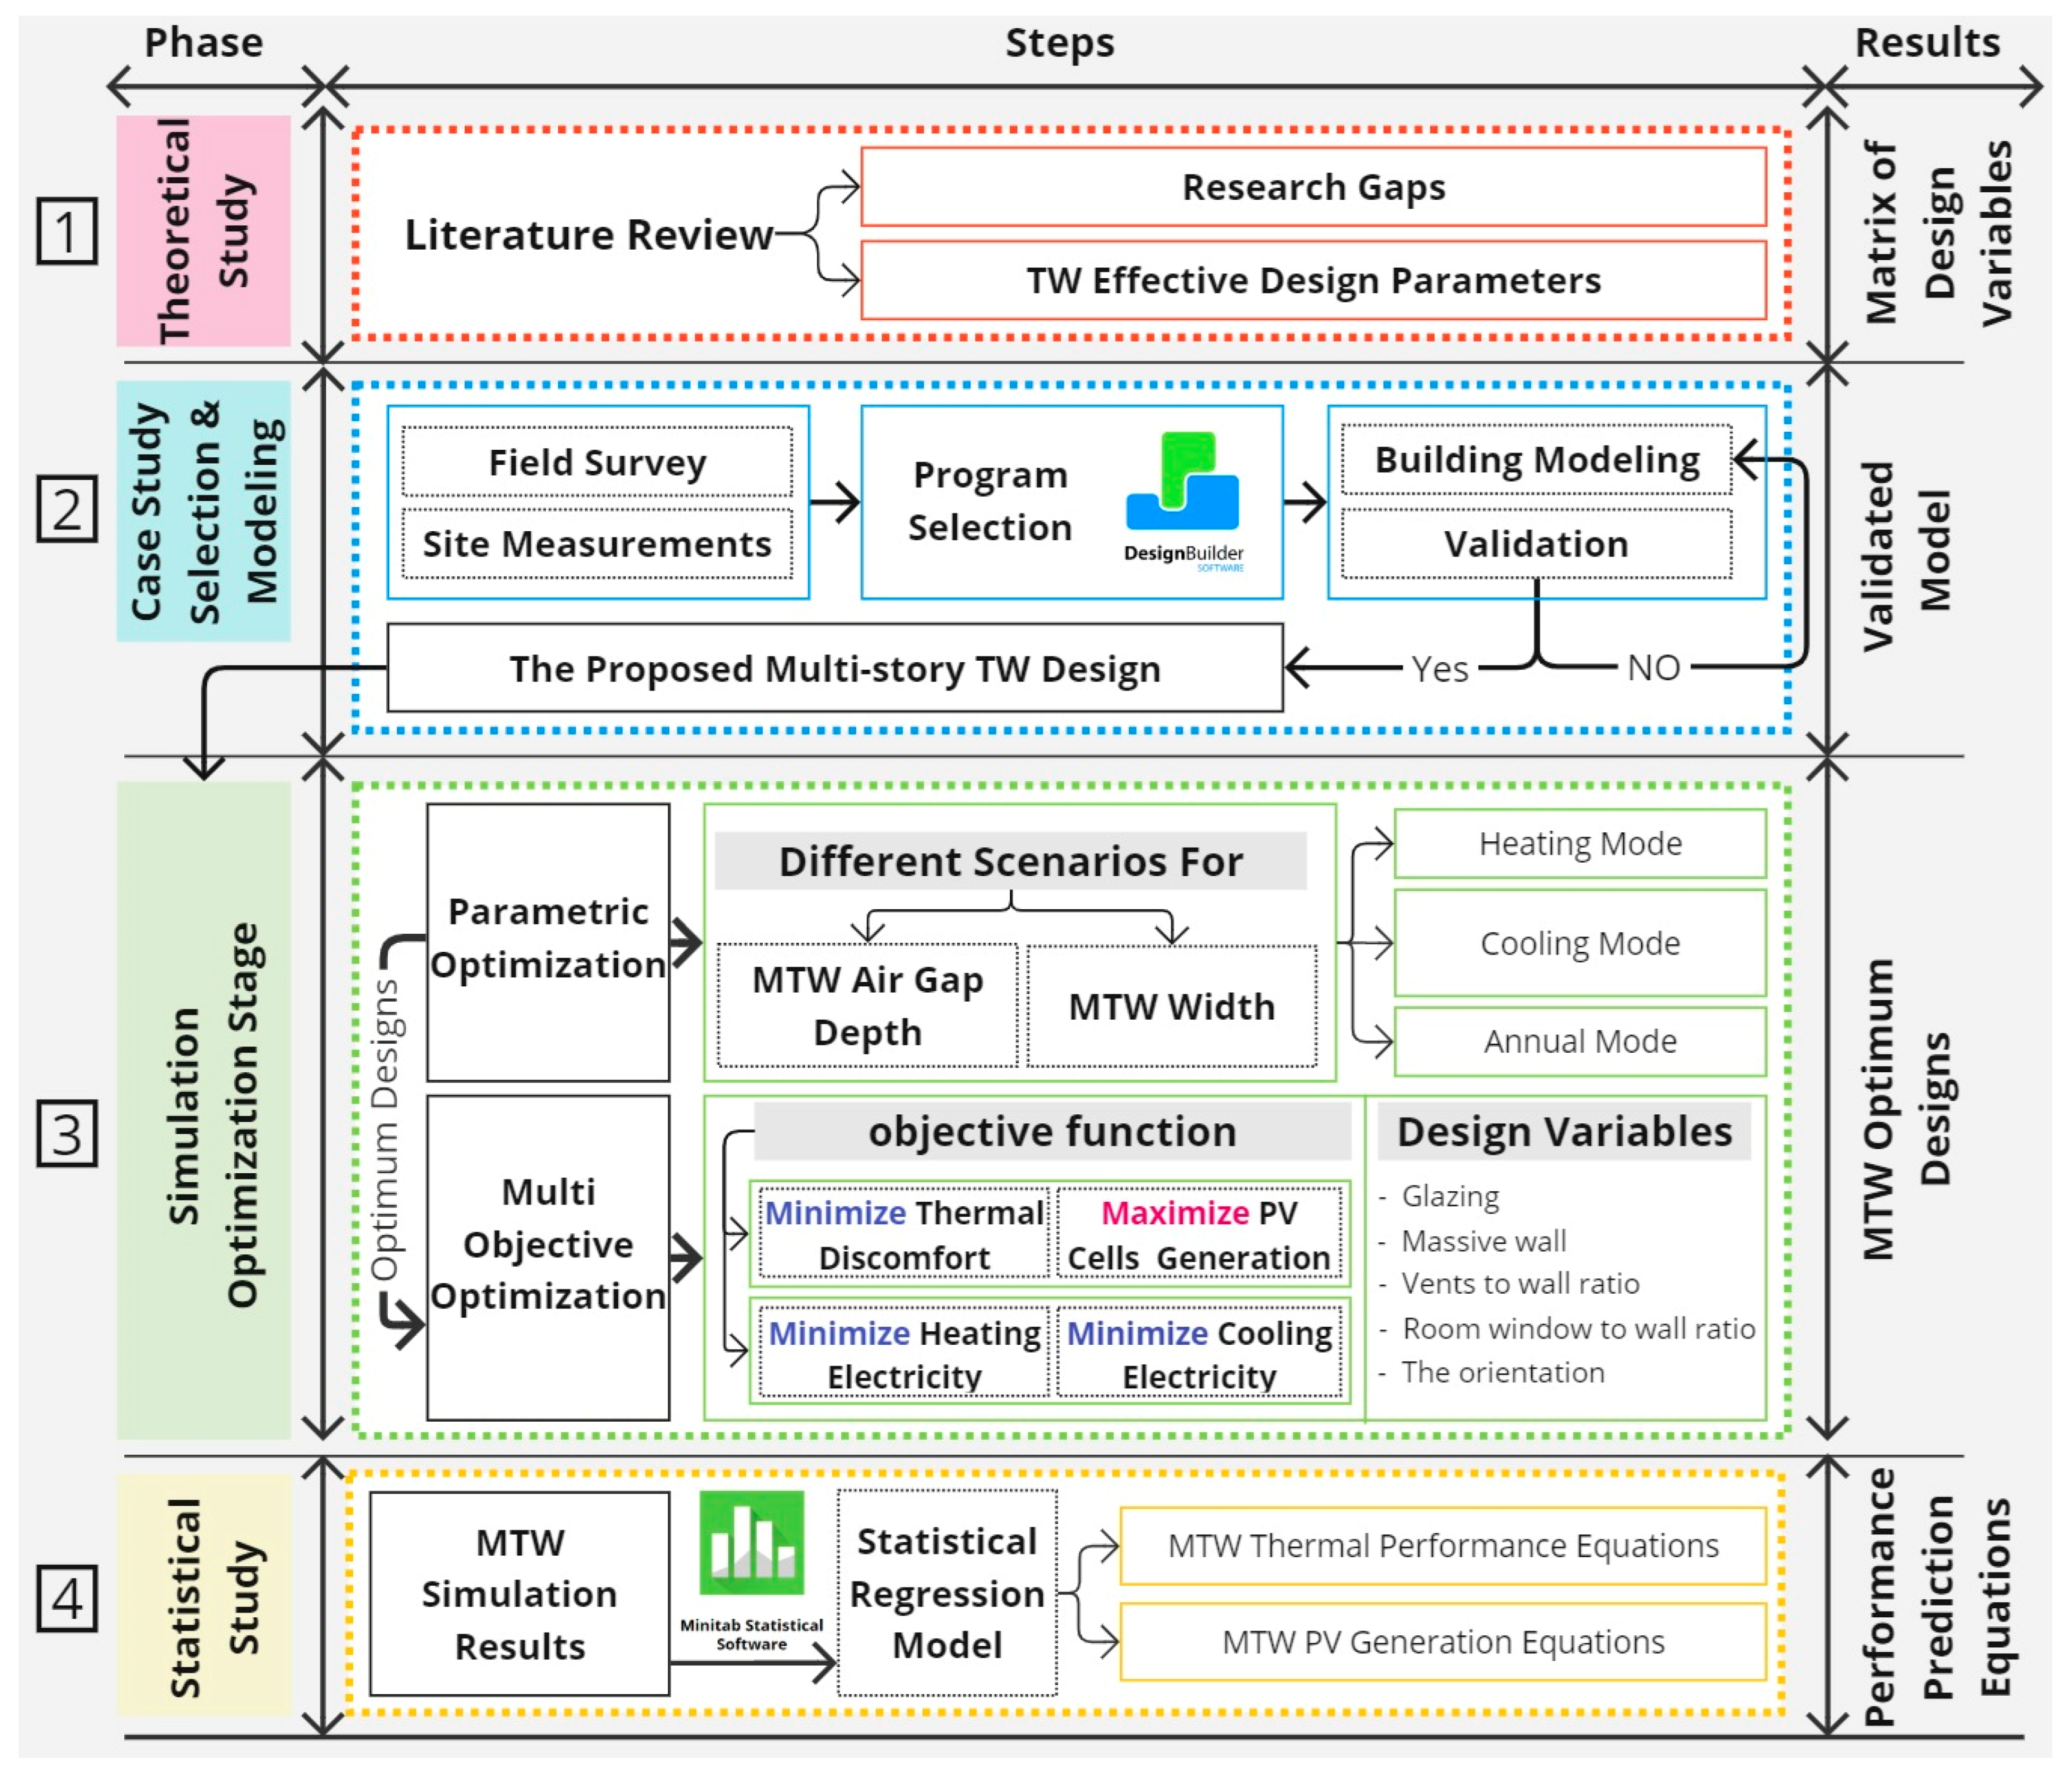
As shown in
Figure 1, the proposed methodology consists of four main phases: In the first phase, the geometrical and thermal specifications and limitations of TW design parameters were determined based on a thorough literature review. Then, field measurements, modeling, and calibration were performed for a selected case study residential building in New Burj Al Arab City, Egypt, followed by proposing an MTW design (phase two).
The first and second phases would achieve the first objective. Subsequently, a two-stage simulation-optimization approach was applied to determine the impact of seven key design parameters on the proposed MTW system performance and to identify the optimal configurations of the MTW (objective 2). In the first stage, a parametric optimization was performed to investigate the impact of the MTW width and air gap depth and find their optimum values. In the second stage, a multi-objective simulation-optimization was conducted to find the near-optimum values of five design parameters: vents-to-wall ratio, room window-to-wall ratio, the massive wall, glazing, and building orientation, to maximize both the energy and thermal performance. Finally, a multiple regression analysis was performed to develop predictive equations for MTW performance (objective 3).
2.1. Identification of TW’s Most Effective Design Parameters
Here, TW’s most influential design parameters are identified by conducting a thorough literature review. Many studies discussed the various design parameters that affect TW performance. The design of TW and its components, including the massive wall, the air gap, the air vents, and the glazing layer, significantly influences its performance [
21,
30].
TW proportions have a significant impact on thermal and airflow performance. TW width-to-height ratio affects heat transfer and airflow rate. An optimal ratio of 1:5 resulted in the highest airflow rate [
18]. Also, TW height directly influences airflow speed, where increasing the height of the TW results in an enhanced rate of air movement [
24]. The optimal thermal performance is achieved when the air gap depth-to-height ratio is 0.05 [
23], while another study determined the ratio to be 0.1 [
31]. In addition, the optimum TW-to-wall area ratio is 37% in Mediterranean regions. This ratio can save approximately 32.1% of the annual heating consumption [
32].
Numerous studies have investigated the performance of the massive wall, with particular emphasis on the influence of wall thickness and materials. These factors are directly linked to the U-value, which measures the heat transfer capability of the wall [
33]. Most of these studies discussed the influence of varying the wall thickness between 0.1 and 1 m. For instance, utilizing 0.45 m of clay brick could achieve around 20% annual savings in heating electricity in Lyon, France [
34]. In another investigation, the ideal thickness for stone was 34 cm, and for concrete, it was 32 cm; that could help to reduce heating loads by 50% [
25]. Additional research has explored the integration of advanced materials, such as thermal insulators and PCM, to enhance the thermal properties of the walls and optimize their heat absorption and storage capabilities. The maximum operating time can be achieved while integrating phase change material with a 45 cm wall thickness [
26]. Also, adding wool insulation to a gray color-painted massive wall reduces heating and cooling loads by 94% and 73%, respectively [
12].
The performance of TW is considerably influenced by the airflow dynamics within the air gap. Many factors must be considered, especially the air gap thickness [
30]. Most of the literature examined changing the air gap width between 5 and 80 cm. In a study in Kirkuk (Iraq), the massive wall has the maximum temperature at a 10 cm air gap width, while a 30 cm gap width would achieve the highest airflow rate [
20]. Also, a 10 cm air gap showed the maximum air gap temperature of 30 °C in a CFD study using empirical data [
35]. In addition, a 10 cm air gap thickness could achieve a maximum airflow rate of 120 m
3/h [
5].
The design of the vents significantly impacts TW thermal efficiency [
30]. Previous investigations examined the application of various vent ratios, starting from 2% [
36], and also altered the number of vents from an unvented condition [
37] to a configuration with eight vents [
38]. In their study, Kaya et al. examined the impact of the vent-to-wall-area ratio on TW performance for 11 different scenarios, from unvented to a 20% area ratio. Eight vents with an 8% vent-to-wall area ratio achieved the best performance [
28]. In addition, controlling TW vent opening scenarios showed a reduction in heating demand by 71.7% and cooling demand by 36.1% in a warm climate and 18.2% and 42.4% in a cold climate [
6]. Also, opening the air vent two to three hours after sunrise and closing it one hour before sunset could maximize heating efficiency [
39].
The impact of received sunlight is directly connected to the specifications, thickness, and quality of the glass, making glazing an important factor influencing TW performance [
40]. Due to its insulating properties, glass often causes substantial heat loss [
41]. A glazing with a high solar heat gain coefficient (SHGC) and low heat transfer coefficient (U-value) can improve TW heating performance [
22]. Studies have investigated the influence of various glazing types on TW efficacy, particularly glass with single and multi-layers. Argon-filled double glazing is more effective in reducing cooling energy than clear single and double glazing [
42]. At the same time, low-e glass can improve heating performance in a ventilated TW [
13]. Selecting the appropriate glazing-to-wall ratio and type could decrease the heating duration by 48.8%, leading to a 23.9% enhancement in comfort conditions [
27].
As summarized in
Table 1, the previous analysis highlights the significant influence of TW design parameters, including proportions, the massive wall, the air gap, vents, and glazing, on its performance. Selecting the optimal combination of these parameters, tailored to the specific climatic conditions, can enhance TW’s efficiency and reduce energy consumption.
The design variables of MTW were identified based on insights from previous studies. Particular consideration was given to the dimensions of the photovoltaic cell network, ensuring its integration was reflected in adjustments to the Trombe Wall’s width ratios and the air gap depth. The selection prioritized locally available building materials for the wall and glazing parameters while ensuring a broad range of variability in thermal properties, especially the U-value. Additionally, orientation was incorporated as a critical variable, given its significant influence on the timing and intensity of solar radiation incidents on the Trombe Wall.
Figure 2 displays the matrix of design variables.
2.2. Case Study Selection and Modeling
2.2.1. Location and Climatic Conditions
In this study, New Borg El Arab is selected as a case study. New Borg El Arab is located in the northwestern region of Egypt, within the Alexandria Governorate. It lies approximately 60 km southwest of Alexandria city and about 7 km from the Mediterranean coast. The city’s geographical coordinates are approximately 30°52′54″ North latitude and 29°34′40″ East longitude. According to the Köppen Climate Classification, New Borg El Arab experiences a hot desert climate (BWh). Summers are typically long, hot, and arid, while winters are cooler and rainy. The average temperature in January, the coldest month, is approximately 15 °C, while in August, the warmest month, it averages around 27.5 °C [
49].
2.2.2. Building Design and Construction
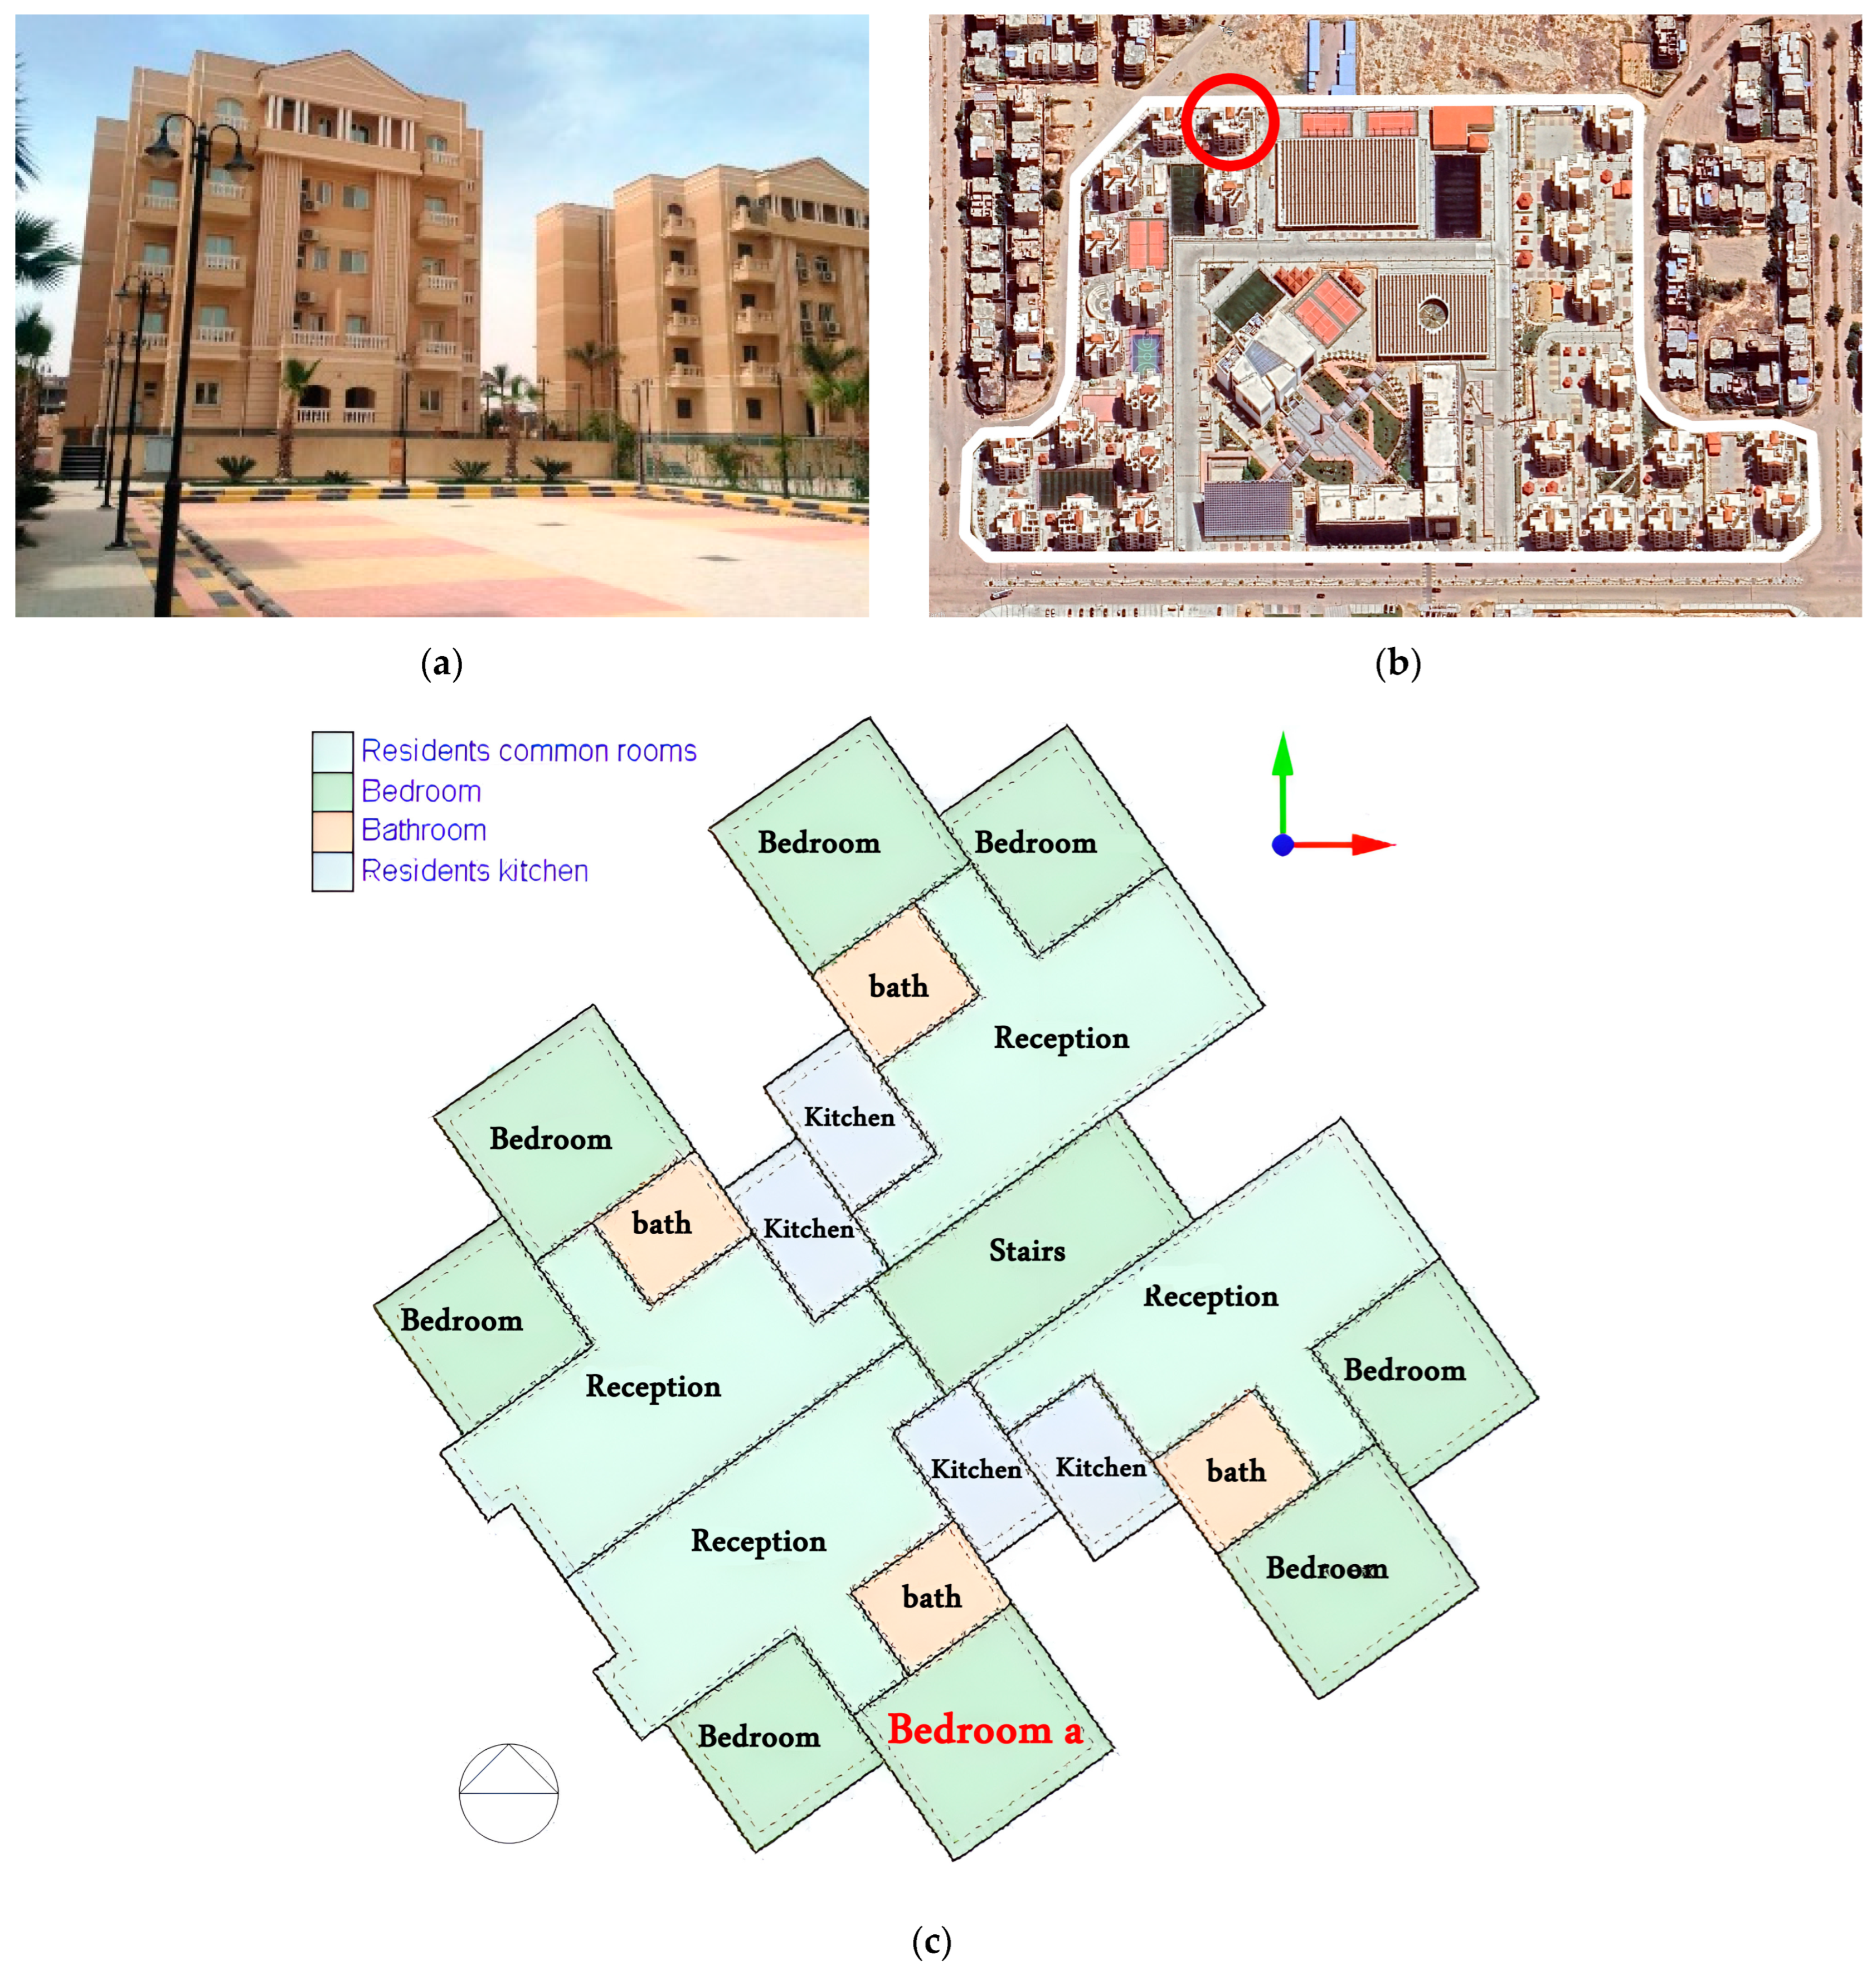
Figure 3a shows a typical residential building within the Egyptian-Japanese University’s housing complex in New Borg El Arab City. The complex comprises 28 identical detached residential buildings, organized into two groups of 14 buildings each, as shown in
Figure 3b. Each building features a ground floor and four repetitive upper floors, with a floor height of 3 m and a total floor area of 325 m
2.
Figure 3c presents the standard floor plan, which includes four residential units per floor. Each unit comprises a reception area, a kitchen, a bathroom, and two bedrooms, each with a small terrace. The building is constructed with a reinforced concrete frame structure, incorporating red brick walls for both exterior and interior partitions. Details of the building envelope’s physical components—such as walls, roofing, flooring, and glazing—were obtained from the design drawings and are summarized in
Table 2.
2.2.3. Modeling and Validation
DesignBuilder v7 was utilized for building simulation, as it is a versatile software widely recognized for simulating building designs to improve energy efficiency and occupant comfort [
47,
50]. It takes into account the impact of different parameters, including air movement, pressures, and velocity and their effects on heat transfer [
51].
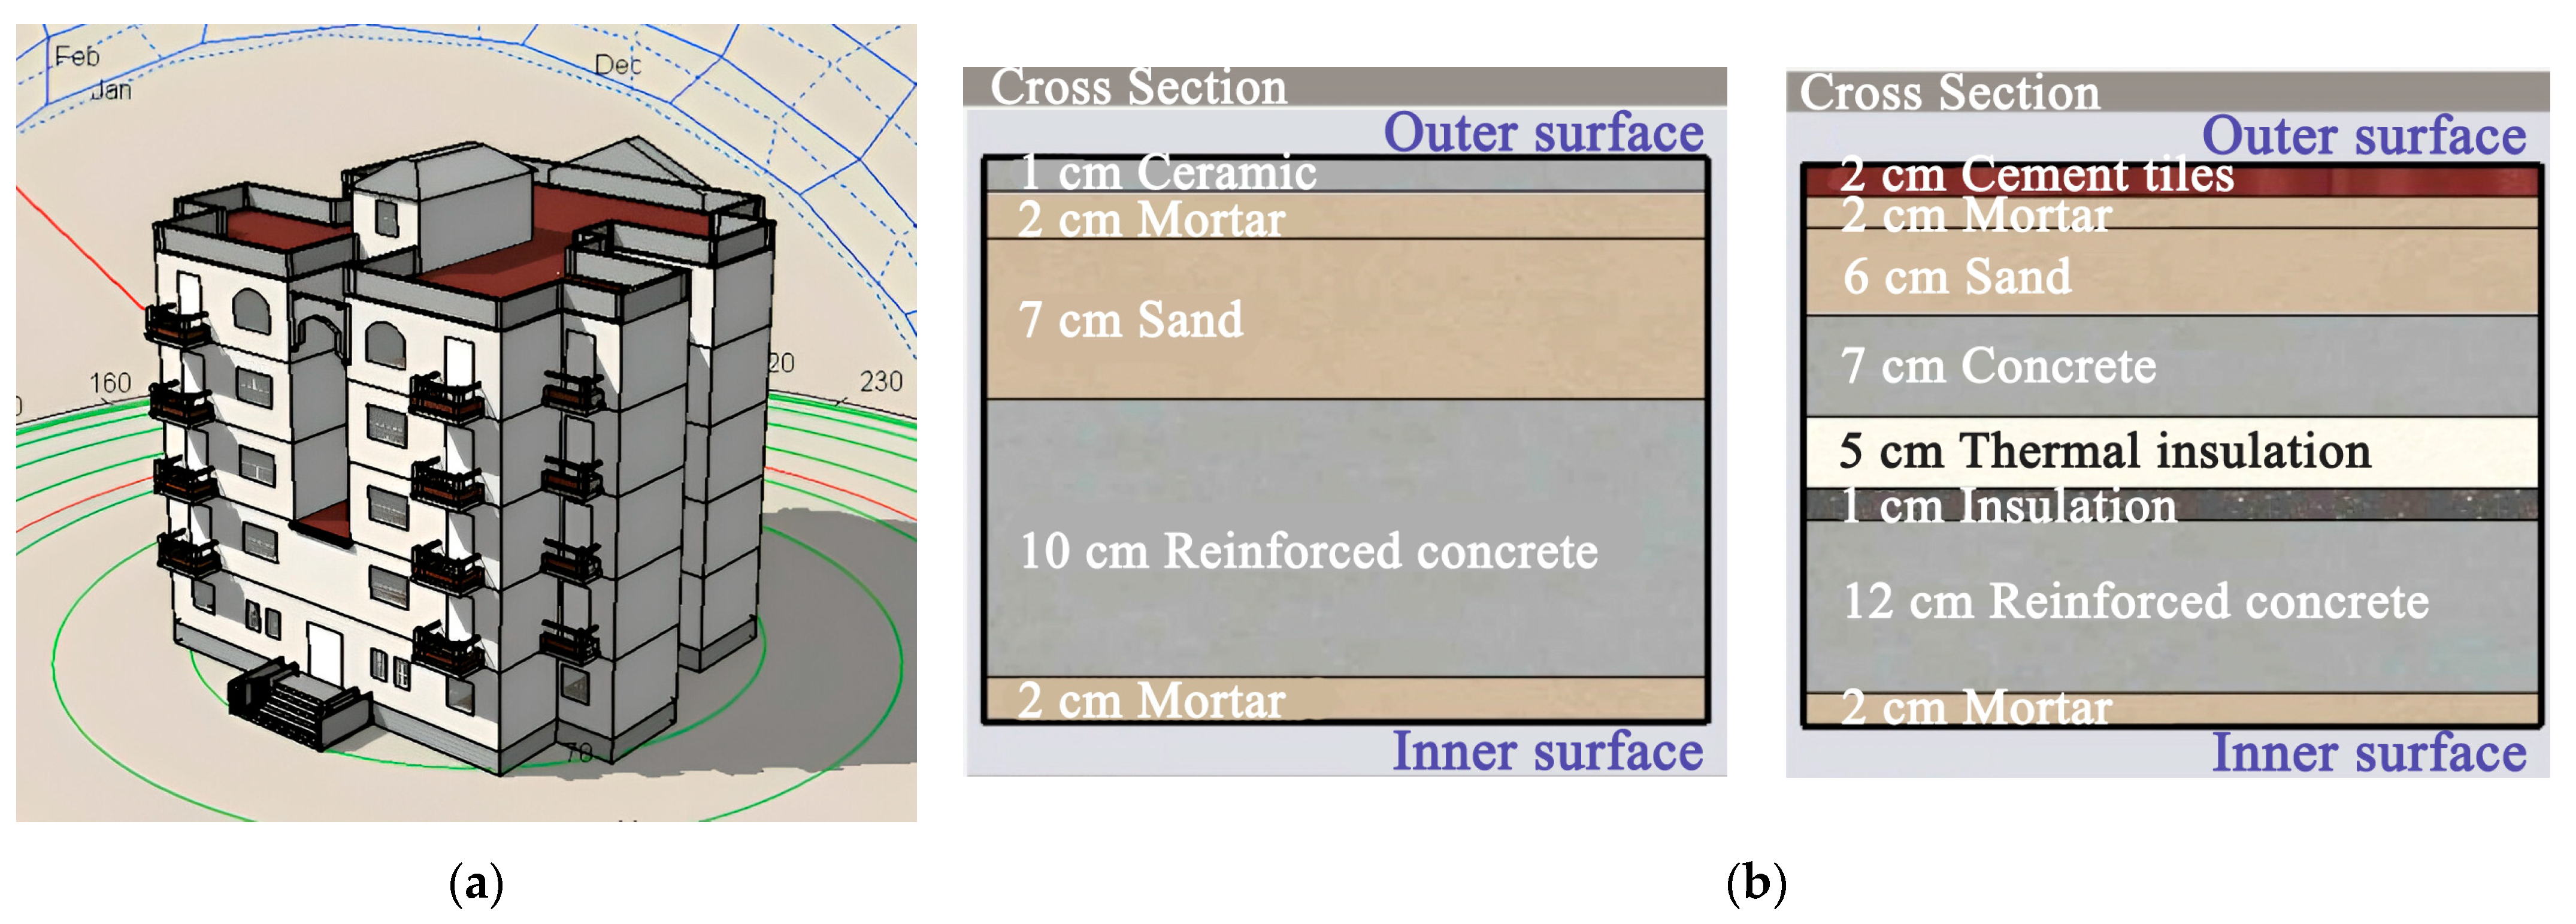
The building model was developed by providing all relevant details as inputs; the boundary conditions were established using real hourly weather data for New Burj Al Arab City, Egypt, to account for variations in ambient temperature, solar radiation, and wind speed. The external surfaces were exposed to dynamic environmental conditions, while internal surfaces were influenced by heat transfer between adjacent zones. The simulation incorporated natural ventilation as the primary airflow mechanism. Also, the simulation considered the stack effect and pressure-driven ventilation, with airflow rates and velocities dynamically adjusted based on temperature differences between the indoor and outdoor environments. The building model was developed by providing all relevant details as inputs, including user profiles, and comprehensive specifications of the building and its components specifications based on building designs and field surveys.
Figure 4a,b shows the building model and the building’s floors and roof cross-sections.
A timestep of 10 was selected. The timestep represents the discrete time interval at which calculations and system updates occur during the simulation. More timesteps per hour enhance accuracy but increase computational load. Simpler models may yield reliable results with fewer timesteps (e.g., 2 per hour), while more complex systems (e.g., containing HVAC systems) typically require 6 or more [
51]. Therefore, a timestep of 10 was selected to ensure a balance between computational efficiency and result accuracy. The initial and boundary conditions were summarized in
Table 3.
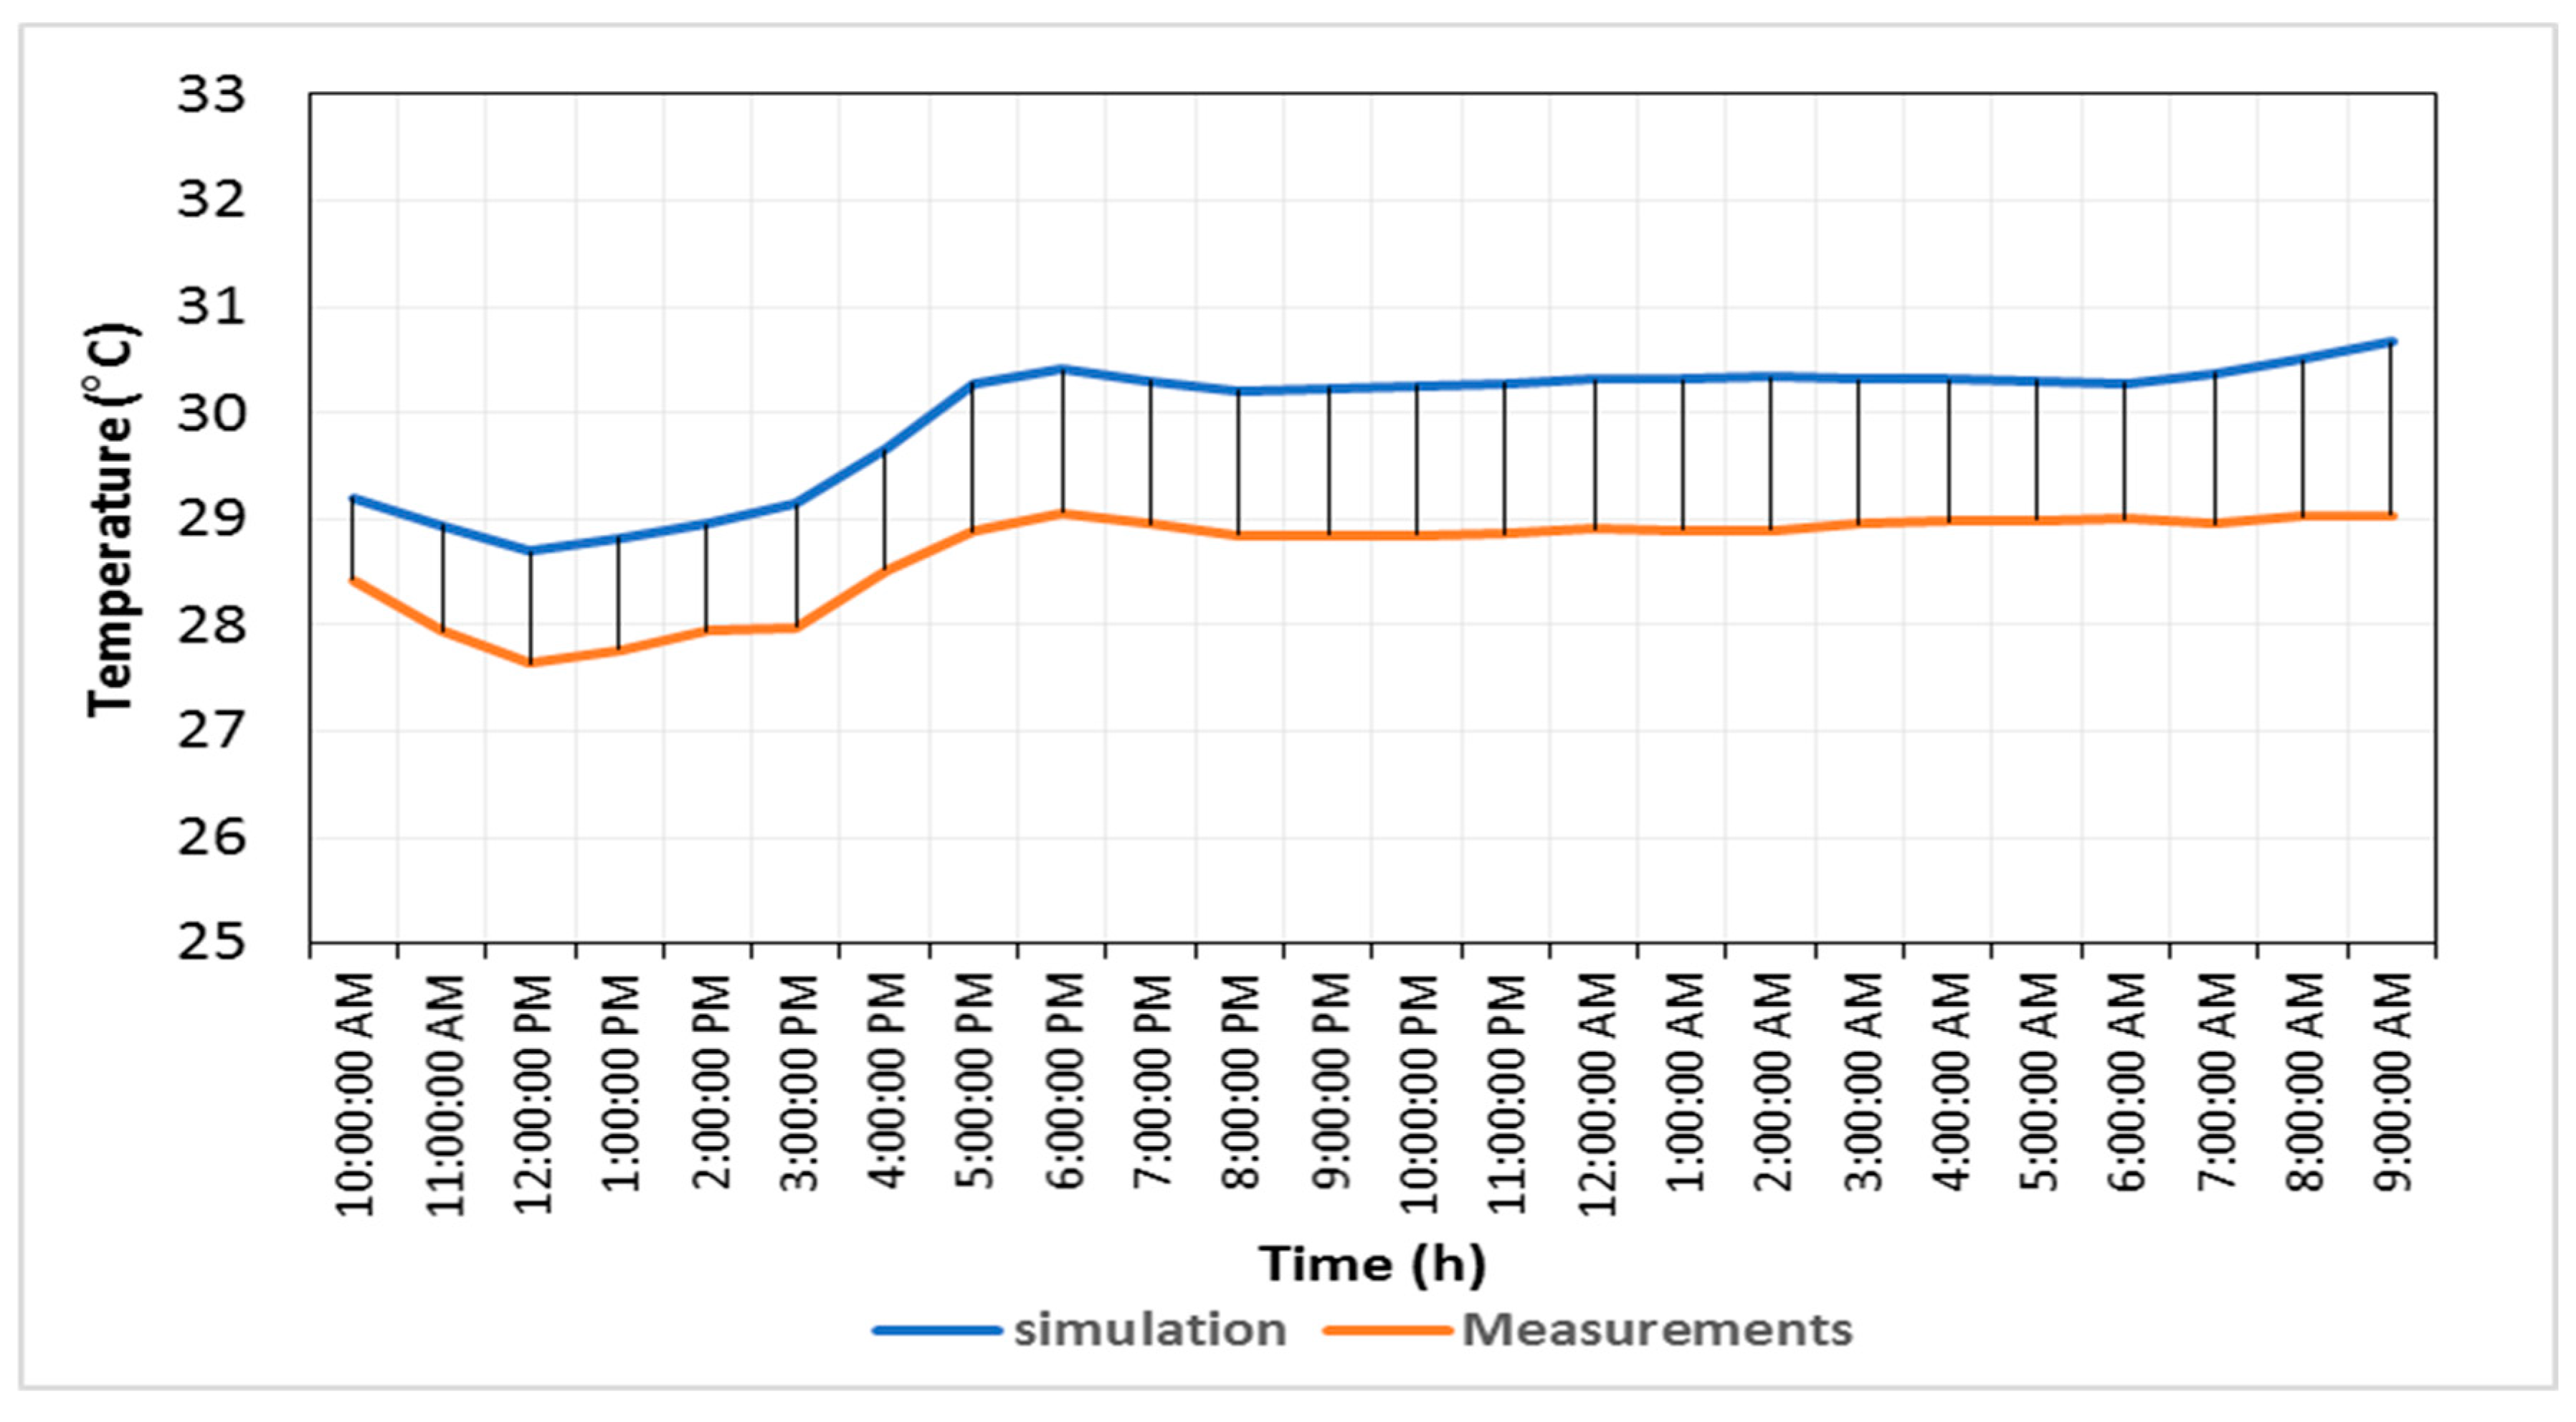
The actual temperatures can be compared with the simulation results to verify the accuracy of the simulation model and the extent to which its results are consistent with the actual reality in the interior spaces. The actual indoor temperatures were measured in Room a on July 25 for 24 h, and a comparison was made between the measured and simulated results during the same period. The validation was conducted only for 24 h due to data limitations and the challenges of collecting real-world measurements in an occupied building. Many studies have conducted validation within similar or even shorter time frames. For instance, Cheng et al. validated a passive solar room by comparing simulated and measured indoor temperature data over a 24 h period starting at 8:00 a.m. [
52]. Similarly, Friji et al. compared measured and modeled temperatures from 10:00 a.m. to 4:00 p.m. [
35]. Additionally, Zhang et al. validated a test room by comparing numerical and experimental indoor temperature data from midnight on 10 January to 6:00 p.m. on 11 January [
48].
As shown in
Figure 5, the results showed that the largest value of the change was 1.63 °C and the smallest was 0.77 °C. Generally, there is an agreement and consistency between the actual measurements and the simulation results.
To validate the accuracy of the simulation results, a comparative analysis was performed between the measured and simulated data. The Root Mean Square Error (
RMSE) and Relative Error (
RE) were utilized as evaluation metrics [
53]. The calculation equations are as follows:
where
T is the temperature and
N is the number of measurements.
The analysis yielded an average relative error of 4.45%, demonstrating a strong agreement between the simulated results and the measured data [
35]. Furthermore, the
RMSE was 1.33, within the acceptable calibration threshold of 1.5 [
54]. These findings confirm the reliability of the computational simulation and its suitability for evaluating the performance of the proposed system. Measured and simulated indoor temperatures in Room (a) on 25 July, which were used for estimating the values of the
RE and
RMSE, are available in
Table A1 in
Appendix A.
2.2.4. The Proposed Multi-Story Trombe Wall Design
The proposed TW design was developed as a multi-story system to accommodate the maximum number of rooms in a vertical configuration. The MTW has a 375 cm width and a 30 cm depth, featuring a 25 cm brick wall, with upper and lower vents of 0.4 m2 on each floor and 6 mm clear glazing. It was integrated with the southeast-facing bedrooms.
PV blind was integrated and connected to the massive wall, adding the functionality of electricity generation. Also, the PV position can significantly minimize thermal gain into rooms since the PV cells operate as an absorber, blocking transmitted radiation. Consequently, it can control heat transfer to the interior, particularly during the summer [
22].
Table 4 shows the PV cell specifications.
As depicted in
Figure 6, two operational modes were designed for the MTW system: one for heating and one for cooling. In the heating mode, the room window is closed, the upper and lower vents in the massive wall are opened, and the PV blind is positioned horizontally to facilitate direct heat transfer through the massive wall. Conversely, in the cooling mode, the room window is opened, the upper vents are sealed, the lower vents are left open, and the PV cells are placed vertically to minimize heat transfer through the wall.
2.3. Simulation-Optimization
Simulation tools (e.g., building energy simulation programs) can solely evaluate the impact of design variables on defined performance measures. On the other hand, optimization finds the optimum or near-optimum design variables that obtain the best performance measures. However, optimization still requires the output from simulation to evaluate the goodness of a solution. Therefore, there is a need to integrate simulation and optimization in one approach, called simulation-optimization [
55]. This study applied this approach to find the near-optimum design variables of the proposed multi-story Trombe Wall (MTW).
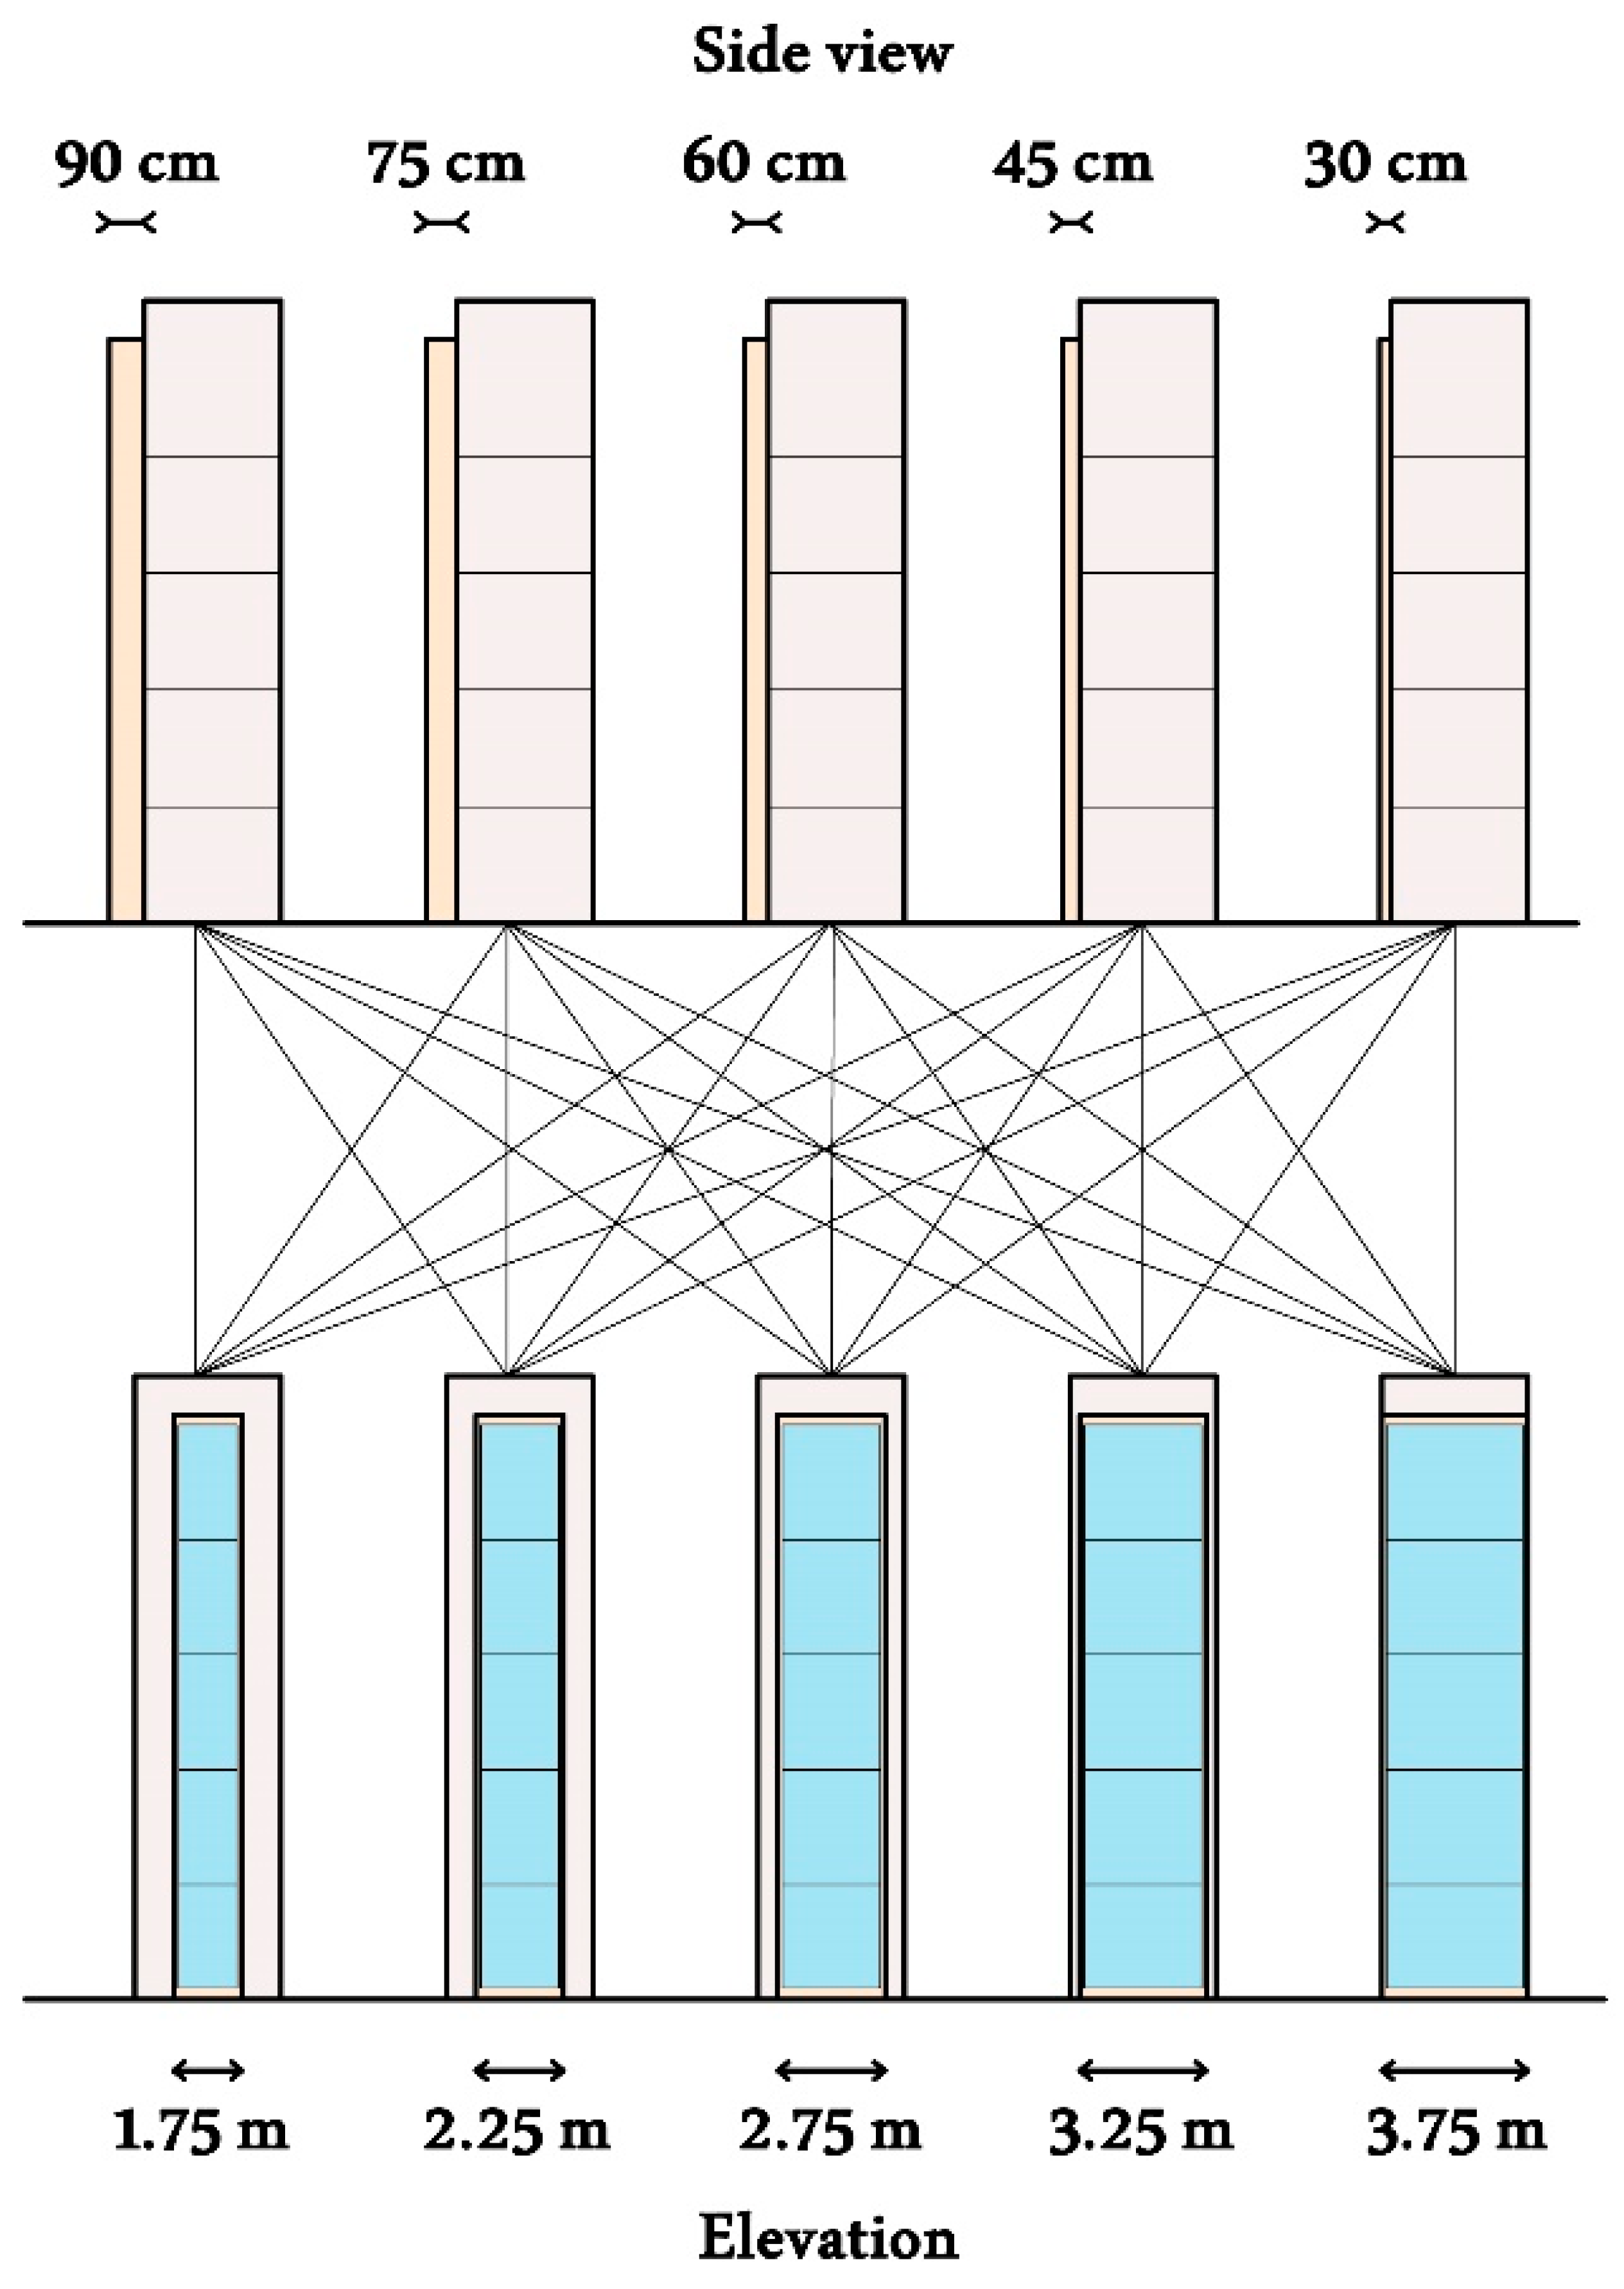
The simulation-optimization was conducted in two stages [
56]. In the first stage, parametric optimization is conducted to investigate the impact of varying the MTW width and air gap depth. The width was adjusted between 175 cm and 375 cm in increments of 50 cm, while the air gap depth ranged from 30 cm to 90 cm, with 15 cm intervals resulting in 25 design alternatives, as shown in
Figure 7. Then, a simulation evaluation of these 25 design alternatives is conducted to obtain the optimum MTW width and air gap depth (i.e., full enumeration).
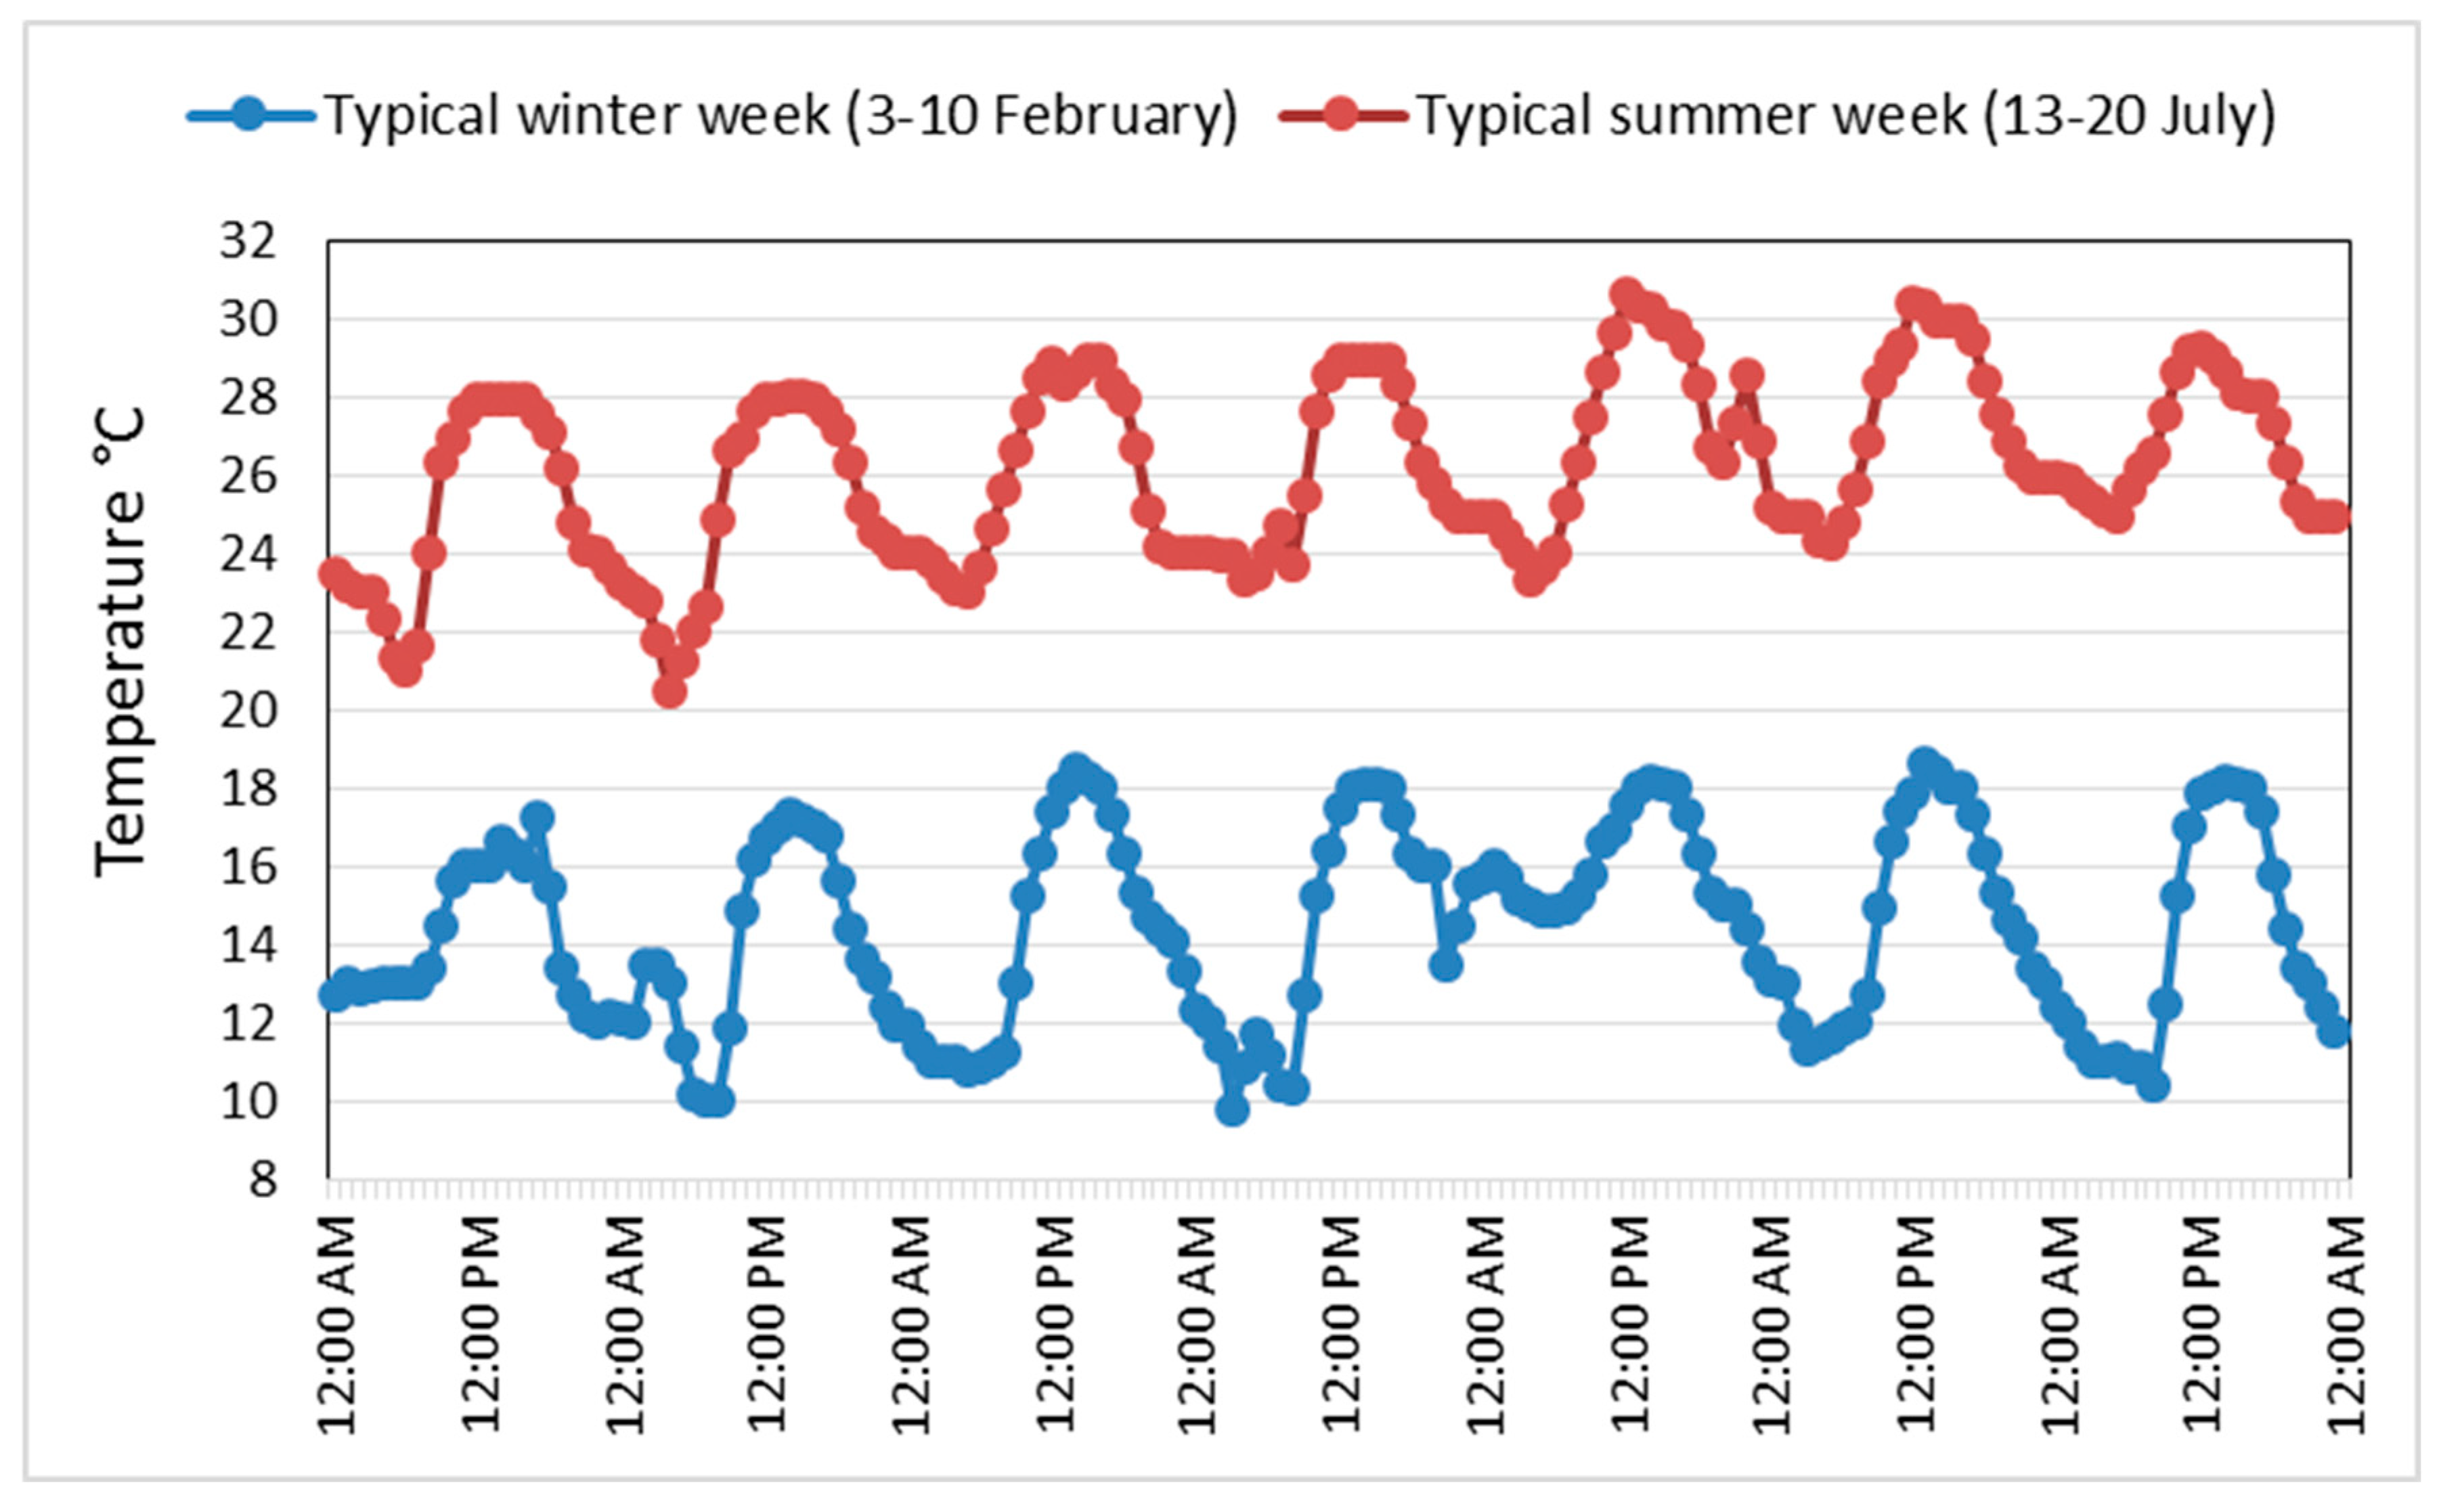
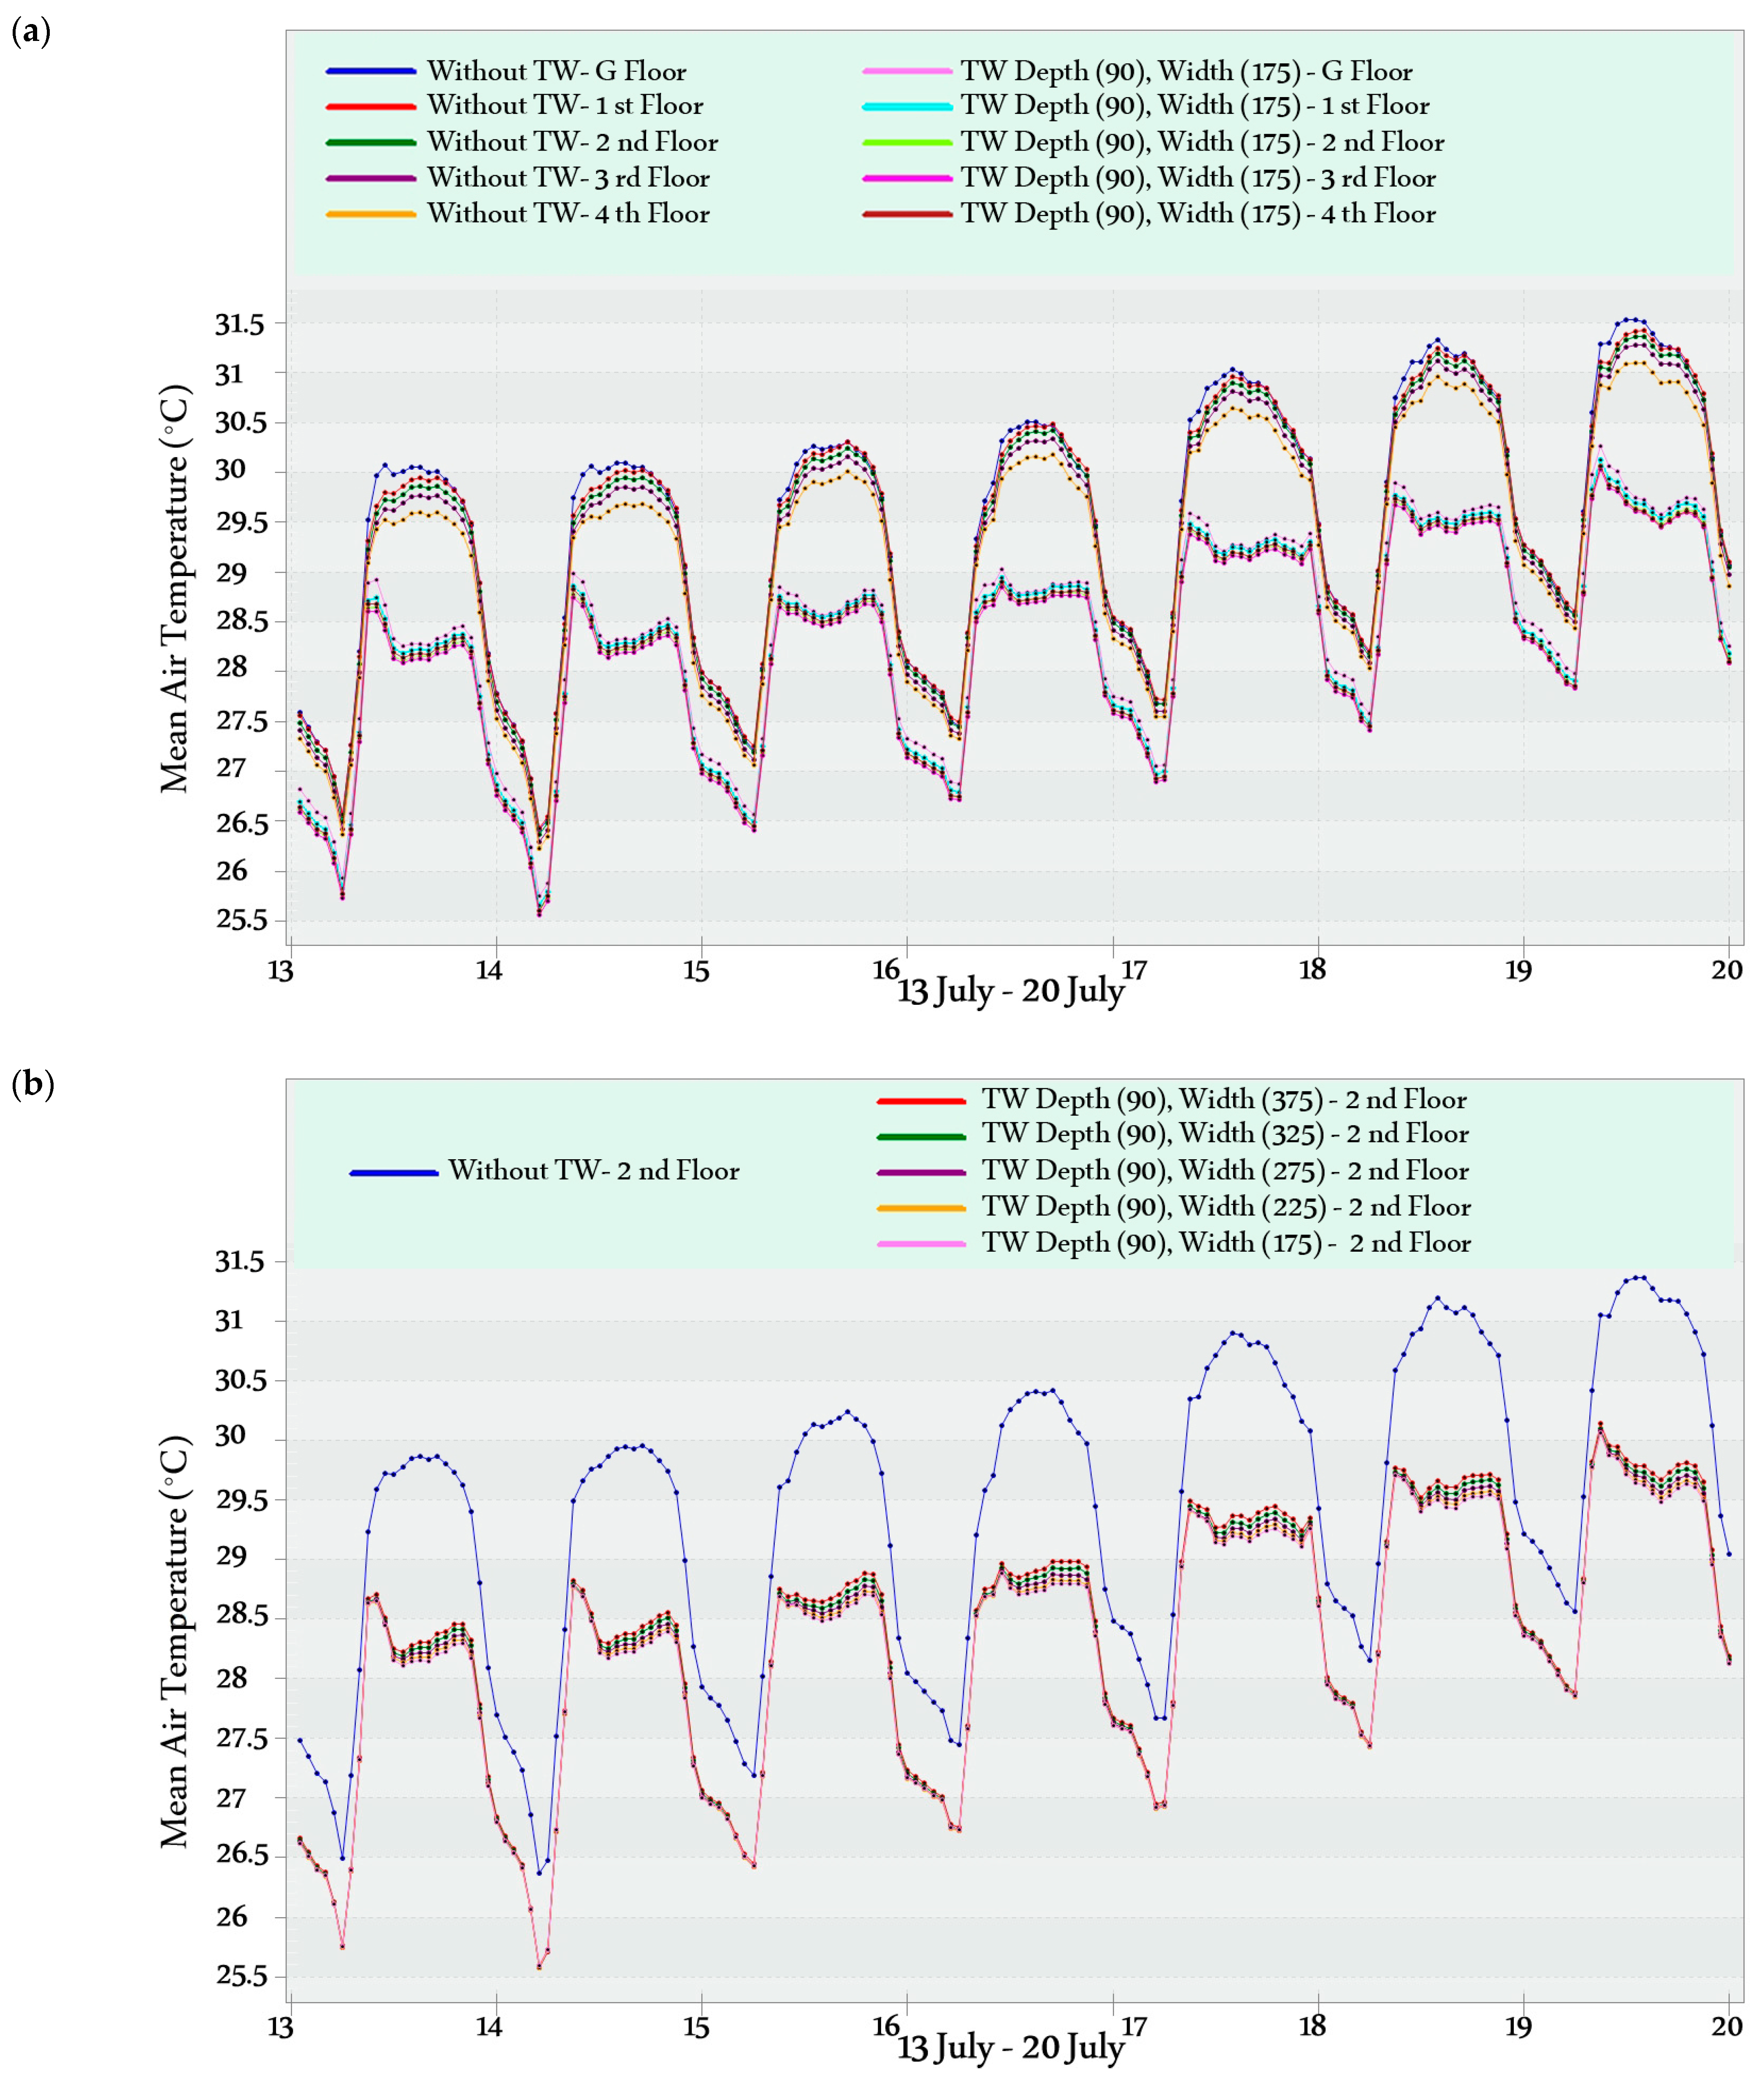
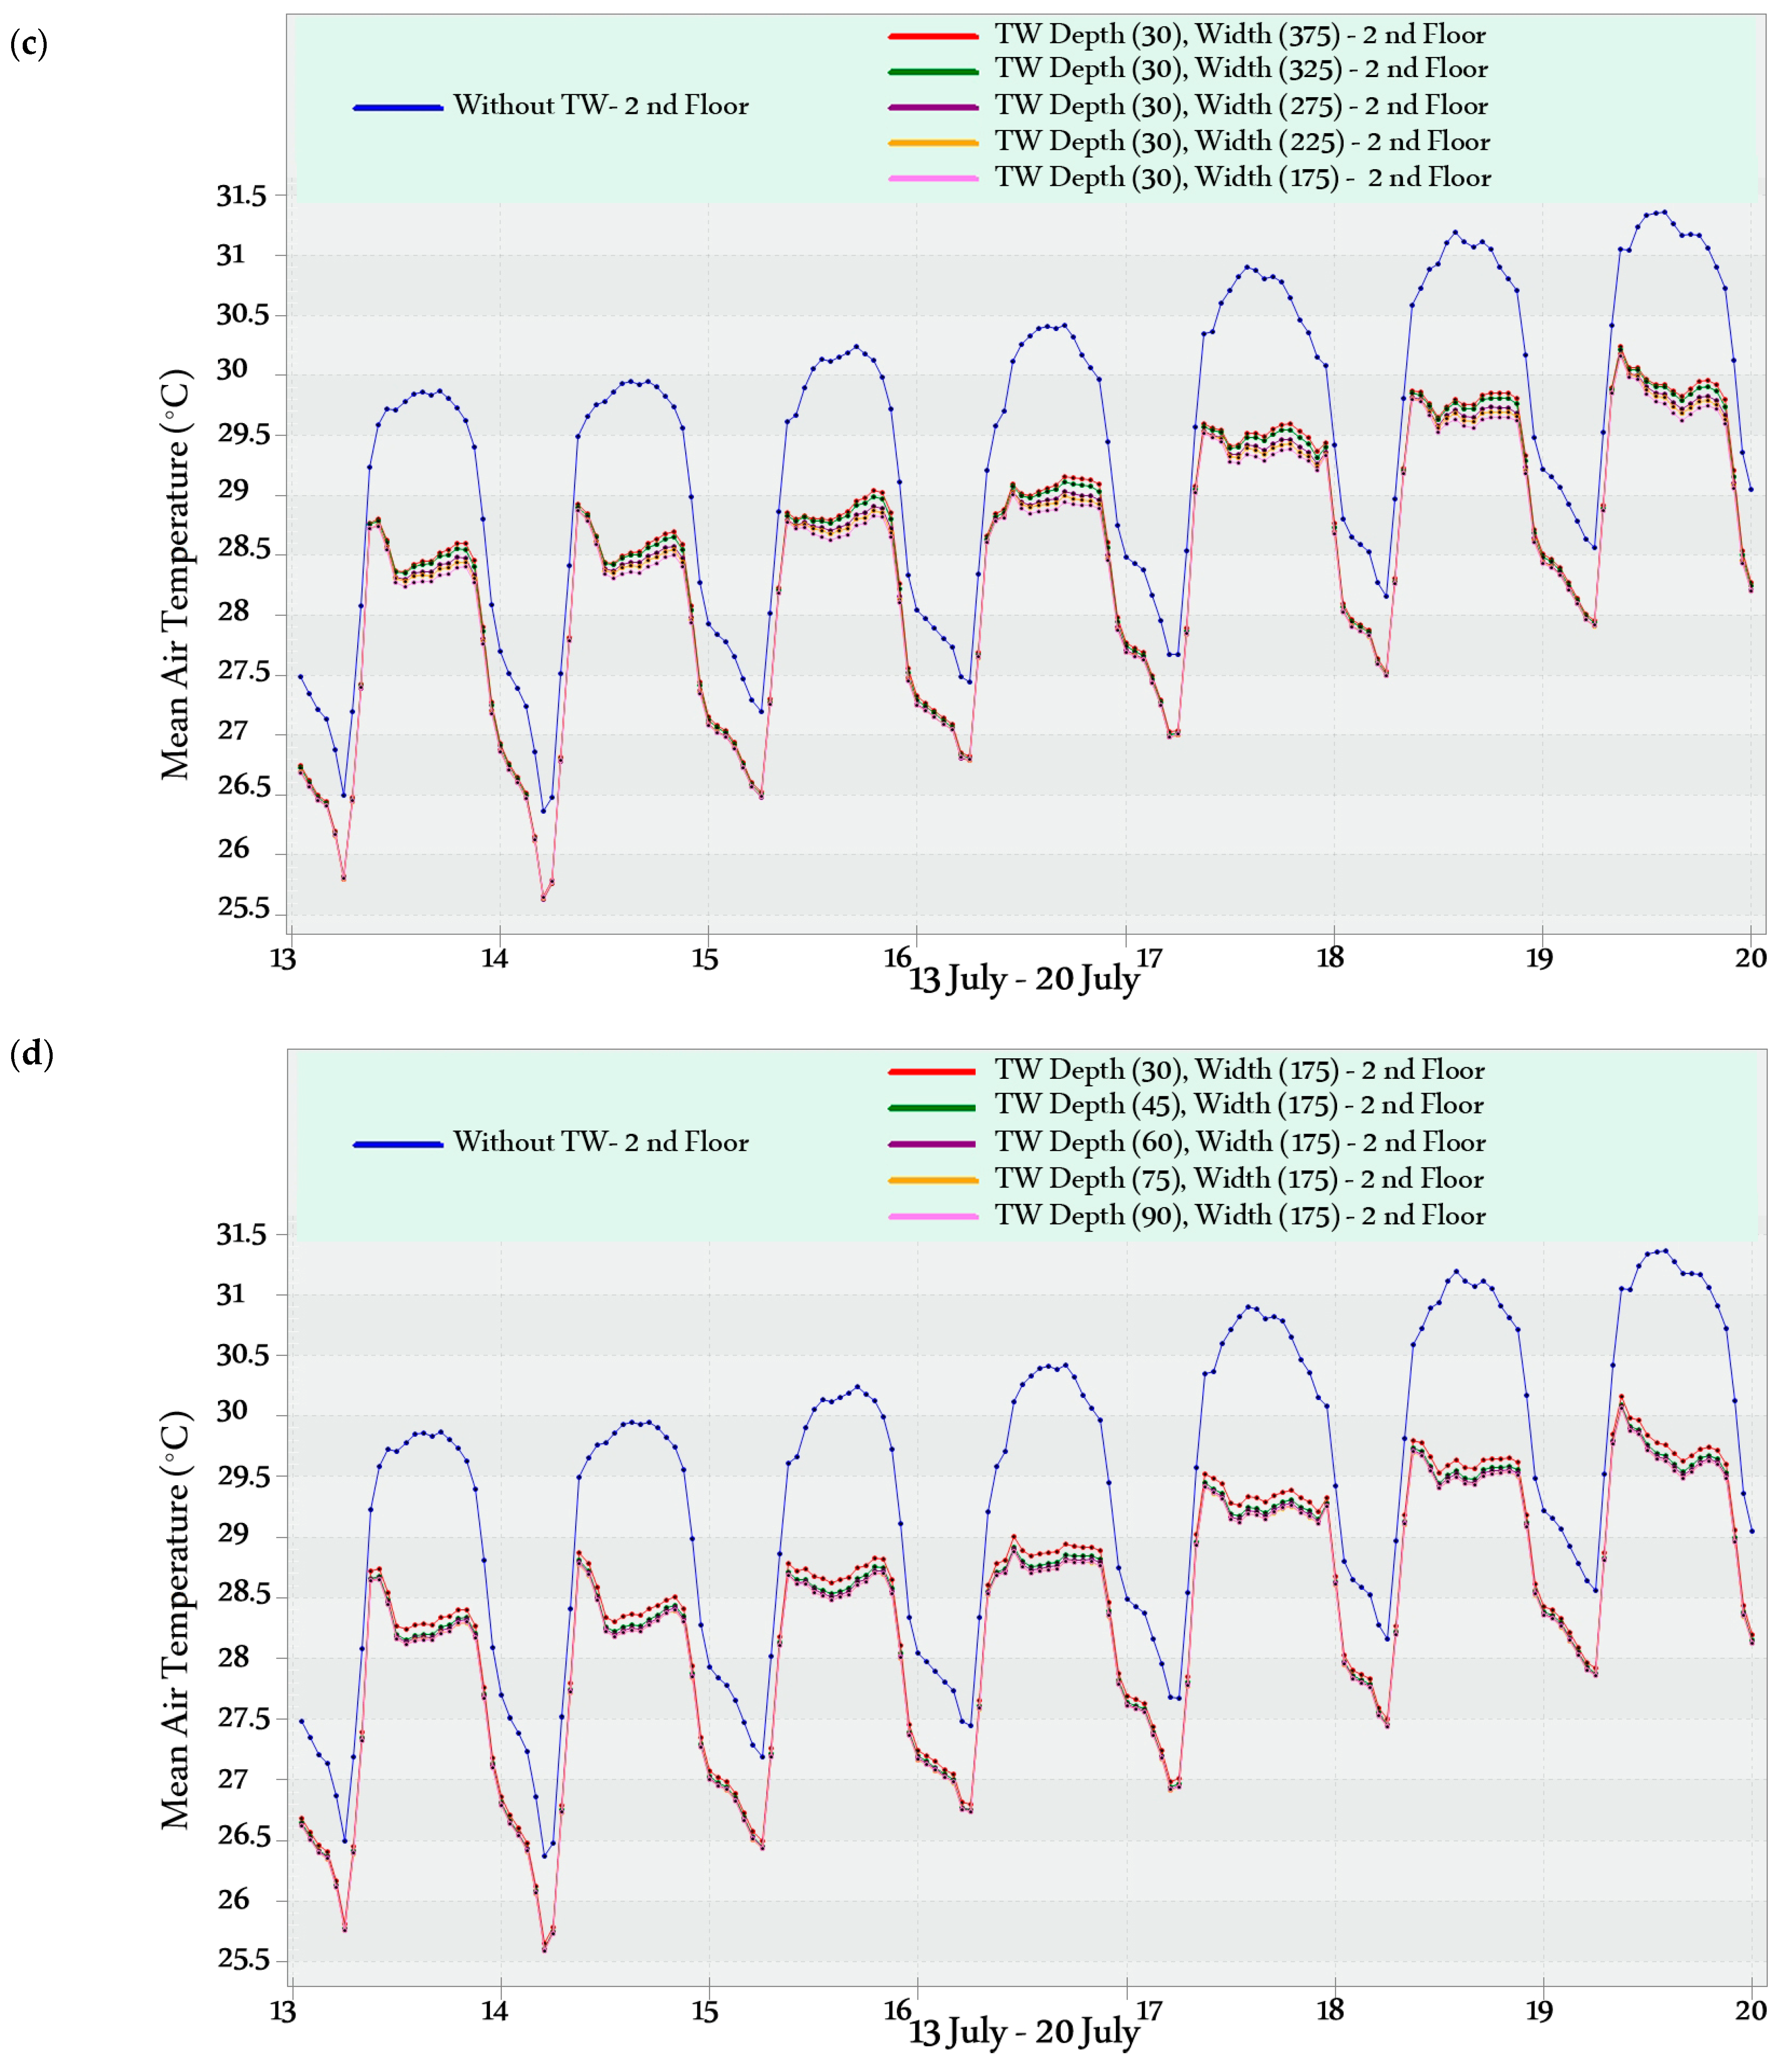
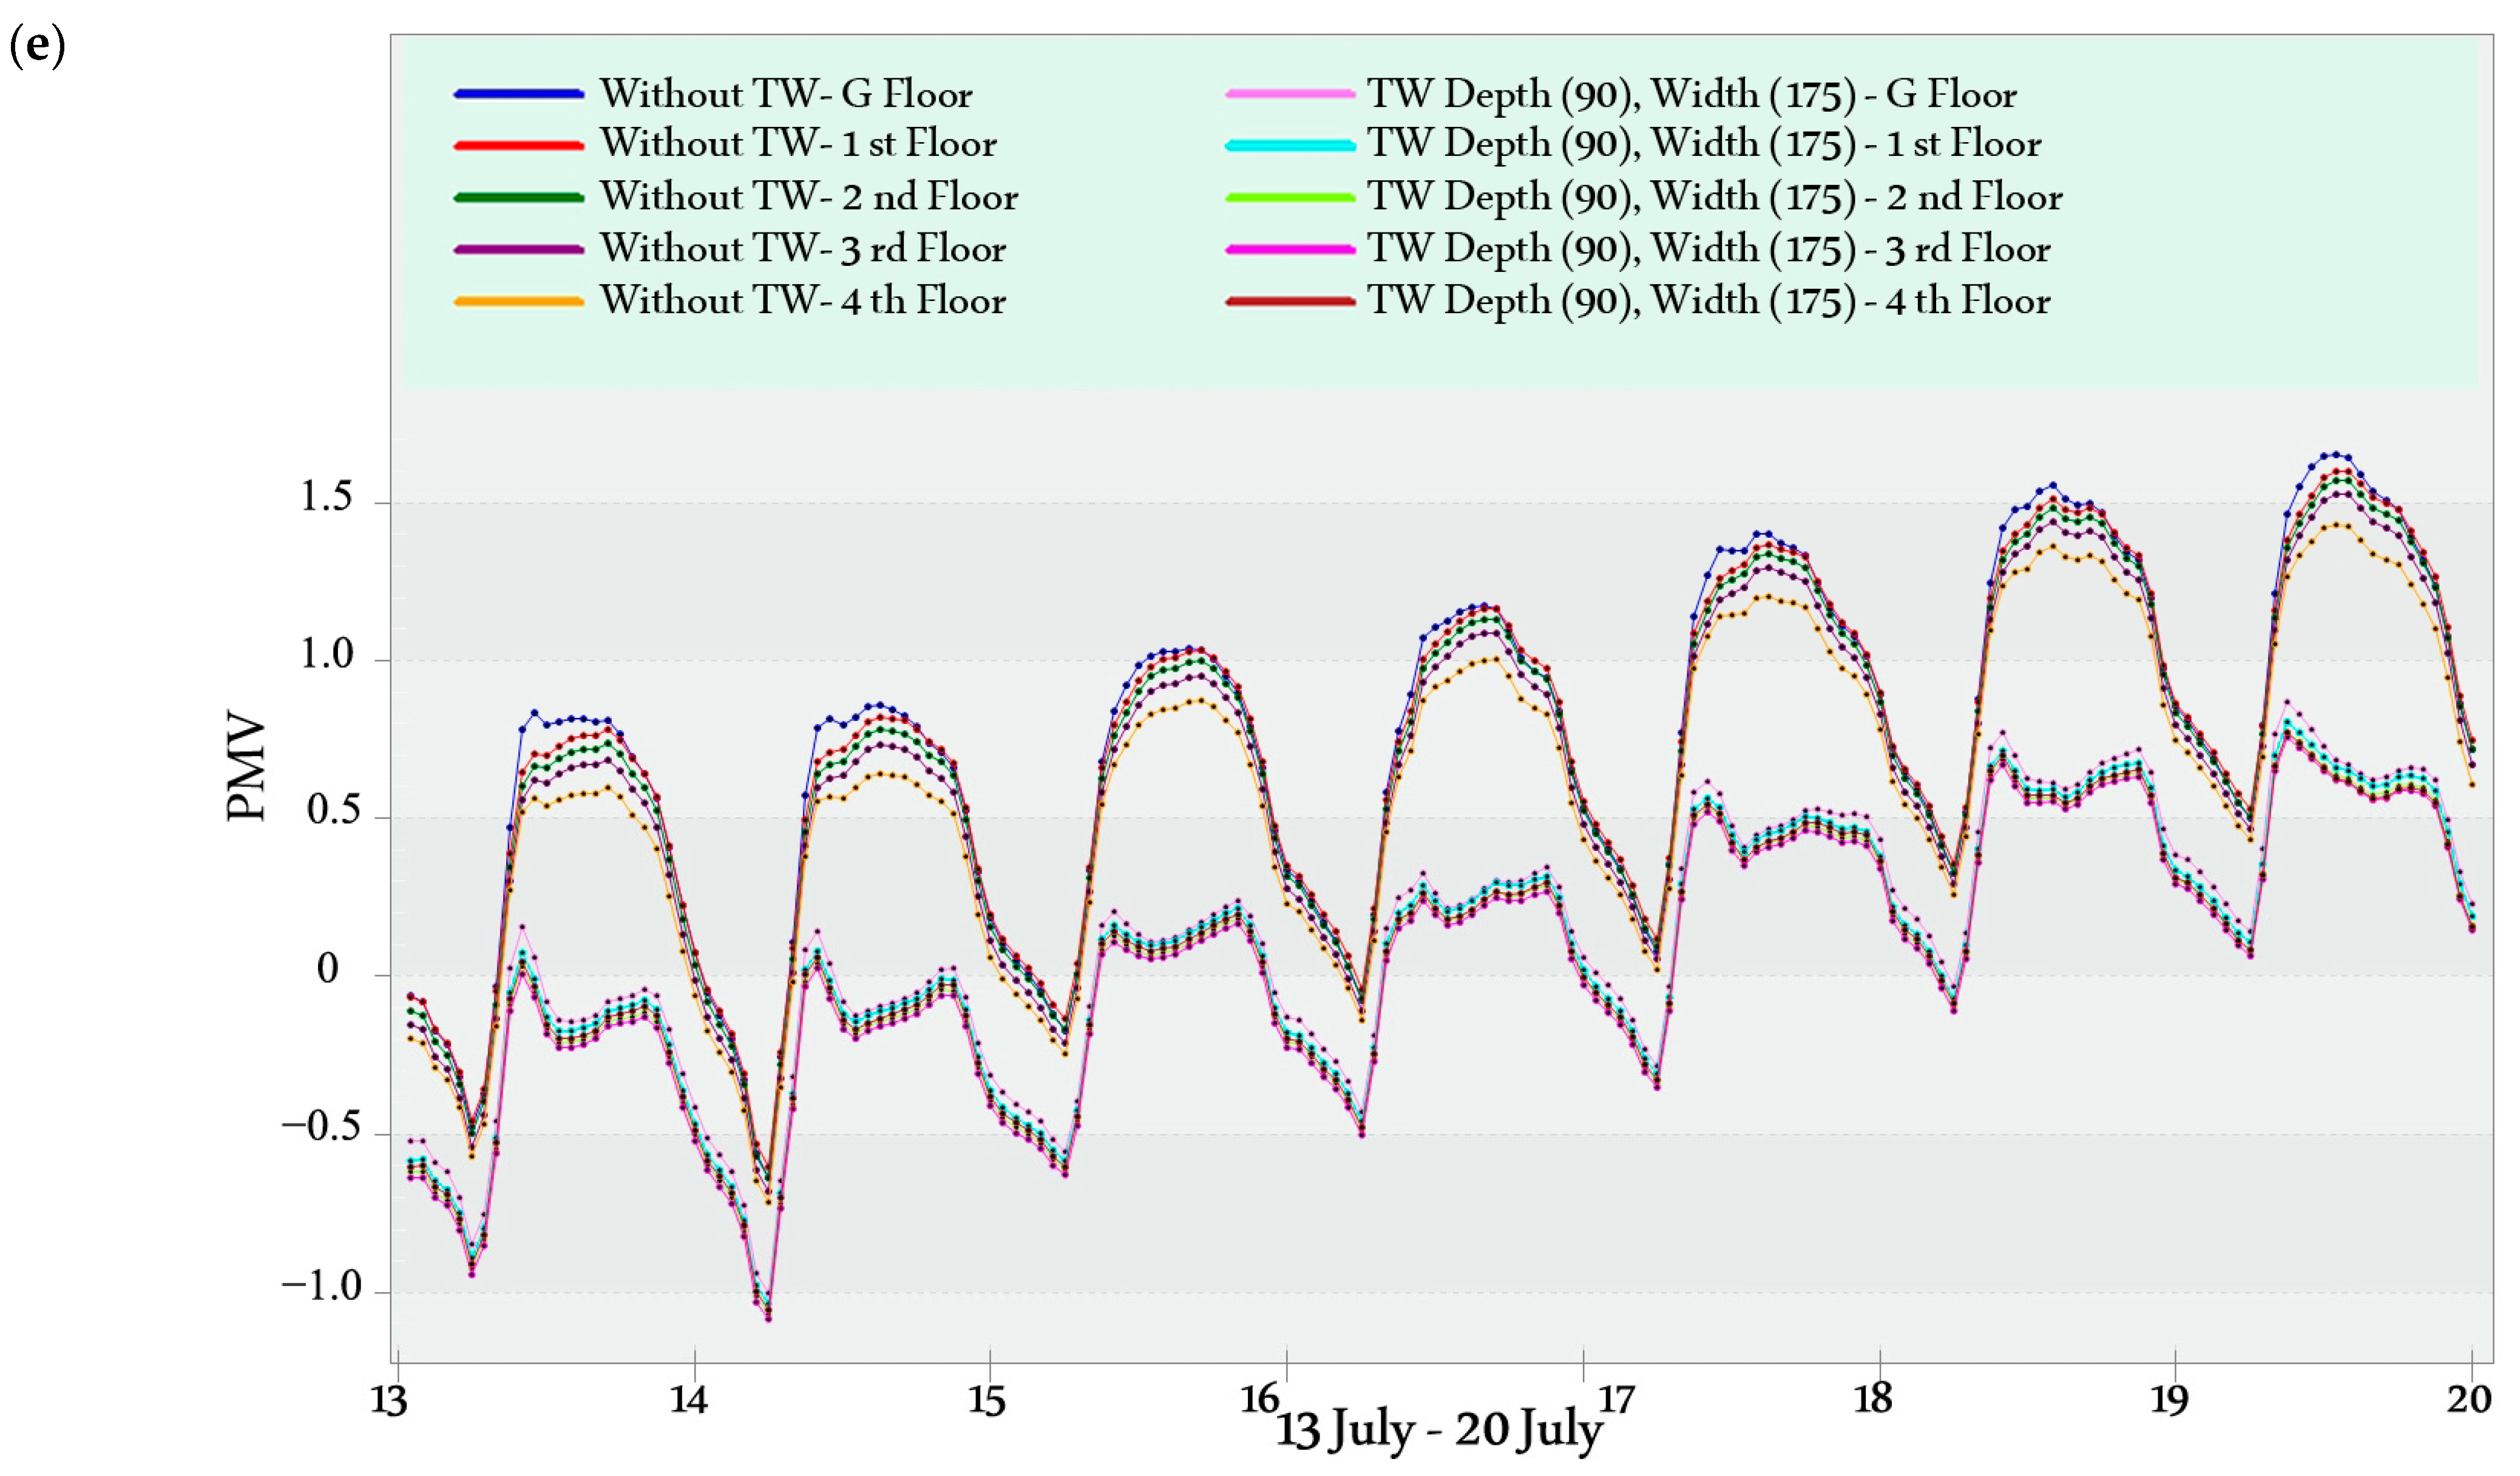
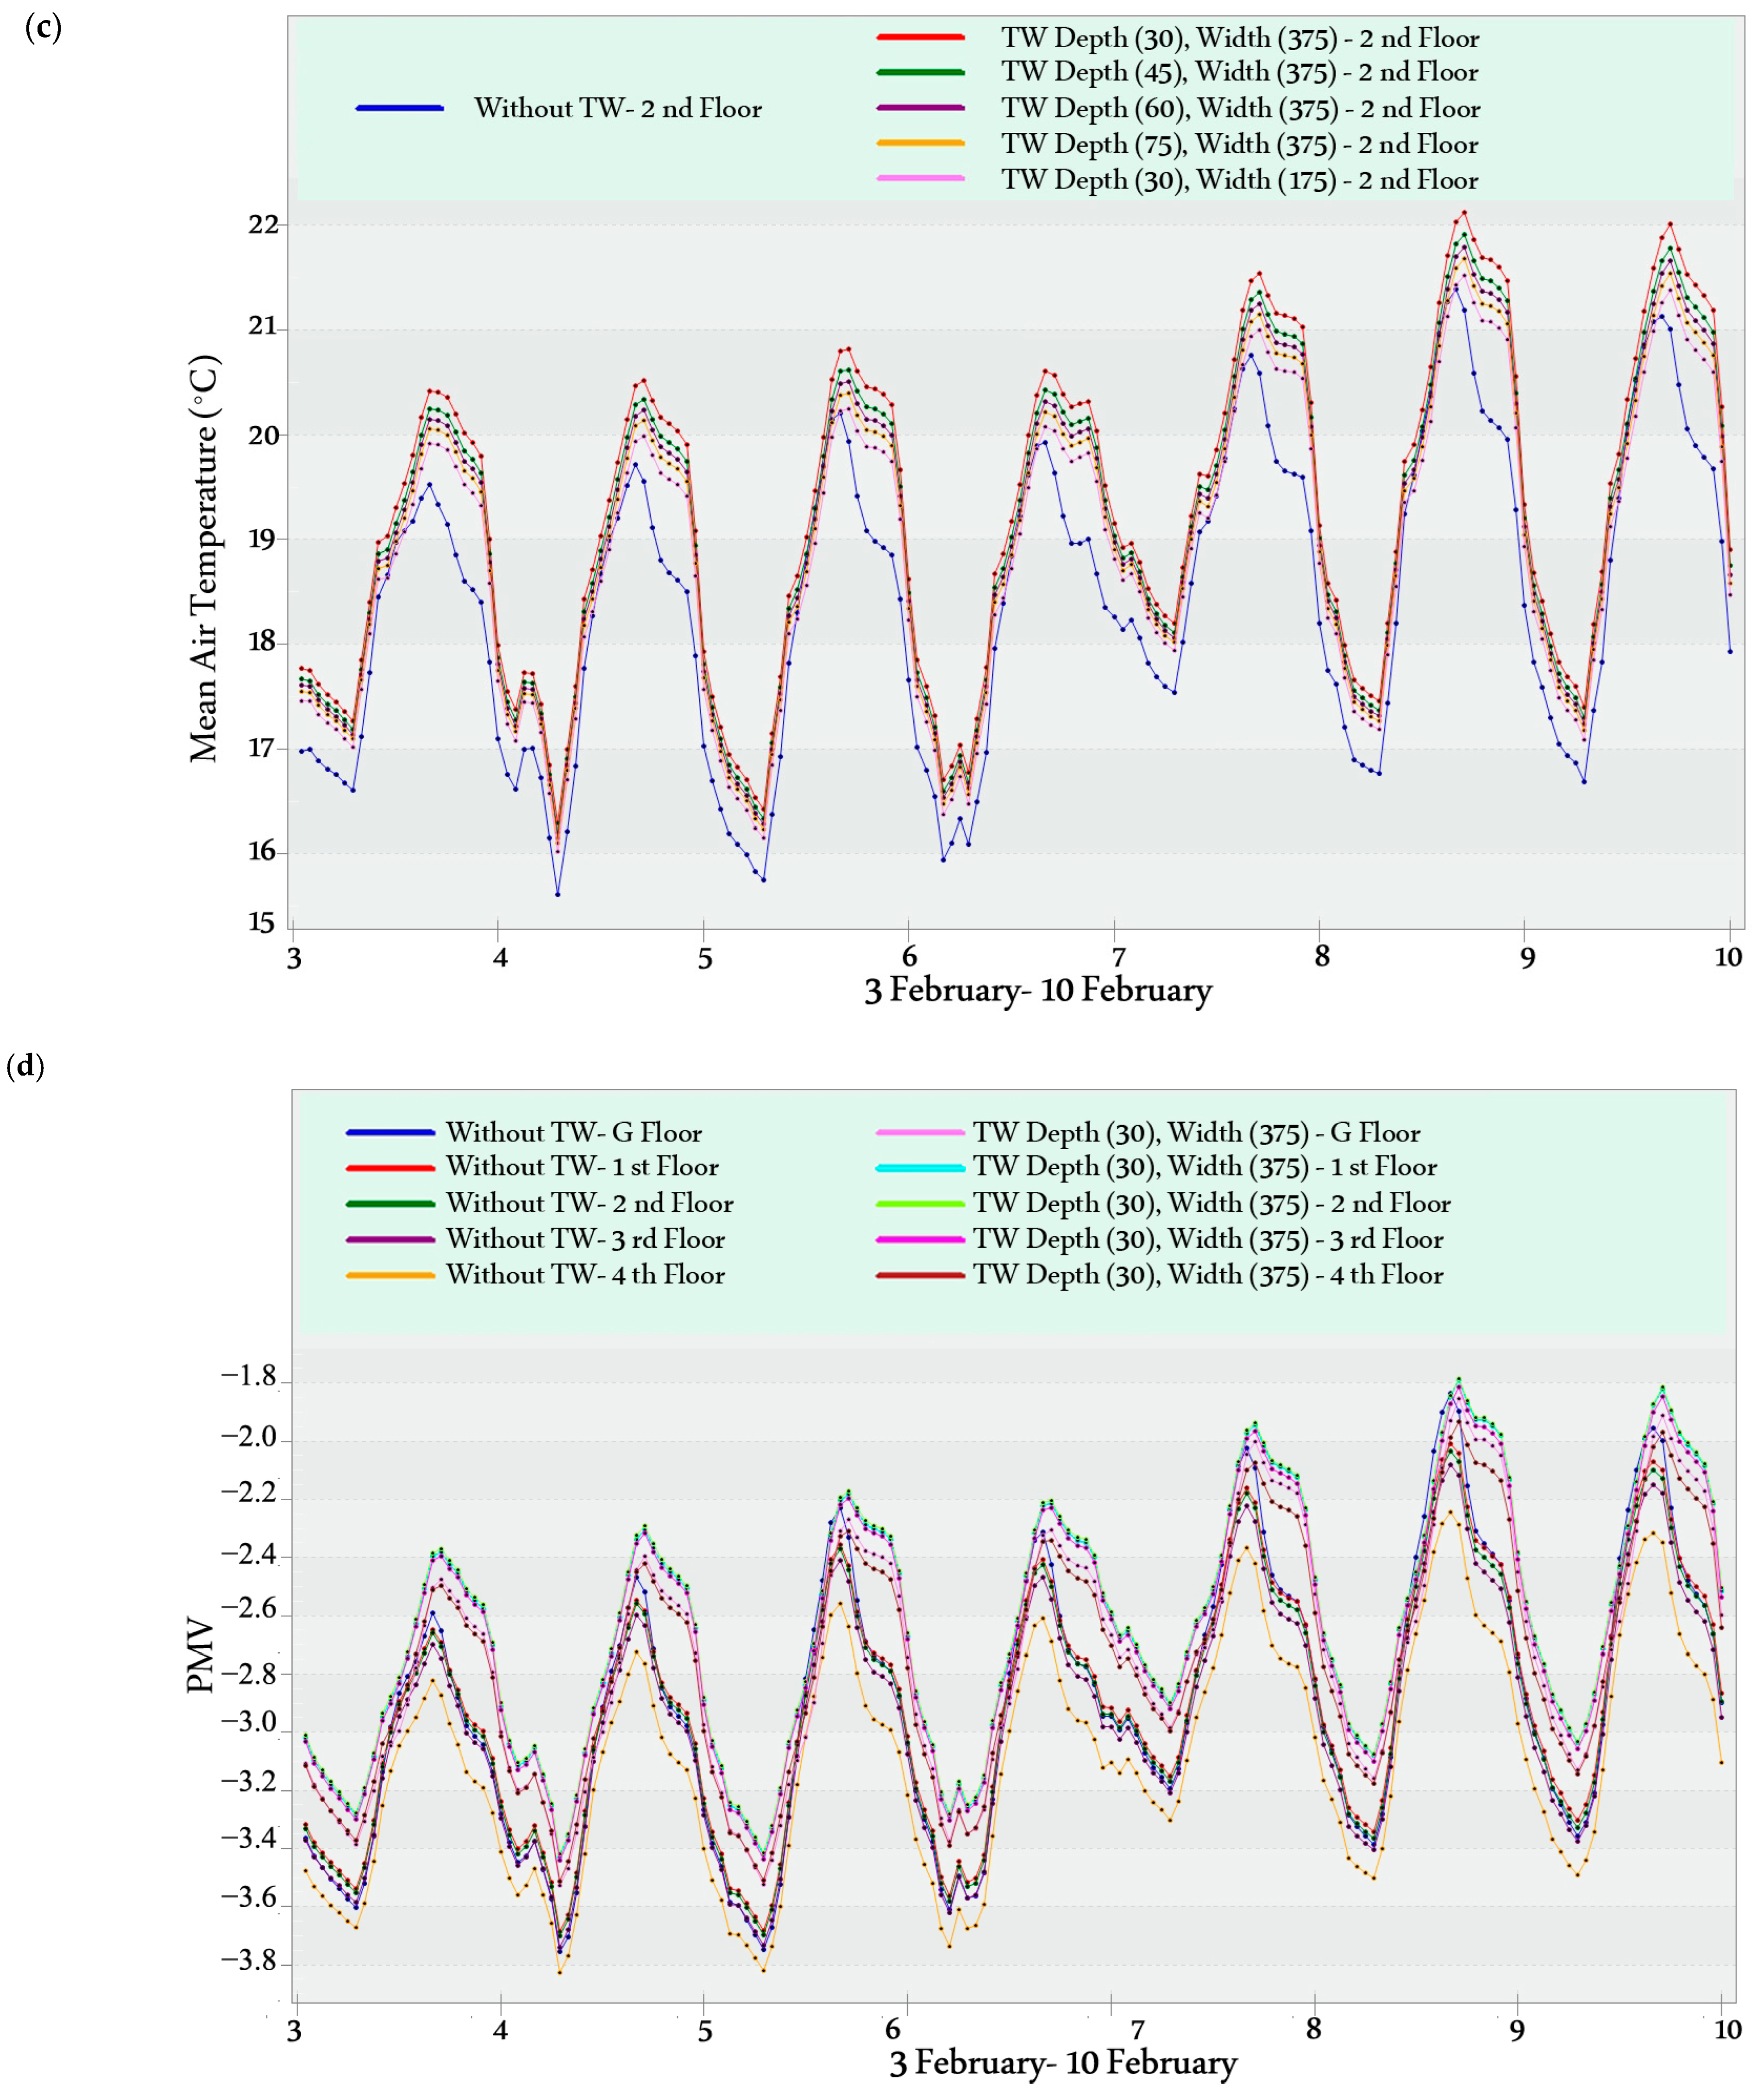
The simulation was conducted to evaluate hourly temperatures and Predicted Mean Vote (PMV) values during a typical winter week (3–10 February) and a typical summer week (13–20 July). A typical week is identified as a representative period that characterizes the climatic conditions of a specific season [
51].
Figure 8 shows the design temperature in the typical winter week and the typical summer week. The PMV metric assesses thermal comfort from −3 (cold) to 3 (hot), with 0 representing optimal comfort. The advised PMV range for satisfactory thermal comfort is between −0.5 and 0.5 [
57].
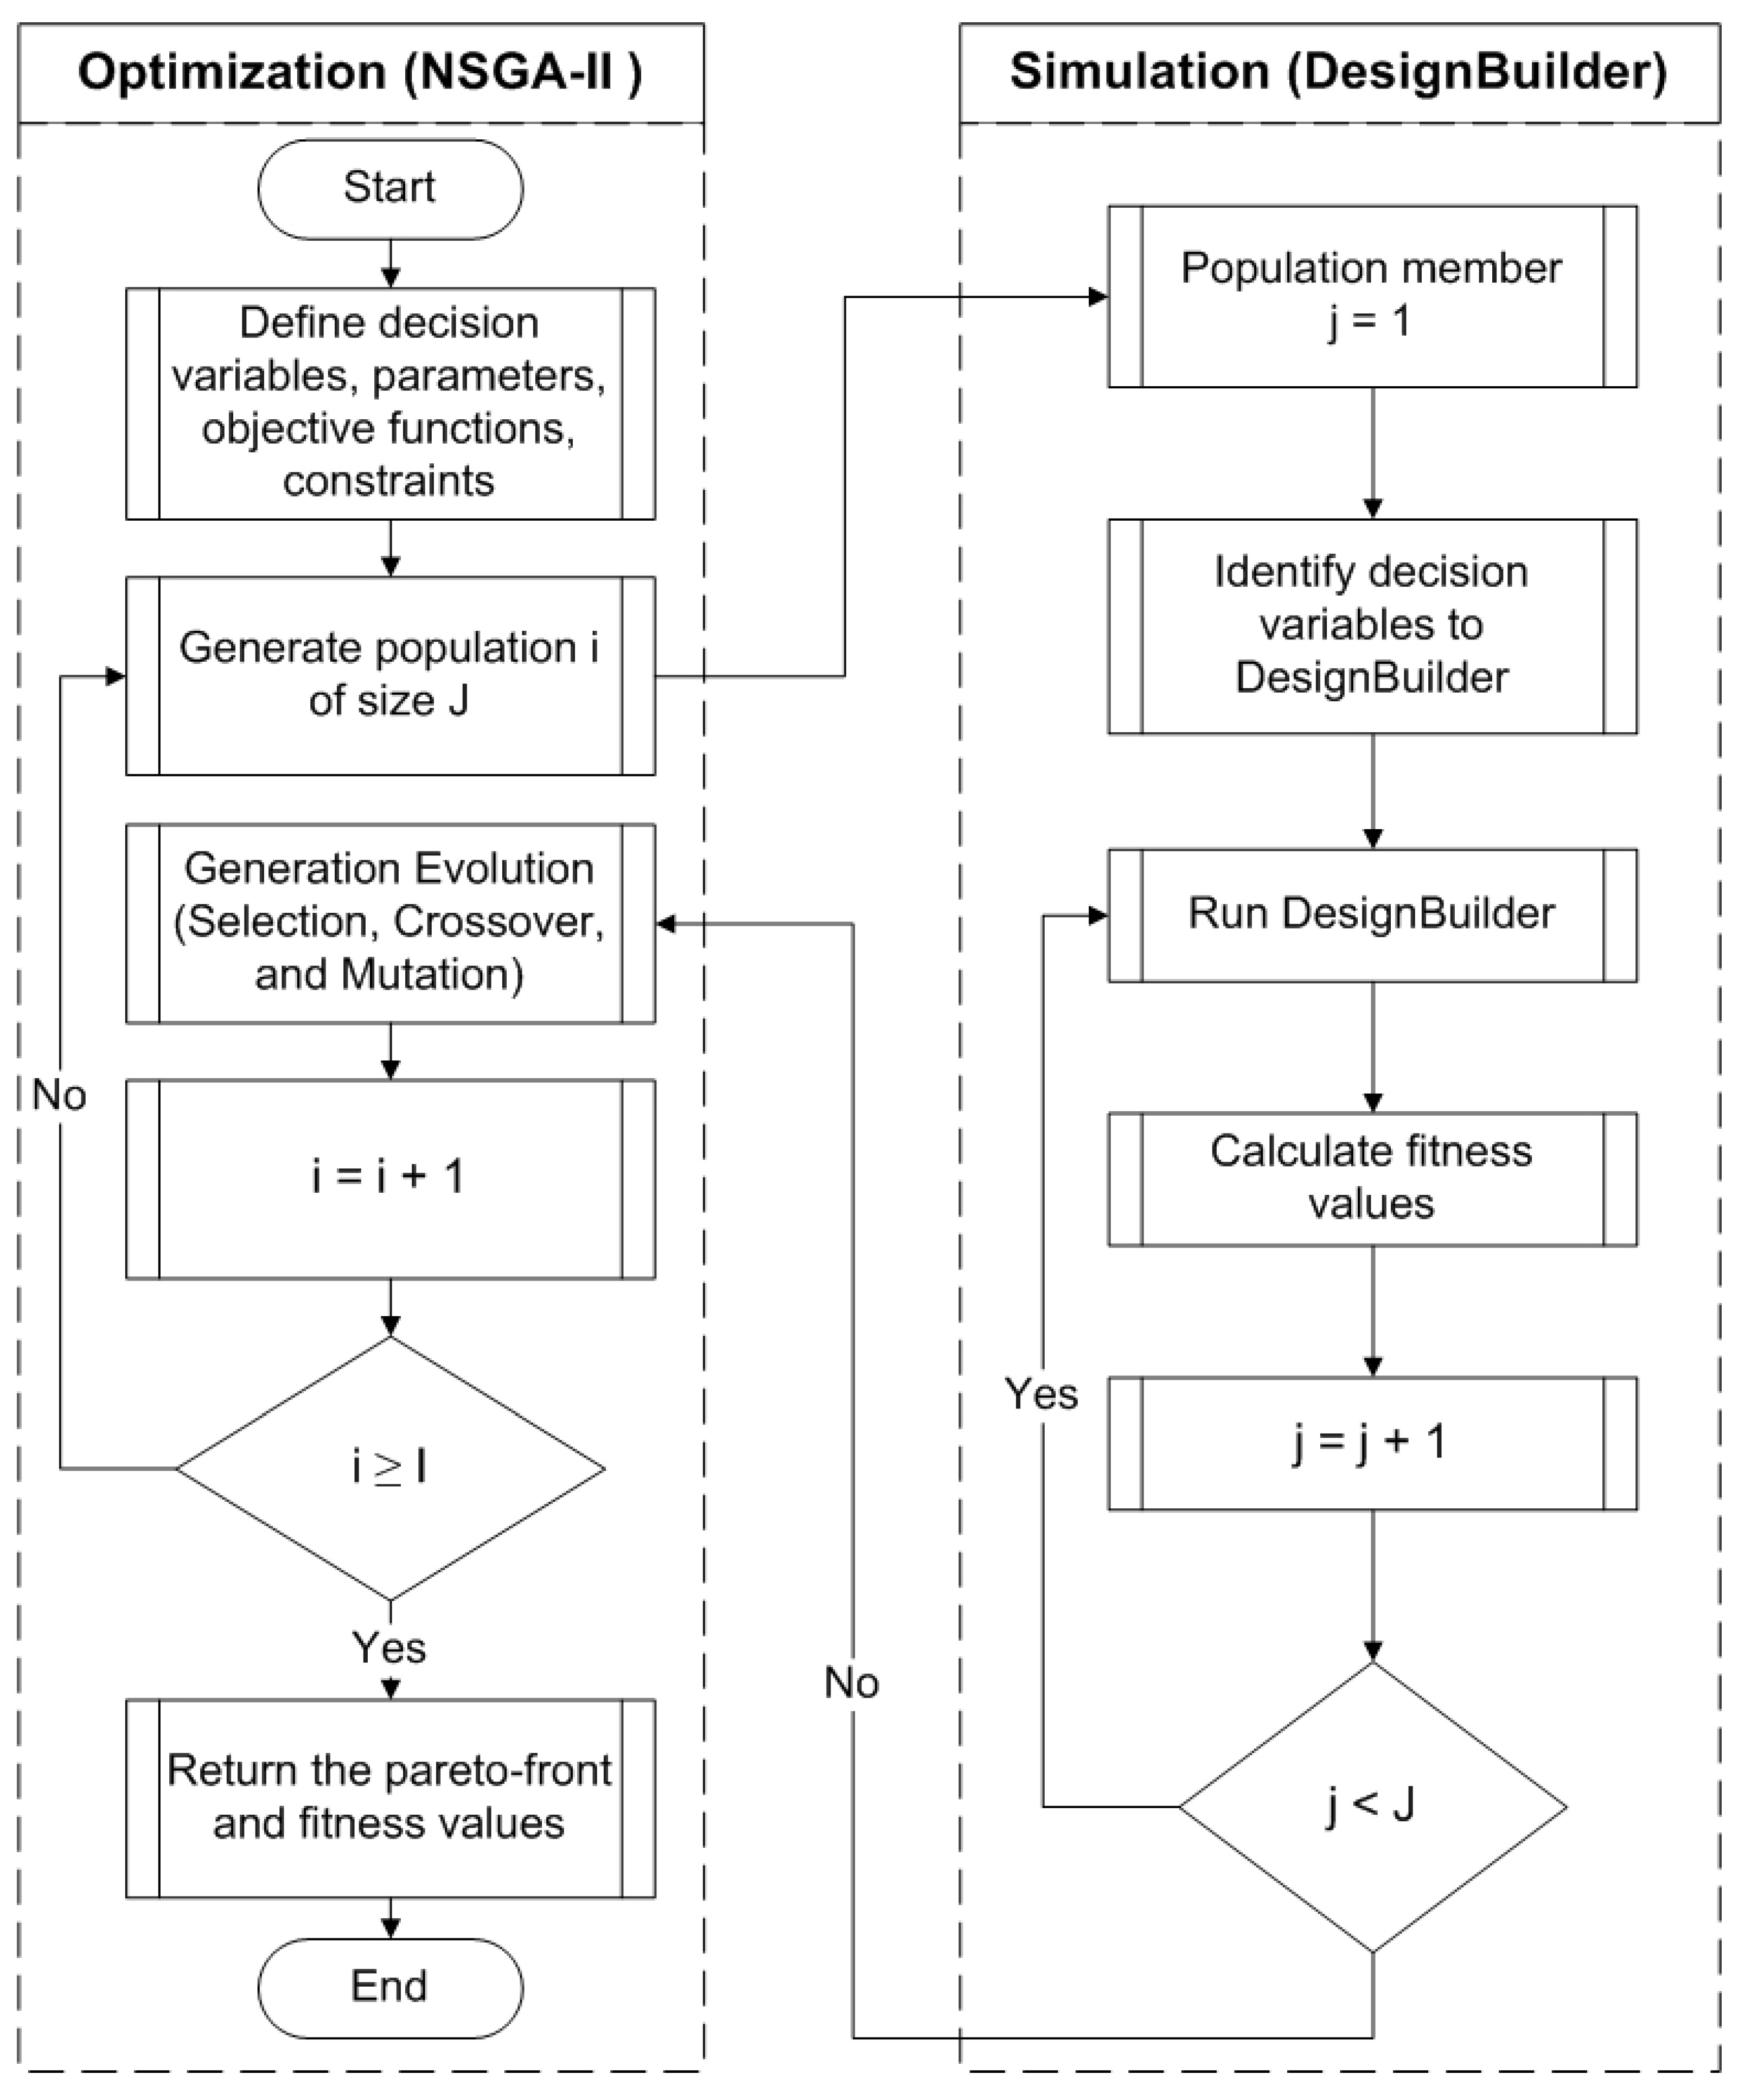
In the second stage, a multi-objective simulation-optimization is conducted, as shown in
Figure 9. This figure shows the integration between simulation and optimization. This study uses the non-dominated sorting genetic algorithm (NSGA II) as the optimization algorithm. Previous studies demonstrated the efficiency of NSGA II in solving complex multi-objective simulation-optimization problems [
58,
59,
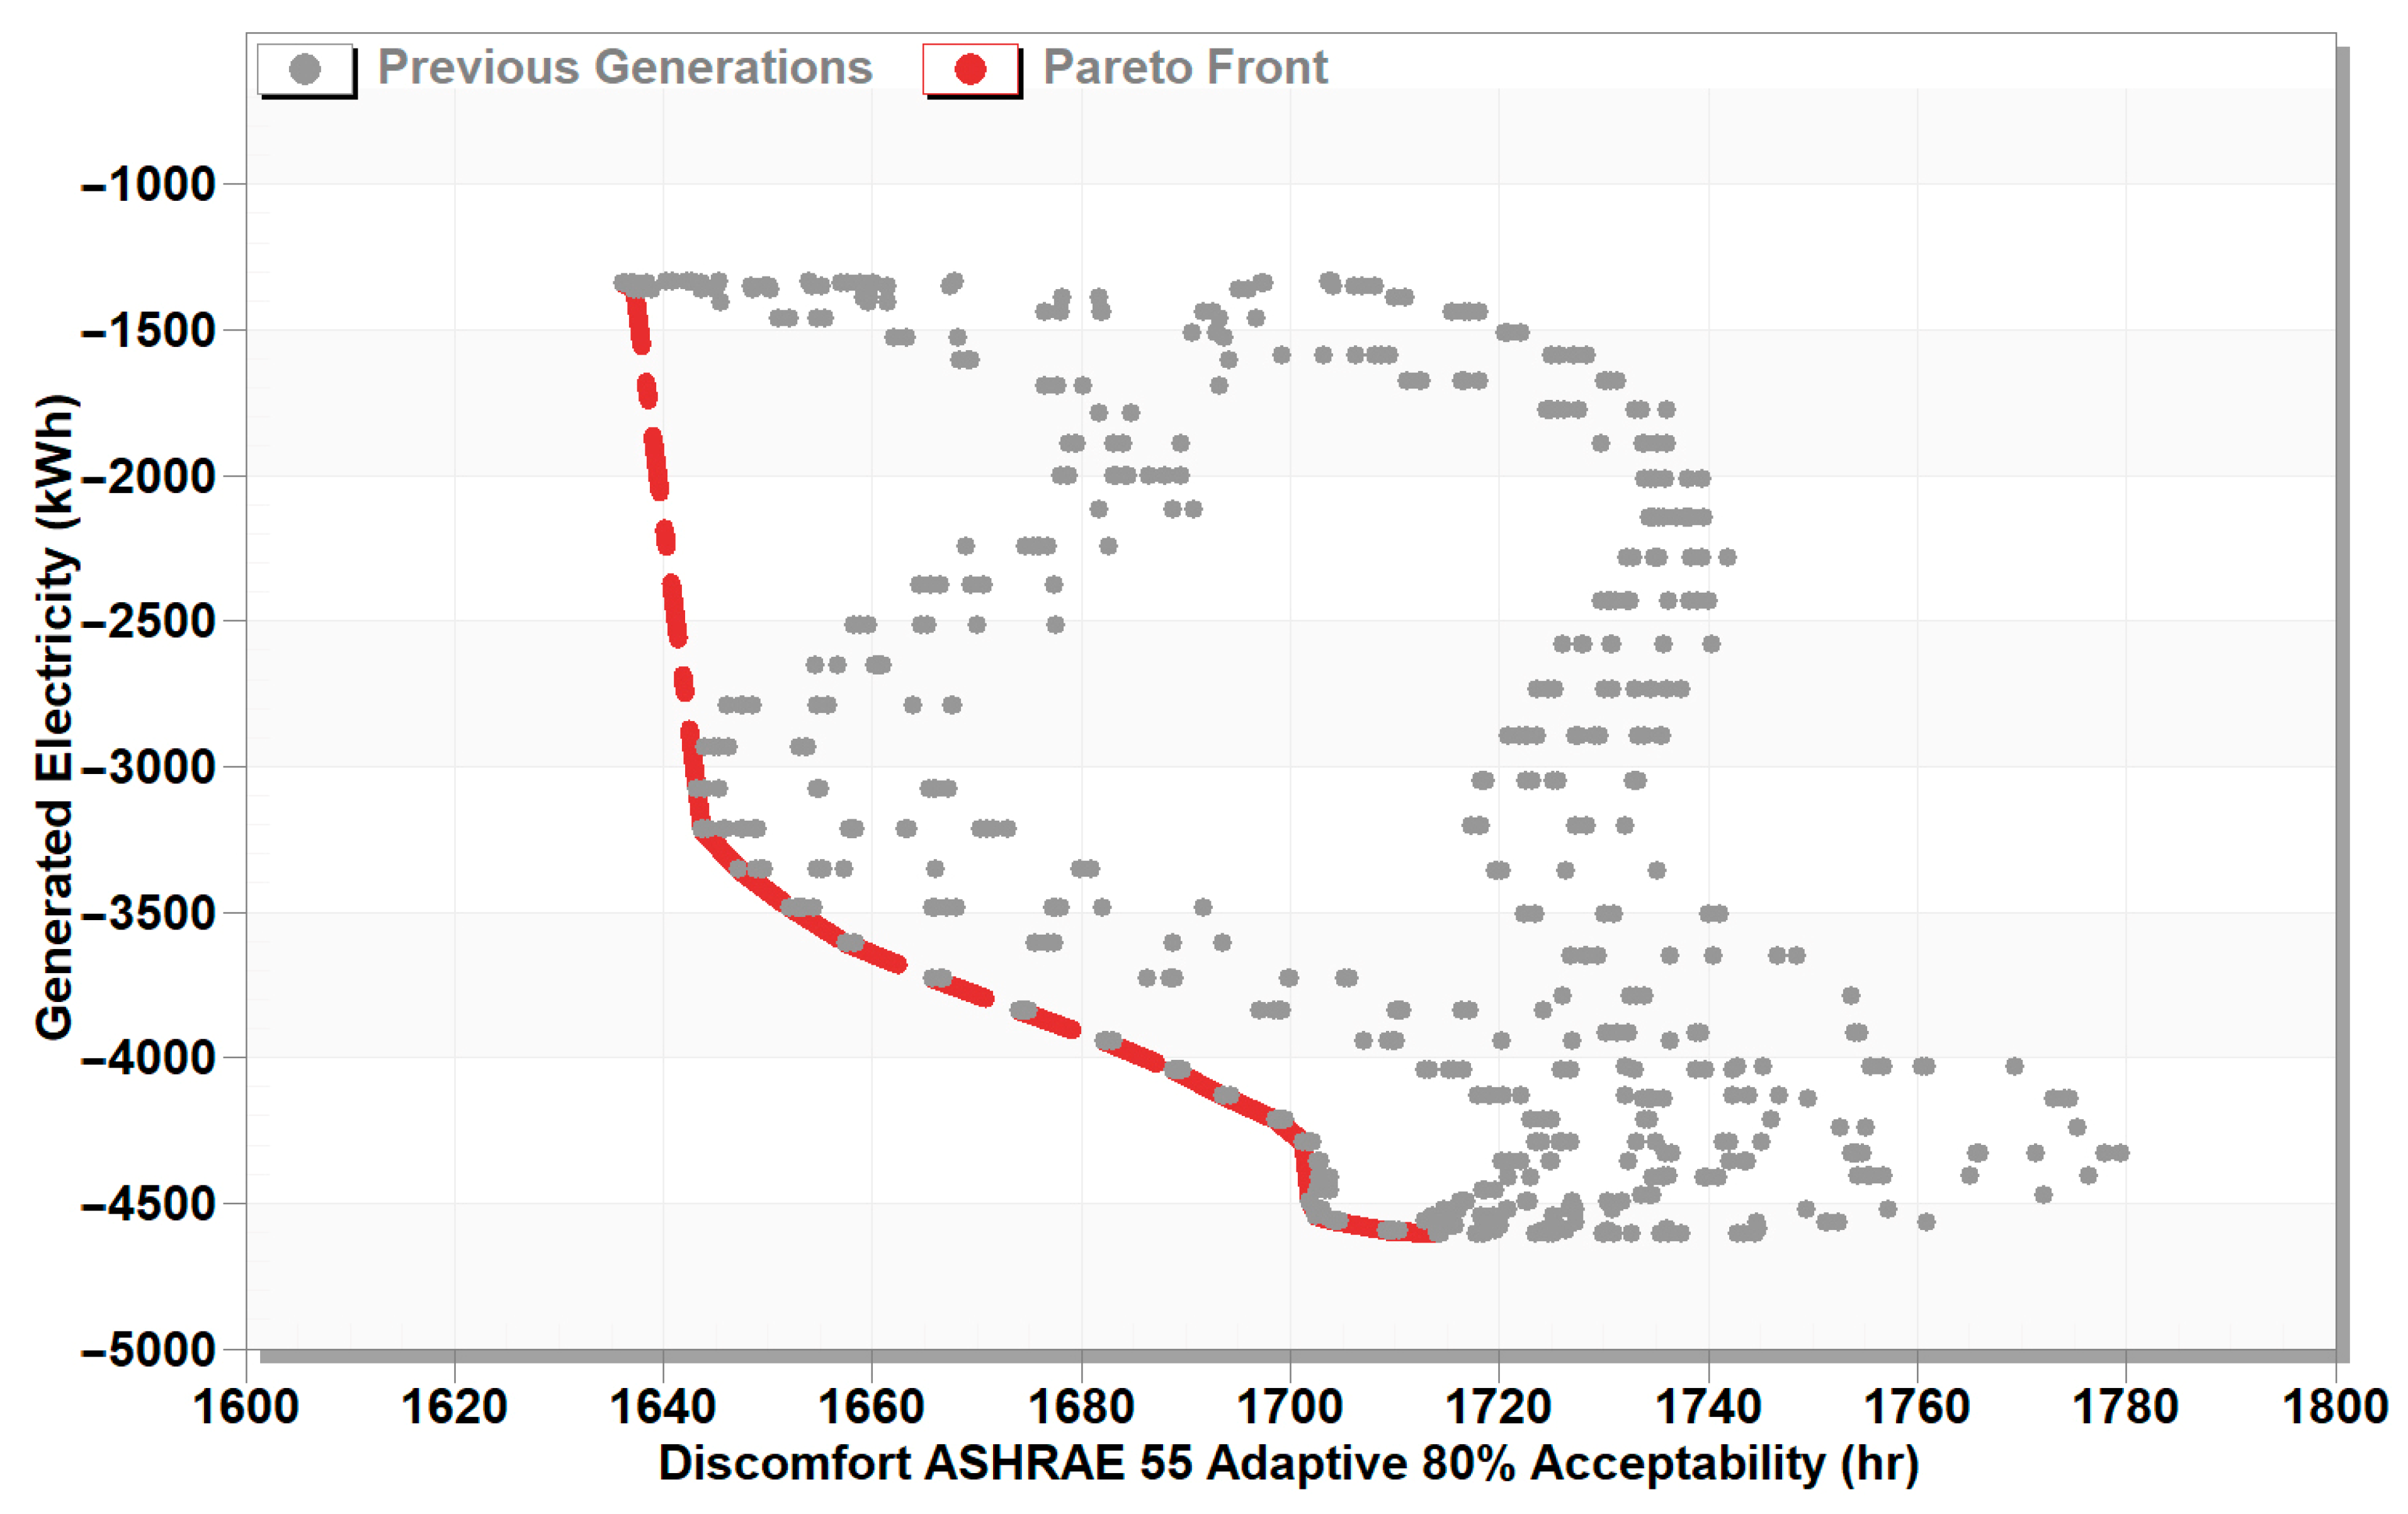
60]. Firstly, the decision variables, parameters, objective functions, and constraints are defined. The decision variables are the design parameters of MTW (i.e., glazing, the massive wall, the vents-to-wall ratio, the room window-to-wall ratio, and the orientation). The optimum MTW width and air gap depth values obtained from the first stage are defined as optimization parameters in this stage. The objective functions are: (1) maximizing the PV cell energy generation rate and minimizing thermal discomfort according to ASHRAE 55 Adaptive 80% Acceptability; and (2) minimizing heating and cooling electricity. ASHRAE 55 is among the most widely utilized adaptive thermal comfort models globally. It indicates whether the indoor temperature aligns with the 80% acceptability limits for adaptive comfort [
61].
The constraints represent the value ranges of decision variables, discussed previously in
Figure 2. The second step is randomly generating an initial population of size J, where each member (j) represents a unique combination of decision variables. DesignBuilder evaluates each member performance. After estimating the values of all members of the population, they are ranked using the non-dominated sorting, and the best Pareto front is updated. Selection, crossover, and mutation processes are repeated until generating a new population. Each new population undergoes fitness evaluation in DesignBuilder, followed by repeated cycles of selection, crossover, and mutation until reaching the predefined maximum number of generations (I).
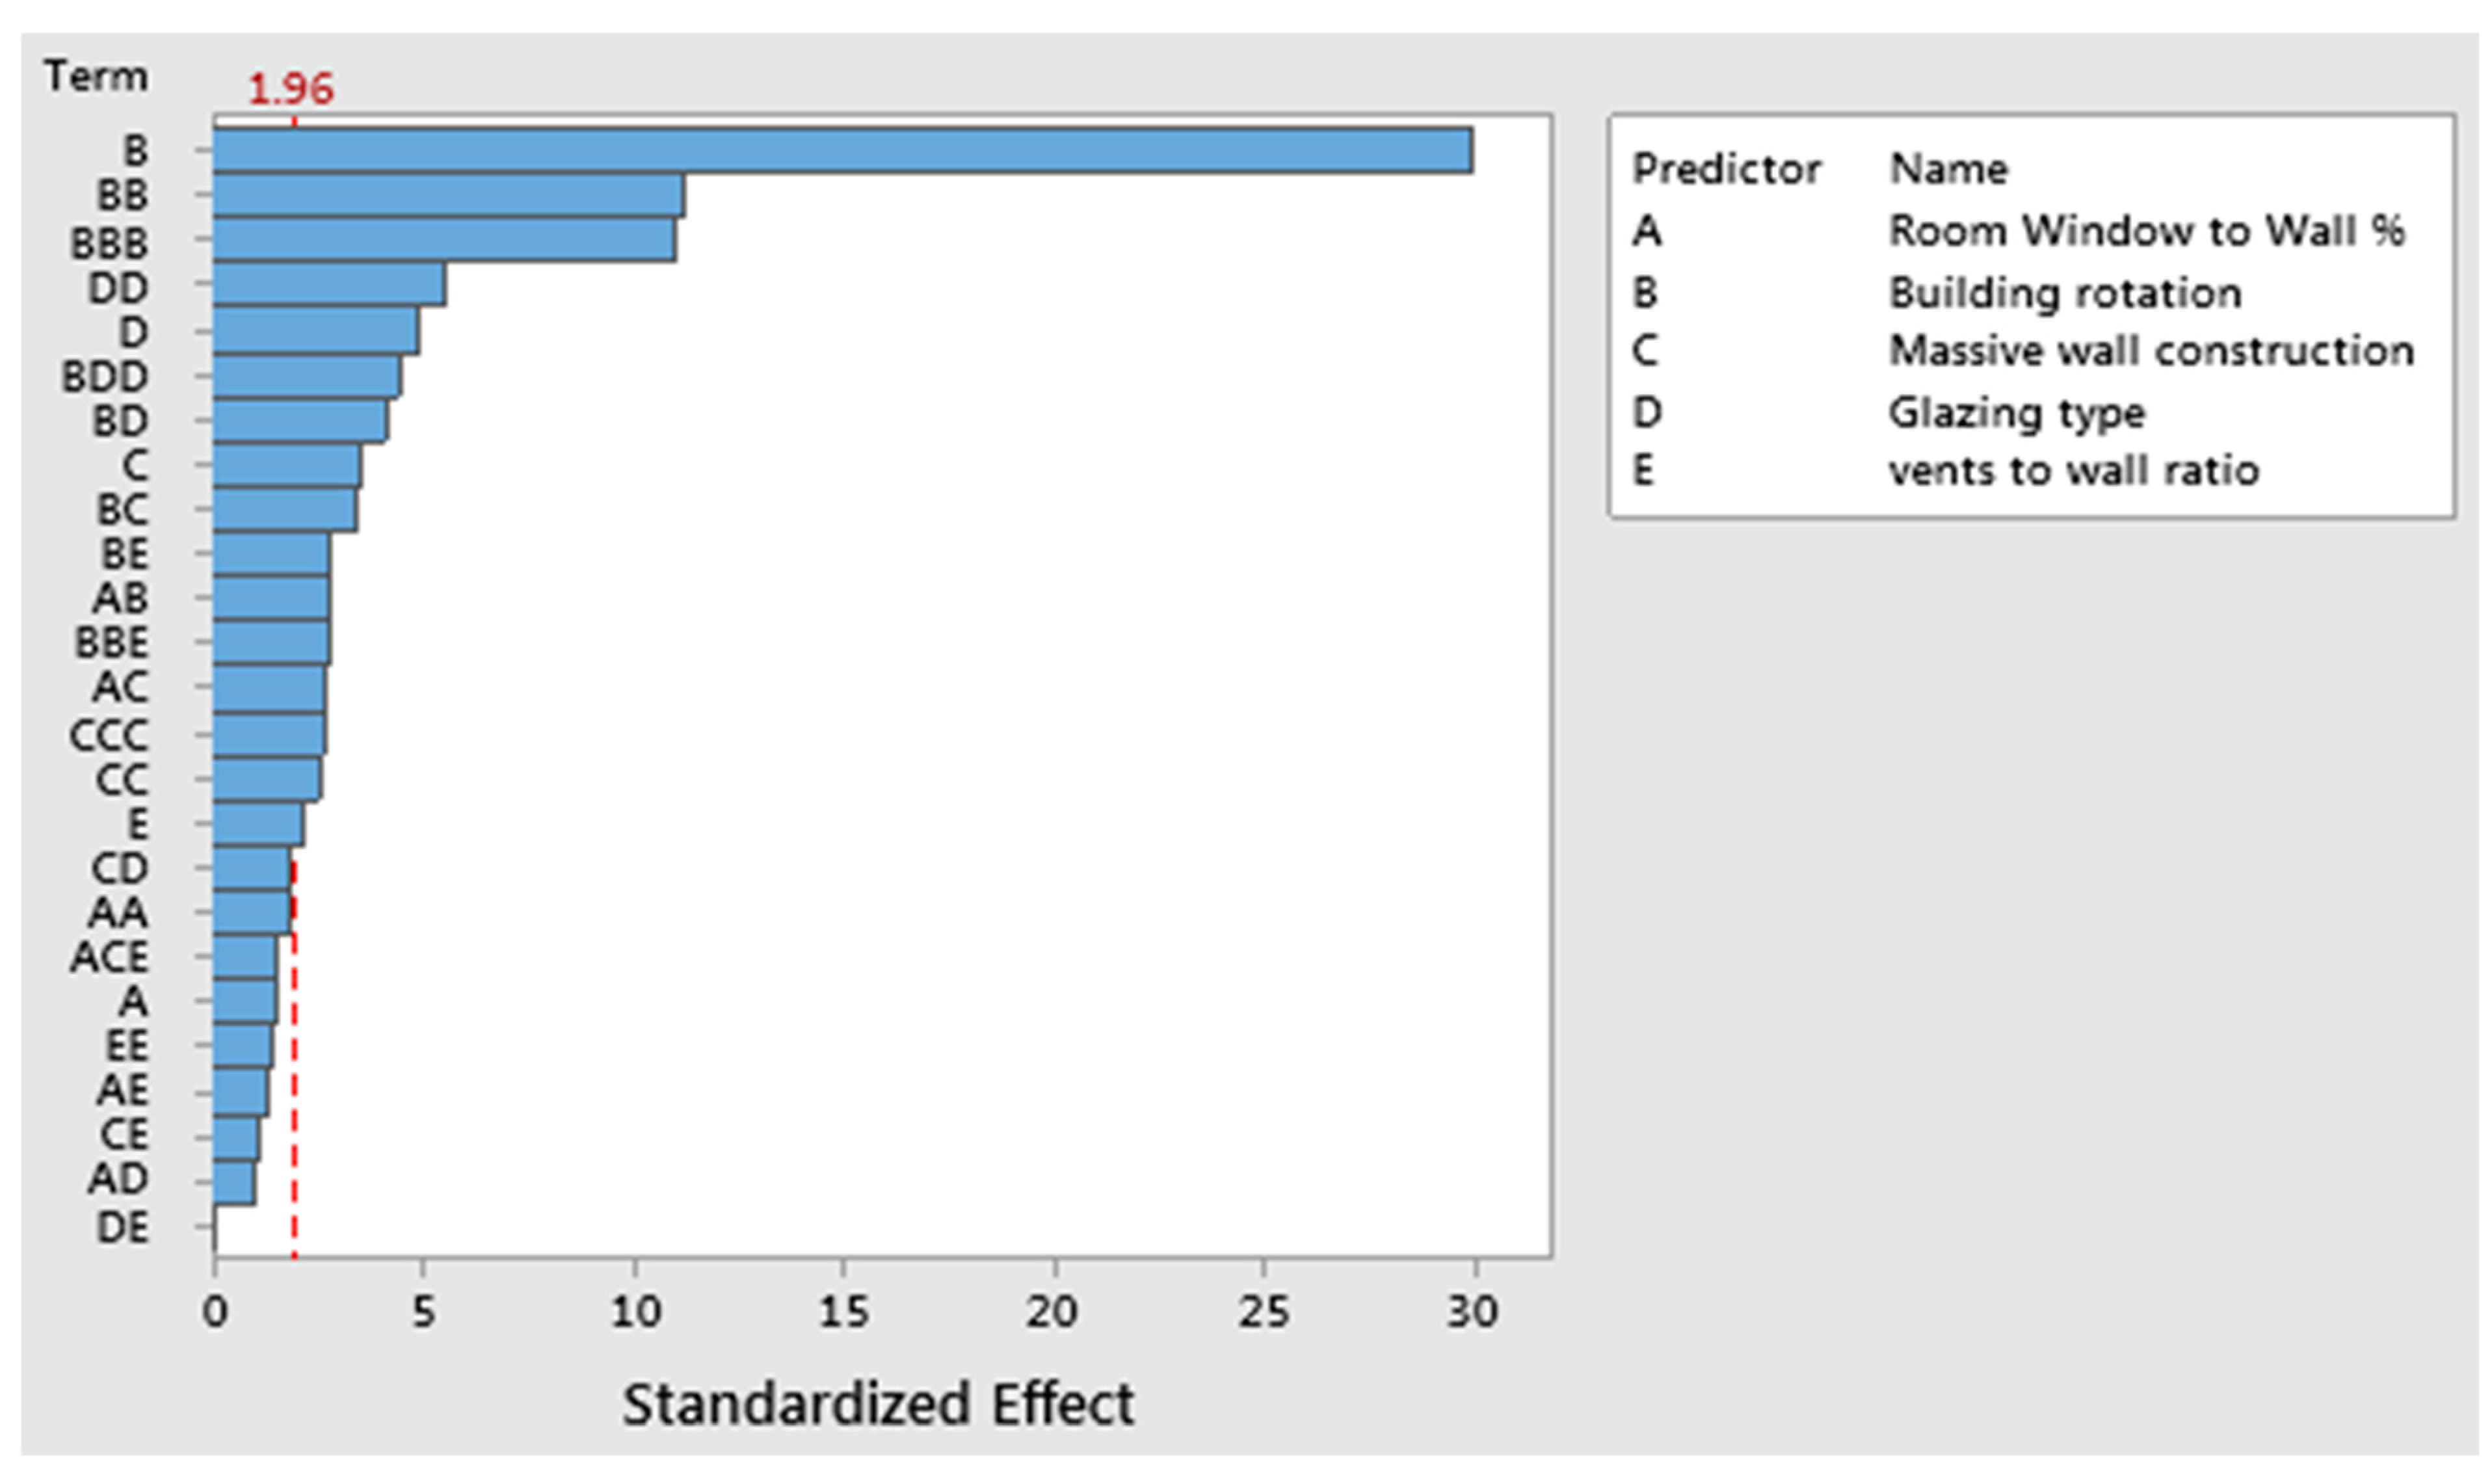
2.4. Regression Analysis
A multiple regression analysis using the least squares method was conducted via Minitab
® 19.1 statistics software [
62] to examine the Model Sensitivity and to develop a regression model for the MTW system. The “multiple regression” tool is utilized to explain the relationship between a set of predictors (×1, ×2, ×3, etc.) and the response variable (
Y). The general formula for multiple regression is represented as:
where
is the dependent variable:
,
,…,
are the independent variables;
is the intercept;
are the linear, quadratic, and cubic coefficients;
represents interaction terms (
, capturing interactions between predictors); and
is the error term.
The predictors corresponded to five design variables: the type and thickness of the massive wall, the type and thickness of the glazing layer, the vent-to-wall ratio, the window-to-wall ratio, and the orientation. The response variable was determined as PV energy generation rates and the number of discomfort hours. Using the regression model, equations were generated to predict the number of discomfort hours and PV generation rates.
4. Discussion and Future Directions
This study explored the potential of multi-story Trombe Wall (MTW) as a hybrid passive design strategy for heating, cooling, and electricity generation. Recent studies have investigated the thermal performance of Trombe Walls and their advanced configurations, highlighting their potential for both passive cooling and heating, with a predominant focus on enhancing heating performance.
In cooling mode, the MTW in this study achieves a temperature reduction of up to 1.94 °C. This performance is comparable to the 0.78 °C cooling effect reported by Irshad et al. for PVTW but slightly lower than the reductions achieved by PVTW-venetian blind systems (2.1 °C) [
66], optimized TW incorporating solar chimney (2 °C) (Rabani et al.) [
67], and PCM-integrated TW (3.25 °C) (Li et al.) [
68]. However, it surpasses the cooling effect of double-layer PCM TWs, which ranged from 0.4 to 0.93 °C (Kong et al.) [
69]. For heating performance, the MTW increases indoor temperatures by 1.56 °C, outperforming the 0.5 °C improvement recorded by Bellos et al. for an extra window TW [
37] However, it falls below the 5.5 °C increase achieved by He et al. using a Venetian blind TW [
70] and the 1–4 °C improvement observed by Abbassi and Dehmani with finned TWs [
71].
Regarding thermal comfort, the MTW enhances comfort hours by 40%, a value comparable to the 43.81% improvement achieved by Lin et al. using a PV-PCM TW [
72] but higher than the 23.9% improvement achieved by Pourghorban and Asoodeh through adding advanced glazing [
27]. Overall, while the MTW provides balanced cooling and heating effects, its key advantage lies in its multi-story application, allowing it to enhance thermal performance across multiple rooms—unlike previous studies, which primarily focused on single-room configurations, making it a viable alternative for energy-efficient multi-story building applications. Potential improvements could be achieved by integrating phase change materials (PCM), fins, blinds, and other advanced configurations, which have been shown in previous studies to enhance both passive cooling and heating performance.
While this study advances the understanding of multi-story Trombe Wall as a hybrid system, several limitations must be acknowledged. These limitations also present opportunities for further research, as outlined below:
This study primarily focused on analyzing the impact of the proposed MTW on indoor temperatures and PMV levels. However, incorporating a CFD analysis could provide more profound insights into airflow patterns and temperature variations across different floors. Additionally, modifying the air duct cross-section may offer better control over the performance of the multi-story Trombe Wall, highlighting the need for further investigation in this area.
Exploration of alternative building types and configurations: This research focused on a specific residential building. Investigating MTW applications in high-rise, commercial, and mixed-use buildings would help determine its broader architectural potential. Additionally, assessing the impact of different urban forms, including building density, height variations, and surrounding shading elements, would provide more insights into MTW efficiency in real-world scenarios.
Application of machine learning: The developed regression models demonstrated high predictive accuracy; however, integrating machine learning could enhance model precision and adaptability. Future work could focus on using artificial intelligence to optimize MTW performance.
Integration with smart control systems: Developing an intelligent control system to adjust vent openings, shading devices, and airflow rates could optimize the MTW’s performance.
Economic and lifecycle analysis: Investigating the cost-effectiveness and environmental impact of MTW compared to traditional heating and cooling systems would provide practical insights for designers.
The validation process was conducted over a 24 h period due to constraints in obtaining long-term real-world data in an occupied building. While this approach aligns with previous studies, we recognize that a longer validation period could further enhance the reliability of the results. Future research should consider extended validation periods to improve the robustness of the findings.
The application of the MTW in temperate and cold climate regions may require further modifications to account for different environmental conditions, such as lower solar radiation levels and increased heating demand. This is an important aspect that warrants further exploration.
5. Conclusions
Trombe Walls, as a passive design technique, provide a cost-effective and eco-friendly solution by reducing heating and cooling energy consumption through solar-powered natural ventilation. Numerous studies have explored various TW designs and their impact on building performance. However, several research gaps remain: (1) Most studies examine TW parameters individually without considering their interrelationships; (2) Research primarily focuses on heating efficiency, with limited attention to cooling performance in hot climates; (3) Studies mainly assess TWs in single-room setups, neglecting multi-story applications; and (4) A comprehensive optimization of TW design parameters is still needed. This study contributes by developing an optimized multi-story Trombe Wall (MTW) as a hybrid system for both heating and cooling. The key objectives are: (1) assessing the thermal and energy performance of the proposed MTW, (2) optimizing its design parameters to enhance energy efficiency and thermal comfort in residential buildings within hot climate regions, and (3) developing predictive equations to estimate its thermal and energy performance.
To achieve these objectives, a four-phase methodology was adopted. Firstly, the geometric and thermal parameters of the Trombe Wall (TW) design were identified through a literature review, followed by field measurements, modeling, and calibration for a residential case study in New Burj Al Arab City, Egypt. Then, a multi-story Trombe Wall (MTW) design was proposed based on the findings of the first phase. Consequently, a two-stage simulation-optimization was employed to evaluate the impact of seven key design parameters and find their optimum values. Finally, multiple regression analysis was applied to develop predictive equations for MTW performance. The key results of the study are:
From the literature review, the identified TW design parameters are the TW width, the air gap depth, the type and thickness of the massive wall, the type and thickness of the glazing layer, the vent-to-wall ratio, the room window-to-wall ratio, and the orientation.
A building energy simulation model (using DesignBuilder software) for a residential building in New Burj Al Arab City, Egypt, was validated with an RMSE of 1.33 and a relative error of 4.45%, confirming the reliability of the computational simulation.
A proposed multi-story TW system integrated with a PV blind was developed. The MTW has two operational modes: one for heating and one for cooling.
Regarding the impact of MTW width and air gap depth on the thermal performance:
In the heating mode, increasing the width or reducing the air gap depth of the MTW enhances thermal performance. The optimum MTW width and air gap depth are 375 cm and 30 cm, respectively. The maximum temperature increase reached up to 1.56 °C;
In the cooling mode, decreasing the width or increasing the air gap depth of the MTW enhances thermal performance. The optimum MTW width and air gap depth are 175 cm and 90 cm, respectively. The maximum temperature reduction reached 1.94 °C;
Implementing the MTW in the cooling mode resulted in a noticeable reduction in PMV values. This improvement translated into a 40% increase in comfort hours.
Regarding the impact of MTW width and air gap depth on PV electricity generation, adjusting the MTW width or depth has minimal influence on the average energy generation rate per square meter of PV cells. Consequently, the PV cells’ alignment and total surface area remain the primary factors determining electricity output. During cooling mode, the average generation rate was 815 kilowatts per square meter, compared to 572 kilowatts per square meter in heating mode.
The developed regression models for discomfort in heating and cooling modes exhibit high R2 values of 70.20% and 83.29%, respectively. Also, the regression models for electricity generation in heating and cooling modes show strong predictive capability, with R2 values of 86.49% and 95.73%, respectively. These R2 values demonstrate that the models effectively represent variations in thermal discomfort and electricity generation.
The multi-objective simulation-optimization key results are:
- 1.
In the cooling mode, an inverse relationship was observed between discomfort hours and electricity generation. Twenty near-optimal solutions were obtained with a maximum electricity of 4603.95 kWh and a minimum discomfort of 1636.2 h.
- 2.
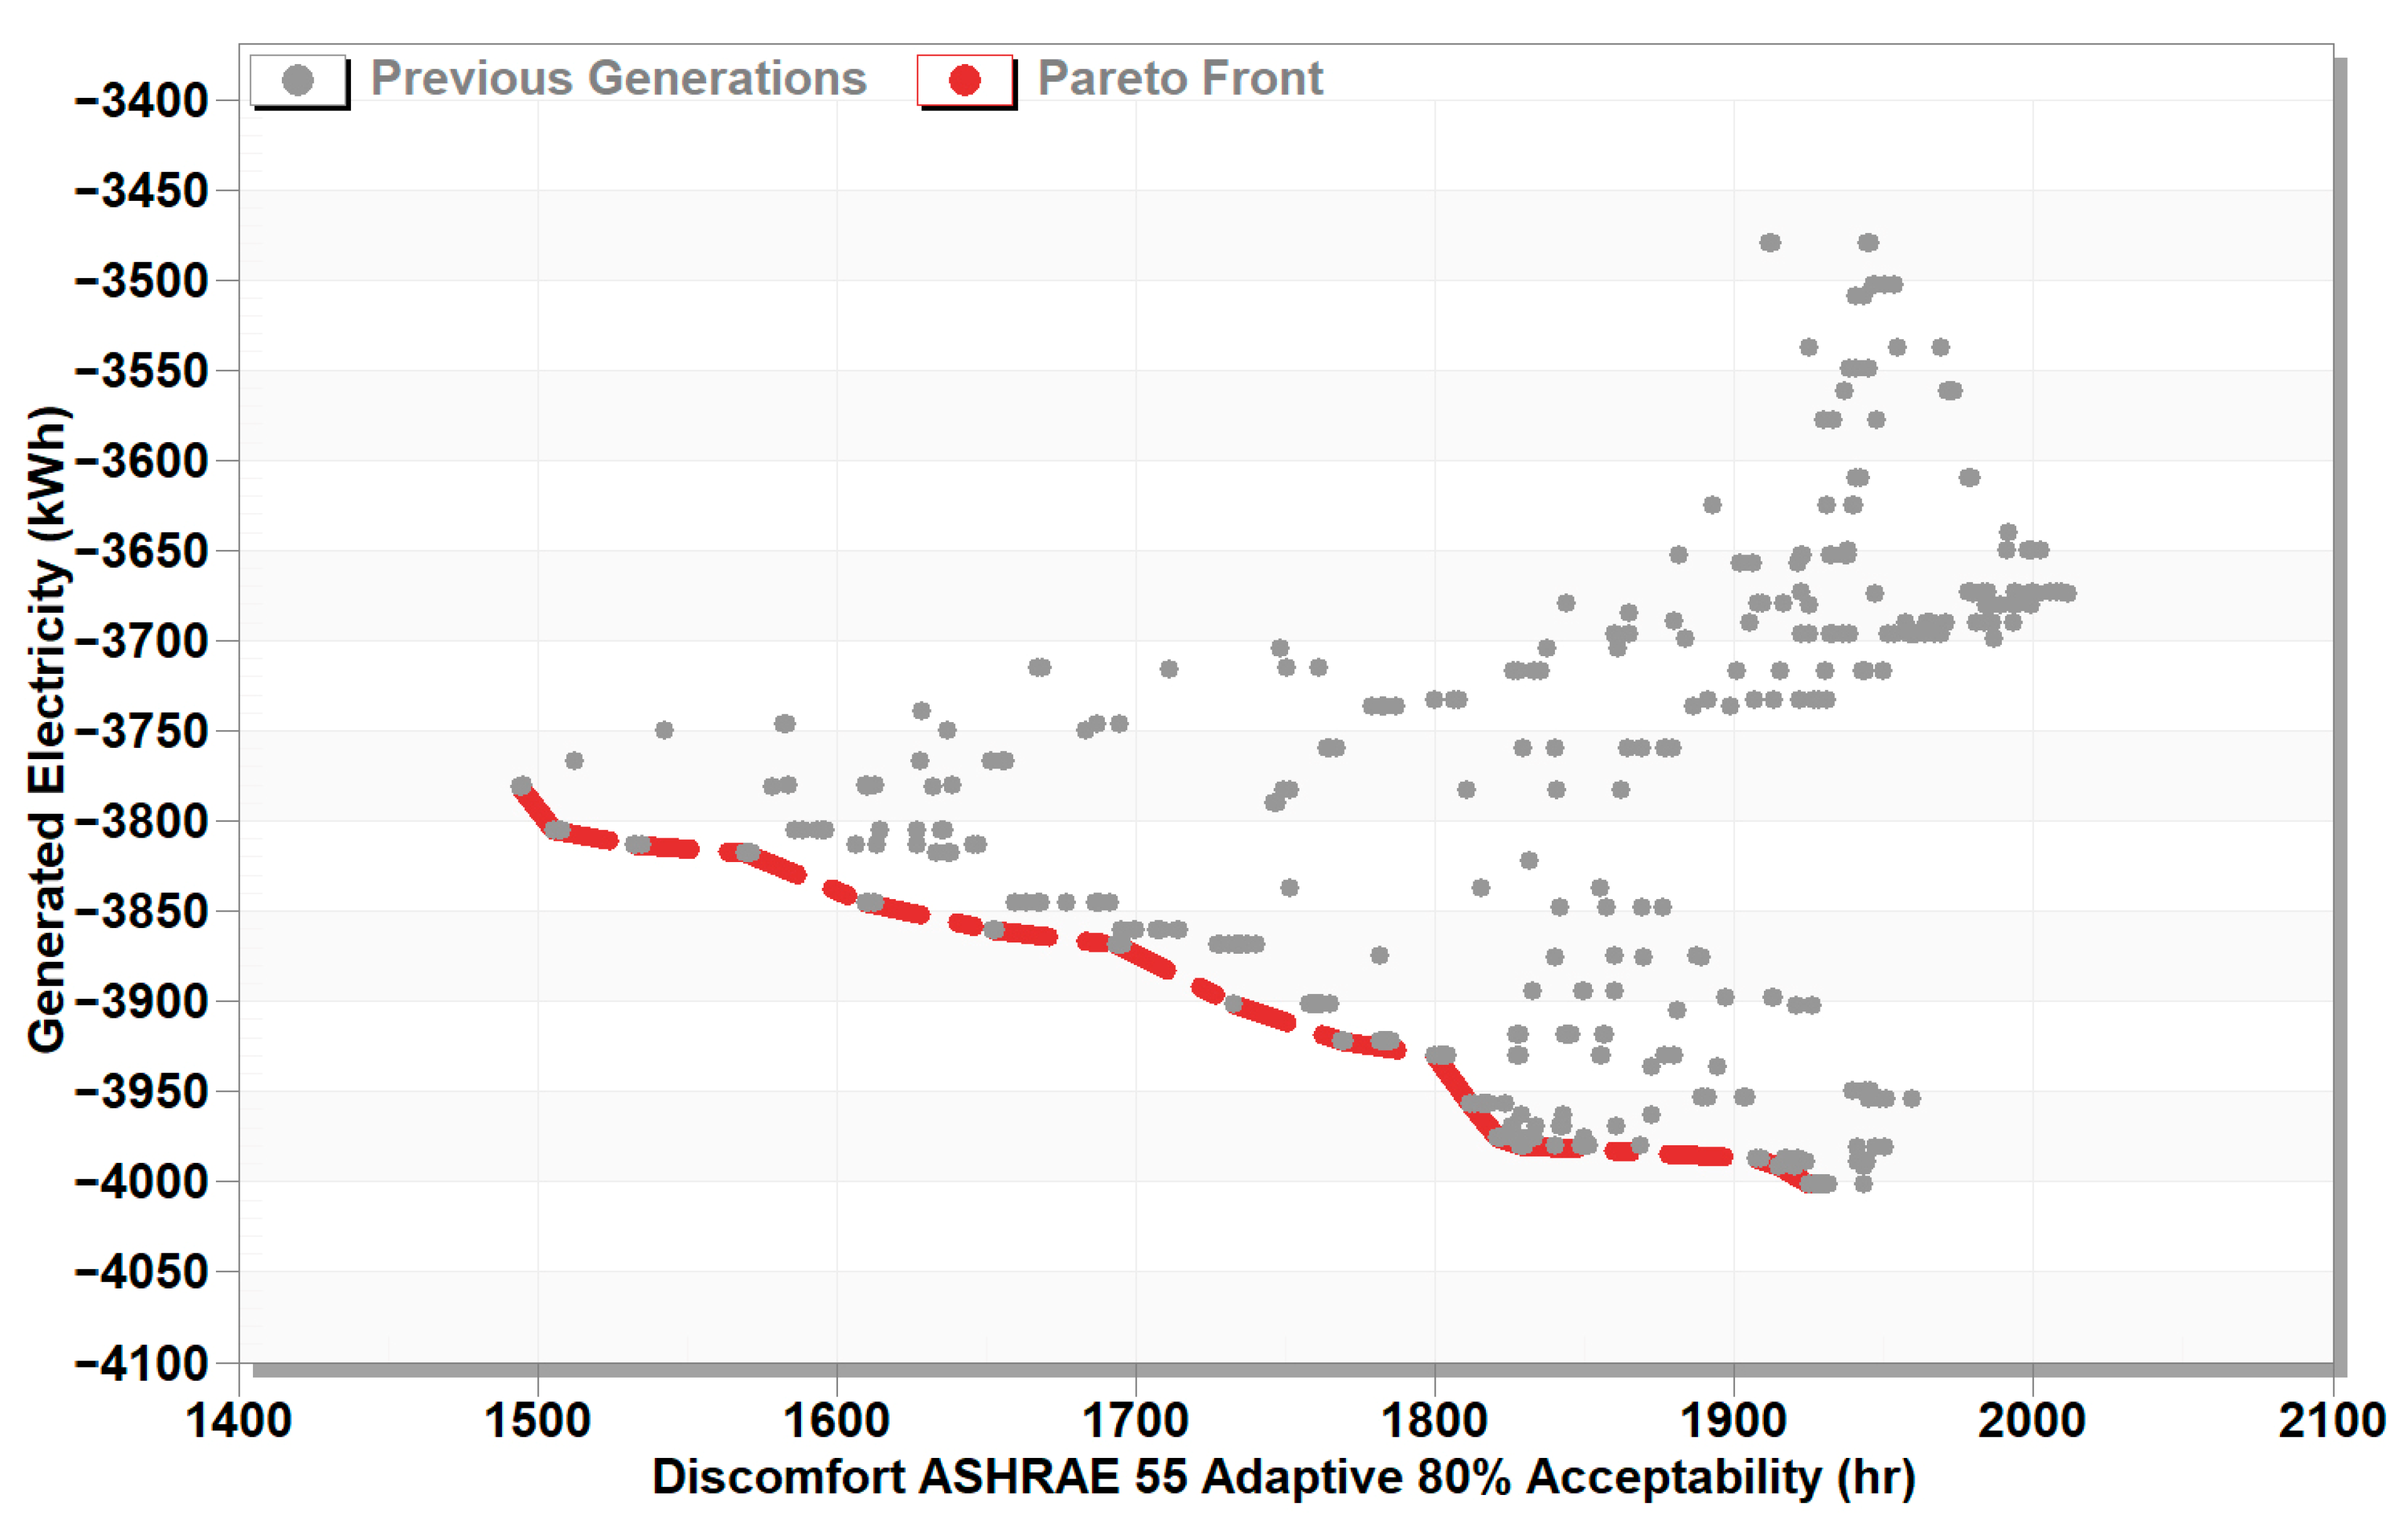
In the heating mode: A trade-off exists between discomfort hours and electricity generation. Sixteen solutions on the Pareto front were obtained with a maximum electricity of 4001.2 kWh and a minimum discomfort of 1503.7 h.
- 3.
The following design parameters could balance heating and cooling modes: a 375 cm width, 30 cm air gap depth, Triple low-e glazing, a massive wall of 20 cm-thick concrete block (u value of 3.871), around 130° building rotation, about 20% room window to wall ratio, and nearby 20% vents to wall ratio.
- 4.
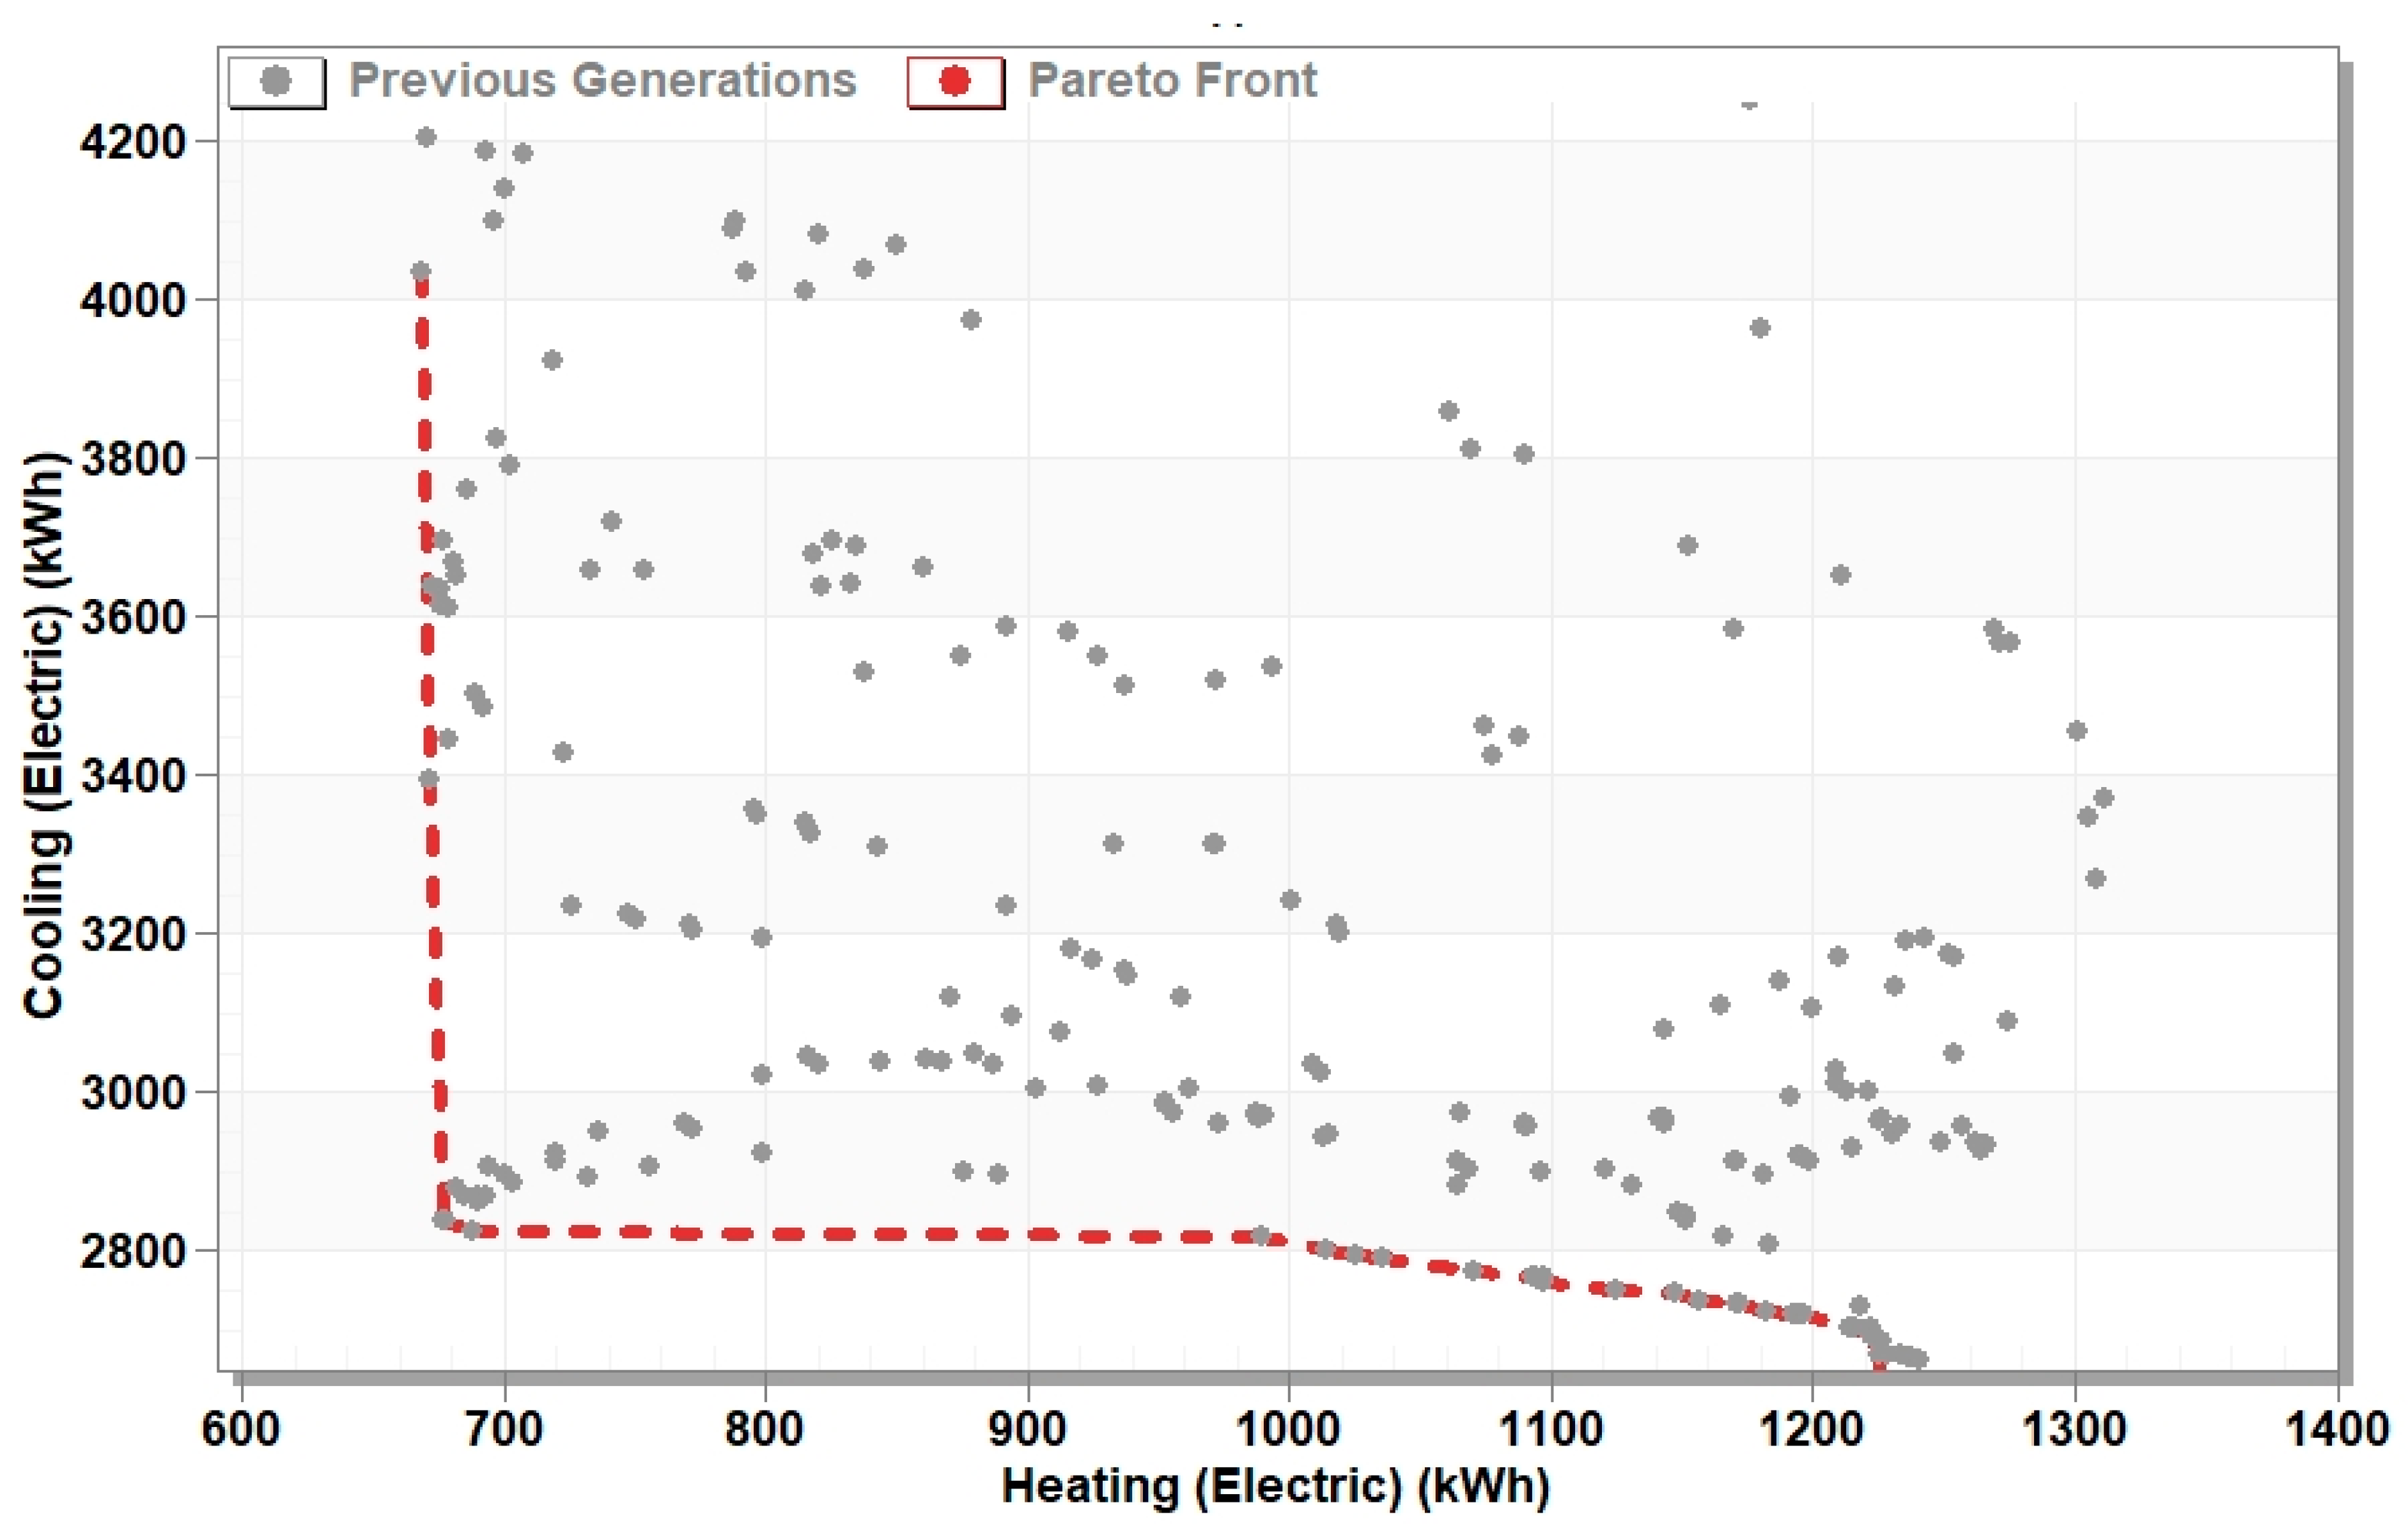
The Pareto front analysis revealed that the optimized MTW system can significantly reduce total energy demand, with near-optimal solutions maintaining low heating electricity (~700 kWh) and minimal cooling electricity (~2800 kWh) while ensuring comfortable indoor conditions.
- 5.
Optimizing the proposed MTW could increase the annually generated electricity by 31% on average.


 ,
, 
