
Experimental Analysis of the Slurry Diffusion Behavior Characteristics of Point Source Grouting and Perforated Pipe Grouting in Sandy Soil


Abstract
1. Introduction
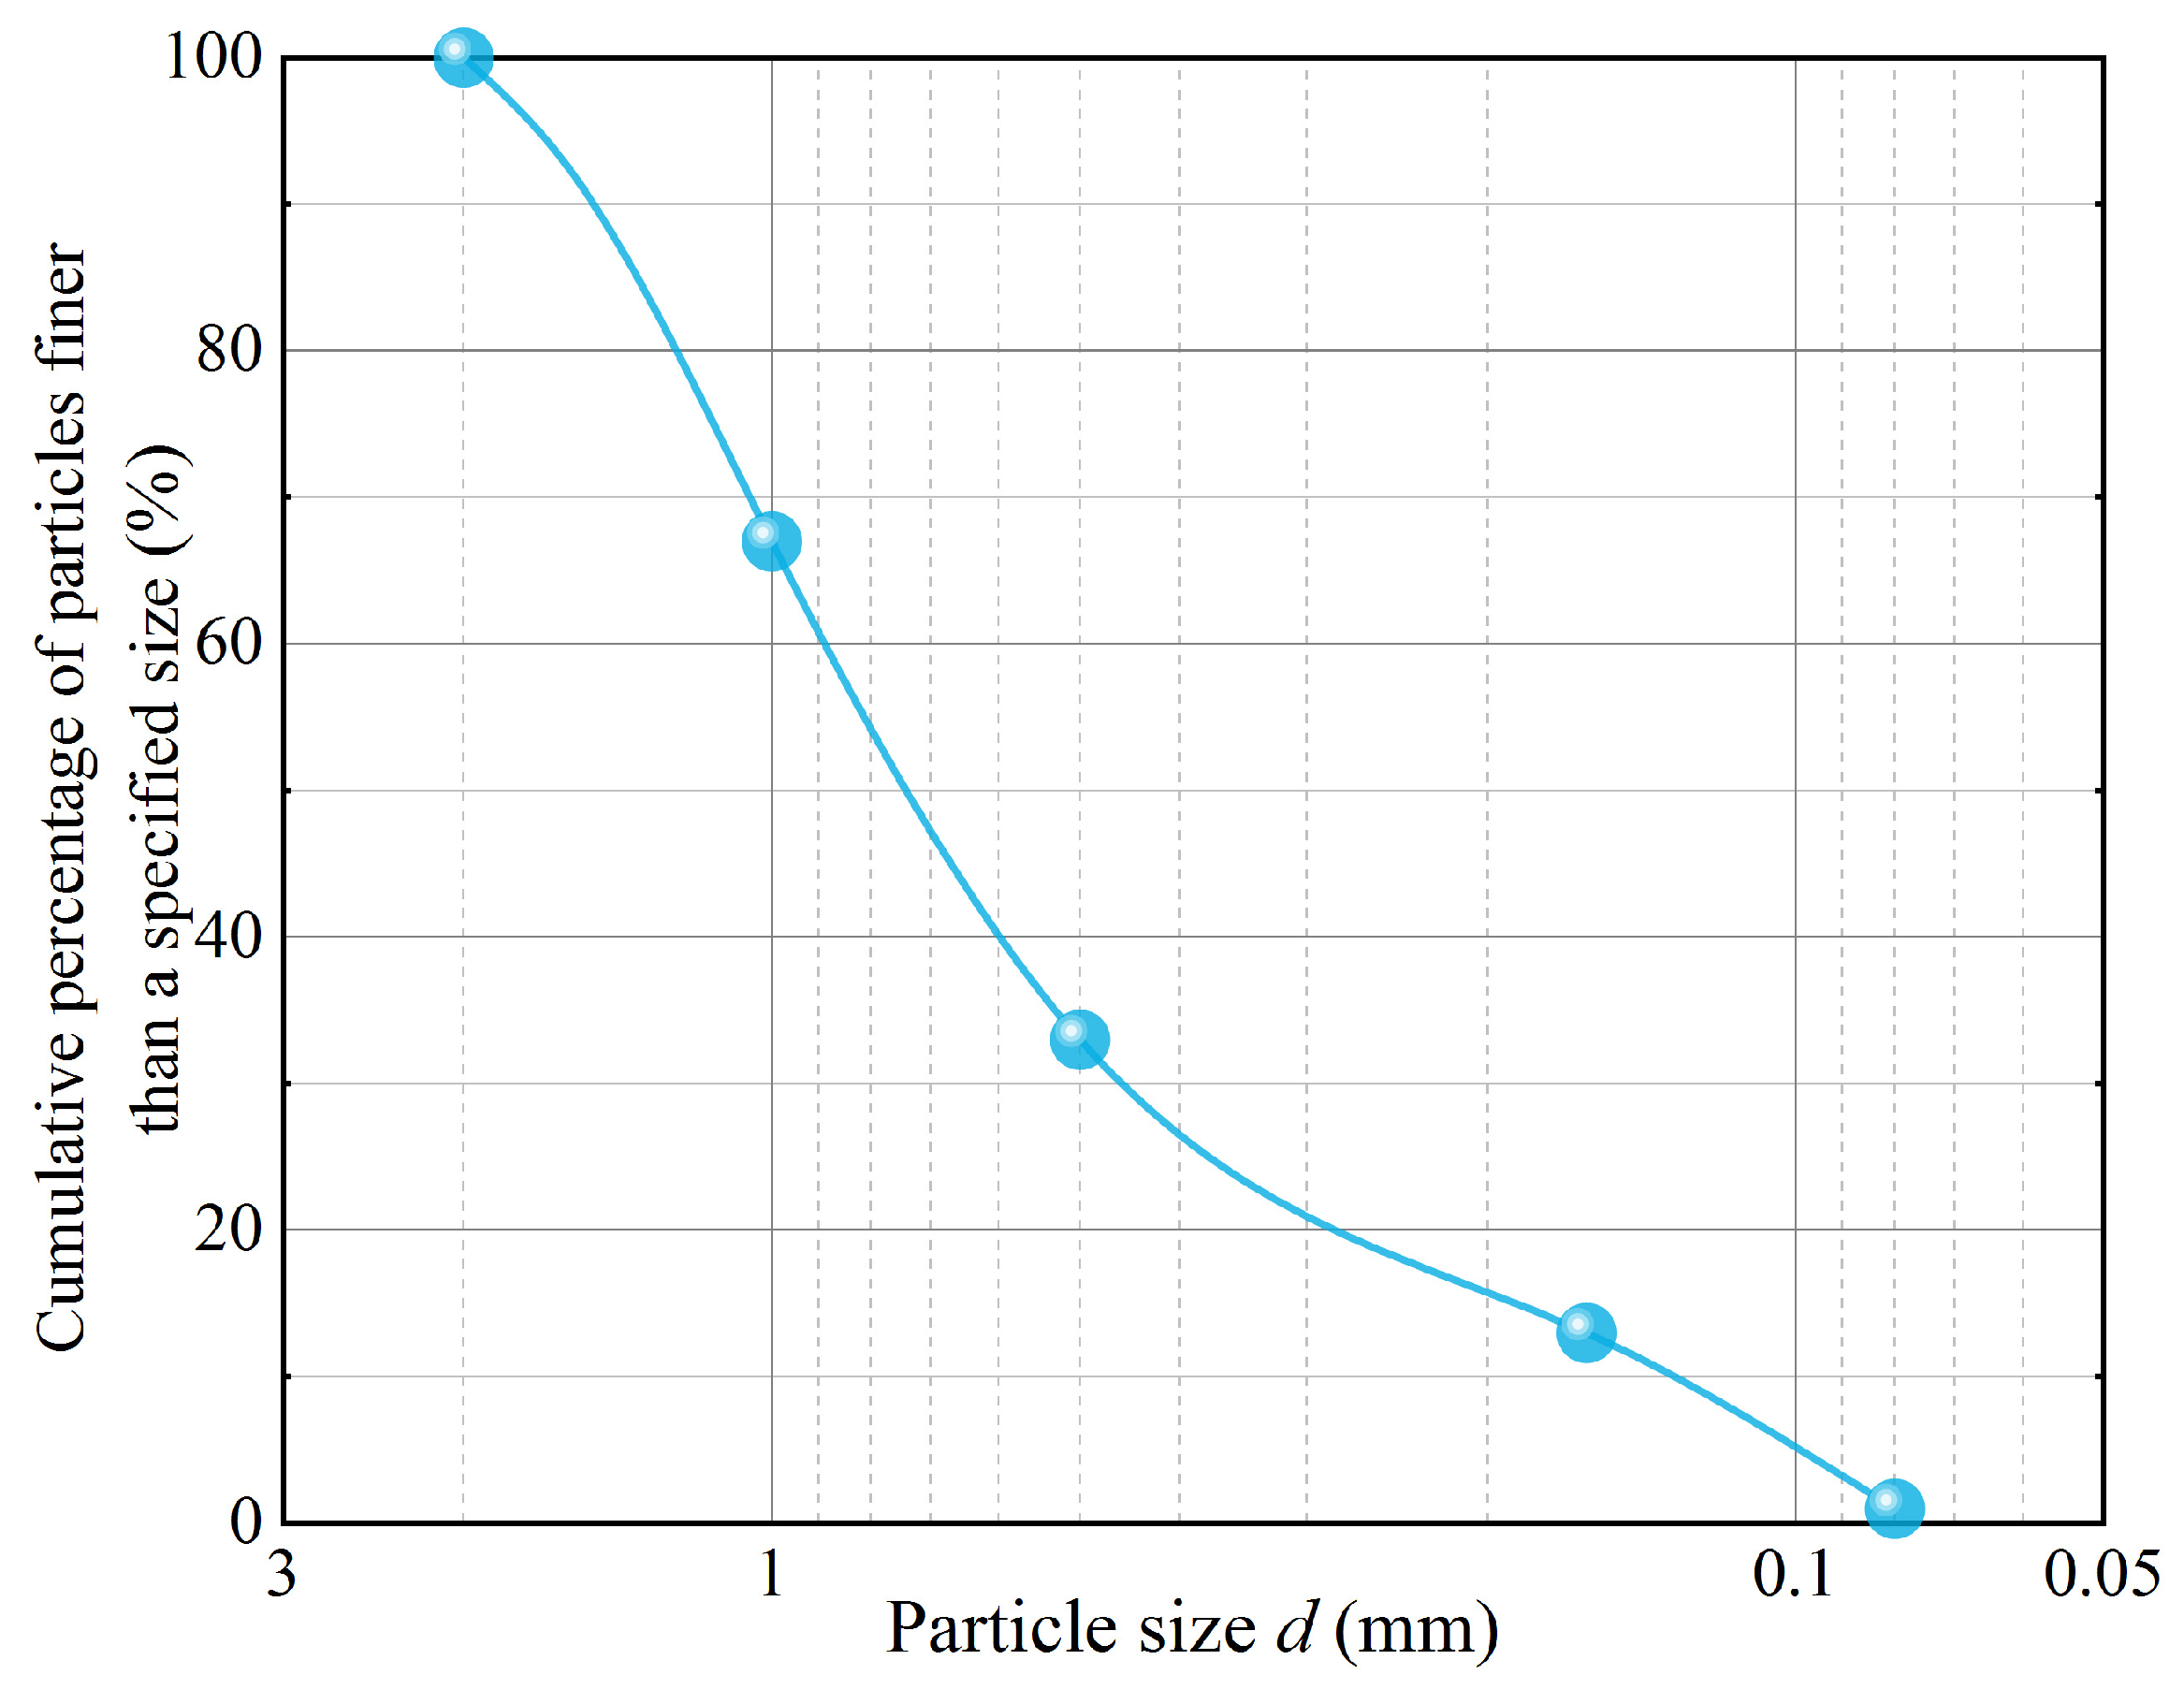
2. Test Materials
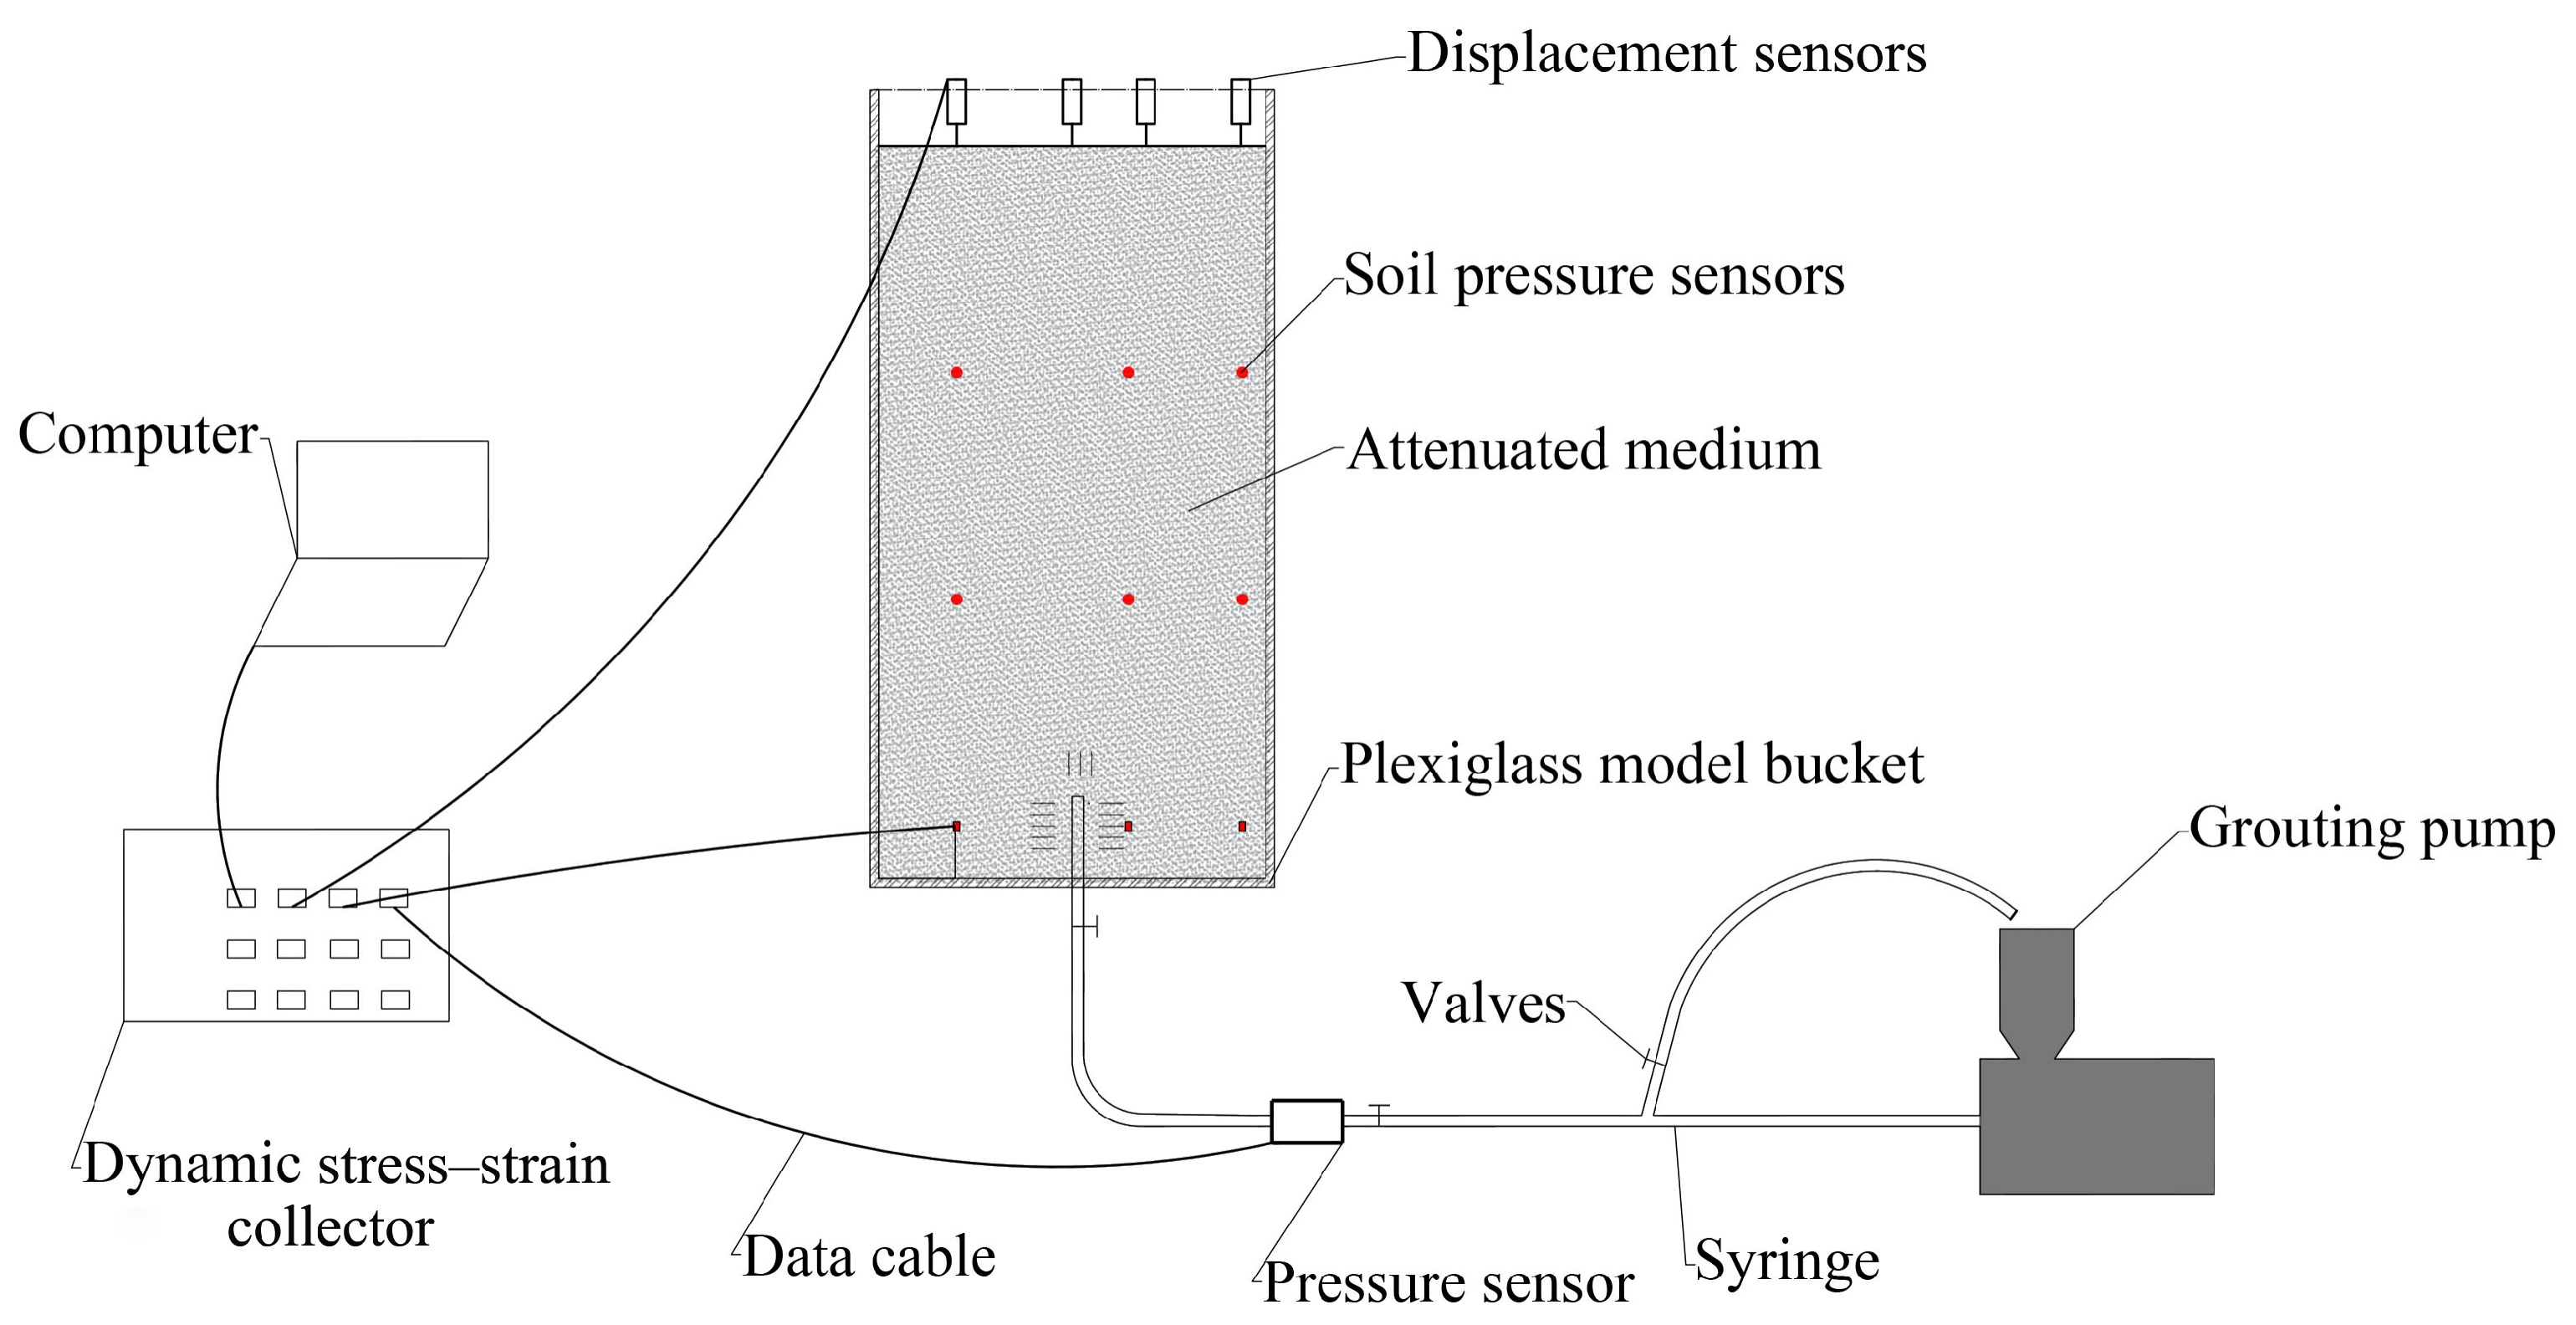
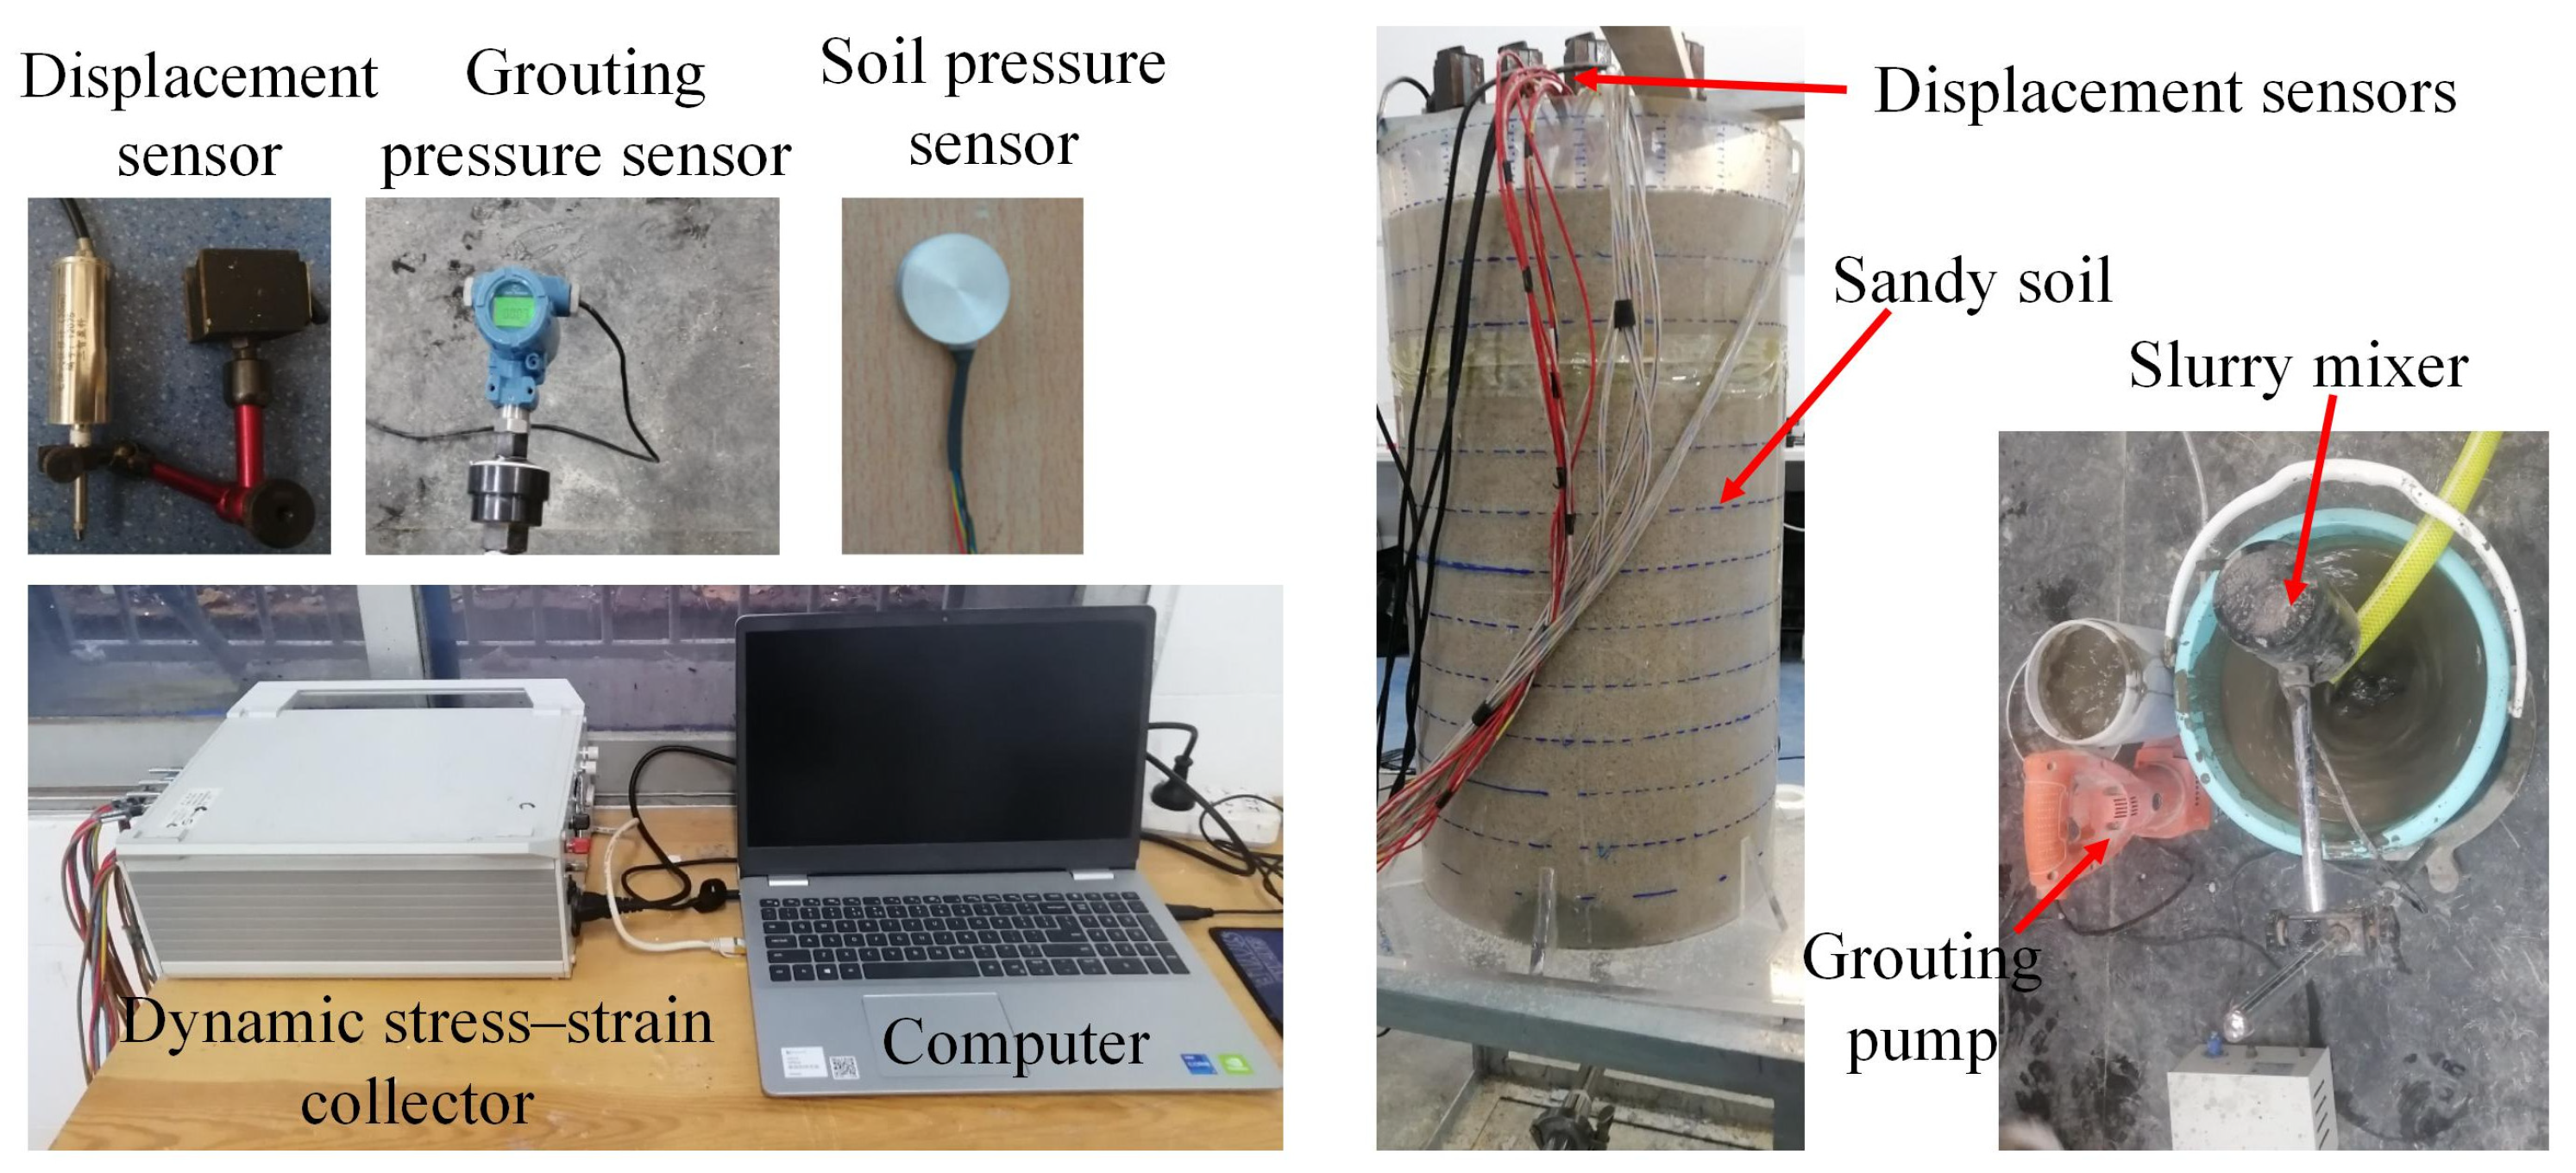
3. Test Set-Up Systems
4. Analysis of the Test Results
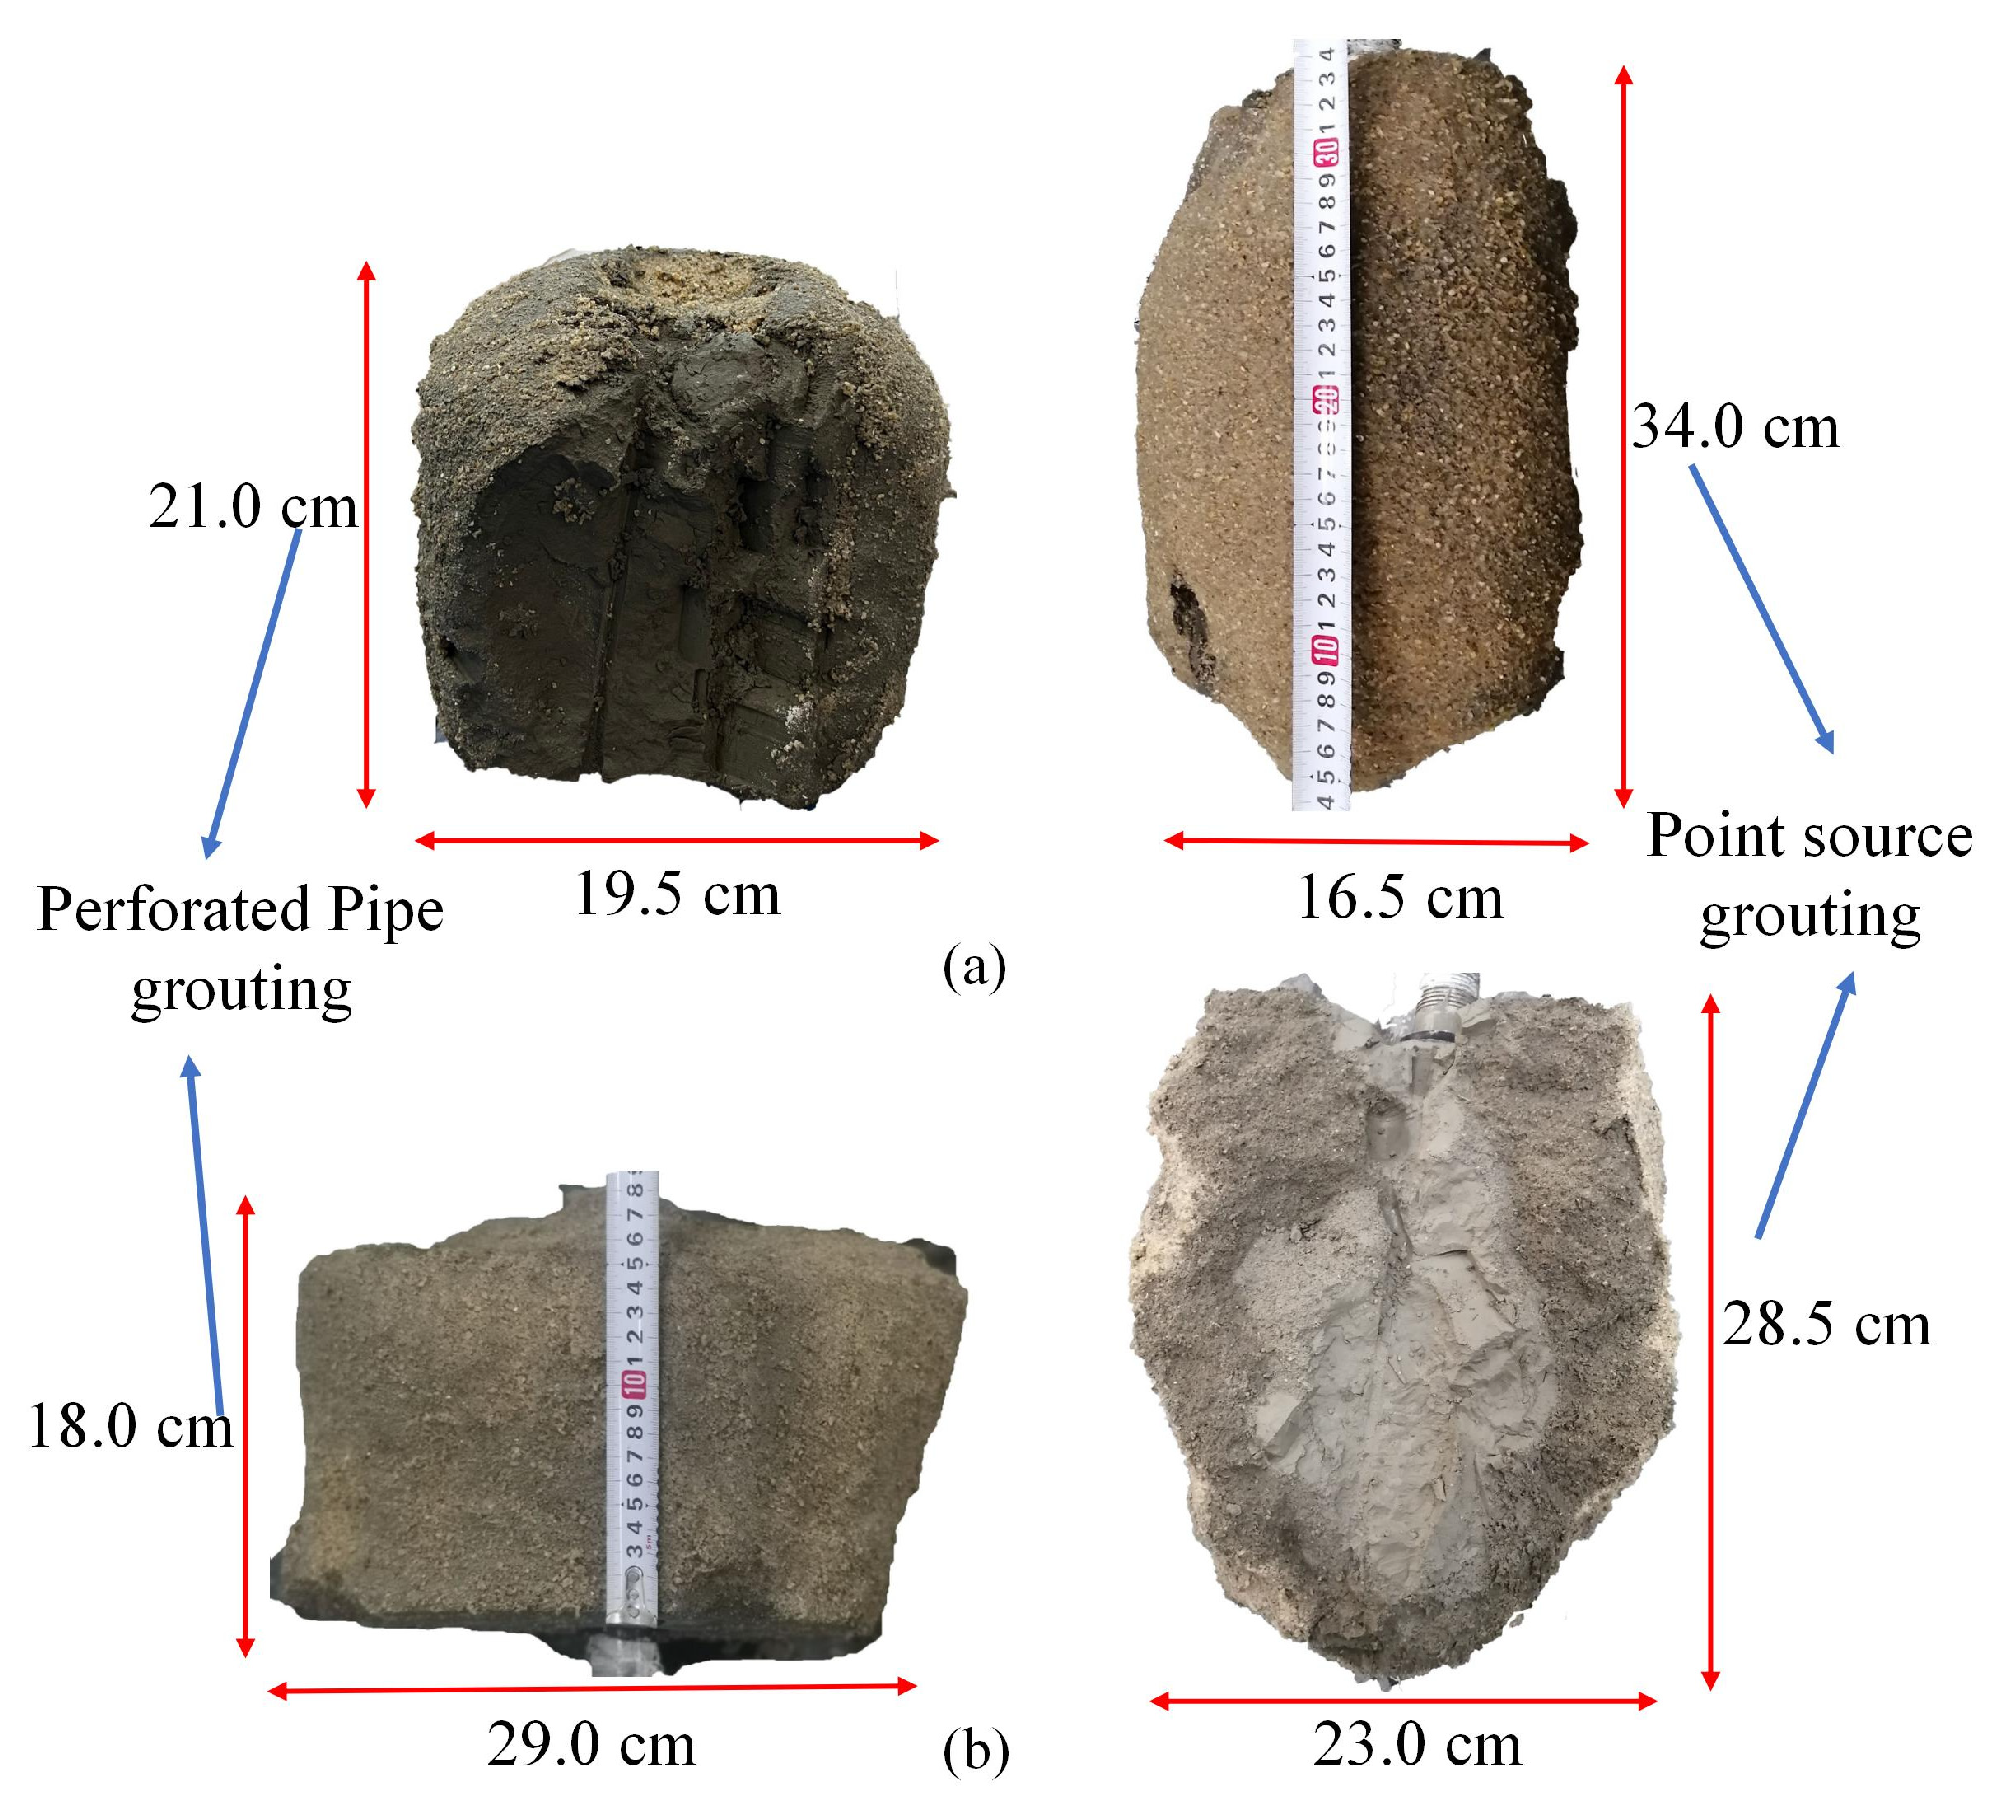
4.1. Analysis of Grouted Solids
4.2. Analysis of the Slurry Diffusion Action Mechanism
4.2.1. Analysis of the Diffusion Mechanism of Perforated Pipe Grouting
4.2.2. Analysis of the Diffusion Mechanism of Point Source Grouting
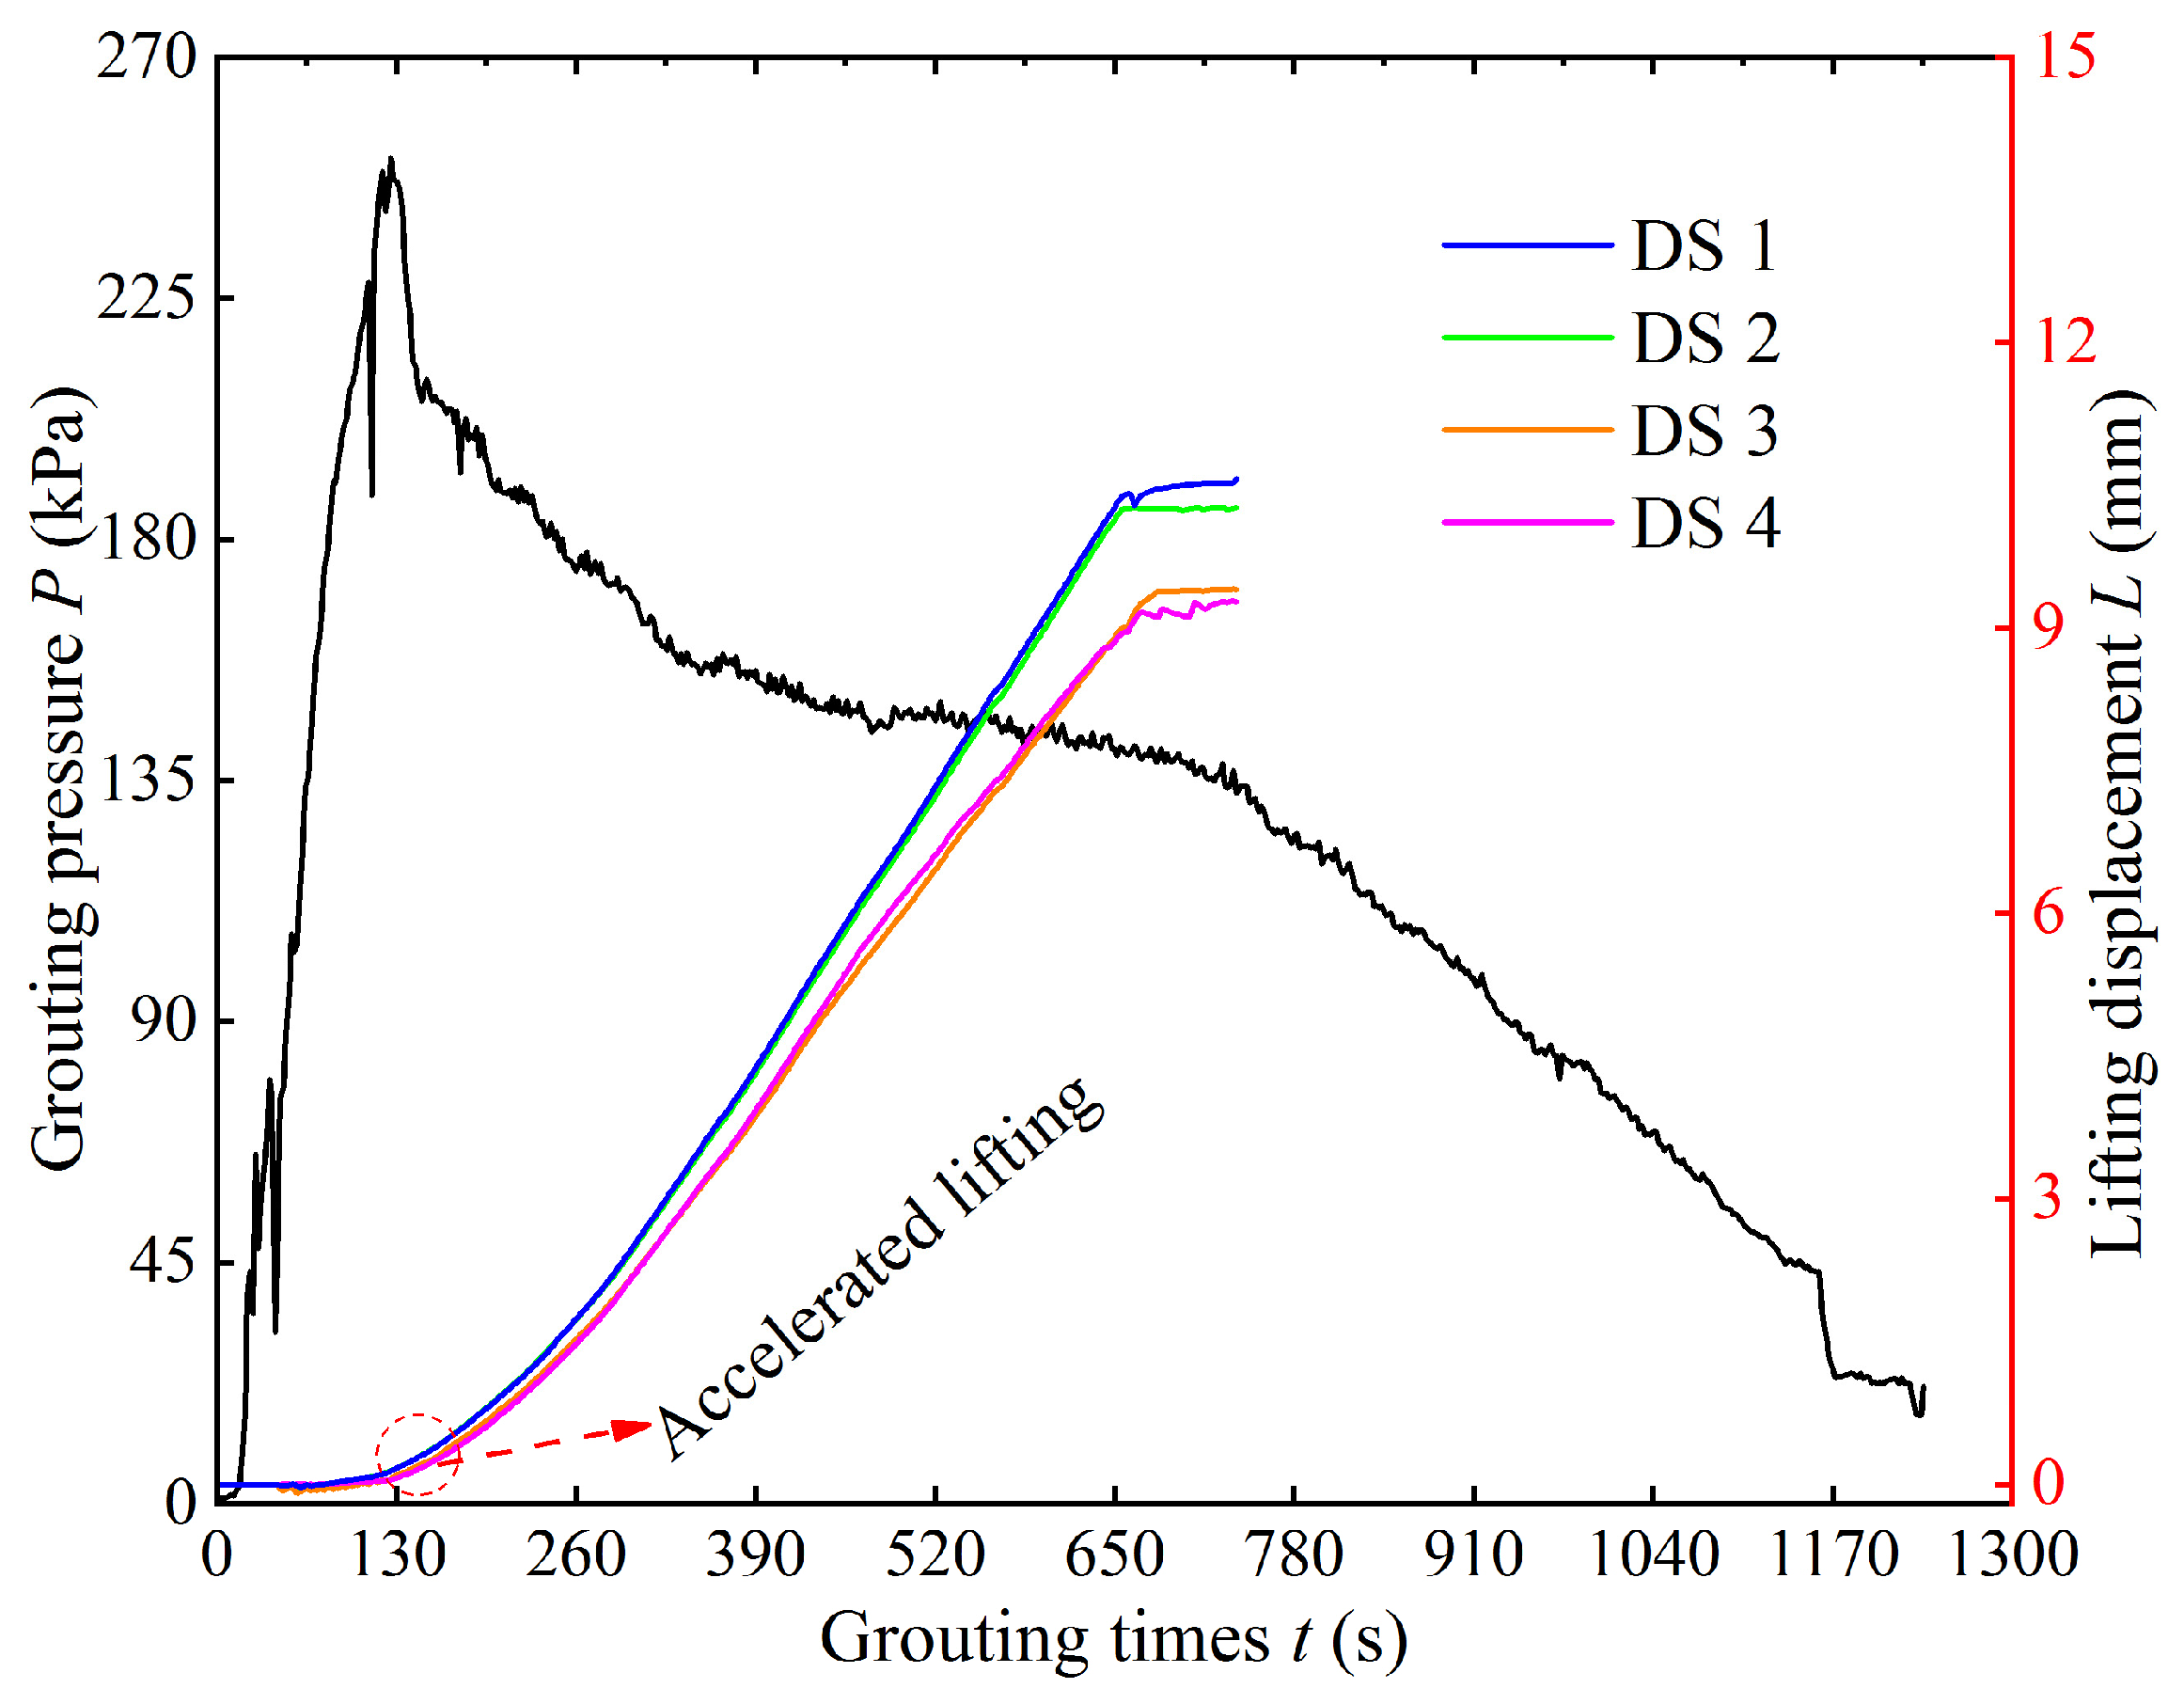
4.3. Mechanism Analysis of Grouting Lifting Action
4.3.1. Analysis of the Mechanism of Lifting Action in Perforated Pipe Grouting
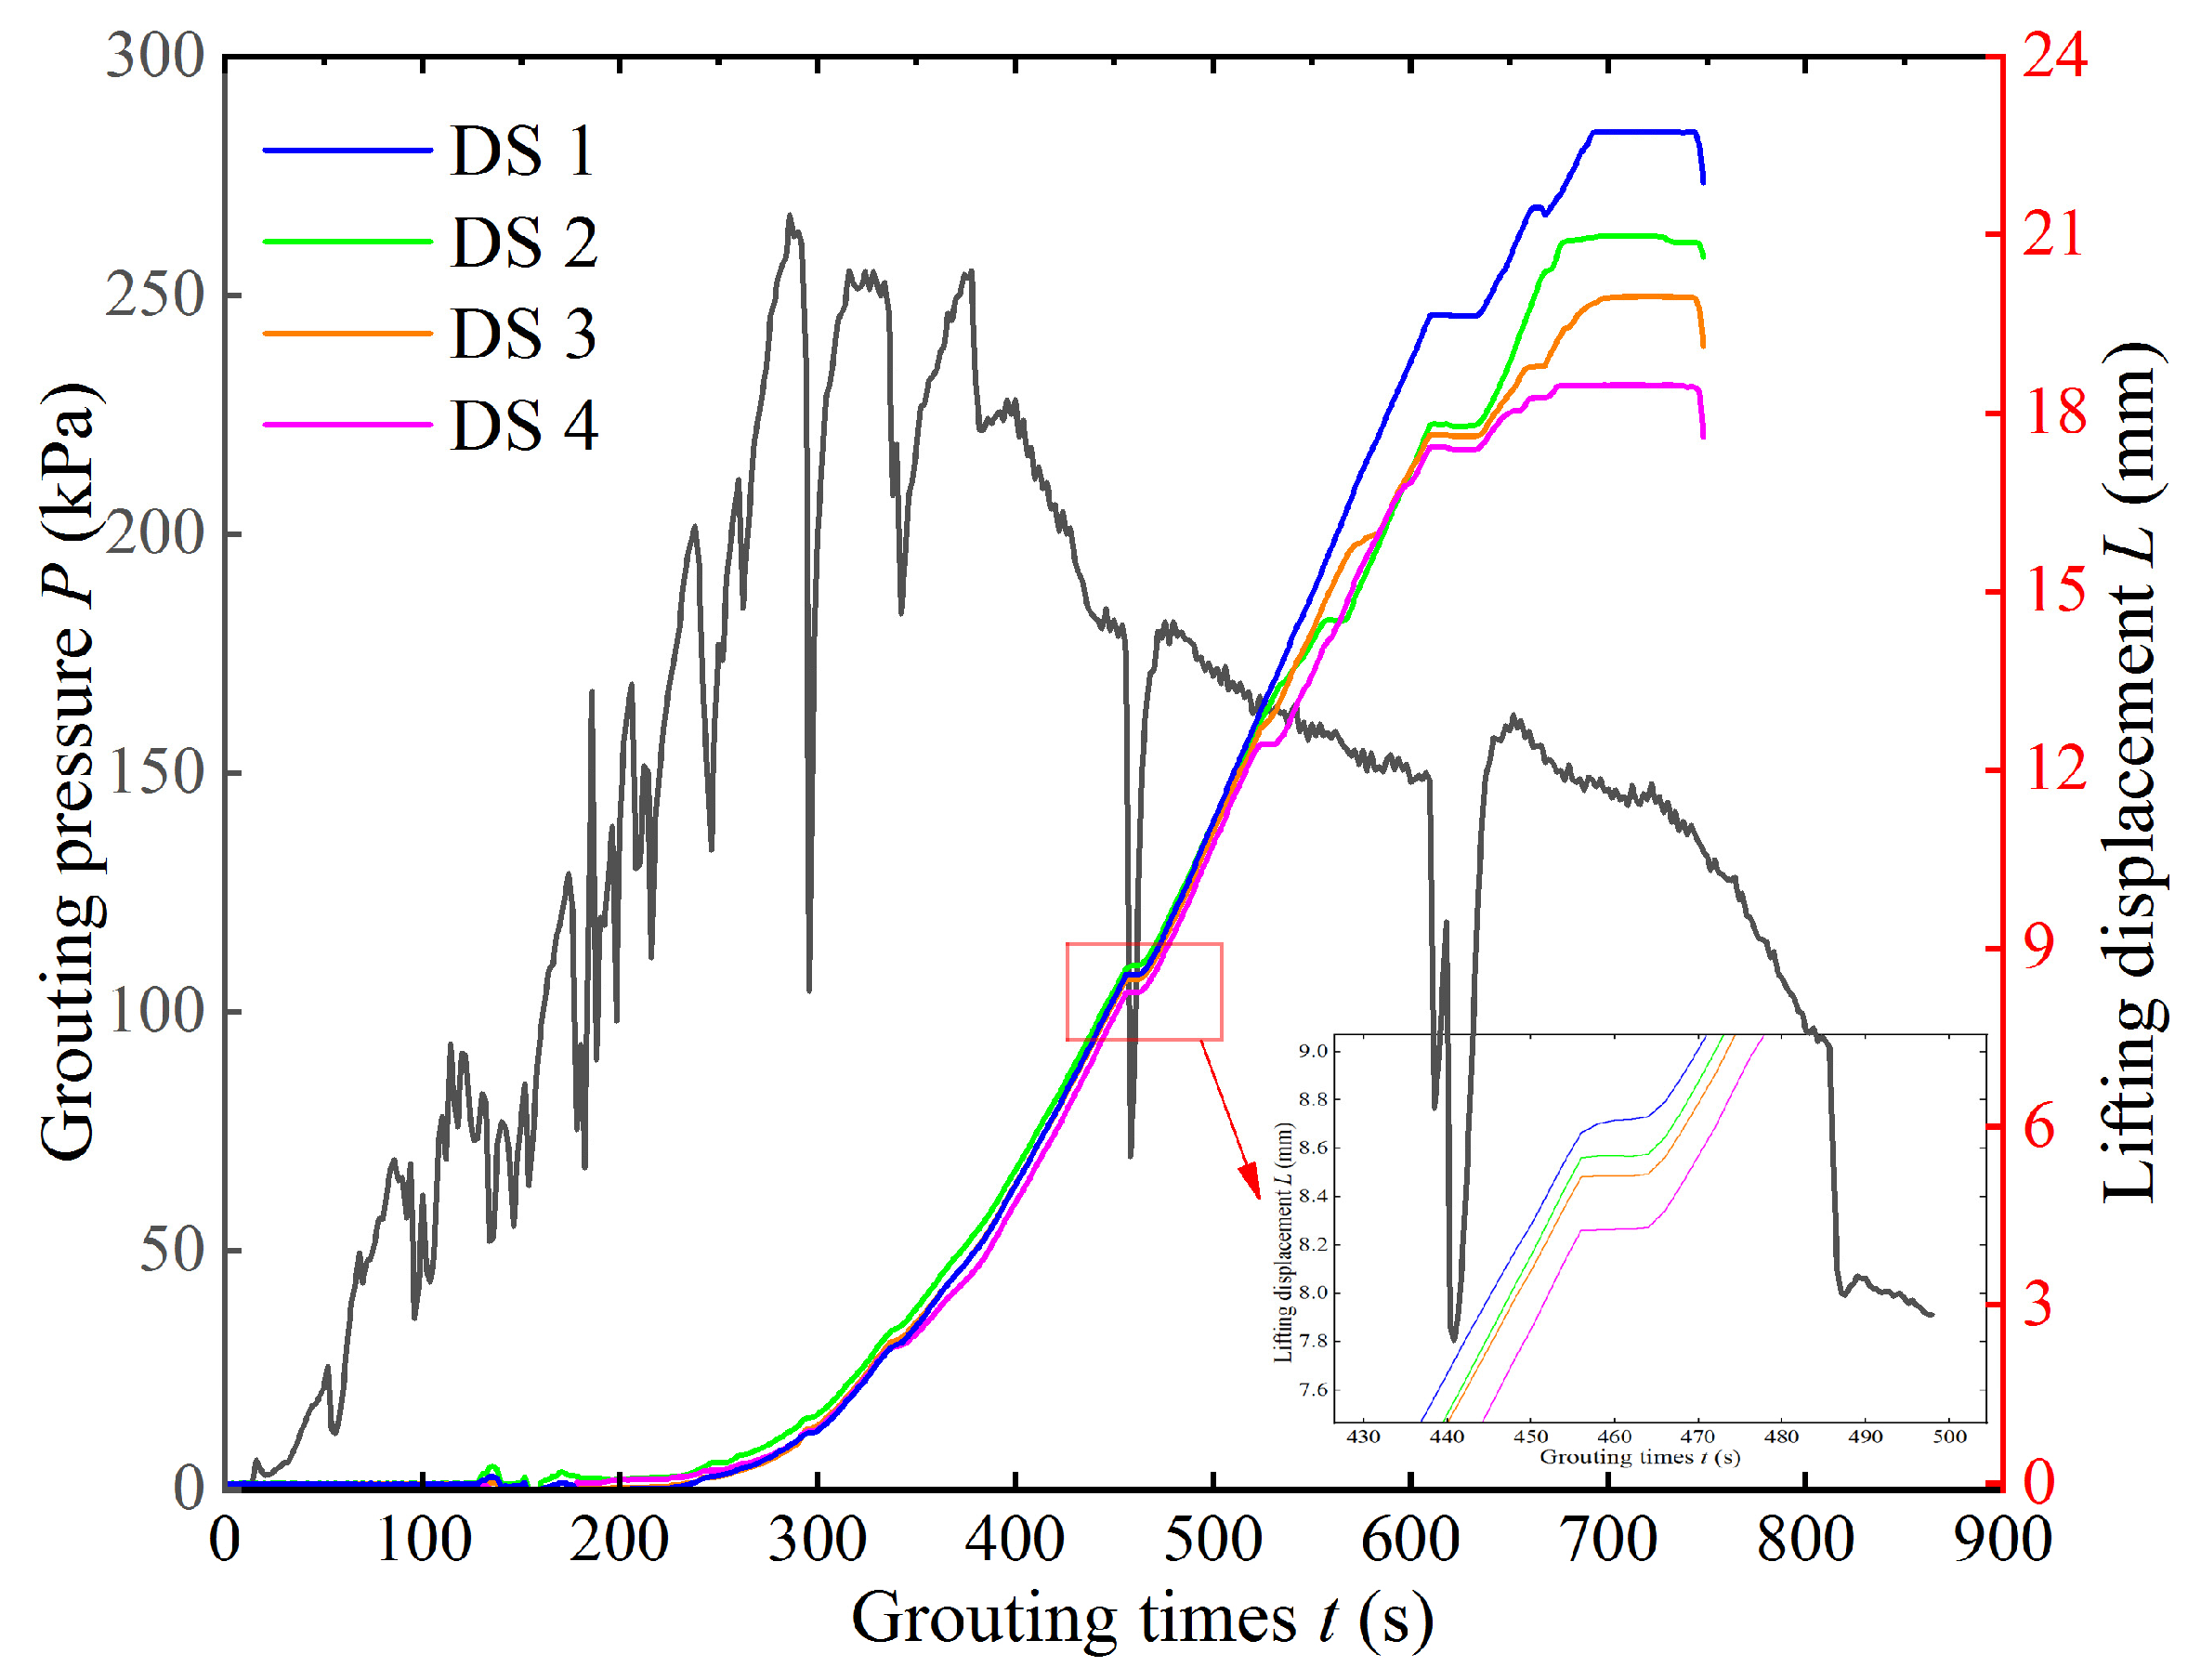
4.3.2. Analysis of the Lifting Mechanism of Point Source Grouting
4.4. Stress State Analysis of the Grouting Process
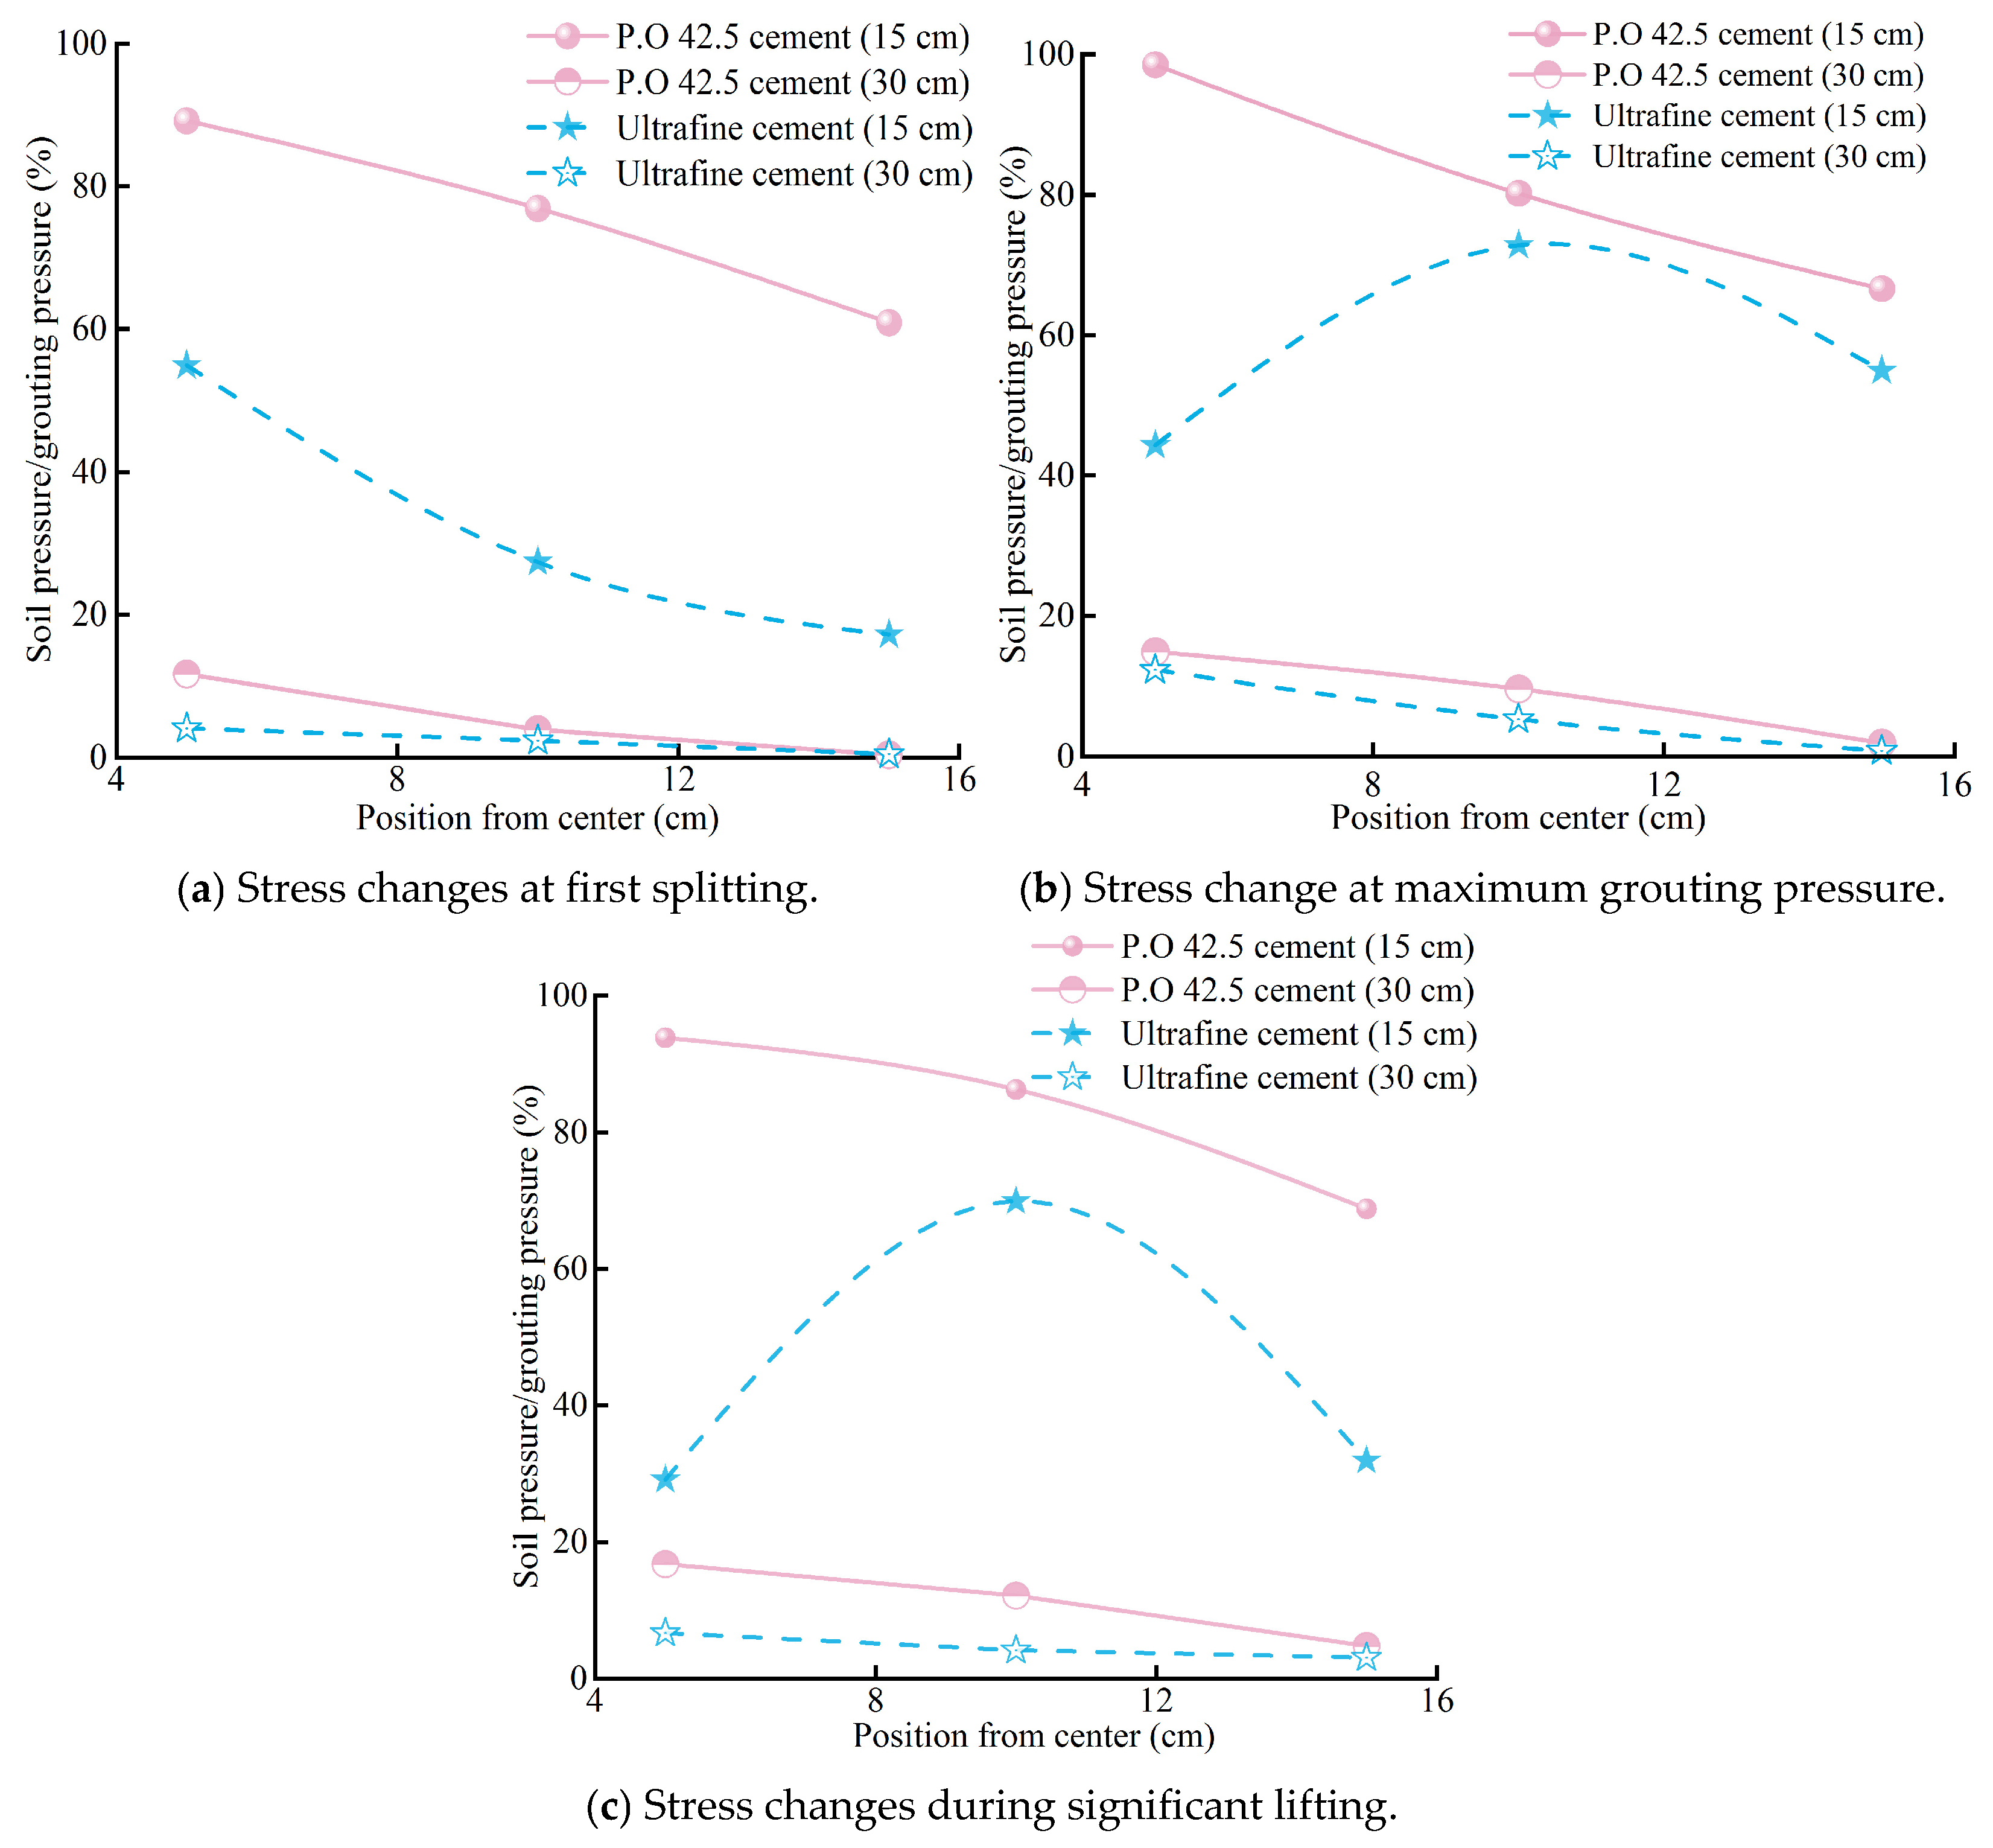
4.4.1. Stress State Analysis of the Perforated Pipe Grouting Process
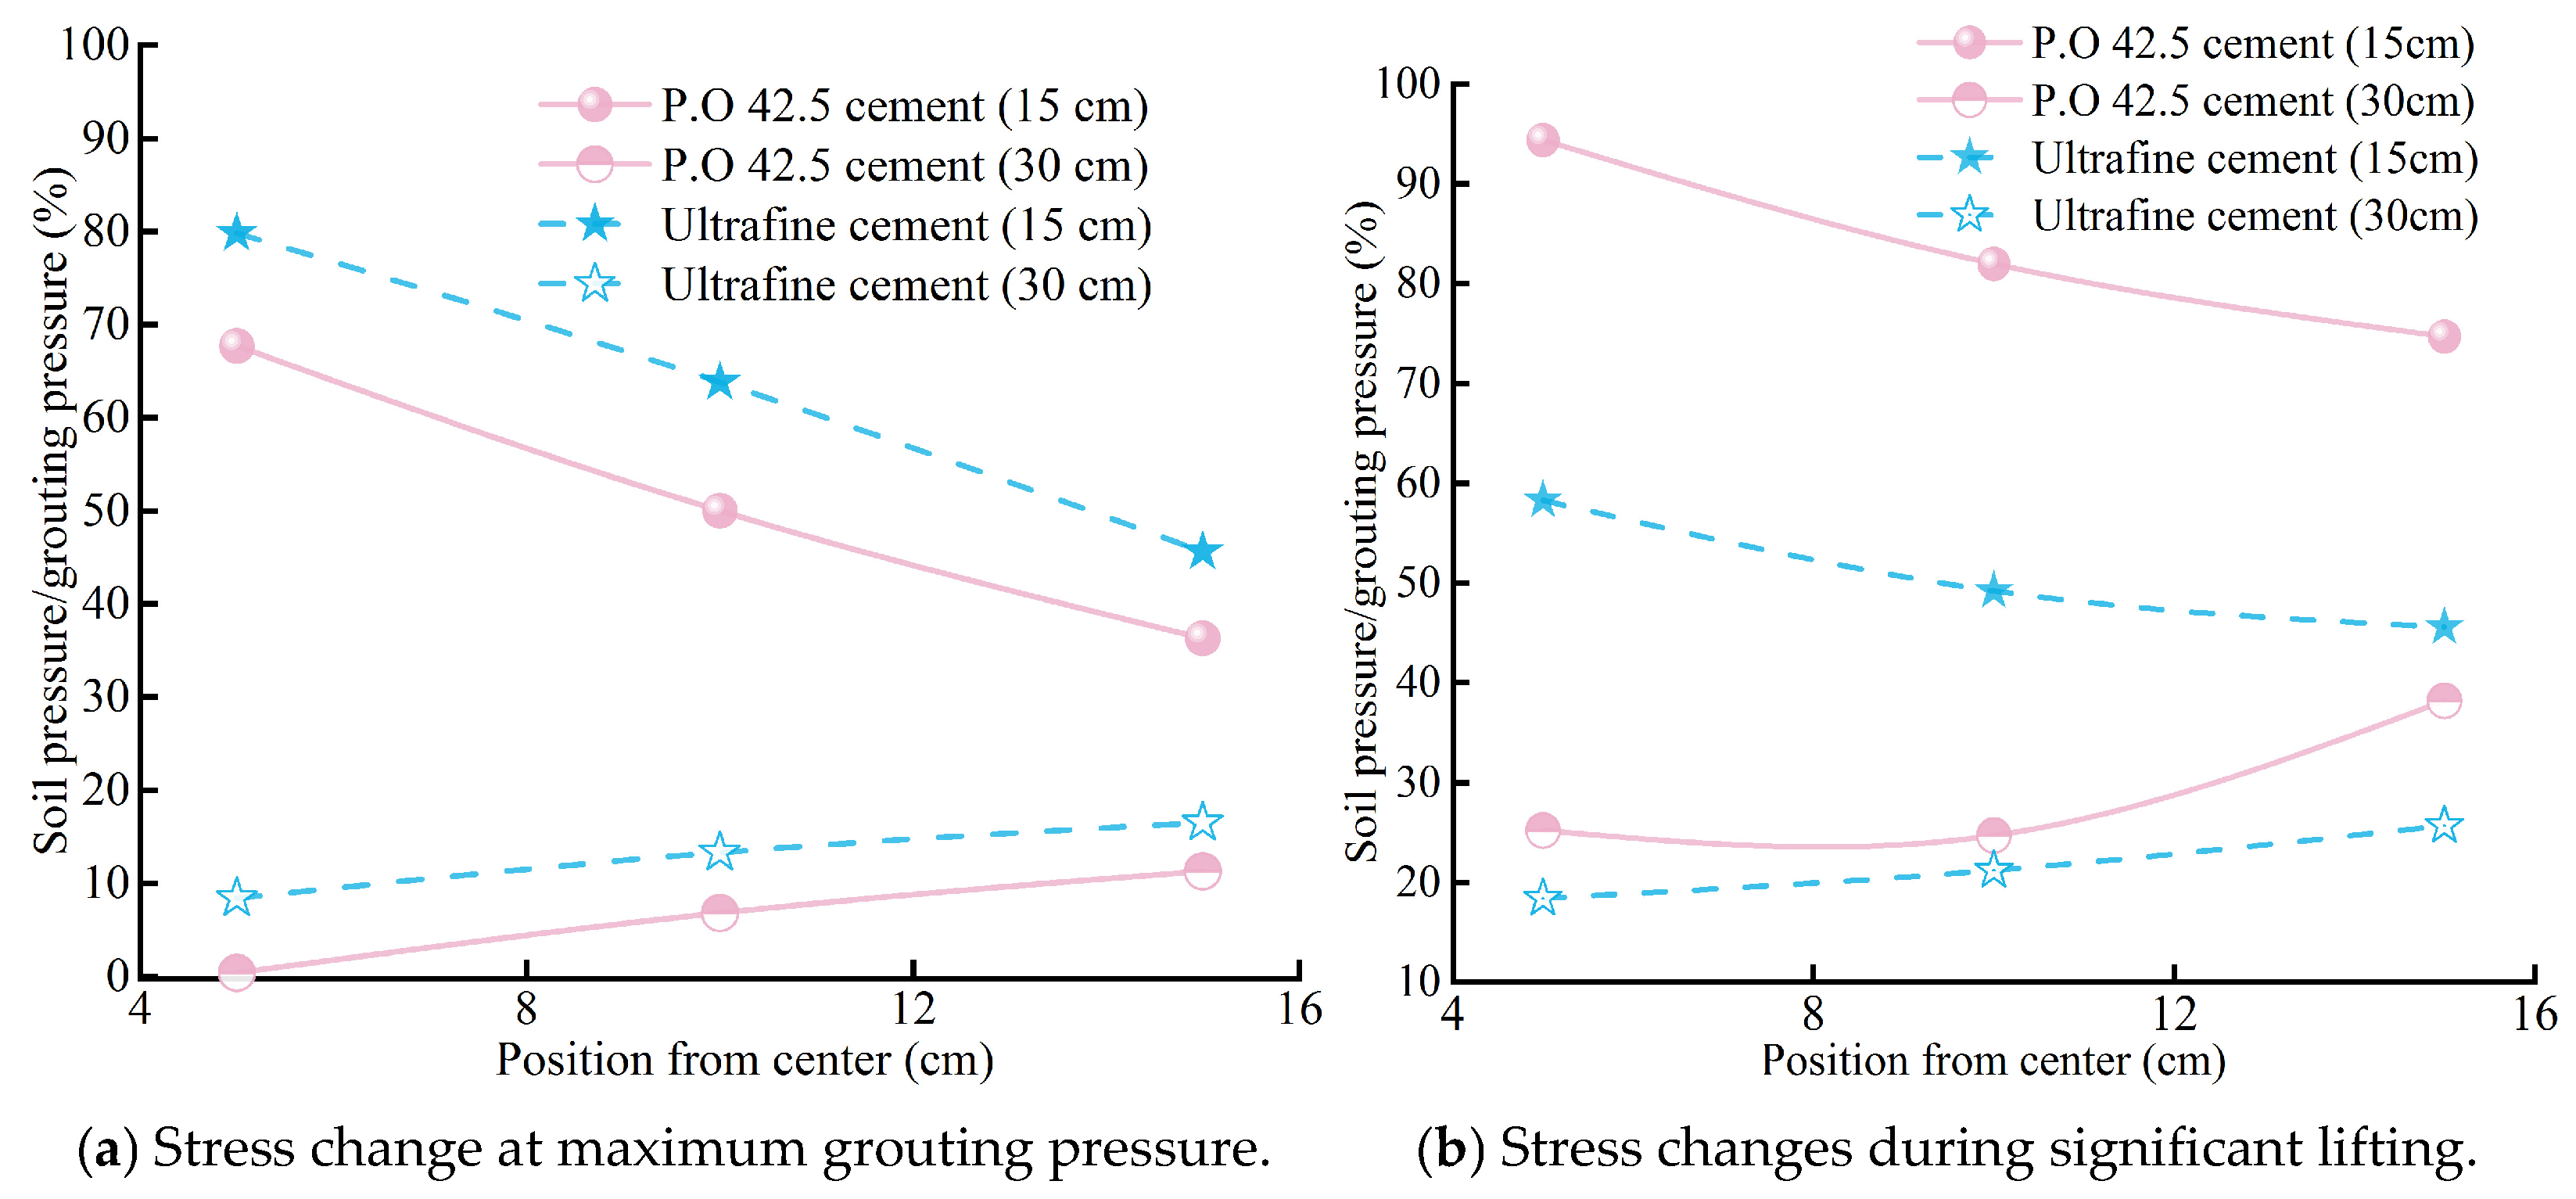
4.4.2. Stress State Analysis of the Point Source Grouting Process
5. Conclusions
- (1)
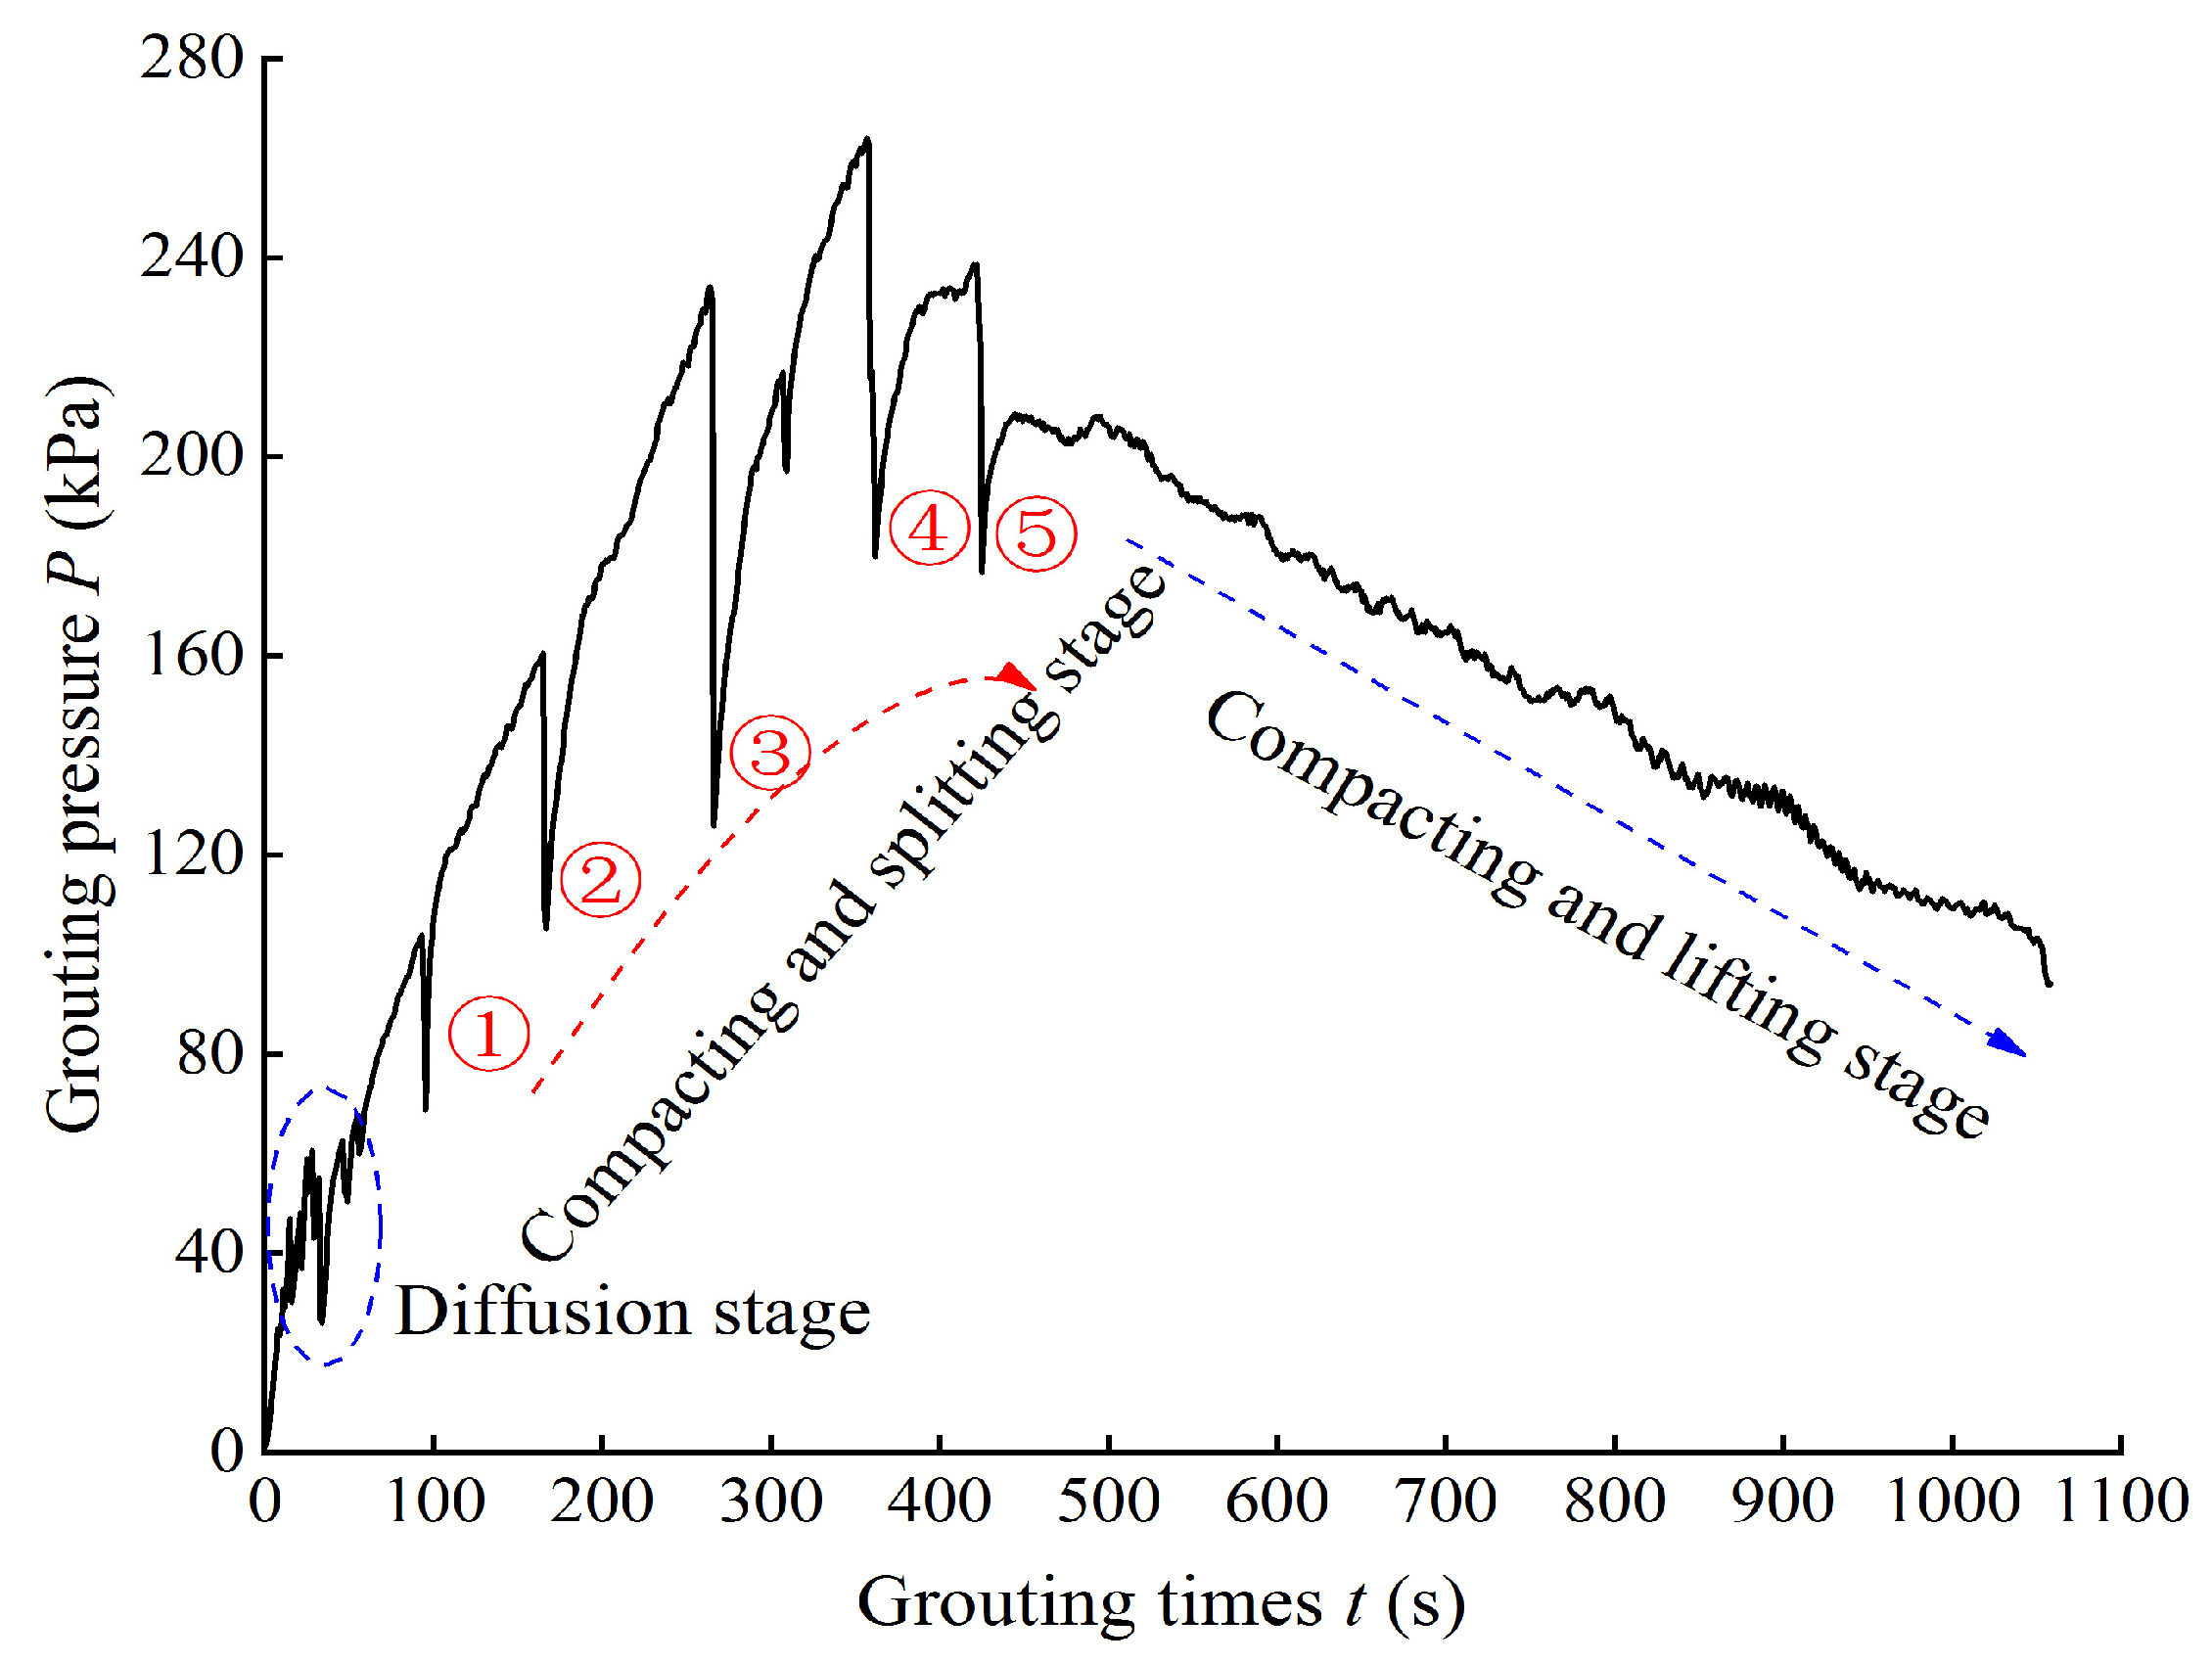
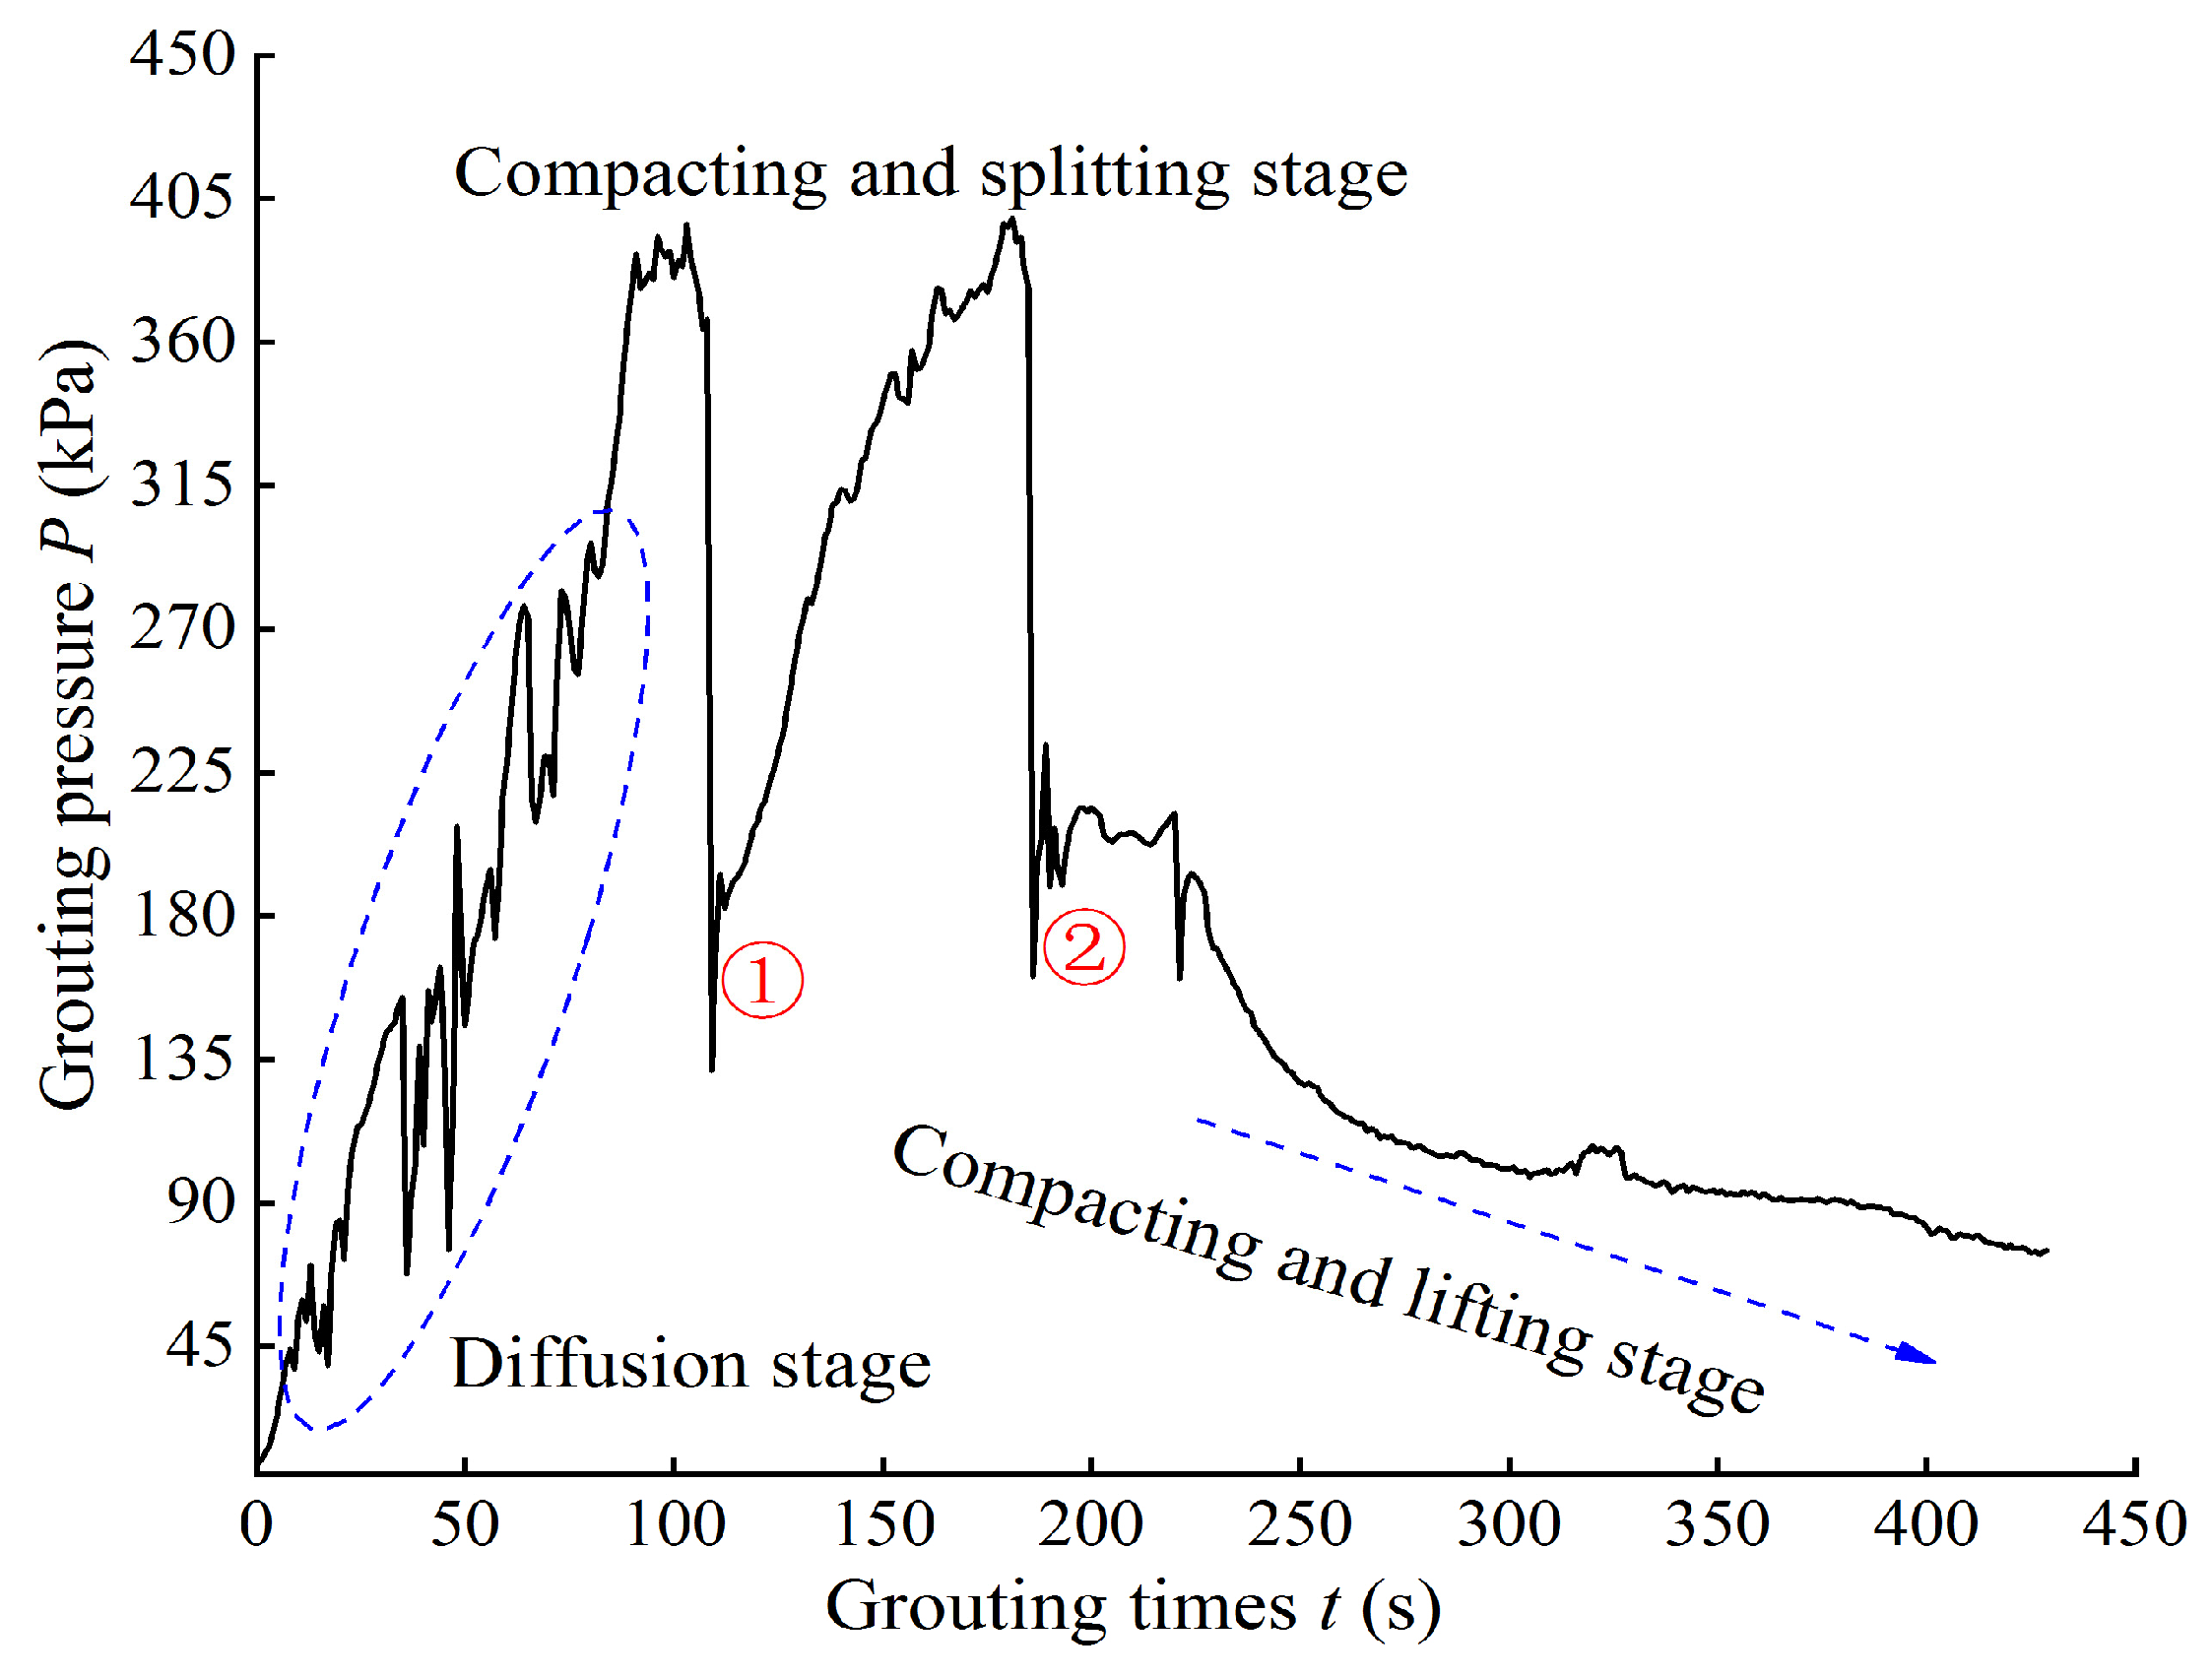
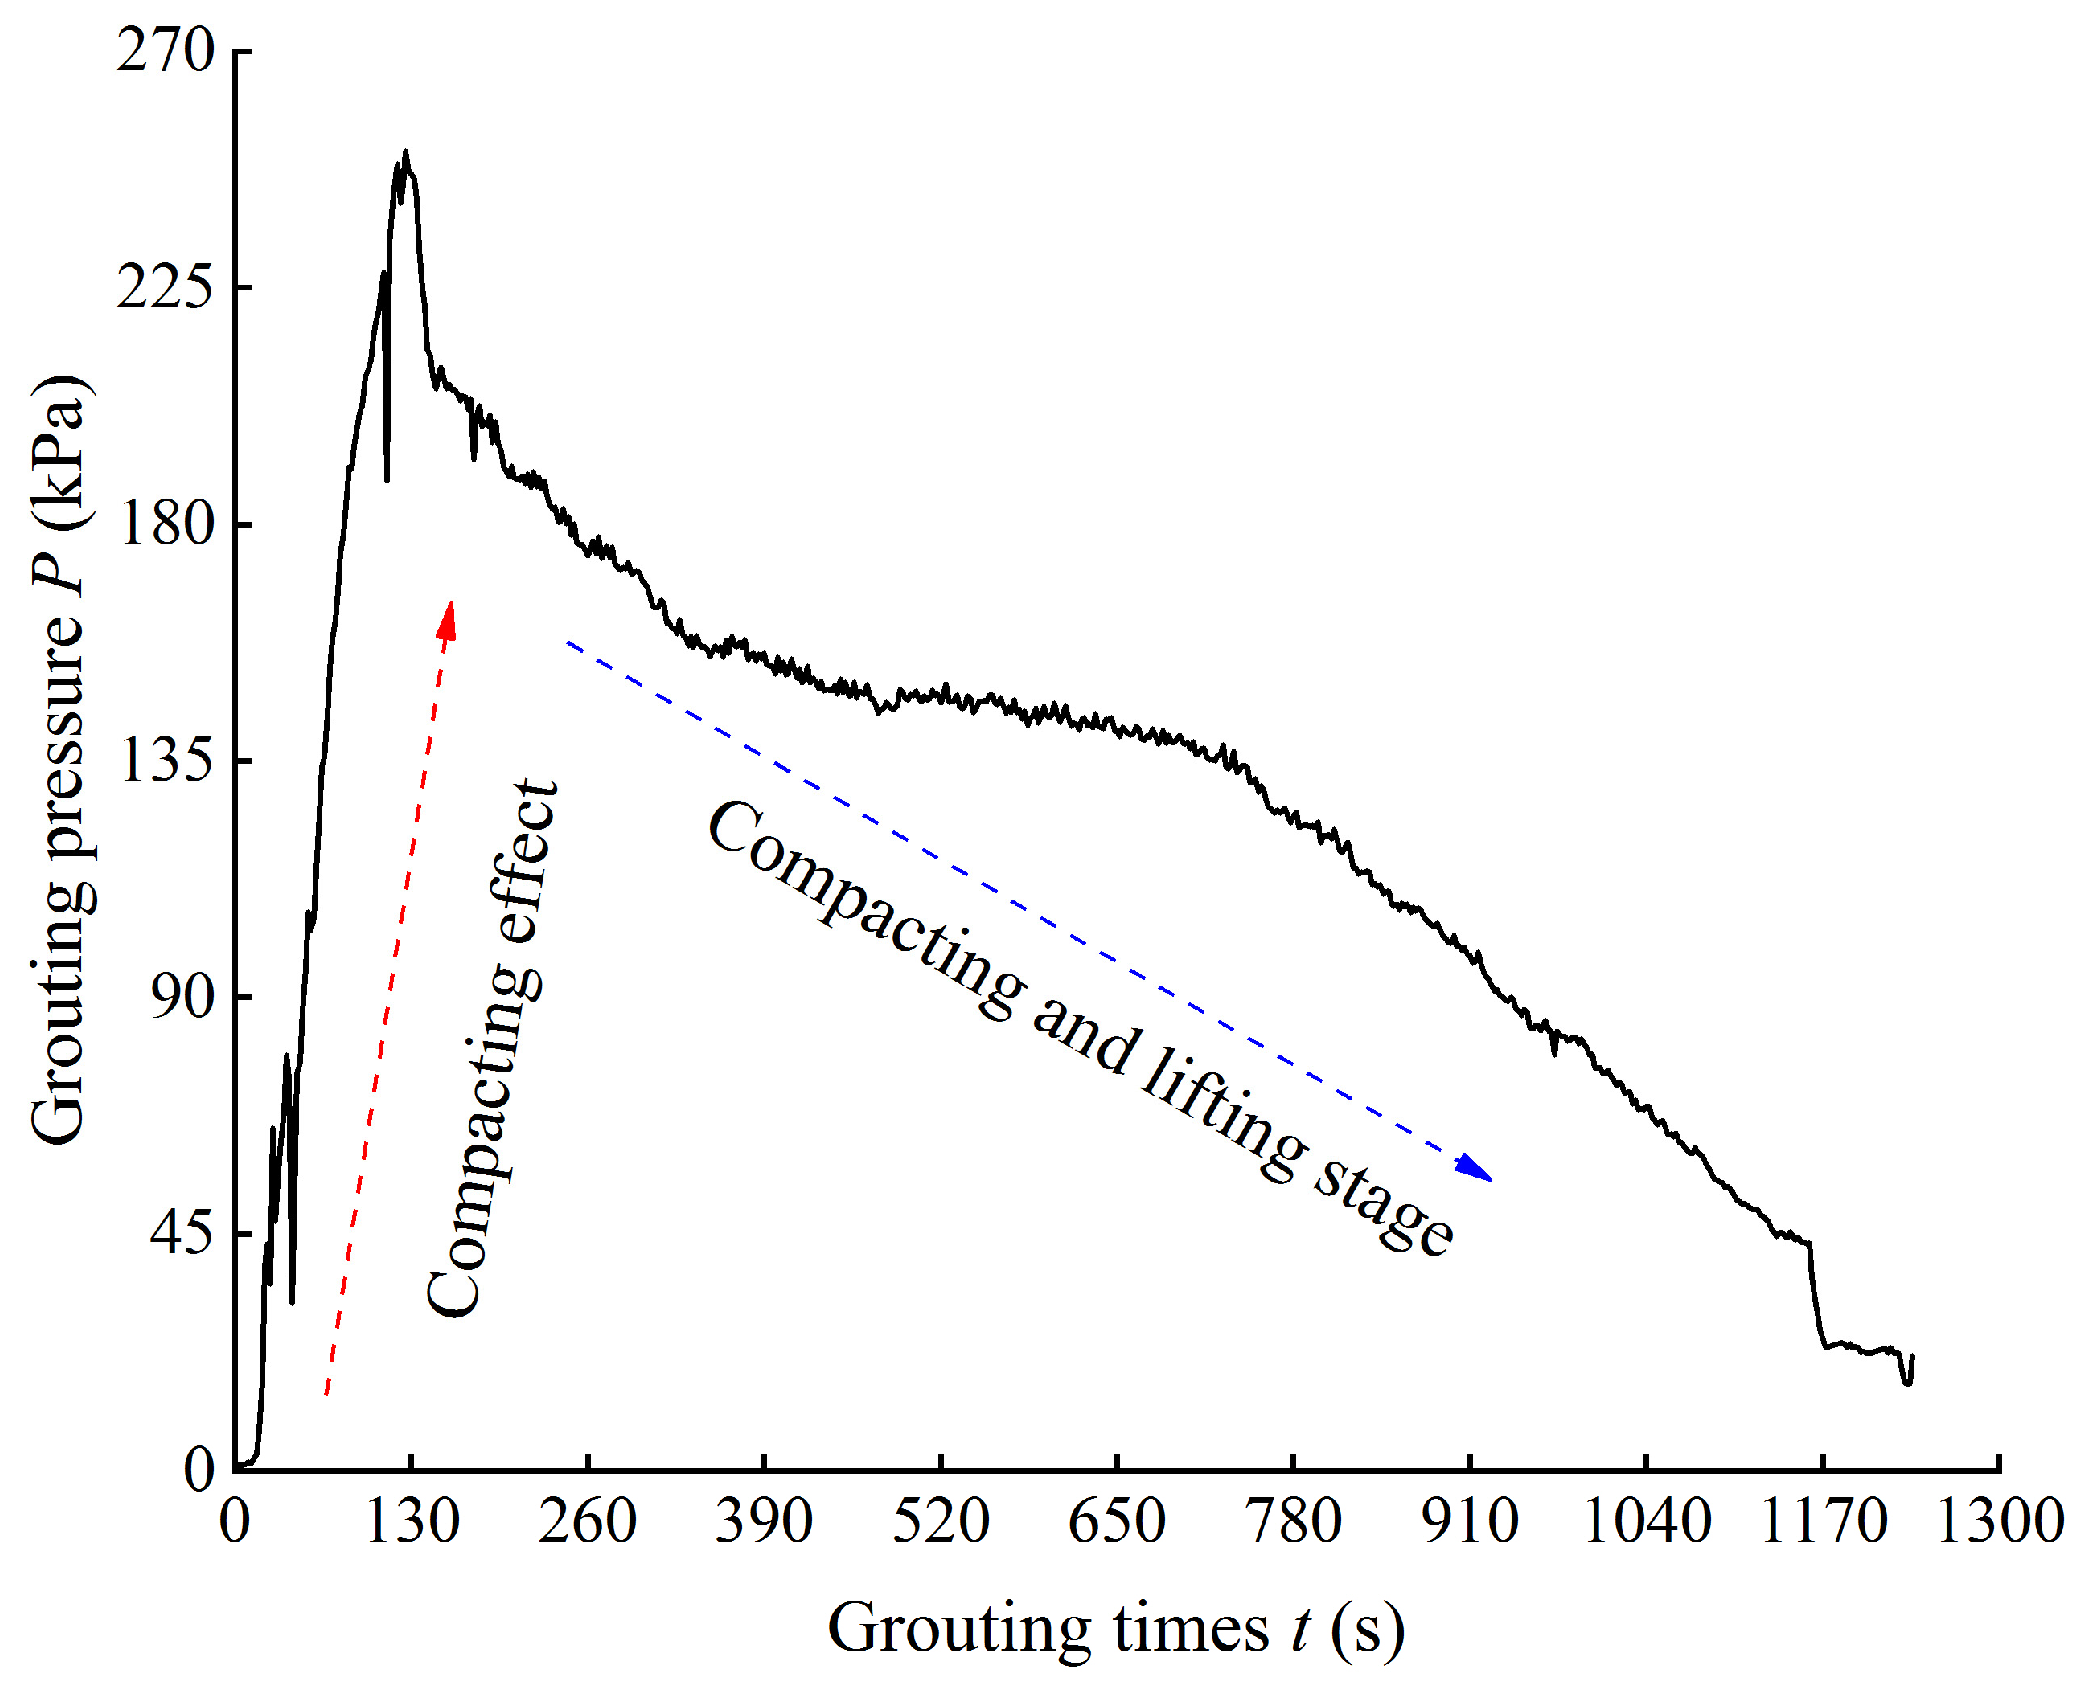
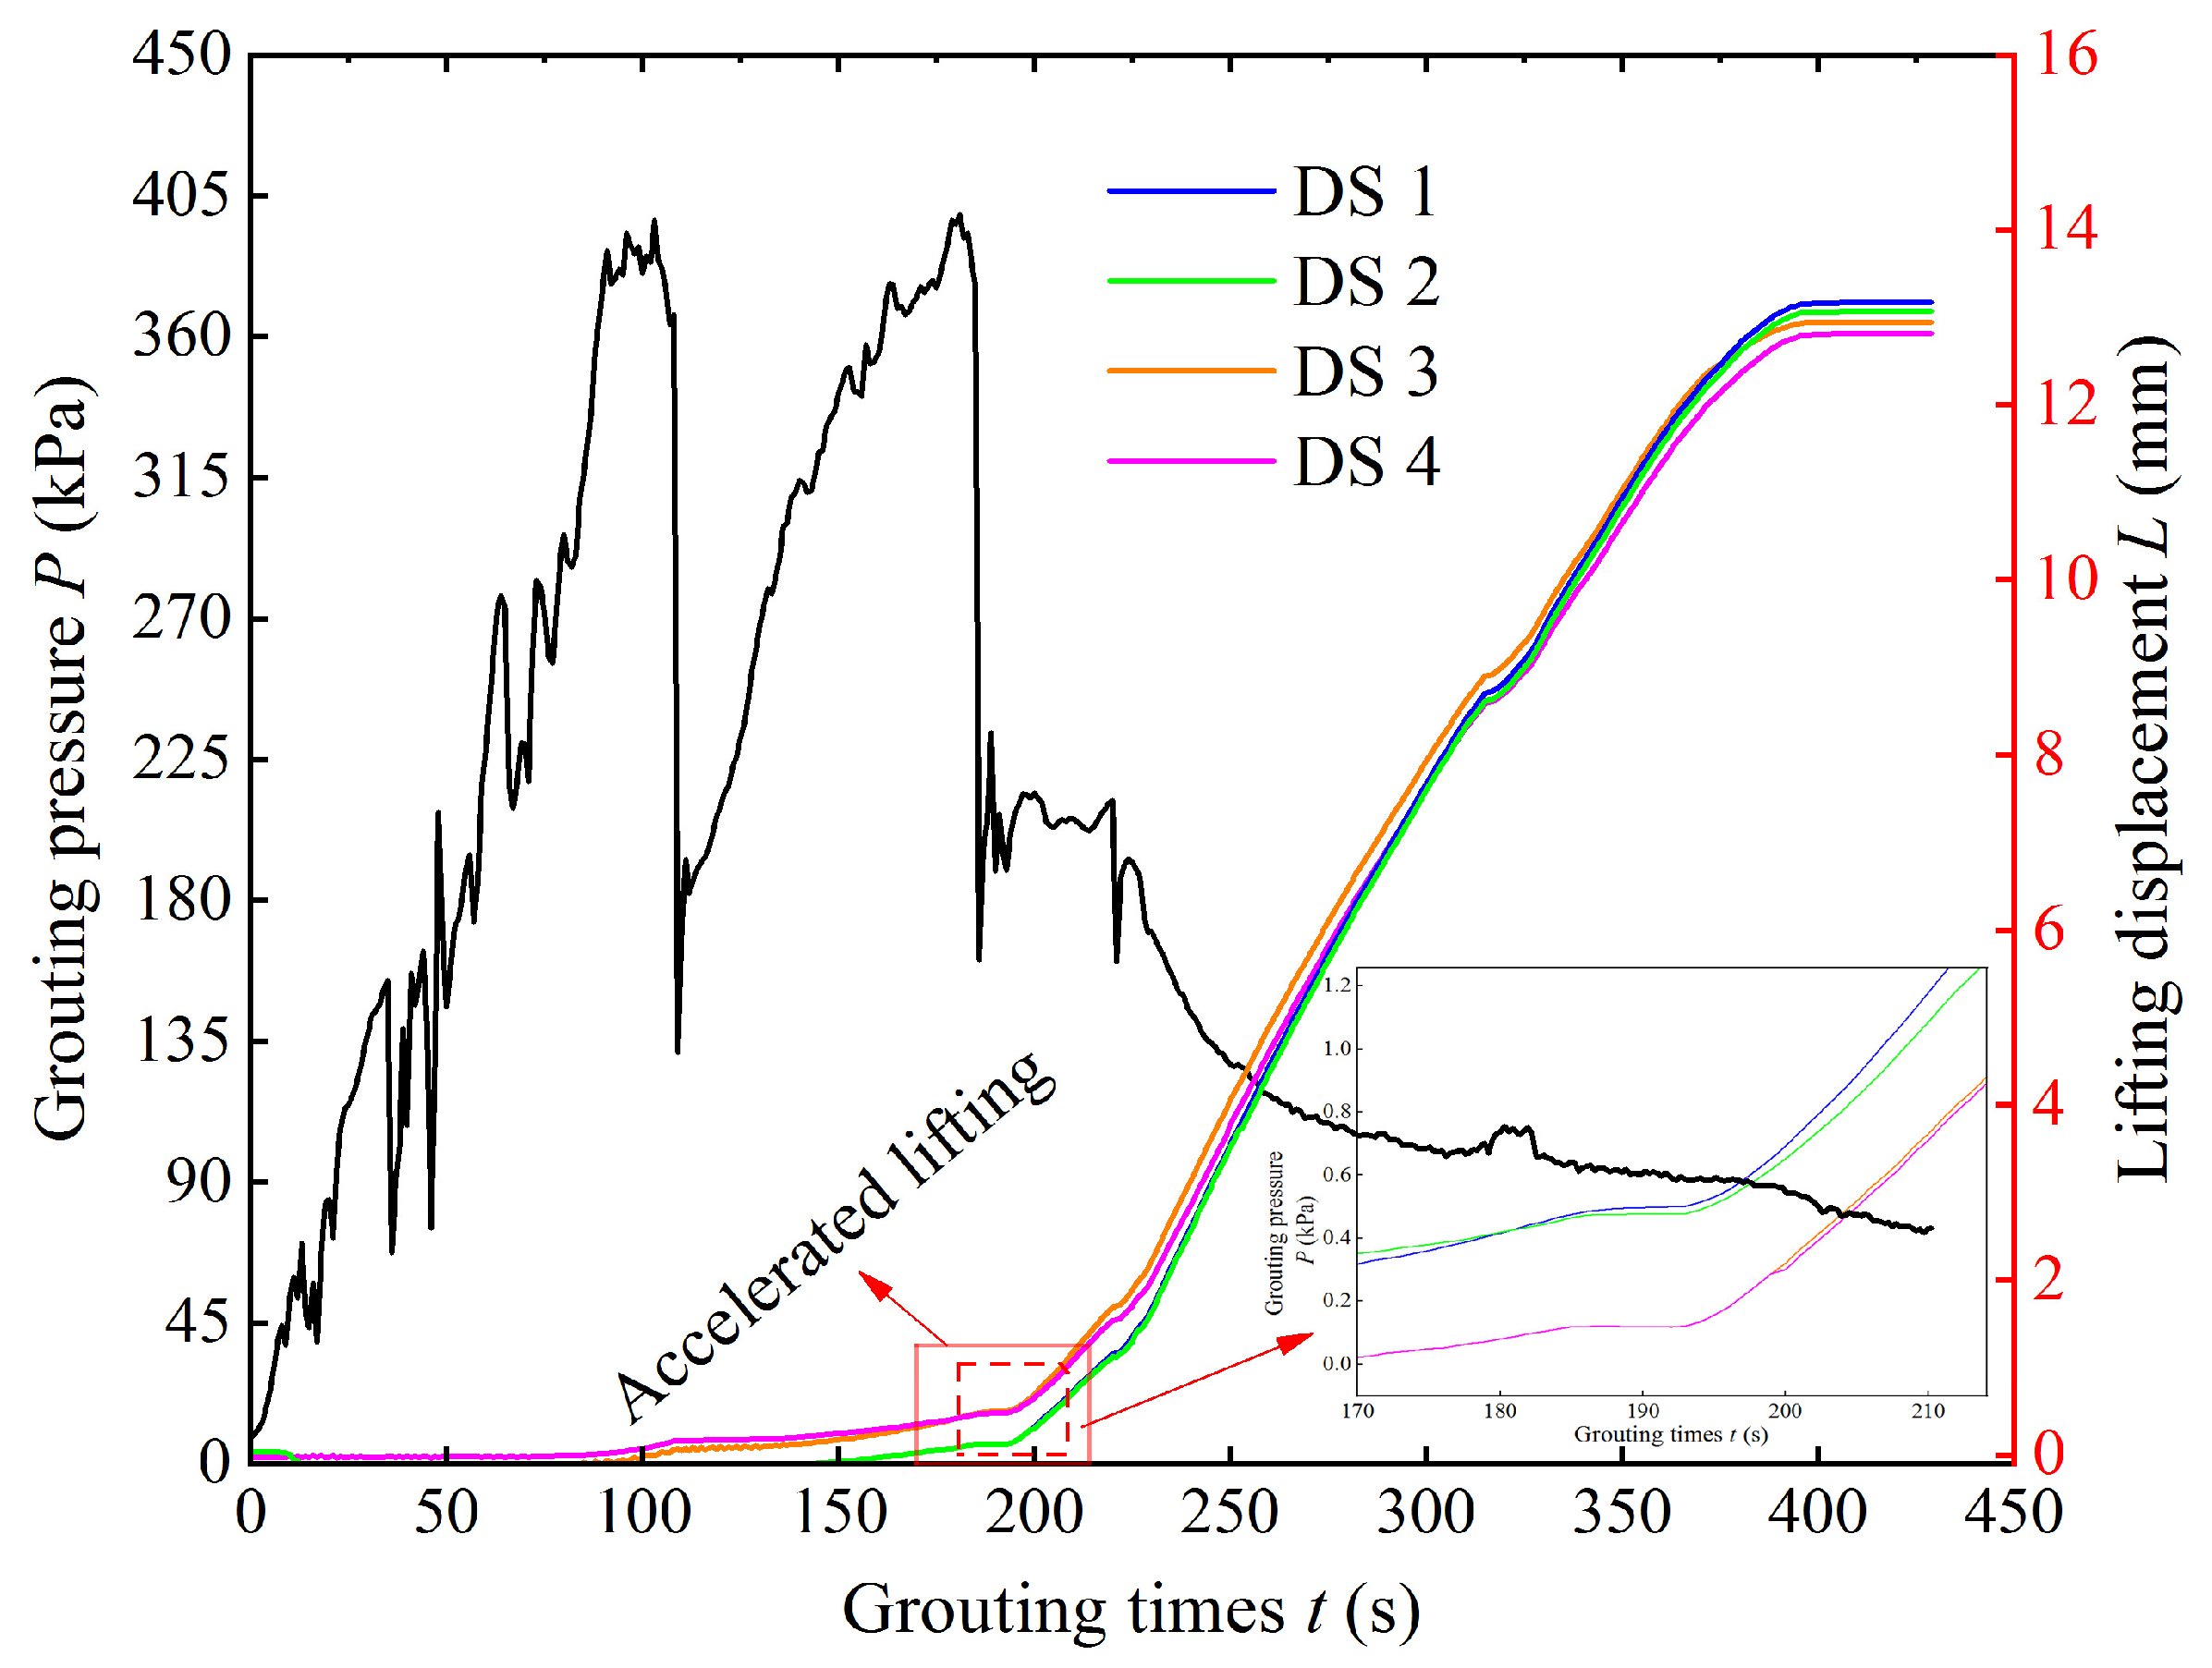
- During the grouting process, variations in the diffusion patterns and characteristics of the slurry resulted in distinct behavioral traits. Nevertheless, the underlying diffusion mechanism can be broadly encapsulated as follows: sand compression absorbs the pre-slurry diffusion volume, and with the subsequent injection of slurry, the sand compression gradually reaches the limit, and the resistance to grouting tends to be stabilized. As the grouting process advances further, the injected slurry volume subsequently compensates for the continuous displacement incurred by the overlying sand layers. The horizontally developed “step” feature on the uplift displacement curve is congruent with the slurry’s splitting behavior.
- (2)
- The grouting energy of P.O 42.5 cement consistently exhibited a gradual attenuation trend within the bottom sand layer. Conversely, ultrafine cement, owing to its finer particle size, was able to effectively enter the pore spaces of sand and soil. However, when utilizing the perforated pipe grouting method, the lateral boundary conditions imposed limitations on the penetration of the ultrafine cement, resulting in a “multi-peak” characteristic in its grouting energy attenuation. In contrast, when employing the point source grouting method, the grouting energy attenuation trends for these two cement types reversed as the grouting process progressed. Notably, the lateral boundary conditions significantly constrained energy attenuation during perforated pipe grouting. Furthermore, the vertical direction of grouting energy showed a substantial reduction, yet the stress characteristics of the two types of grouting methods diverged markedly due to their distinct directions of action.
Author Contributions
Funding
Data Availability Statement
Conflicts of Interest
References
- Hu, H.X.; Deng, C.; Chen, W. The effect of magnetization conditions on the stability of cement grout. Case Stud. Constr. Mater. 2022, 16, e01016. [Google Scholar] [CrossRef]
- Deng, C.; Li, L.; Hu, H.; Xu, Z.; Zhou, Y.; Yin, Q.; Chen, J. Effect of magnetized water on the fundamental grouting properties of cement grout under varying magnetization conditions. Sci. Rep. 2025, 15, 700. [Google Scholar] [CrossRef] [PubMed]
- Hu, H.; Gan, B.; Deng, C.; Xie, Z.; Lu, Y.; Cai, Y. Experimental study on the effect of water-cement ratios on the diffusion behavior of sand soil grouting. Bull. Eng. Geol. Environ. 2024, 83, 80. [Google Scholar] [CrossRef]
- Bian, X.; Duan, X.; Li, W.; Jiang, J. Track settlement restoration of ballastless high-speed railway using polyurethane grouting: Full-scale model testing. Transp. Geotech. 2021, 26, 100381. [Google Scholar] [CrossRef]
- Xuan, D.; Zhang, M.; Li, J.; Dong, Z.; Alimu, A.; Xu, J. Experimental study on the diffusion radius of modified slurry used in longwall overburden isolated grouting. Geofluids 2023, 2023, 7195779. [Google Scholar] [CrossRef]
- Ma, X.; Zhang, L.; Zhou, J. Experimental study on the relationship between grouting pressure and compressive strength of hardened cement paste. Iran. J. Sci. Technol. Trans. Civ. Eng. 2020, 44, 483–489. [Google Scholar] [CrossRef]
- Wang, Q.; Gao, H.; Jiang, B.; Li, S.; He, M.; Qin, Q. In-situ test and bolt-grouting design evaluation method of underground engineering based on digital drilling. Int. J. Rock Mech. Min. Sci. 2021, 138, 104575. [Google Scholar] [CrossRef]
- Guo, Y.-X.; Zhang, Q.-S.; Zhang, L.-Z.; Liu, R.-T.; Chen, X.; Liu, Y.-K. Experimental study on groutability of sand layer concerning permeation grouting. Adv. Mater. Sci. Eng. 2021, 2021, 6698263. [Google Scholar] [CrossRef]
- Hu, H.; Lu, Y.; Deng, C.; Gan, B.; Xie, Z.; Cai, Y.; Chu, A. Experimental study on grout-soil interaction effects in sandy soil under different water-to-cement ratios. Buildings 2024, 14, 947. [Google Scholar] [CrossRef]
- Hu, H.-X.; Cao, W.; Deng, C.; Lu, Y.-F. Experimental study on the relationship between time-varying uplift displacement and grout diffusion in sand. Appl. Sci. 2024, 14, 3922. [Google Scholar] [CrossRef]
- Liu, S.; Xie, Z.; Zhang, J.; Sun, J.; Tian, Q.; Yu, Z.; An, X.; Wu, W. Experimental Study on the Diffusion Law of Horizontal Grouting in Shallow Sand Gravel Layer. KSCE J. Civ. Eng. 2024, 28, 3192–3207. [Google Scholar] [CrossRef]
- Lu, C.; Cao, X.; Liu, H.; Guo, S.; Lu, Z. A unified model for predicting the diffusion distance of cement slurry in weakly consolidated formation considering different diffusion patterns. Constr. Build. Mater. 2024, 441, 137484. [Google Scholar] [CrossRef]
- Fang, H.; Liu, C.; Du, X.; Li, B.; Zhai, K.; Zhao, X.; Du, M.; Xue, B.; Wang, S. Experimental study on the diffusion characteristics of nonaqueous reactive expansive polymers in sand and gravel media under dynamic water conditions. Tunn. Undergr. Space Technol. 2023, 142, 105433. [Google Scholar] [CrossRef]
- He, S.; Lai, J.; Wang, L.; Wang, K. A literature review on properties and applications of grouts for shield tunnel. Constr. Build. Mater. 2020, 239, 117782. [Google Scholar] [CrossRef]
- Niu, J.; Li, Z.; Gu, W.; Chen, K. Experimental study of split grouting reinforcement mechanism in filling medium and effect evaluation. Sensors 2020, 20, 3088. [Google Scholar] [CrossRef]
- Wei, B.; Huang, Q.; Zhuang, D.; Cao, X.; Hui, B.; Zuo, X.; Zhu, M. Study on the diffusion law of fluidized filling gangue slurry in goaf of coal mine underground. Geofluids 2024, 2024, 9925765. [Google Scholar] [CrossRef]
- Markou, I.N.; Christodoulou, D.N.; Petala, E.S.; Atmatzidis, D.K. Injectability of microfine cement grouts into limestone sands with different gradations: Experimental investigation and prediction. Geotech. Geol. Eng. 2018, 36, 959–981. [Google Scholar] [CrossRef]
- Wang, Y.; Yu, B.; Wan, Y.; Yu, X. Experimental investigation and numerical verification on diffusion of permeable polymers in sandy soils with considering grouting parameters. Int. J. Civ. Eng. 2023, 21, 617–632. [Google Scholar] [CrossRef]
- Li, H.; Ji, X.; Zhou, P. Study on the microscopic mechanism of grouting in saturated water-bearing sand stratum based on VOF-DEM method. Processes 2022, 10, 1447. [Google Scholar] [CrossRef]
- Li, S.C.; Feng, X.; Liu, R.T.; Zhang, L.W.; Han, W.W.; Zheng, Z. Diffusion of grouting cement in sandy soil considering filtration effect. Rock Soil Mech. 2017, 38, 925–933. [Google Scholar] [CrossRef]
- Shrivastava, N.; Zen, K. Finite element modeling of compaction grouting on its densification and confining aspects. Geotech. Geol. Eng. 2018, 36, 2365–2378. [Google Scholar] [CrossRef]
- Shrivastava, N.; Zen, K. An experimental study of compaction grouting on its densification and confining effects. Geotech. Geol. Eng. 2018, 36, 983–993. [Google Scholar] [CrossRef]
- Yang, J.; Cheng, Y.; Chen, W. Experimental study on diffusion law of post-grouting slurry in sandy soil. Adv. Civ. Eng. 2019, 2019, 3493942. [Google Scholar] [CrossRef]
- Li, D.; Li, X.; Hu, Y.; Zhang, S.; Mei, C.; Wu, H.; Sun, X.; Fu, Y. Study on dispersion of cement grout in sand considering filtration effect through the EDTA titration test. Geofluids 2020, 2020, 6620979. [Google Scholar] [CrossRef]
- Guo, C.; Hu, D.; Wang, F. Diffusion behavior of polymer grouting materials in sand and gravel. Soil Mech. Found. Eng. 2021, 57, 440–444. [Google Scholar] [CrossRef]
- Assaad, J.J.; Daou, Y. Cementitious grouts with adapted rheological properties for injection by vacuum techniques. Cem. Concr. Res. 2014, 59, 43–54. [Google Scholar] [CrossRef]
- Hou, F.; Sun, K.; Wu, Q.; Xu, W.; Ren, S. Grout diffusion model in porous media considering the variation in viscosity with time. Adv. Mech. Eng. 2019, 11, 1687814018819890. [Google Scholar] [CrossRef]
- Yang, Y.; Lu, J.; Yang, Z.; Ding, Y. Experiments and effect parameters prediction model of reinforcement loose gravel soil-layers by flower pipe grouting. Trans. Chin. Soc. Agric. Eng. 2018, 34, 151–157. [Google Scholar] [CrossRef]
- Zhou, A.; Wu, Y.; Li, H.; Li, J.; Sun, T.; Yang, Y. Experimental study of graphene oxide modified ultrafine cement properties and grouting model. J. Build. Eng. 2025, 99, 111632. [Google Scholar] [CrossRef]
- Zhang, B.; Liu, P.; Wu, Y.; Wu, L.; Li, C.; Liu, S.; Zhou, Y. Experimental study on grouting diffusion law of tunnel secondary lining cracks based on different slurry viscosities. Appl. Sci. 2025, 15, 1955. [Google Scholar] [CrossRef]
- Sha, F.; Zhang, L.; Zhang, M.; Zuo, Y.; Niu, H. Penetration grouting diffusion and strengthening mechanism of sand layer with crucial grout. J. Build. Eng. 2024, 91, 109585. [Google Scholar] [CrossRef]
- Zhang, H.; Guo, Y.; Sun, T.; Zhang, C.; Liang, W.; Li, X. Diffusion properties and cementitious characteristics of ultrafine cement slurry in coral sand. Mar. Georesources Geotechnol. 2024, 1–13. [Google Scholar] [CrossRef]


| Silicon Dioxide | Moisture Content | Mud Content | Heat Loss | Chloride Ion Content | Floatation Content |
|---|---|---|---|---|---|
| >98% | ≤0.18% | ≤0.18% | <0.47% | ≤0.0070% | ≤0.0020% |
Disclaimer/Publisher’s Note: The statements, opinions and data contained in all publications are solely those of the individual author(s) and contributor(s) and not of MDPI and/or the editor(s). MDPI and/or the editor(s) disclaim responsibility for any injury to people or property resulting from any ideas, methods, instructions or products referred to in the content. |
© 2025 by the authors. Licensee MDPI, Basel, Switzerland. This article is an open access article distributed under the terms and conditions of the Creative Commons Attribution (CC BY) license (https://creativecommons.org/licenses/by/4.0/).
Share and Cite
Li, L.; Deng, C.; Chen, Y.; Xu, Z.; Yan, W.; Zhou, Y. Experimental Analysis of the Slurry Diffusion Behavior Characteristics of Point Source Grouting and Perforated Pipe Grouting in Sandy Soil. Buildings 2025, 15, 1133. https://doi.org/10.3390/buildings15071133
Li L, Deng C, Chen Y, Xu Z, Yan W, Zhou Y. Experimental Analysis of the Slurry Diffusion Behavior Characteristics of Point Source Grouting and Perforated Pipe Grouting in Sandy Soil. Buildings. 2025; 15(7):1133. https://doi.org/10.3390/buildings15071133
Chicago/Turabian StyleLi, Liuxi, Chao Deng, Yuan Chen, Zhichao Xu, Wenqin Yan, and Yi Zhou. 2025. "Experimental Analysis of the Slurry Diffusion Behavior Characteristics of Point Source Grouting and Perforated Pipe Grouting in Sandy Soil" Buildings 15, no. 7: 1133. https://doi.org/10.3390/buildings15071133
APA StyleLi, L., Deng, C., Chen, Y., Xu, Z., Yan, W., & Zhou, Y. (2025). Experimental Analysis of the Slurry Diffusion Behavior Characteristics of Point Source Grouting and Perforated Pipe Grouting in Sandy Soil. Buildings, 15(7), 1133. https://doi.org/10.3390/buildings15071133