Article

Effect of Drying and Wetting Cycles on Deformation Characteristics of Compacted Loess and Constitutive Model

1
College of Civil Engineering, Taiyuan University of Technology, Taiyuan 030024, China
2
Shanxi Transportation Construction Engineering Quality Detection Center Co., Ltd., Taiyuan 030006, China
3
China Railway Engineering Design Consulting Group Co., Ltd., Taiyuan Design Institute, Taiyuan 030013, China
4
Shool of Ocean Engineering, Harbin Institute of Technology Weihai, Wenhuaxi Road, Weihai 264209, China
*
Author to whom correspondence should be addressed.
Buildings 2025, 15(7), 1124; https://doi.org/10.3390/buildings15071124
Submission received: 11 March 2025 / Revised: 27 March 2025 / Accepted: 28 March 2025 / Published: 30 March 2025
(This article belongs to the Special Issue Advanced Research in Cement and Concrete)

Abstract

Owing to the alternating processes of rainfall and evaporation, the compacted loess employed in ground and roadbed construction frequently experiences drying and wetting (D-W) cycles. These cycles are prone to induce substantial deformation of the soil mass, posing a risk to the integrity of buildings and infrastructure. Consequently, this study delved into the effects of D-W cycles on the deformation behavior of compacted loess, considering varying initial dry densities and water contents. To achieve a profound understanding of the deformation characteristics of the compacted loess, we meticulously monitored the resistivity ratio, crack ratio, and microstructure throughout the tests. Furthermore, a constitutive model was developed to forecast the deformation of compacted loess under D-W cycles. The findings revealed that both the vertical strain and crack ratio exhibited an upward trend with the increase in D-W cycle numbers, while they exhibited a downward trend as dry density increased. Notably, water content was identified as a significant factor affecting both the crack ratio and resistivity ratio. Additionally, the occurrence and progression of D-W cycles and cracks led to a slight increase in particle abundance and the proportion of total pore area. Meanwhile, during the wetting process, the infiltration of water softened the cementing substances, resulting in a disruption of the connections between aggregates. This made it much easier for cracks in the soil to expand after the sample dried. The constitutive model was meticulously constructed by incorporating yield surfaces that account for decreasing and increasing water contents. The validity of the proposed model was substantiated through a comparative analysis of the measured and calculated data. This comprehensive investigation furnishes a theoretical foundation for assessing the stability of compacted loess ground and roadbeds subjected to D-W cycles.

1. Introduction

Compacted loess is extensively utilized as a filling material for ground and roadbed construction in loess regions, primarily within the Loess Plateau. Due to the inherent limitations of on-site construction conditions, this material is often unevenly compacted and exhibits heterogeneous water content distribution. Furthermore, the cyclical climate and environmental changes induce frequent D-W cycles, which give rise to a plethora of geotechnical issues [1], including soil mass deformation and instability of the ground and roadbed. Clarifying these issues is imperative for gaining a profound understanding of the mechanical properties of compacted loess. Consequently, investigating the effects of D-W cycles on the deformation characteristics of compacted loess is of paramount importance for providing a theoretical foundation for assessing the stability of compacted loess mass.
Some studies have been conducted to investigate the effects of D-W cycles on soil deformation. Feng et al. [2] found that the presence of salts in soil inhibits soil cracking, while the D-W cycle promotes it. Li et al. [3] reported that the rebound modulus of soil samples exhibited gradual variations with D-W cycles, even for soils with identical compaction and water content. Mao et al. [4] discovered that the void ratio of soil masses tended to increase progressively during D-W cycles. Niu et al. [5] investigated the effects of dry density and D-W cycles on the soil–water characteristic of expansive soil. They pointed out that samples with a smaller initial dry density have a poorer water-holding capacity, and the greater the number of dry–wet cycles, the poorer the water-holding capacity of the samples. Collectively, these research studies demonstrate that D-W cycles exert a considerable influence on soil deformation. Consequently, a more comprehensive investigation into the effects of D-W cycles on the deformations of compacted loess was undertaken.
Additionally, D-W cycles have been related to the crack development in soil [6]. Guo et al. [7] observed no significant alteration in the number of soil cracks after three D-W cycles. With respect to clayey soils, Tang et al. [8] noted the emergence of a greater number of wider, irregular cracks on the soil surface subsequent to D-W cycles. However, the Crack Intensity Factor (CIF) exhibited a decrease after D-W cycles. Utilizing the Gamma Ray Computerized Tomography Recognition Technique (GCT), Pries et al. [9] monitored changes in soil cracks during D-W cycles, uncovering that an increase in macropore volume led to more irregular pore distribution and the formation of surface cracks. Research focusing on loess has also been carried out. Ye et al. [10] employed CT scanning imaging to investigate the internal fracture evolution of loess during D-W cycles, revealing that soil mass cracks originated from uneven water distribution, which induced significant hydraulic gradients and tensile stresses within the soil mass. Ye et al. [11] further noted that the progression of soil cracks accelerated with the increasing D-W cycle gradient. However, after three cycles, the development of loess cracks slowed and tended toward stabilization. Pan et al. [12] utilized nuclear magnetic resonance (NMR) technology to examine microstructural changes in loess, discovering a decrease in micropore volume, an increase in macropore volume, microfractures gradually transformed into new cracks, and a subsequent enhancement in crack visibility following D-W cycles.
Furthermore, the electrical resistivity method has been employed to monitor variations in soil properties, given its relevance to soil structure, dry density, and water content [13]. The soil skeleton exerts a significant influence on soil resistivity, while vertical loads indirectly affect resistivity by altering the structural characteristics of the soil. Alibrahim and Eris [14] explored the pattern of change in clay resistivity during consolidation, observing that the electrical conductivity of intact soil exhibited a gradual increase as the soil was compressed. Filho et al. [15] determined that resistivity is more closely associated with water content than soil compaction. Moreover, Liu et al. [16] found that resistivity exhibits an inverse relationship with water content at a constant level of compaction. Research conducted by Zhu and Li [17] indicated that the resistivity of unsaturated Q3 loess decreases as the degree of compaction increases. Dong et al. [18] utilized a resistivity measurement device to assess the resistivity of intact loess during compression tests. Furthermore, Qin et al. [19] discovered that the resistivity of unsaturated soil differs from that of saturated compacted loess soil during continuous loading compression, with horizontal resistivity not being equivalent to vertical resistivity during the compression process.
In addition, D-W cycles have a profound impact on the microstructure of loess. Xu et al. [20] delved into the damage characteristics of loess and discovered that the skeleton of saline loess becomes loose following D-W cycles, accompanied by a consistent rise in the diameter of the soil pores. The findings of Yuan et al. [21] indicate that the contacts between soil particles transition from face-to-face to point-to-point after undergoing D-W cycles. Ye et al. [22] examined the alterations in the microstructure of remolded loess subsequent to D-W cycles, revealing a reduction in the size of the clay mineral particles within the intergranular space coupled with a gradual rounding of the particle morphology. Furthermore, the contacts between particles evolve into unstable connections. Kong et al. [23] investigated the effects of the D-W cycle degree on the water-holding and gas-permeable properties of compacted loess. The research results showed that the D-W cycles cause some of the larger aggregates in the loess samples to decompose into smaller ones. Meanwhile, some fine particles between the soil particle frameworks re-aggregate to form a metastable stacking structure. Qin et al. [24] explored the microscopic characteristics of the evolution of the collapsibility of compacted loess under the action of D-W cycles. The study pointed out that during the dry–wet cycle process, the cementing substances between loess particles dissolve due to water erosion. This causes the arrangement of the skeleton particles of loess to loosen, directly leading to a rapid decline in the strength of the loess.
Significant progress has been made in the investigation of soil swelling and shrinkage deformation during D-W cycles through the establishment of constitutive models. Alonso et al. [25] introduced the suction yield surface in the Barcelona Basic Model, employing it to characterize swelling–shrinkage deformation. Furthermore, Alonso et al. [26] extended this concept by proposing suction yield surfaces under various conditions within the Barcelona Expansion Model. Based upon these foundational models, Zhao et al. [27] examined the impact of various factors on the accumulative deformation of soil samples. Subsequently, Zhao et al. [28] refined the definition of suction yield surfaces under diverse conditions and utilized this constitutive model to simulate soil deformation throughout D-W cycles. Nevertheless, research on constitutive models for swelling–shrinkage deformation in compacted loess remains limited.
This research explored the effects of water content, dry density, and the number of drying and wetting (D-W) cycles on the deformation, resistivity characteristics, and microstructure of compacted loess. Based upon the experimental findings, a constitutive model was developed to predict the deformation of loess subjected to D-W cycles. The model was then rigorously validated to assess its predictive accuracy and rationality.

2. Apparatus and Methodology
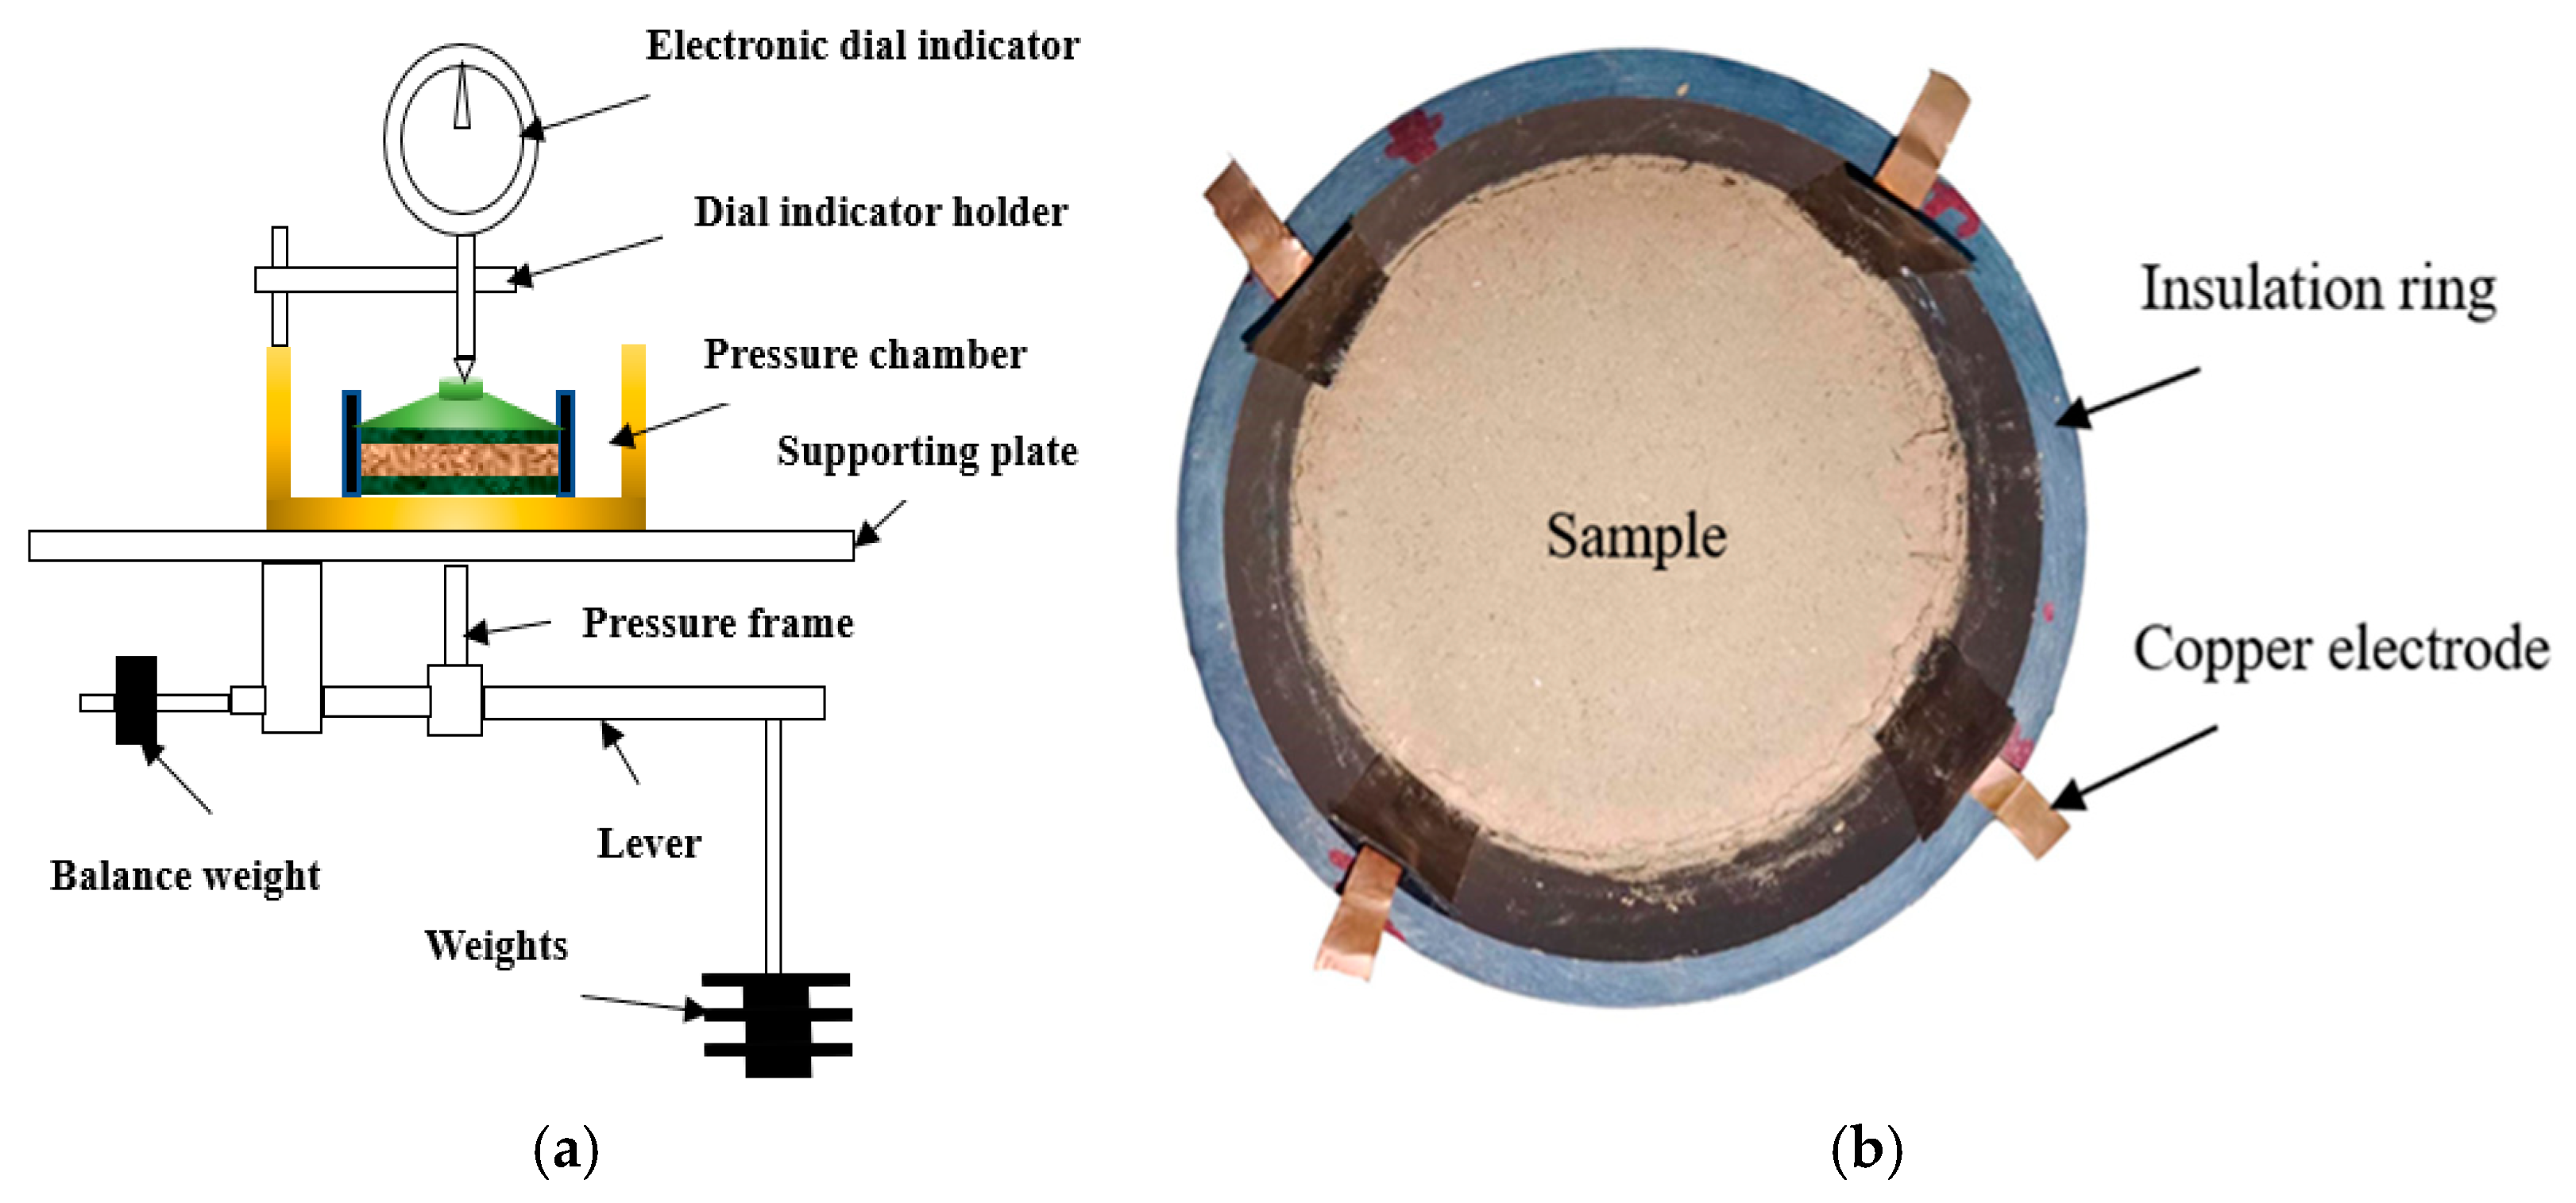
2.1. Test Apparatus

This investigation employed an incremental loading (IL) frame (Figure 1a) to conduct the experimental tests. Vertical loads were applied to soil samples using a consolidation apparatus, which facilitates compression tests and enables the acquisition of soil sample deformations and physical parameters. The minimum vertical load applied was 2 kPa, while the maximum reached 1600 kPa, with an error margin of less than ±2 kPa. To accommodate resistivity measurements, the sample ring was fabricated from rigid plastic, and copper electrode sheets were affixed to the inner wall of the sample ring in a cross-symmetric configuration. The inner diameter of the insulation ring utilized in this study was 80 mm, as illustrated in Figure 1b.
The LCR digital bridge, a sophisticated instrument designed for the precise measurement of capacitance, resistance, and inductance, is renowned for its ease of operation. In this investigation, the AC LCR bridge was utilized to assess the impedance of soil samples. A range of frequencies of 50 Hz, 100 Hz, 500 Hz, 1 kHz, 5 kHz, 10 kHz, 50 kHz, and 100 kHz was selected for impedance testing. The conductive medium exhibits the polarization phenomenon under the action of an electric field, which affects the accuracy of the impedance test results. According to the preliminary experiments and the research findings of Dong et al. [18], when the test frequency is 50 kHz, the polarization phenomenon of the sample is relatively small, and the measurement results are more accurate. Therefore, the two-point measurement method [29] was used to conduct impedance measurement at 50 kHz. The resistivity was subsequently calculated using Equation (1).
ρ = | Z | S / L
where |Z| is the impedance mode (Ω), S is the area of electrode (m2), ρ is the resistivity of soil (Ω·m), and L is the distance between electrodes (m).

2.2. Sample Preparation

This research concentrated on Q4 loess sourced from Dongshan in Taiyuan, a region where the soil is frequently employed as subgrade and filling material. Excavations extended to a depth of 1.5 m below the ground surface. To mitigate the risk of contamination during transit, the soil samples were meticulously sealed in bags immediately after extraction. The soil exhibited a consistent texture and a characteristic yellow hue. Table 1 delineates the essential physical properties of the soil. The loess was classified as silt characterized by a plasticity index of less than 10 and comprising more than 50% fines.
The preparation of compacted loess samples encompassed a series of meticulous steps. Initially, the collected soil material was subjected to sieving to ensure homogeneity. Subsequently, the powdered soil was accurately weighed and meticulously sprayed with water to achieve the predetermined water content. Following this, the material was sealed for a duration of 24 h to facilitate uniform water distribution throughout the soil. Ultimately, the soil underwent compression at a controlled rate of 0.1 mm/min, resulting in the formation of samples with a diameter of 80 mm and a height of 10 mm. After compression, the sample was maintained at a constant volume for 10 min to mitigate rebound effects. This protocol was consistently applied to the preparation of all samples. Detailed specifications for each compacted sample are provided in Table 2.

2.3. Test Schemes

Following the preparation of the samples, they were installed into incremental loading frames and subjected to an initial vertical pressure of 25 kPa. Subsequently, the compacted soil samples were air-dried at room temperature until they reached their driest state, achieving a water content of 1%. The samples were then immersed in distilled water within a container and allowed to saturate for a duration of 24 h. Following saturation, the samples were air-dried to a predetermined water content, thereby completing one drying and wetting (D-W) cycle. Notably, the water content of the soil was determined by weighing the samples, and this process was repeated until the designated number of D-W cycles was attained. Throughout the testing phase, the deformations of the samples were meticulously recorded. Additionally, once the samples were desiccated to a water content of 1%, photographs of the sample surfaces were captured to evaluate the progression of crack formation and development. It was imperative to maintain the camera parallel to the sample surface during photography to ensure accurate documentation.
Furthermore, using the Zeiss Gemini SEM 300 (manufactured by Carl Zeiss AG, Oberkochen, Germany), this research endeavor explored the influence of multiple factors on the microstructure characteristics of the compacted loess clods. Prior to SEM analysis, the central portion of the sample, having undergone D-W cycles under a consistent vertical loading of 25 kPa, was excised and shaped into a soil clod measuring 1 cm2 × 0.5 cm. Subsequently, the soil clod was frozen with liquid nitrogen, and its water was extracted by a vacuum freezing drier to preserve structural integrity. Following this, the soil clods, coated with spray-on cladding material, were placed within the observation chamber. Then, SEM imaging of the soil clods commenced following vacuum treatment. The SEM images were subsequently converted into a binary format to facilitate quantitative analysis of two-dimensional porosity under various conditions. Figure 2 illustrates the process of the microscopic tests.

3. Results and Analysis

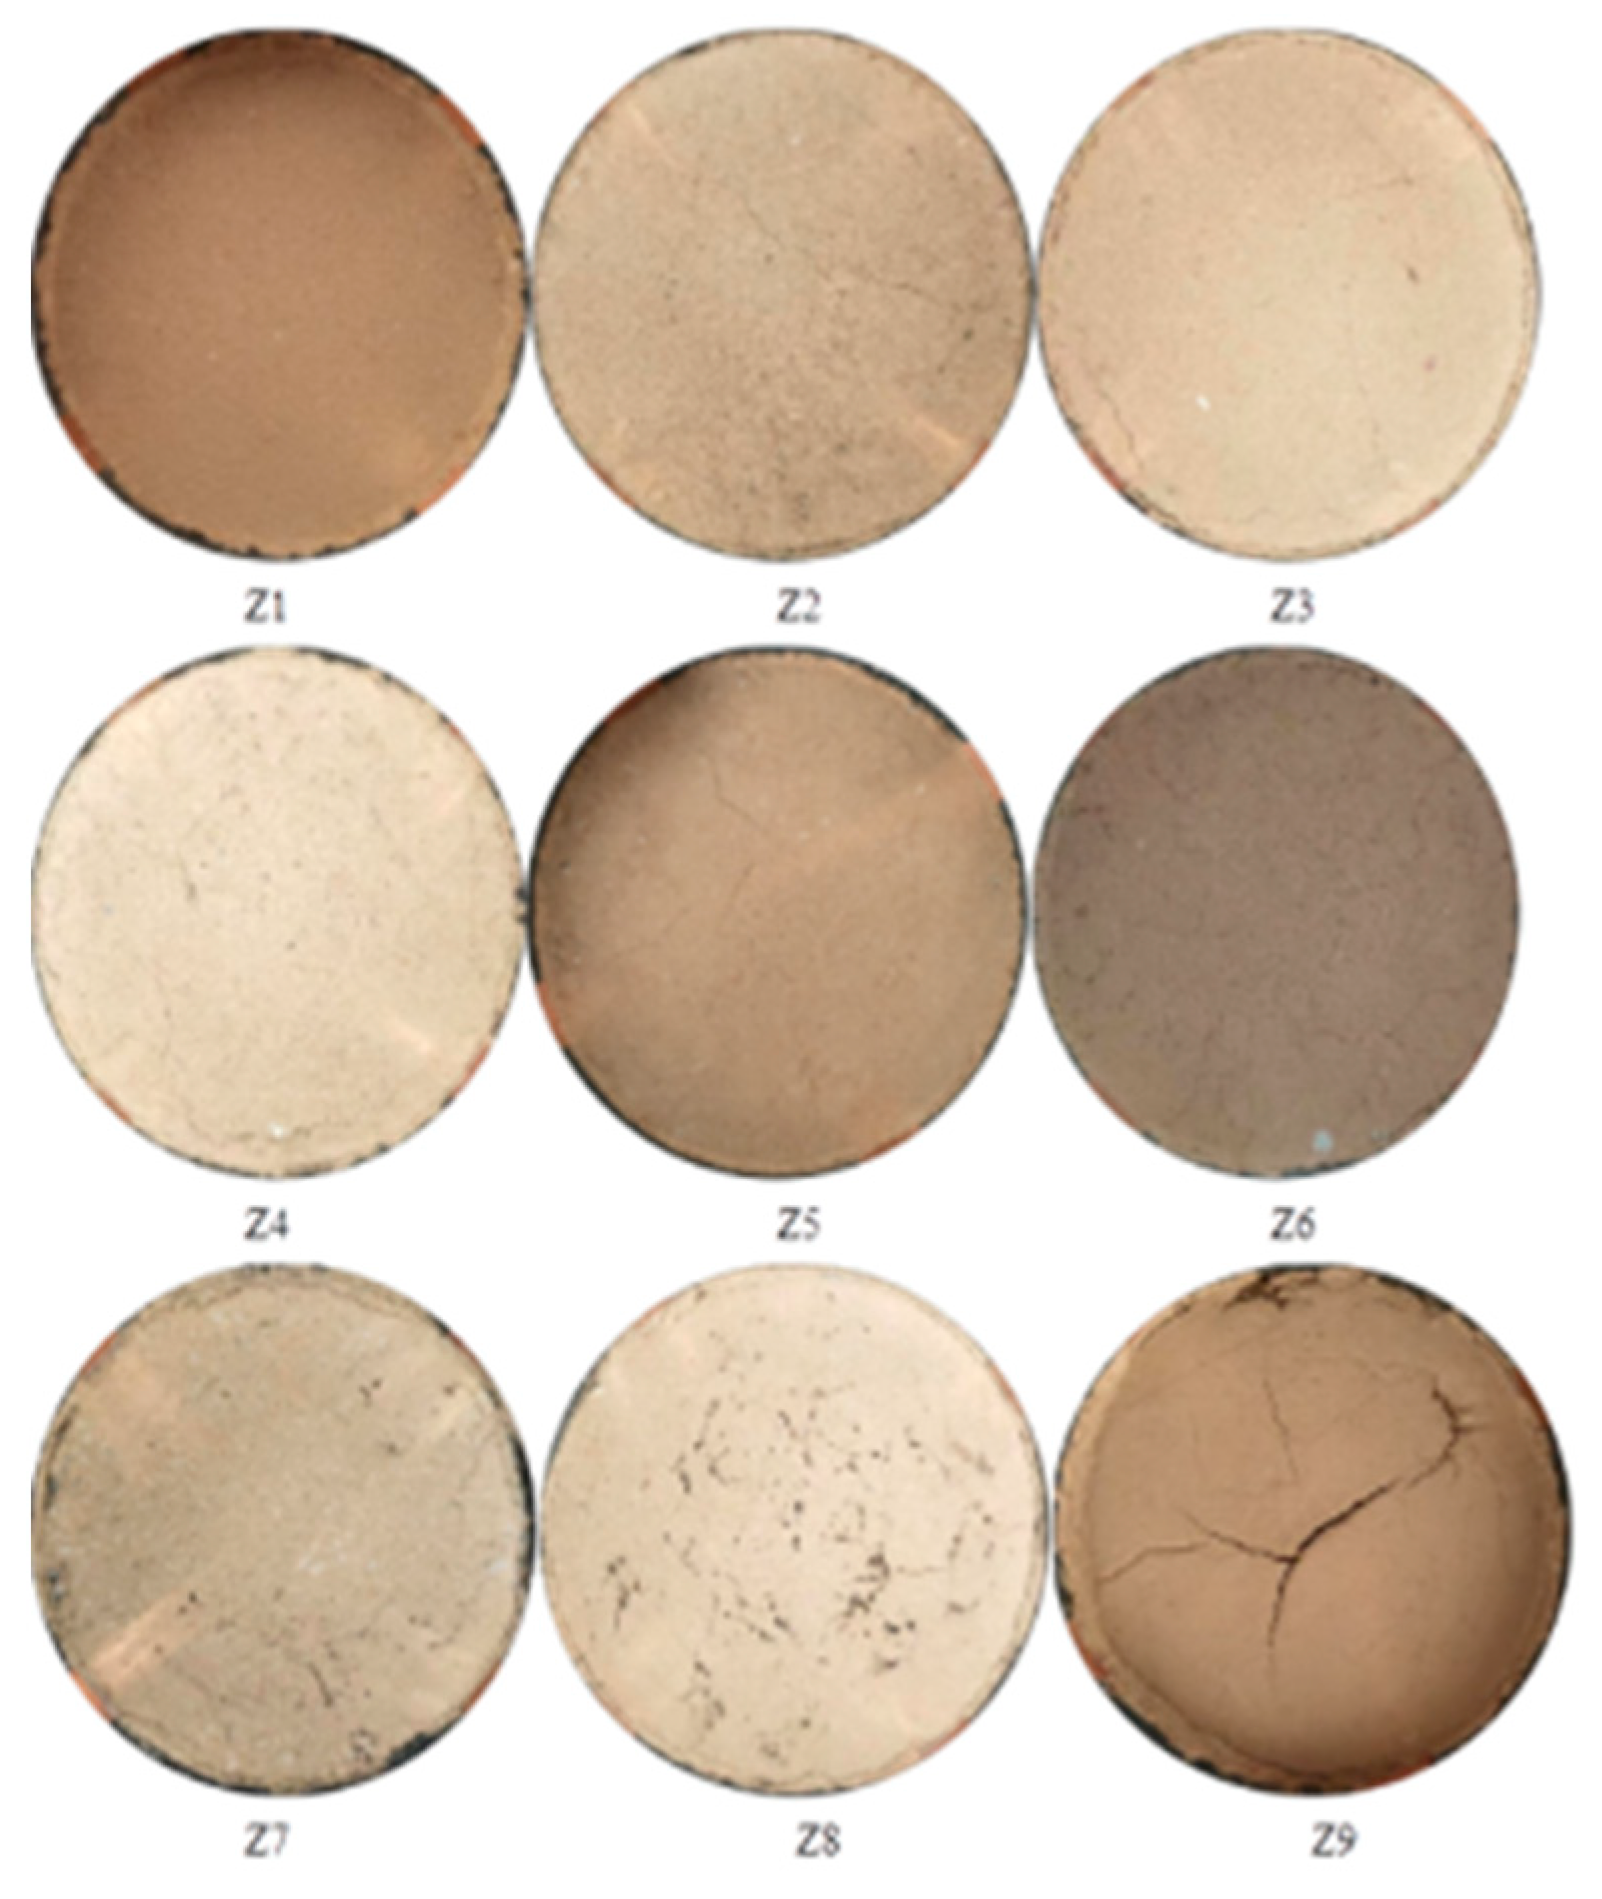
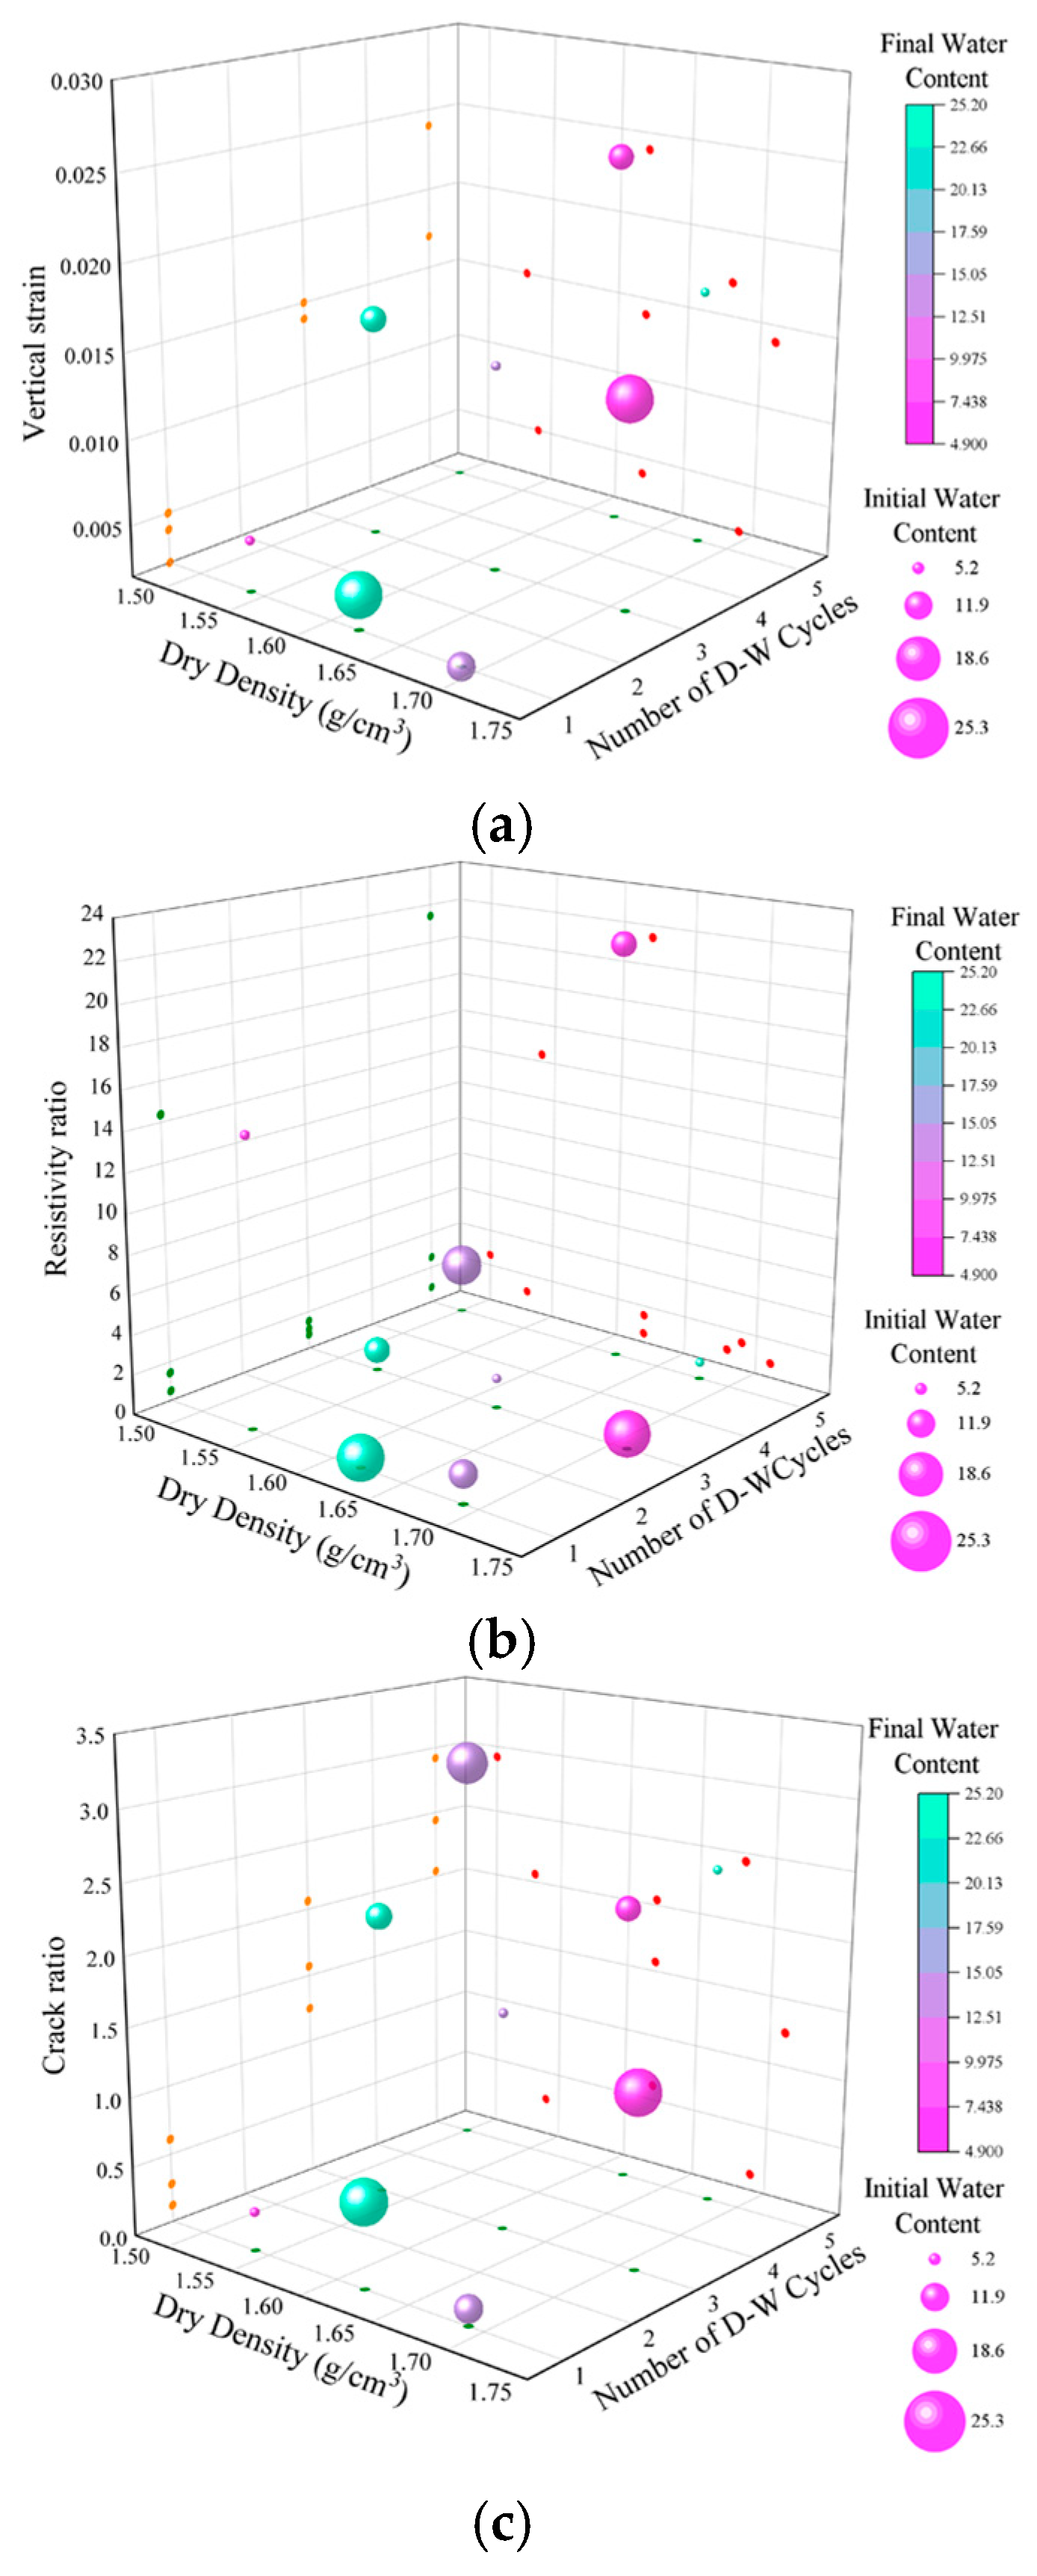
3.1. Macroscopic Characteristics of Compacted Loess
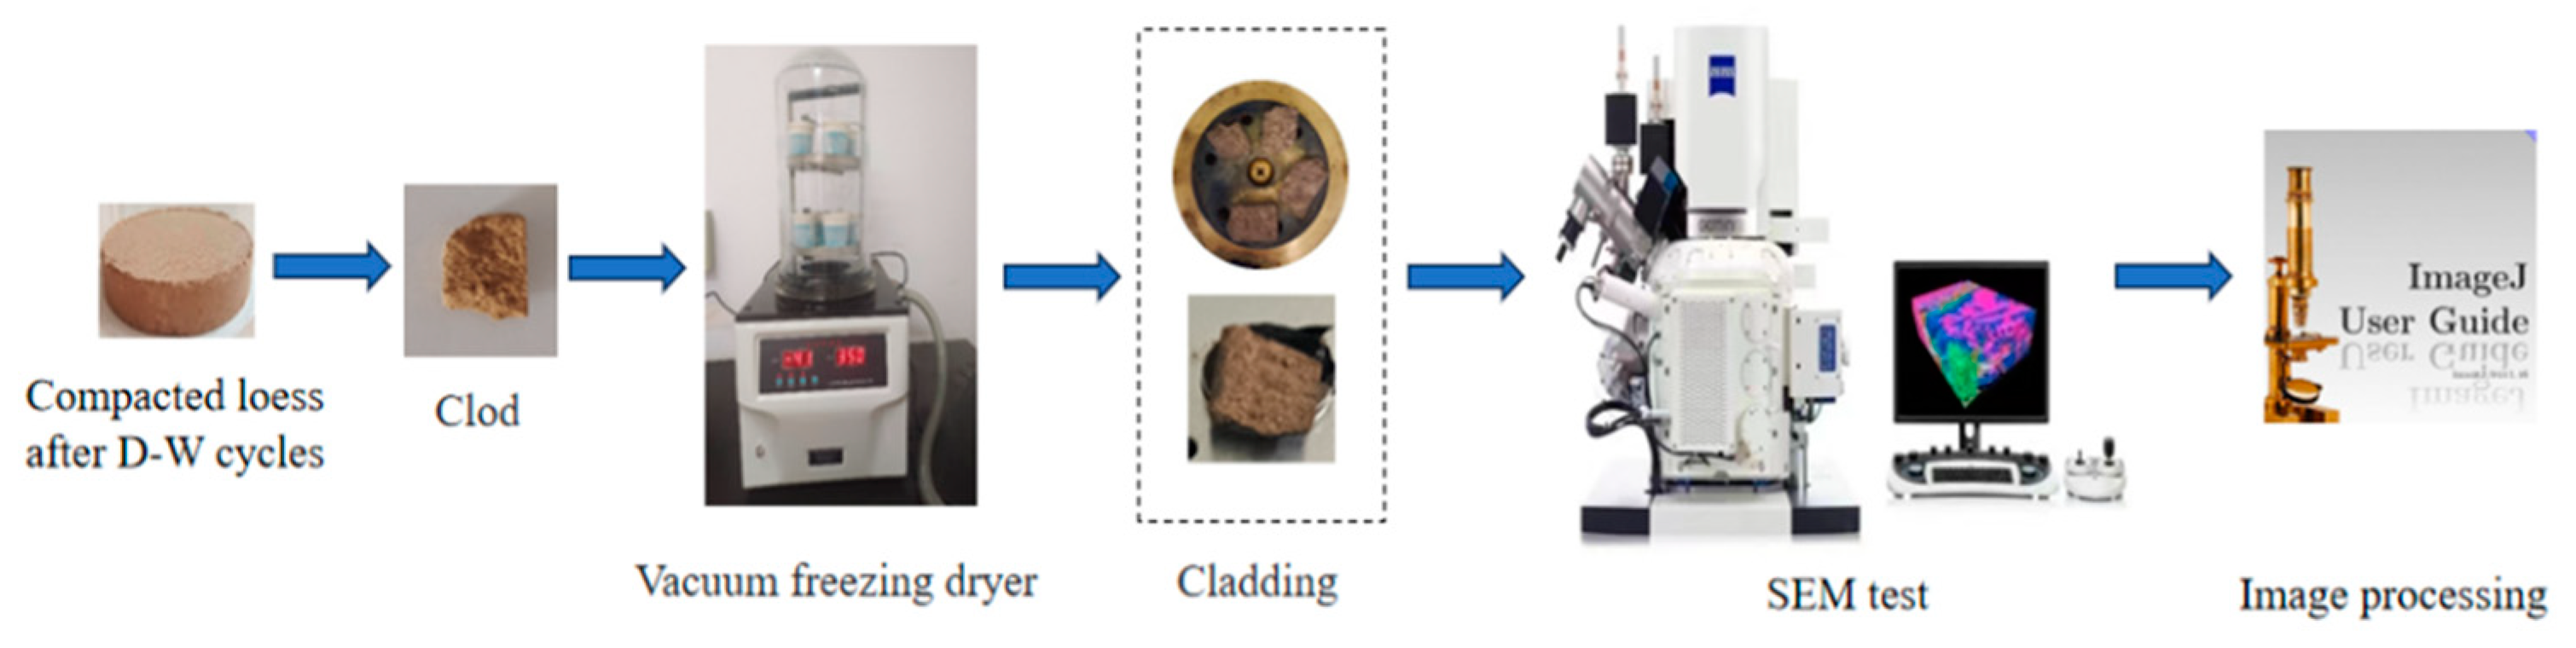
This research examined the influence of dry density, water content, and drying and wetting (D-W) cycles on the deformation behavior, resistivity ratio, and crack ratio of compacted loess.
Vertical strain is defined as the ratio of vertical deformation to the initial height of the sample. The vertical deformation of the sample during D-W cycles was meticulously monitored using a digital micrometer. To evaluate the extent of crack formation throughout D-W cycles, the crack ratio (CR) was employed to assess the size of sample cracks. The CR was calculated by dividing the crack area by the total surface area of the sample. Figure 3 provides a visualization of crack development in samples Z1–Z9. Regarding resistivity, direct comparisons may lead to inaccuracies [30]. To mitigate the influence of variations in sample initialization on test outcomes, the resistivity of the initial saturated state of the samples was utilized as a reference point. The measured resistivity was subsequently divided by the reference resistivity to analyze the pattern of resistivity change [31].
Table 3 presents the results of the tests, including vertical strain, resistivity ratio, and crack ratio of the samples. These data are visualized in 3D scatter ribbon and wall graphs, illustrating the variations with respect to dry density, number of D-W cycles, and water content, as depicted in Figure 4.
Based on the data presented in Table 3 and Figure 4, it is evident that the samples exhibited a decrease in volume following the drying–wetting (D-W) cycles. Furthermore, the accumulative strain for all samples was identified as shrinkage strain. Additionally, it was observed that the vertical strain of the samples increased in correlation with the increase in the number of D-W cycles. Notably, in comparison with the D-W cycles, the water content of the samples exerted a relatively minor influence on the vertical strain. During the D-W cycles, the vertical shrinkage strain decreased as the dry density increased. However, the average vertical strain of the samples with dry densities 1.6 g/cm3 and 1.7 g/cm3 was approximately equal. This finding implies that the effect of D-W cycles on soils with high density is limited. Moreover, the dry density also had a slight impact on the vertical strain of the soil during the D-W cycle. Furthermore, it is discernible that the crack ratio increased after the D-W cycles. Since the hydraulic gradient during the drying process escalates with the increase in the samples’ initial water content, cracks in these samples tend to develop more easily. Nevertheless, the impact of the initial water content on the crack ratio was less significant compared with that of dry density. Additionally, it was found that the extent of crack development was more pronounced in samples with lower dry density, and the final water content had a marginal influence on crack development.
In addition, the water content of the soil can have an impact on the soil’s resistivity [32]. It has been found that the water content of the soil exerts a significant influence on the resistivity ratio. In contrast, the D-W cycles and dry density have a relatively minor influence on this ratio. Moreover, the effect of the final water content on resistivity is more pronounced than that of the initial water content. This is because the final water content affects the number of connected channels. As the final water content escalates, the volume of soil pore water increases, which facilitates the formation of connected channels. However, water content, D-W cycles, and dry density can also affect the resistivity ratio by altering the soil structure. Furthermore, the results indicate that the initial water content has a substantial influence on the internal structure of the soil mass, followed by the D-W cycle, with the dry density having the least influence.

3.2. Microstructure

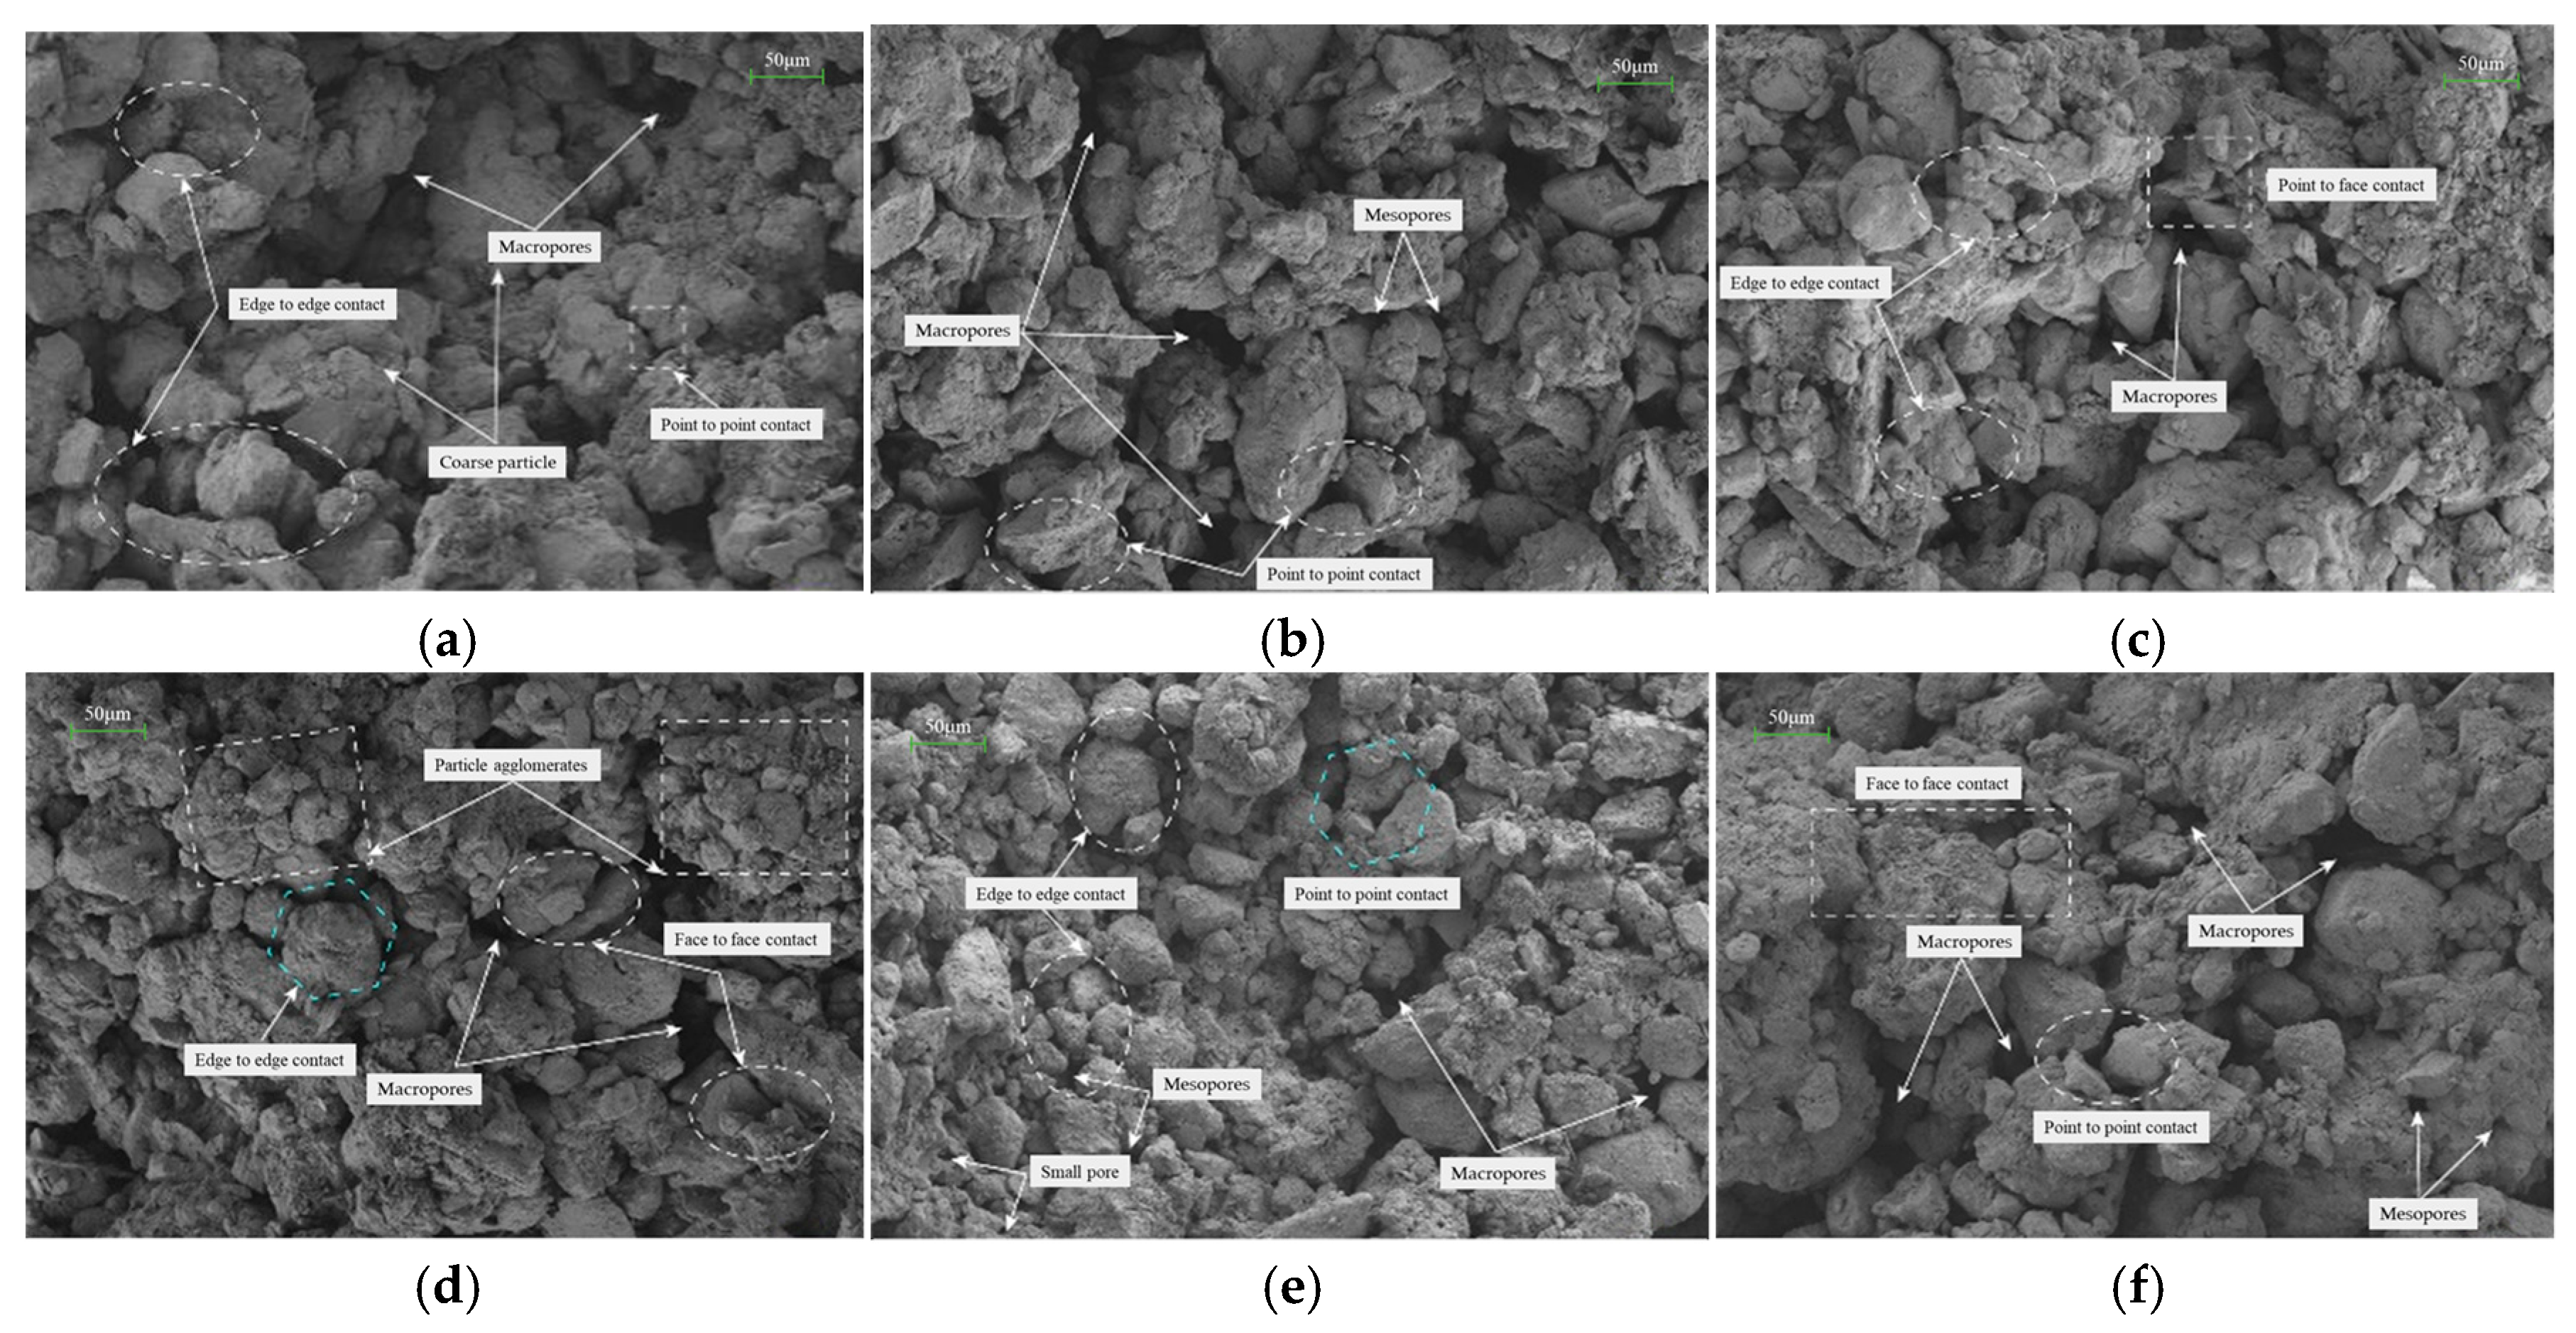
3.2.1. Analysis of SEM Images

Figure 5 presents the SEM images of soil clods under different conditions. Initially, when comparing the SEM images of soil clods with varying dry densities, it is evident that at a dry density of 1.5 g/cm3, the loess soil skeleton is relatively loose. The soil particles exhibit a chaotic accumulation pattern, with particle contacts primarily consisting of point-to-edge contacts. Additionally, there are obvious overhead pores within the soil clods, characterized by large pore diameters and irregular pore shapes. When the dry density increases to 1.7 g/cm3, the soil gradually becomes denser. The coarse particles are broken, and the quantity of fine particles increases, resulting in the formation of stable aggregates. Concurrently, with soil compaction, the macropores transform into smaller pores. By comparing Figure 5a,b,d,e, it can be inferred that the D-W cycles have a substantial influence on the soil microstructure, and this influence intensifies as the soil dry density increases. During the D-W cycle, some aggregates are separated. This occurs because water can soften the cementing materials, thereby reducing the cementation between particles during the wetting phase, which subsequently disrupts the particle connections [21]. Furthermore, the nature of particle–particle contacts changes from stable face-to-face contacts to unstable point-to-edge and point-to-point contacts after the D-W cycles. Meanwhile, micropores and small pores are transformed into mesopores and macropores during this process. However, the pore size of some macropores decreases. This is attributed to the splitting of the aggregates during the wetting process, which reduces their size, although some fine particles reaggregate into blocks [22].

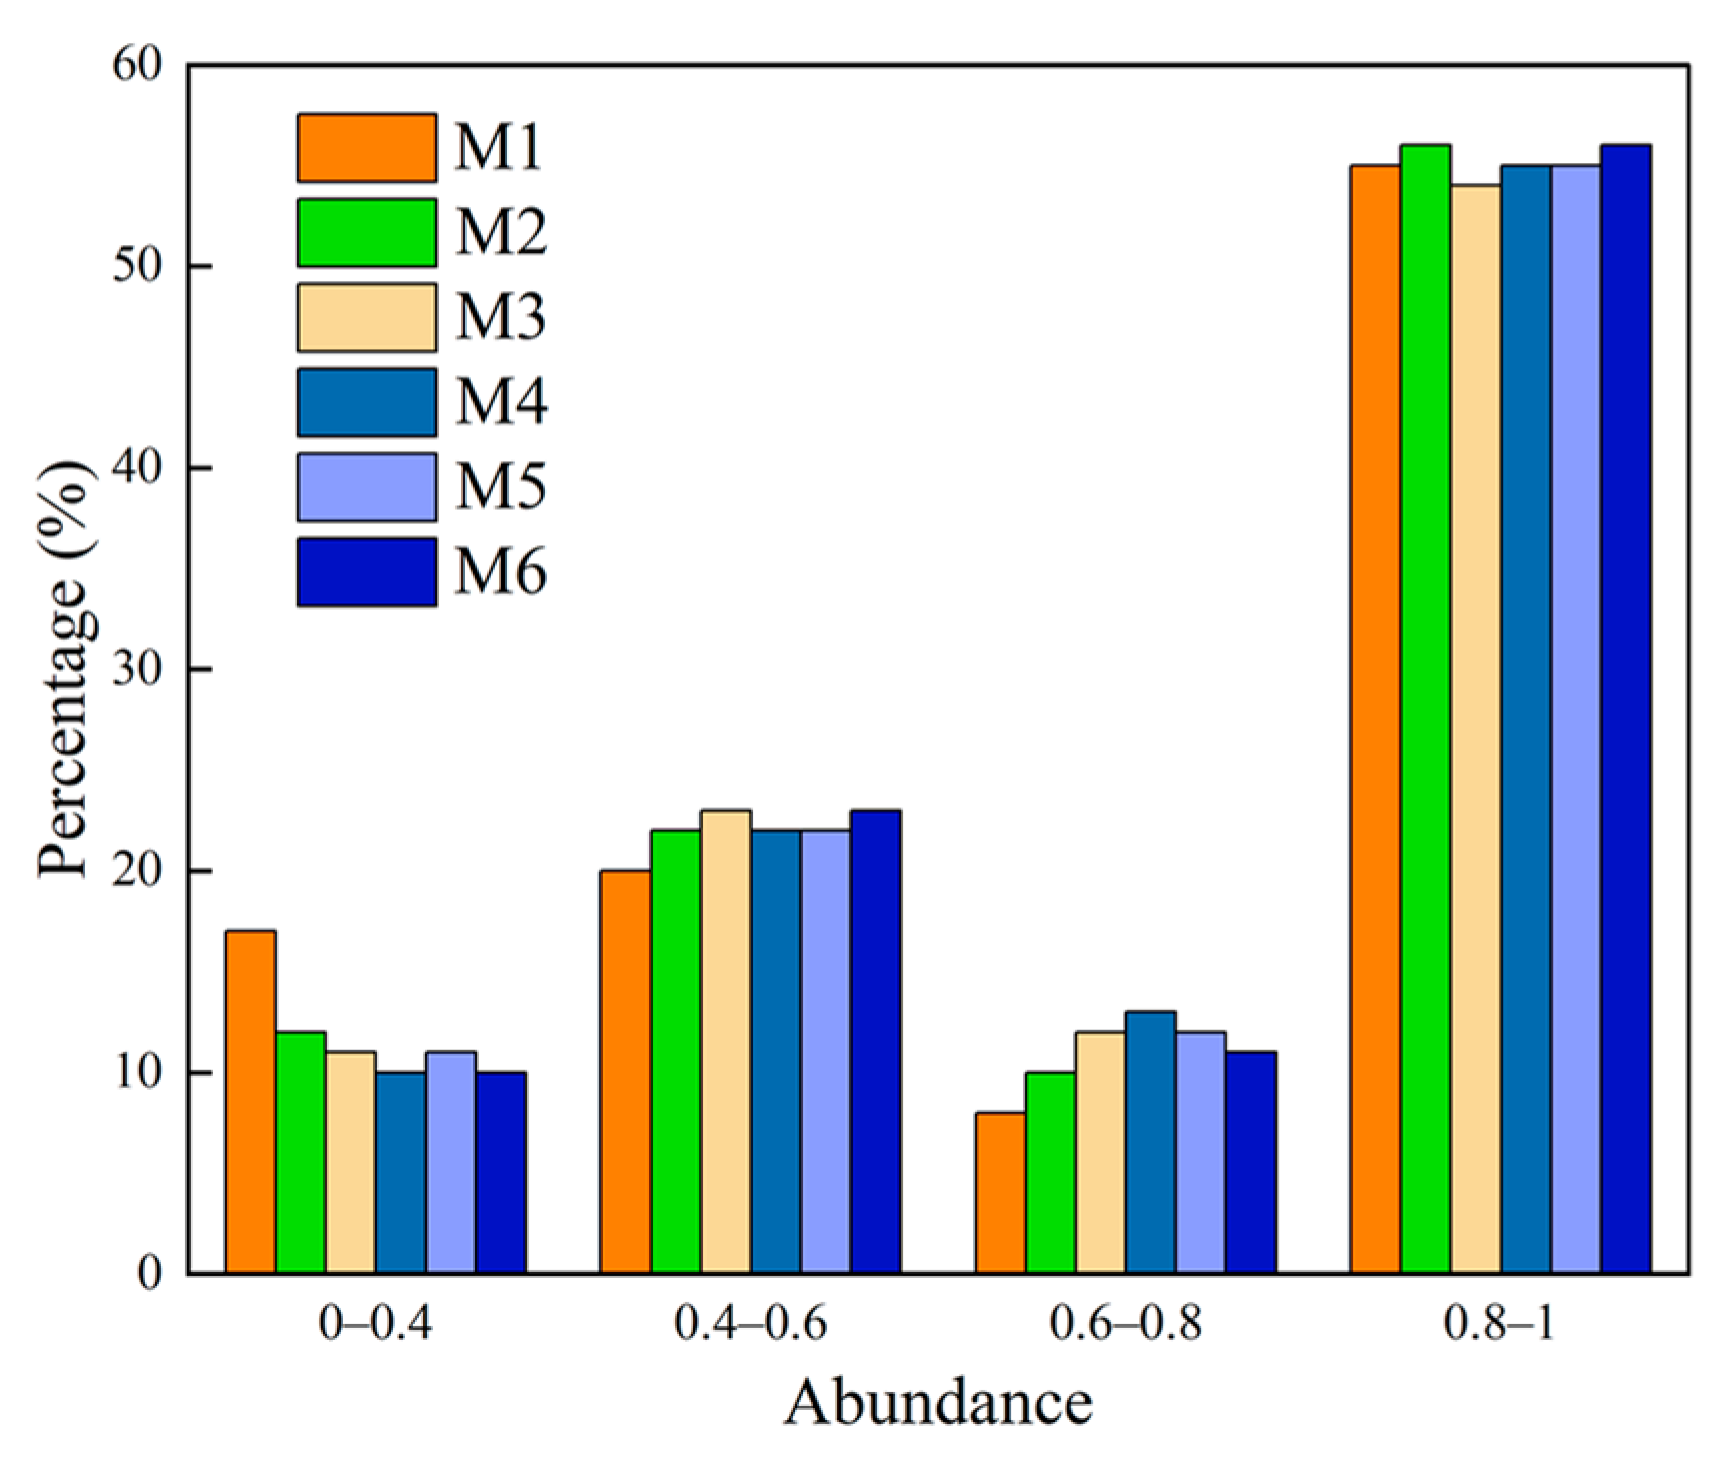
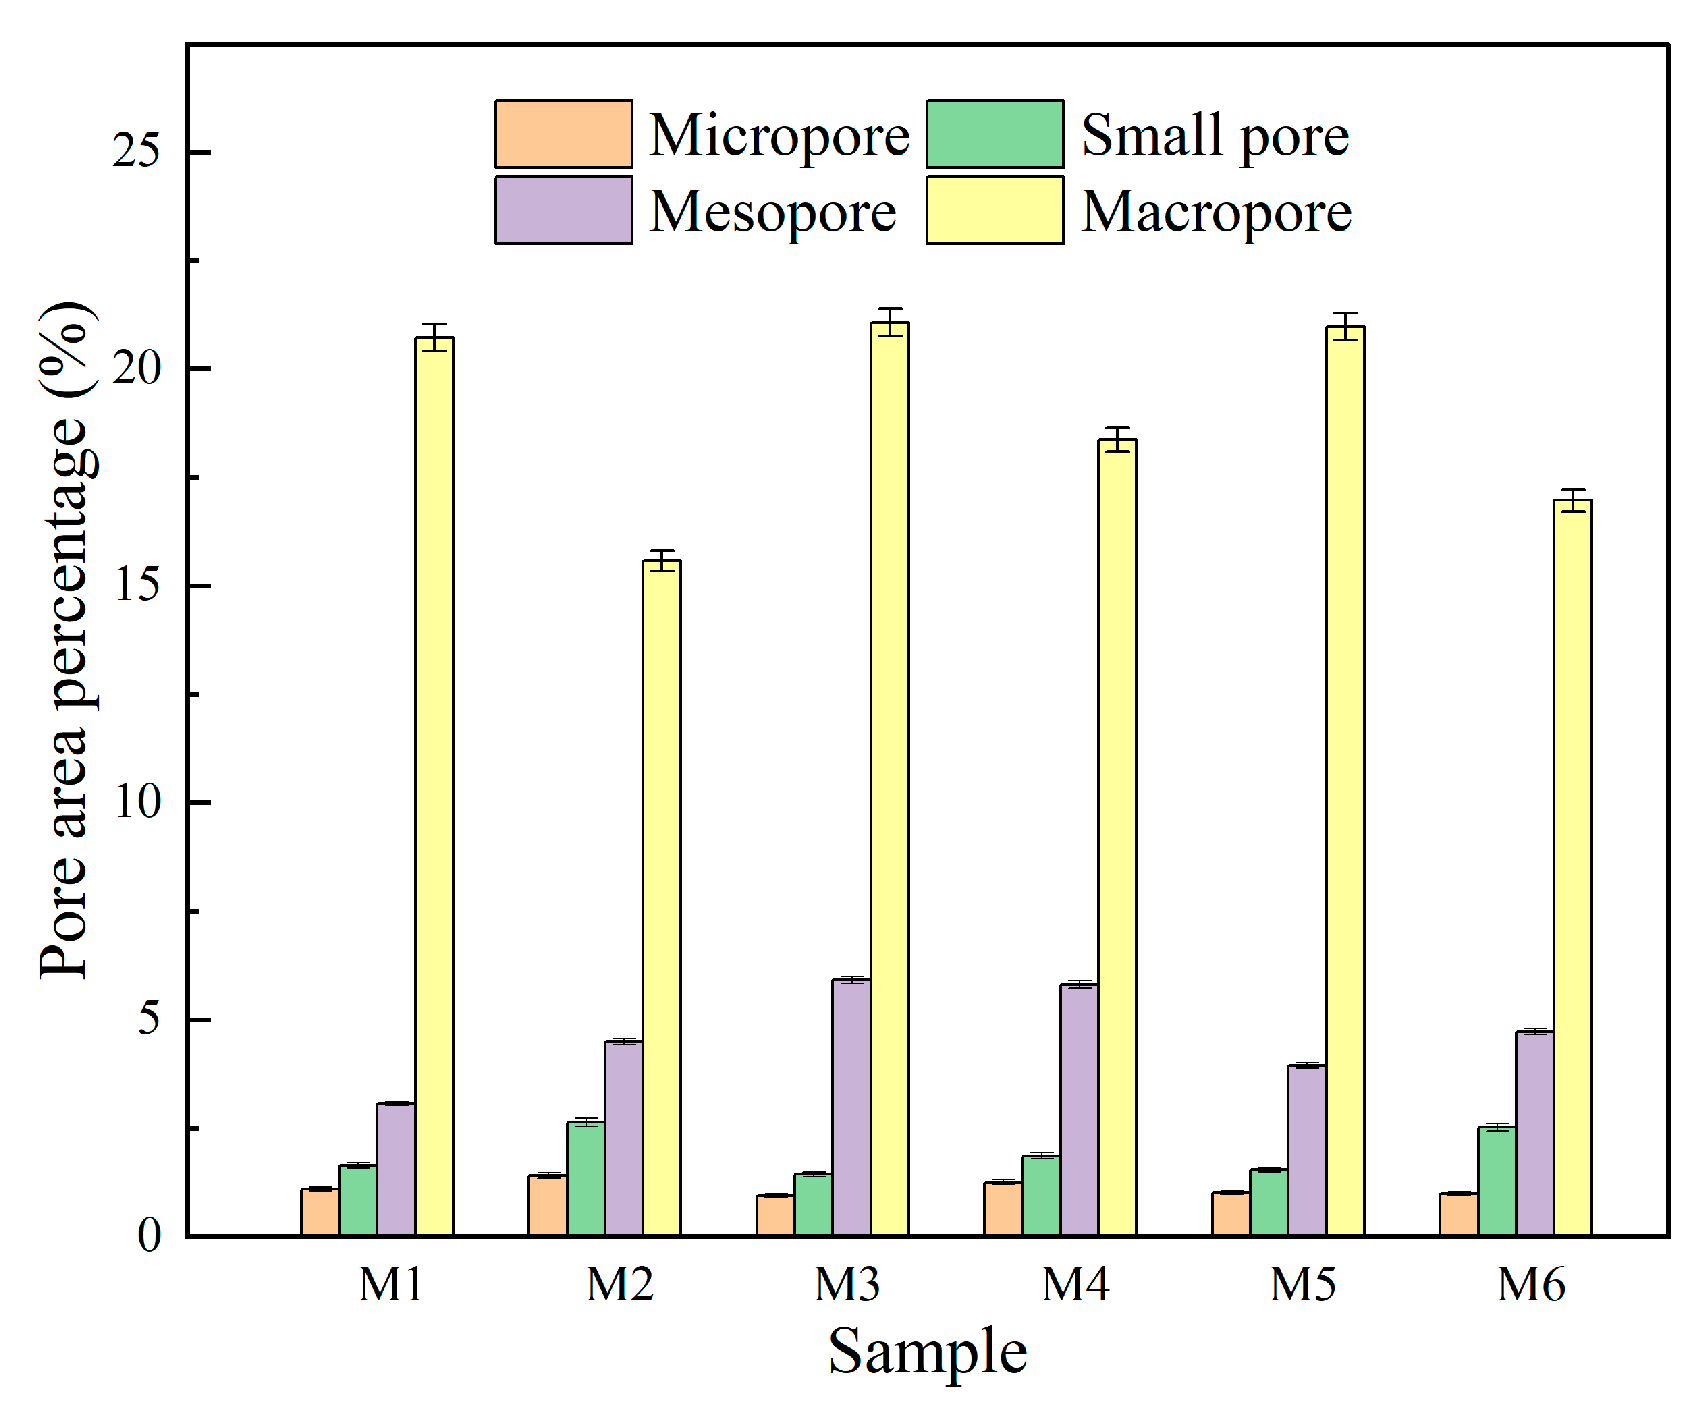
3.2.2. Quantitative Analysis

In this section, the SEM images were binarized, and the software’s automatic calculation function was utilized to extract relevant information pertaining to pores and particles. In this study, we concentrated on the quantitative analysis of particle abundance and pore area distribution.
The abundance value C, ranging from 0 to 1, approximately characterizes the morphology of particles. The equation for C is as follows:
C = B L
where L is the long diameter of the particle and B is the short diameter of the particle.
As the C value diminishes, the shape of the soil particles becomes more irregular and tends toward elongation. Conversely, an increase in the C value corresponds to a greater tendency for the soil particles to be rounded. Figure 6 reveals that the abundance of loess particles is primarily distributed within the range of 0.8–1, indicating that the overall shape of the particles is relatively uniform. When comparing the M1 and M2 data, a distinct trend can be observed: the abundance of particles decreases in the 0–0.4 range. However, there is an increase in particle abundance in the 0.4–0.6, 0.6–0.8, and 0.8–1.0 ranges. Then, when comparing the M3 and M4 data, it is found that the particle abundance decreases in the 0–0.4 and 0.4–0.6 ranges, while it increases in the 0.6–0.8 and 0.8–1.0 ranges. Finally, by comparing the M5 and M6 data, it is apparent that the particle abundance decreases in the 0–0.4 and 0.6–0.8 ranges, but increases in the 0.4–0.6 and 0.8–1.0 ranges. Through the above analysis, it is discovered that the particle abundance increases with the increase in dry density, indicating that as the soil undergoes progressive densification, there is a transformation in particle morphology from irregular and elongated to elliptical and rounded shapes. Furthermore, it is observed that after the D-W cycles, there is a decrease in particle abundance in the 0–0.4 and 0.8–1 ranges. The reduction in the 0–0.4 range is the most significant, while there is an increasing trend in the 0.4–0.6 and 0.6–0.8 ranges. This suggests that during the D-W cycles, a transition occurs from nearly round particles to elliptical and irregular elongated particles. Simultaneously, irregular elongated and elliptical particles transform into round particles. In summary, the soil particle abundance slightly increases after the D-W cycles [33]. Additionally, when comparing M3 with M5 and M4 with M6, it is observed that particle abundance increases with the decrease in final water content. This phenomenon is attributed to the loss of pore water during the drying process, which causes erosion and damage to the soil particles, resulting in the particles exhibiting a more regular shape.
The geometric visualization of soil pores was accomplished to obtain the geometric parameters of the pores, such as the number and angle. Referring to Lei [34] and Nie et al. [35], the pore classification method proposed by Lei was introduced. According to this method, loess pores are classified into four categories: macropores (with a diameter greater than 32 μm), mesopores (with a diameter ranging from 8 μm to 32 μm), small pores (with a diameter between 2 μm and 8 μm), and micropores (with a diameter less than 2 μm).
To analyze the pore distribution in loess samples under diverse conditions, statistical calculations based on the binarized images of the samples were carried out to derive the area ratios of the four types of loess pores, and the results were presented in histograms, as plotted in Figure 7. The pore distribution of the loess samples is dominated by macropores. Based on the analysis of Figure 7, it is evident that the total pore area decreases with the increase in dry density, indicating that the total pore volume gradually diminishes during compression. Additionally, for all samples, the percentage of macropore area relative to the total pore area decreases, while the percentages of mesopore area, small pore area, and micropore area relative to the total pore area increase. These observations suggest that as the dry density rises, the existing macropores transform into mesopores and small pores. Furthermore, during D-W cycles, the total pore area tends to increase. Meanwhile, micropores and small pores gradually coarsen, connect, and transform into mesopores and macropores throughout the D-W cycle process. As a result, the percentages of mesopore area and macropore area relative to the total pore area increase, while those of the small pore area and micropore area relative to the total pore area decrease. When the dry density and the number of cycles are given, the total pore area decreases as the final water content declines. Meanwhile, the percentages of macropore area and mesopore area relative to the total pore area decrease slightly, while those of the small pore area and micropore area relative to the total pore area increase slightly. During the wetting process of the soil, the micropores and small pores expand due to the wedging pressure caused by the hydration of clay particles in the sample. When this pressure exceeds a certain threshold, the inter-particle connections are irreversibly weakened, leading to the disintegration of particle aggregates and the loose arrangement of fine particles. Consequently, this results in a significant increase in the proportion of mesopore area and macropore area. During drying contraction, the fine particles aggregate together as the wedging pressure decreases. As a result, the particles become closely arranged between the aggregates, transforming macropores and mesopores into micropores and small pores. However, due to the unevenness of this shrinkage, particle aggregate cracks can easily occur, reducing the soil’s integrity and exacerbating the loss of soil strength [36].

4. Constitutive Model

In this study, we referred to the existing model of swelling and shrinkage deformation of expansive soil under D-W cycles [27,28]. Based on the experimental results, we established a swelling and shrinkage model for compacted loess, taking into account the influence of vertical pressure. This model incorporates various factors, such as the elastic zone, the state parameter, and the water content yield surface. We investigated the critical swelling and shrinkage states and made appropriate modifications to predict the swelling and shrinkage of compacted loess under vertical loading and D-W cycles. Eventually, the validity of the model was verified through the experimental data.

4.1. Elastic-Plastic Deformation Theory

The establishment of this model is grounded on the elastic–plastic theory, which delineates the critical water content for elastic–plastic deformation throughout the D-W cycles of compacted loess. Consequently, elastic and plastic deformation equations are derived from the elastic–plastic theory.
The formula for calculating the total deformation of loess is presented as Equation (3).
d ε = d ε e + d ε p
where e is the elastic deformation, p is the plastic deformation, and is the total deformation.
The e occurs when the water content surpasses the yield water content, while the p occurs when the water content is below the yield water content. The formulas for calculating the elastic deformation and the plastic deformation are shown in Equations (4) and (5):
d ε e = k w d w w + p
d ε p = λ w d w 0 w 0 + p
where kw and λw are the coefficients that vary with the water content, representing the elastic and plastic behaviors, respectively; w0 represents the threshold water content for yielding; and p indicates the vertical stress.
To determine the elastic compressibility coefficient kw, tests were conducted under two different conditions: a constant water content of 1% (denoted as w1) and a constant saturated water content (denoted as w2). The D-W cycle test was performed without the application of a vertical load. Subsequently, the stress–deformation relationship was obtained from the test results, and the elastic deformation parameters kw1 and kw2 were determined by calculating the slope of the stress–deformation line. The kw can be calculated using Equation (6).
k w = d e d log w = e 2 e 1 log w 2 / w 1
where the void ratios e1 and e2 correspond to the water content w1 and w2, respectively.
Meanwhile, the λw can be calculated by the kw. The equations for calculating the λw are shown as follows,
λ w = k w 1 + e cs 1 e e rc e ( Wetting ) k w 1 + e ss 1 e e rs e ( Drying )
where ecs1 is the critical void ratio, ess1 is the swelling stable void ratio, e is the current void ratio, erc is the intercept of the critical line, and ers is the intercept of the critical swelling stable line.
To ascertain the magnitude of deformation that occurs within the soil mass during D-W cycles, it is imperative to have access to information regarding the initial state of the soil mass (encompassing parameters such as p, ω, and e0), the critical swelling and shrinkage lines, as well as the swelling stable line. Subsequently, calculations are carried out for both the swelling deformation induced by wetting and the shrinkage deformation caused by drying, both of which exhibit elastic–plastic behavior. The sample deformation is determined by multiplying the final strain by the initial sample height.

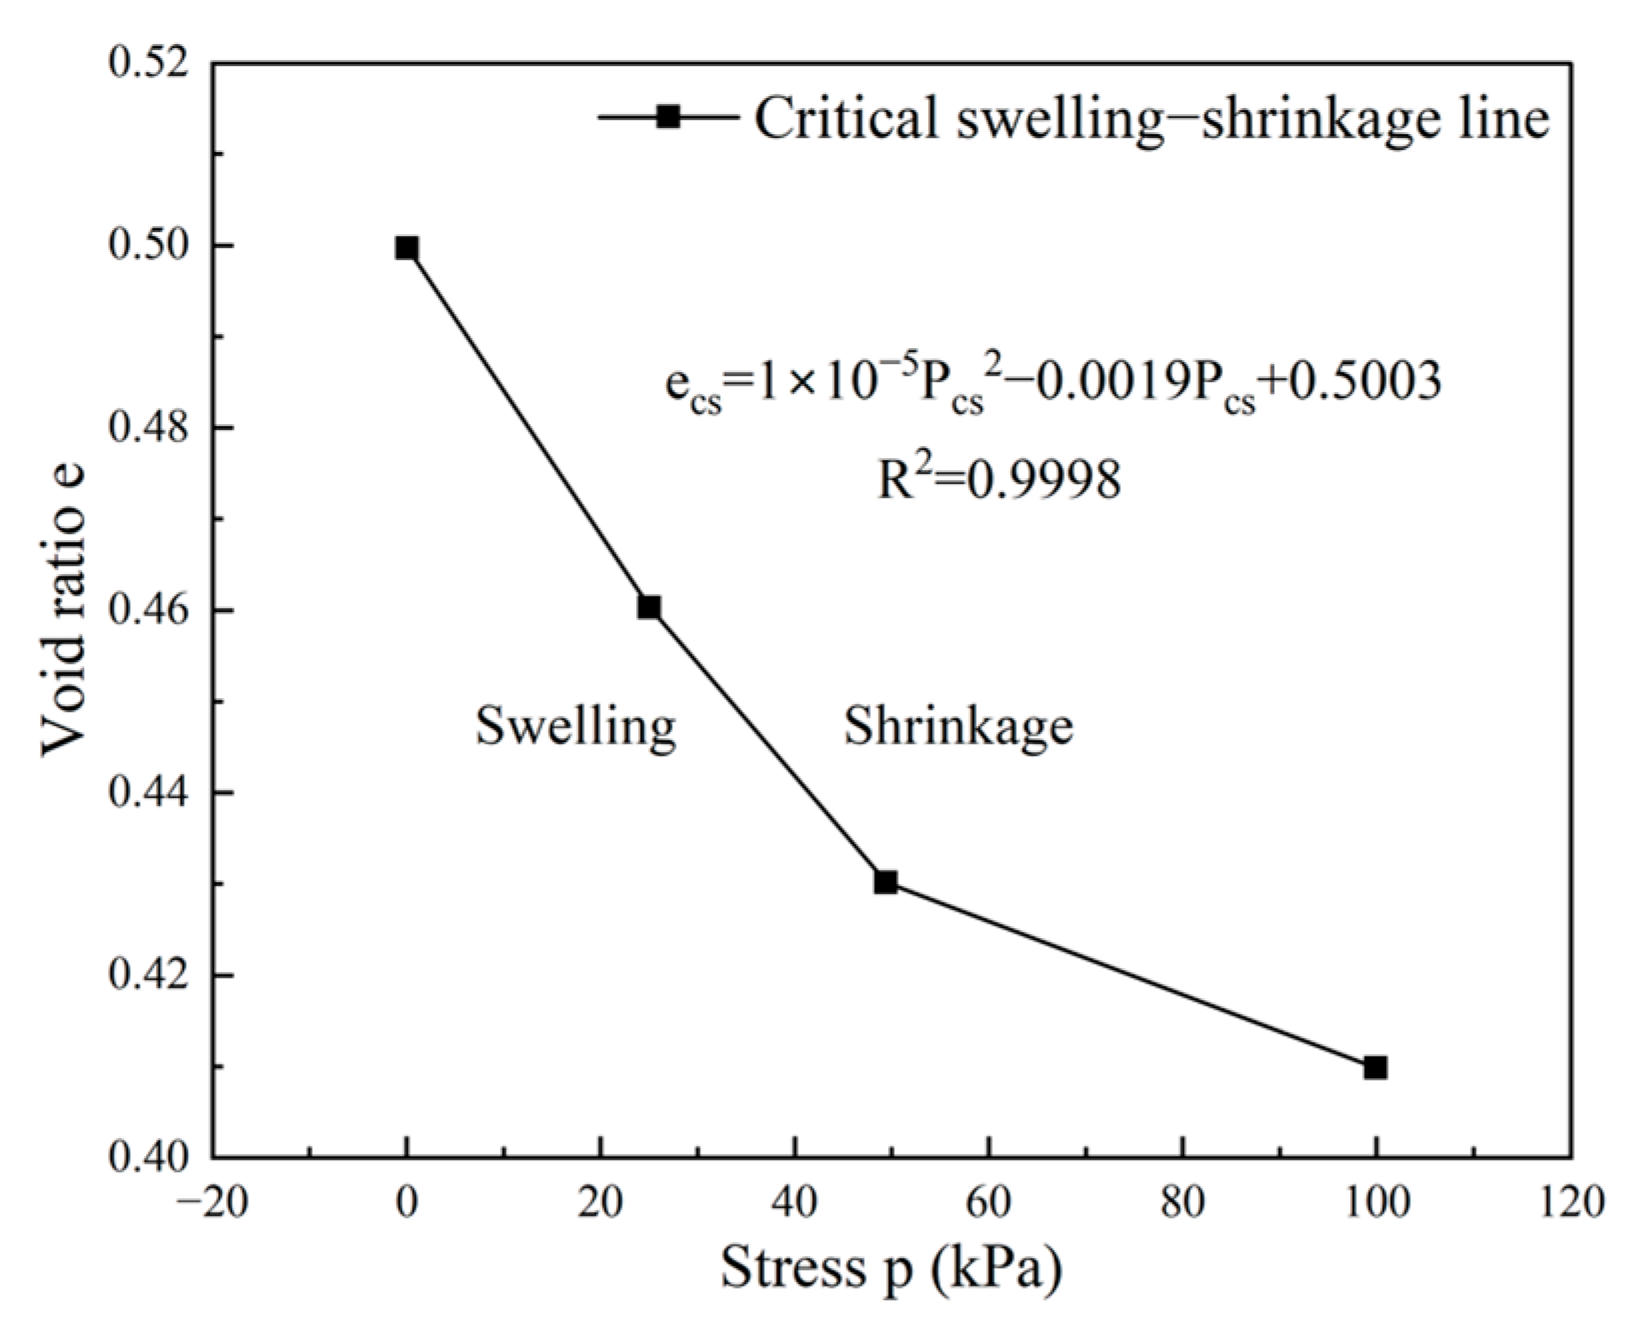
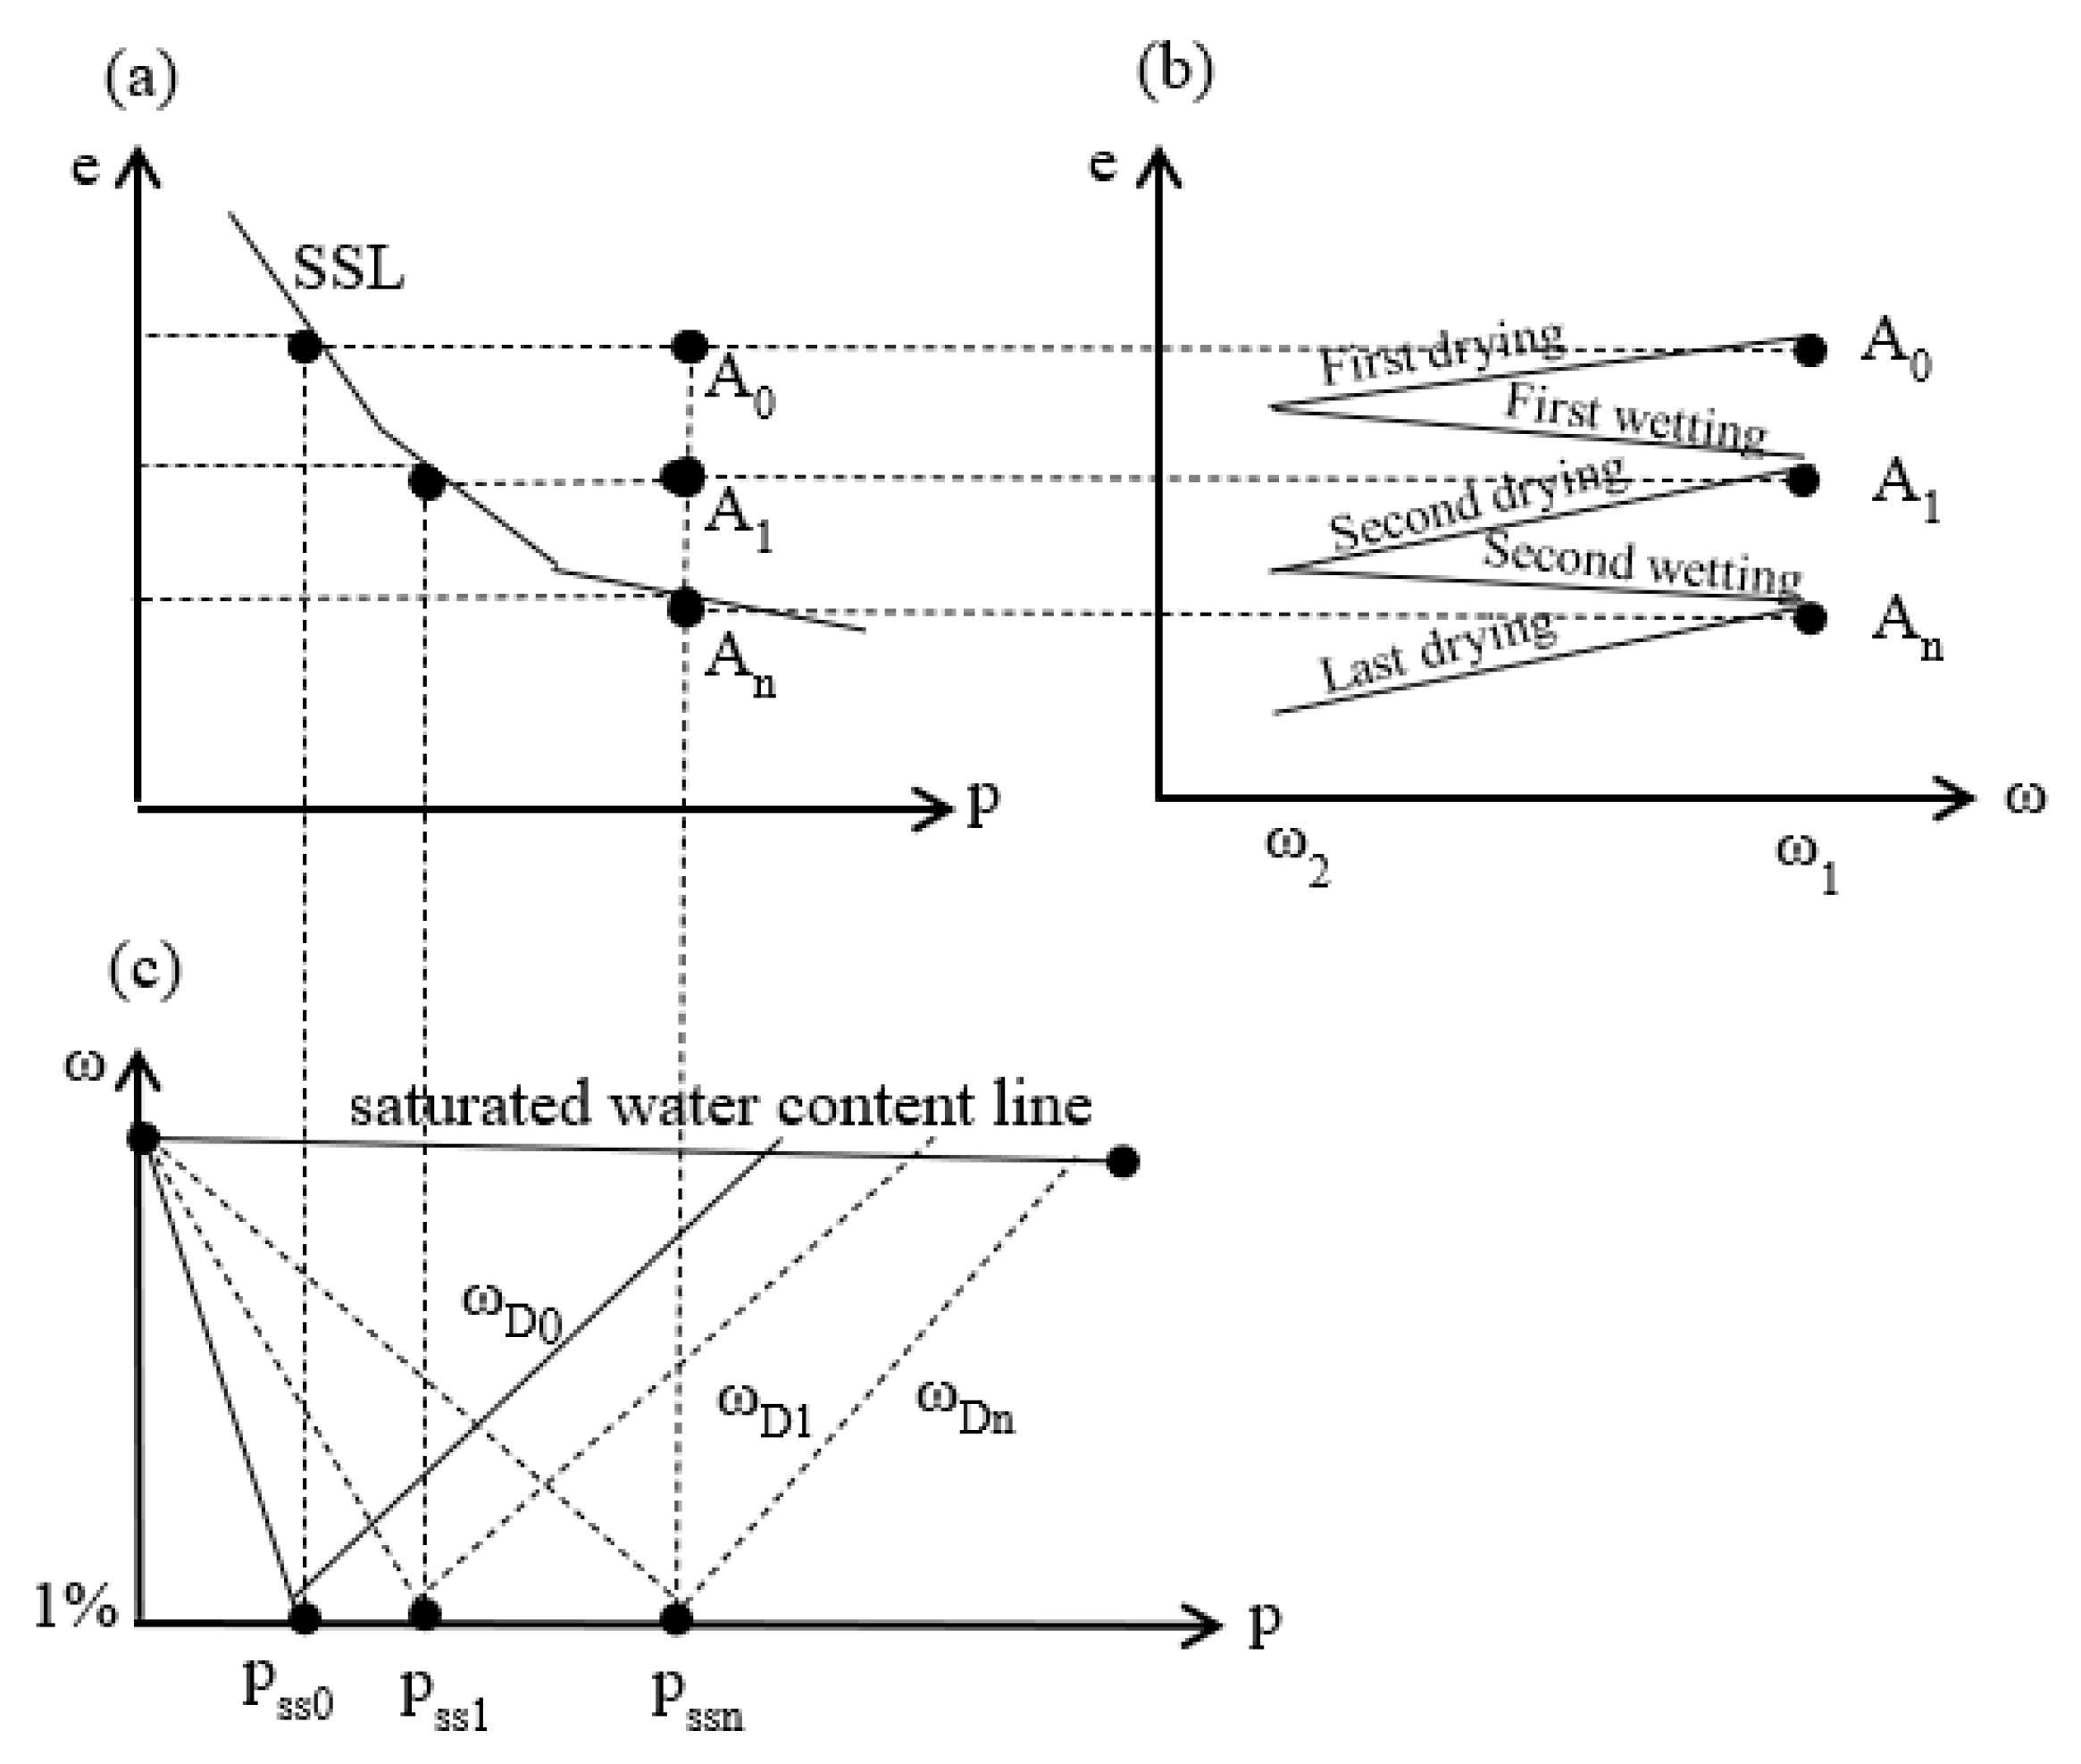
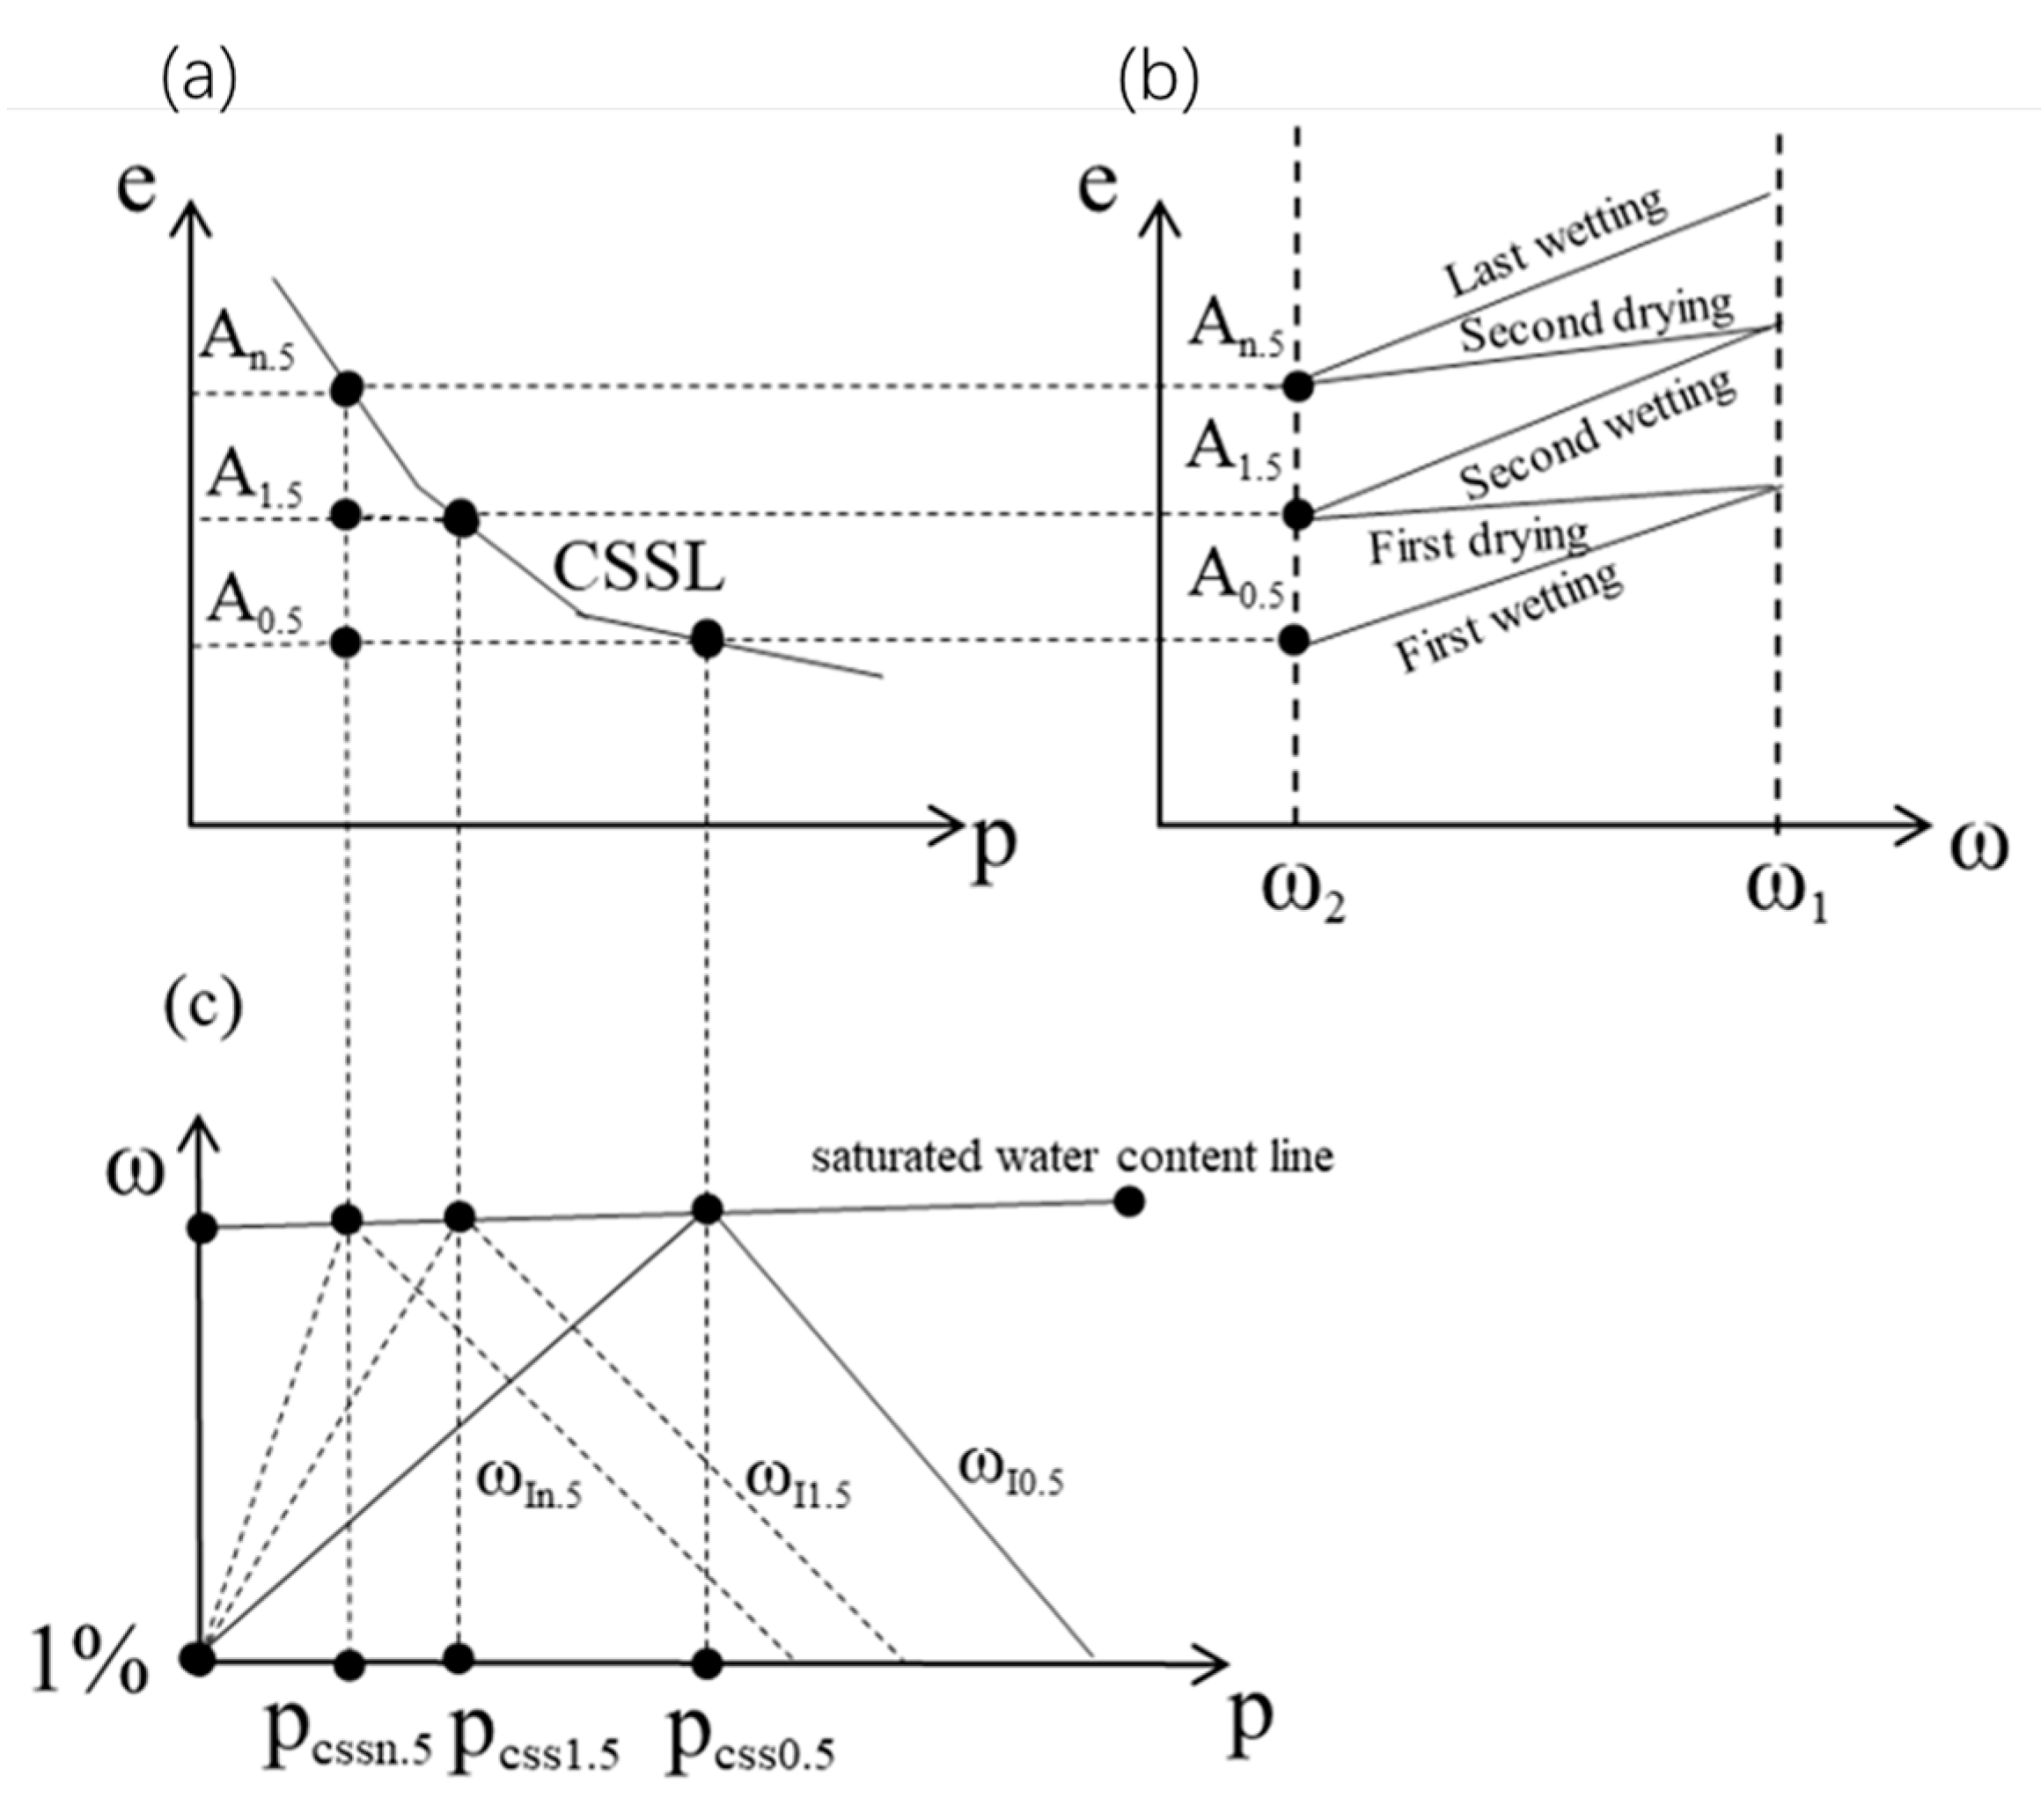
4.2. Critical Swelling and Shrinkage Lines

Based on the aforementioned results from the D-W cycle tests of compacted loess samples, the following conclusions can be drawn:
(1)
After the sample has undergone several D-W cycles, the swelling deformation is equal to the shrinkage deformation. At this point, the total deformation of the samples is the elastic deformation during the D-W cycles. Ultimately, the soil will reach an equilibrium state.
(2)
It can be observed that smaller loads are more likely to result in swelling deformation in the total deformation of the soil mass with a given initial dry density. Conversely, a larger load is more likely to cause shrinkage deformation in the total deformation. Therefore, it is crucial to determine the critical stress level at which the cumulative deformation of the soil with a given dry density reaches zero after a series of D-W cycles.
(3)
According to the test results, there exists a critical dry density such that the total deformation of the soil at this stress after D-W cycles is zero. For soils with different dry densities under the same loading condition, those with higher dry densities tend to generate swelling deformation, while those with lower dry densities tend to generate shrinkage deformation.
Based on the above analysis, it is evident that there exist a critical stress and a dry density at which the swelling deformation of the sample is equal to the shrinkage deformation. In the relationship diagram of void ratio e and pressure p, the critical void ratio and the critical stress can be modeled as a curve. This curve is named the critical swelling–shrinkage line (CSSL). The formula for describing the CSSL is presented in Equation (8):
e c s = a c s p c s p r e 2 + b c s p c s p r e + e r c
where ecs is the void ratio at critical swelling–shrinkage; pcs is the stress at critical swelling–shrinkage; pre is the initial stress; and acs, bcs, and erc are the parameters. Bringing the parameters into Equation (8), we can obtain the following equation, as shown in Figure 8:
CSSL :   e c s = 1 × 10 5 p c s 2 0.0019 p c s + 0.5

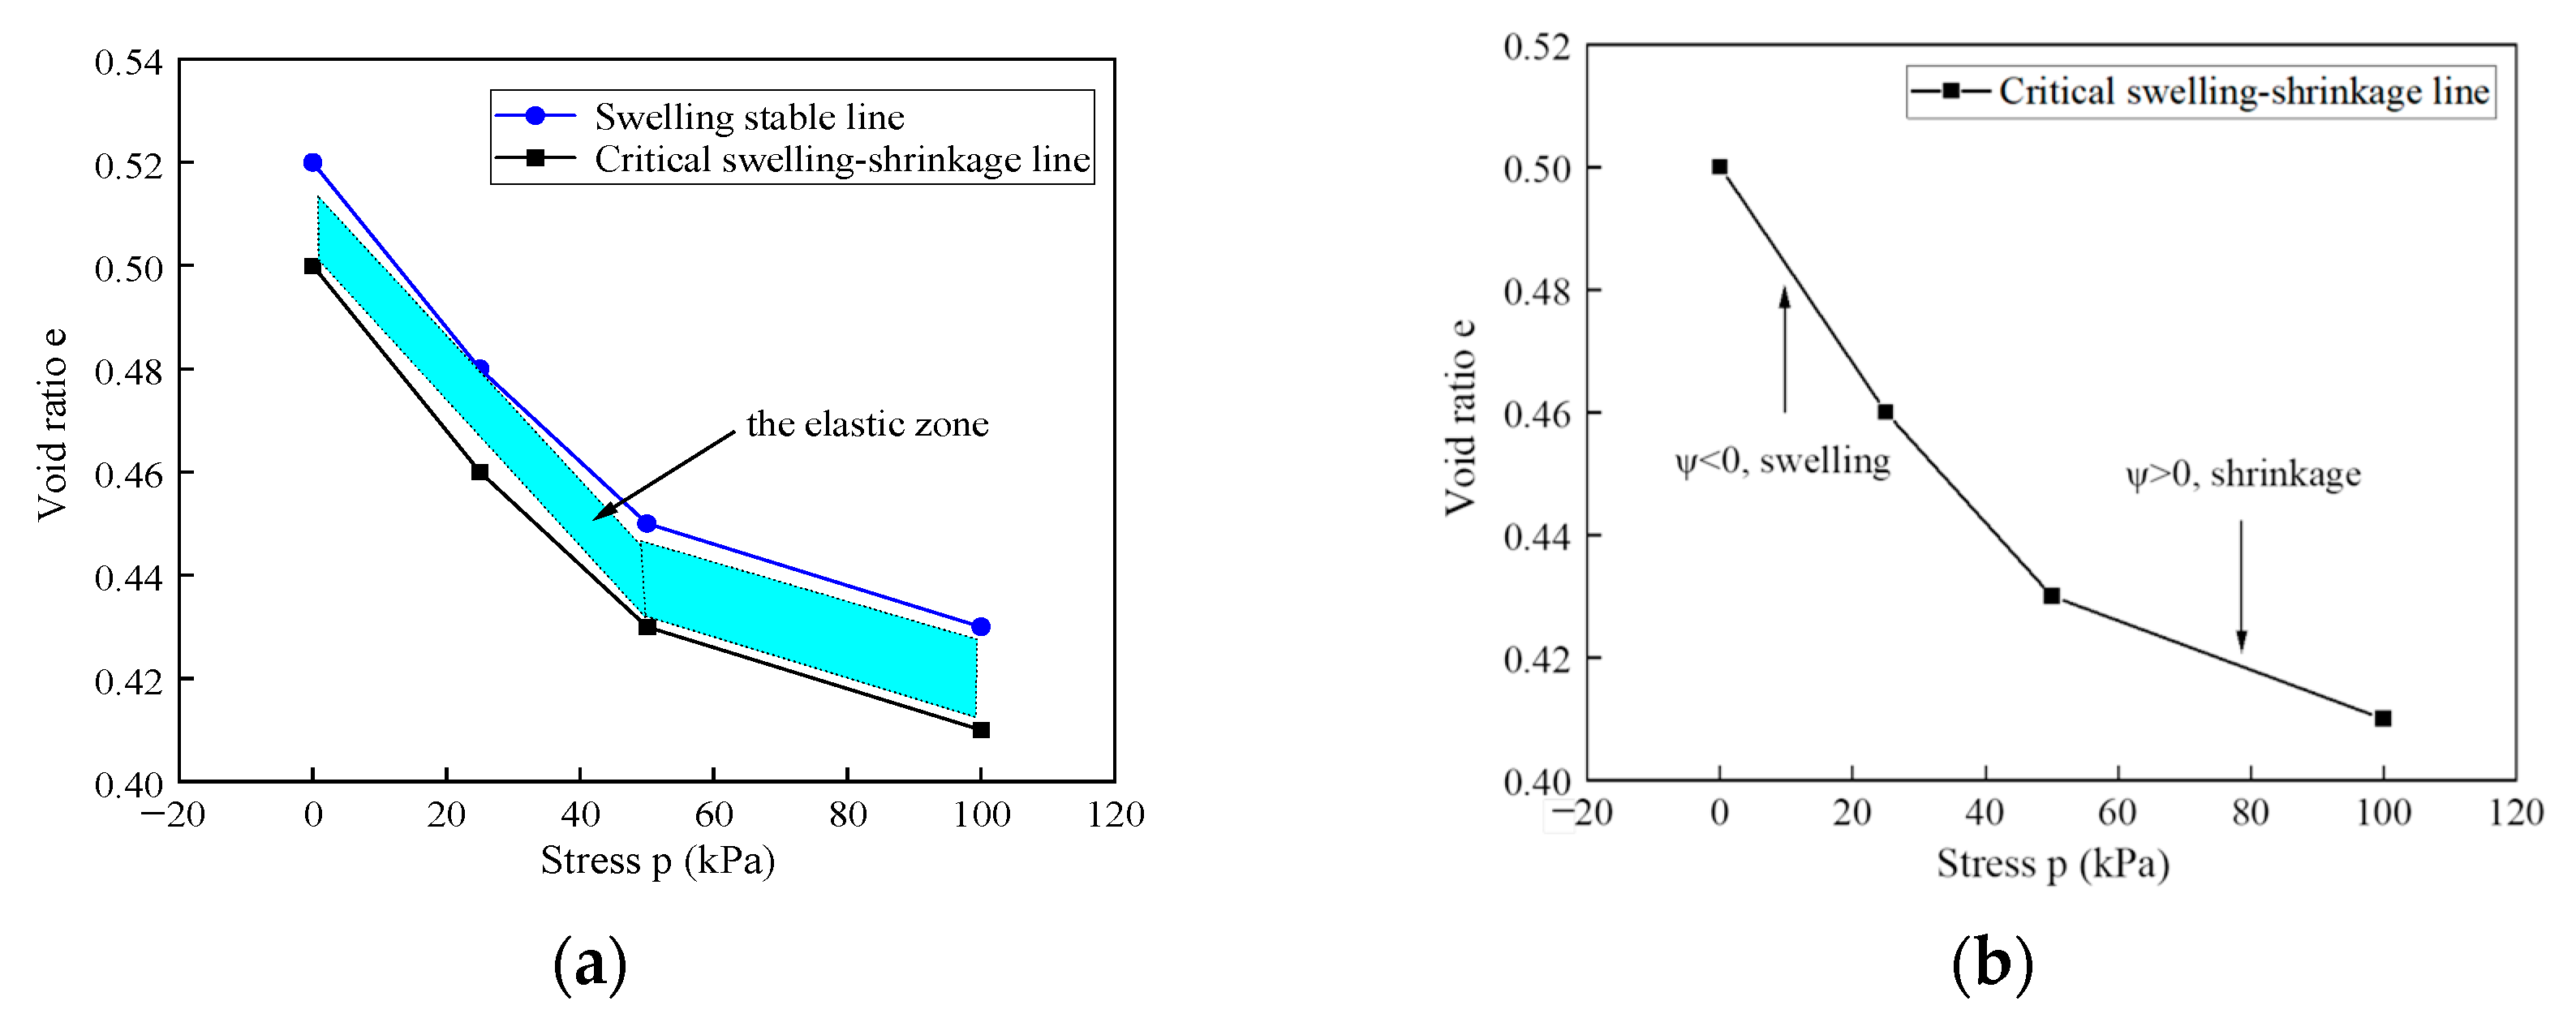
4.3. Swelling Stable Line

The swelling stable state corresponds to the state where the soil sample is saturated and at critical swelling–shrinkage. The swelling stable line (SSL) is a curve connecting the points in the swelling stable state, as illustrated in Figure 9. The formula for describing the SSL is shown in Equation (10):
e s s = a s s p s s p r e 2 + b s s p s s p r e + e r s
where ess is the void ratio at the swelling stable state, pss is the stress at the swelling stable state, ass and bss are slopes, and ers is the intercept. Substituting these parameters into Equation (10), we can obtain the following equation:
SSL : e s s = 1 × 10 5 p s s 2 0.0019 p s s + 0.52

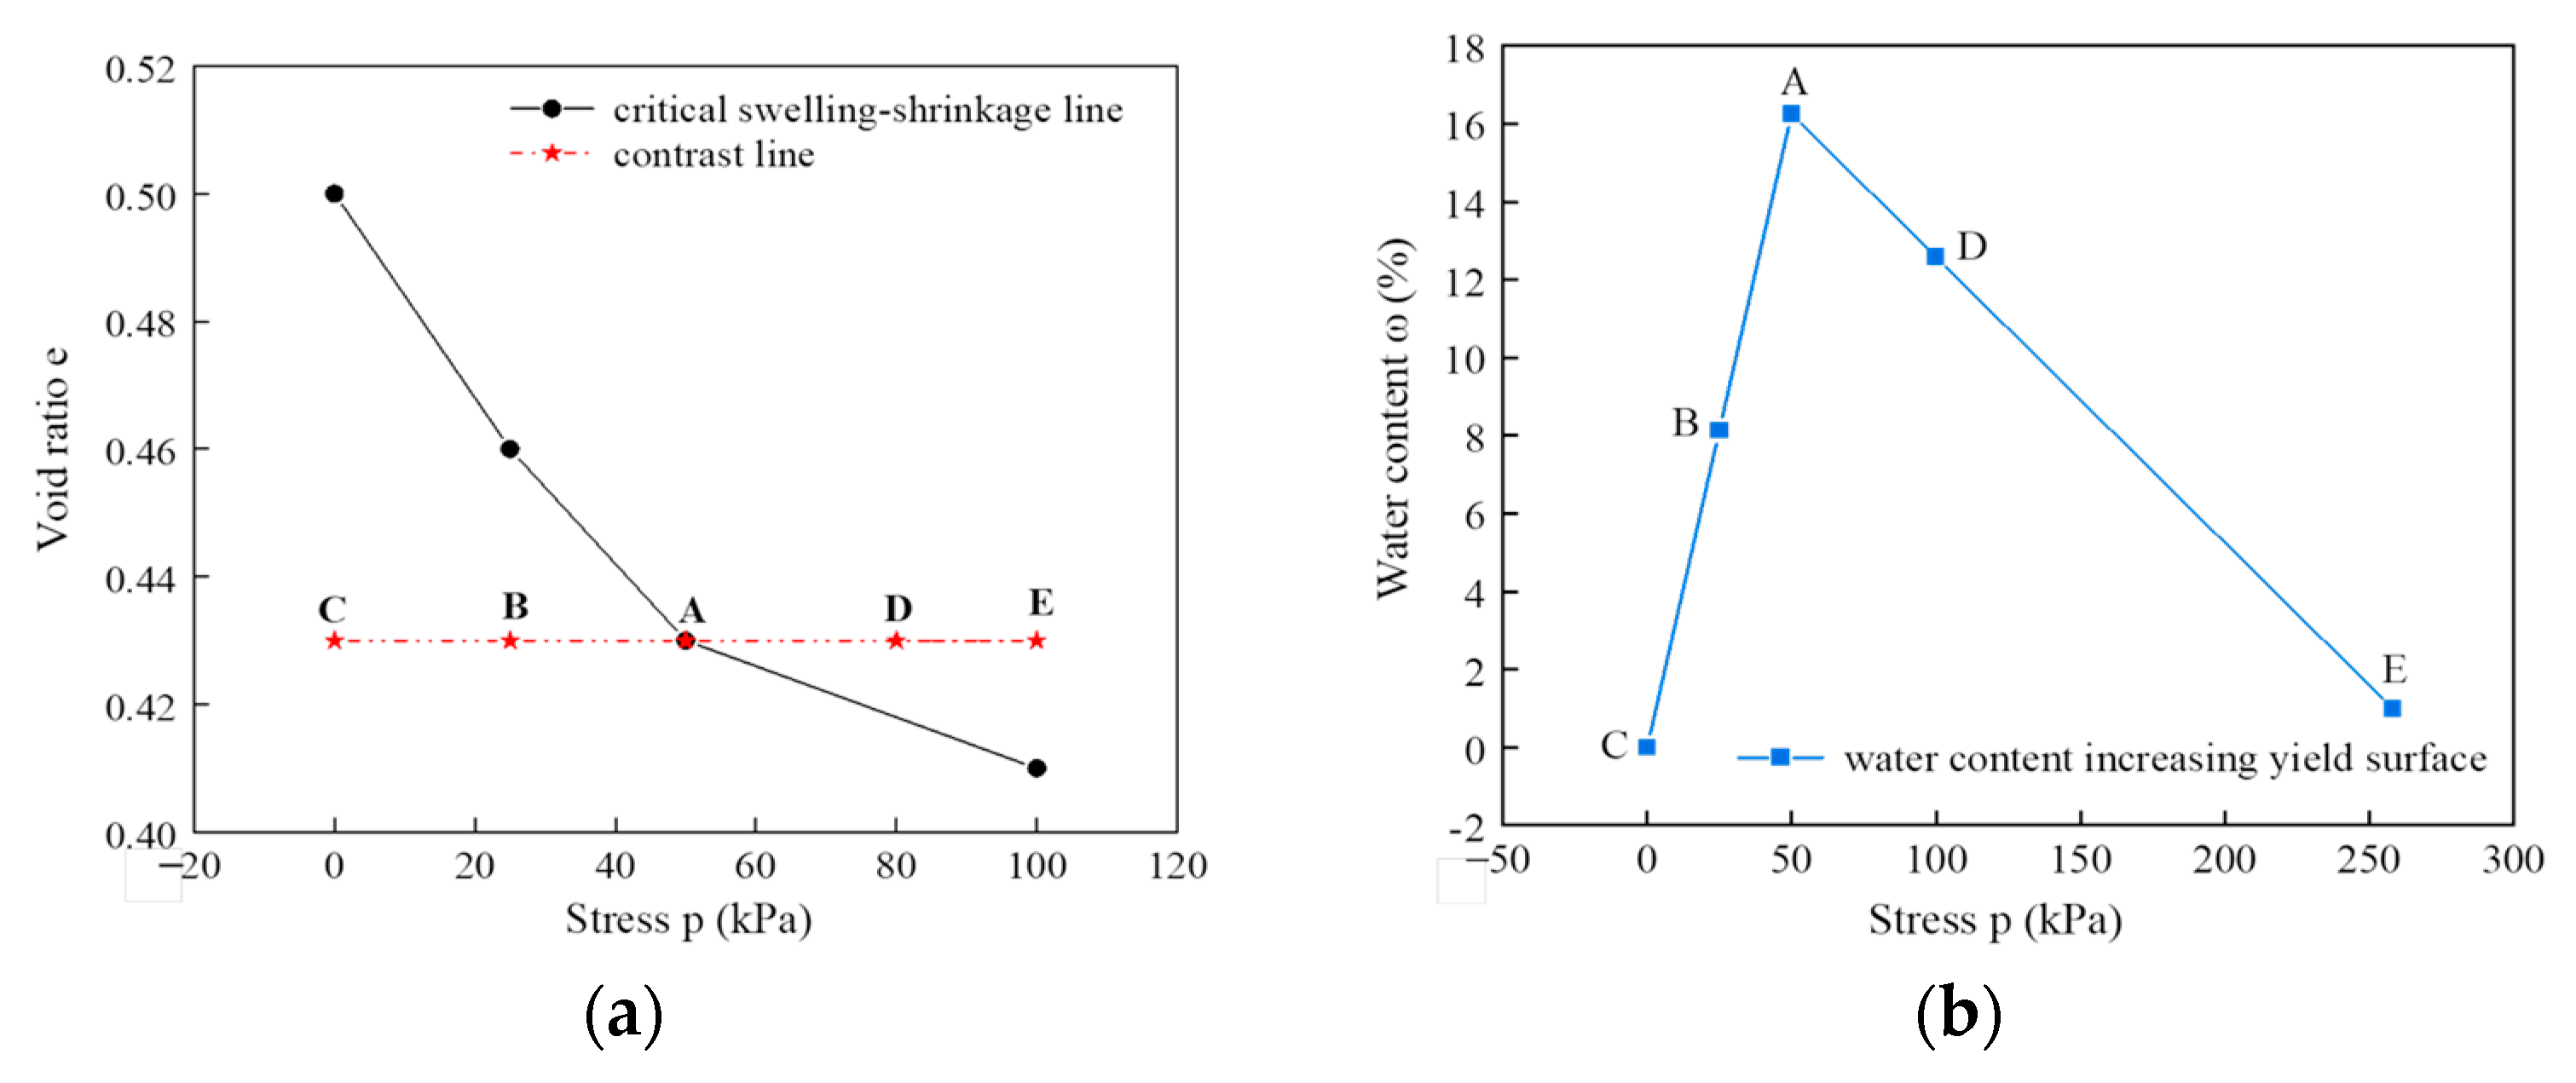
4.4. Elastic Zone and State Parameters

The elastic zone is defined as the region between the critical swelling–shrinkage line (CSSL) and the swelling stable line (SSL). Points situated within this zone experience only elastic deformations. The equation for describing the elastic zone can be formulated as follows:
1 × 10 5 p c s 2 0.0019 p c s + 0.5 < e < 1 × 10 5 p s s 2 0.0019 p s s + 0.52
The state parameter ψ is introduced in Figure 10b to characterize the relationship between the current state and the critical state of a soil. The ψ serves as an indicator for determining how the current state of the soil mass is related to its critical swelling–shrinkage state. The equation for ψ can be defined as ψ = eecs. If the value of ψ is less than zero, it implies that the sample is in a compact state in which the accumulative deformation is swelling deformation. Conversely, if the value is greater than zero, it indicates that the sample is in a loose state in which the accumulative deformation is shrinkage deformation.

4.5. Water Content Yield Surface

(1)
Water content decreasing yield surface.
The yielding water content is determined to depict the soil’s behavior when it undergoes elastic–plastic deformation and yields during D-W cycles. It represents the water content at which the soil transitions from an elastic state to a plastic state. The curve formed by the yield water content during the soil drying process is defined as the water content decreasing yield surface. Conversely, during the wetting process, the curve formed by the yield water content is defined as the water content increasing yield surface.
Figure 11 depicts the assumption that there are five initial soil states, namely A, B, C, D, and E, when characterizing the water content yield surface during the drying process. Since state A is a point on the SSL, it implies that the soil sample may undergo elastic shrinkage deformation during the drying process. Thus, the yield moisture content of the sample in state A is 1%. However, the soil sample corresponding to state B will exhibit shrinkage deformation during the drying process. Meanwhile, the yield water content of state B, ωDB, is 9%, which is higher than that of ωDA. In addition, for the soil at state C, the yield water content ωDC and the plastic shrinkage deformation are greater than those at state B. Nevertheless, the state parameters of the soil at state C are smaller than those at state B.
For the soil at state D, shrinkage deformation occurs after D-W cycles. This indicates that plastic shrinkage deformation takes place during drying, and the yield water content ωDD is larger than that of ωDA. The yield water content of the soil at state E, ωDE, is greater than that of ωDD. Moreover, the shrinkage deformation after D-W cycles at state E is also more substantial than that at state D.
Consequently, when the yield water content of the soil sample reaches the minimum value, the applied stress on the soil sample is equivalent to the critical stress. When the applied stress on the sample surpasses the critical stress, the yield water content will increase with the increase in vertical load. Conversely, the yield water content decreases as the vertical load rises.
To simplify the calculation, a linear yield locus was employed to describe the water content decreasing yield surface (ωD). The formula for ωD is given by Equation (13).
ω D = ω A ω C p A p C p + p A ω C p C ω A p A p C , p < p A ω A ω E p A p E p p E ω A p A ω E p A p E , p > p A
where, ωA is the water content at state A, ωC is the water content at state C, and ωE is the water content at state E; pA is the applied stress at state A, pC is the applied stress at state C, and pE is the applied stress at state E; p is the applied stress; and ωD is the corresponding yield water content.
In this study, to characterize the change in ωD during D-W cycles, we assumed that the soil’s initial state was A0, which is located in the shrinkage zone, as shown in Figure 12a. The initial water content of the decreasing yield surface ωD0 is shown in Figure 12c. After a certain number of cycles, the accumulative deformation is shrinkage deformation, as shown in Figure 12b. When the current state has shifted to A1, it is still in the shrinkage zone. However, as the swelling stabilizing stress decreases, the soil state parameter becomes smaller, and ωD shifts to the right.
(2)
Water content increasing yield surface.
To elucidate the yield surface in relation to the water content increasing yield surface, we simultaneously assumed that the soil may exist in five distinct states, denoted as A, B, C, D, and E, at the onset of the wetting process, as illustrated in Figure 13. State A is positioned on the critical swelling–shrinkage line (CSSL), indicating that the corresponding sample will undergo a certain degree of swelling due to elasticity when saturated with liquid. Consequently, the yield water content of the sample at state A, ωIA, is 17% of the saturated water content in the current state. On the other hand, for soil at state B, the applied stress is below the critical stress level. As a result, the deformation that occurs during the wetting process is classified as plastic swelling deformation. The yield water content of loess at state B, ωIB, should be less than that of ωIA. As can be seen from the figure, ωIB is approximately 8%. Additionally, for samples at state C, both the state parameters and the yield water content are smaller than those at state B. However, the plastic deformation during the swelling process is more pronounced than that of soil at state B.
For a sample at state D, swelling deformation occurs after D-W cycles. During wetting, it is apparent that the deformation is due to plastic swelling. Additionally, the yield water content ωID at state D is smaller than that at state A (ωIA). For a sample at state E, the swelling deformation after D-W cycles is greater than that of a sample at state D. The yield water content ωIE at state E is also smaller than the yield water content ωID at state D.
Consequently, when the applied stress is less than the critical stress, the yield water content increases with the rise in vertical loading. At the point where the applied stress equals the critical stress, the yield water content attains its maximum value, which corresponds to the saturated water content at the current state. As the vertical loading increases further, such that the applied stress exceeds the critical stress, the yield water content decreases.
Similarly, a linear yield locus was utilized to describe the water content increasing yield surface ωI. The formula for ωI can be expressed as follows:
ω I = ω A ω C p A p C p + p A ω C p C ω A p A p C , p < p A ω A ω E p A p E p p E ω A p A ω E p A p E , p > p A
To describe the variations in ωI during D-W cycles, it can be assumed that a soil mass exists, denoted as A0.5, as shown in Figure 14a. Consequently, the initial water content increasing yield surface, ωI0.5, is shown in Figure 14c. After one D-W cycle, the overall deformation observed is swelling deformation (as depicted in Figure 14b), and the current position shifts to A1.5, which is also located within the swelling region. As the critical stress increases, the ψ value of A1.5 decreases, and the water content increasing yield surface shifts to the left, as shown in Figure 14c. Likewise, after several D-W cycles, the current state transits to An.5, where the CSSL is situated. For some samples, the total deformation after D-W cycles is elastic swelling–shrinkage deformation, and the water content increasing yield surface ceases to move.
Based on the preceding analysis, the fluctuation of ωI is predominantly governed by the variations in Pcs and yield stress. Consequently, the yield stress can be ascertained by leveraging the correlation between the CSSL and the e, in conjunction with the yield surface exacerbated by the augmented water content.

4.6. Model Verification

4.6.1. Model Calculation Methods

The computation of elastic–plastic deformation throughout the wetting process relies on the association between the initial state and the CSSL. Equation (9) can be employed to calculate the critical stress, and Figure 14a offers a way to determine the yield stress.
Subsequently, Equation (14) can be utilized to depict the yield surface related to the increase in water content based on the critical stress and yield stress. Meanwhile, Equation (14) is capable of determining the yield water content. Additionally, the elastic compressibility coefficient can be calculated by employing Equation (6) in combination with the CSSL and the SSL. Next, λw can be determined via Equation (7) with kw. The elastic–plastic deformation can be computed using Equations (4) and (5). Ultimately, the condition of the soil mass after the completion of the wetting process can be ascertained.
Both the drying process and the wetting process can utilize Equation (11) to determine the stable stress induced by swelling. Meanwhile, the yield stress can be derived from Figure 12a. The yield surface associated with water content reduction can be determined via Equation (13). Subsequently, the yield water content can be calculated by Equation (13) based on the water content reducing yield surface and the applied stress. Based on Equations (4) and (5), the elastic–plastic deformation can be computed using kw and ψ. The determination of the final soil state after drying involves the comprehensive consideration of the elastic deformation calculated during wetting and the soil state after wetting. The abovementioned calculation process is repeated to calculate the deformation of the sample in all D-W cycles.

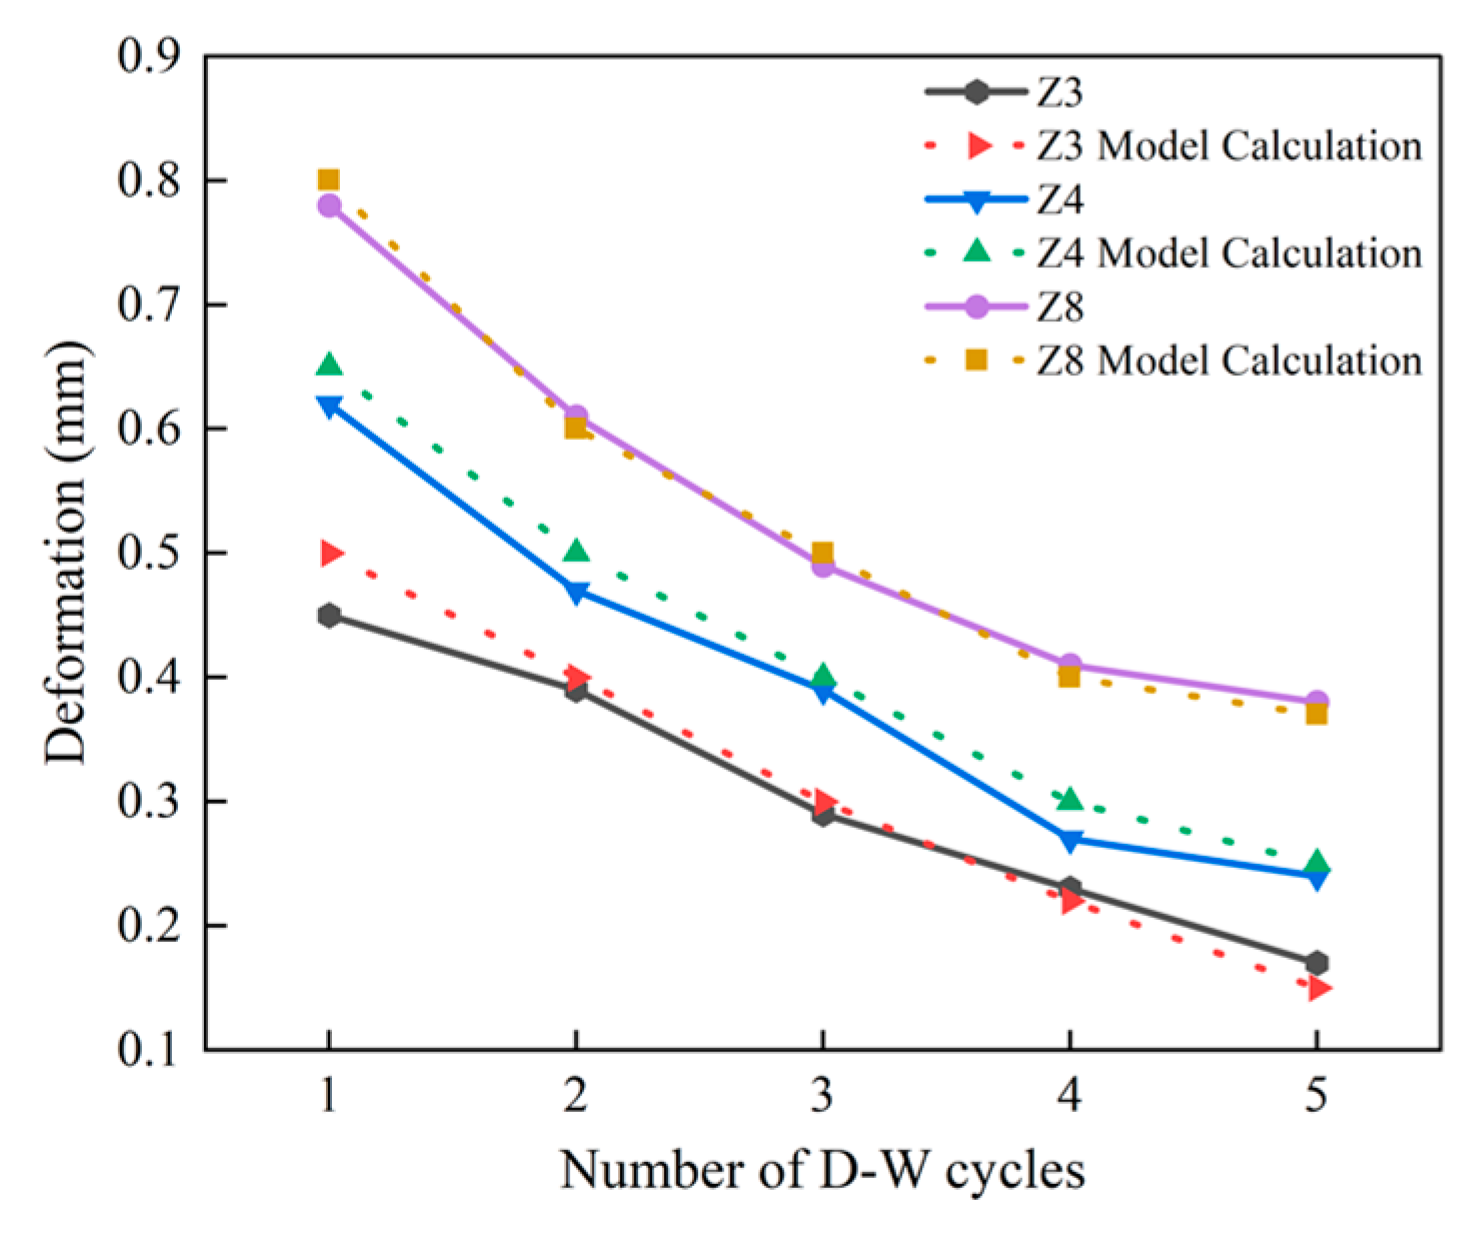
4.6.2. Comparative Verification

To validate the model, a series of fittings and analyses were carried out on samples Z3, Z4, and Z8 in this study, which had undergone three D-W cycles. A vertical load of 25 kPa was applied to the samples. The model calculation results and the actual results are presented in Figure 15.
The dry densities of samples Z3, Z4, and Z8 are 1.7 g/cm3, 1.6 g/cm3, and 1.5 g/cm3, respectively. Consequently, the cumulative deformations after D-W cycles follow the order of Z8 > Z4 > Z3, which is consistent with the rule derived from the modeling calculation. In Figure 15, there exists a certain discrepancy between the calculated and actual values after one cycle. However, as the number of cycles escalates, the calculated value tends to approach the tested value. This phenomenon can be ascribed to the non-linear characteristic of the water content yield surface. The calculated deformation results of the samples acquired from the model are in good agreement with the actual deformation results. This implies that the model established in this work can precisely represent the experimental outcomes.

5. Conclusions

In this study, the impacts of D-W cycles on the deformation, resistivity ratio, crack ratio, and microstructure of compacted loess with different water contents and dry densities were explored. The following conclusions were reached.
The number of cycles exerts a significant influence on the crack ratio and vertical strain, followed by the initial water content. However, compared with the final and initial water contents, the number of cycles has a relatively slight effect on the resistivity ratio of the samples, indicating that both the number of cycles and the initial water content significantly affect the compressibility of loess during the D-W cycles.
By analyzing the SEM images of the soil, it can be observed that the morphology of the particles tends to be regular and round. The soil skeleton also becomes denser, the total pore area decreases, macropores rupture, and small pores take their place. Furthermore, following the D-W cycles, the soil skeleton loosens, resulting in the transformation of small pores and micropores into mesopores and macropores. Consequently, the total pore area increases, and there is a slight increase in the abundance of soil particles. As the particle contact relationship further evolves, it changes to point-to-edge contact. When other factors are held constant, drying shrinkage deformation leads to a decrease in the final water content, a decrease in the total soil pore area, and an increase in the content of micropores and small pores.
Additionally, the yield surfaces associated with water content decrease and increase were investigated. During the drying process for the water content decreasing yield surface and the wetting process for the water content increasing yield surface, when the soil sample undergoes shrinkage deformation, the yield water content escalates with the increase in stress; however, for the soil with swelling, the yield water content declines with the increase in stress. A constitutive model was proposed based on these findings and was subsequently validated. Moreover, in this constitutive model, the elastic–plastic deformation is decomposed into elastic deformation and plastic deformation. This model can enhance the accuracy of classifying the critical water content related to elastic–plastic deformation and can also precisely determine the variation in water content to calculate the deformation of the samples. In this study, a comprehensive method for calculating the deformation of samples based on classical elastic–plastic mechanical formulas was presented. The model was verified by comparing the calculated deformation with the test results. The verification results demonstrated the rationality of the model. The model is suitable for calculating the swelling–shrinkage deformation of compacted loess subjected to both vertical loading and D-W cycles, which provides a basis for further research on the deformation properties of compacted loess.
Parameters such as the elastic compressibility coefficient kw and the plastic deformation-related parameter λw are determined through tests under specific conditions. Compacted loess with different properties in different regions may vary, and the universality of these parameters has not been verified yet. In addition, some other environmental factors such as temperature or differences in soil types have not been considered in the model. This will be the content of our subsequent research.

Author Contributions

Conceptualization, P.Q. and Y.L. (Yuqi Liu); methodology, P.Q., Y.L. (Yuqi Liu) and Q.Y.; investigation, Y.L. (Yuqi Liu), L.G. and X.Z.; writing—original draft preparation, Y.L. (Yuqi Liu) and P.Q.; writing—review and editing, P.Q. and C.Y.; visualization, Q.Y. and Y.L. (Yubo Liu). All authors have read and agreed to the published version of the manuscript.

Funding

The research presented in this paper was financially supported by the National Natural Science Foundation of China (Grant Nos. 42177138 and 41907239).

Data Availability Statement

The data presented in this study are available on request from the corresponding author due to technical or time limitations.

Conflicts of Interest

Author Li Gong was employed by the company China Railway Engineering Design Consulting Group Co., Ltd. The remaining authors declare that the research was conducted in the absence of any commercial or financial relationships that could be construed as a potential conflict of interest.

References

  1. Sun, Z.J.; Miao, P.Y. Simulation experiment on surface deformation evolution regulation of loess slope under dry-wet alternate environment. Sci. Technol. Eng. 2018, 18, 117–123. [Google Scholar]
  2. Feng, H.X.; Xing, X.G.; Su, L.C. Insights into saline soil cracking subjected to drying-wetting cycles. Acta Geophys. 2025, 73, 619–633. [Google Scholar] [CrossRef]
  3. Li, C.; Deng, W.D.; Cui, X.K. The study on resilient modulus of remolded loess in moisture circulation process. J. Transp. Sci. 2009, 25, 8–12. [Google Scholar]
  4. Mao, Y.C.; Li, G.Y.; Lei, J.X. Experimental study on the effects of wetting-drying cycles of compacted loess. Adv. Mater. Res. 2014, 831, 326–330. [Google Scholar] [CrossRef]
  5. Niu, L.S.; Zhang, A.J.; Zhao, J.M. Study on Soil-Water Characteristics of Expansive Soil under the Dry-Wet Cycle and Freeze-Thaw Cycle considering Volumetric Strain. Adv. Civ. Eng. 2021, 2021, 6622370. [Google Scholar] [CrossRef]
  6. Yuliana, Y.; Arwan, A.; Viroon, K. Seasonal dynamics of root growth and desiccation cracks and their effects on soil hydraulic conductivity. Eng. Geol. 2025, 349, 107973. [Google Scholar] [CrossRef]
  7. Guo, H.; Li, W.y.; Dang, F. The shrinkage crack characteristics of jute fiber-modified clay under wet-dry cycle conditions. Constr. Build. Mater. 2025, 472, 140840. [Google Scholar] [CrossRef]
  8. Tang, C.; Shi, B.; Liu, C. Influencing factors of geometrical structure of surface shrinkage cracks in clayey soils. Eng. Geol. 2008, 101, 204–217. [Google Scholar] [CrossRef]
  9. Pires, L.F.; Bacchi, O.O.S.; Reichardt, K. Gamma ray computed tomography to evaluate wetting/drying soil structure changes. Nucl. Instrum. Methods Phys. Res. Sect. B Beam Interact. Mater. At. 2005, 229, 443–456. [Google Scholar] [CrossRef]
  10. Ye, W.J.; Li, C.Q.; Ma, W.C. Mechanism Fractured Loess Expansion Joints under the Effect of Wet-dry Cycle. Sci. Technol. Eng. 2016, 16, 122–127. [Google Scholar]
  11. Ye, W.J.; Li, C.Q.; Yang, G.S. Evolution of loess crack under action of dehumidification-humidification. J. Eng. Geol. 2017, 25, 376–383. [Google Scholar] [CrossRef]
  12. Pan, Z.X.; Yang, G.S.; Ye, W.J. Study on mechanical properties and microscopic damage of undisturbed loess under dry and wet cycles. J. Eng. Geol. 2020, 28, 1186–1192. [Google Scholar] [CrossRef]
  13. Archie, G.E. The electrical resistivity log as aid in determining some reservoir characteristics. Pet. Technol. 1942, 146, 54–61. [Google Scholar] [CrossRef]
  14. Alibrahim, B.; Eris, U. Influence of compaction method and effort on electrical resistivity and volume change of cohesive soils. KSCE J. Civ. Eng. 2021, 25, 2381–2393. [Google Scholar]
  15. Filho, A.M.S.; Furriel, G.P.; Calixto, W.P. Alves Methodology to correlate the humidity, compaction and soil apparent electrical conductivity. In Proceedings of the 2015 CHILEAN Conference on Electrical, Electronics Engineering, Information and Communication Technologies (CHILECON), Santiago, Chile, 28–30 October 2015; pp. 729–734. [Google Scholar] [CrossRef]
  16. Liu, Z.B.; Zhang, Y.; Fang, W. Experimental research on relationship between electrical resistivity and compactibility of loess. J. Xi’an Univ. Sci. Technol. 2013, 33, 84–90. [Google Scholar]
  17. Zhu, C.H.; Li, N. Mesoscopic deformation mechanism of loess high-fill foundation based on soil electrical resistivity. Chin. J. Rock Mech. Eng. 2013, 32, 640–648. [Google Scholar]
  18. Dong, X.Q.; Huang, F.F.; Su, N.N. Experimental study of AC electrical resistivity of unsaturated loess during compression. Chin. J. Rock Mech. Eng. 2015, 34, 189–197. [Google Scholar] [CrossRef]
  19. Qin, P.J.; Liu, Y.B.; Song, Z.W. An electrical resistivity method of characterizing hydromechanical and structural properties of compacted loess during constant rate of strain compression. Sensors 2020, 20, 4783. [Google Scholar] [CrossRef]
  20. Xu, J.; Li, Y.; Ren, C. Damage of saline intact loess after dry-wet and its interpretation based on SEM and NMR. Soils Found. 2020, 60, 911–928. [Google Scholar] [CrossRef]
  21. Yuan, K.; Ni, W.; Lü, X. Influence of wetting–drying cycles on the compression behavior of a compacted loess from microstructure analysis. Bull. Eng. Geol. Environ. 2022, 81, 348. [Google Scholar] [CrossRef]
  22. Ye, W.; Wu, Y.; Bai, Y. Study of Macro- and Mesodamage of Remolded Loess under Alternating Dry and Wet Conditions in an Acid Rain Environment. Adv. Mater. Sci. Eng. 2021, 2021, 5158150. [Google Scholar] [CrossRef]
  23. Kong, D.H.; Wu, T.; Xu, H.Q. Variation and correlation between water retention capacity and gas permeability of compacted loess overburden during wetting-drying cycles. Environ. Res. 2024, 252, 118895. [Google Scholar] [CrossRef] [PubMed]
  24. Qin, B.; Li, X.A.; Wang, L. Model interpretation and microscopic characteristics of collapsibility evolution of compacted loess under dry-wet cycles. Catena 2024, 246, 108413. [Google Scholar] [CrossRef]
  25. Alonso, E.E.; Gens, A.; Josa, A. A constitutive model for partially saturated soils. Géotechnique 1990, 40, 405–430. [Google Scholar] [CrossRef]
  26. Alonso, E.E.; Vaunat, J.; Gens, A. Modelling the mechanical behaviour of expansive clays. Eng. Geol. 1999, 54, 173–183. [Google Scholar] [CrossRef]
  27. Zhao, N.F.; Ye, W.M.; Chen, Y.G. Investigation on swelling-shrinkage behavior of unsaturated compacted GMZ bentonite on wetting-drying cycles. Bull. Eng. Geol. Environ. 2019, 78, 617–627. [Google Scholar] [CrossRef]
  28. Zhao, N.F.; Ye, W.M.; Chen, B. Modeling of the swelling-shrinkage behavior of expansive clays during wetting-drying cycles. Acta Geotech. 2019, 14, 1325–1335. [Google Scholar] [CrossRef]
  29. Qin, P.J.; Song, Z.W.; Wang, Y.B. Experimental studies on structure properties of compacted loess during constant strain rate compaction. J. Taiyuan Univ. Technol. 2020, 51, 620–626. [Google Scholar] [CrossRef]
  30. Hu, Z.; Ai, P.; Li, Z.C. Electrical resistivity evolution of compacted silty clay under wetting-drying cycles sequentially coupled with dynamic loads. Rock Soil Mech. 2021, 42, 2722–2732. [Google Scholar] [CrossRef]
  31. Wu, G.; Wang, K.; Zhao, M. Analysis of damage evolution of sandstone under uniaxial loading and unloading conditions based on resistivity characteristics. Adv. Civ. Eng. 2019, 2019, 9286819. [Google Scholar] [CrossRef]
  32. Duan, Z.; Yan, X.S.; Sun, Q. Effects of water content and salt content on electrical resistivity of loess. Environ. Earth Sci. 2021, 80, 469. [Google Scholar] [CrossRef]
  33. Liu, K.; Ye, W.J.; Gao, H.J. Multi-scale effects of mechanical property degradation of expansive soils under drying-wetting environments. Chin. J. Rock Mech. Eng. 2020, 39, 2148–2159. [Google Scholar] [CrossRef]
  34. Lei, X. The types of loess pores in China and their relationship with collapsibility. Sci. Sin. Ser. B Chem. Biol. Agric. Med. Earth Sci. 1988, 31, 1398–1410. [Google Scholar]
  35. Nie, Y.; Ni, W.; Lü, X.; Tuo, W.; Yuan, K. Macroscopic mechanical behavior and microstructural evolution of compacted loess in the Chinese Loess Plateau. Soil Tillage Res. 2023, 232, 105767. [Google Scholar] [CrossRef]
  36. Zhao, G.T.; Zou, W.L.; Han, Z. Evolution of soil-water and shrinkage characteristics of an expansive clay during freeze-thaw and drying-wetting cycles. Cold Reg. Sci. Technol. 2021, 186, 103275. [Google Scholar] [CrossRef]
Figure 1. Diagram of the test devices. (a) Diagram of the loading frame; (b) the installation of the copper electrodes.
Buildings 15 01124 g001
Figure 2. The process of the microstructure test.
Buildings 15 01124 g002
Figure 3. Photographs of crack development.
Buildings 15 01124 g003
Figure 4. Three-dimensional scatter ribbon and wall graphs. (a) Vertical strain; (b) resistivity ratio; (c) crack ratio.
Buildings 15 01124 g004
Figure 5. SEM images of clods: (a) M1; (b) M3; (c) M5; (d) M2; (e) M4; (f) M6.
Buildings 15 01124 g005
Figure 6. Bar chart of the abundance ratio.
Buildings 15 01124 g006
Figure 7. Area distribution of various loess pores.
Buildings 15 01124 g007
Figure 8. The critical swelling–shrinkage line.
Buildings 15 01124 g008
Figure 9. The swelling stable line.
Buildings 15 01124 g009
Figure 10. Graphs for the elastic zone and state parameters. (a) Graphs for the elastic zone; (b) graphs for the state parameters.
Buildings 15 01124 g010
Figure 11. The water content decreasing yield surface. (a) e–p relations; (b) ω–p relations.
Buildings 15 01124 g011
Figure 12. Schematic diagram of yield surface changes with decreasing water content: (a) e–p space, (b) e–ω relations, (c) ω–p relations.
Buildings 15 01124 g012
Figure 13. The water content increasing yield surface. (a) e–p relations; (b) ω–p relations.
Buildings 15 01124 g013
Figure 14. Schematic evolution of ωI: (a) e–p space, (b) e–ω relations, (c) ω–p relations.
Buildings 15 01124 g014
Figure 15. Results of the model verification.
Buildings 15 01124 g015
Table 1. Primary physical parameters of loess material.
Specific GravityMaximum Dry Density (g·cm−3)Optimum Water Content (%)Liquid Limit (%)Plastic Limit (%)Plasticity IndexCollapsibility
Coefficient
GsρmaxωoptωLωPIP∆s
2.771.7215.322.813.19.710.02
Table 2. Parameters of compacted soil samples.
NumberInitial Dry Density ρd (g·cm−3)Initial Height (mm)Initial Water Content (%)Final Water Content (%)Number of Dry–Wet Cycles
Z11.5410.075.425.131
Z21.6210.045.3315.023
Z31.689.875.2424.875
Z41.6210.0314.724.965
Z51.699.9614.8414.871
Z61.5310.1215.1325.123
Z71.7110.0225.225.073
Z81.5010.0124.8415.025
Z91.6210.0625.1324.951
M11.519.9315150
M21.719.9615150
M31.4910.0815153
M41.719.9515153
M51.510.011553
M61.719.931553
Table 3. The results of the tests.
NumberVertical StrainResistivity RatioCrack Ratio
Z10.00514.370.28
Z20.0141.491.57
Z30.0170.852.44
Z40.02421.402.04
Z50.0021.430.12
Z60.0151.052.06
Z70.0140.741.25
Z80.0382.592.92
Z90.0040.490.61
Disclaimer/Publisher’s Note: The statements, opinions and data contained in all publications are solely those of the individual author(s) and contributor(s) and not of MDPI and/or the editor(s). MDPI and/or the editor(s) disclaim responsibility for any injury to people or property resulting from any ideas, methods, instructions or products referred to in the content.

