Article

Investigation on Mix Proportions of Ultra-High Performance Concrete with Recycled Powder and Recycled Sand

1
College of Civil Engineering, Tongji University, Shanghai 200092, China
2
Key Laboratory of Performance Evolution and Control for Engineering Structures, Tongji University, Ministry of Education, Shanghai 200092, China
3
Institute of Bridge Engineering Research, Harbin Institute of Technology, Harbin 150090, China
*
Authors to whom correspondence should be addressed.
Buildings 2025, 15(7), 1048; https://doi.org/10.3390/buildings15071048
Submission received: 12 February 2025 / Revised: 17 March 2025 / Accepted: 21 March 2025 / Published: 25 March 2025
(This article belongs to the Section Building Materials, and Repair & Renovation)

Abstract

The construction waste of brick and concrete can be used to produce recycled powder and recycled sand, which can replace cement and natural sand, respectively, in concrete. This can reduce the cost of concrete, reutilize construction waste and decrease environmental pollution. The idea of producing UHPC incorporating both RP and RS by standard curing instead of steam curing is proposed in this study. The optimal mixture design of ultra-high-performance concrete (UHPC) with both recycled powder and recycled sand is investigated. Based on the revised Dinger–Funk model, the optimal mix proportions of green UHPC (GUHPC) with recycled powder and recycled sand were calculated on this basis, and the effects of the superplasticizer content, water–binder ratio, recycled powder and recycled sand replacement ratio on the workability and mechanical properties of GUHPC at different ages were investigated through the designed experimental program. The test results show that when the superplasticizer to cementitious material ratio was 0.8%, the flowability and the 28 d compressive strength were highest. When the water–binder ratio was 0.16, the flexural strength and compressive strength of the GUHPC at different ages were the largest. As the replacement ratio of the recycled powder increased, the workability of the GUHPC decreased. However, even when replacement ratio of recycled powder was 30%, the flowability was still higher than 180 mm. The flexural strength and the 28 d compressive strength increased first and then decreased. Compared with mixtures without RP, the 28 d compressive strength increased by 6.4% and reached the maximum value when the replacement ratio of the RP was 30%. The comprehensive contribution of recycled powder to the strength was analyzed. Recycled powder can enhance the contribution of cement to GUHPC strength, and the enhancement effect increases with increases in the recycled powder content and age. The optimal replacement ratio of recycled powder is 30%. As the replacement ratio of the recycled sand increased, the flowability of the GUHPC first increased and then decreased, and the flexural and compressive strength decreased. The toughness was analyzed by the flexural strength to compressive strength ratio (f:c). With increases in the recycled sand, the f:c at 3 d of age increased, the f:c at 7 d of age showed no significant change, and the f:c at 28 d of age first increased and then decreased. The f:c at 28 d of age reached a maximum value of 0.316 when the replacement ratio of recycled sand was 50%. Therefore, the replacement ratio of the recycled sand was selected to be 50%. The optimum mix proportions of GUHPC were obtained by considering the workability, mechanical properties and amount of recycled material.

1. Introduction

Ultra-high performance concrete (UHPC) has ultra-high strength and excellent durability. UHPC is designed based on theories of densified particle packing. UHPC is produced with low water–binder ratio, and thus the cement in the mixture is not fully hydrated. At present, the amount of construction waste is large, which causes serious environmental pollution, and meanwhile, natural resources are in short supply. Waste bricks and concrete can be used to produce recycled powder (RP) and recycled sand (RS), which can be used to replace cement and natural sand (NS). The benefits of this include the reduced consumption of cement and NS, decreased environmental pollution, the reutilization of construction waste and the lower cost of UHPC. The effects of RP and RS on concrete have been studied.
RP is the powder obtained from waste concrete and clay bricks, which can partially replace cement in RPC [1]. Xue et al. [2] produced RP by sorting, crushing, grinding and screening waste bricks obtained from the demolition of buildings. The specific surface area of recycled brick powder was 450 m2/kg and the main compositions were SiO2 (49.3%) and Al2O3 (17.9%). Janotka et al. [3] used recycled brick powder (particle size 0–4 mm) to replace cement. Compared with normal concrete without recycled brick powder, the addition of RP did not reduce its flowability or strength. Zhu et al. [4] pointed out that the contribution of RP to the strength of concrete was mainly from its micro-aggregate effect, hydration activity and pozzolanic activity, among which, hydration activity contributed more to the early strength and pozzolanic activity contributed more to its later strength. RP can be used as a pozzolanic cement-based mineral admixture. It has been found that RP exhibits certain pozzolanic activity, compared with cement. Silica fume has higher pozzolanic activity than RP, while RP shows a certain hydration activity at the early stage. Mao et al. [5] studied the optimal mix proportion of RPC with RP and suggested that the replacement rate of RP should be 30%. The research results of Mao et al. [6] show that RP can decrease the chloride ion permeability resistance of RPC in the early stage. Due to its pozzolanic activity, the pore structure of RPC can be refined in the later stage, and thus, the chloride ion permeability resistance can be improved. Cantero et al. [7] used recycled concrete powder (particle size less than 4 mm) to replace cement, and recycled aggregate (particle size 4–22 mm) to replace natural aggregate. With RP replacement rates of 10% and 25% and a recycled aggregate replacement rate of 50%, the thermal conductivity can be reduced by 7.9% to 11.8% and the specific heat capacity can be increased by 6.0% to 9.1% compared to normal concrete.
Mohamed et al. [8] found that using recycled coarse aggregate (RCA) to replace 50% of the natural coarse aggregate (NCA) in UHPC reduced the slump flow diameter and resulted in a slight decrease in the 28-day compressive strength. Zhou et al. [9] compared the effects of recycled fine aggregate with maximum particle sizes of 0.5 mm, 1.0 mm, 2.0 mm and 5.0 mm on the compressive and tensile properties of UHPC. The results showed that the UHPC with RS of different maximum particle sizes can obtain good mechanical properties. The 28-day compressive strength of UHPC with RS was higher than that of UHPC with quartz sand. UHPC with 0.5 mm and 1.0 mm RS had higher tensile strength compared to that with other particle sizes. Compared with UHPC with quartz sand, the tensile strength of UHPC with 2.0 mm and 5.0 mm RS was reduced by 7% and 16%, respectively, but the compressive strength was increased by 23% and 19%, respectively. In research by Ma et al. [10], compared with mortar with NS, the compressive strength of mortar with 25%, 50% and 100% RS was increased by 6.9%, 10.4% and 1.6%, respectively. The main reason for the improvement of compressive strength by RS was its high strength and irregular shape. Salahuddin et al. [11] studied the mechanical properties of RPC, in which, NS was partially replaced by recycled fine aggregate by 25%, 50% and 75%, respectively. Two curing conditions, normal water curing and 90 °C hot water curing for 48 h, were compared. Under the two curing conditions, the 28 d compressive strength, flexural strength, splitting tensile strength and elastic modulus of RPC with 25% and 50% recycled fine aggregate were increased compared with that without recycled fine aggregate, while the mechanical properties of RPC with 75% replacement were decreased. The mechanical properties of RPC cured in 90 °C hot water were higher than those cured in normal temperature water. In addition, some scholars have used admixtures to improve the mechanical properties of UHPC with recycled fine aggregate. Yu et al. [12] and Chu et al. [13] modified UHPC with recycled fine aggregate by adding graphene to improve the mechanical properties of the UHPC.
The existing studies focus on the influence of single RP or RS on the properties of ordinary concrete or UHPC. The feasibility of simultaneously incorporating RP and RS in UHPC is studied and the effect of their replacement rate on the workability and mechanical properties of GUHPC is investigated in this research. The theoretical optimal mixture design of GUHPC was calculated according to a modified Dinger–Funk model. Furthermore, the influence of the superplasticizer content, water–binder ratio and replacement ratio of RP as well as RS on the workability and mechanical properties of GUHPC was studied experimentally, and the optimal mixture design of GUHPC was obtained. Standard curing was adopted instead of the steam curing normally used for UHPC for convenience and energy saving.
By using multiple recycled materials, construction waste is recycled, natural resources are saved, environmental pollution is alleviated, the cost is lowered and the applications of recycled materials in concrete are also expanded. UHPC with RP and RS can be used just like normal UHPC as long as the requirements for performance are met.

2. Experimental Materials

2.1. Cementitious Materials

2.1.1. Cement

In this paper, P·O 42.5 ordinary Portland cement was used. The main chemical composition is shown in Table 1 and physical properties are shown in Table 2.

2.1.2. Silica Fume

The main chemical composition is shown in Table 1 and the physical properties are shown in Table 3.

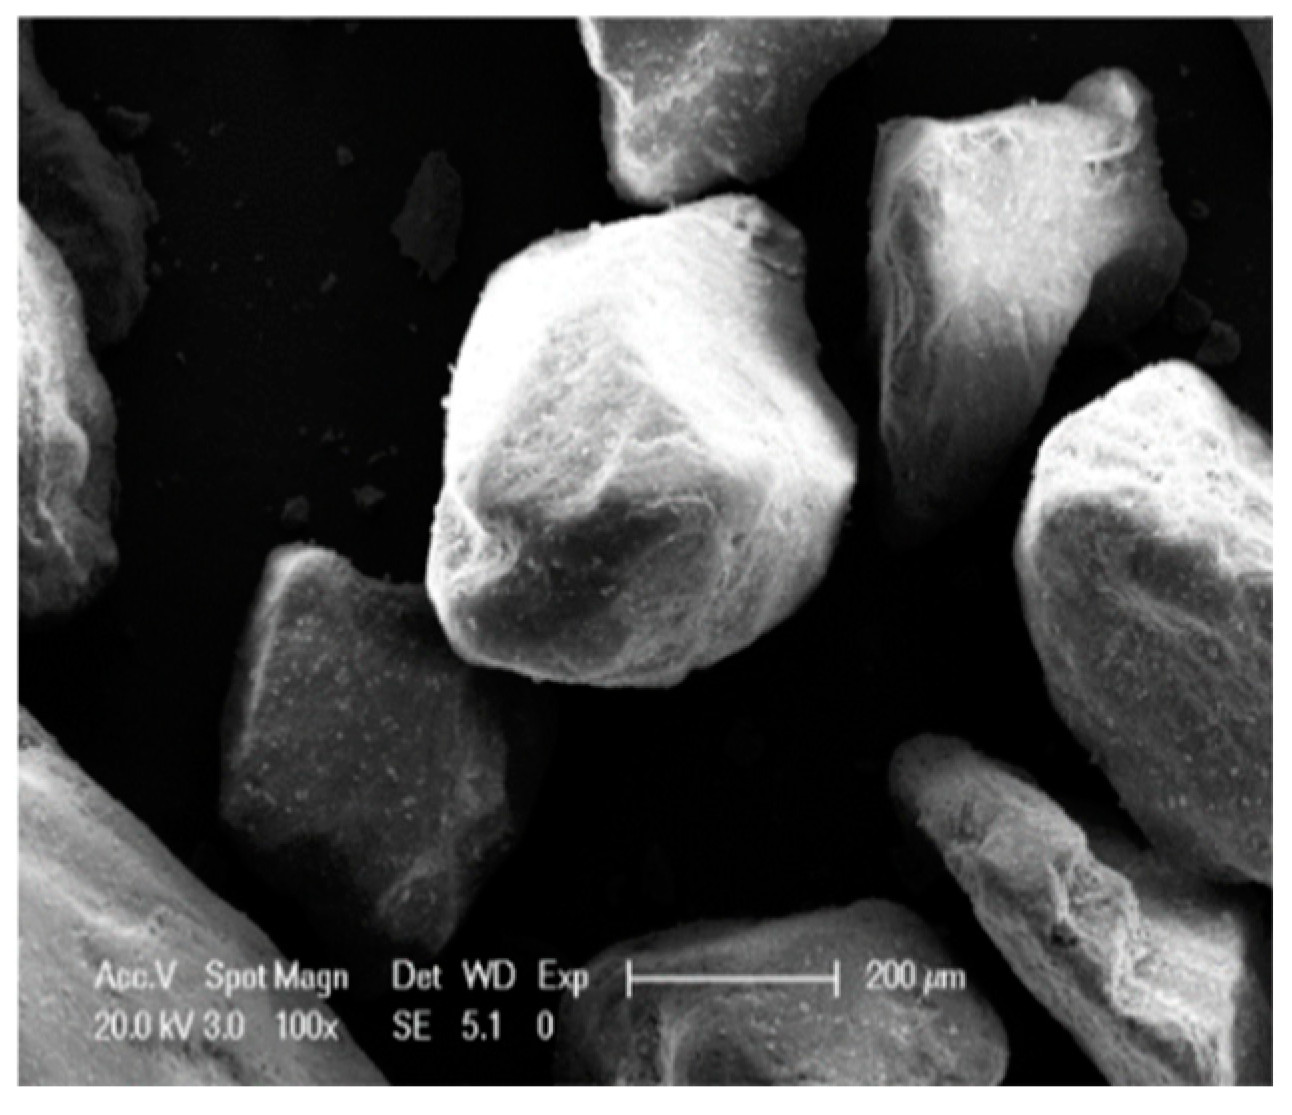
2.1.3. Recycled Powder

The raw material of the RP was the waste brick and waste concrete generated by the demolition of a building in Shanghai. These raw materials were subsequently smashed, screened by a standard sieve, dried and milled to obtain RP. To determine the milling time, the fineness of the RP was tested at different milling times (30 min, 60 min, 90 min), and the objective was to make the fineness of the RP close to that of the cement. The milling parameters and fineness of different RPs are shown in Table 4. RP(BP:CP = 7:3) [14] was produced in a factory, while the other RP was produced in the lab. The different RPs are shown in Figure 1.
Considering the large water requirements of brick powder, and comparing the milling time, milling power consumption, density and fineness of RP, the RP with a mass ratio of 7:3 of brick powder and concrete powder was selected and the milling time was determined to be 90 min.

2.2. Fine Aggregate

2.2.1. Natural Sand

In this paper, natural river sand was selected as the natural fine aggregate. The NS was obtained by 1.18 mm standard screening, and the particle size distribution is shown in Table 5. The physical characteristics of the NS are shown in Table 6.

2.2.2. Recycled Sand

RS was produced from waste concrete. By crushing and grinding, recycled coarse aggregate and recycled concrete stone powder can be obtained. Then, the RS with a particle size less than 2.36 mm was screened by a standard sieve; the particle size distribution is shown in Table 5. The physical characteristics are shown in Table 6. SEM images of the NS and RS are shown in Figure 2 and Figure 3. The surface of the NS is smoother and more rounded than the RS. The surface of the RS is rough, irregular, multi-angular and covered with fine particles, including old fine aggregate, broken stone and old cement matrix. Thus, the RS has greater water absorption than the NS.

2.3. Steel Fiber

Copper-coated hook steel fiber (STF) for UHPC was used, and its performance parameters are shown in Table 7.

2.4. Superplasticizer

Polycarboxylic acid high-performance superplasticizer was used. The performance indicators of the superplasticizer are shown in Table 8.

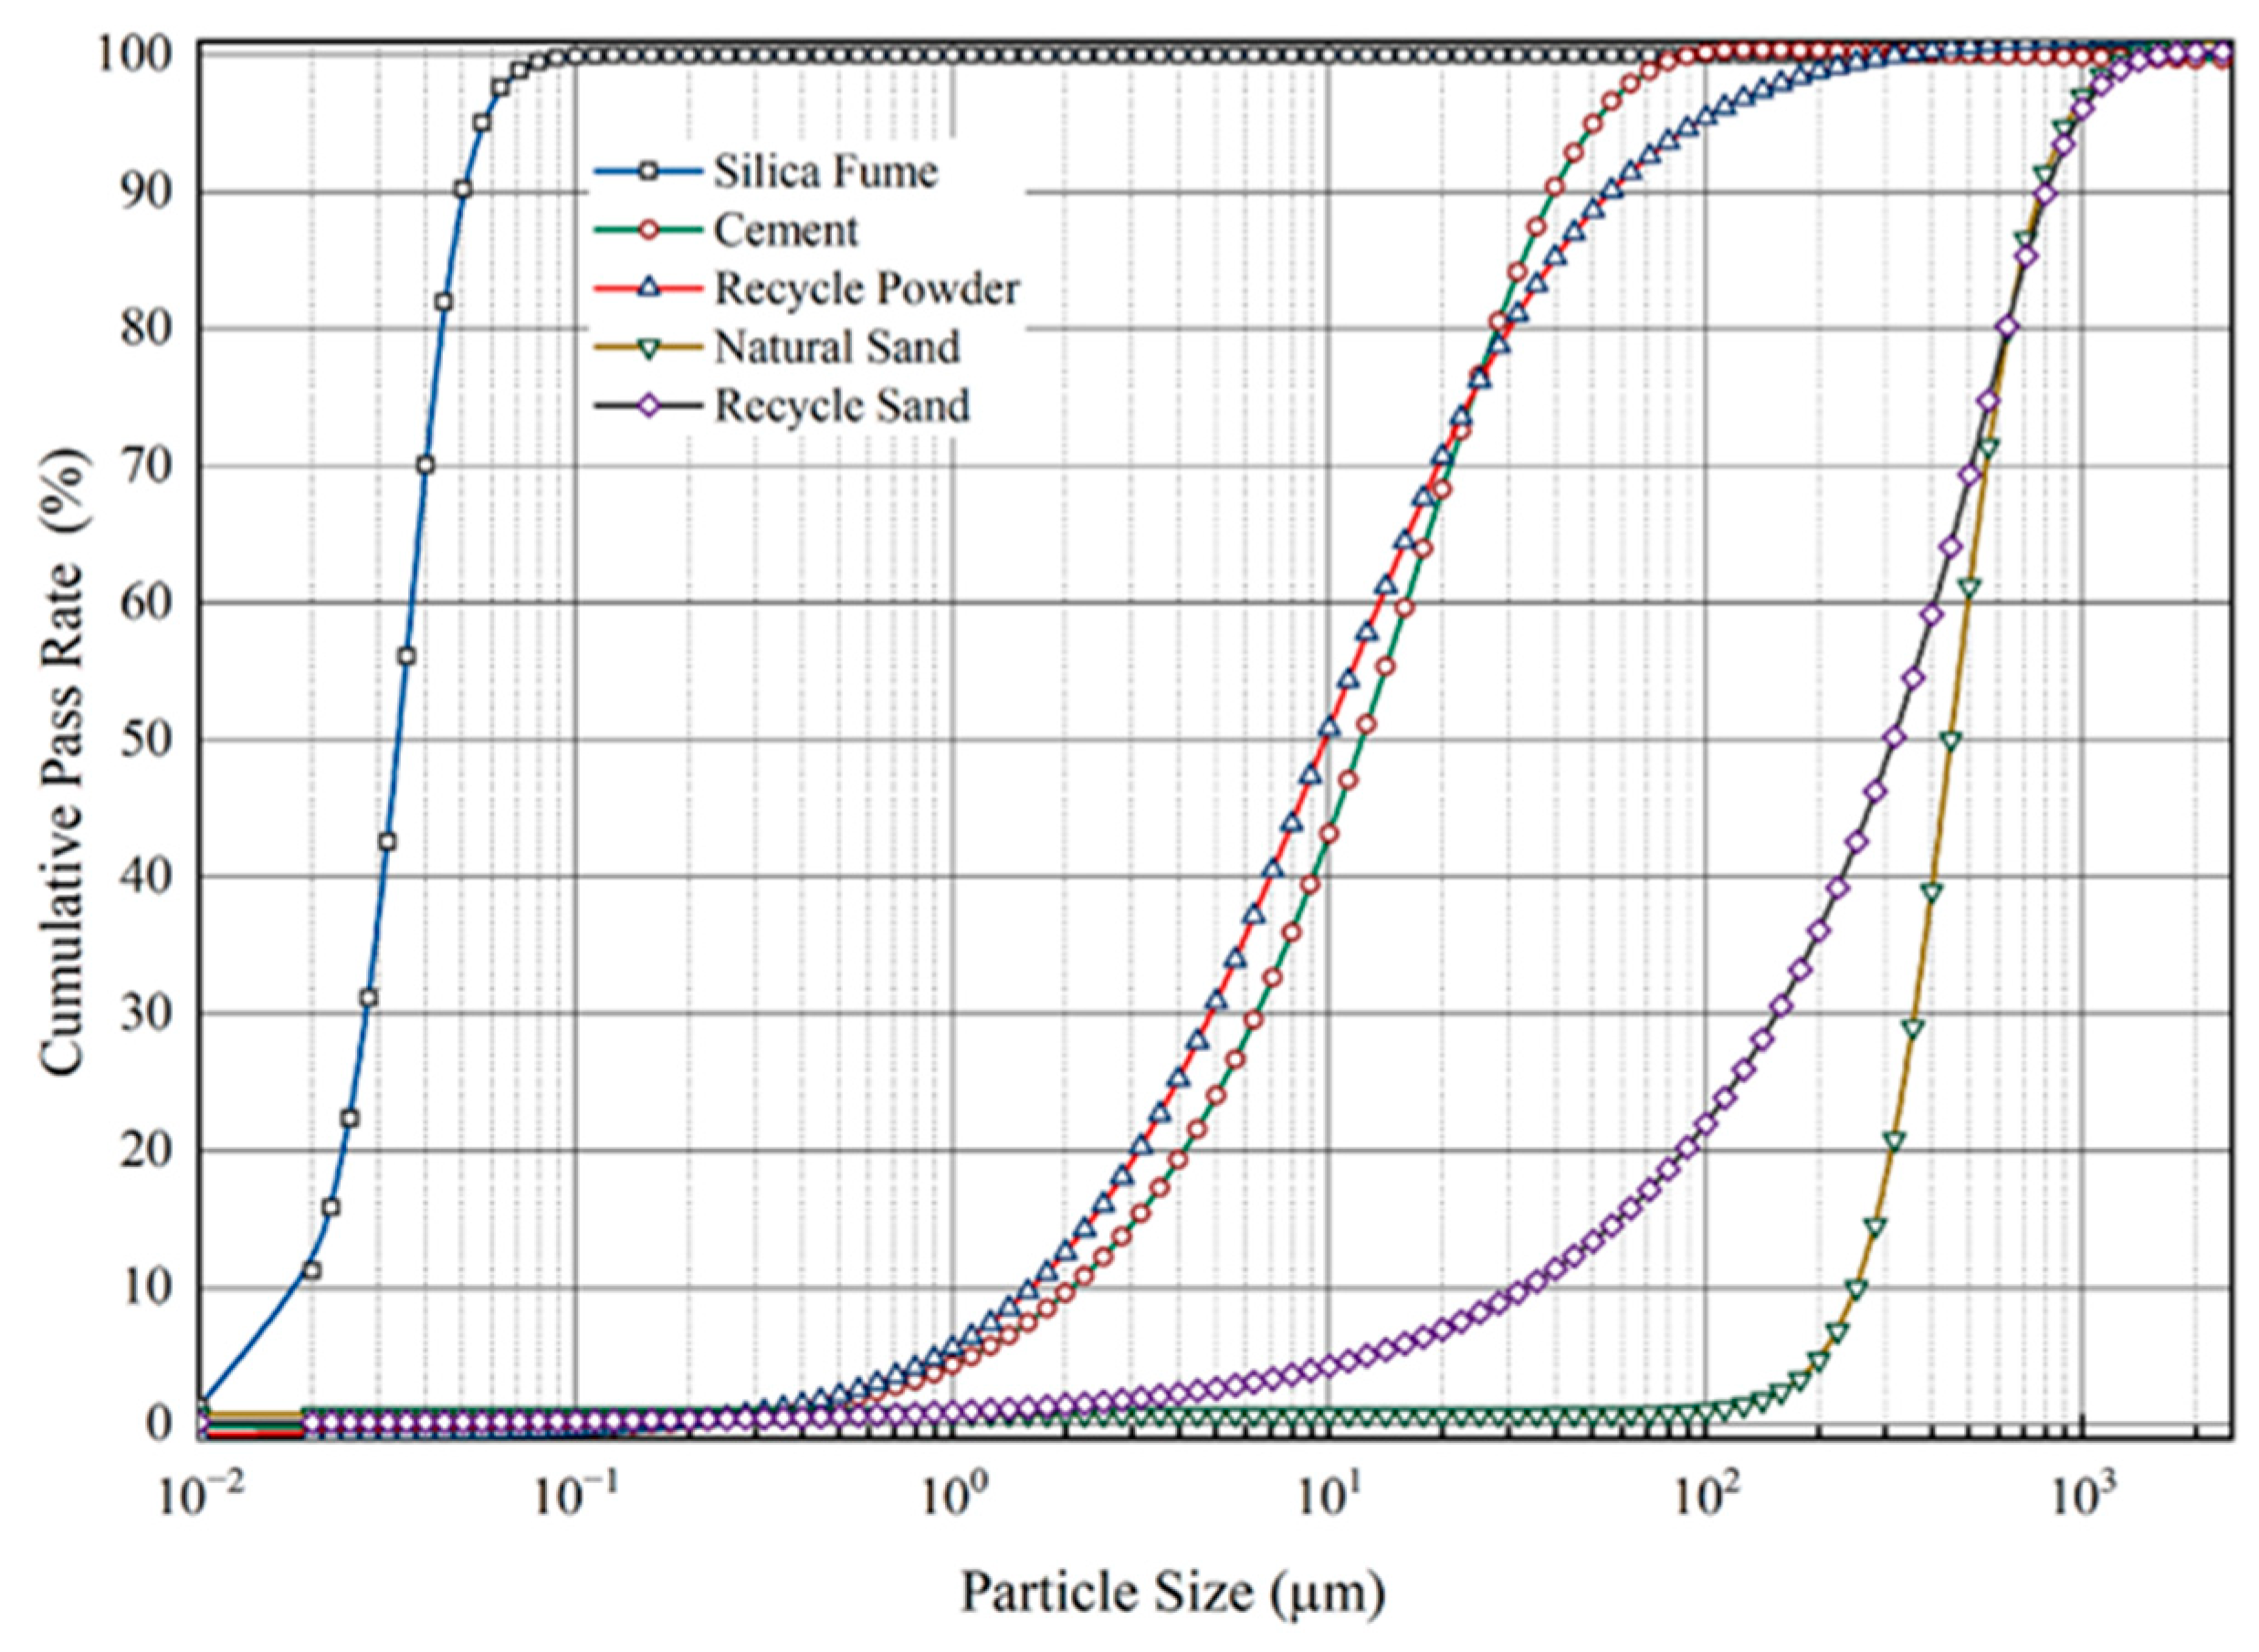
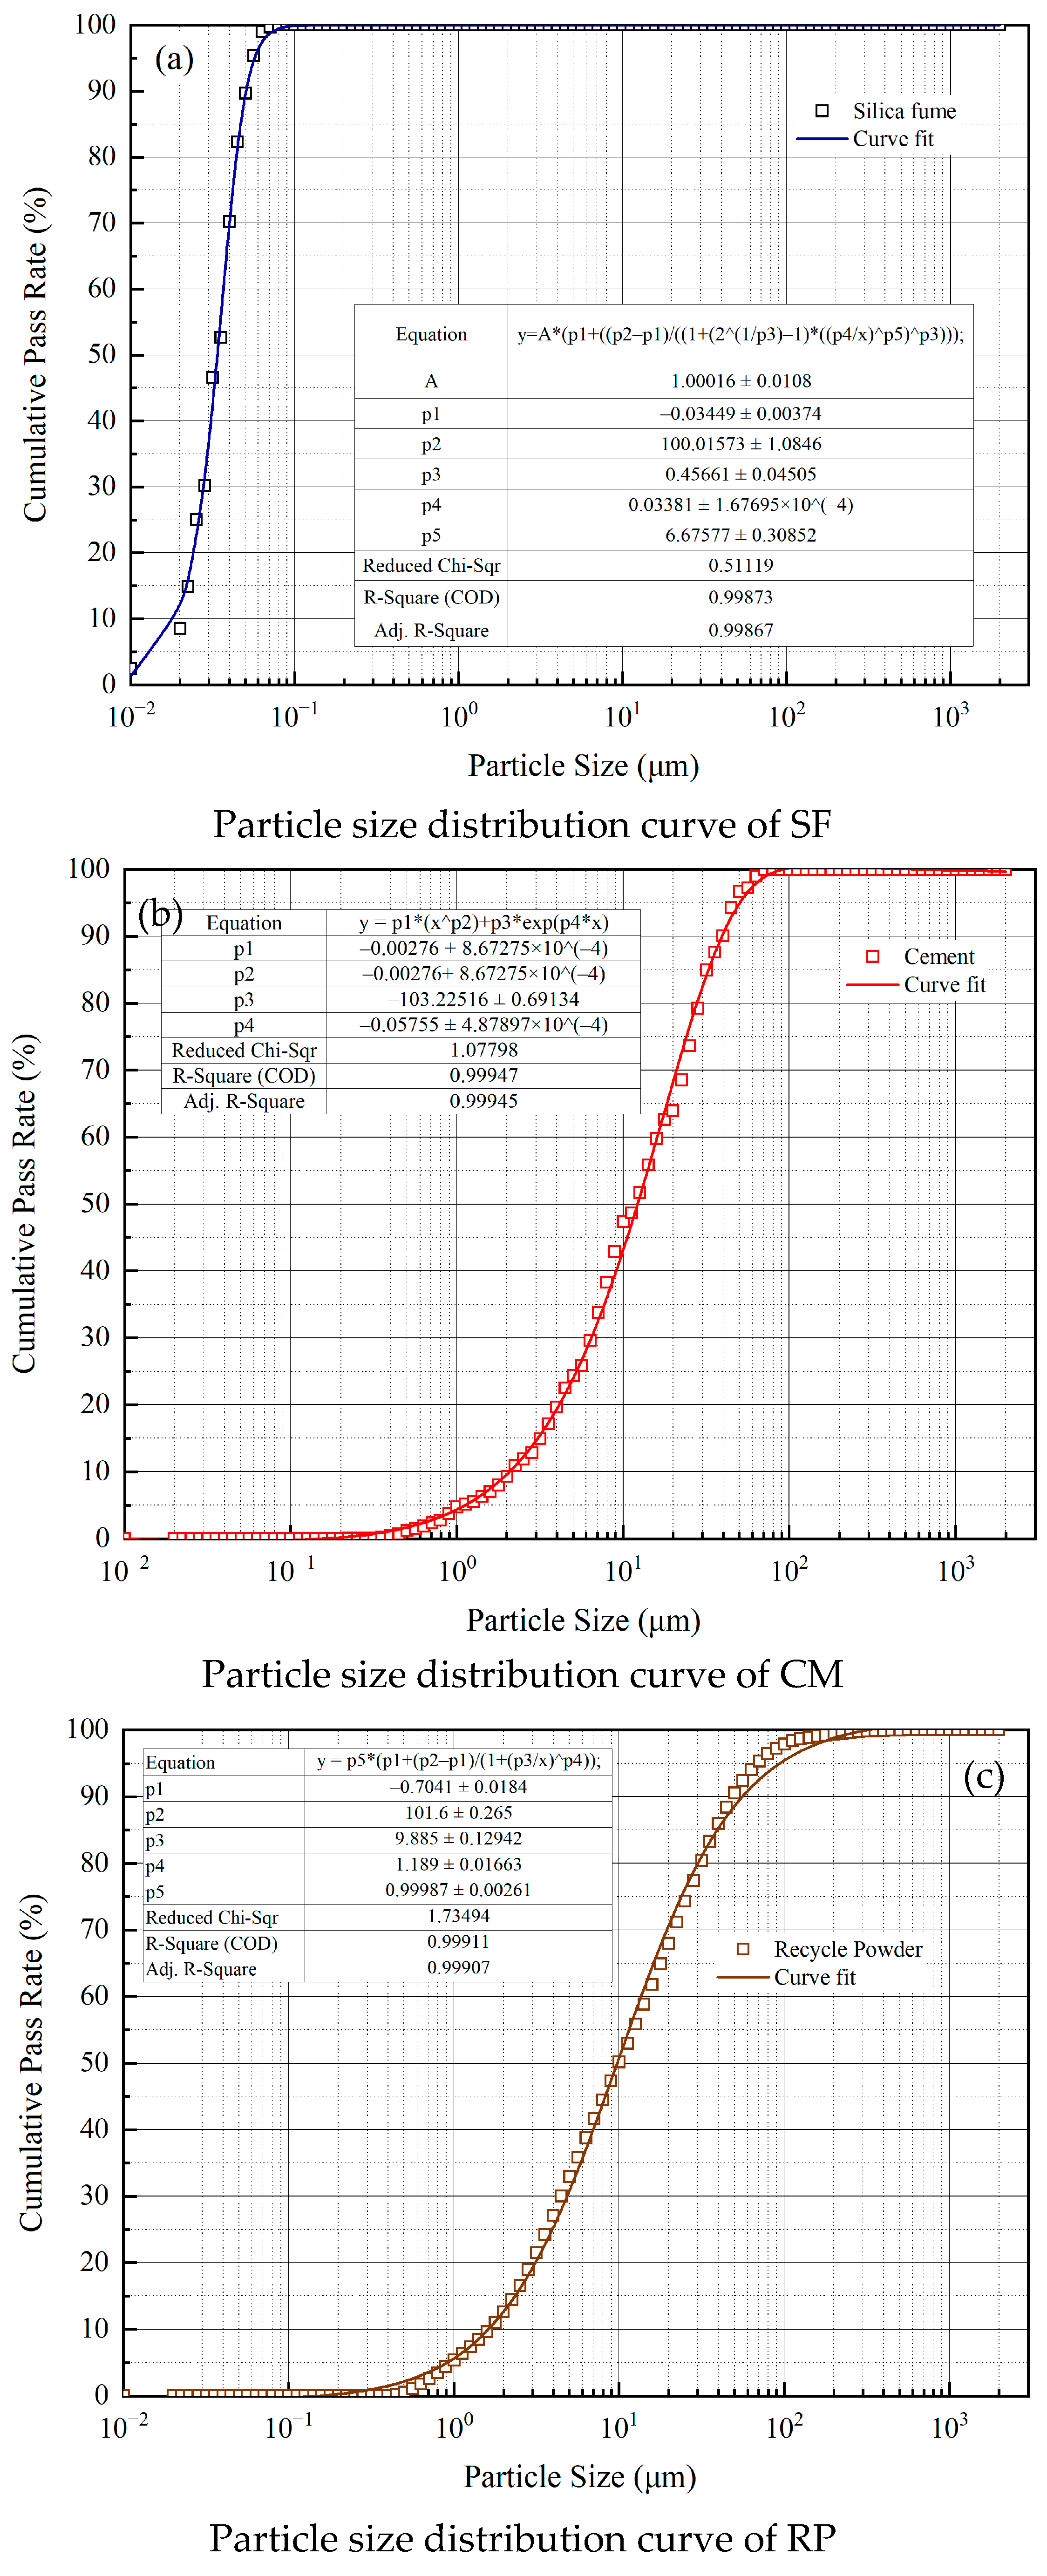
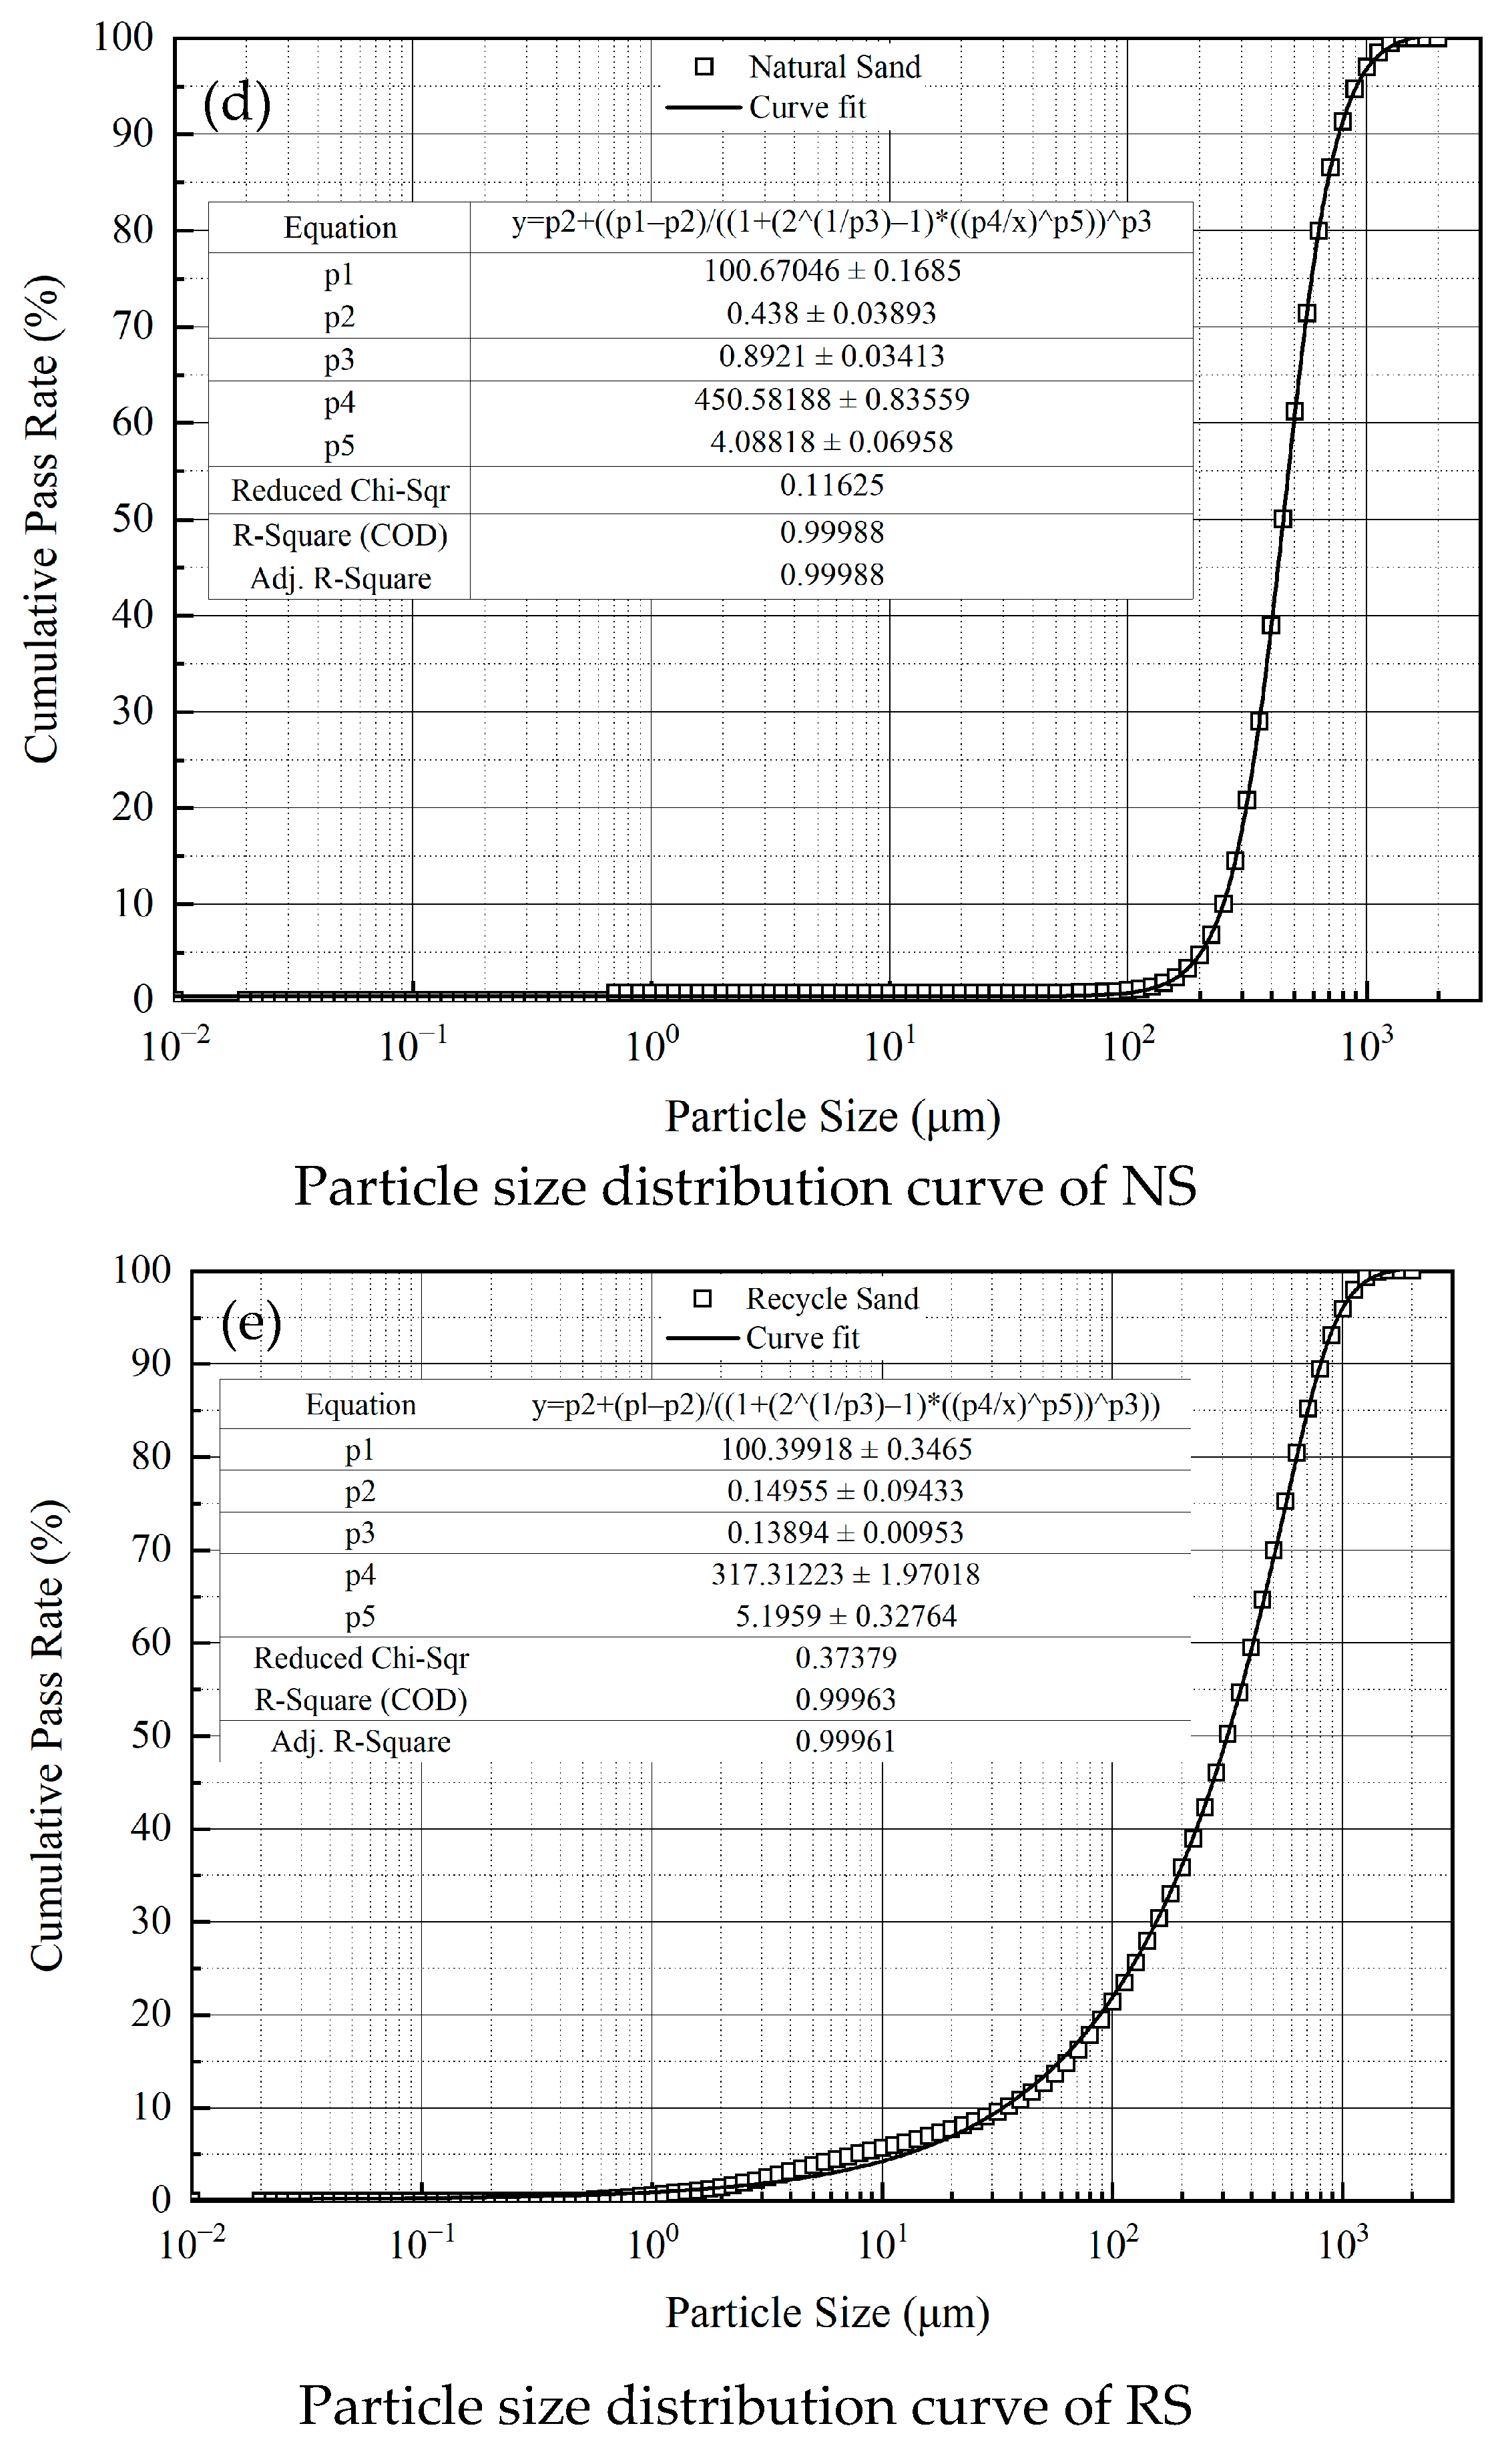
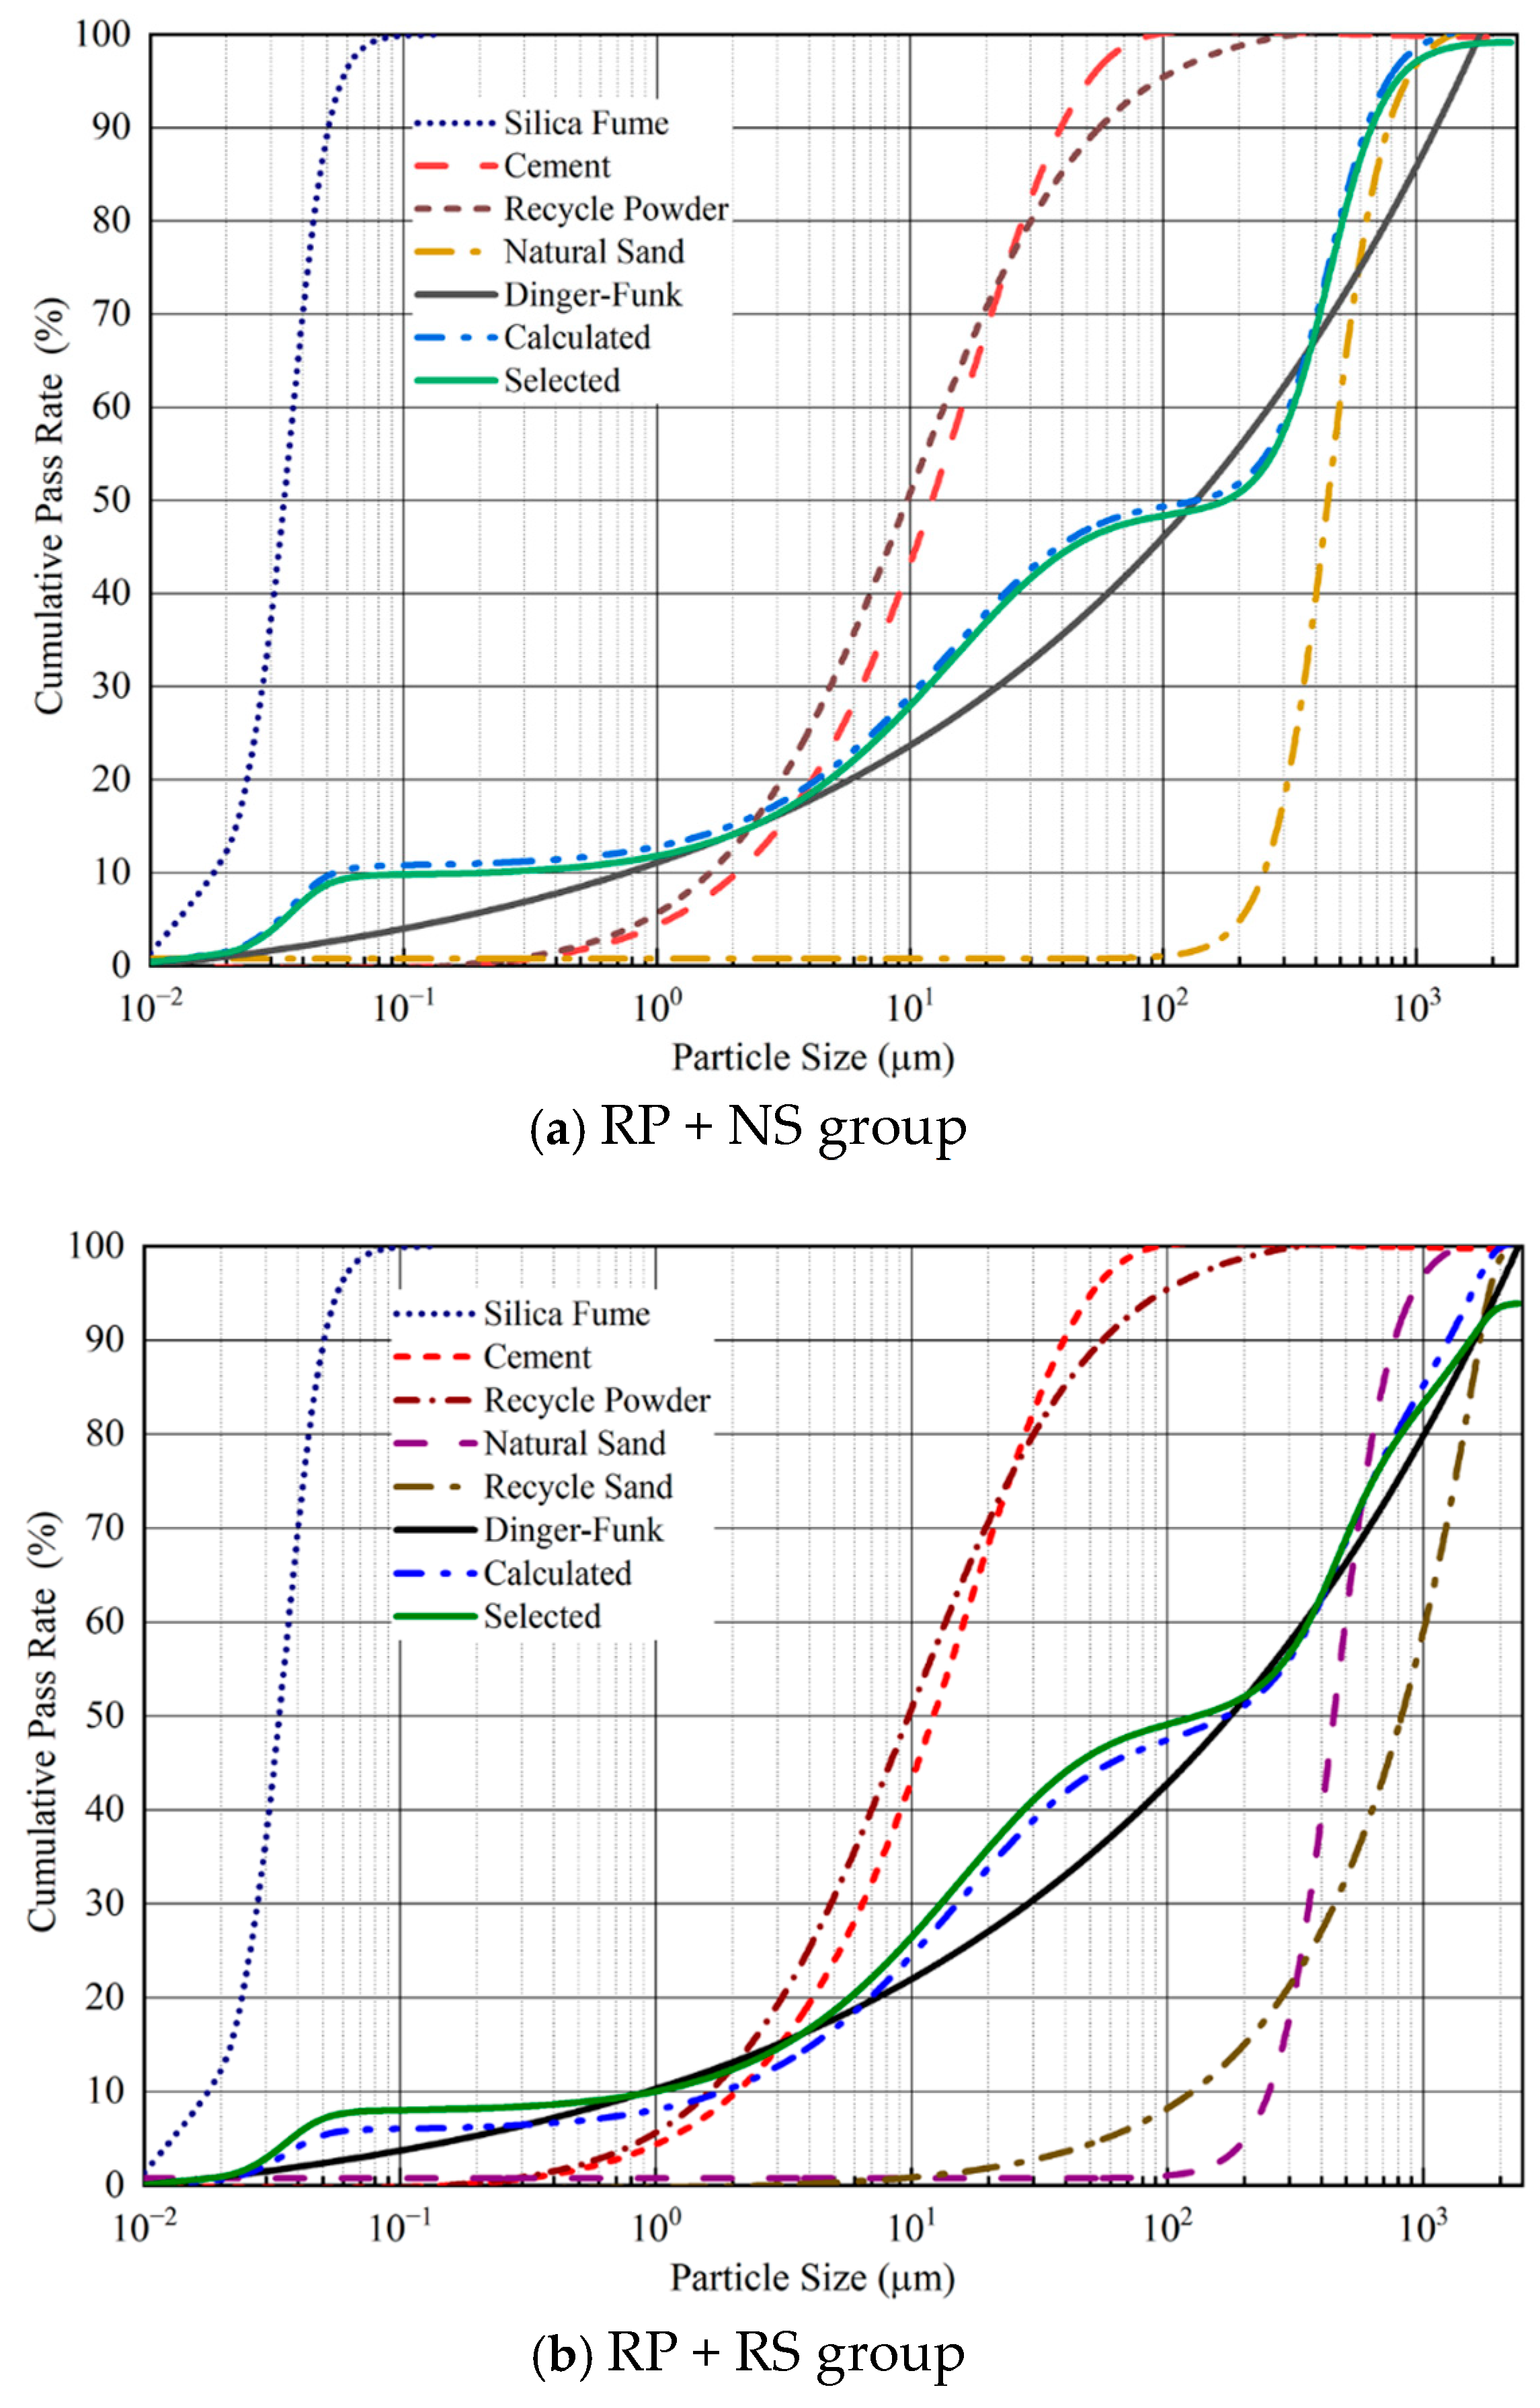
2.5. Size Distribution

The laser particle size analyzer was used to test the particle size distribution of the raw materials, and the results are shown in Figure 4. It can be concluded that the particle size of the SF was the smallest in the system, and the particle diameter was concentrated in the range of 0.1–1 μm. The particle size distribution characteristics of the cement and RP were similar; the particle diameter was concentrated in the range of 0.3–50 μm and the median particle size (D50) was about 11–18 μm, so their filling effect was similar. The particle size of the NS and RS was mainly distributed around 0.1–1 mm and 0.01–2 mm. The filling effect of the fine aggregate can be enhanced.

3. Optimization Design of UHPC Mix Proportions Based on Dinger–Funk Model

3.1. Dinger–Funk Model

The Dinger–Funk model [15] is based on the maximum packing theory to optimize particle gradation, and it was modified from the Andreasen model [16] to satisfy the fact that the minimum particle size in concrete is always limited. This model has been widely used in the mix proportion design of various concretes [17,18,19].
According to the maximum density theory, to achieve the maximum packing density, it is necessary to ensure that the particle size distribution curve U m ( D i ) of the whole system can meet the following requirements:
U m ( D i ) = U ( D i ) = 100 × D i n D min n D max n D min n
  • U m ( D i ) —The volume fraction of particles with a particle size smaller than D i ;
  • D i —Particle size or screen size;
  • D max ,   D min —The Maximum and minimum particle size in the system;
  • n —Distribution index.
Hunger [17] suggested an n value of 0.22–0.25 for self-compacting concrete. In this paper, a distribution index of n = 0.25 was used.

3.2. Mix Proportion Optimization Design

Firstly, based on the tested particle size distribution of each solid component, the appropriate curve function was selected as the particle size distribution curve by the fitting generation function of OriginPro 2021. The results are shown in Figure 5.
The particle size distribution curve U m ( D i ) in the whole mixture can be regarded as a linear combination of the particle size distribution curve of each component ( U m ( D i ) = v 1 · U 1 ( D 1 ) + v 2 · U 2 ( D 2 ) + v 3 · U 3 ( D 3 ) + v i is the volume fraction (0~1) of the “ith” solid material in the whole mixture. By selecting the Dinger–Funk curve as the objective curve, the optimal volume fraction can be determined by regression analysis of the linear combination of the particle size distribution curves of each component and the theoretical mass proportion can be calculated, as shown in Figure 6 and Table 9 and Table 10.
According to the mix proportion design calculated by the theoretical model, two basic mix proportions were determined, as shown in Table 11. The water–binder ratio in UHPC is usually between 0.16 and 0.20. Based on the previous research [1,4,5,6], the water–binder ratio was selected as 0.18. STFs with a volume fraction of 2% were used.

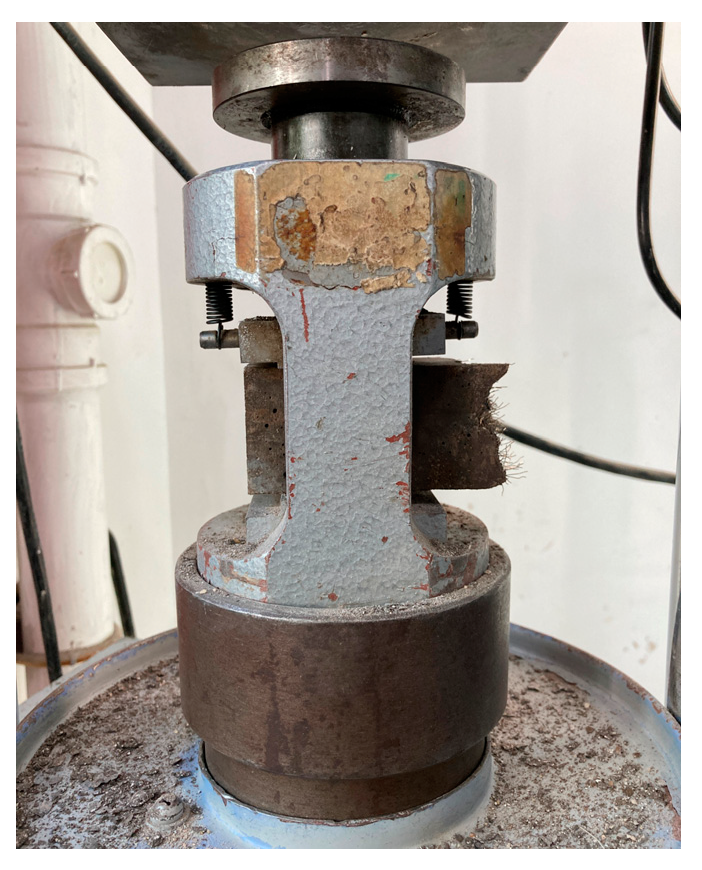
4. Specimen Fabrication and Test Methods

According to trial tests, the stirring program was as follows: (1) Based on the mix proportion, add CM, RP, SF and fine aggregate into the mixer and mix for 3 min; (2) Add 75% water and superplasticizer to the mixer and stir for 3 min; (3) Add the remaining 25% water and superplasticizer and stir for 5 min; (4) Finally, scatter the STF into the mix uniformly and stir for 5 min.
After mixing, the flowability was tested according to the flow table method specified in GB/T 2419 (2005).
Another part of the mixture was poured into a mold with dimensions of 40 mm × 40 mm × 160 mm for flexural strength tests. For each mix proportion, three prism specimens needed to be made. Then, the mold was vibrated on a vibration table for 2–3 min to remove air from the mixture. Standard curing was carried out. The specimens were placed in a standard curing chamber (temperature T = 20 ± 2 °C and relative humidity RH ≥ 95%) for 24 h. After demolding, the specimens were placed back in the standard curing chamber until the test.
The test device for flexural strength is shown in Figure 7. According to GB/T 17671 (1999), the loading rate for the flexural strength test is 50 N/s ± 10 N/s. The final experimental result is the average of the flexural strengths of the three prism specimens.
The half prisms obtained after the flexural test were used for compressive strength tests, so the compressive strength is the average value of the six half prisms. The test device for compressive strength is shown in Figure 8. According to GB/T 17671 (1999), the loading rate of the compressive strength test is 2400 N/s ± 200 N/s.

5. Experimental Program

Based on the calculated optimal mix design, the influence of the superplasticizer content, water–binder ratio, RP content and RS content on the performance of the GUHPC were investigated, and the optimal mix proportion was further explored.

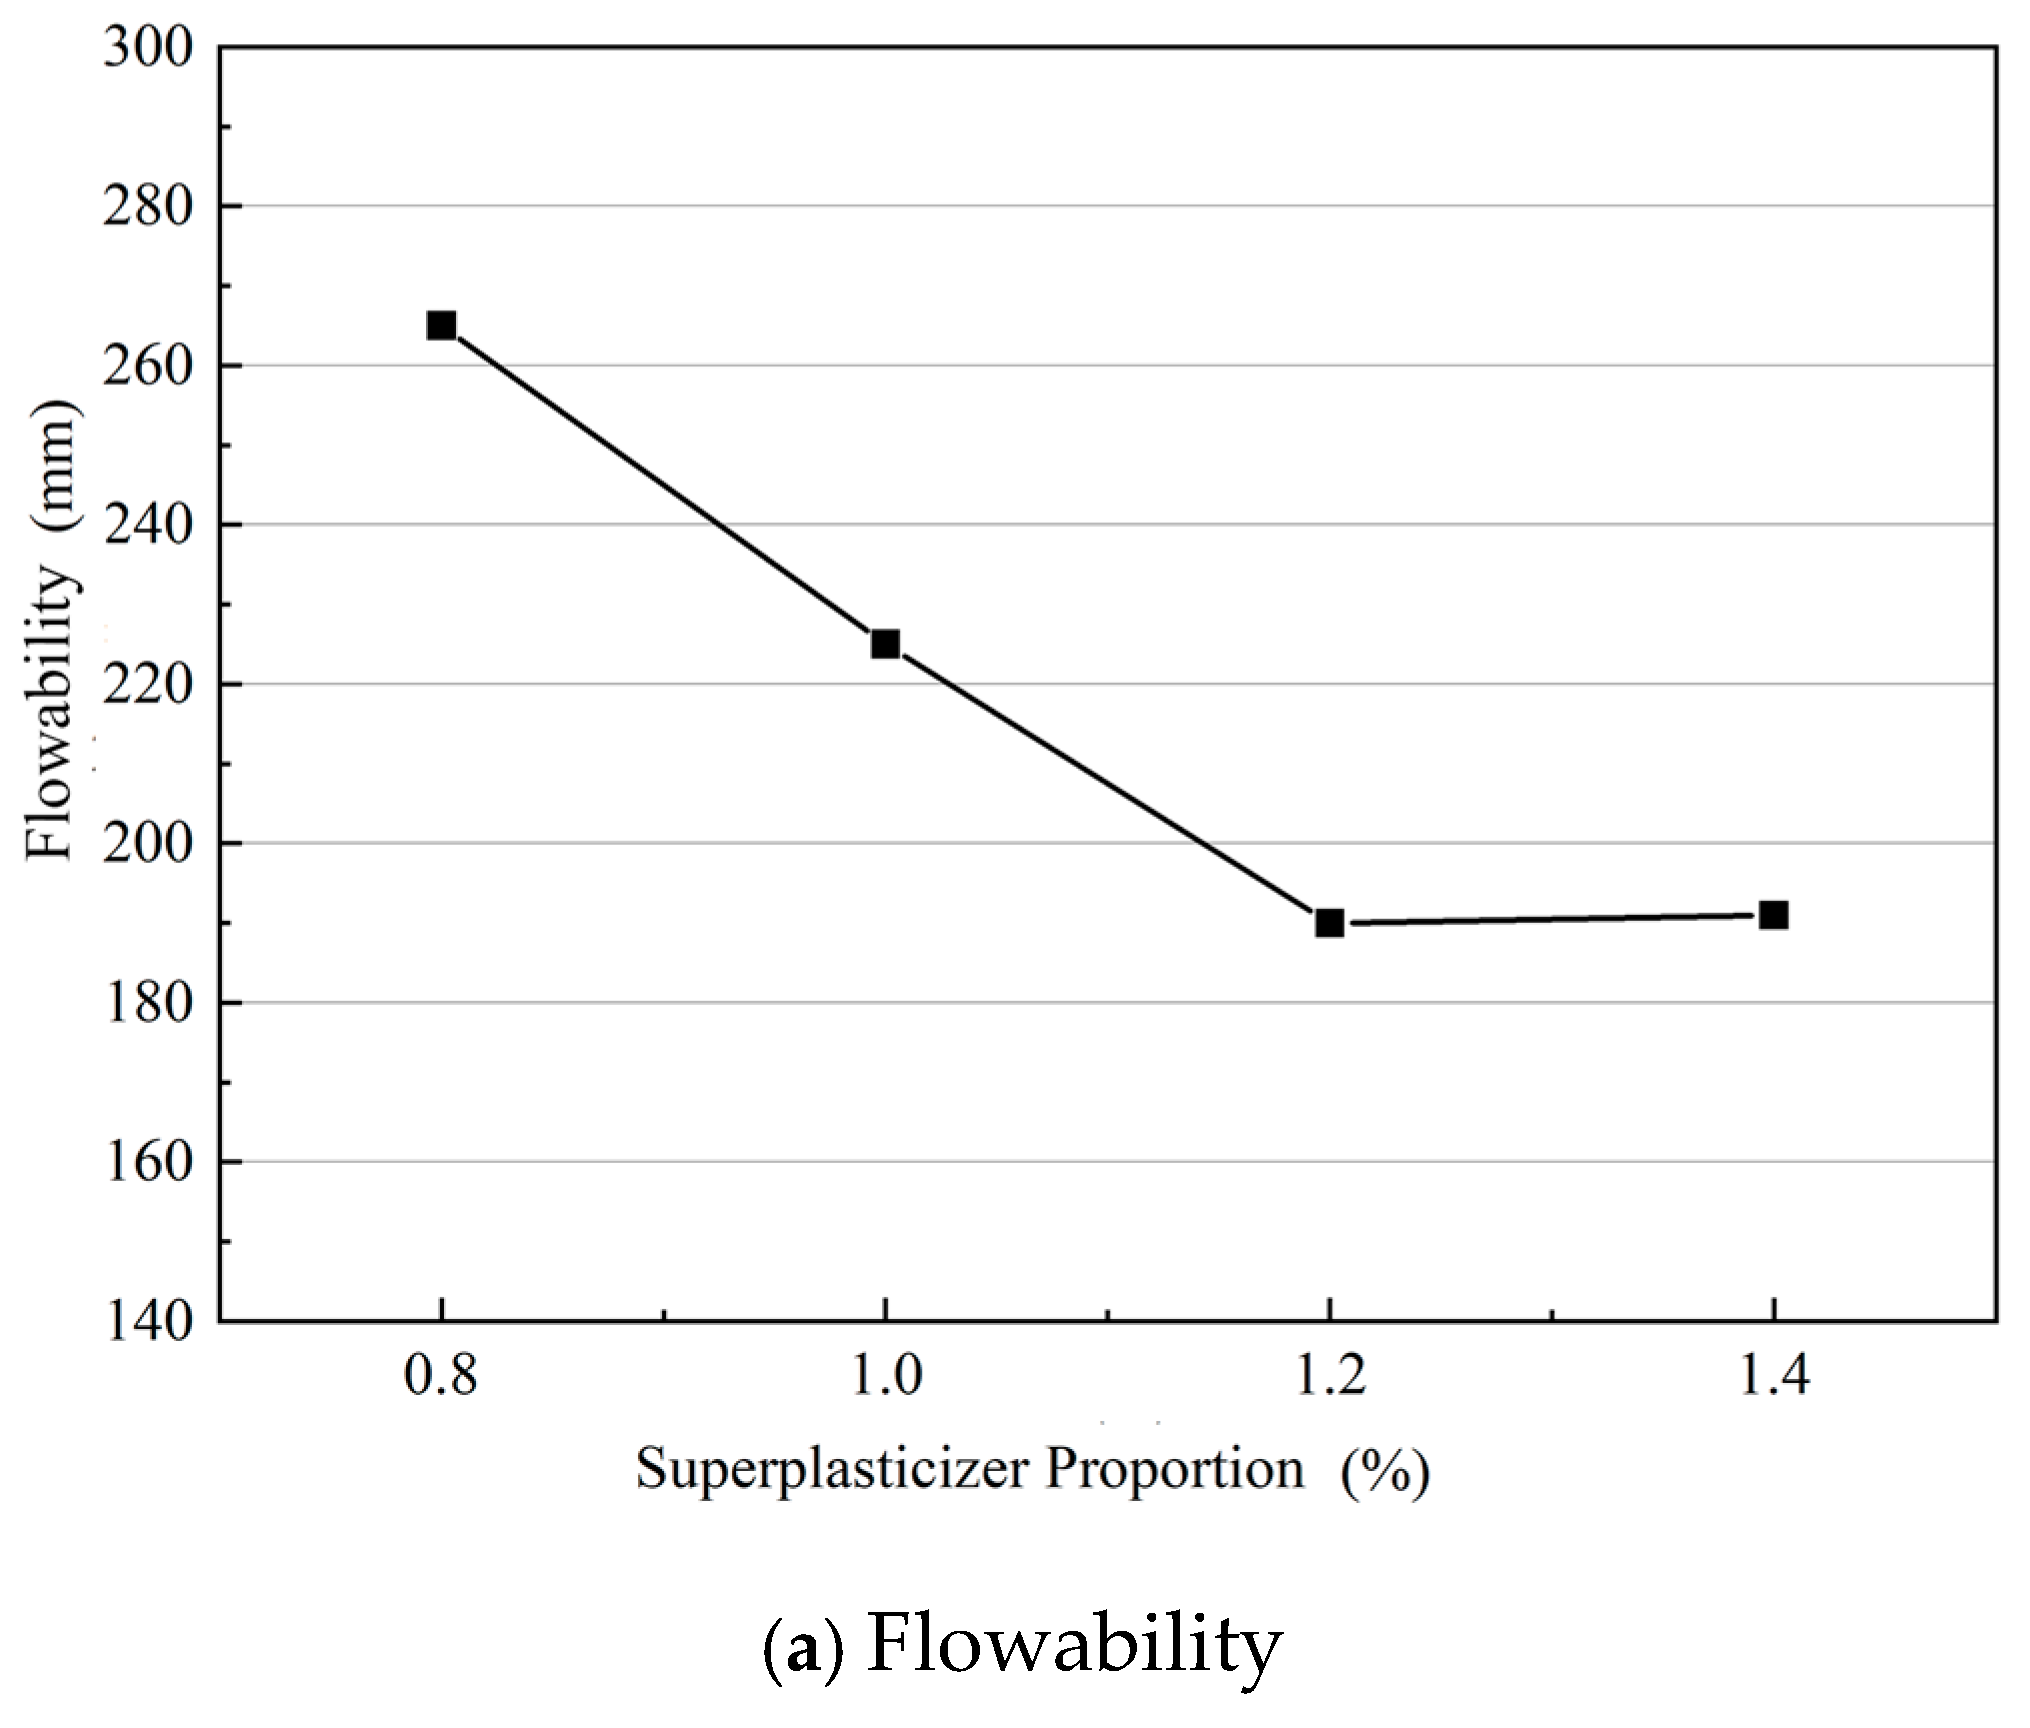
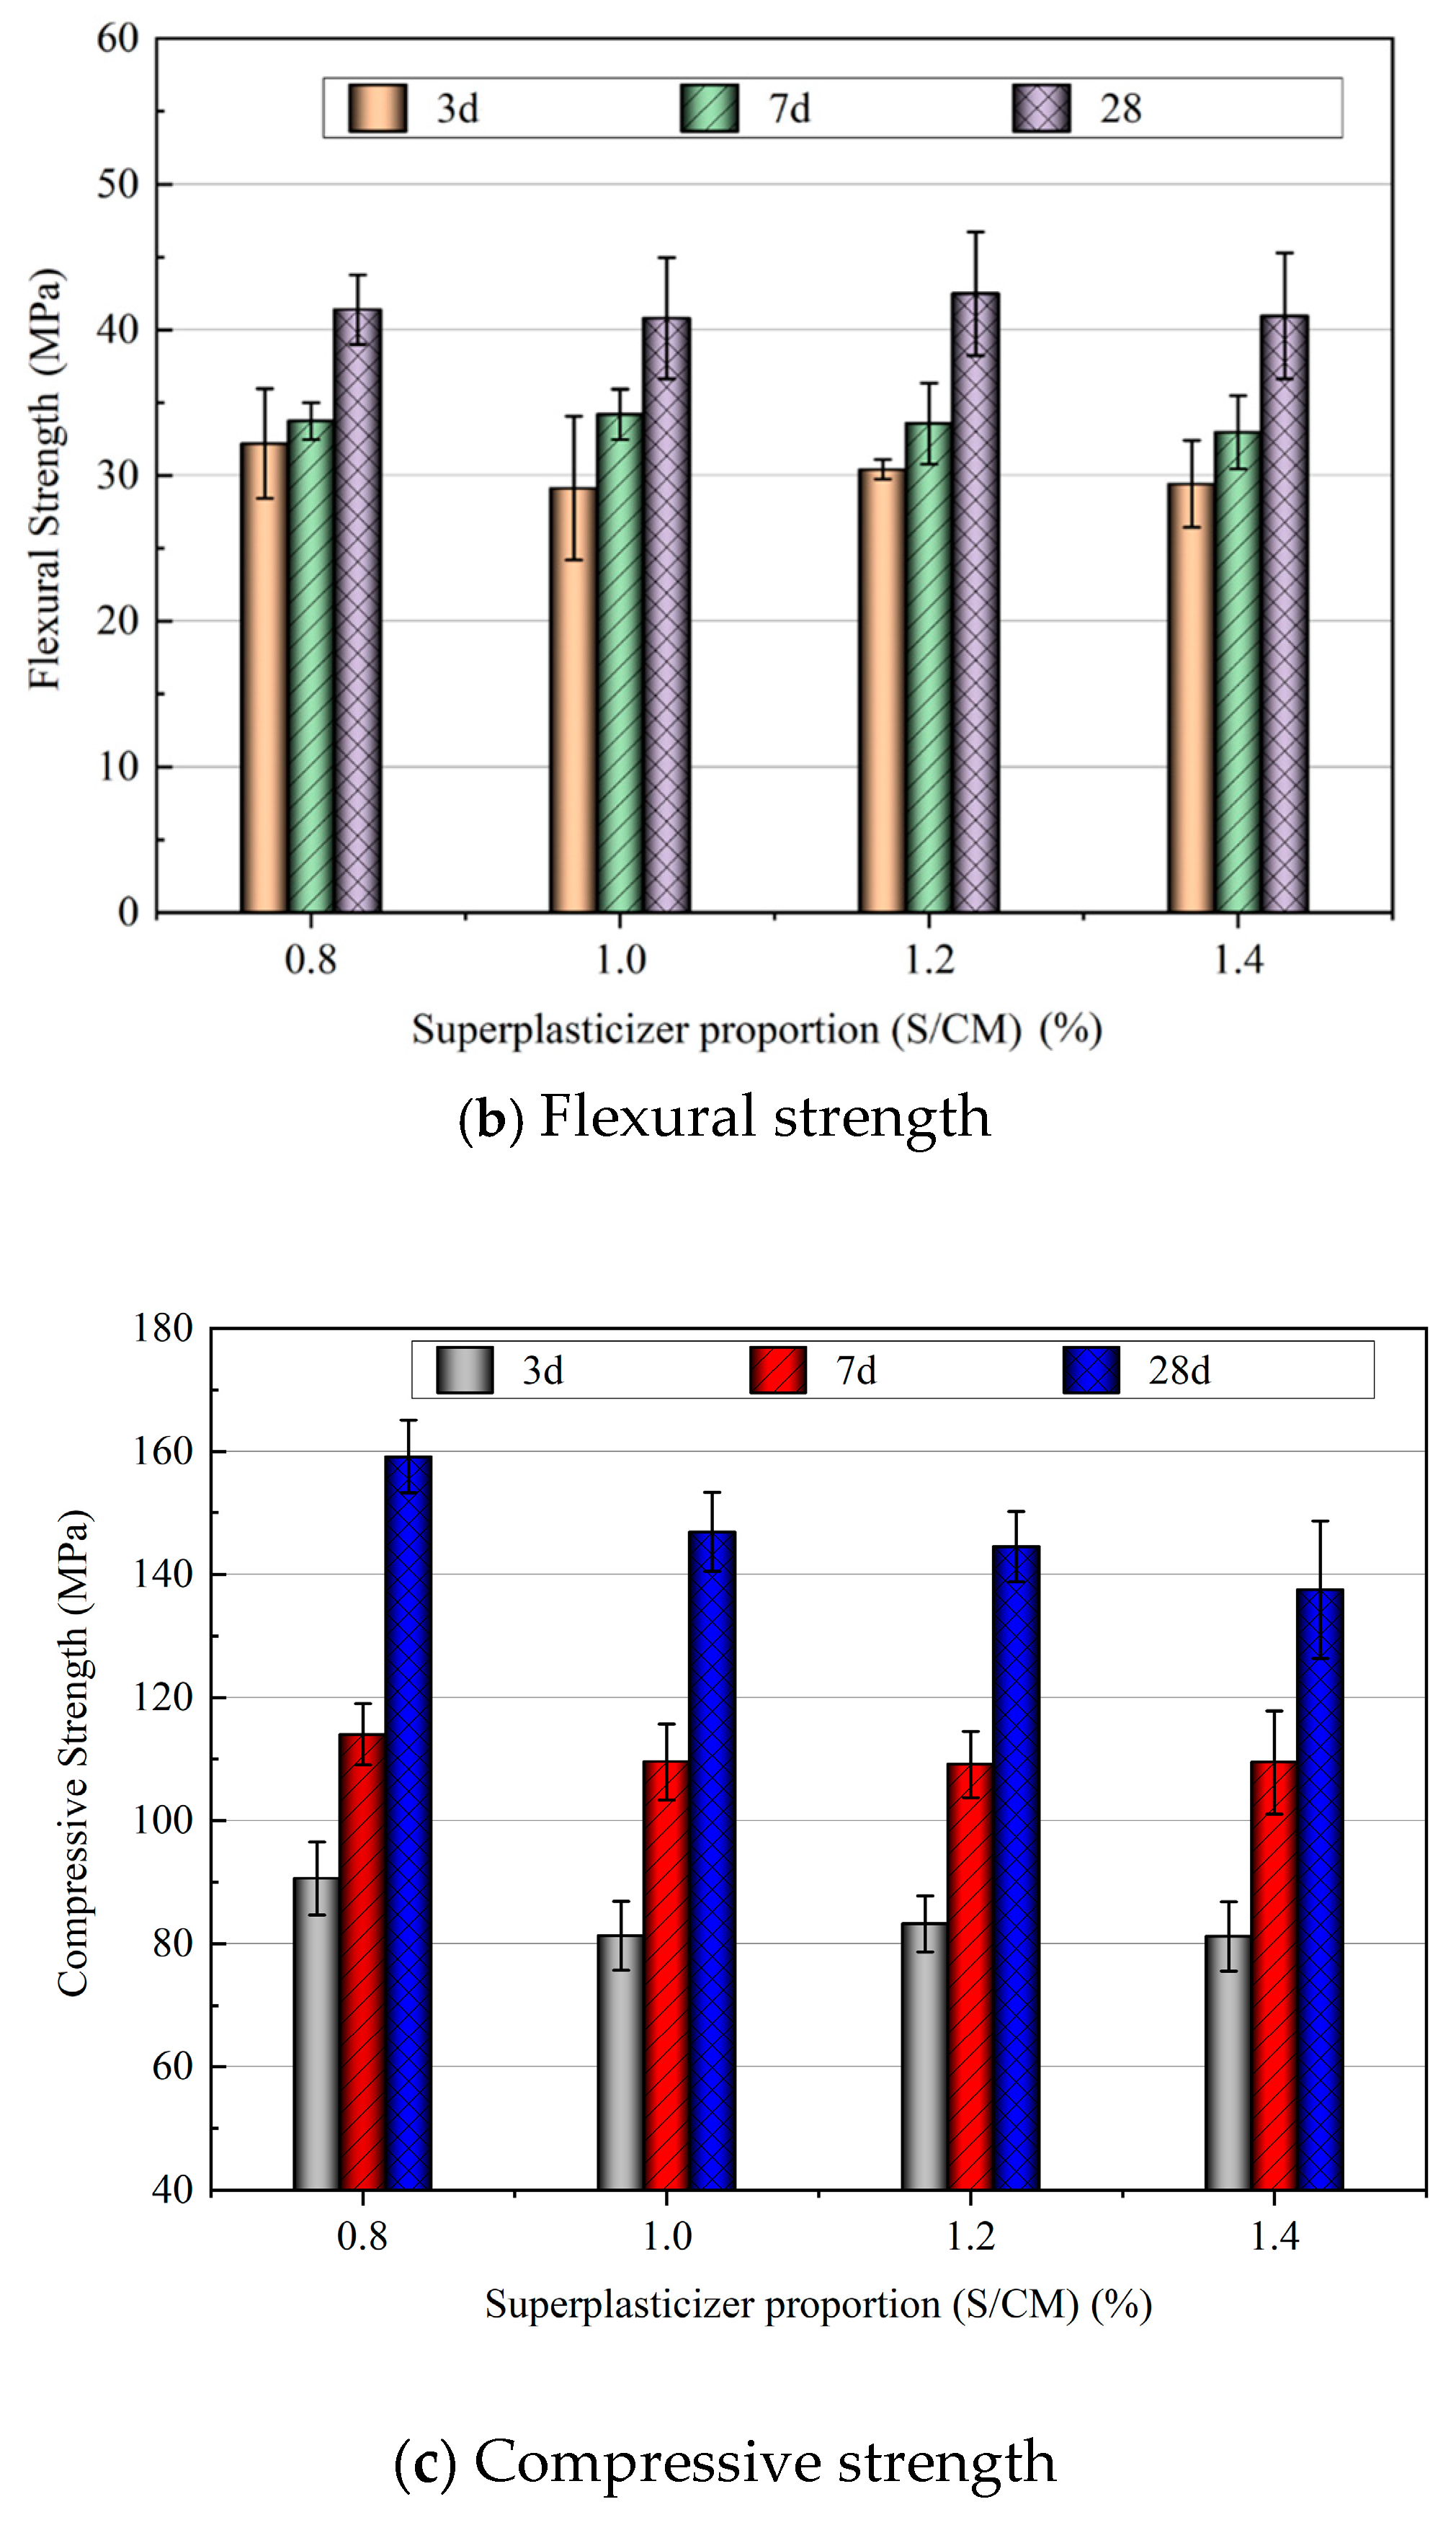
5.1. Superplasticizer Proportion

To find the appropriate dosage of superplasticizer, mix proportions with four different superplasticizer dosages were tested, as shown in Table 12. The water content of the superplasticizer was included in the total water of the mixture. According to the manufacturer’s recommendation, 0.8% was the minimum content. The variations of flowability, flexural strength and compressive strength of the GUHPC with the amount of superplasticizer are shown in Figure 9.
As shown in Figure 9a, when SP/CM increased from 0.8% to 1.2%, the flowability reduced significantly. Excessive superplasticizer can make the cement slurry become viscous, which can cause the flowability to reduce. Figure 9b shows that the amount of superplasticizer has little influence on the flexural strength. As shown in Figure 9c, when the content of superplasticizer was 0.8%, the 3 d, 7 d and 28 d compressive strength of the specimen were all the highest. The dosage of superplasticizer in the GUHPC was selected as SP/CM = 0.8%.

5.2. Water–Binder Ratio

According to relevant studies [1,4,5,6], the water–binder ratio of UHPC should be between 0.16 and 0.20. The influence of the water–binder ratio was studied experimentally, and the mix proportions are shown in Table 13. The flowability, compressive strength and flexural strength of the GUHPC with different water–binder ratios are shown in Figure 10.
According to Figure 10a, the flowability of GUHPC increased with increases in the water–binder ratio. When the water–binder ratio was 0.16, 0.17 and 0.18, the flowability was higher than 180 mm, which indicates good flowability [20], and no serious segregation was observed. As shown in Figure 10b,c, the flexural and compressive strength decreased with increases in the water–binder ratio.
According to the flowability, compressive strength and flexural strength, the water-binder ratio of 0.16 was selected.

5.3. Substitution Rate of Recycled Powder

The influence of the RP ratio was investigated. RP replacement rates of 0, 20%, 30% and 40% were compared, and the mix proportions are shown in Table 14. The workability, compressive strength and flexural strength of the GUHPC were tested, as shown in Figure 11. In the flexural and compressive tests, the same failure modes were observed for all the mixtures. RP showed no influence on the failure mode.
The flowability of the GUHPC decreased with increases in the replacement rate of the RP, because RP has higher water requirements than cement. RP particles have an angular shape, irregular structure and loose surface, which can weaken the flowability of the mix [14]. Nevertheless, the whole mix can maintain good flowability.
As shown in Figure 11b, with increases in the replacement rate of the RP, the flexural strength increased firstly and then decreased. Compared with the mixture without RP, the 3-day flexural strength for RP replacement rates of 20%, 30% and 40% increased (decreased) by 3.1%, −20.6% and −32.9%, respectively; the 7-day flexural strength by 2.8%, −8.6% and −0.7%, respectively; and the 28-day flexural strength by 4.9%, 2.3% and −0.2%, respectively. Decreases in cement can result in reduced hydration and thus the strength may be lowered. However, the pozzolanic activity of the RP gradually developed over time [4,14], which can increase the strength in later stages.
As shown in Figure 11c, with increases in the replacement rate of RP, the 3-day and 7-day compressive strength decreased, while the 28-day compressive strength increased first and then decreased, the results were similar to Wang et al. [21]. The pozzolanic activity of RP is not fully developed at early ages and is not sufficient to compensate for the strength decrease caused by reduced hydration [4,14], and thus, the 3-day and 7-day compressive strength of the GUHPC decreased with increases in the replacement rate of the RP. The reasons why the 28-day compressive strength of the GUHPC first increased and then decreased with increases in the replacement rate of the RP are: (1) at the 28th day, the strength increase caused by the pozzolanic activity of the RP developed is higher than the strength decrease caused by the reduced hydration due to the decrease in the cement; (2) the micro-filling effect of the RP [22,23] is most fully utilized when the replacement rate of the RP is 30%. As the replacement rate of the RP exceeds a certain level, the micro-filling effect declines. Compared with mixtures without RP, the 3-day compressive strength for RP replacement rates of 20%, 30% and 40% increased (decreased) by −10.5%, −15.3% and −24.3%, respectively; the 7-day compressive strength by −2.3%, −5.3% and −4.8%, respectively; and the 28-day compressive strength by 3.2%, 6.4% and 1.7%, respectively.
The 28 d compressive strength of the GUHPC was the highest when the replacement rate of the RP was 30%. These results also verified the mix design based on the revised Dinger–Funk model.
To evaluate the comprehensive effect of RP on strength, the material activity index proposed by Pu [24] was adopted. The relative strength of concrete (S′, MPa) is the contribution of the cement per unit (1% of the cement used) to the strength, as in Equation (2):
S = S m
  • S —Compressive strength of concrete, MPa;
  • m—Mass percentage of CM in the total mass of RP and CM, %.
The relative strength of GUHPC with different RP replacement rates at different ages was calculated, as shown in Figure 12. With increases in the RP substitution rate, the relative strength at each age increased. This shows that RP can enhance the contribution of cement to the strength of GUHPC. With increases in the age, the relative strength of the different RP substitutes increased, indicating that the enhancement effect of RP increased with increases in age.
In order to quantify the contribution of RP to the strength of GUHPC, the comprehensive strength contribution rate (Pr,%) proposed by Mao [14] was calculated following Equation (3). When the Pr is greater than 0, it means that the contribution of RP to the strength is greater than that of inert material.
Pr = S S c S × 100
As shown in Figure 13, the comprehensive contribution rate of the GUHPC gradually increased with increases in the replacement amount of RP, and the increase was approximately linear. With increases in age, the comprehensive contribution rate increased gradually. For example, the 28-day comprehensive contribution rate was 22.4%, 34.2% and 41.0%, respectively, when the replacement rate of the RP was 20%, 30% and 40%. When the replacement rate of the RP was 30%, the comprehensive contribution rate at 7 d and 28 d increased by 45.6% and 90.2%, respectively, compared with that at 3 d. It can be seen that by replacing cement, the RP can exert the comprehensive effect of mineral admixture in GUHPC and can improve the utilization rate of cement. The enhancement effect increases with increases in RP as well as age. Based on the above comprehensive analysis, as well as the performance of concrete, 30% was selected as the optimal replacement rate of RP.

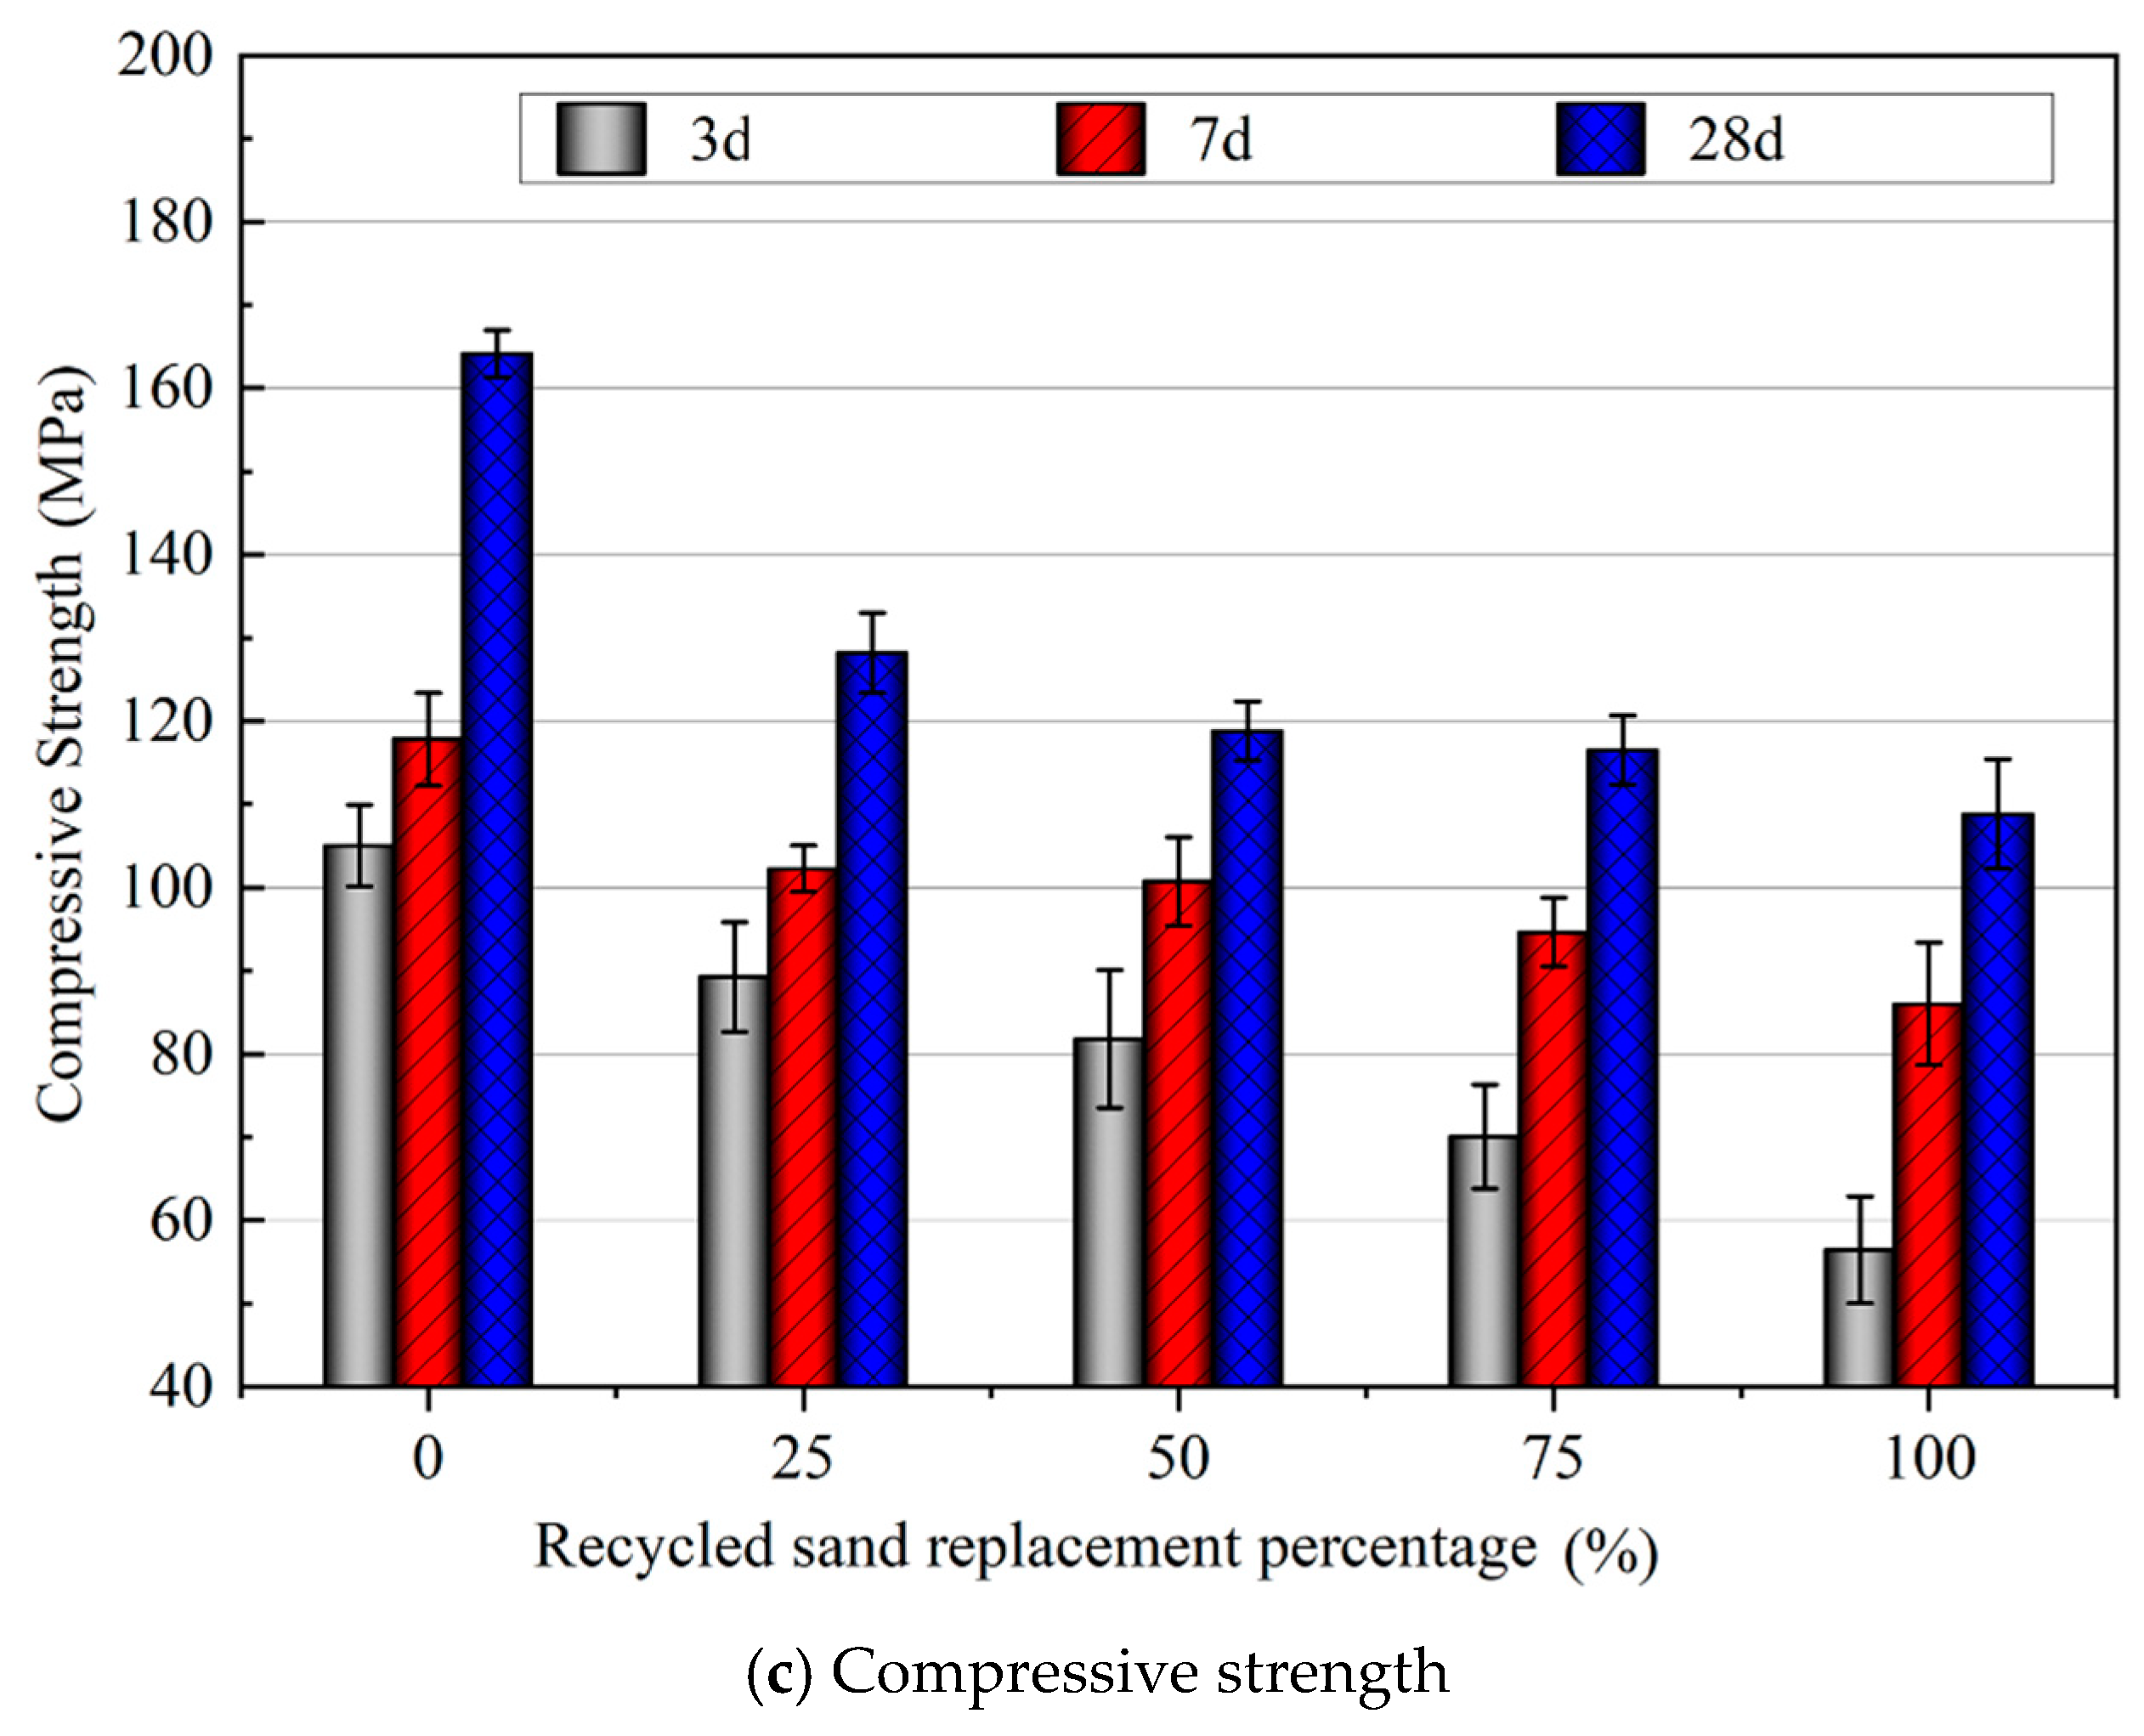
5.4. Substitution Rate of RS

To reduce the cost of UHPC and save natural aggregate resources, RS was used to produce GUHPC. GUHPC mix proportions with RS of different contents (25%, 50%, 75% and 100%) were tested. Since the water absorption rate of the RS (11.8%) was significantly higher than that of NS (0.8%), the water consumption and superplasticizer needed be increased to meet the flowability requirements. According to multiple trial tests, the additional water was taken as 7.67% of the RS content (that is, 65% of the RS water absorption). The mix proportions are listed in Table 15.
In the flexural and compressive tests, the same failure modes were observed for all the mixtures. RS showed no influence on the failure mode.
The flowability was tested, as shown in Figure 14a. It can be seen that with increases in the RS replacement amount, the flowability of the GUHPC increased first and then decreased. RS can fill in the gaps between NS, and the flowability of the mix can be improved when the RS content is low at 25%. The water absorption rate of RS was higher than that of NS, and the flowability decreased with increases in the RS content when the RS content was high.
The flexural strength and compressive strength of GUHPC with RS are shown in Figure 14b,c. It can be seen that with increases in the RS content, the flexural strength and compressive strength of the GUHPC was decreased at each age. Compared with mixtures without RS, the 28-day flexural strength for RS replacement rates of 25%, 50%, 75% and 100% decreased by 15.8%, 14.2%, 25.4% and 31.1%, respectively, and the 28-day compressive strength by 21.9%, 27.6%, 29.0% and 33.7%, respectively.
The comprehensive performance of RS is worse than that of NS, due to the high water absorption rate, irregular surface and impurities contained. These defects weaken the bond between the cement slurry and RS, so the strength of RS concrete is generally lower than that of NS concrete [25]. Decreases in the compressive strength were higher than those in the flexural strength, which indicates that the compressive strength of GUHPC containing RS is more sensitive to the RS content.
The flexural strength to compressive strength ratio (f:c) is one of the indicators for the toughness of concrete. The f:c of GUHPC with different RS replacement rates is shown in Figure 15. With increases in the RS content, the f:c at 3 d of age increased, the f:c at 7 d of age showed no significant change, and the f:c at 28 d of age first increased and then decreased. At 28 d of age, the f:c was the largest when the RS percentage was 50%. Therefore, considering the flowability, strength and toughness of GUHPC, the replacement rate of RS is determined as 50%.

6. Conclusions

RP and RS were used to replace cement and natural sand in UHPC. The optimal proportion design of GUHPC with RP and RS was obtained according to a revised Dinger–Funk model, and the effects of different mix parameters such as the superplasticizer content, the water–binder ratio and the amount of RP and RS on the workability and mechanical properties of the GUHPC were experimentally studied. Furthermore, standard curing was adopted instead of steam curing. The following conclusions were obtained:
(1)
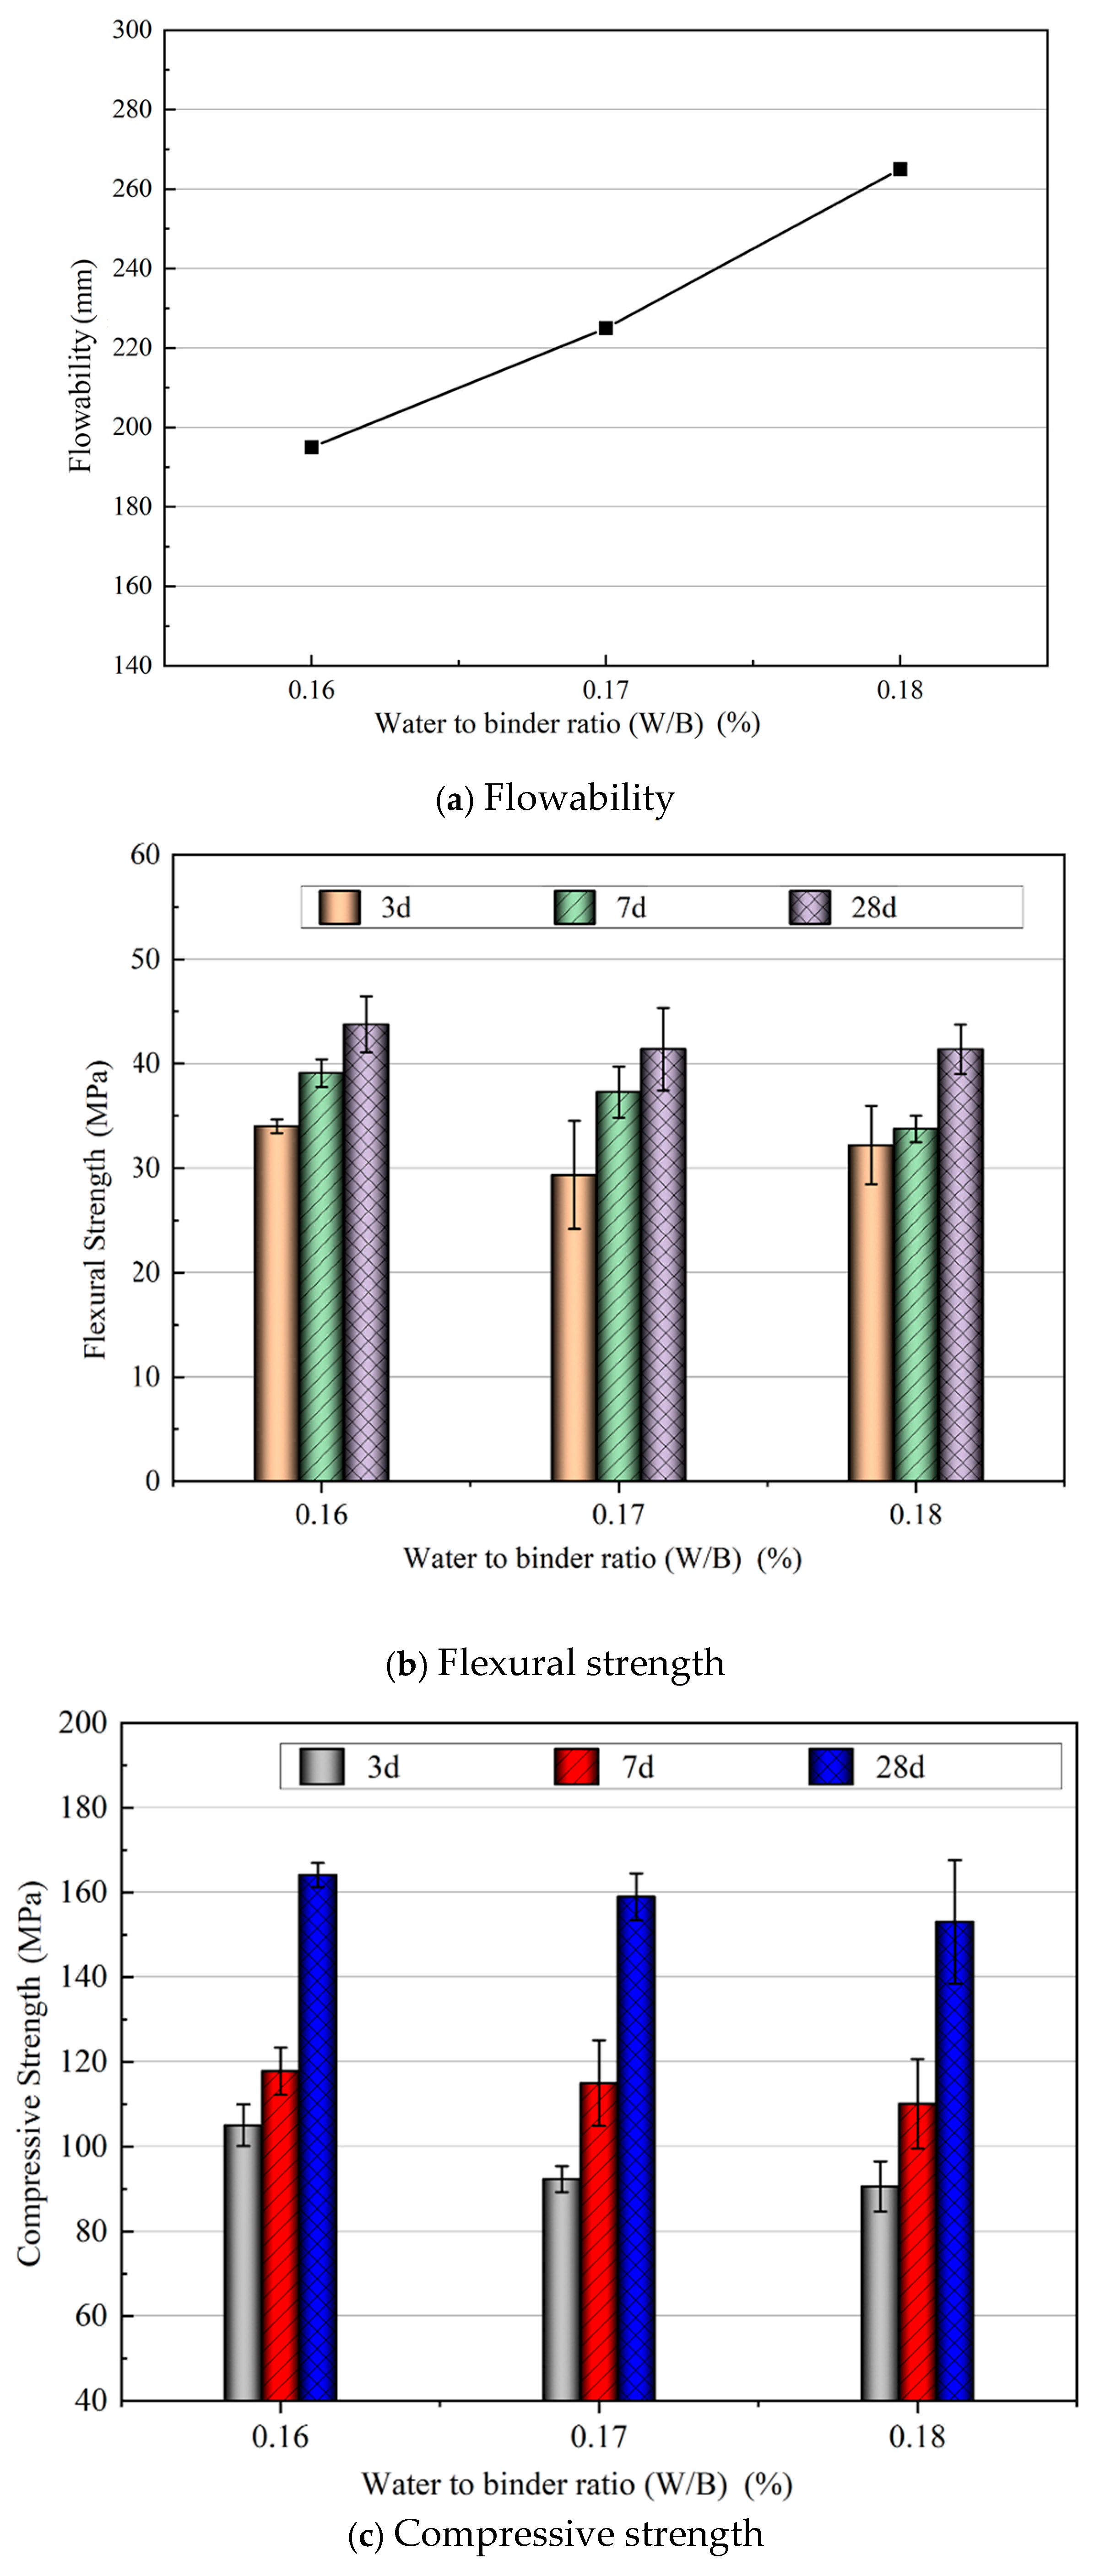
When SP/CM was 0.8%, the flowability and the 28 d compressive strength of the GUHPC mixture were the largest, and thus, the SP/CM of 0.8% was selected. With increases in the water–binder ratio, the flowability of the GUHPC increased and the flexural and compressive strength decreased. For a water–binder ratio of 0.16, 0.17 and 0.18, the flowability was higher than 180 mm. Thus, the water–binder ratio of 0.16 was selected.
(2)
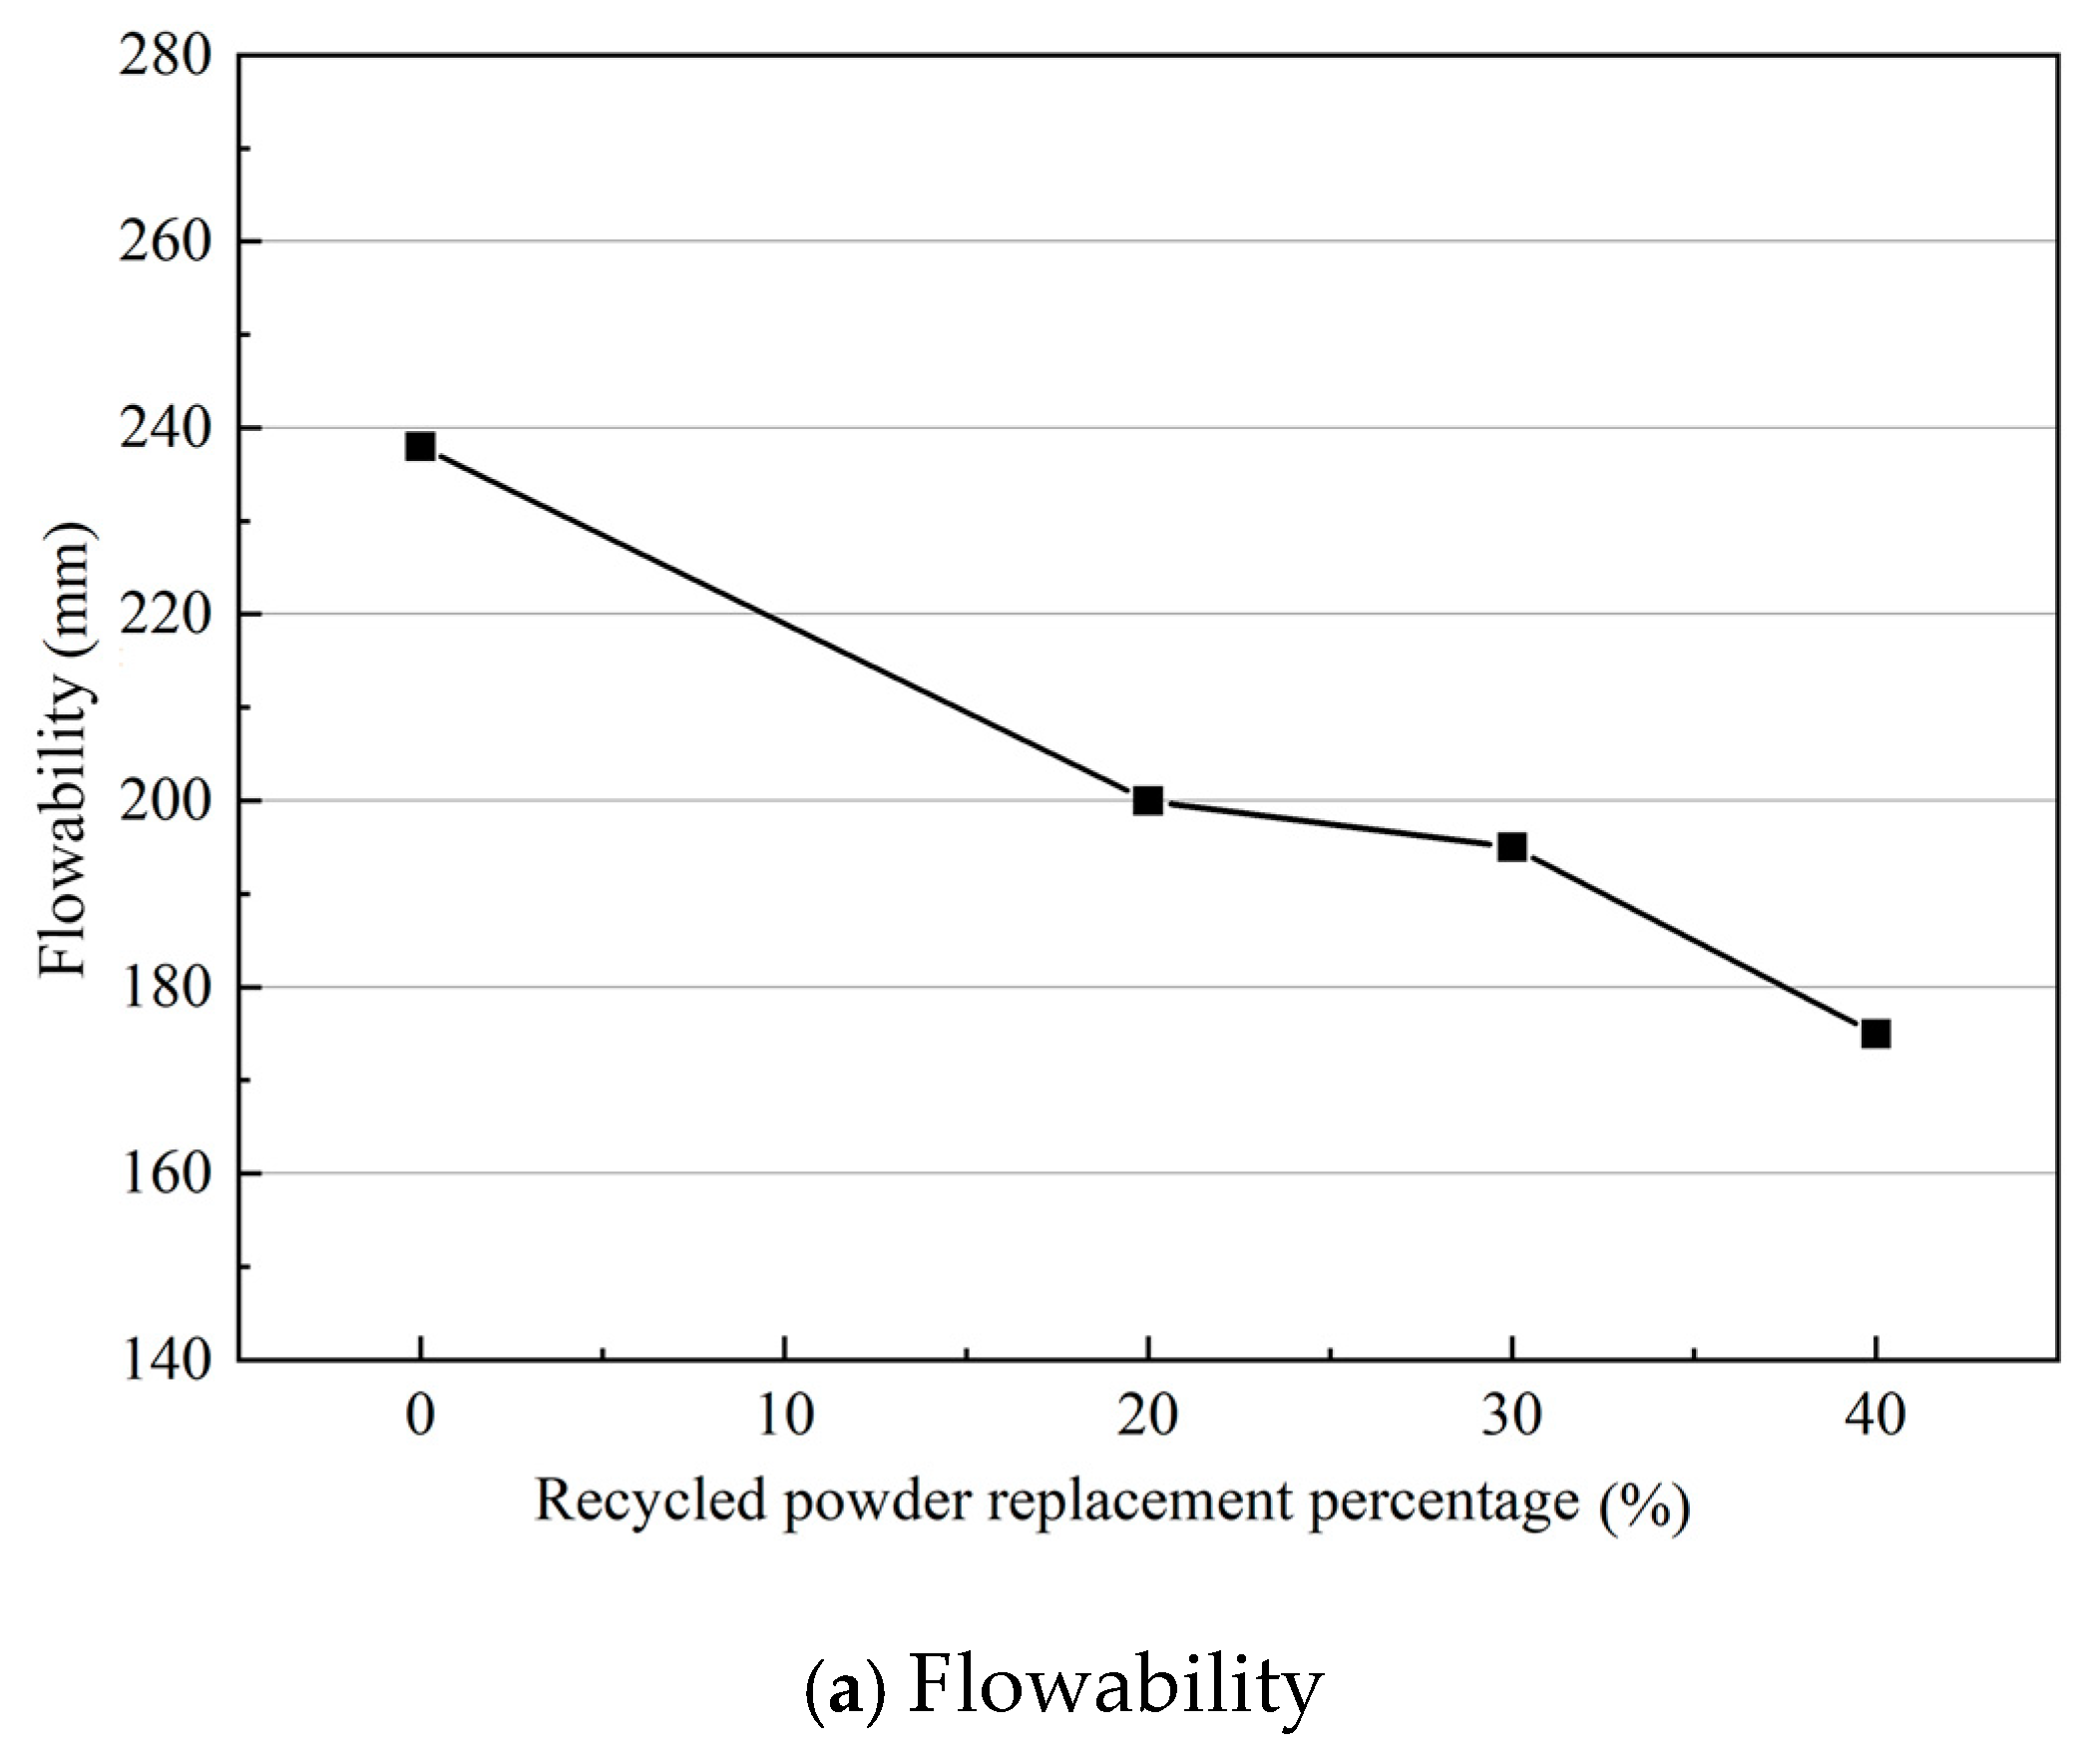
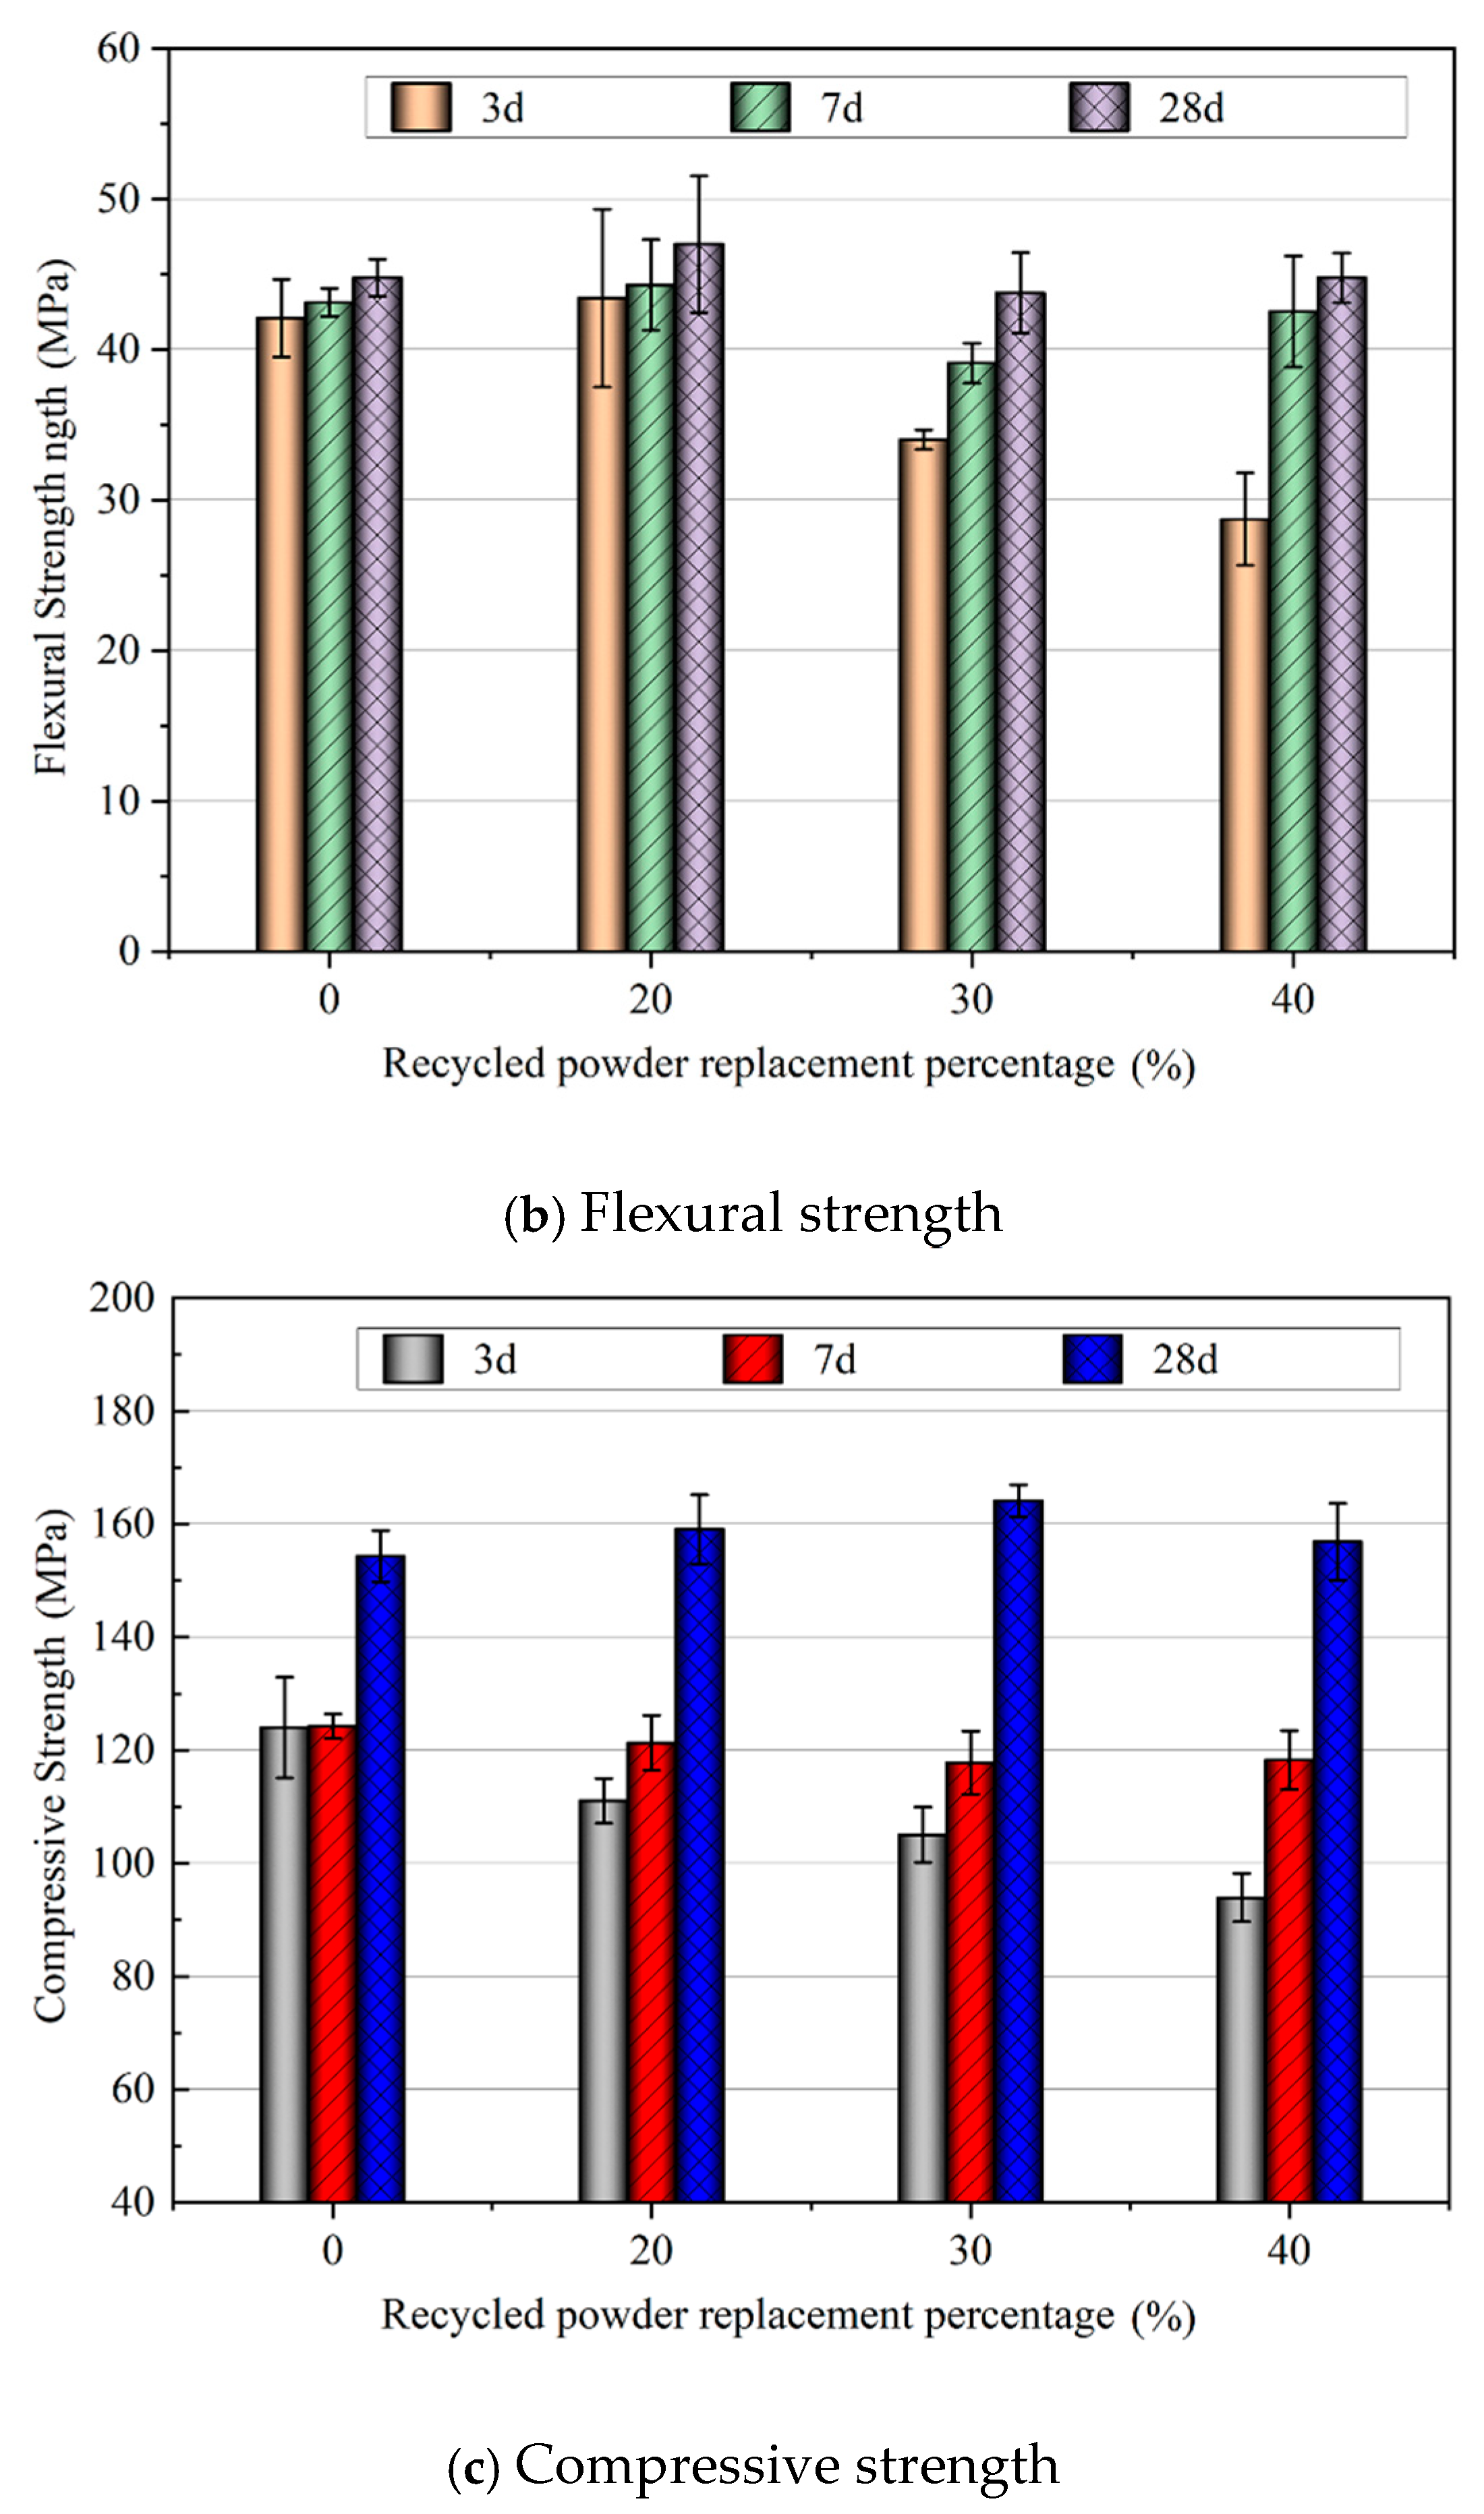
With increases in RP, the flowability of the GUHPC decreased, the 3 d and 7 d flexural strength increased first and then decreased, the 28 d flexural strength changed little, the 3 d and 7 d compressive strength decreased, and the 28 d compressive strength increased first and then decreased. The 28 d compressive strength of the GUHPC with an RP replacement rate of 30% was the highest.
(3)
With increases in the RP, the relative strength at each age increased, indicating that RP can enhance the contribution of cement to the strength of GUHPC. With increases in age, the relative strength of the different RP substitutes increased, indicating that the enhancement effect of RP increased with increases in age. The comprehensive contribution rate of the RP gradually increased with increases in RP and age. Based on the comprehensive analysis and also the performance of the concrete, an RP replacement rate of 30% is selected.
(4)
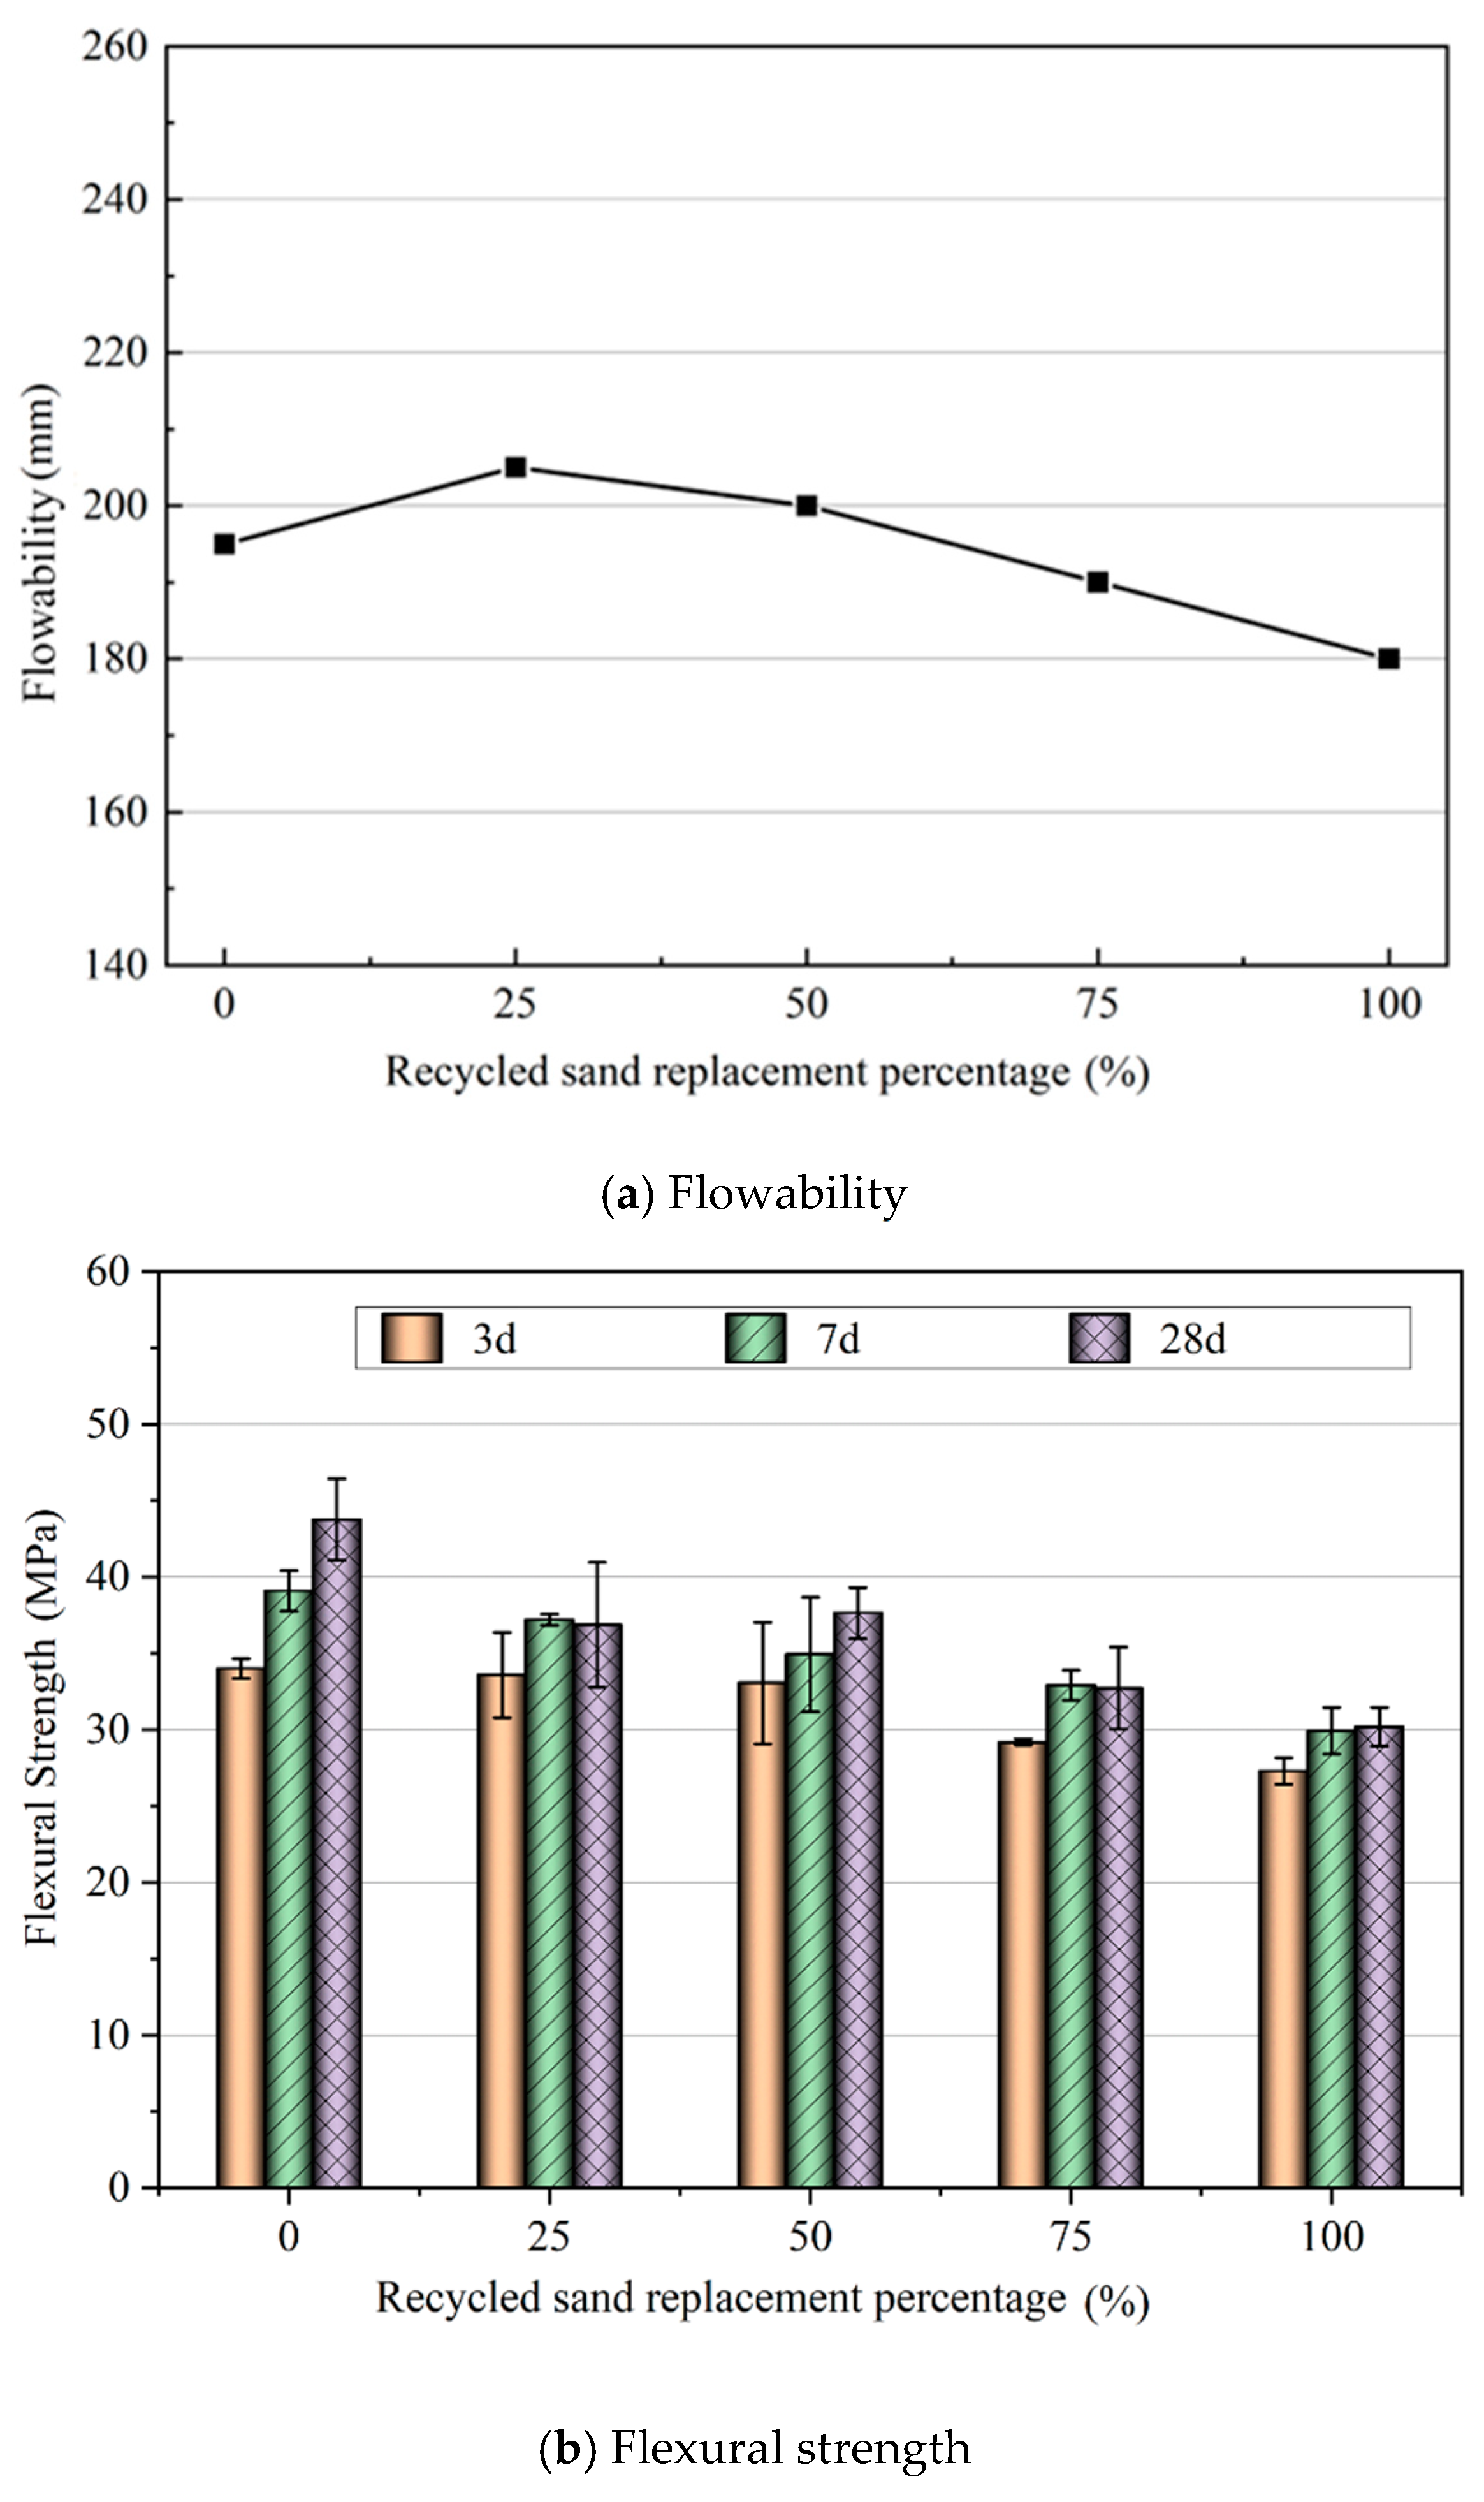
With increases in RS, the flowability of the GUHPC first increased and then decreased, and the flexural strength and compressive strength at each age decreased. With increases in RS, the f:c at 3 d of age increased, the f:c at 7 d of age had no significant change, and the f:c at 28 d of age first increased and then decreased. Considering the flowability, strength and toughness of GUHPC, the RS replacement rate of 50% was selected.
(5)
GUHPC can be produced by using RP and RS simultaneously with standard curing instead of steam curing. The optimal mix proportion was determined considering the flowability, mechanical properties and substitution rate of RP and RS. Furthermore, the proportion design method for GUHPC with RP and RS based on the revised Dinger–Funk model was also verified.

Author Contributions

Conceptualization, P.Z.; methodology, P.Z.; software, S.D.; validation, P.H.; formal analysis, P.H. and S.Z.; investigation, S.D.; resources, Y.W.; data curation, Y.W.; writing—original draft preparation, P.H. and S.D.; writing—review and editing, P.Z.; visualization, S.D.; supervision, S.Z.; project administration, P.Z.; funding acquisition, P.Z. and L.Z. All authors have read and agreed to the published version of the manuscript.

Funding

The research was supported by National Key R&D Program of China (2022YFC3801100) and the National Science Foundation of China (51208373).

Institutional Review Board Statement

Not applicable.

Informed Consent Statement

Not applicable.

Data Availability Statement

The data used to support the findings of this study are available from the corresponding author upon request.

Conflicts of Interest

The authors declare no conflicts of interest.

References

  1. Zhu, P.; Mao, X.Q.; Qu, W.J.; Li, Z.Y.; Ma, Z.J. Investigation of using recycled powder from waste of clay bricks and cement solids in reactive powder concrete. Constr. Build. Mater. 2016, 30, 246–254. [Google Scholar]
  2. Xue, C.; Shen, A.; Guo, Y. Utilization of construction waste composite powder materials as cementitious materials in small-scale prefabricated concrete. Adv. Mater. Sci. Eng. 2016, 2016, 8947935. [Google Scholar] [CrossRef]
  3. Janotka, I.; Martauz, P.; Bačuvčík, M. Design of concrete made with recycled brick waste and its environmental performance. Minerals 2021, 11, 463. [Google Scholar] [CrossRef]
  4. Zhu, P.; Mao, X.Q.; Qu, W.J. Investigation of recycled powder as supplementary cementitious material. Mag. Concr. Res. 2019, 71, 1312–1324. [Google Scholar]
  5. Mao, X.Q.; Qu, W.J.; Zhu, P. Mixture optimization of green reactive powder concrete with recycled powder. J. Mater. Civ. Eng. 2019, 31, 1–11. [Google Scholar] [CrossRef]
  6. Mao, X.Q.; Qu, W.J.; Zhu, P.; Xiao, J.Z. Influence of recycled powder on chloride penetration resistance of green reactive powder concrete. Constr. Build. Mater. 2020, 251, 119049. [Google Scholar] [CrossRef]
  7. Cantero, B.; Bravo, M.; De Brito, J. Thermal performance of concrete with recycled concrete powder as partial cement replacement and recycled CDW aggregate. Appl. Sci. 2020, 10, 4540. [Google Scholar] [CrossRef]
  8. Mohamed, A.; Ibrahim, Y.H.; Abdullah, M.Z.; Bassam, A.T.; Ahmed, M.M.; Ibrahim, S.A. Influence of recycled aggregates and carbon nanofibres onproperties of ultra-high-performance concrete under elevated temperatures. Case Stud. Constr. Mater. 2022, 16, e01063. [Google Scholar]
  9. Zhou, Y.W.; Guo, D.C. Multiscale mechanical characteristics of ultra-high-performance concrete incorporating different particle size ranges of recycled fine aggregate. Constr. Build. Mater. 2021, 30, 246–254. [Google Scholar]
  10. Ma, Z.; Liu, X.; Hu, R. Using recycled aggregate and powder from high-strength mortar waste for durable cement-based materials: Microstructure and chloride transport. J. Clean. Prod. 2023, 417, 137998. [Google Scholar]
  11. Salahuddin, H.; Qureshi, L.A.; Nawaz, A. Elevated temperature performance of reactive powder concrete containing recycled fine aggregates. Materials 2020, 13, 3748. [Google Scholar] [CrossRef] [PubMed]
  12. Yu, L.; Wu, R. Using graphene oxide to improve the properties of ultra-high-performance concrete with fine recycled aggregate. Constr. Build. Mater. 2020, 259, 120657. [Google Scholar] [CrossRef]
  13. Chu, H.; Zhang, Y.; Wang, F. Effect of graphene oxide on mechanical properties and durability of ultra-high-performance concrete prepared from recycled sand. Nanomaterials 2020, 10, 1718. [Google Scholar] [CrossRef] [PubMed]
  14. Mao, X.Q. Study on Green Reactive Powder Concrete (GRPC). Ph.D. Thesis, Tongji University, Shanghai, China, 2019. [Google Scholar]
  15. Dinger, D.R.; Funk, J.E. Particle-packing phenomena and their application in materials processing. MRS Bull. 1997, 22, 19–23. [Google Scholar] [CrossRef]
  16. Funk, J.E.; Dinger, D.R. Predictive Process Control of Crowded Particulate Suspensions: Applied to Ceramic Manufacturing; Springer: Boston, MA, USA, 2013. [Google Scholar]
  17. Martin, H. An integral Design Concept for Ecological Self-Compacting Concrete. Ph.D. Thesis, Technische Universiteit Eindhoven, Eindhoven, The Netherlands, 2010. [Google Scholar]
  18. Yu, Q.L.; Spiesz, P.; Brouwers, H.J.H. Development of cement-based lightweight composites—Part 1: Mix design methodology and hardened properties. Cem. Concr. Compos. 2013, 44, 17–29. [Google Scholar] [CrossRef]
  19. Yu, R.; Spiesz, P.; Brouwers, H.J.H. Mix design and properties assessment of ultra-high performance fibre reinforced concrete (UHPFRC). Cem. Concr. Res. 2014, 56, 29–39. [Google Scholar] [CrossRef]
  20. GB 175-2007; PRC National Standard. General Purpose Portland Cement. Standards Press of China: Beijing, China, 2008.
  21. Wang, X.; Yu, R.; Shui, Z. Optimized treatment of recycled construction and demolition waste in developing sustainable ultra-high-performance concrete. J. Clean. Prod. 2019, 221, 805–816. [Google Scholar]
  22. Ahmet, F.Ş.; Cenk, K. High-strength self-compacting concrete produced with recycled clay brick powders: Rheological, mechanical and microstructural properties. J. Build. Eng. 2024, 88, 109175. [Google Scholar]
  23. Heikal, M.; Zohdy, K.M.; Abdelkreem, M. Mechanical, microstructure and theological characteristics of high performance self-compacting cement pastes and concrete containing ground clay bricks. Constr. Build. Mater. 2013, 38, 101–109. [Google Scholar]
  24. Pu, X.C. Ultra-High-Performance Concrete; Chongqing University Press: Chongqing, China, 2004. [Google Scholar]
  25. Salahuddin, H.; Qureshi, L.A.; Nawaz, A. Effect of recycled fine aggregates on performance of Reactive Powder Concrete. Constr. Build. Mater. 2020, 243, 118223. [Google Scholar] [CrossRef]
Figure 1. Different RPs.
Buildings 15 01048 g001
Figure 2. Microscopic image of NS [14].
Buildings 15 01048 g002
Figure 3. Microscopic image of RS [12].
Buildings 15 01048 g003
Figure 4. Particle size distribution curve of each raw material.
Buildings 15 01048 g004
Figure 5. Particle size distribution curves of each component: (a) SF; (b) CM; (c) RP; (d) NS; (e) RS.
Buildings 15 01048 g005aBuildings 15 01048 g005b
Figure 6. The results of the mix proportion design.
Buildings 15 01048 g006
Figure 7. Setup for the flexural strength test.
Buildings 15 01048 g007
Figure 8. Setup for the compressive strength test.
Buildings 15 01048 g008
Figure 9. Flowability, flexural and compressive strength versus superplasticizer proportion.
Buildings 15 01048 g009aBuildings 15 01048 g009b
Figure 10. Flowability, flexural and compressive strength versus water to binder ratio.
Buildings 15 01048 g010
Figure 11. Flowability, flexural and compressive strength versus recycled power replacement rate in GUHPC.
Buildings 15 01048 g011aBuildings 15 01048 g011b
Figure 12. Relative strength versus RP replacement rate in GUHPC at different ages.
Buildings 15 01048 g012
Figure 13. Comprehensive contribution rate versus RP replacement rate in GUHPC.
Buildings 15 01048 g013
Figure 14. Flowability, flexural and compressive strength versus RS replacement rate in GUHPC.
Buildings 15 01048 g014aBuildings 15 01048 g014b
Figure 15. f:c versus RS replacement rate at each age.
Buildings 15 01048 g015
Table 1. The main chemical composition of cement and admixtures.
ComponentSiO2
(%)
Al2O3
(%)
Fe2O3
(%)
CaO
(%)
Mg
(%)
Na2O
(%)
K2O
(%)
SO3
(%)
CM15.406.054.3264.471.250.111.222.01
RP59.7416.906.938.471.821.292.211.37
SF92.400.870.100.431.560.080.33-
Note: Cement (CM), Silica fume (SF).
Table 2. Physical properties of cement.
Density (kg/m3)LOI
(%)
Fineness (%) Specific Surface Area (m2/kg)Initial Setting TimeFinal Setting TimeFlexural Strength
(MPa)
Compressive Strength
(MPa)
(min)(min)3d28d3d28d
31803.026.183572032505.97.727.445.0
Table 3. Physical properties of silica fume.
Density
(kg/m3)
LOI
(%)
Fineness
(%)
Specific Surface Area
(m2/kg)
Water Content (%)Water Demand Ratio
(%)
Activity Index(%)
22003.122.3418,9000.67114121
Table 4. Parameters of different RPs.
Raw MaterialMilling Time (min)Power Consumption (kwh/kg)Fineness
(%)
Density
(g/cm3)
CM--6.183.18
BP300.1514.91-
BP600.306.672.58
CP900.4522.542.51
RP (BP:CP = 7:3)900.456.842.56
RP (BP:CP = 7:3) [14]--6.772.60
Table 5. Grain gradation of NS and RS.
Screen Size (mm)Cumulative Screening Margin (%)
RSNS
9.500.00.0
4.750.00.0
2.360.00.0
1.1840.71.7
0.6058.542.3
0.3083.993.2
0.1592.099.0
Table 6. Physical characteristics of NS and RS.
Fine AggregateNSRS
Grain size (mm)0.08–1.180.08–2.36
Apparent density (kg/m3)25502528
Bulk density (kg/m3)15821250
Loose density (kg/m3)13531105
Fineness modulus2.362.75
Porosity (%)4050
Water absorption (%)0.811.8
Table 7. Performance parameters of STF.
Length
(mm)
Diameter
(mm)
Length Diameter RatioTensile Strength (MPa)Quantity of Fiber per Gram
140.2265≥2000230
Table 8. Main performance indicators of polycarboxylic acid superplasticizer.
Performance IndexValue
Solid content (%)50.26
pH value6.5 ± 1.0
Density (g/cm3, 22 °C)1.10 ± 0.05
Viscosity (cP, 22 °C)<2000
Water-reducing rate (%)30.0
Flowability (mm)290
Chlorine ion content (%)0.05
Total alkali content (%)2.0
Table 9. The results of the mix proportion design (RP + NS).
CompositionSFCMRPNS
Volume fraction0.0950.2300.1600.500
Density (kg/m3)2200318025652550
Theoretical mass proportion0.180.640.361.12
Selected mass proportion0.150.700.301.00
Table 10. The results of the mix proportion design (RP + RS).
CompositionSFCMRPNSRS
Volume fraction0.0610.2390.1500.2500.300
Density (kg/m3)22003180256525502528
Theoretical mass proportion0.120.660.340.560.66
Selected mass proportion0.150.700.300.500.50
Note: RP + NS refers to mixture with RP and only NS as fine aggregate. RP + RS refers to mixture with RP and both NS and RS as fine aggregate.
Table 11. Basic mix proportions of GUHPC.
Mix IDW/BWater
kg/m3
SF
kg/m3
CM
kg/m3
RP
kg/m3
NS
kg/m3
RS
kg/m3
STF
kg/m3
RP30 + NS0.1819815070030010000157
RP30 + RS500.18198150700300500500157
Note: RP30 + NS represents that 30% of cement is replaced by RP; RP30 + RS50 represents that 30% of cement is replaced by RP and 50% of NS by RS.
Table 12. Mix proportions of GUHPC with different superplasticizer content.
IDSP0.8SP1.0SP1.2SP1.4
W/B0.180.180.180.18
Water(kg/m3)193193193193
SP/CM(%)0.81.01.21.4
SP(kg/m3)18242935
CM(kg/m3)700700700700
RP(kg/m3)300300300300
SF(kg/m3)150150150150
NS(kg/m3)1000100010001000
STF(kg/m3)157157157157
Note: SP/CM is the mass percentage of the solid content in the superplasticizer to the cementitious materials (CM, RP and SF).
Table 13. Mix proportions of GUHPC with different water–binder ratios.
Mix IDW16W17W18
W/B0.160.170.18
Water(kg/m3)175190198
SP/CM(%)0.80.80.8
SP(kg/m3)181818
Cement(kg/m3)700700700
RP(kg/m3)300300300
SF(kg/m3)150150150
NS(kg/m3)100010001000
STF(kg/m3)157157157
Table 14. Mix proportions of GUHPC with different RP ratios.
Mix (ID)RP0 + NSRP20 + NSRP30 + NSRP40 + NS
W/B0.160.160.160.16
Water(kg/m3)175175175175
SP/CM(%)0.80.80.80.8
SP(kg/m3)18181818
CM(kg/m3)1000800700600
RP(kg/m3)0200300400
SF(kg/m3)150150150150
NS(kg/m3)1000100010001000
STF(kg/m3)157157157157
Table 15. Mix proportions of GUHPC with RS of different contents.
Mix (ID)RP30 + RS25RP30 + RS50RP30 + RS75RP30 + RS100
Water(kg/m3)175175175175
Additional water(kg/m3)19435877
SP/CM(%)1.21.21.41.4
SP(kg/m3)28283232
CM(kg/m3)700700700700
RP(kg/m3)300300300300
SF(kg/m3)150150150150
NS(kg/m3)7505002500
RS(kg/m3)2505007501000
STF(kg/m3)157157157157
Disclaimer/Publisher’s Note: The statements, opinions and data contained in all publications are solely those of the individual author(s) and contributor(s) and not of MDPI and/or the editor(s). MDPI and/or the editor(s) disclaim responsibility for any injury to people or property resulting from any ideas, methods, instructions or products referred to in the content.

