
Shaking Table Tests and Numerical Analysis of a Steel Frame Employing Novel Variable-Coefficient Viscous Dampers

 ,
,
Abstract
1. Introduction
2. Test Set-Up
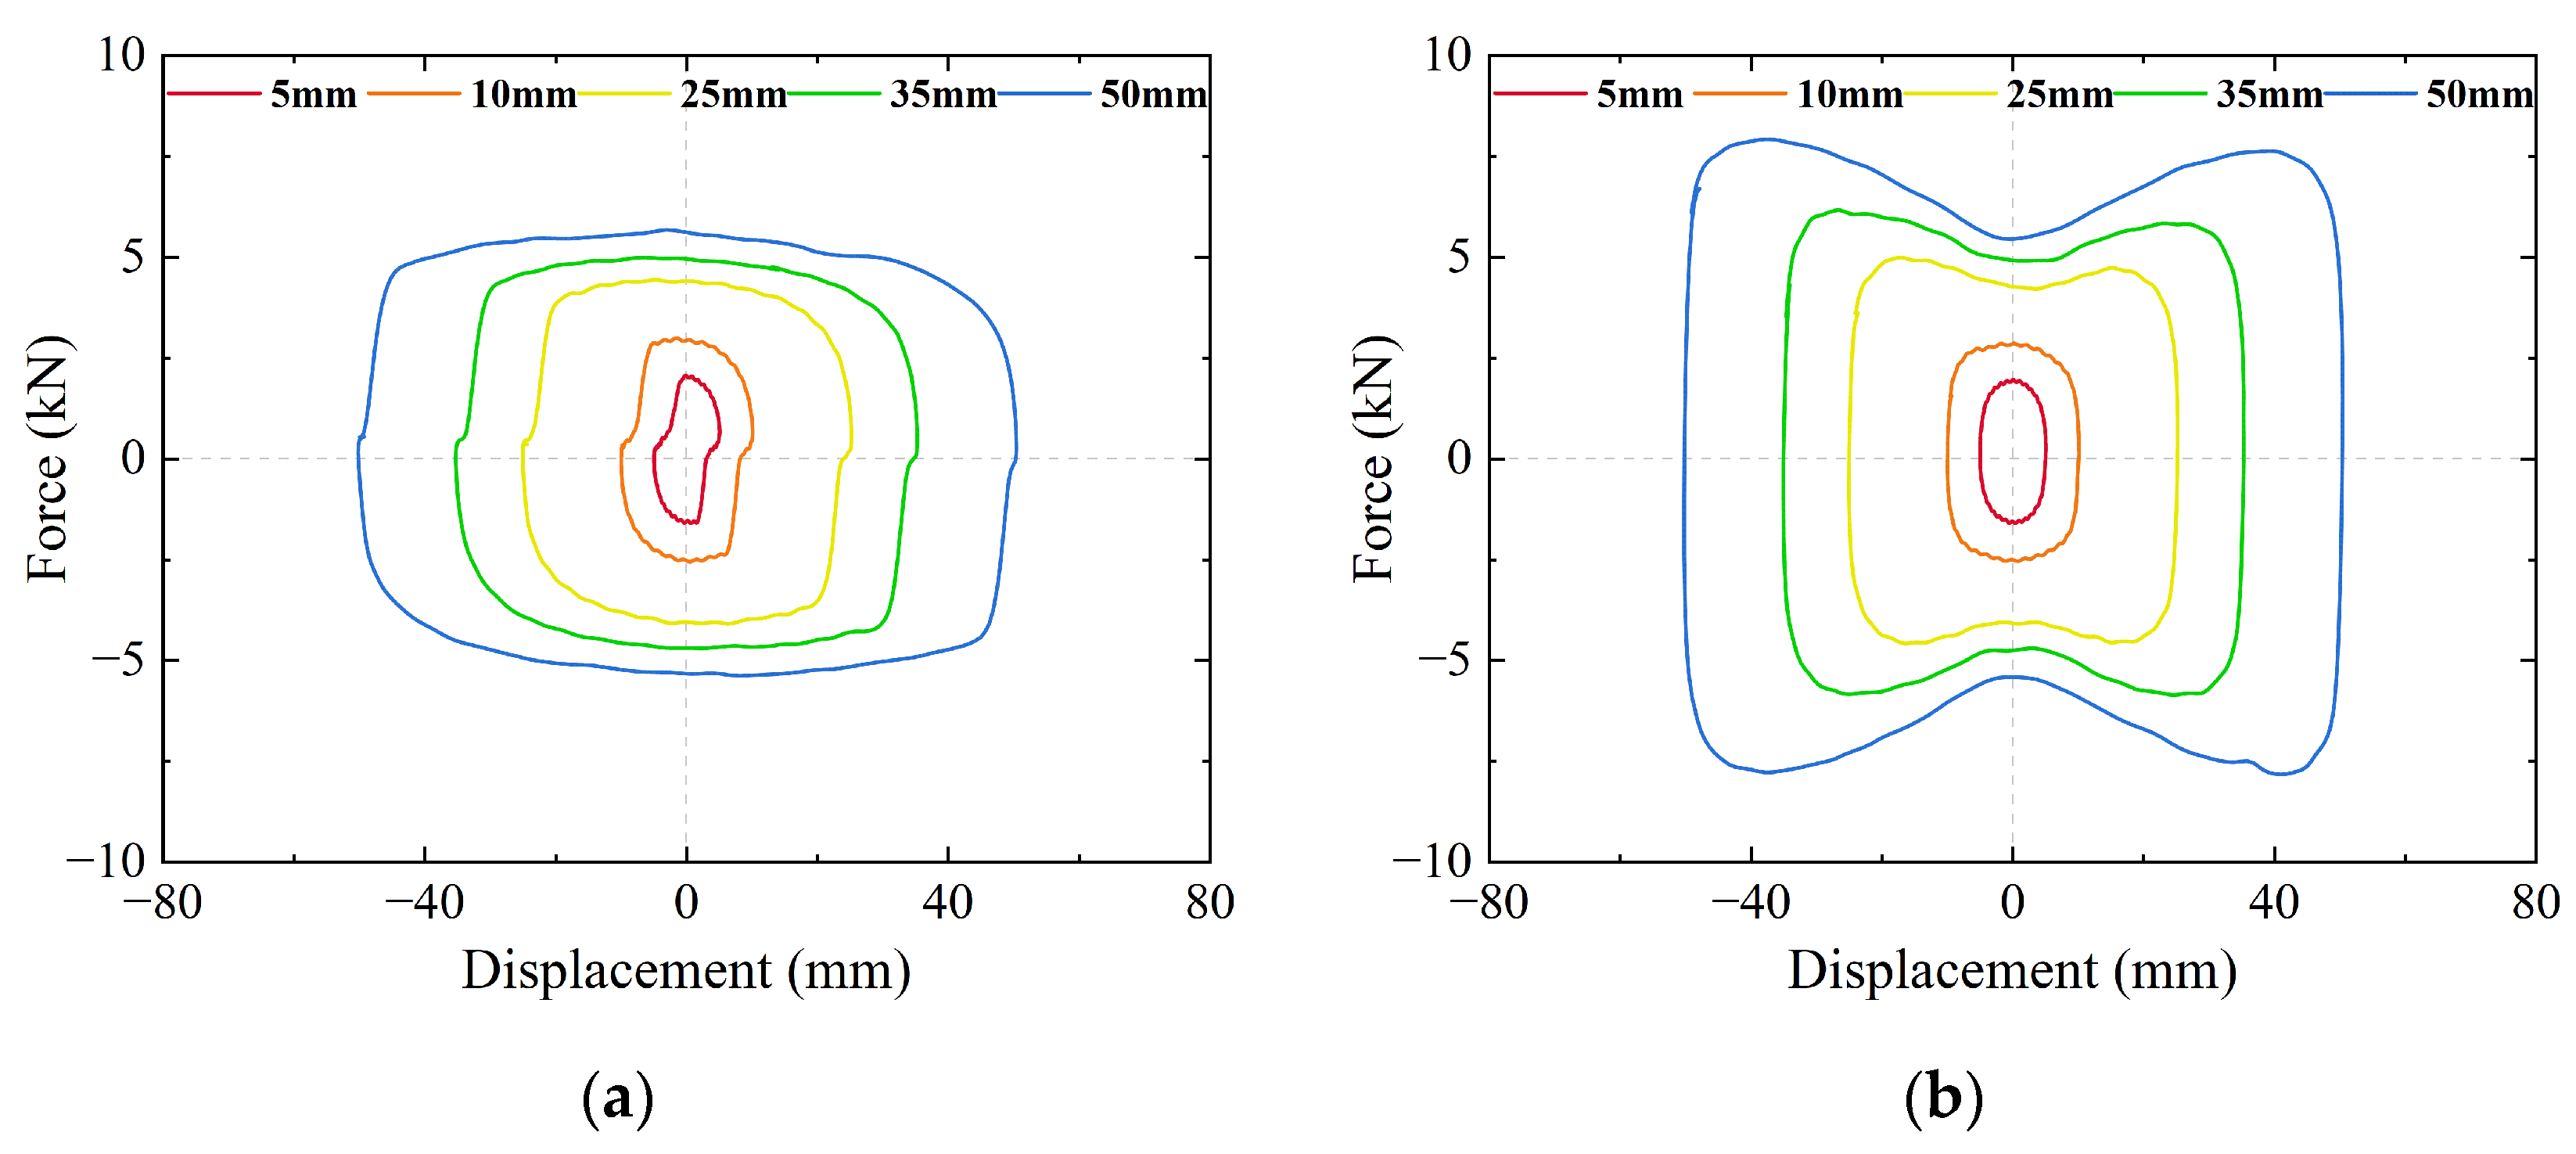
2.1. VD and VVD
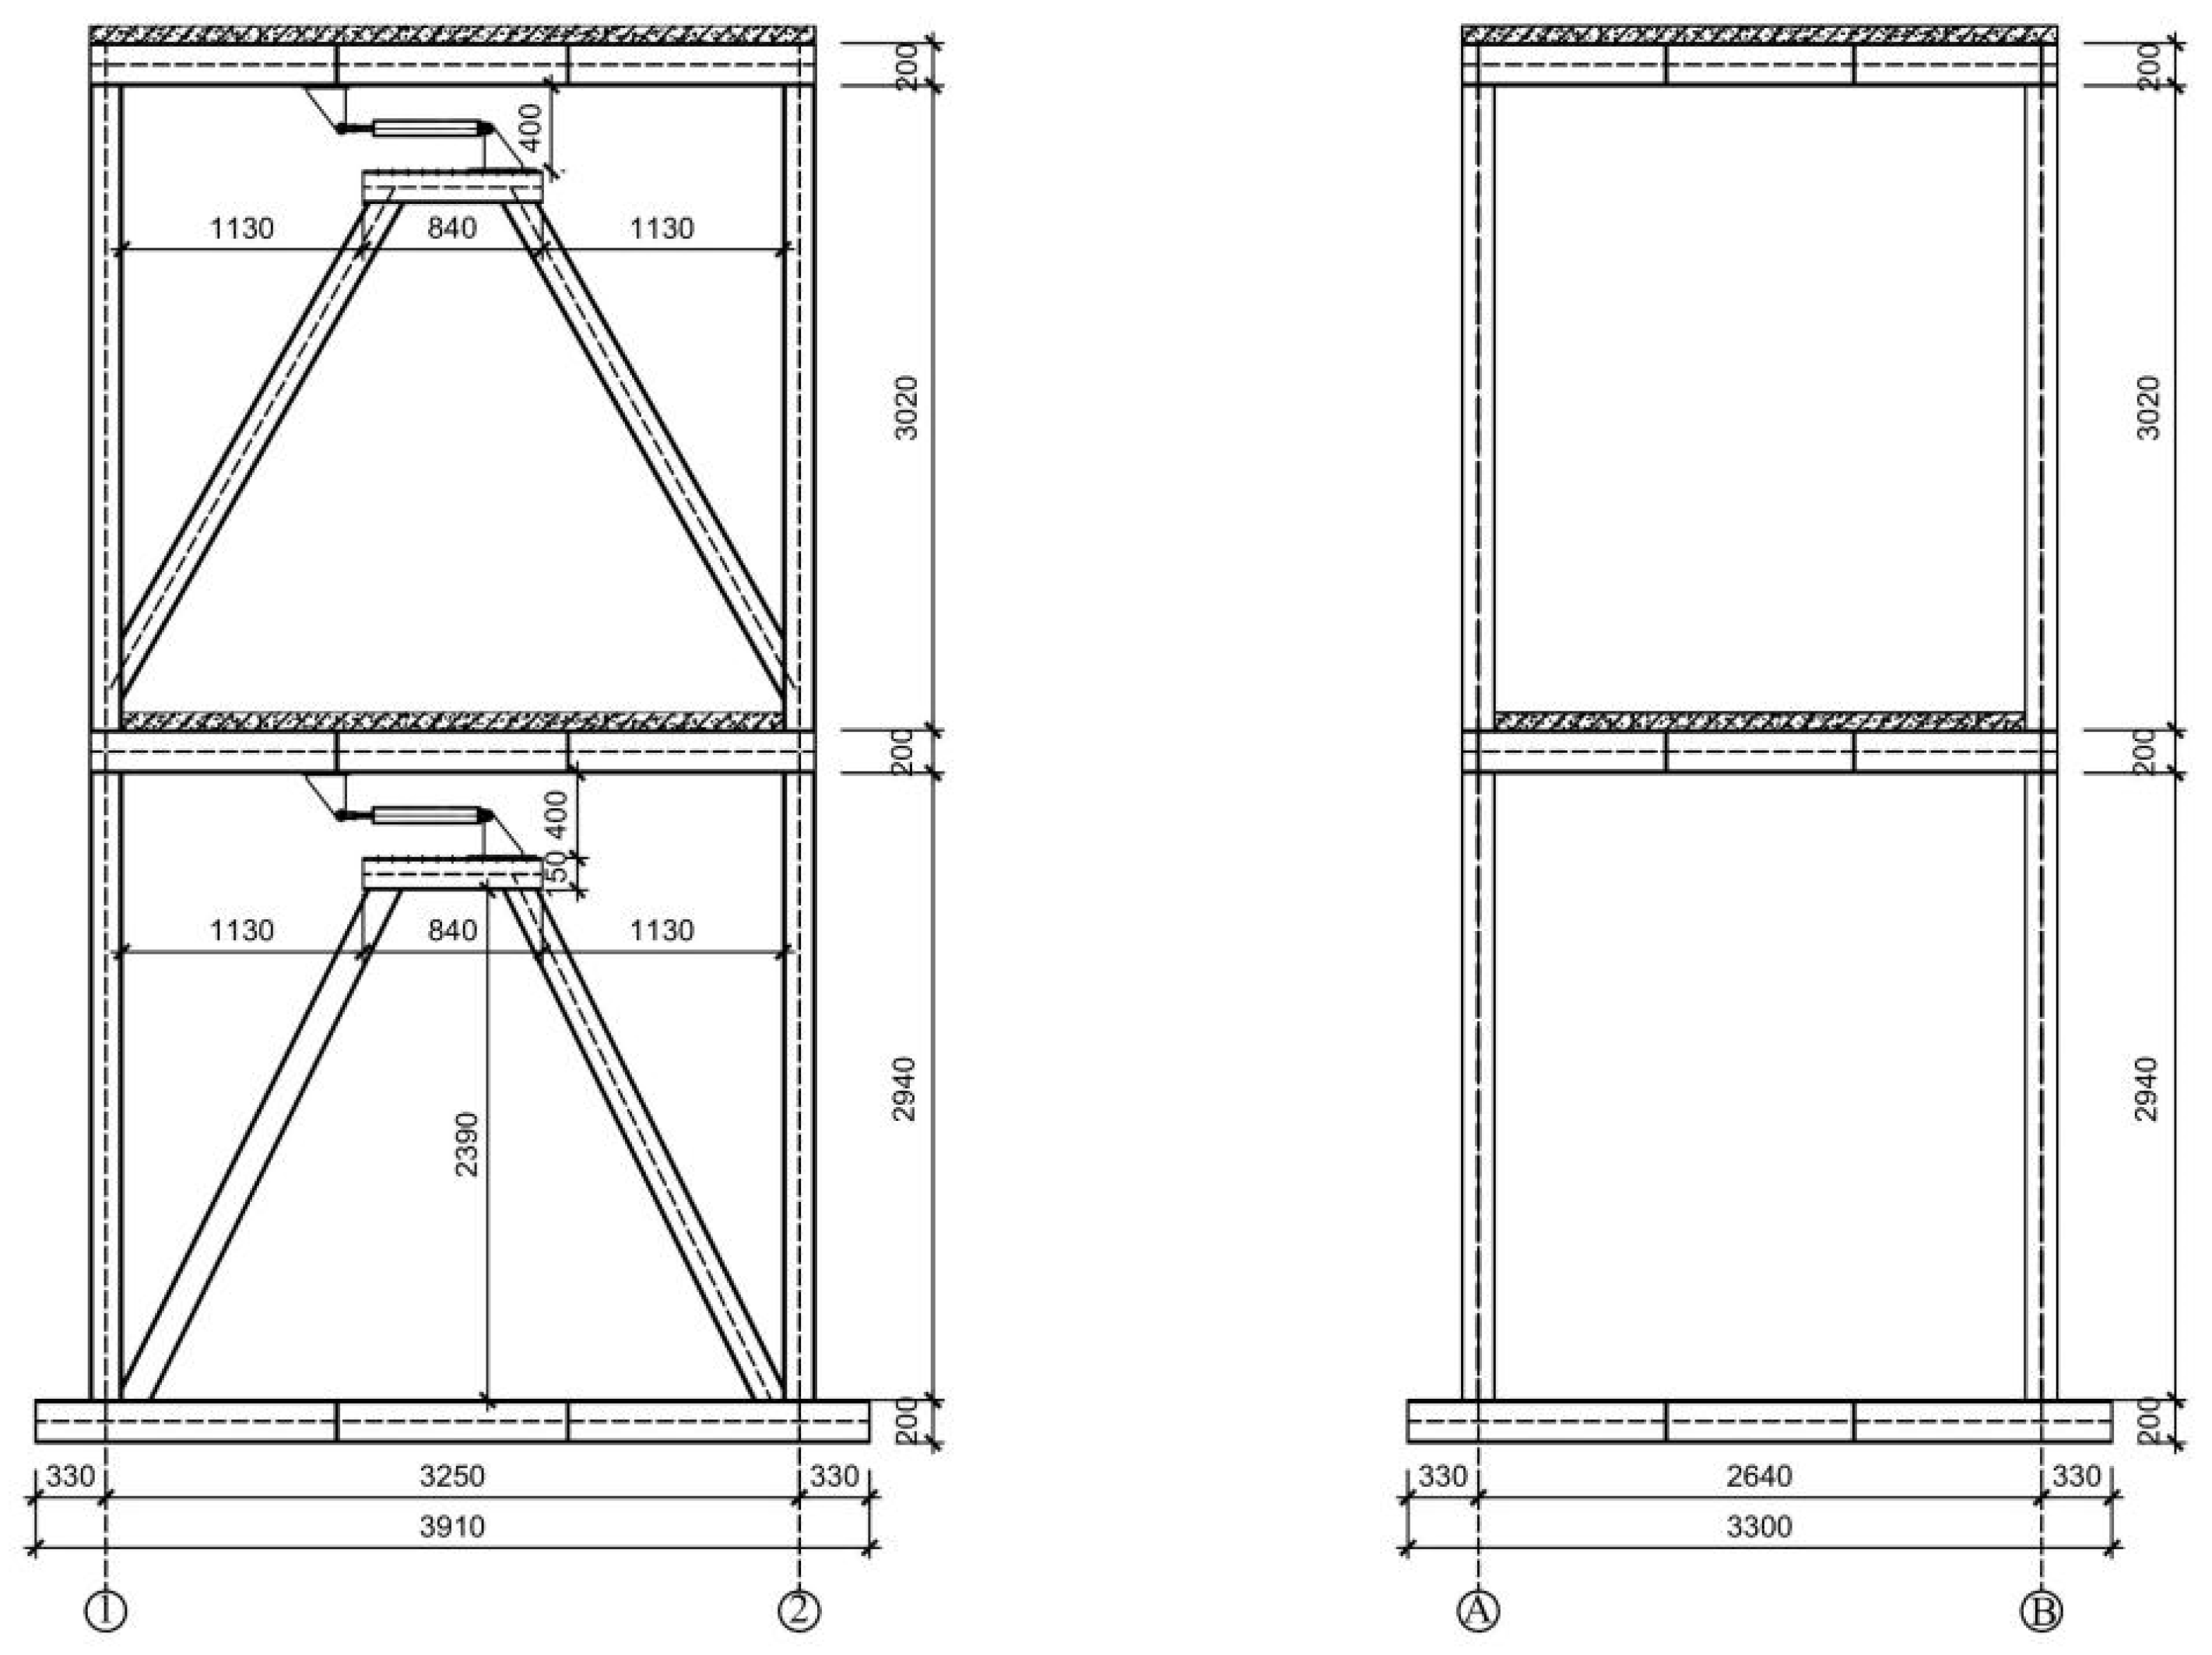
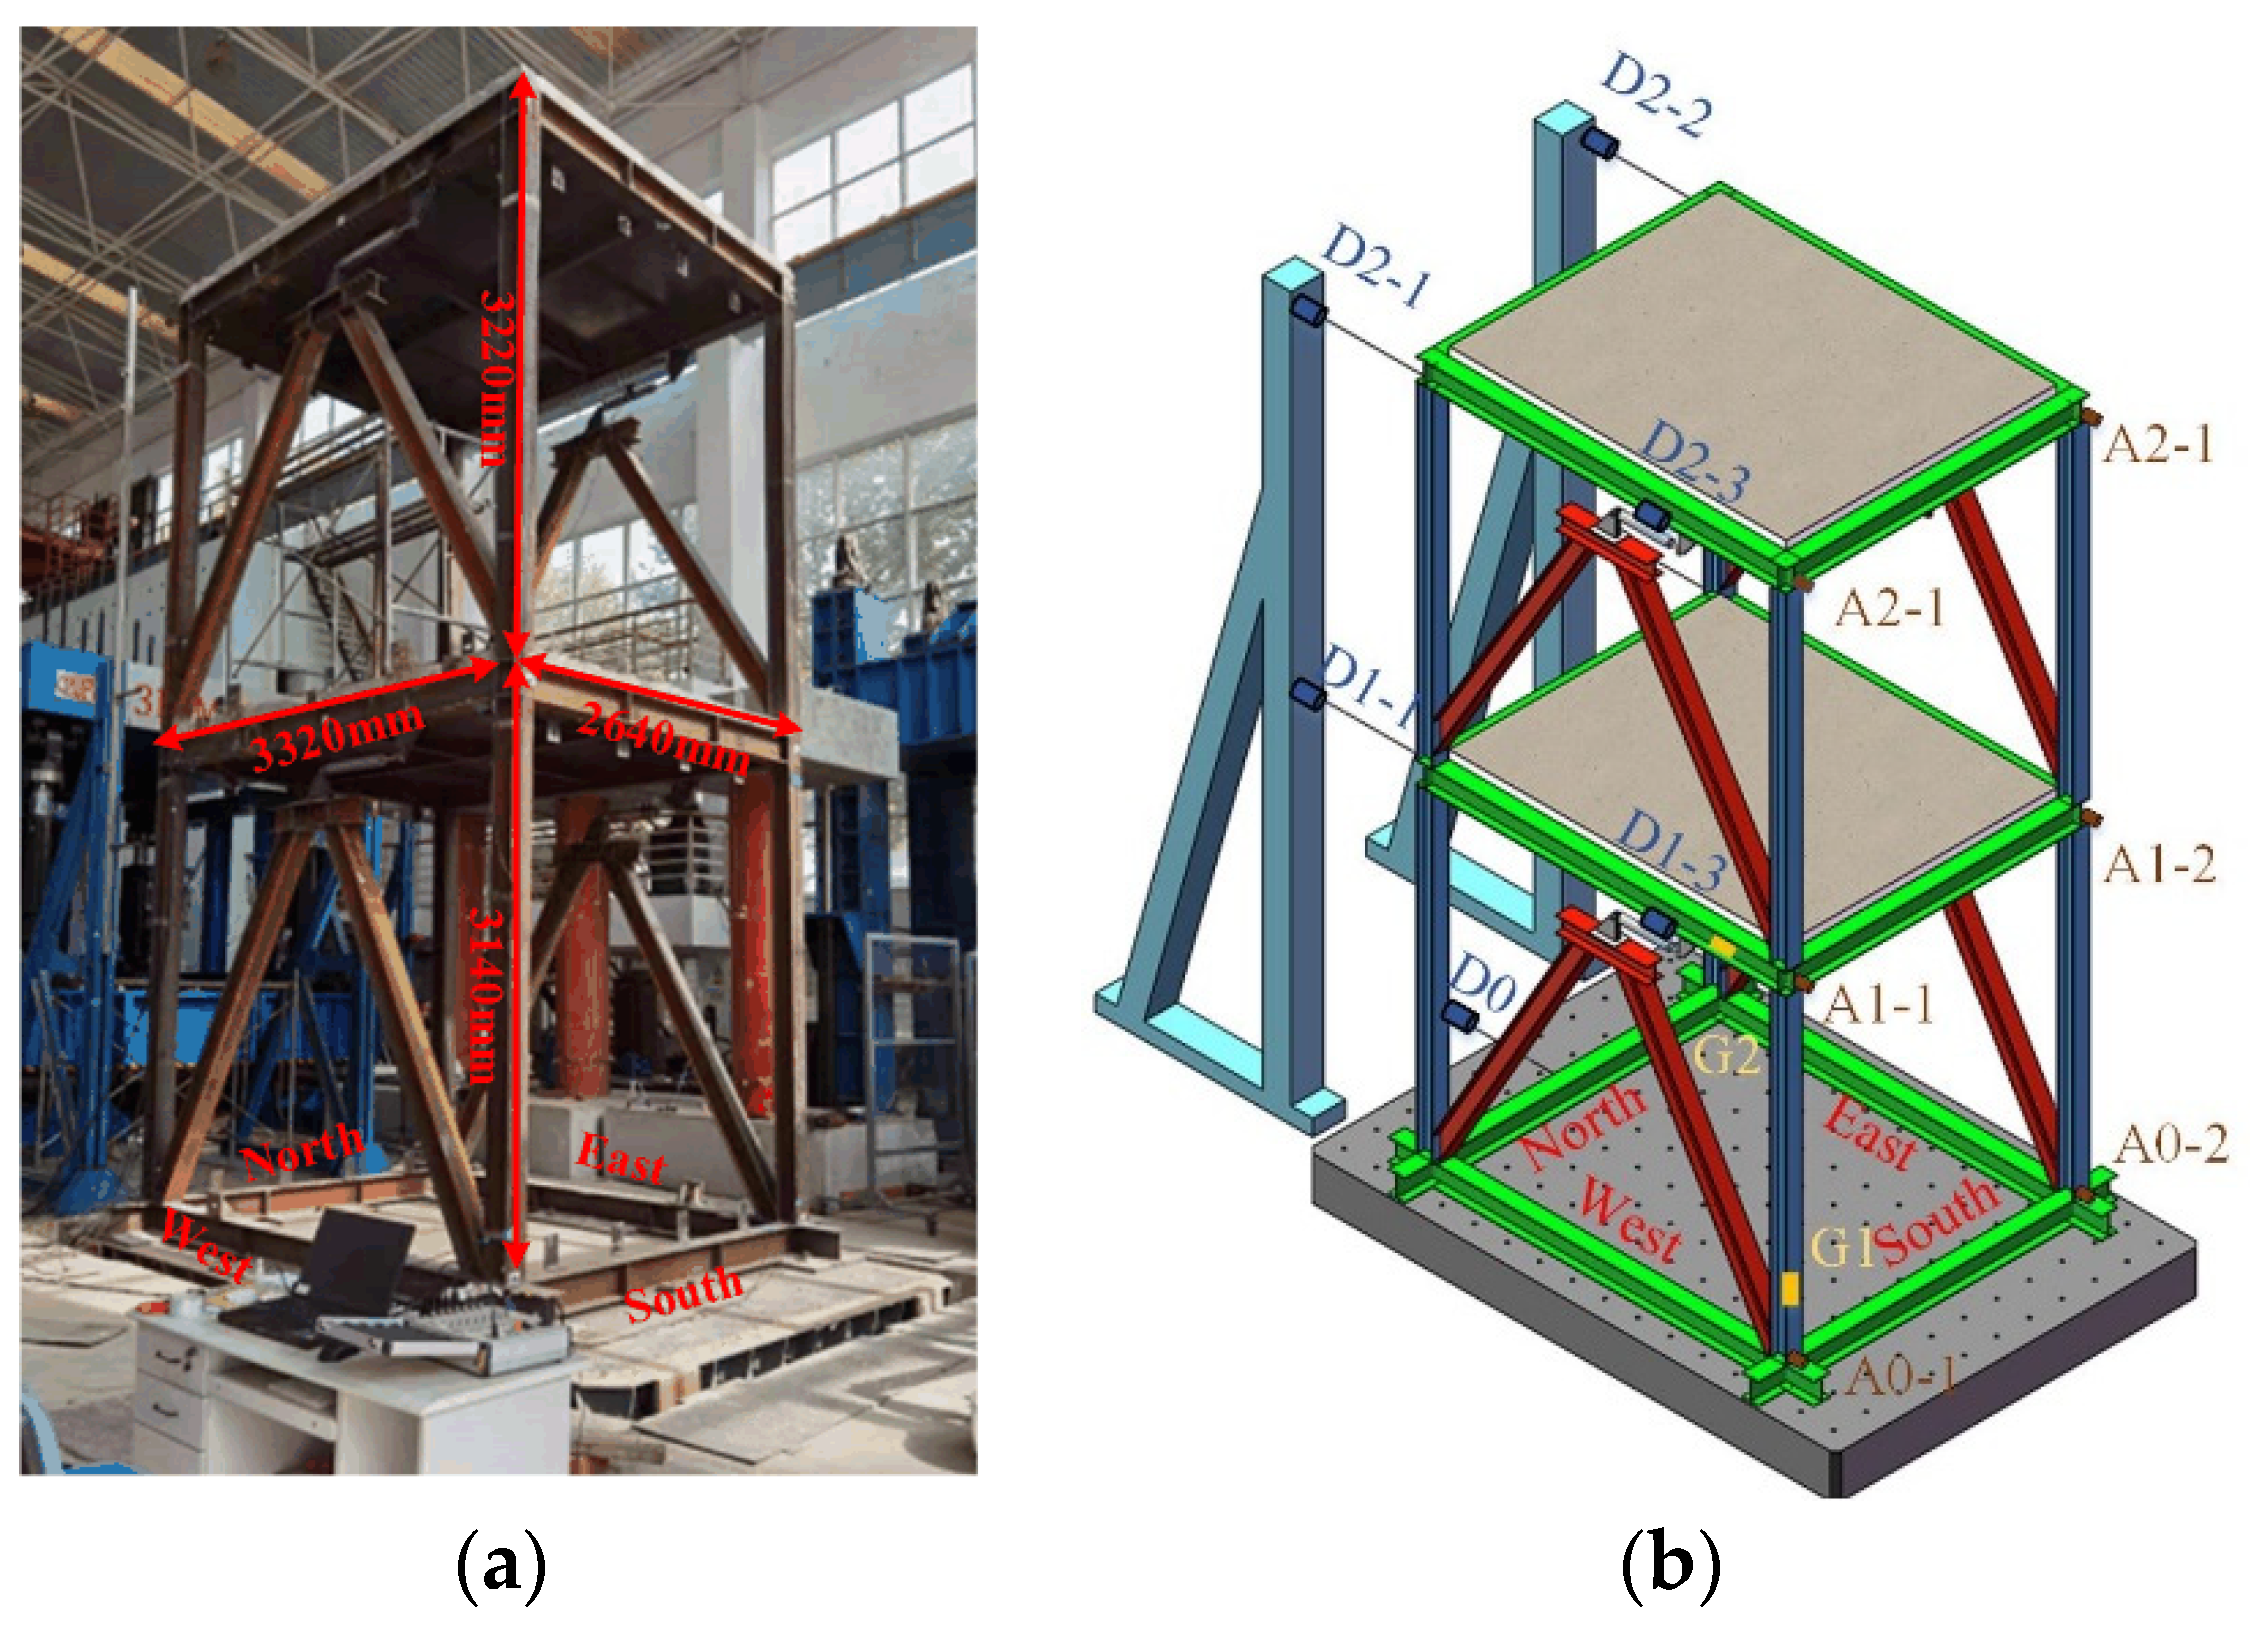
2.2. Test Structure and Instrumentation Arrangement
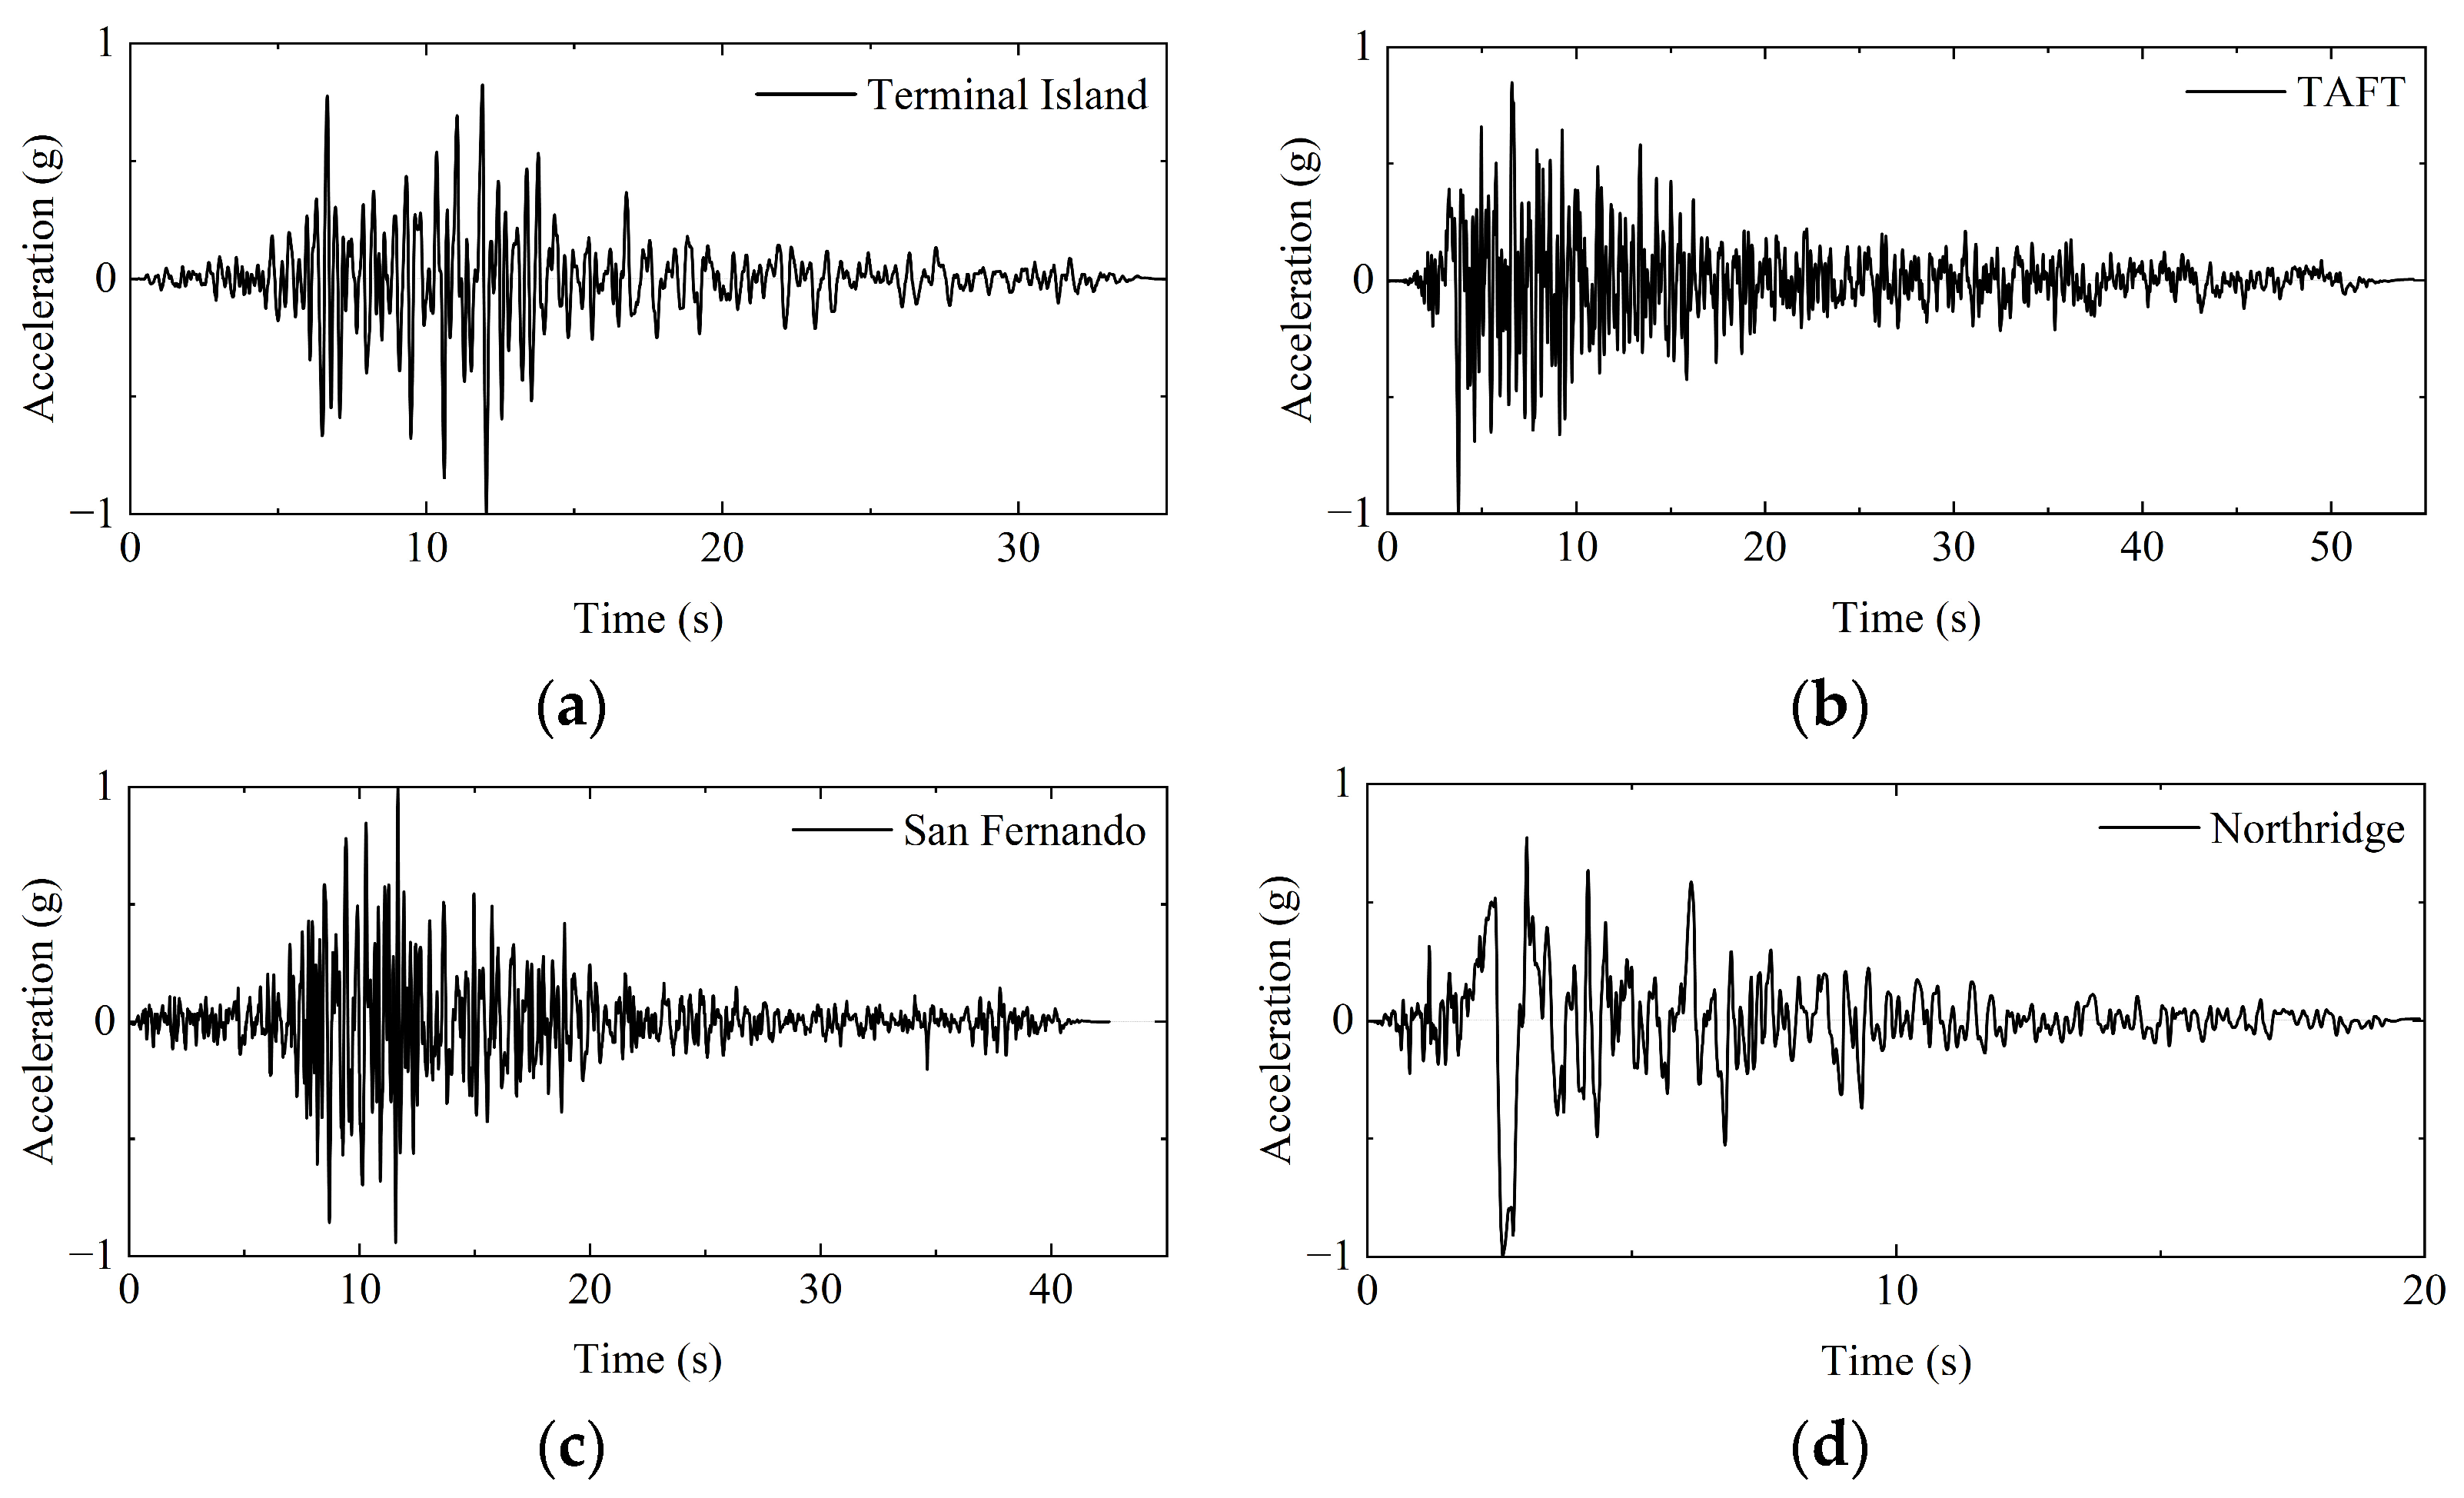
2.3. Test Conditions
3. Test Results and Analysis
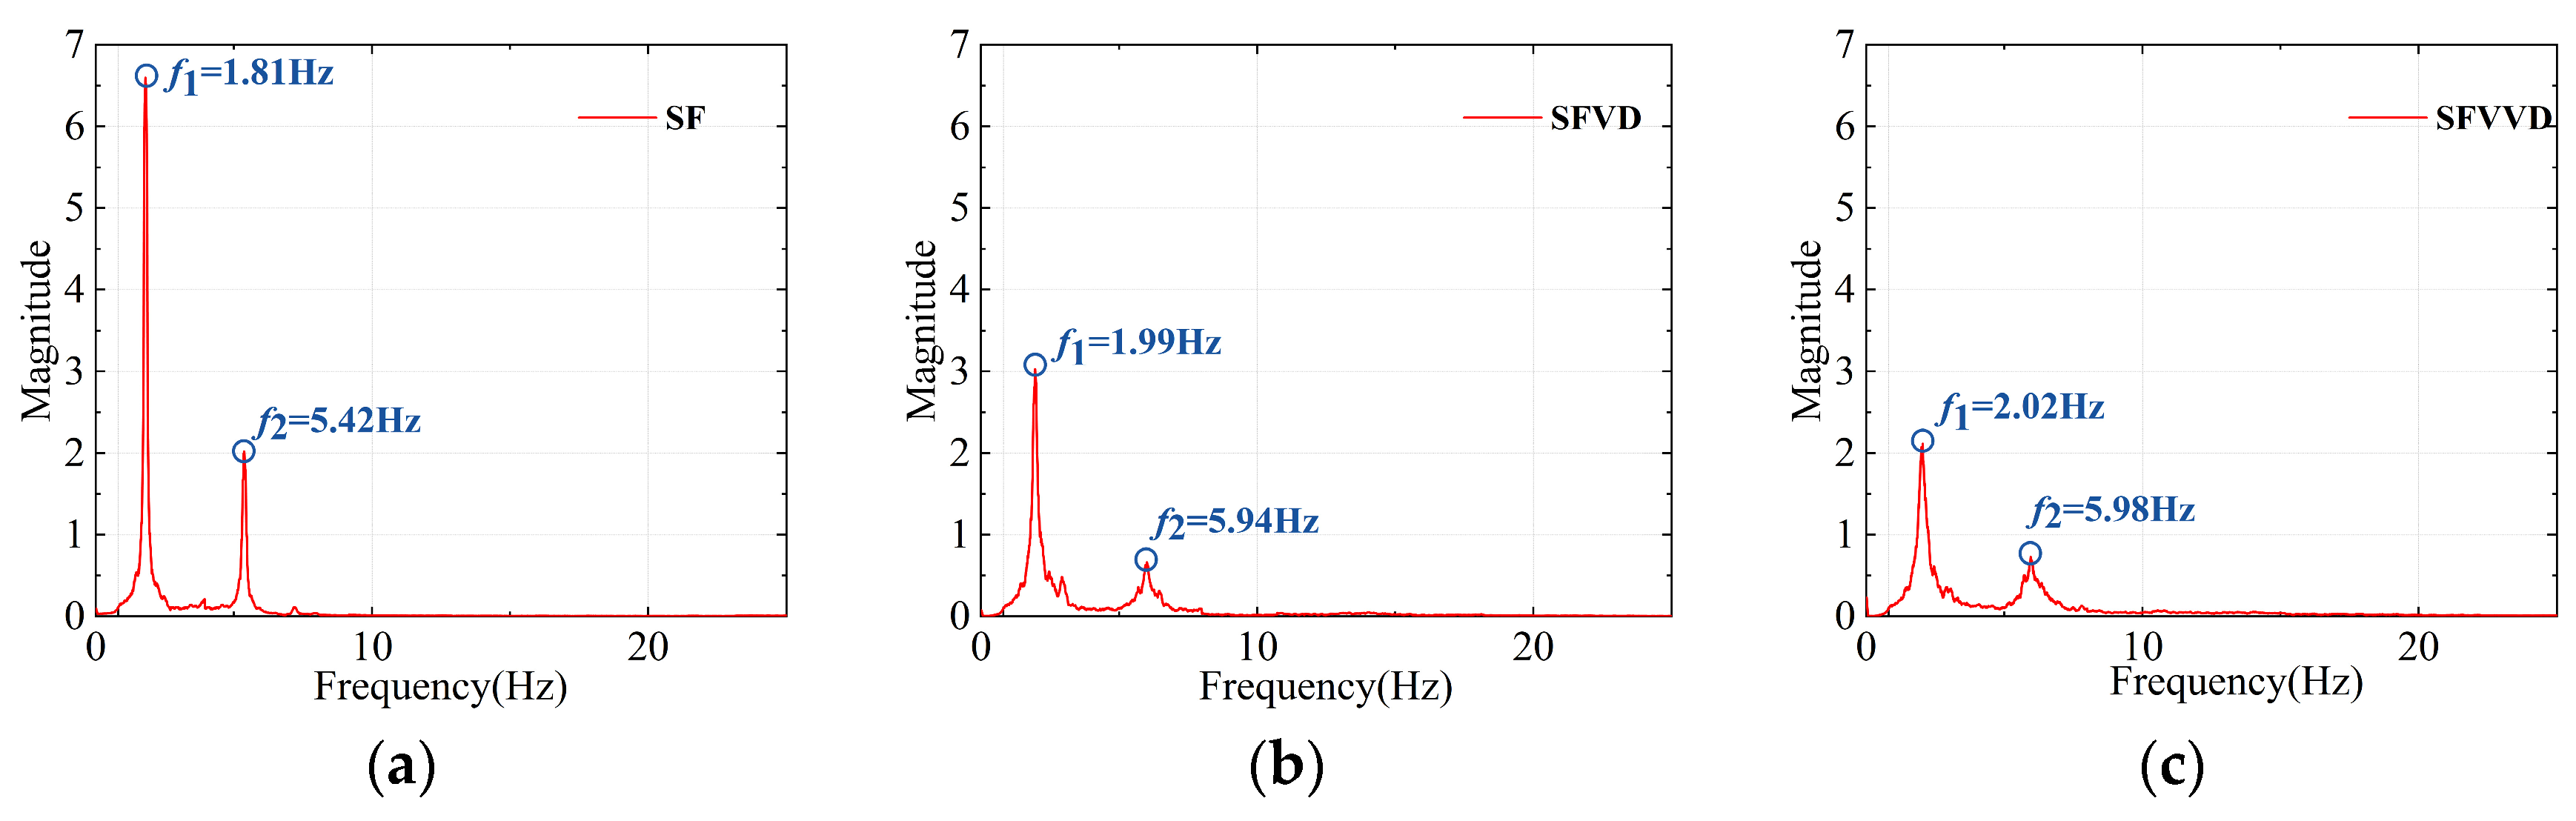
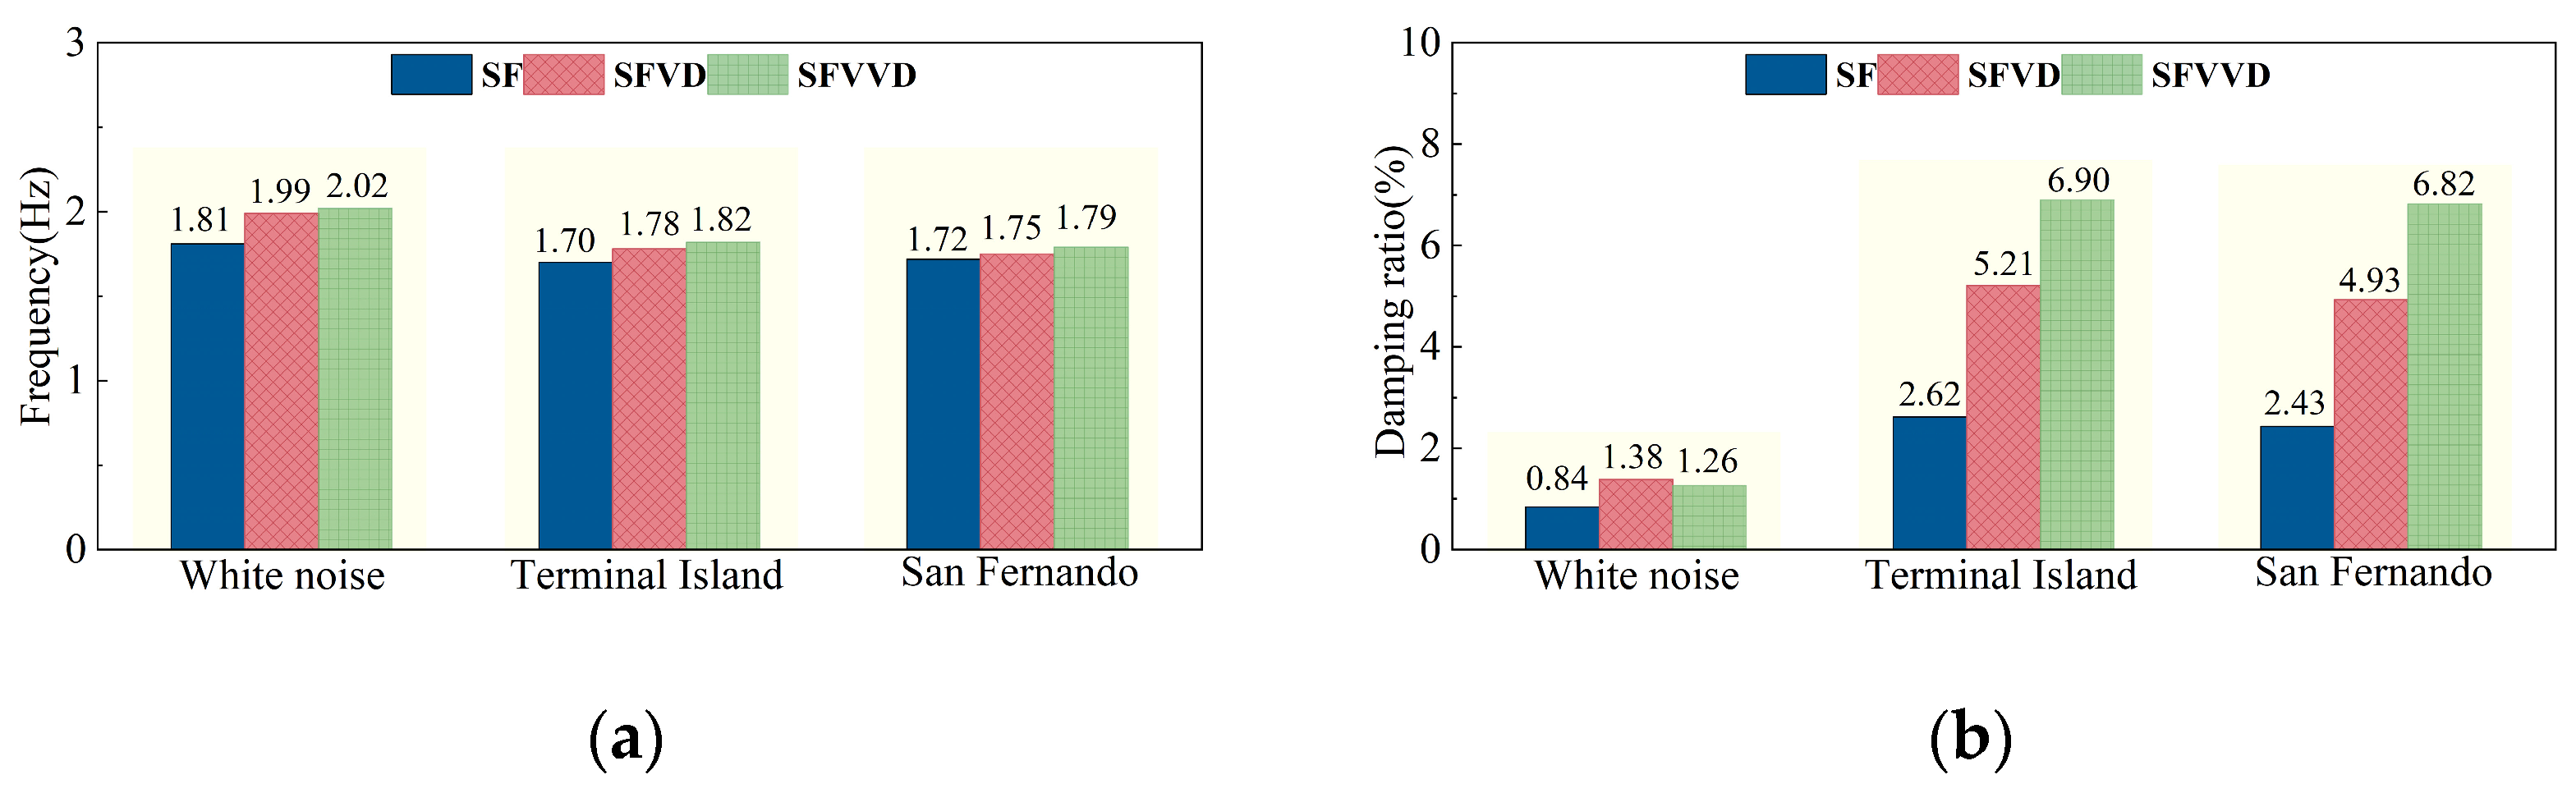
3.1. Structural Dynamic Characteristics
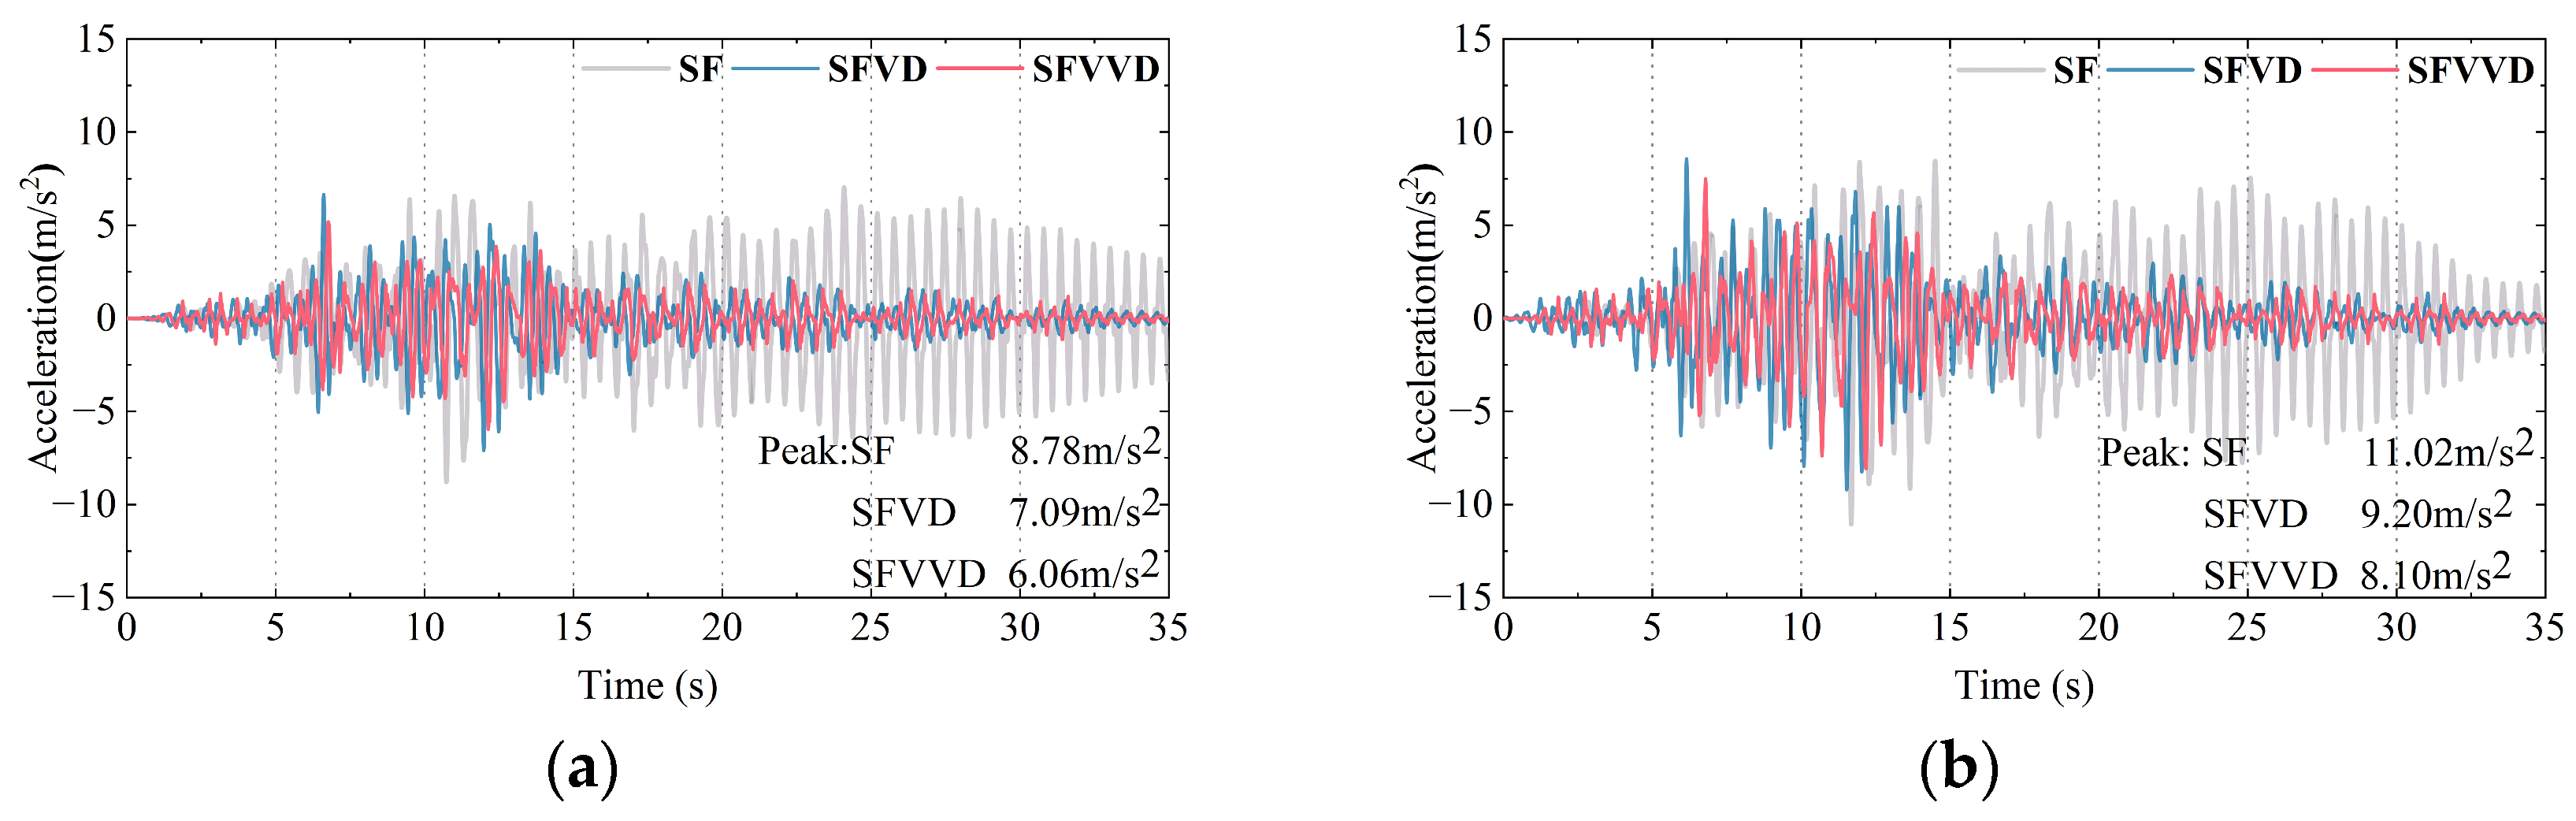
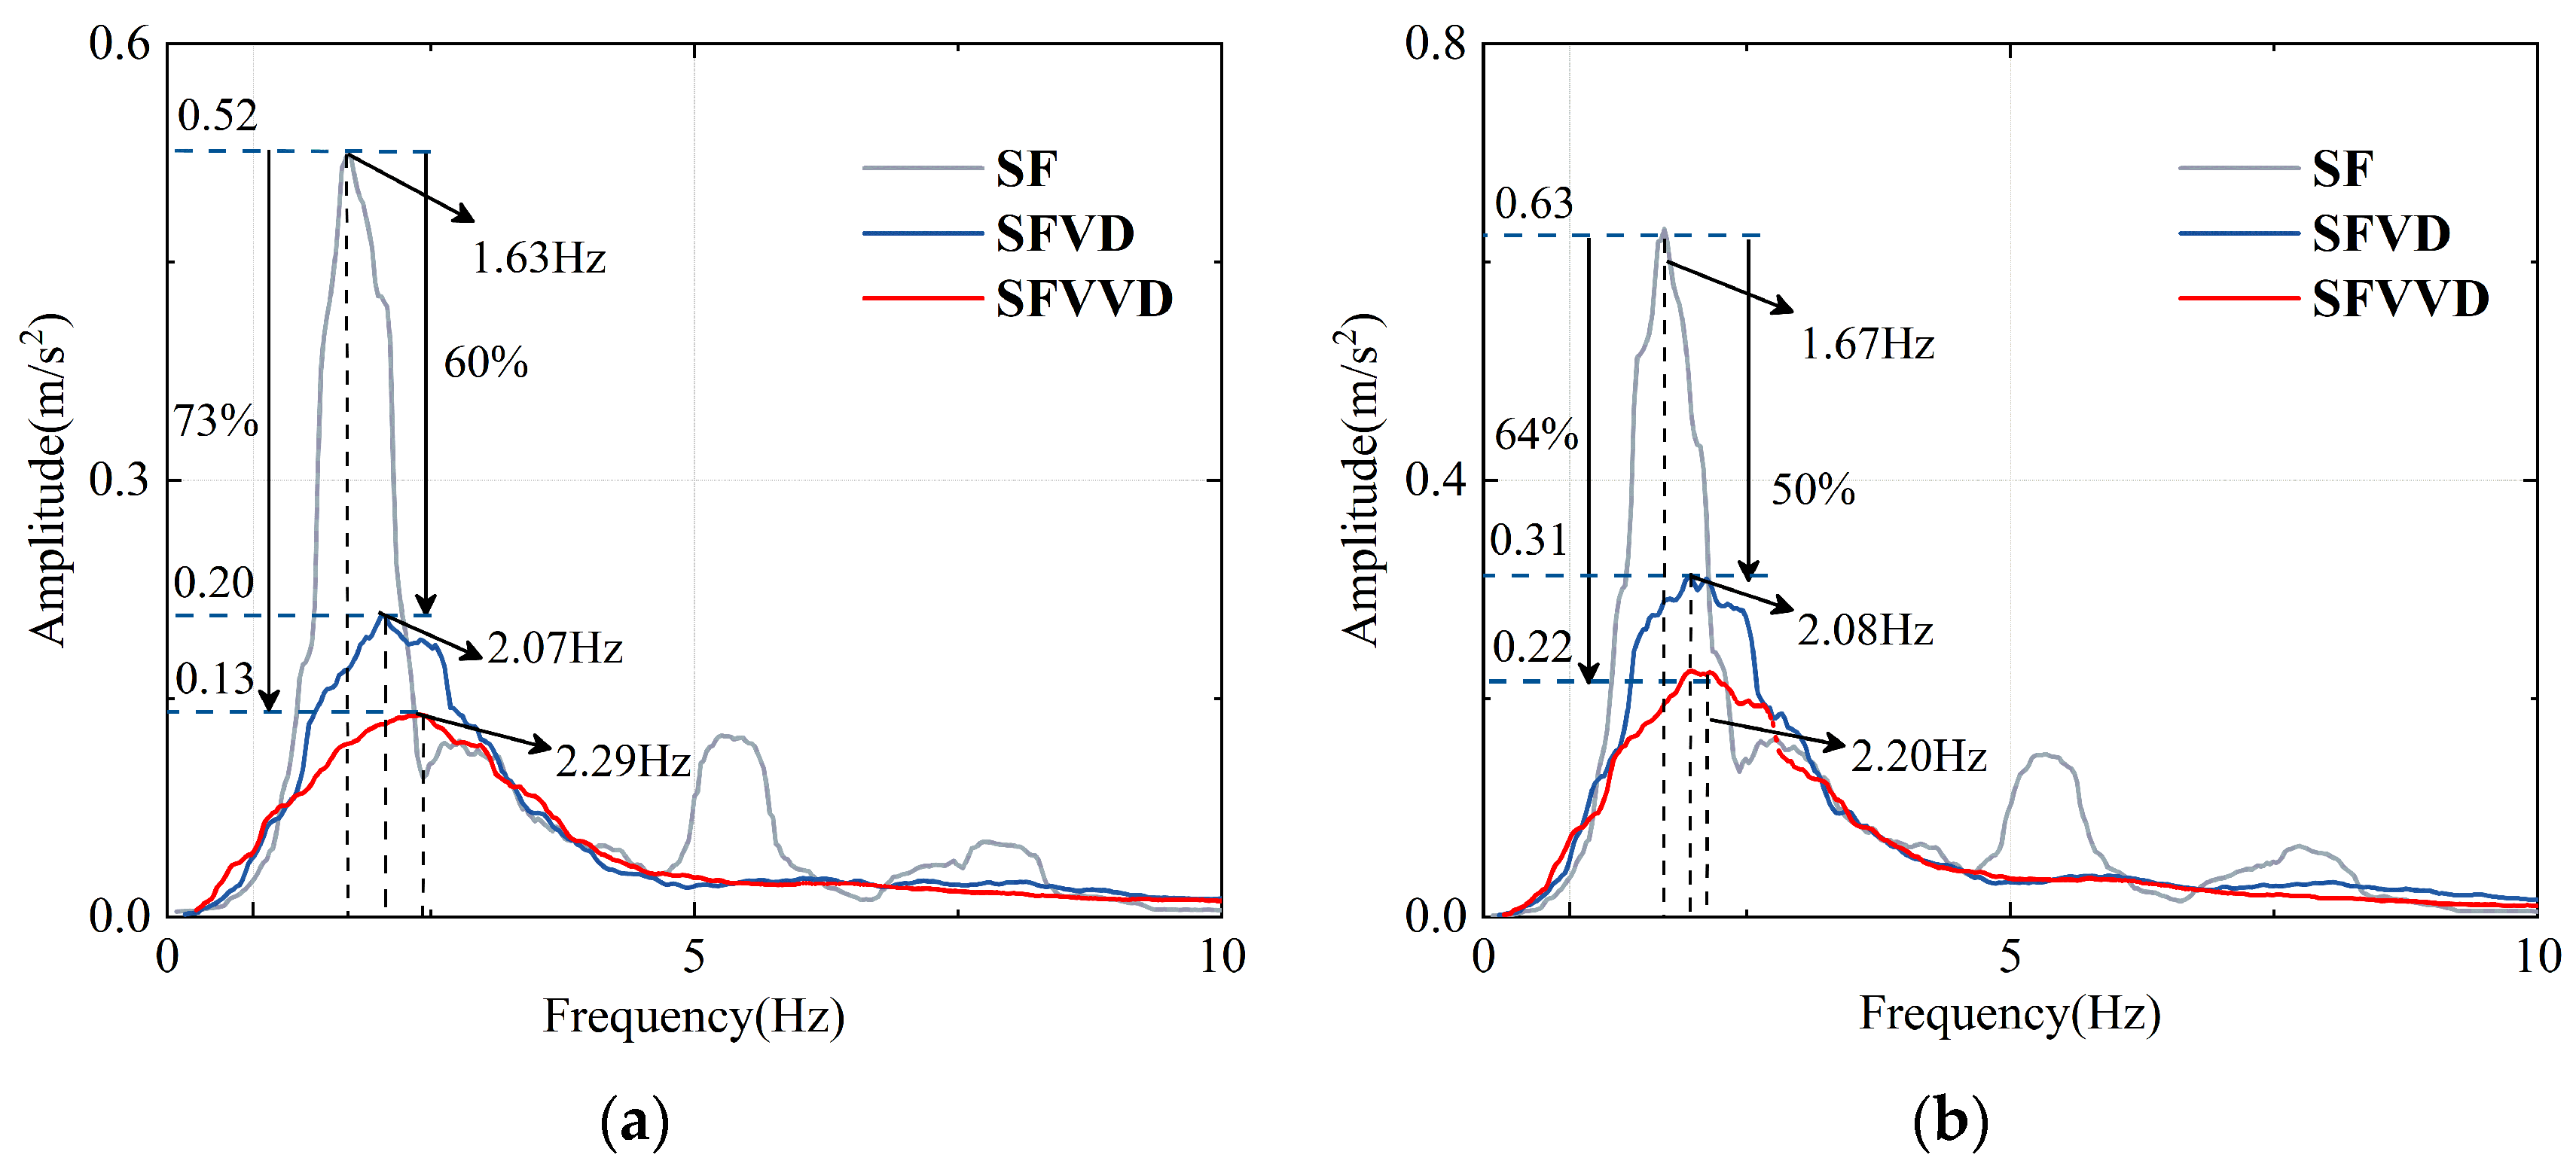
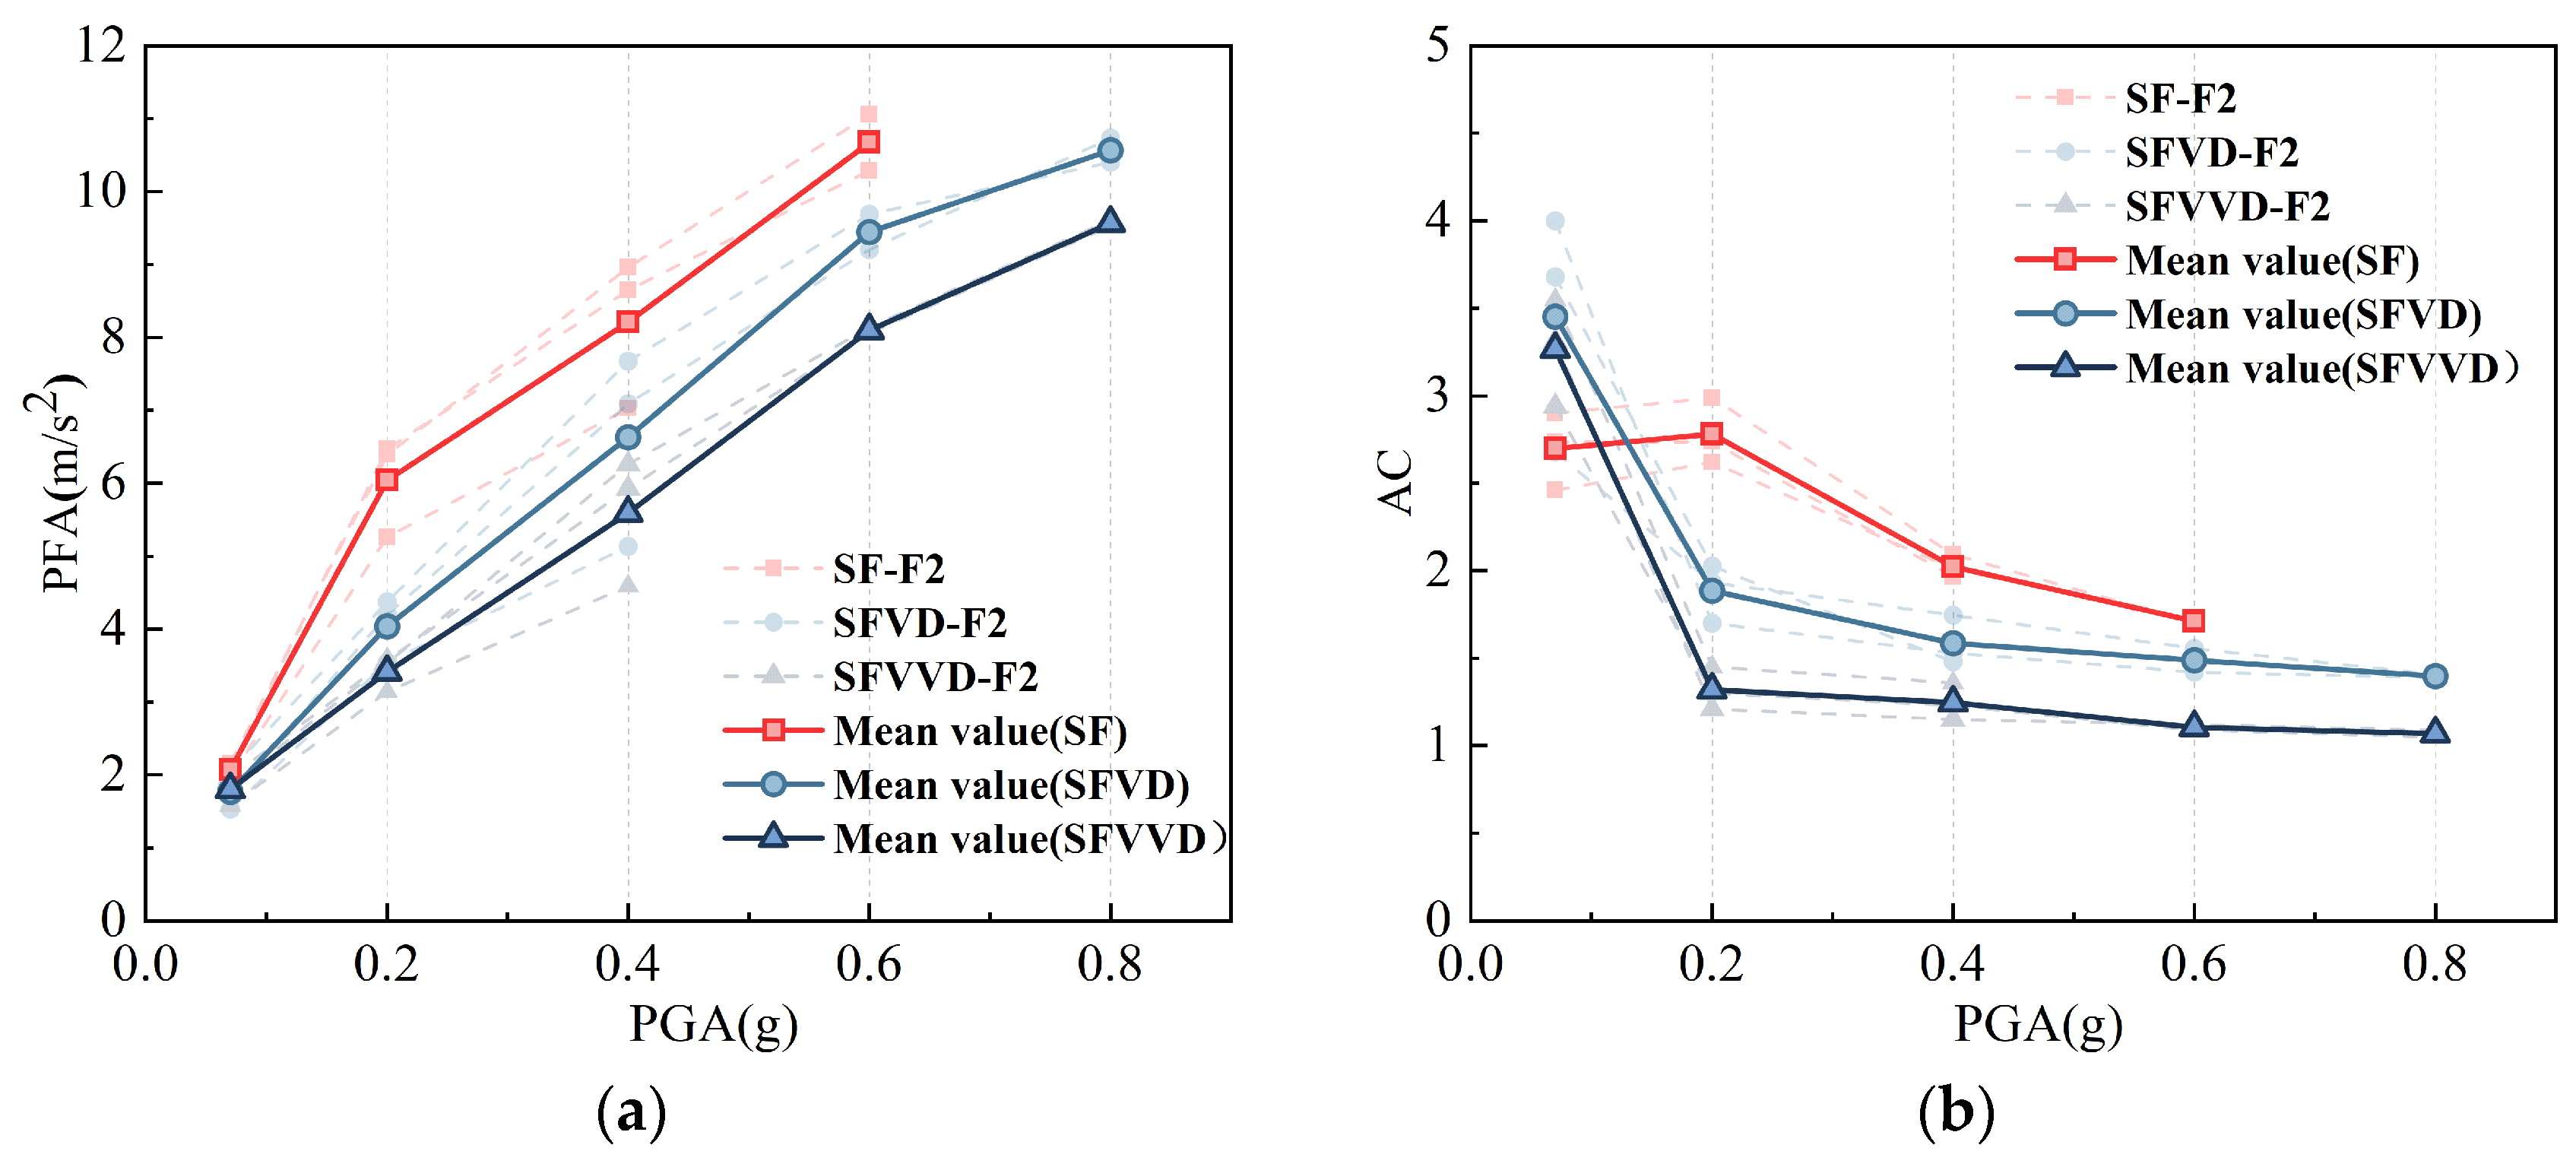
3.2. Acceleration Responses
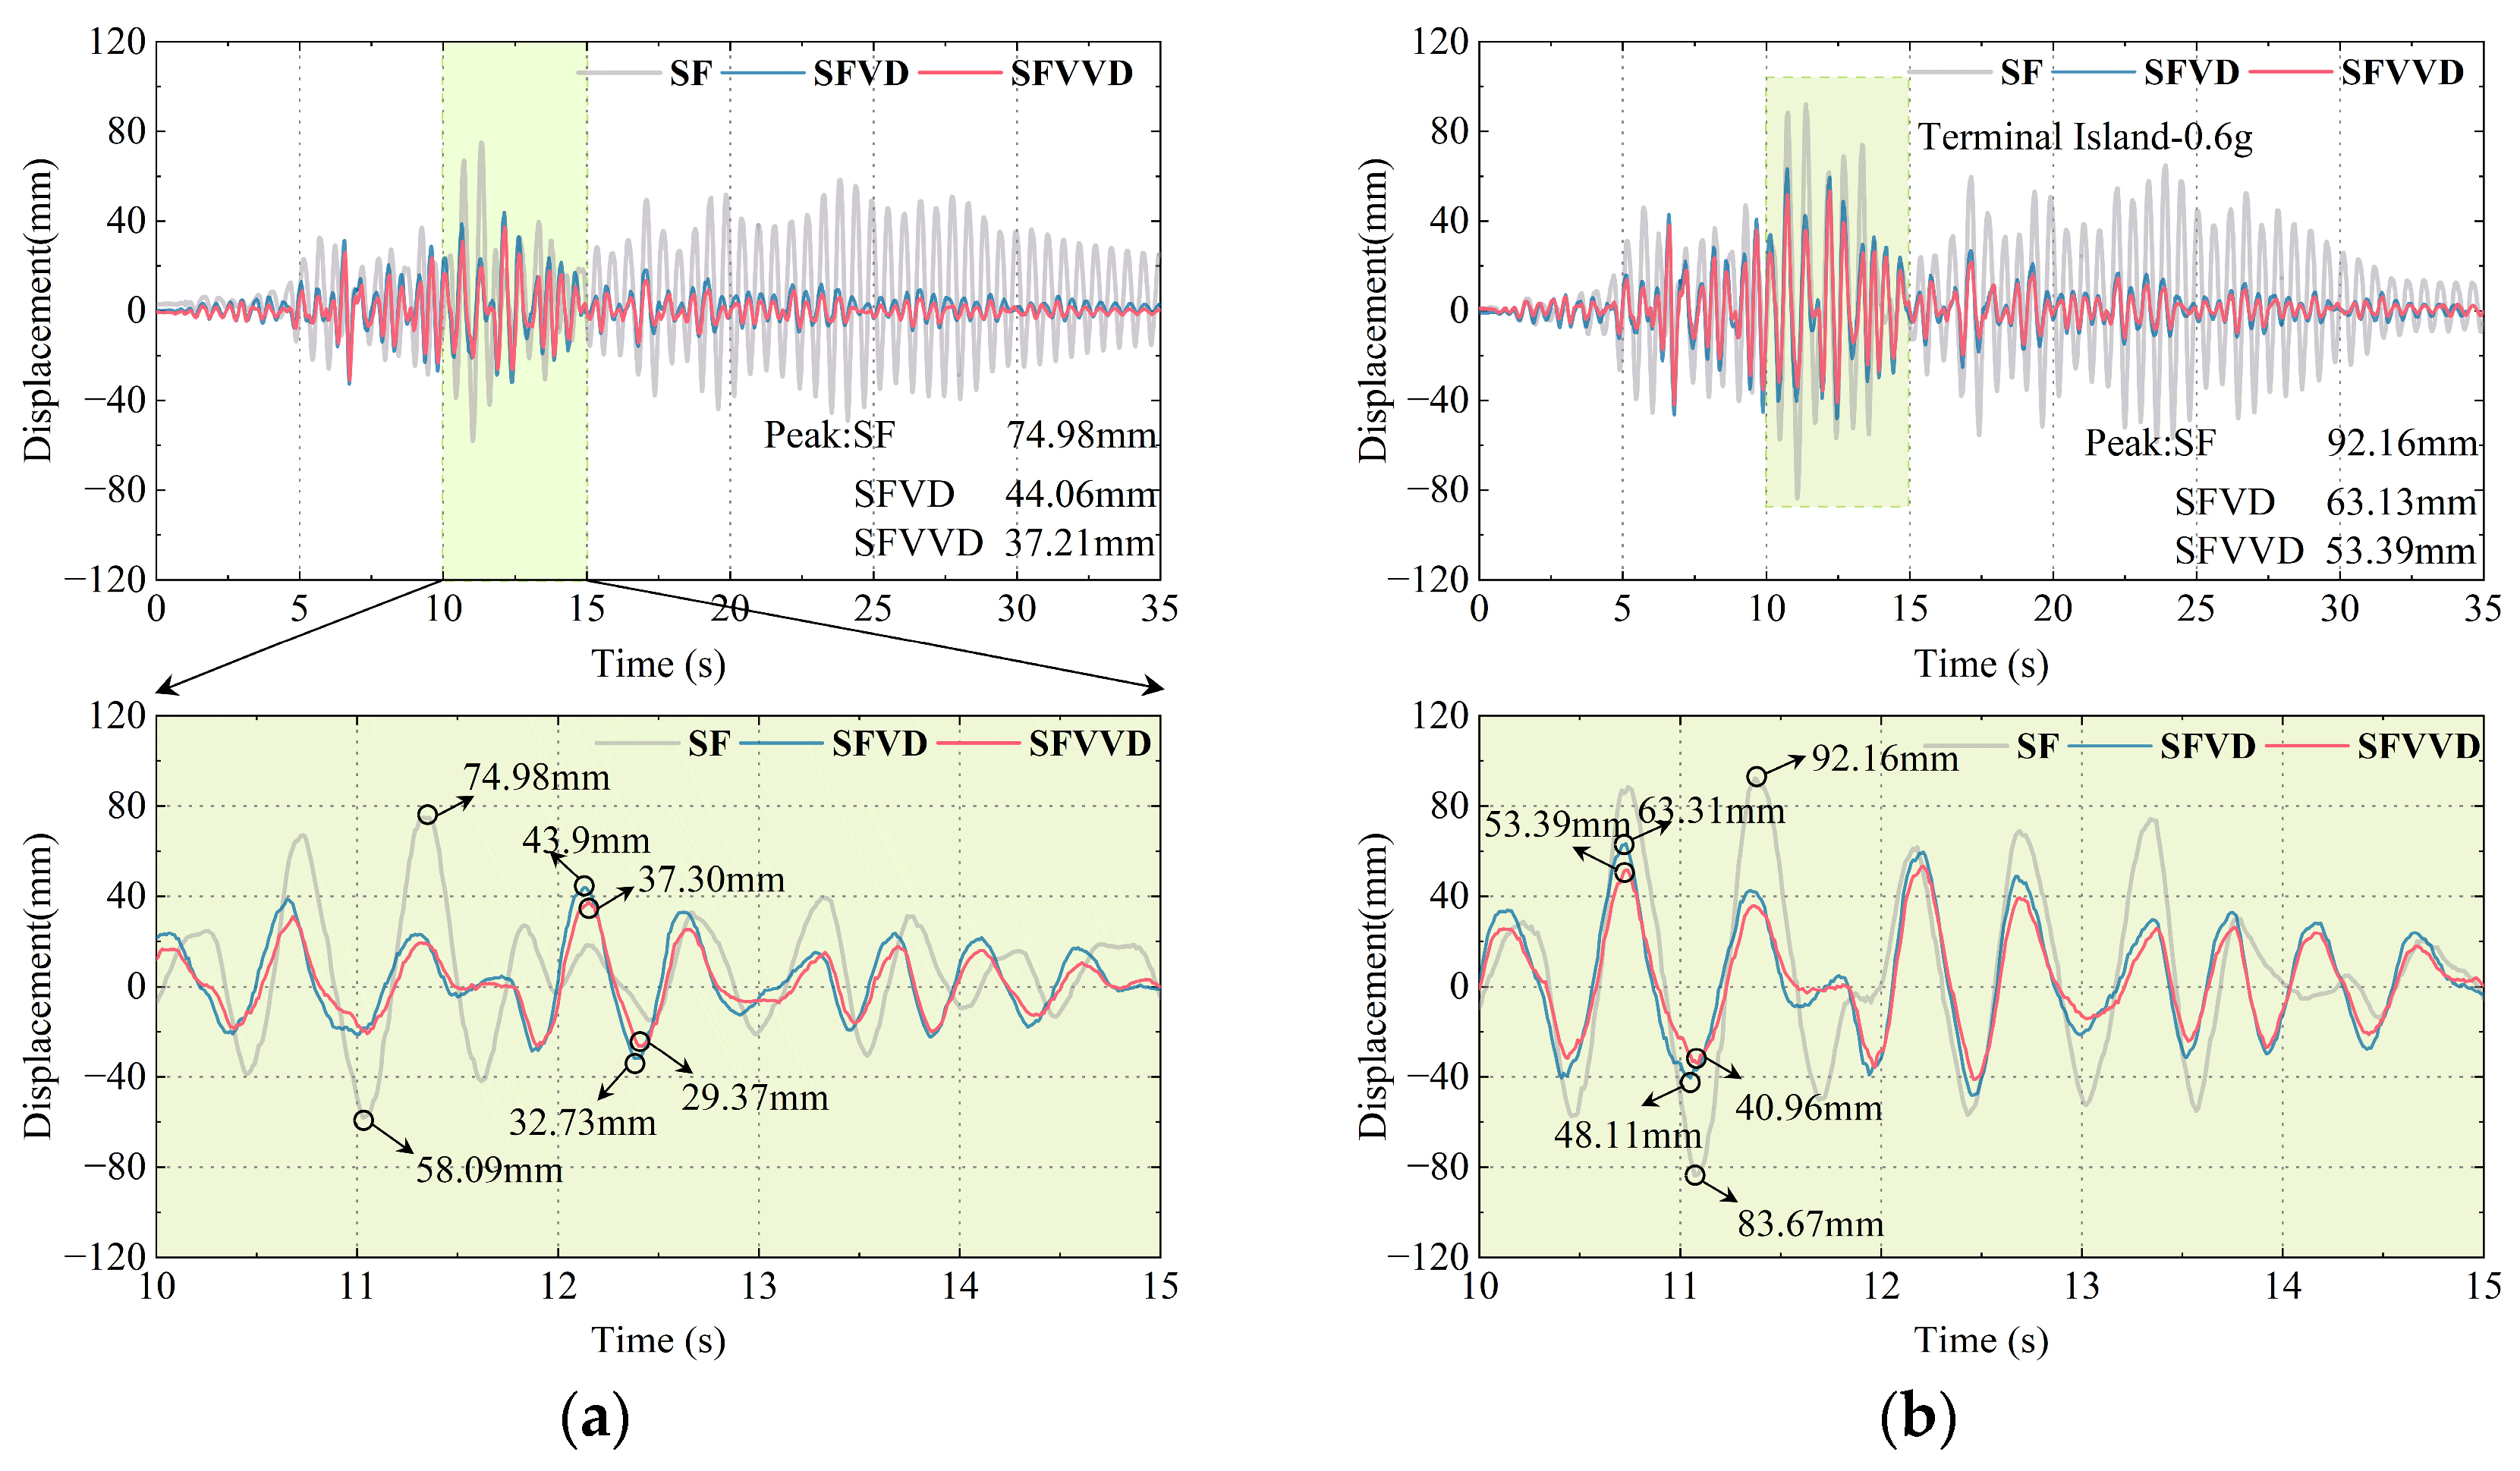
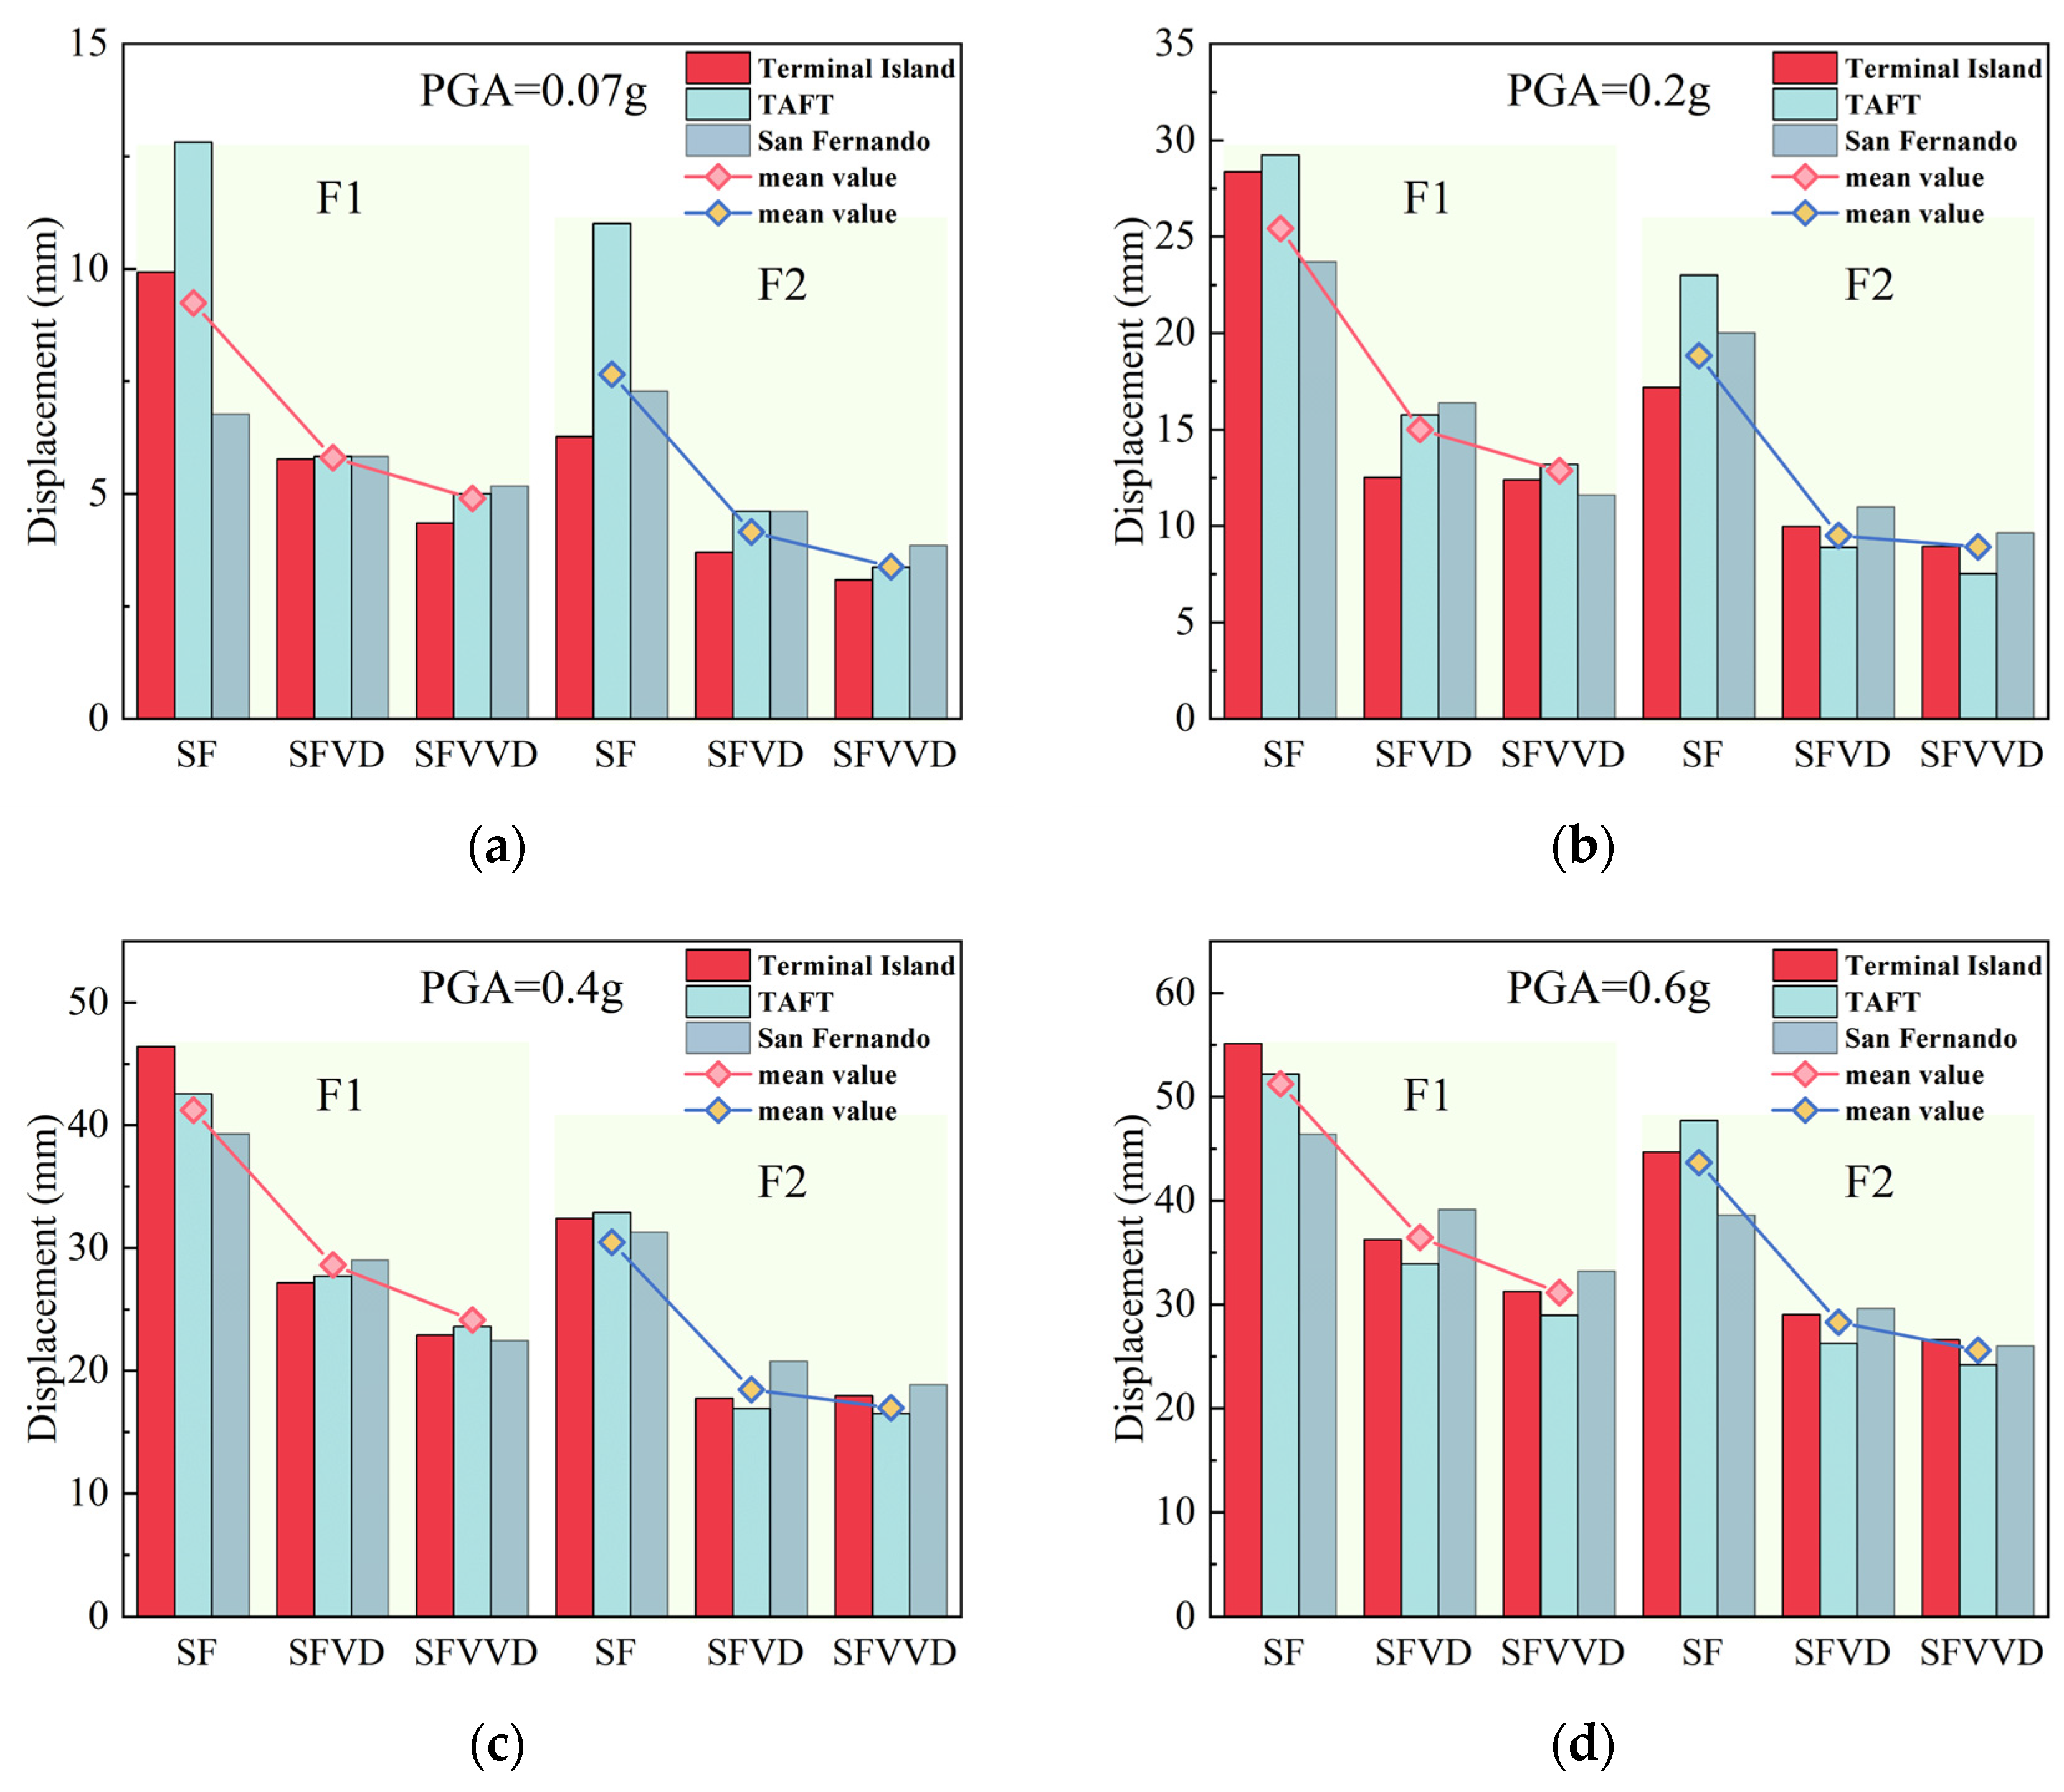
3.3. Displacement Responses
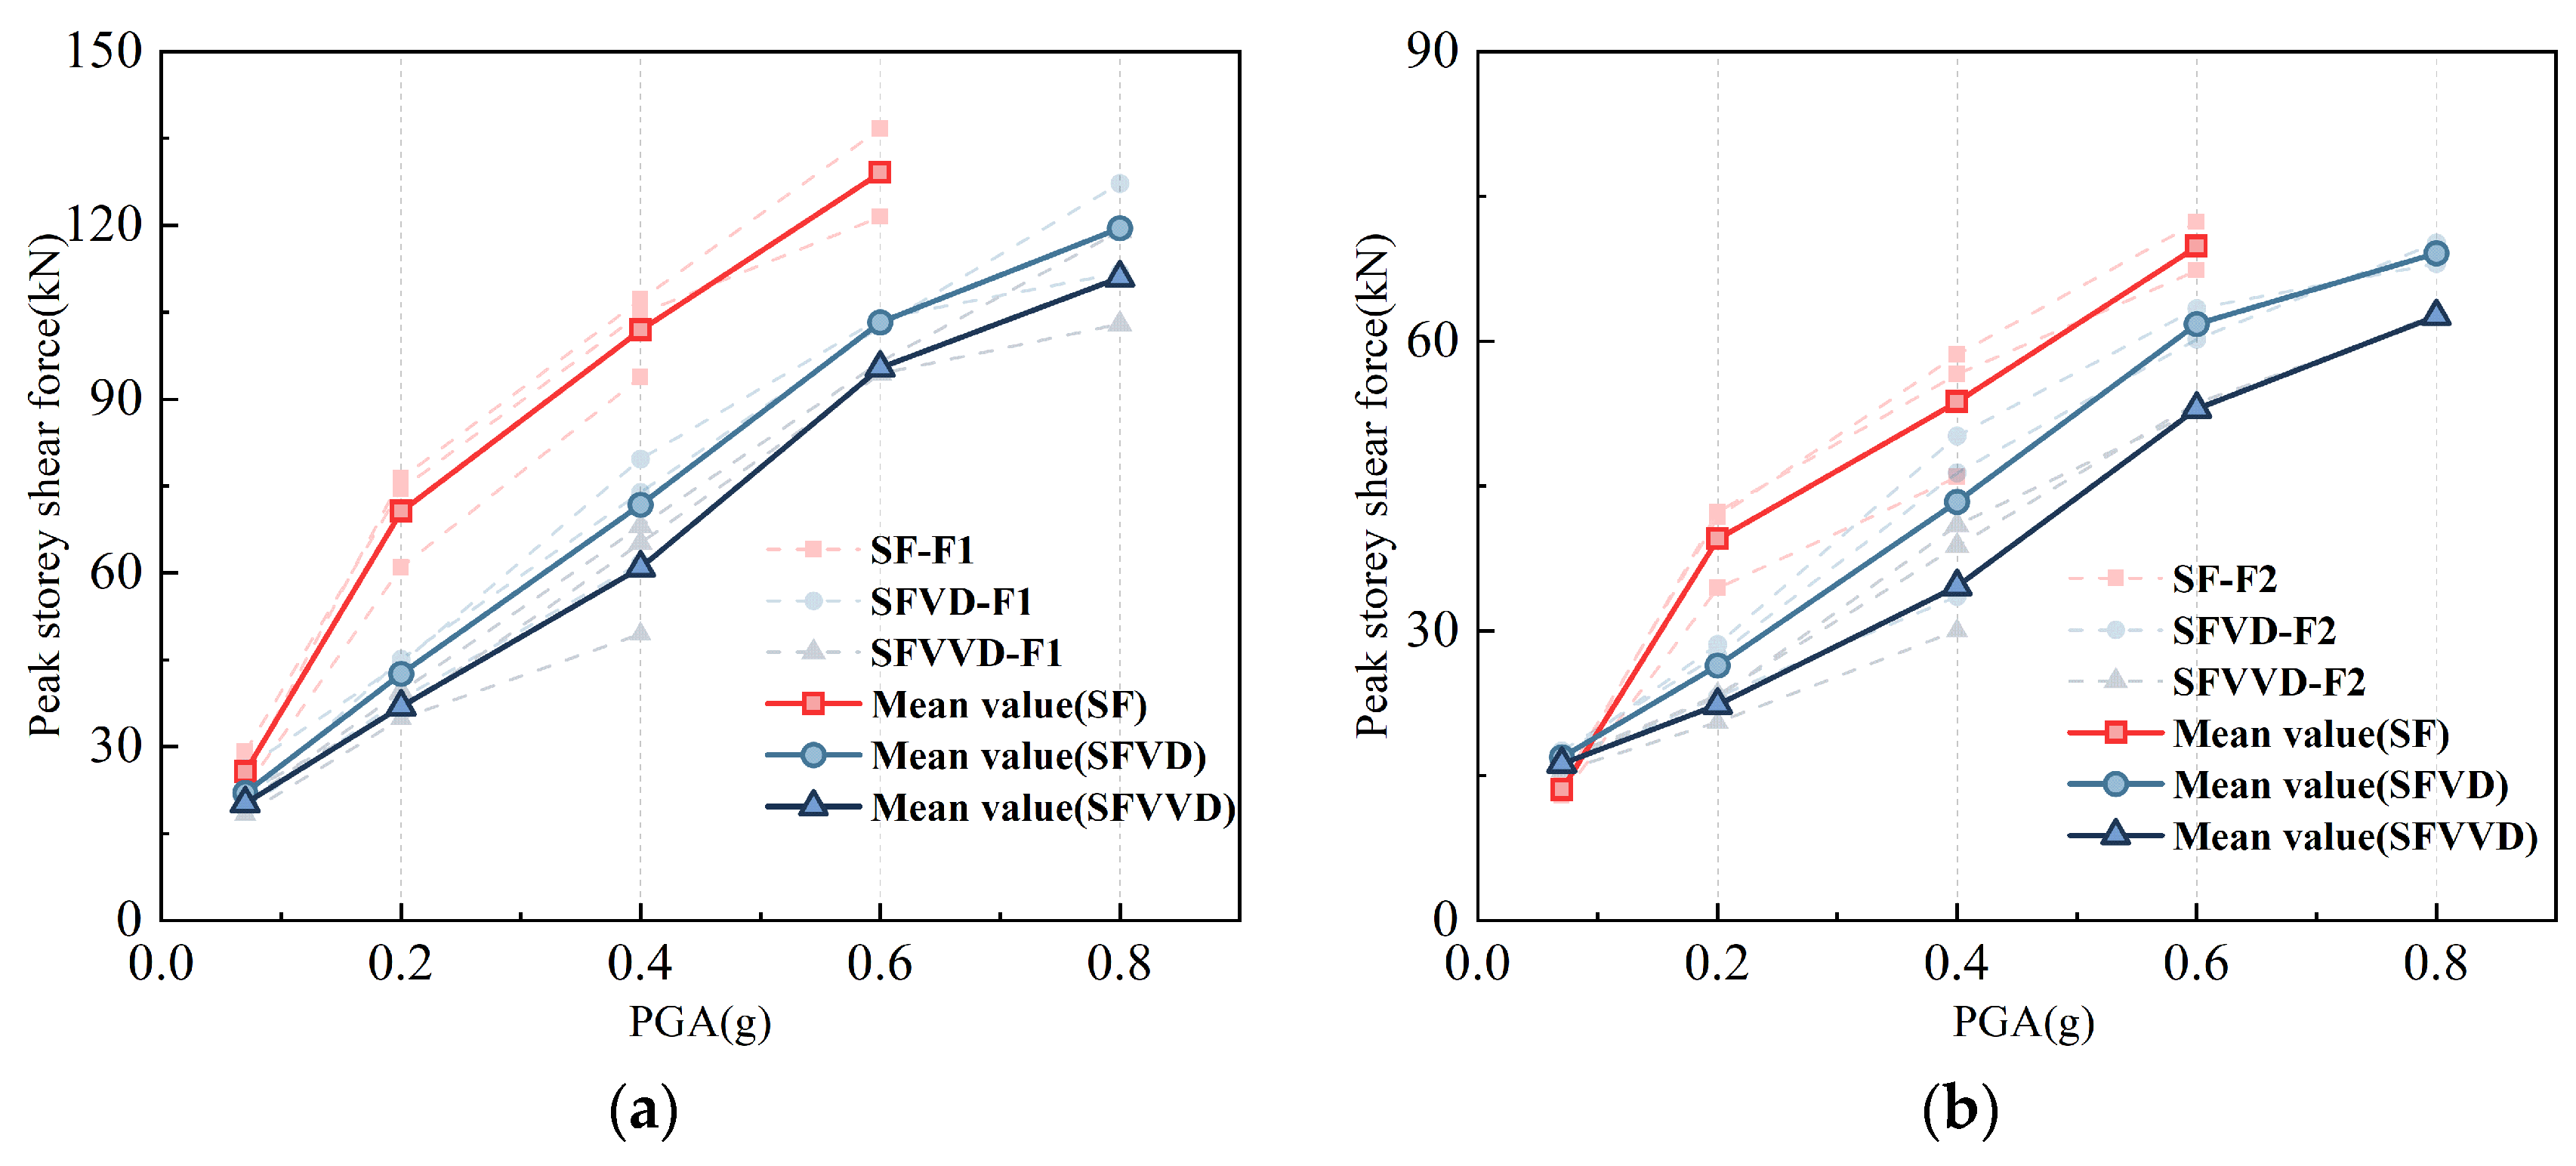
3.4. Shear Force Responses
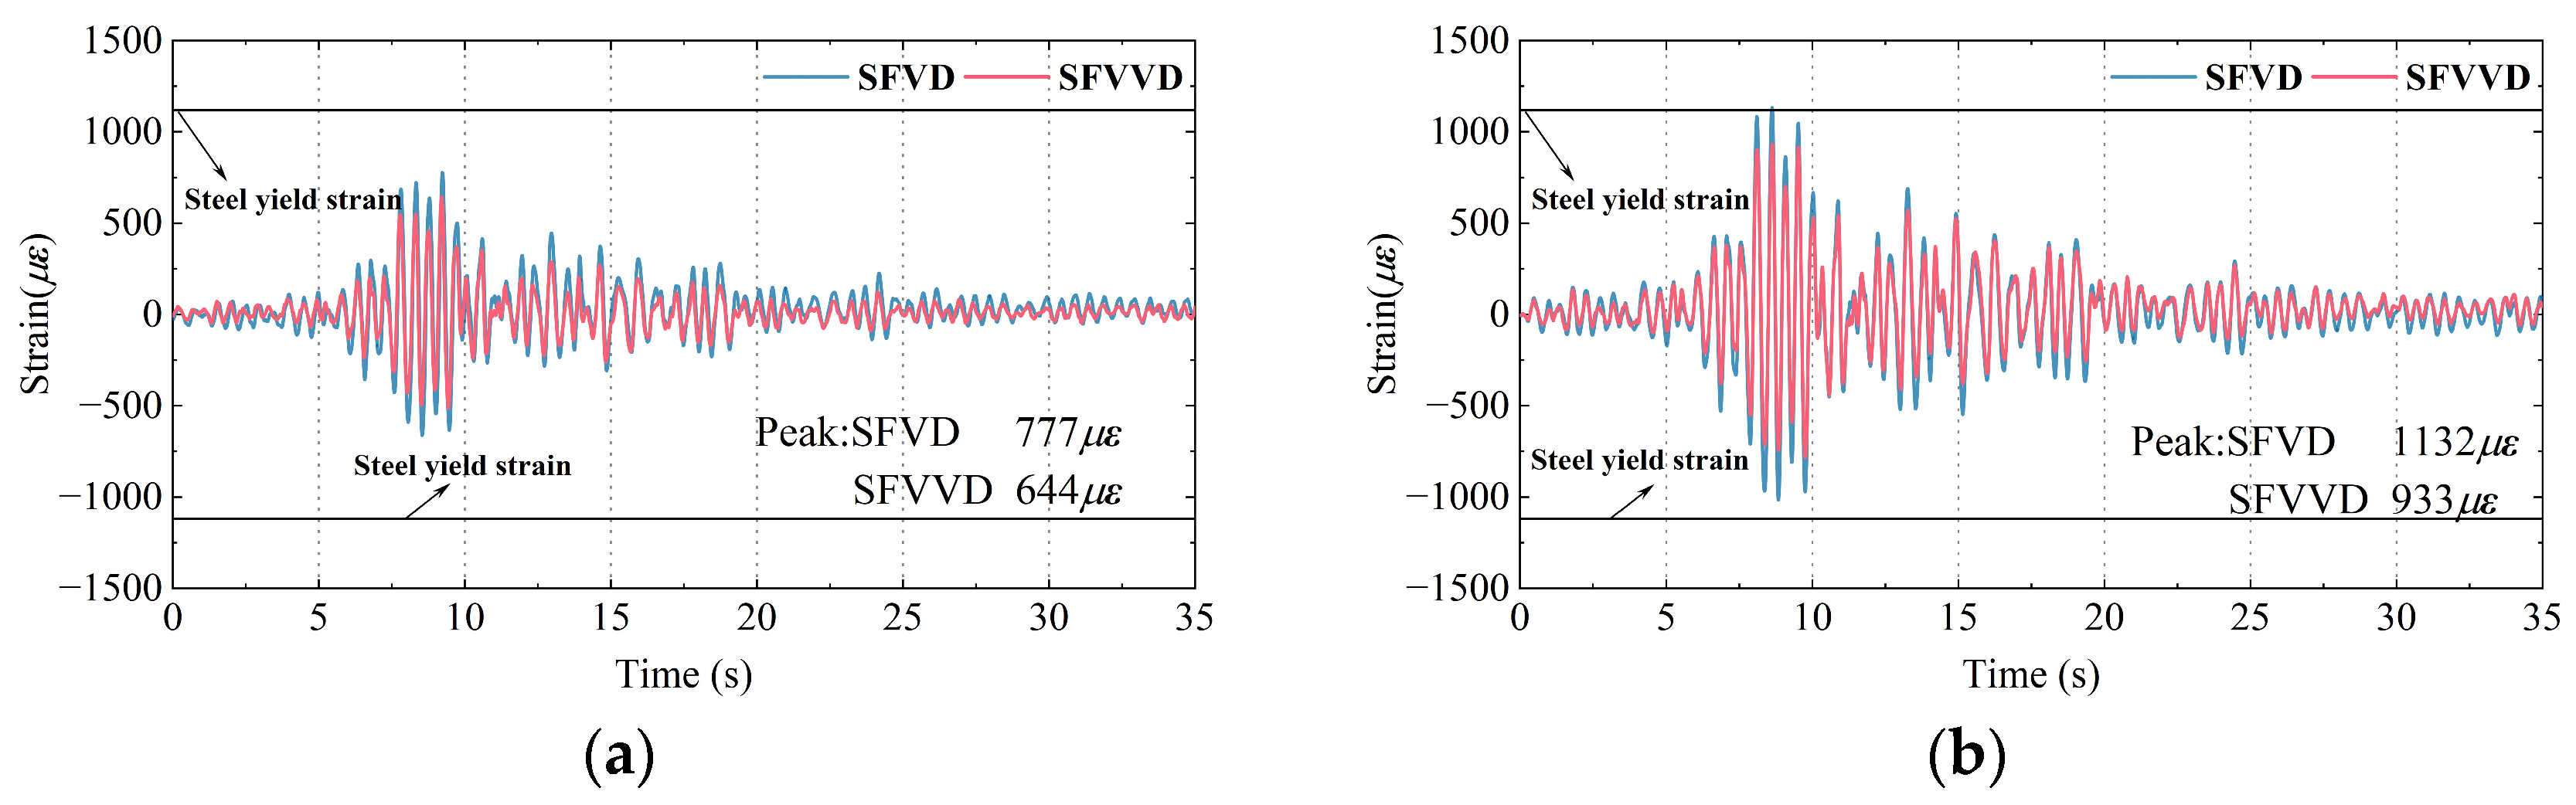
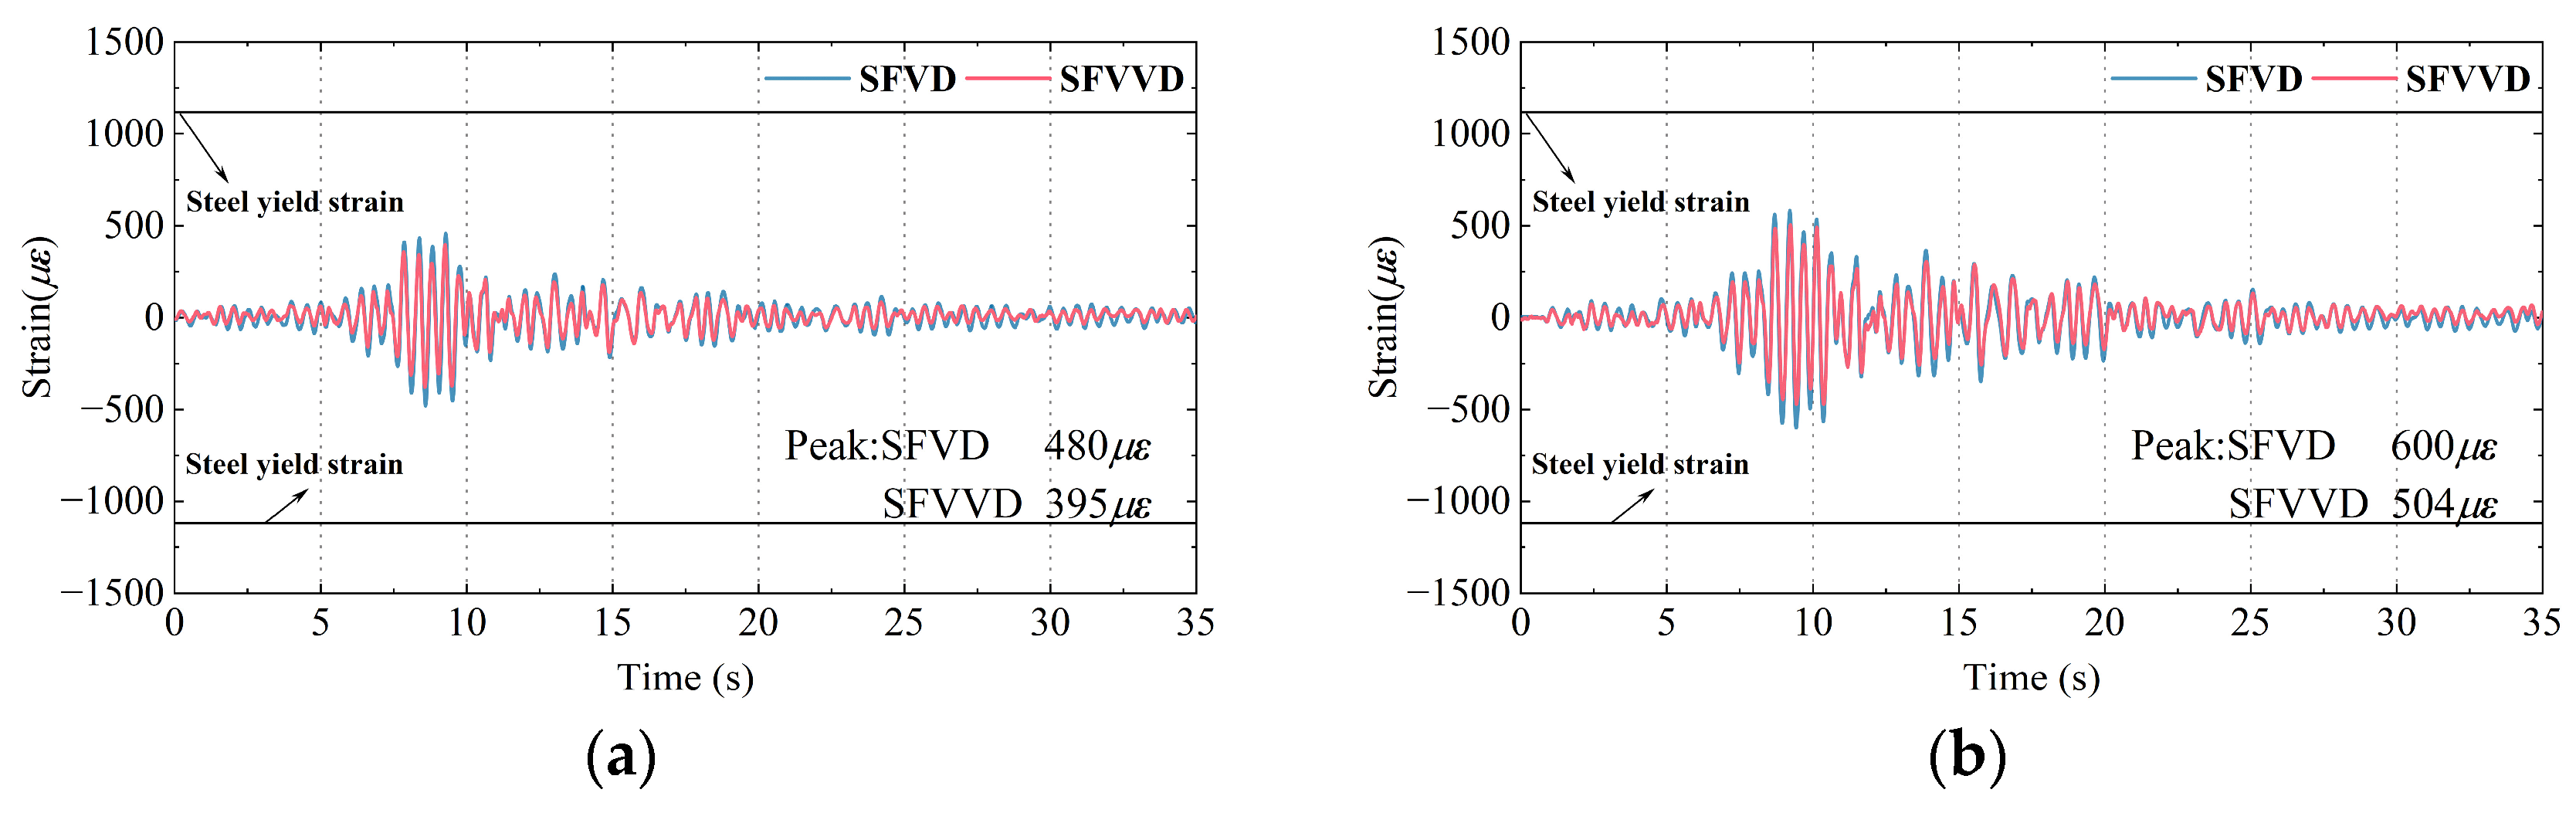
3.5. Strain Responses
4. Numerical Analysis
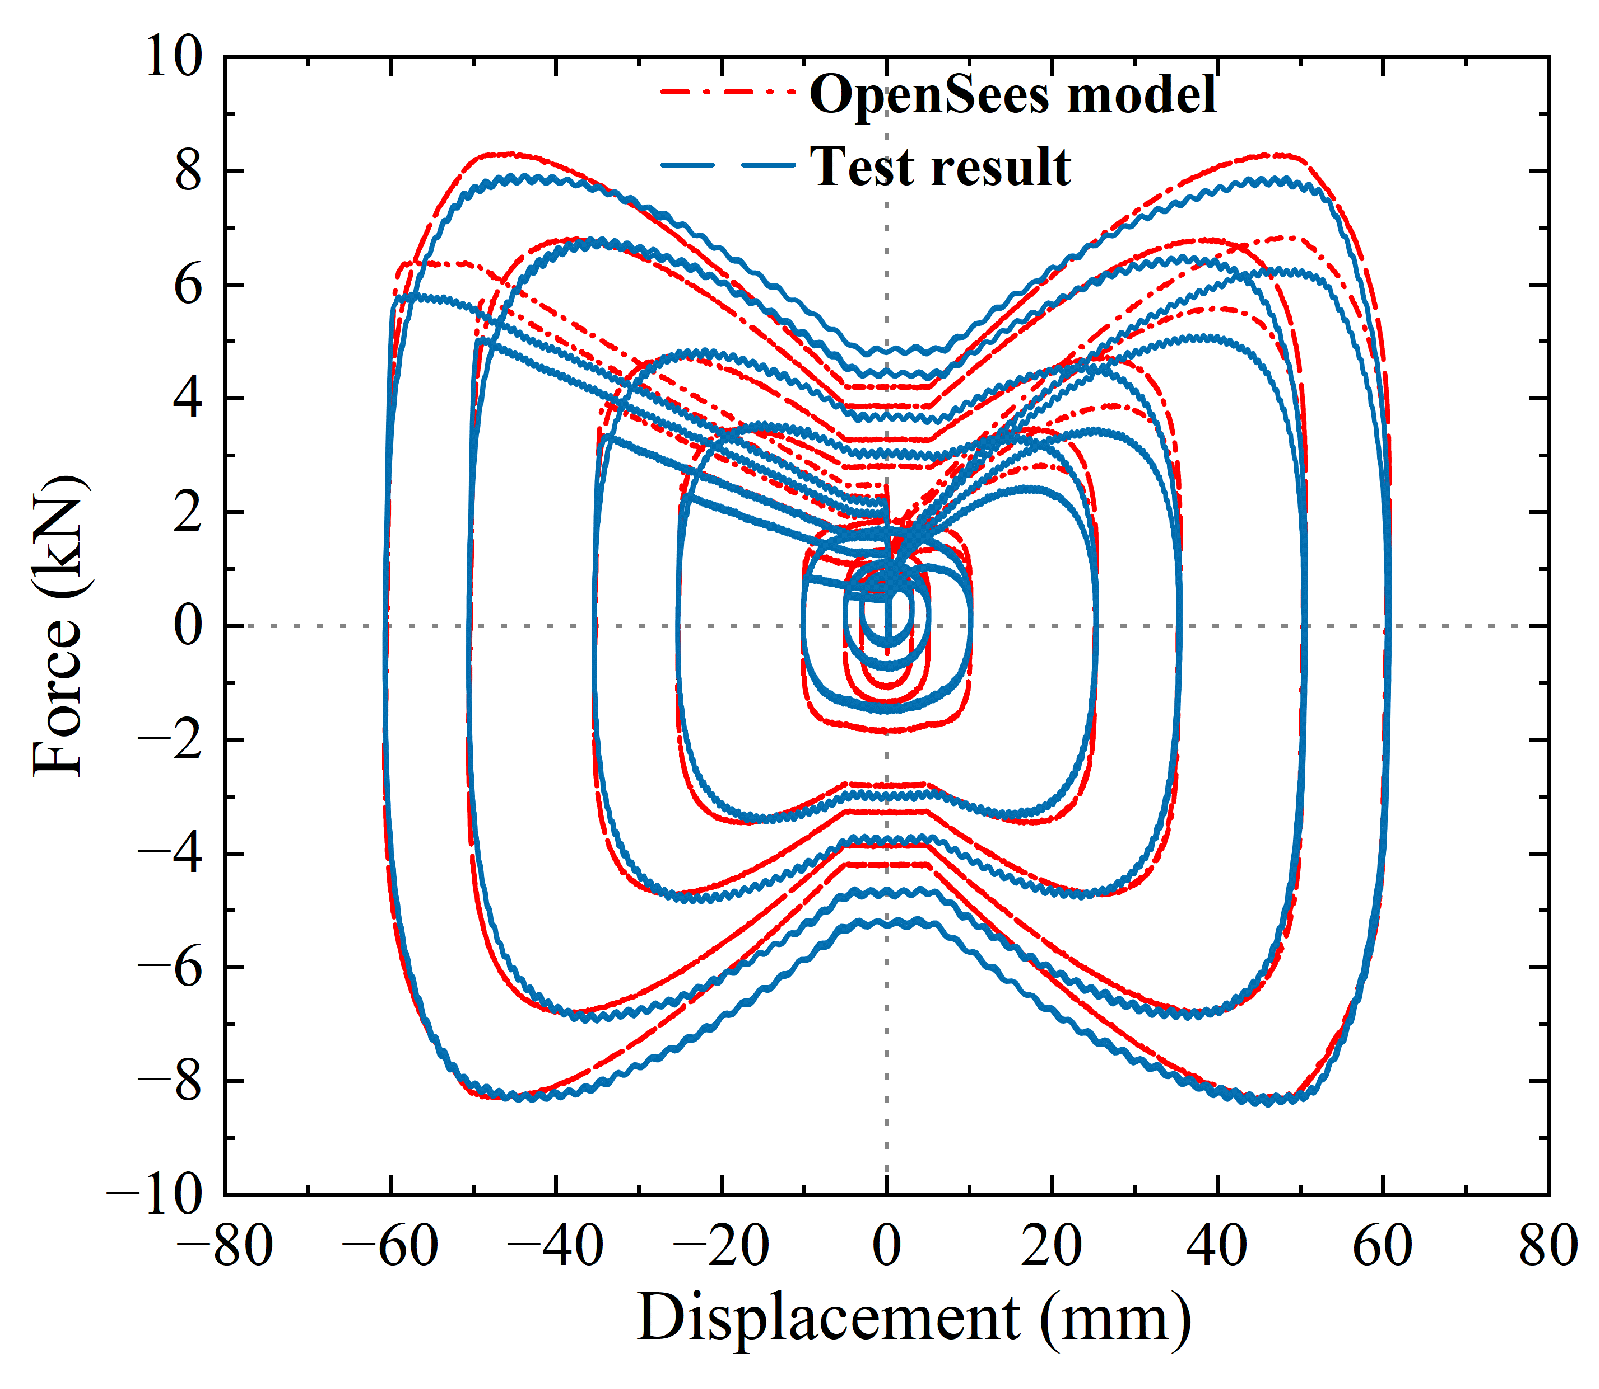
4.1. VVD Material Development and Validation
- (a)
- Located the viscous damper material.h and viscous damper material.cpp source files in the OpenSees 3.3.0 code. These files were modified using C++ in the Microsoft Visual Studio 2022 software.
- (b)
- New parameter interfaces for C1, C2, s, and L were added to the viscous damper material.h by extending the public class.
- (c)
- Modified the setTrialStrain function in viscous damper material.cpp. Implemented a conditional function to calculate the damping coefficient C for the current time step based on the VVD deformation, using Equation (1). This value was assigned to the damping coefficient parameter for the stress calculations.
- (d)
- Renamed the modified files to VVD material.h and VVD material.cpp. These files were added to the OpenSees uniaxial material library, and the relevant declaration and invocation files were updated to incorporate the new VVD material.
- (e)
- OpenSees was recompiled in Microsoft Visual Studio to include the VVD material in the updated program.
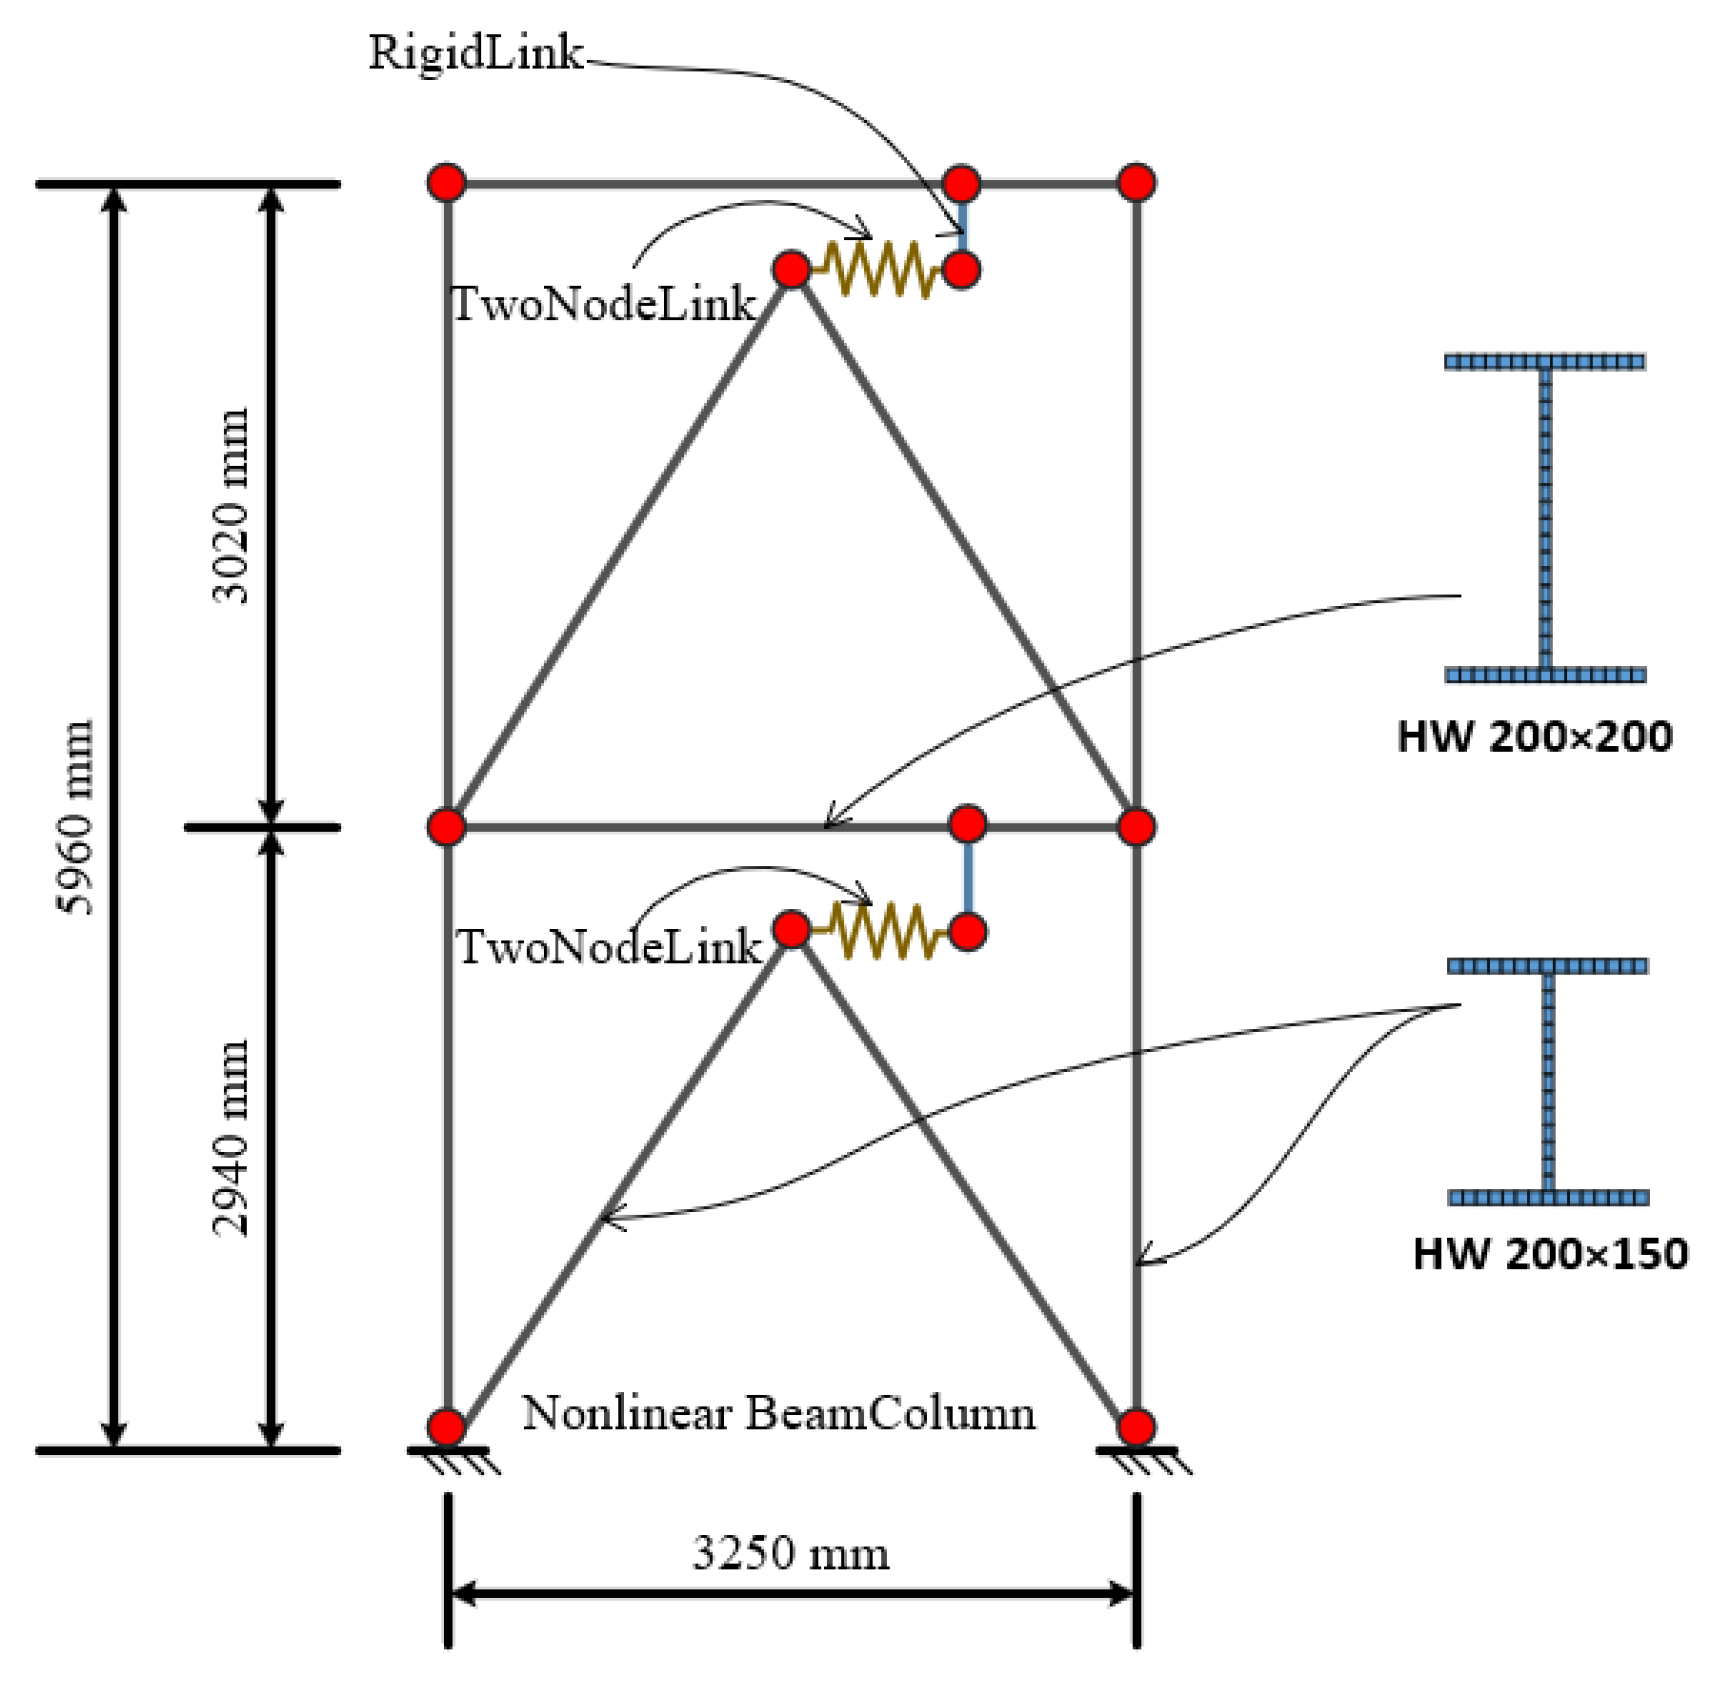
4.2. Numerical Model of SFVVD
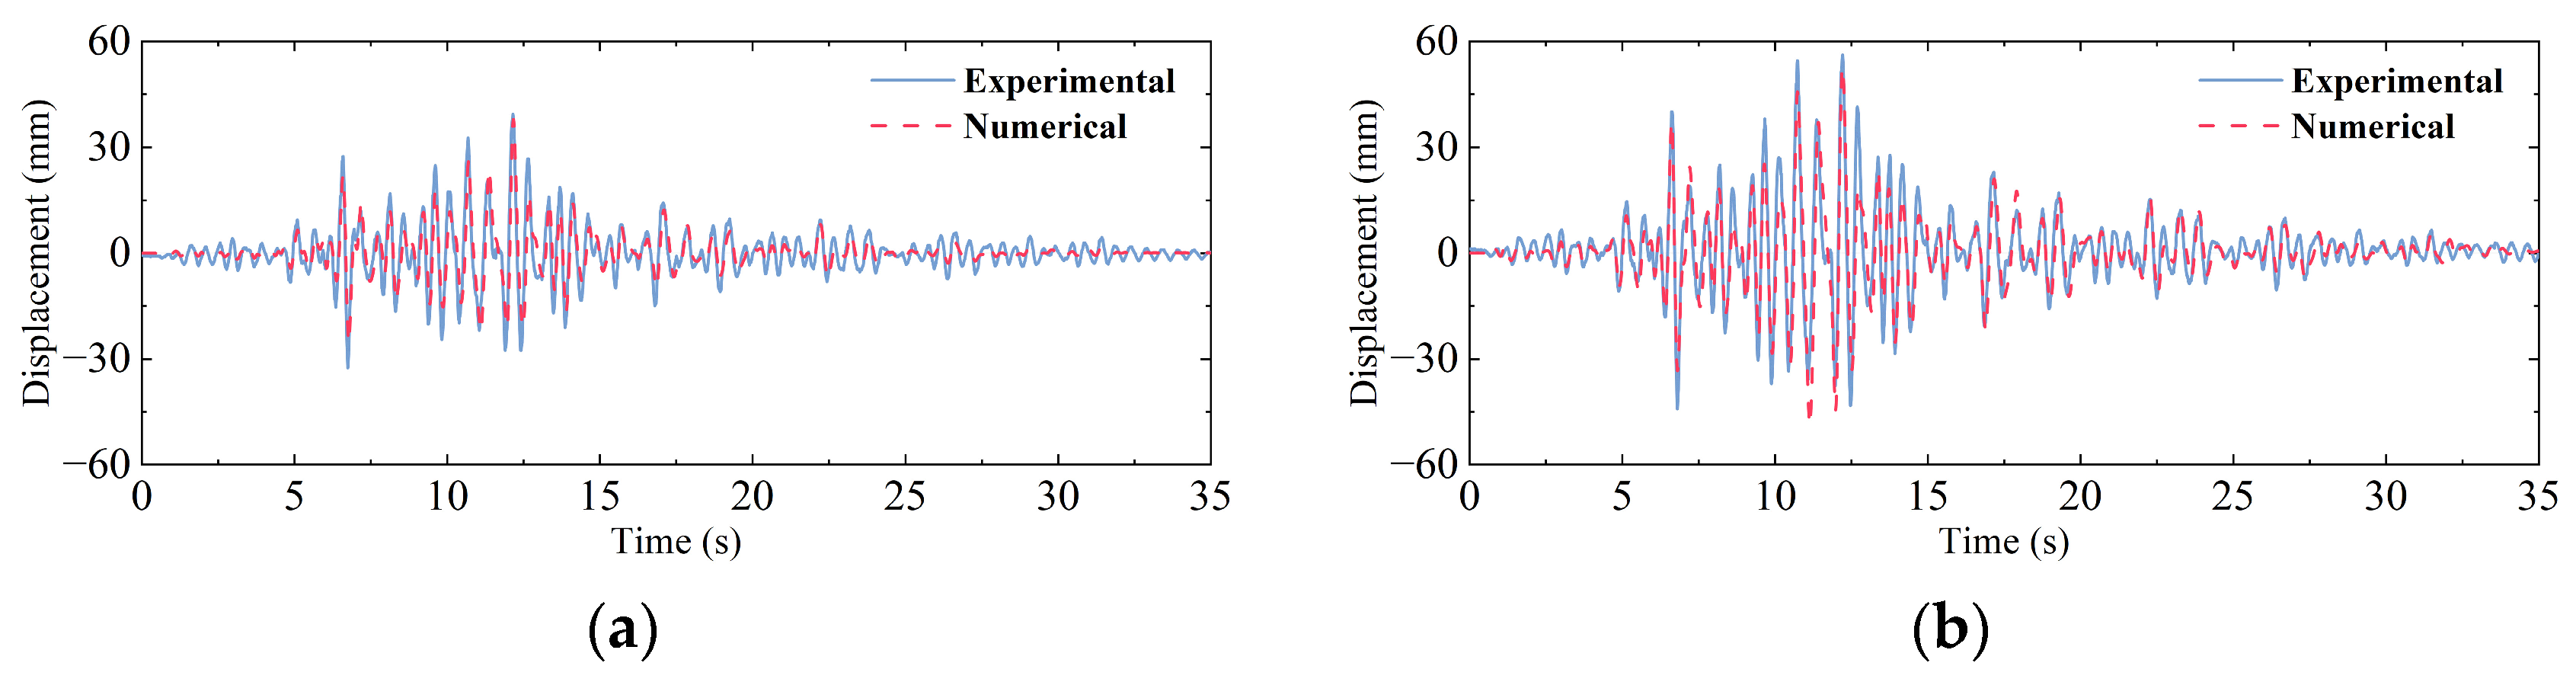
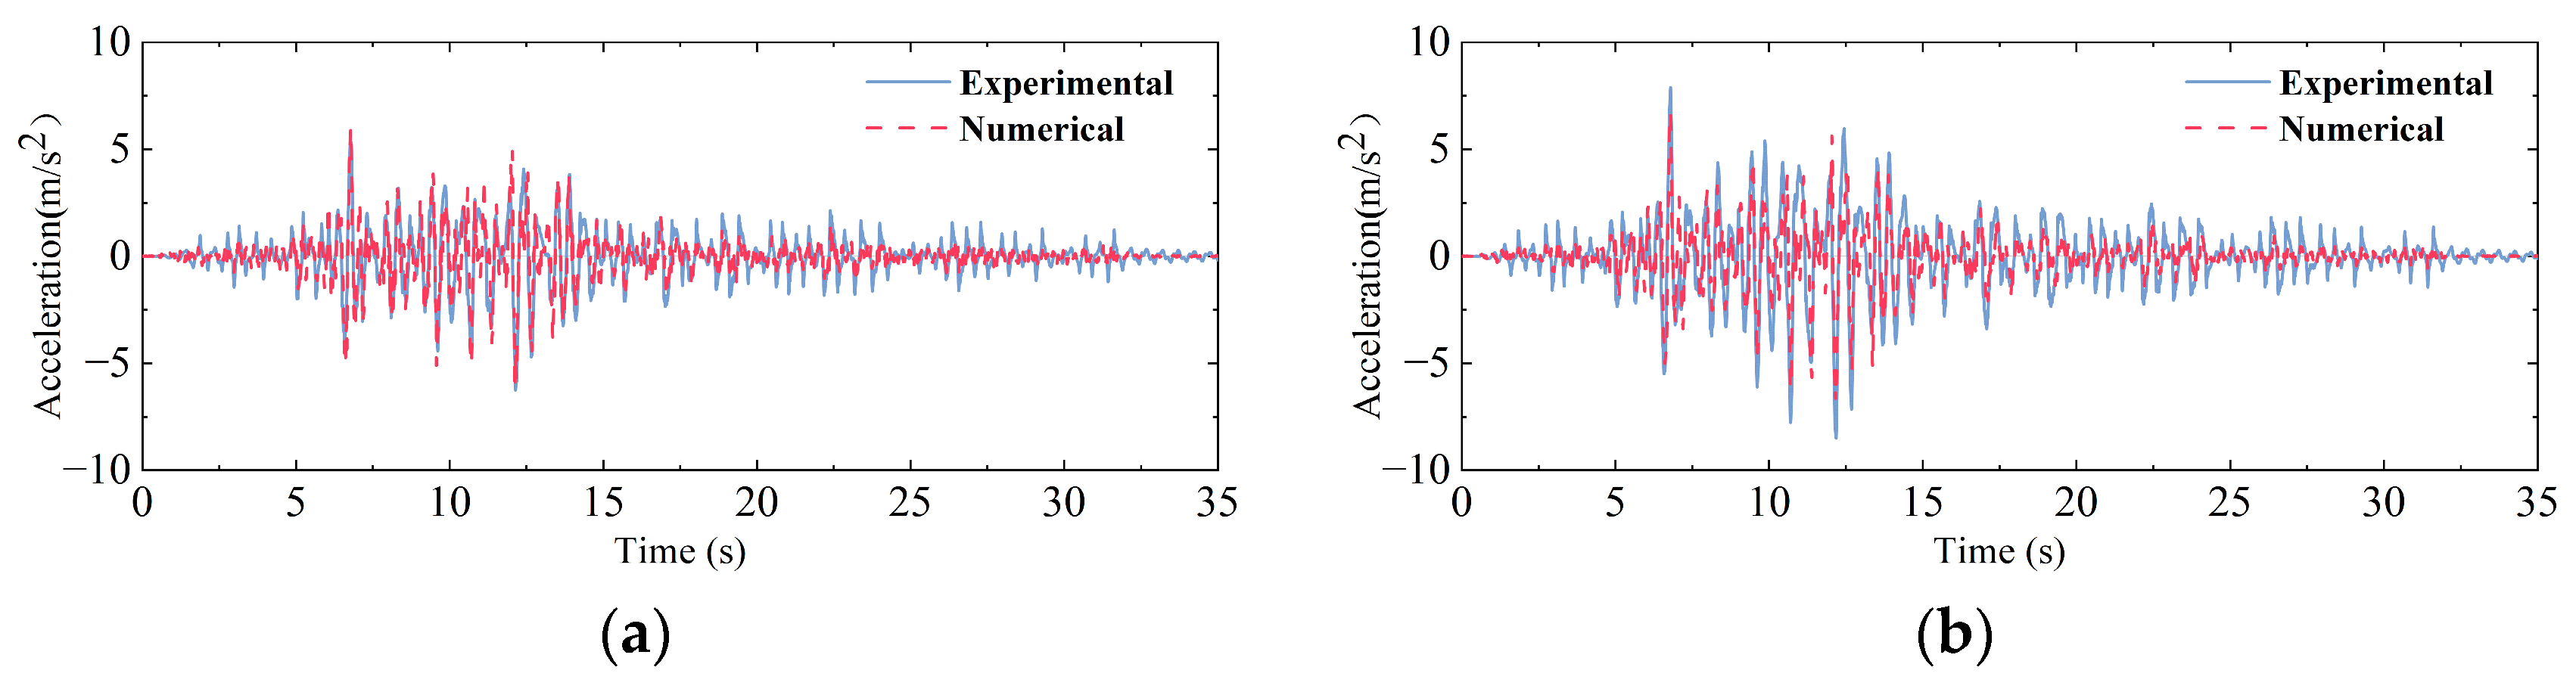
4.3. Validation Against Shaking Table Test Results
4.4. Parametric Analysis
5. Conclusions
- (1)
- Under WNE and SWE, the first-order frequency increases for both SFVD and SFVVD compared with SF remained within 10%. Under WNE conditions, the damping ratios of the SFVD and SFVVD increased by approximately 20% and 30%, respectively. When subjected to SWEs with a PGA of 0.07 g, the damping ratios of the SFVD and SFVVD increased by approximately two and three times, respectively. As the excitation intensity increased, the VVD enhanced the structural damping ratios compared to the VD, while having a minimal impact on the structural frequencies.
- (2)
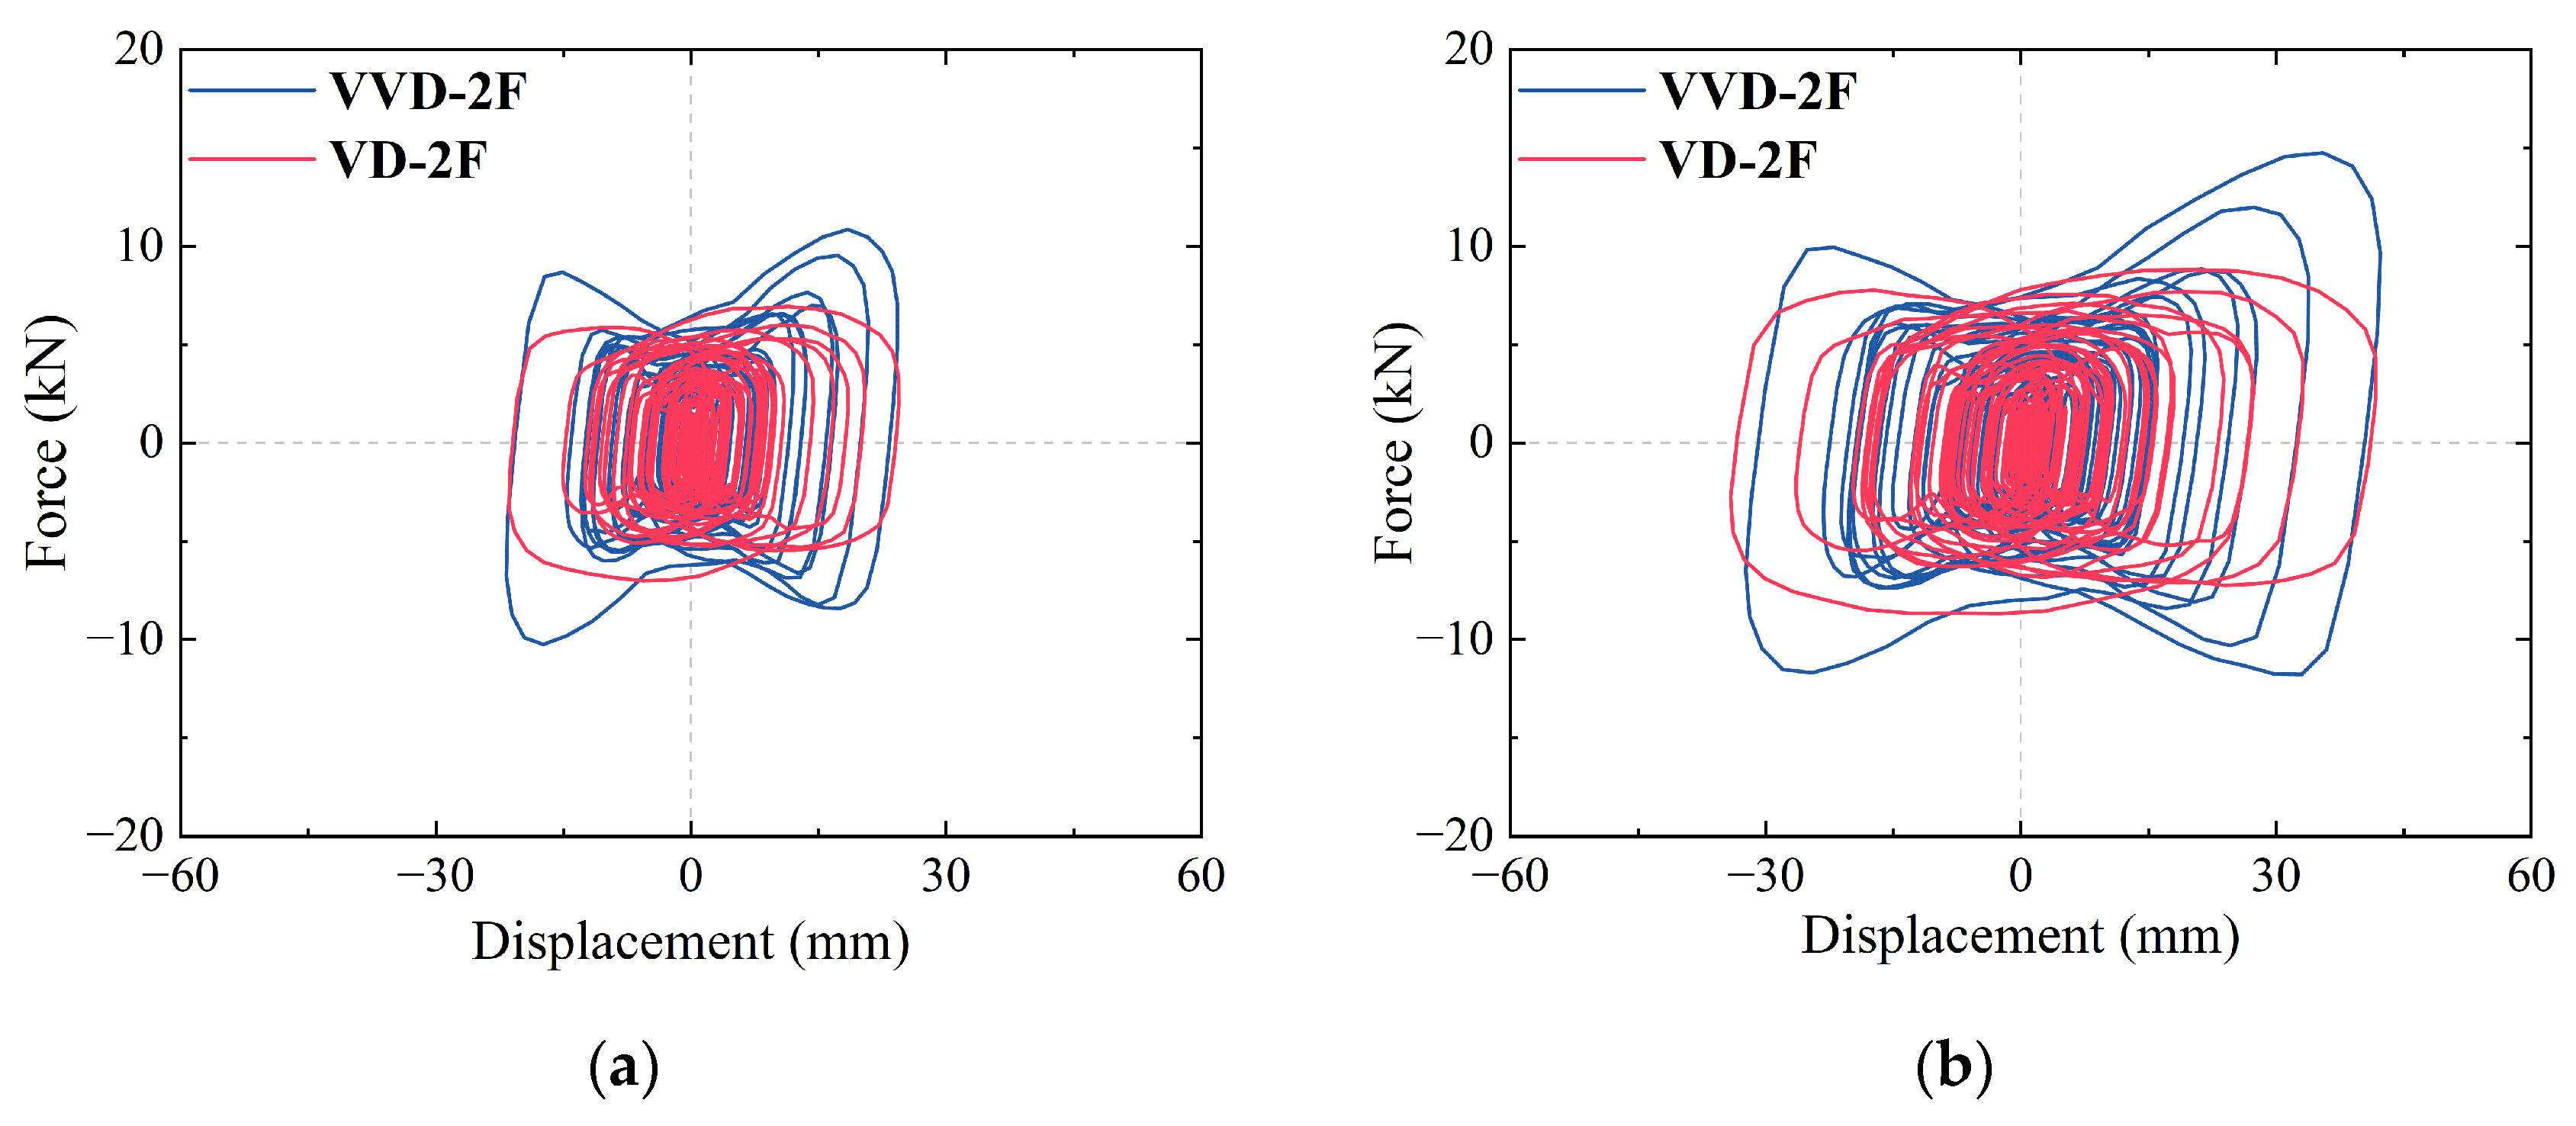
- Under different seismic waves with varying PGA levels, SFVVD reduced inter-story displacement at weak layers by 45–51%, a 10–17% improvement over SFVD. Top-story acceleration was reduced by 24–35% in SFVVD, reflecting a 12–15% improvement compared with that associated with the SFVD. SFVVD also decreased the inter-story shear force by 25–45%, surpassing SFVD by 10–16%. Strain in beams and columns for SFVVD were approximately 17% lower than those in SFVD. Overall, the VVD provided superior damping responses, especially under intense seismic excitation conditions, effectively reducing seismic response.
- (3)
- A VVD material was developed in OpenSees for simulating seismic-reduction structures with VVD. Numerical simulations of shaking table tests validated the precision of this element, with the model predicting dynamic responses with an accuracy of within 6% of experimental results.
- (4)
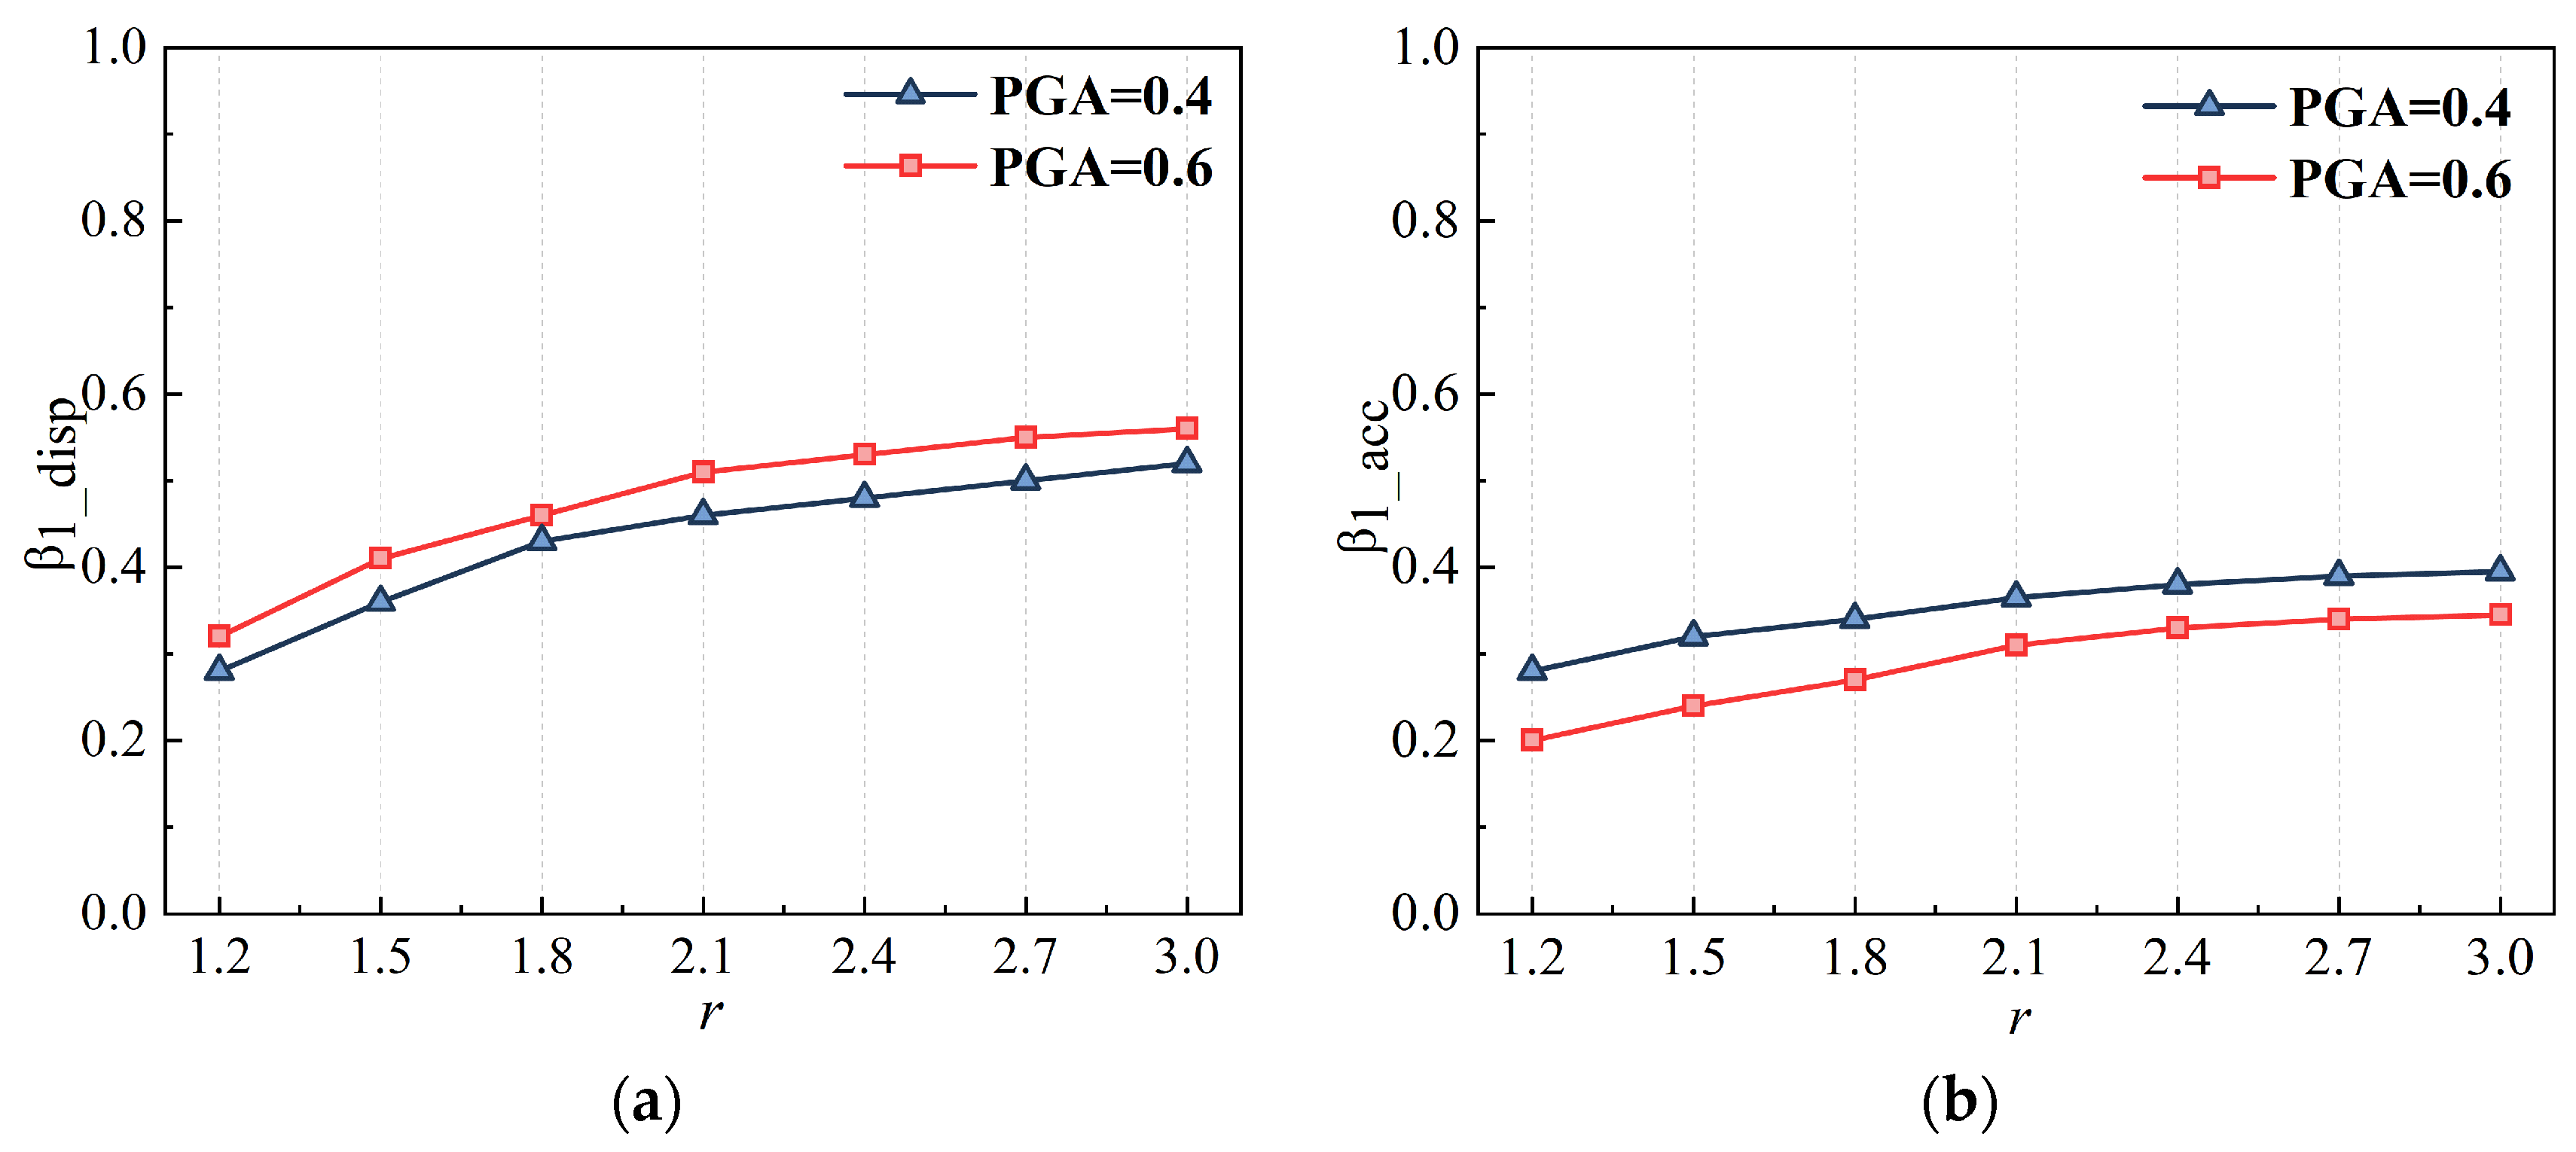
- Based on the numerical model of SFVVD, a parametric analysis was conducted to examine the effects of the ratio of C1 to C2 and the value of α. The results indicated that increasing enhanced the seismic reduction rate of the SFVVD, but when exceeded 2, the seismic reduction rate showed little to no further increase. Additionally, as the value of α increased, the structural seismic reduction rates decreased.
Author Contributions
Funding
Data Availability Statement
Conflicts of Interest
References
- Sarno, L. Effects of multiple earthquakes on inelastic structural response. Eng. Struct. 2013, 56, 673–681. [Google Scholar] [CrossRef]
- Hua, W.; Ye, J. Seismic risk assessment of reticulated shell structures considering multiple uncertainties. Thin-Wall Struct. 2023, 185, 110618. [Google Scholar] [CrossRef]
- Soong, T.; Spencer, B.F. Supplemental energy dissipation: State-of-the-art and state-of-the-practice. Eng. Struct. 2002, 24, 243–259. [Google Scholar] [CrossRef]
- Lai, Z.; Liu, Y.; Zhai, Z.; Chen, H.; Wang, J. Numerical simulation and experimental verification of a velocity-squared damping hybrid mass damper for vibration control of high-rise buildings. Eng. Struct. 2024, 312, 118219. [Google Scholar]
- Kookalani, S.; Shen, D. Effect of Fluid Viscous Damper parameters on the seismic performance. J. Civil. Eng. Mater. App. 2020, 4, 141–153. [Google Scholar]
- Hu, S.; Hu, R.; Hu, M.; Meng, D.; Igarashi, A. Numerical and experimental study on the damping performance of the fluid viscous damper considering the gap effect. J. Vib. Control. 2023, 30, 4946–4963. [Google Scholar] [CrossRef]
- Constantinou, M.C.; Symans, M. Experimental study of seismic response of buildings with supplemental fluid dampers. Struct. Des. Tall Build. 1993, 2, 93–132. [Google Scholar]
- Zhu, W.; Yu, B.; Kaewunruen, S. Shaking table tests of suspended structures equipped with viscous dampers. Appl. Sci. 2023, 9, 2616. [Google Scholar]
- Miao, H.; Zhu, L.; Zhu, L. The shaking table test and the numerical analysis on a novel viscous damper installation conFigureuration. J. Build. Eng. 2024, 83, 108418. [Google Scholar]
- Feng, R.; Xu, W.; Wang, S.; Du, D.; Xie, L.; Miao, Q. Seismic response of two-storey steel frame equipped with metallic yielding and viscous dampers under far-and near-field earthquakes: Shaking table tests and numerical investigations. Structures 2023, 58, 105538. [Google Scholar]
- Wani, Z.; Wani, M. Study on integrated response-based adaptive strategies for control and placement optimization of multiple magneto-rheological dampers-controlled structure under seismic excitations. J. Sound. Vib. 2022, 28, 1712–1726. [Google Scholar] [CrossRef]
- Hong, S.; Choi, S.; Choi, Y.; Choi, N. Non-dimensional analysis and design of a magnetorheological damper. J. Sound. Vib. 2005, 288, 847–863. [Google Scholar] [CrossRef]
- Priyatharrshan, S.; Sename, T.; Sename, O. Identification and comparison of two nonlinear extended phenomenological models for an automotive ElectroRheological (ER) damper. IFAC-PapersOnLine 2005, 54, 439–444. [Google Scholar] [CrossRef]
- Zoccolini, L.; Bruschi, E.; Bruschi, S.; Quaglini, V. Current trends in fluid viscous dampers with semi-active and adaptive behavior. Appl. Sci. 2023, 13, 10358. [Google Scholar] [CrossRef]
- Kuo, W.; Wu, T.; Guo, J.; Chiang, M.; Chen, Y. Design and performance evaluation of a serial multi-electrode electrorheological damper. J. Sound. Vib. 2006, 292, 694–709. [Google Scholar] [CrossRef]
- Chan, Y.; Sun, Y.; Sun, J.; Yuan, S.; Zhao, J.; Zhao, M.; Luo, J.; Pu, H.Y. Design and analysis of a stiffness and damping regulator based on giant electrorheological fluid under multilayered squeeze mode. J. Sound. Vib. 2022, 527, 116864. [Google Scholar]
- Lam, K.; Chen, Z.; Ni, Y.; Chan, H. A magnetorheological damper capable of force and displacement sensing. Sens. Actuators A Phys. 2010, 158, 51–59. [Google Scholar] [CrossRef]
- Xu, Y.; Qu, W.; Ko, J. Seismic response control of frame structures using magnetorheological/electrorheological dampers. Earthq. Eng. Struct. Dynam. 2000, 29, 557–575. [Google Scholar] [CrossRef]
- Hiemenz, G.; Choi, Y.; Wereley, N. Seismic control of civil structures utilizing semi–active MR braces. Comput.-Aided Civ. Inf. 2003, 18, 31–44. [Google Scholar] [CrossRef]
- Das, D.; Datta, T.; Madan, A. Semiactive fuzzy control of the seismic response of building frames with MR dampers. Earthq. Eng. Struct. Dynam. 2012, 41, 99–118. [Google Scholar] [CrossRef]
- Kumar, S.; Chandramohan, S.; Sujatha, S. Geometric optimization of magnetorheological damper for prosthetic ankles using artificial neural networks. Mechatronics 2024, 98, 103108. [Google Scholar]
- Dyke, S.; Spencer, B.; Sain, M.; Carlson, J. An experimental study of MR dampers for seismic protection. Smart Mater. Struct. 1998, 7, 693. [Google Scholar]
- Wani, Z.; Tantray, M.; Farsangi, E. Shaking table tests and numerical investigations of a novel response-based adaptive control strategy for multi-story structures with magnetorheological dampers. J. Build. Eng. 2021, 44, 102685. [Google Scholar]
- Sha, H.; Chong, X.; Xie, L.; He, L.; Jiang, Q.; Gao, J. Study on seismic performance of RC frame with UHPC cladding panels and two-level friction damping connections. J. Build. Eng. 2024, 95, 110118. [Google Scholar]
- Xu, W.Z.; Cai, Y.; Zhang, T.; Wang, S.; Du, D.; Wan, L. Experimental and numerical investigations of a staged energy dissipation device. Thin-Wall Struct. 2024, 198, 111721. [Google Scholar] [CrossRef]
- Yang, C.; Xie, L.; Xie, Q.; Li, A.; Liu, Q.; Wang, X. Dual-objective control of braced steel frame using asynchronized parallel two-stage yielding BRB. Soil. Dyn. Earthq. Eng. 2024, 179, 108522. [Google Scholar] [CrossRef]
- Hazaveh, N.; Hazaveh, G.; Chase, J.; Pampanin, S. Experimental test and validation of a direction-and displacement-dependent viscous damper. J. Eng. Mech. 2017, 143, 04017132. [Google Scholar]
- Eyres, R.; Champneys, A.; Lieven, N. Modelling and dynamic response of a damper with relief valve. Nonlinear Dyn. 2005, 40, 119–147. [Google Scholar]
- Kasai, K.; Ito, H.; Ooki, Y.; Ozaki, H.; Ishii, M. Full-scale shake table tests of 5-story steel building with various dampers. In Proceedings of the 7th International Conference on Urban Earthquake Engineering (7CUEE) & 5th International Conference on Earthquake Engineering, (5ICEE), Tokyo, Japan, 3–5 March 2010. [Google Scholar]
- Liu, X.; Wang, W.; Li, J. Full-scale shaking table tests and numerical studies of structural frames with a hybrid isolation system. Eng. Struct. 2023, 292, 116545. [Google Scholar]
- Xu, W.; Du, D.; Wang, S.; Liu, W.; Li, W. Shaking table tests on the multi-dimensional seismic response of long-span grid structure with base-isolation. Eng. Struct. 2019, 201, 109802. [Google Scholar]
- Ge, M.; Hao, J.; Yu, J.; Yan, P.; Xu, S. Shaking table test of buckling-restrained steel plate shear walls. J. Constr. Steel Res. 2017, 137, 254–261. [Google Scholar]
- GB 50011-2010; Code for Seismic Design of Buildings. Architecture Industry Press of China: Beijing, China, 2016. (In Chinese)
- Zhang, T.; Xu, W.; Wang, S.; Du, D.; Tang, J. Seismic response prediction of a damped structure based on data-driven machine learning methods. Eng. Struct. 2024, 301, 117264. [Google Scholar] [CrossRef]
- Akcelyan, S.; Akcelyan, D.; Hikino, T. Adaptive numerical method algorithms for nonlinear viscous and bilinear oil damper models subjected to dynamic loading. Soil. Dyn. Earthq. Eng. 2018, 113, 488–502. [Google Scholar]
- Guan, M.; Hang, X.; Wang, M.; Zhao, H.; Liang, Q.; Wang, Y. Development and implementation of shear wall finite element in OpenSees. Eng. Struct. 2024, 304, 117639. [Google Scholar] [CrossRef]
- Xie, L.; Sha, H.; Chong, X.; Jia, J. Seismic performance comparison between reinforced concrete frame structures with and without energy dissipating cladding panel system: Shaking table test and numerical simulation. J. Build. Eng. 2022, 62, 105414. [Google Scholar]


| Damper | L (mm) | s (mm) | d (mm) | D1 (mm) | D2 (mm) | Viscosity (×104 mm2/s) |
|---|---|---|---|---|---|---|
| VD | 45 | / | 20 | 47 | / | 20 |
| VVD | 45 | 5 | 20 | 47 | 46 | 20 |
| Steel Members | Section Dimensions |
|---|---|
| Beam | HW 200 × 150 × 6 × 9 mm |
| Column | HW 150 × 150 × 7 × 10 mm |
| Brace | HW 150 × 150 × 7 × 10 mm |
| SWE | Year | Magnitude | Rib (km) | Rrup (km) | PGA (g) |
|---|---|---|---|---|---|
| Terminal Island | 1994 | 6.69 | 53.43 | 57.2 | 0.1885 |
| TAFT | 1952 | 7.36 | 38.42 | 38.89 | 0.1803 |
| San Fernando | 1971 | 6.69 | 173.16 | 173.16 | 0.0363 |
| Northridge | 1994 | 6.69 | 0 | 6.5 | 0.8909 |
| Test Structure | PGA | PFA | Reduction Rate | AC | Reduction Rate |
|---|---|---|---|---|---|
| SF | 0.2 | 6.04 | - | 2.78 | - |
| SFVD | 4.03 | 0.33 | 1.88 | 0.32 | |
| SFVVD | 3.71 | 0.38 | 1.52 | 0.45 | |
| SF | 0.4 | 8.21 | - | 2.02 | - |
| SFVD | 6.63 | 0.19 | 1.58 | 0.22 | |
| SFVVD | 5.59 | 0.32 | 1.24 | 0.38 | |
| SF | 0.6 | 10.67 | - | 1.71 | - |
| SFVD | 9.44 | 0.12 | 1.48 | 0.14 | |
| SFVVD | 8.10 | 0.24 | 1.01 | 0.35 |
| Test structure | PGA | ||
|---|---|---|---|
| SFVD | 0.2 | 0.39 | 0.33 |
| SFVVD | 0.44 | 0.38 | |
| SFVD | 0.4 | 0.29 | 0.19 |
| SFVVD | 0.38 | 0.35 | |
| SFVD | 0.6 | 0.19 | 0.11 |
| SFVVD | 0.26 | 0.24 |
| Parameter | C1 | C2 | K | s | L | |
|---|---|---|---|---|---|---|
| Unit | / |
| Model | K | C1 | C2 | s | L | |
|---|---|---|---|---|---|---|
| VVD | 6500 | 675 | 1205 | 0.4 | 5 | 45 |
| PGA (g) | Absolute Displacement (mm) | Relative Error (%) | Absolute Acceleration (m/s2) | Relative Error (%) | ||
|---|---|---|---|---|---|---|
| Experimental Results | Numerical Results | Experimental Results | Numerical Results | |||
| 0.4 | 41.01 | 42.72 | 4.1% | 6.26 | 6.38 | 1.8% |
| 0.6 | 53.44 | 56.21 | 5.1% | 6.74 | 7.21 | 5.4% |
Disclaimer/Publisher’s Note: The statements, opinions and data contained in all publications are solely those of the individual author(s) and contributor(s) and not of MDPI and/or the editor(s). MDPI and/or the editor(s) disclaim responsibility for any injury to people or property resulting from any ideas, methods, instructions or products referred to in the content. |
© 2025 by the authors. Licensee MDPI, Basel, Switzerland. This article is an open access article distributed under the terms and conditions of the Creative Commons Attribution (CC BY) license (https://creativecommons.org/licenses/by/4.0/).
Share and Cite
Liu, M.; Cao, C.; Zhu, Z.; Xu, W.; Du, D.; Wang, S.; Sun, C. Shaking Table Tests and Numerical Analysis of a Steel Frame Employing Novel Variable-Coefficient Viscous Dampers. Buildings 2025, 15, 1046. https://doi.org/10.3390/buildings15071046
Liu M, Cao C, Zhu Z, Xu W, Du D, Wang S, Sun C. Shaking Table Tests and Numerical Analysis of a Steel Frame Employing Novel Variable-Coefficient Viscous Dampers. Buildings. 2025; 15(7):1046. https://doi.org/10.3390/buildings15071046
Chicago/Turabian StyleLiu, Muhan, Chuying Cao, Zhenyu Zhu, Weizhi Xu, Dongsheng Du, Shuguang Wang, and Chuanzhi Sun. 2025. "Shaking Table Tests and Numerical Analysis of a Steel Frame Employing Novel Variable-Coefficient Viscous Dampers" Buildings 15, no. 7: 1046. https://doi.org/10.3390/buildings15071046
APA StyleLiu, M., Cao, C., Zhu, Z., Xu, W., Du, D., Wang, S., & Sun, C. (2025). Shaking Table Tests and Numerical Analysis of a Steel Frame Employing Novel Variable-Coefficient Viscous Dampers. Buildings, 15(7), 1046. https://doi.org/10.3390/buildings15071046