Article

Sustainability Drivers and Sustainable Development Goals-Based Indicator System for Prefabricated Construction Adoption—A Case of Developing Economies

by
Janappriya Jayawardana
1,2,
Malindu Sandanayake
3,*,
J. A. S. C. Jayasinghe
4,
Asela K. Kulatunga
5 and
Guomin Zhang
1,*
1
Civil and Infrastructure Engineering, School of Engineering, RMIT University, Melbourne, VIC 3001, Australia
2
Department of Manufacturing and Industrial Engineering, Faculty of Engineering, University of Peradeniya, Peradeniya 20400, Sri Lanka
3
Institute of Sustainable Infrastructure and Liveable Cities, Victoria University, Melbourne, VIC 3011, Australia
4
Department of Civil Engineering, Faculty of Engineering, University of Peradeniya, Peradeniya 20400, Sri Lanka
5
Department of Engineering, Faculty of Environment, Science, and Economics, University of Exeter, Exeter EX4 4PY, UK
*
Authors to whom correspondence should be addressed.
Buildings 2025, 15(7), 1037; https://doi.org/10.3390/buildings15071037
Submission received: 2 March 2025 / Revised: 19 March 2025 / Accepted: 21 March 2025 / Published: 24 March 2025
(This article belongs to the Section Construction Management, and Computers & Digitization)

Abstract

Understanding the complex interaction between sustainability drivers (SDs) and the sustainable development goals (SDGs) within construction practices is essential to accelerating the global construction industry’s transition towards sustainable development. The current study aims to establish a universal measurable indicator system that establishes relationships between SDs that are relevant to prefabricated construction (PFC) and specific SDGs. The developed indicators measure how effectively PFC aligns with and contributes to achieving the targeted SDGs. A case study in Sri Lanka is used to identify and validate the usefulness of key SDs in advancing PFC in developing economies. The research methodology comprised a literature search, a pilot study, a questionnaire survey targeting PFC stakeholders, statistical analysis, an SDG mapping process, and a case study-based demonstration. The statistical analysis highlighted a reduced overall project time, the efficient consumption of materials, and overall project cost savings as the most significant SDs. The factor analysis grouped these SDs into four categories, explaining 71.48% of the cumulative variance. A fuzzy evaluation confirmed the critical role of all driver categories in the effective diffusion of prefabrication. The developed indicator system establishes a structured connection between SDs, SDGs, impacts, stakeholders, and indicator types. The case study analysis highlighted the potential of precast construction and the use of modular design in disassembly approaches to improve sustainability outcomes, which would directly support SDG targets such as resource efficiency (SDG 8.4) and health and pollution management goals (SDG 3.9). The outcomes provide valuable insights for construction industry stakeholders in developing economies committed to improving construction efficiencies. The proposed indicator system also contributes to the global construction sector’s efforts toward achieving the goals of the 2030 Agenda for Sustainable Development.

1. Introduction

Achieving sustainable development demands a collective effort across all sectors to meet the present needs without compromising future generations [1]. The construction industry plays a pivotal role in global development by providing essential infrastructure, housing, employment, and economic growth [2]. Construction outputs such as buildings and bridges often have service lives exceeding 50 years, highlighting their long-term environmental and societal impact [3]. Given its significance, the concept of sustainable development has evolved to include sustainable construction [4]. Research indicates that the construction industry consumes about 40% of available material resources, 25% of available water, and 35% of the global energy while emitting around 40% of the worldwide carbon emissions [5,6]. Hence, the international building and infrastructure sector actively investigates innovative and sustainable construction techniques to mitigate its adverse effects.
PFC is an emerging solution in which building components are manufactured in off-site facilities and subsequently transported and assembled on-site [7]. Compared to traditional construction methods, PFC offers competitive advantages, including enhanced product quality, increased productivity, faster delivery, and minimised material waste [8,9]. However, despite these well-perceived benefits, global PFC adoption remains inconsistent, with a distinct disparity between high-income and low-income economies [10]. Developed economies often prioritise sustainability through the use of advanced technology and supportive policies, while developing economies typically prioritise urgent housing affordability, shortages, and efficiency challenges due to resource and technological constraints [11]. Over the past decade, countries such as China, Nigeria, South Africa, and Malaysia have actively investigated SDs to promote PFC adoption. Conversely, the research on PFC in South Asian nations remains limited due to insufficient research and development (R&D) initiatives [12]. Currently, only a few Sri Lankan construction firms utilise prefabrication, primarily using it in panelised systems and bridge components, with there being limited market penetration [12,13,14]. A survey by Uthpala and Ramachandra [15] identified low awareness and negative public perception as primary challenges to embracing modern construction methods in Sri Lanka. Therefore, establishing sustainability drivers is crucial for facilitating the broader diffusion of PFC in Sri Lanka, and these drivers inform both construction industry practitioners (CIPs) and the public.
The existing literature has not developed an indicator system for measuring SDs that influence PFC adoption, limiting the availability of case study-based insights. Eberle et al. [16] emphasised that scientific research has inadequately assessed the contribution of products and organisations to meeting the SDGs through sustainability assessments. Similarly, Alejandrino et al. [17] stressed the need to establish links between SDGs and sustainability performance indicators. This gap presents a research opportunity to develop a sustainability driver-based indicator system aligned with SDGs that are relevant to PFC. Thus, this study aims to identify the SDs that are significant for PFC adoption and proposes a universal measurable indicator system. The application of the indicator model is demonstrated through case study analysis. The findings will elevate understanding among CIPs, policymakers, and academics, facilitating the promotion, evaluation, and implementation of PFC to maximise the sustainability benefits of construction projects.

2. Background

2.1. Sustainability Drivers for the Adoption of Prefabricated Construction

PFC enables parallel construction activities in off-site manufacturing factories and on-site locations (e.g., site preparation and foundation work), streamlining project schedules and activities [18]. The controlled production environment in PFC enhances quality control and assurance [19]. Furthermore, integrating advanced technologies such as automation, digital software tools, additive manufacturing, and intelligent sensing improves the productivity across project life cycles [19,20]. Automation in production processes mitigates industry skill shortages while enhancing efficiency. The combination of automation with digital engineering, repetitive processes, and specialised labour improves the quality of products, particularly in terms of their colour, finish, and tolerance specifications [20,21].
PFC minimises weather-related delays by enabling simultaneous off-site manufacturing, ensuring greater time certainty in project delivery [22,23]. The controlled factory environment enhances worker health, safety, and the overall working conditions. Ahn et al. [24] found that PFC significantly reduces safety risks, particularly those associated with work-at-height activities. Additionally, fewer on-site trades minimise noise and dust pollution [25]. From a financial perspective, reduced dependence on skilled trades, lower unanticipated labour costs, and optimised resource use elevate cost competitiveness over the entire life cycle of buildings, despite potential similarities or higher initial construction costs compared to traditional methods [26]. Further, well-planned and controlled processes and improved waste management contribute to efficient material utilisation and minimise waste generation [27,28]. Moreover, the increased potential of PFC to reduce on-site carbon emissions and enhance the energy efficiency of prefabricated building systems supports sustainability objectives, improving the overall sustainability performance of PFC [20]. Table 1 summarises the primary SDs derived from both the pilot study and the review of the existing literature.

2.2. Sustainable Development Goals

The United Nations (UN) General Assembly 2015 introduced a comprehensive framework consisting of 17 SDGs, 160 targets, and 247 indicators with the consensus of 193 member nations as part of the 2030 Agenda for Sustainable Development [29]. Building upon the triple bottom line of sustainability—environmental, economic, and social sustainability, the global indicator framework for the SDGs covers the five Ps: people, planet, profit, peace, and partnership, serving as guiding principles for nations and regions in obtaining sustainable development [30]. The proposed framework addresses a wide range of development aspects, including poverty and hunger, health and well-being, gender equality, economic growth, industry and innovation, sustainable cities, water, energy, and climate action.
Despite the passage of over three-quarters of a decade since the introduction of the SDGs, studies increasingly underscore the need for more comprehensive efforts to realise the broader agenda [31]. From an R&D perspective, Eberle et al. [16] emphasise the inadequacy of current systematic assessment methods to evaluate the contributions of products and organisations to achieving the SDGs. Furthermore, Omer et al. [31] stressed the requirement for expansive analyses and tools to assess and devise strategies for achieving the SDG targets by 2030. In the context of construction, traditional construction practices present inherent sustainability challenges that hinder efficient support for the SDGs and other regulations [11]. As prefabrication holds considerable potential to enhance holistic sustainability, further research linking SDGs with prefabrication aspects is vital to advance the current knowledge base.
Table 1. Key sustainability drivers towards adoption of prefabricated construction.
CodeMajor Sustainability DriverReferences
D1Overall project cost savings[18,19,20,32,33,34,35]
D2Reduce overall project time (Fast delivery)[18,19,20,22,23,32,33,34,35,36,37]
D3Minimise weather-related delays[18,19,20,22,23,34,37]
D4Ensure cost and time certainty[18,19,23,36,38,39]
D5Waste reduction and potential for better waste management practices[18,19,22,23,33,34,36,37,38]
D6Efficient consumption of materials[18,19,22,35,36,38]
D7Potential to enhance energy efficiency and reduce carbon emissions[18,19,22,23,36,37,38]
D8Less disturbance on-site from noise and dust[18,19,20,23,34,36]
D9Improved health and safety and working conditions of workers[18,19,22,23,32,33,34,36,37,39]
D10Higher end-product quality (e.g., finishing, tolerances)[18,19,20,23,32,33,34,36,37,38,39]
D11Improved project quality control[18,19,23,34,36]
D12Simplify construction activities[18,19,34,36,38]
D13Improved technology integration, such as automation, 3D printing, BIM 1, Immersive technologies and IoT 2[18]
D14Improved productivity[20,22,23,33,35,37,38]
D15Addressing the industry skills shortage[18,19,33,34,37,39]
1 BIM—building information modelling, 2 IoT—internet of things.

2.3. Research Significance

The significance of this research lies in its contribution to the global transition towards sustainable construction through establishing a measurable and universally applicable indicator system that links SDs with SDGs. This study addresses a gap in understanding regarding how PFC can systematically advance sustainability objectives in developing economies. The existing research highlights the role of prefabrication in reducing environmental footprints, minimising material waste, and improving energy efficiency [39,40,41]. However, a structured framework connecting these advantages to specific SDGs remains to be developed [42]. The proposed indicator system bridges this gap and will enhance decision-making by linking these goals to measurable indicators.
By applying the developed indicator system to case studies of precast and modular buildings, this study aims to empirically validate the link between PFC’s SDs and SDG targets. Previous research suggests that PFC contributes to multiple SDGs, particularly SDG 9 (Industry, Innovation, and Infrastructure) and SDG 12 (Responsible Consumption and Production) [43,44]. The current study strengthens these suggestions by integrating other SDGs (such as SDG13—Climate Action) and demonstrating how PFC-driven midpoint environmental impacts align with SDG targets.

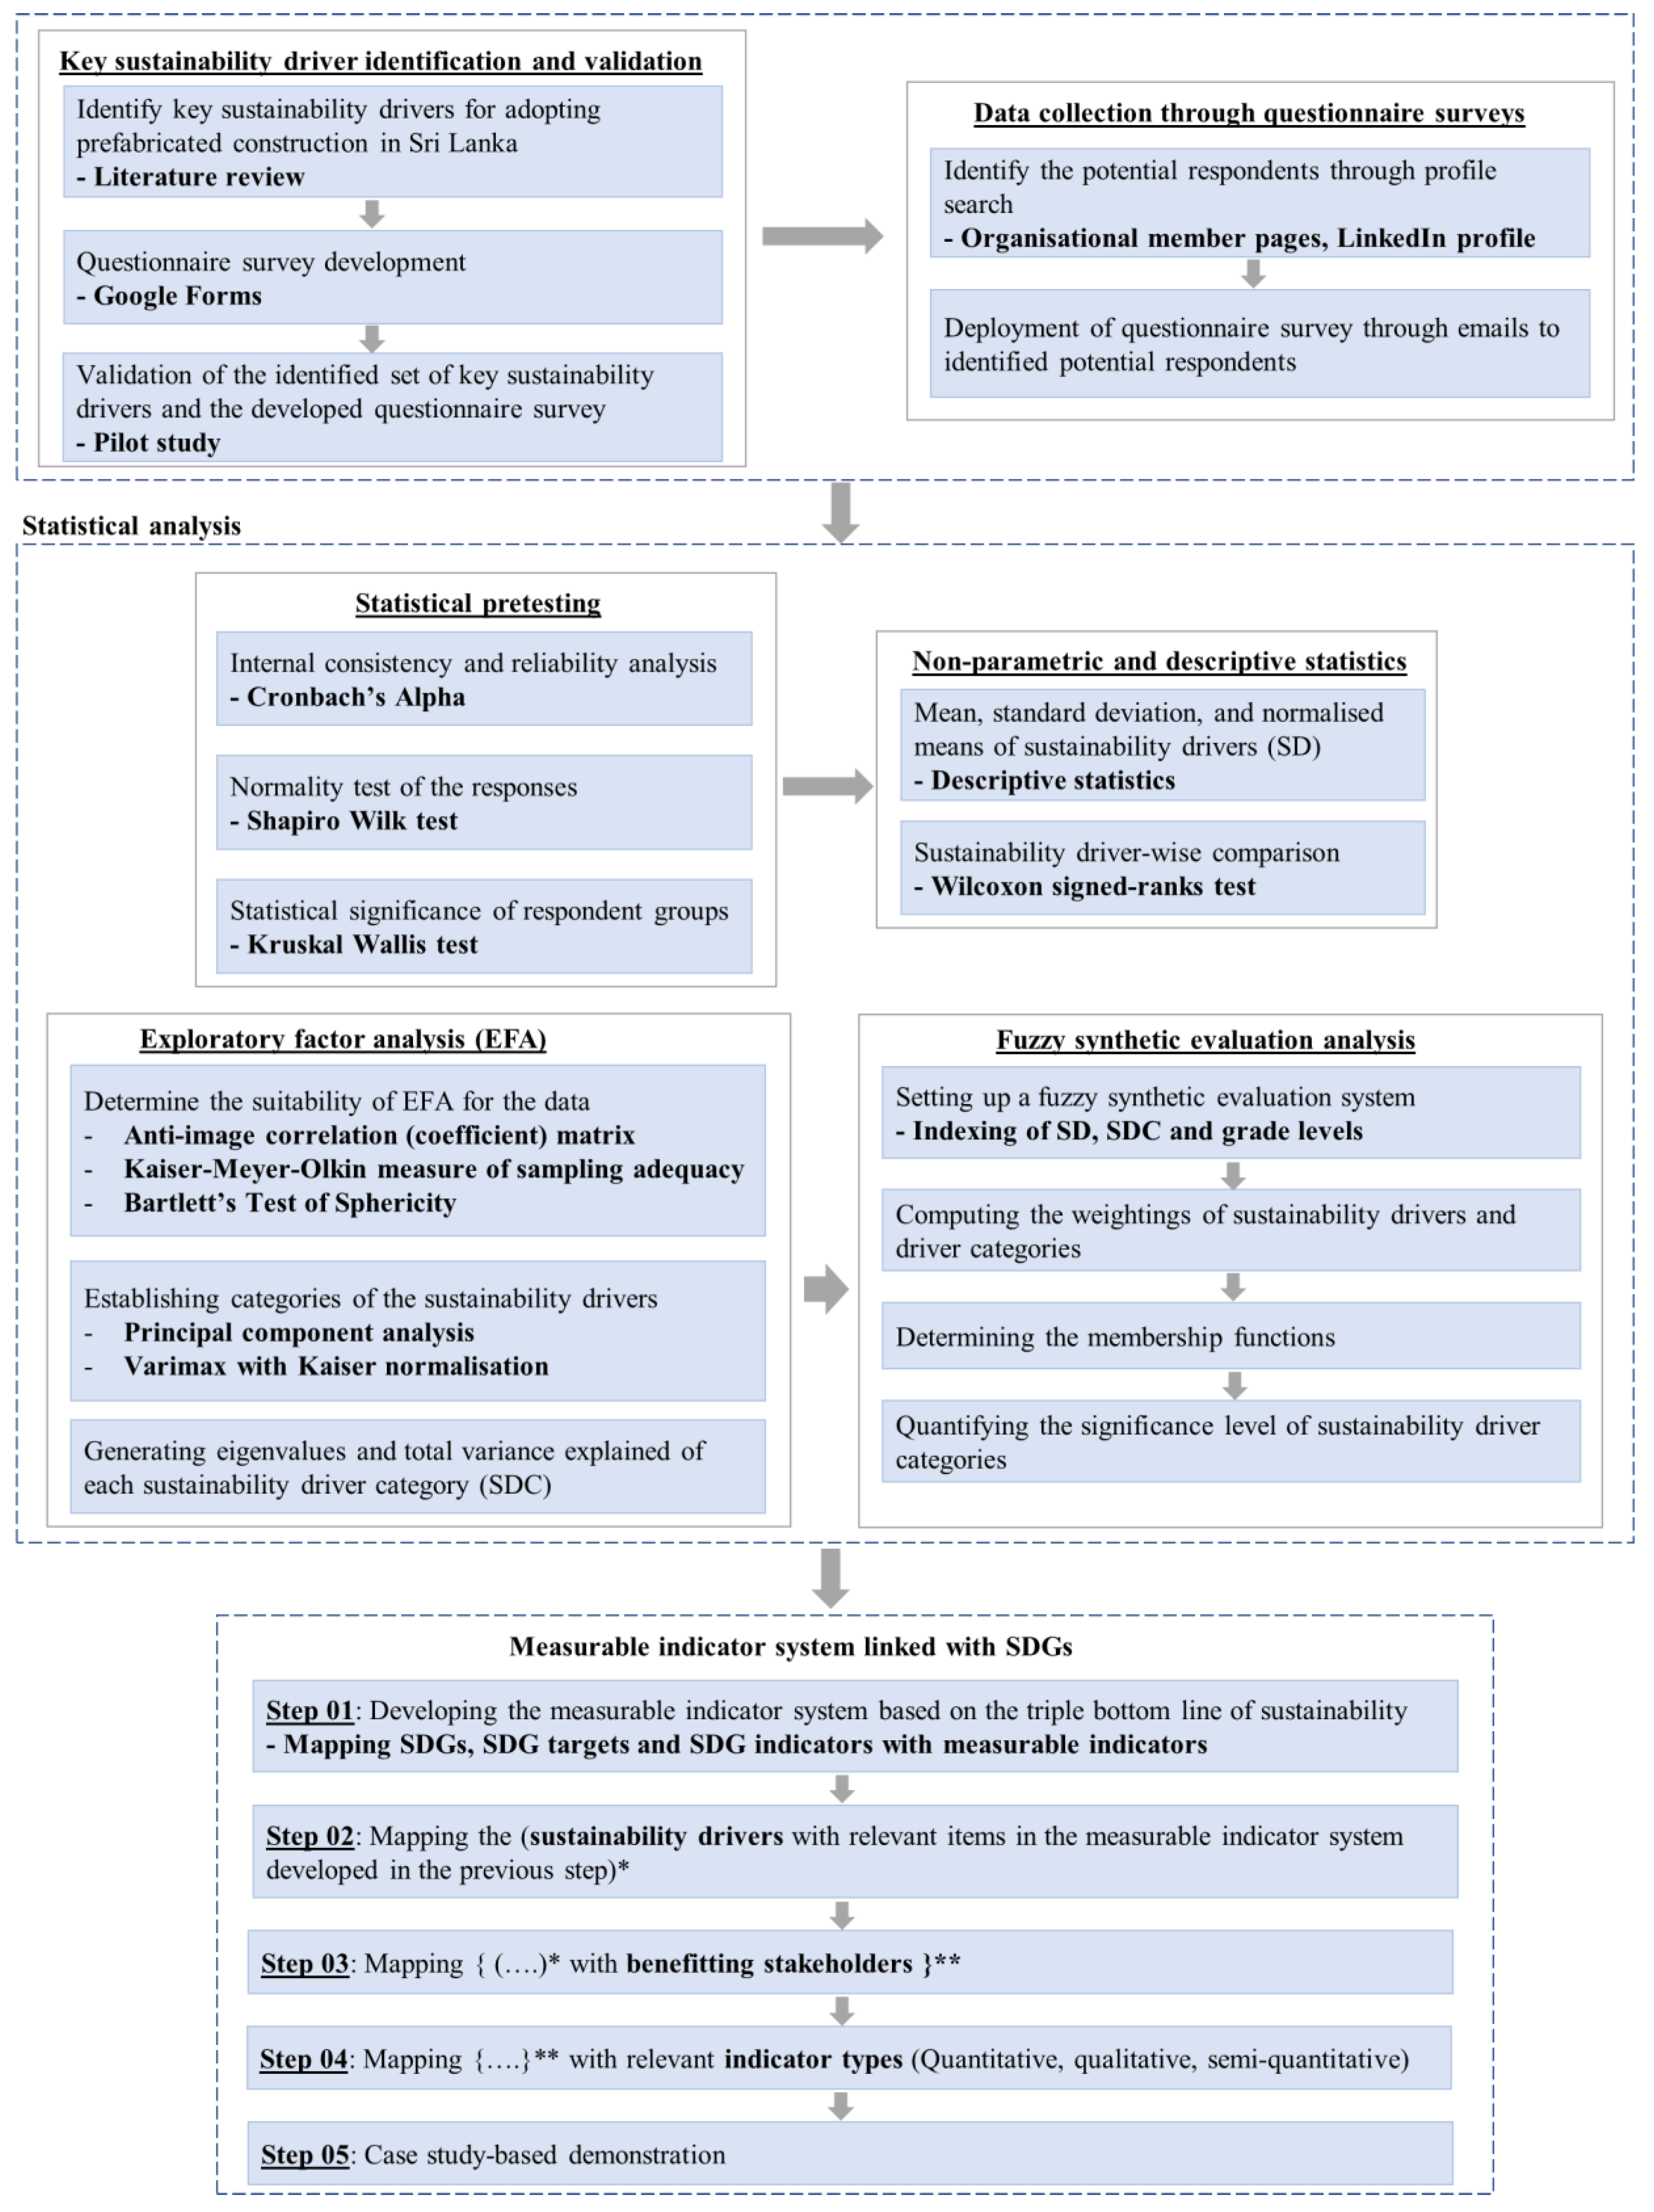
3. Research Methodology

As illustrated in Figure 1, this study adopted quantitative and qualitative approaches to accomplish its research objectives. The research process consisted of four primary phases. Initially, a comprehensive literature survey and pilot study were conducted to identify the major SDs. Subsequently, data were collected via a questionnaire form followed by a statistical data analysis. Finally, an analysis was performed to propose a measurable indicator system for the SDs, linking them to the SDGs.

3.1. Key Sustainability Driver Identification

A comprehensive literature review was conducted to recognise the key SDs influencing the adoption of prefabrication in developing countries. For the Scopus database, the literature search incorporated a search string (Table A1) with equivalent terms for ‘sustainability drivers’ and ‘prefabricated construction’, and relevant studies from the last decade were selected to determine the sustainability enablers from a developing economy perspective. A pilot study examined the relevancy and applicability of the chosen SDs to the current status of the PFC sector in developing regions. A questionnaire was developed through Google Forms and was also reviewed for its accuracy, clarity, and suitability for the intended audience. The expert review panel, with diverse professional backgrounds, included two CIPs and two academic experts. The feedback from the review panel aided in enriching the questionnaire by allowing the rephrasing and reordering of certain questions and factors for more clarity and answerability.

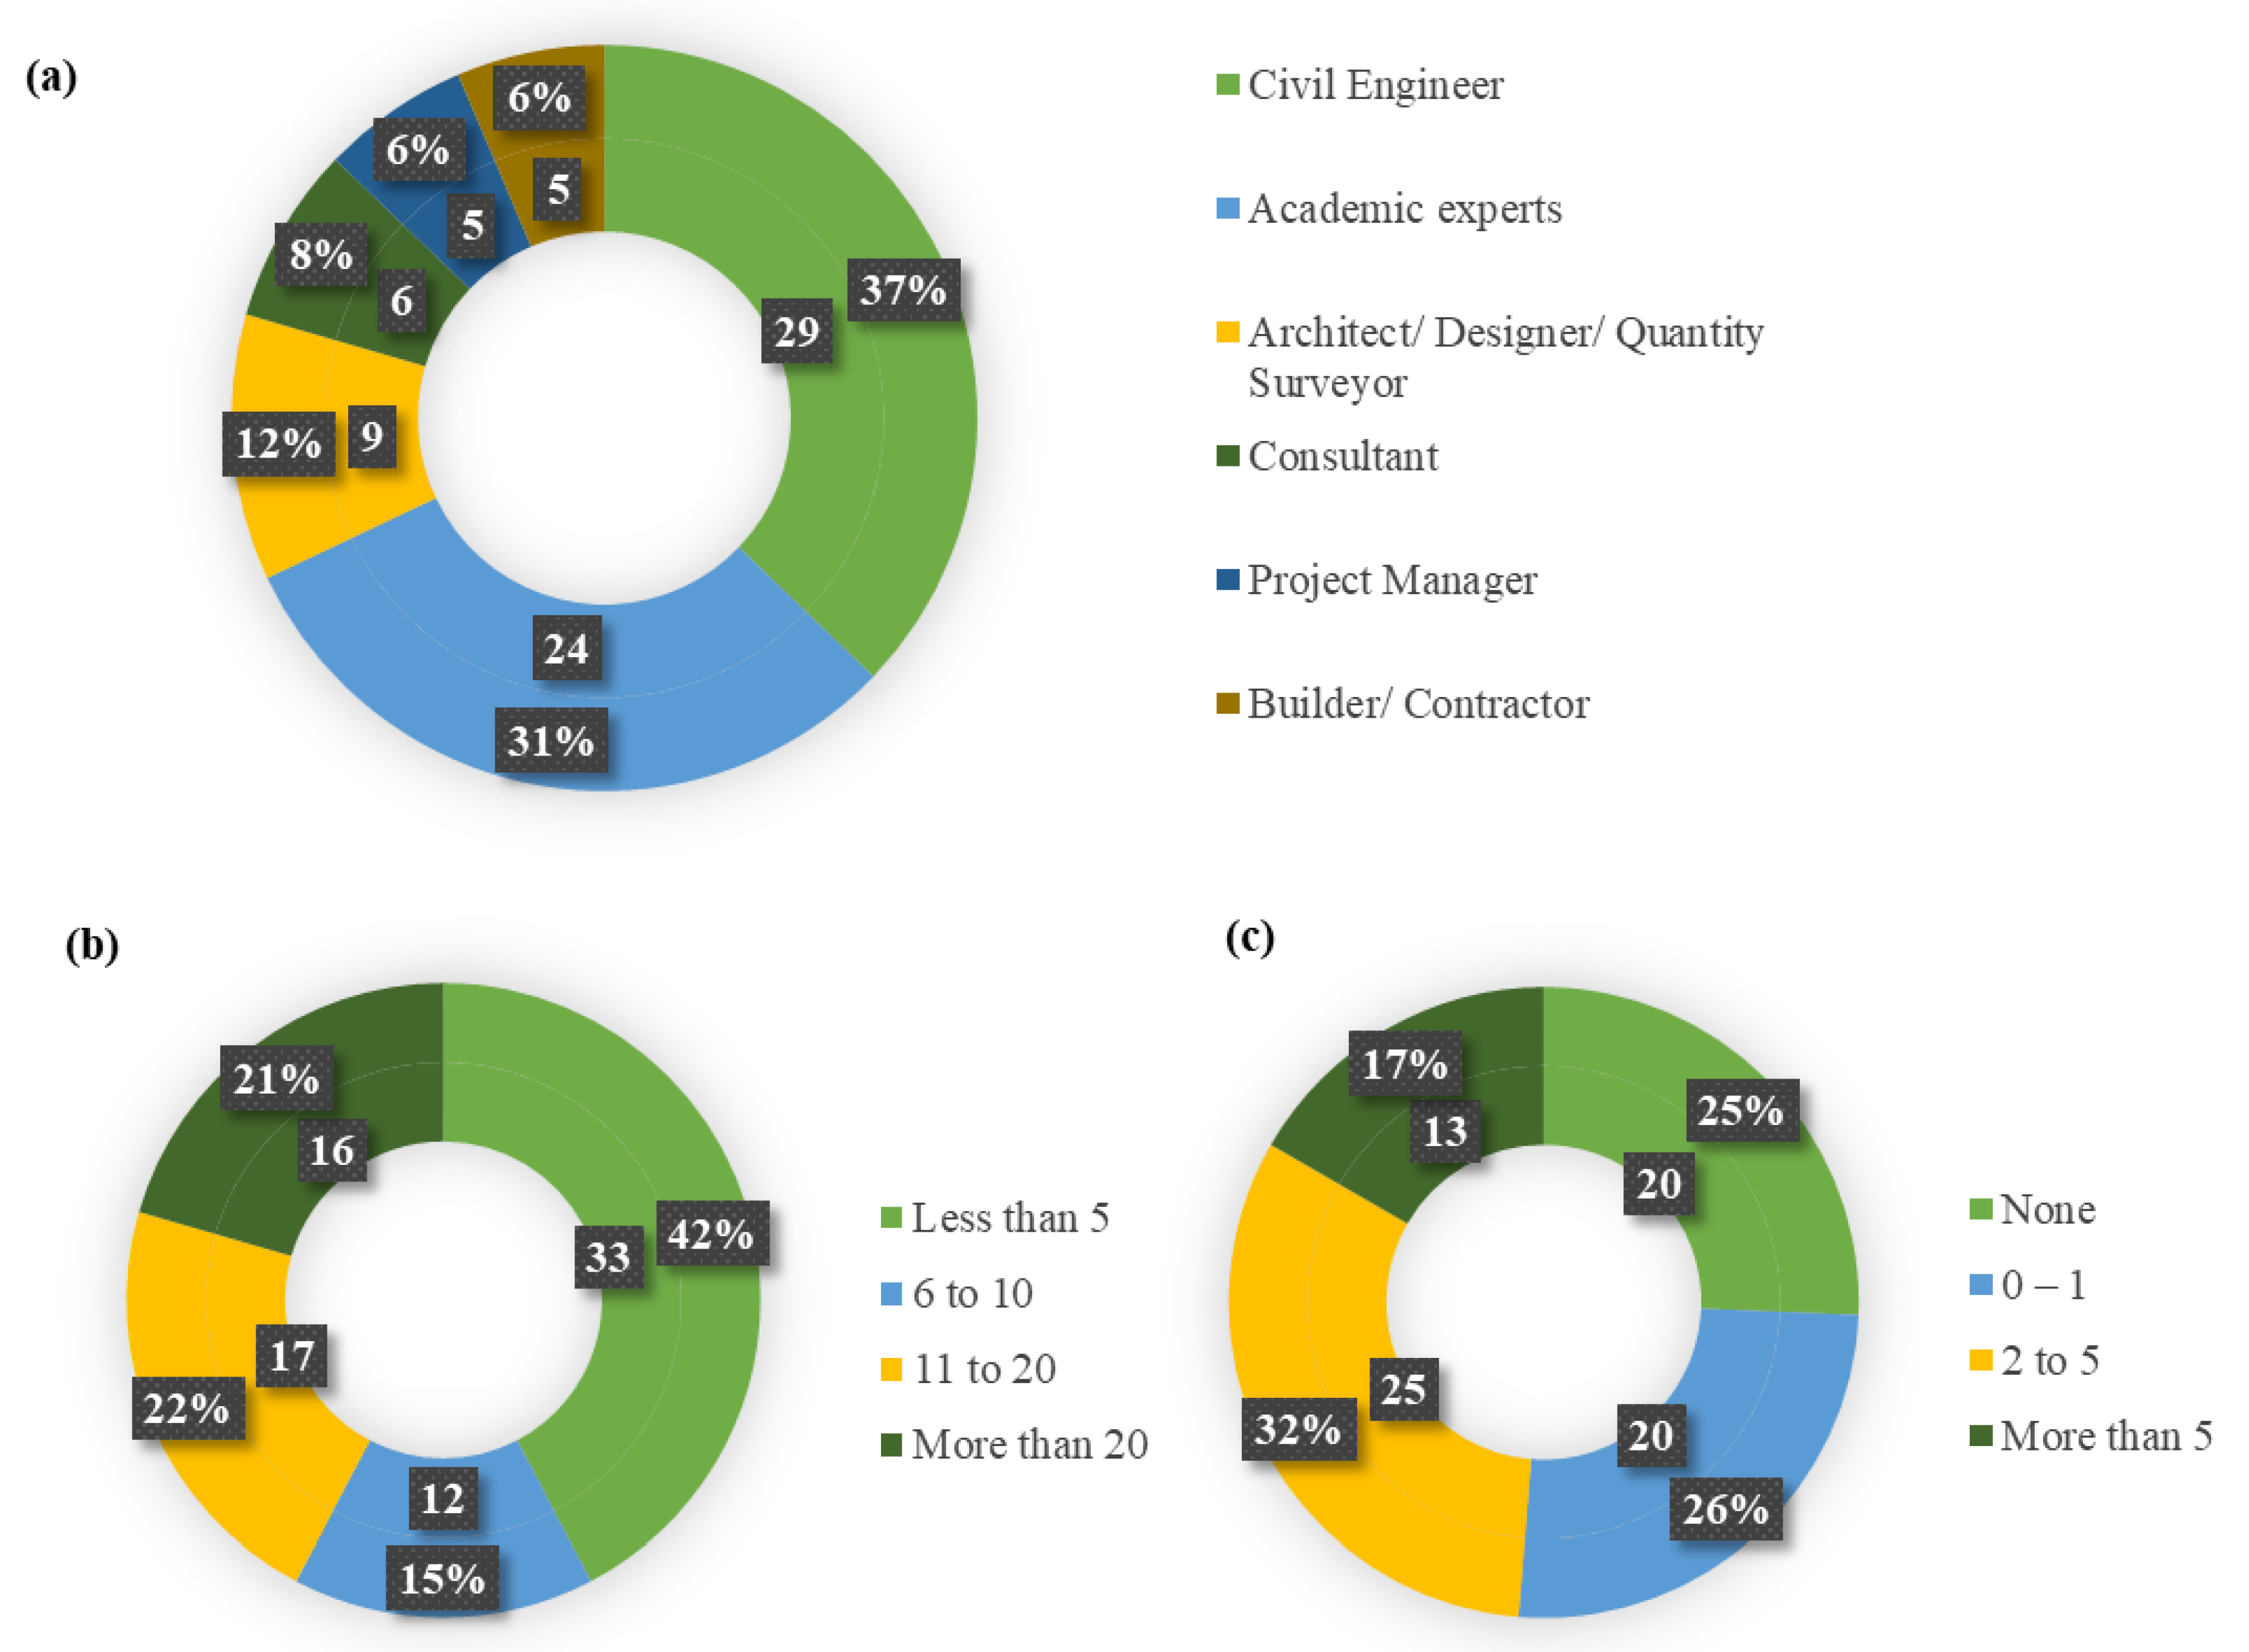
3.2. Data Collection Through Questionnaire Forms

The questionnaire survey was structured into three main sections. The first section outlined the survey’s objectives and duration and provided a brief definition of PFC. Section two collected information about the respondents’ professional backgrounds, specifically focusing on their occupation, years of experience in the construction industry, and familiarity with PFC. The final section assessed the significance of identified SDs in facilitating PFC adoption in Sri Lanka. The participants were asked to rate each factor on a five-point Likert scale, where 1 indicates “not at all important” and 5 represents “extremely important”. The Likert scale is extensively used in PFC-based questionnaires to investigate drivers, barriers, and sustainability aspects [21,22,45]. The survey targeted primary CIPs, such as civil engineers, project managers, architects, designers, builders, consultants, and academic experts. The respondents’ relevant experience was assessed through their organisational and LinkedIn profiles, with the minimum qualification being an advanced degree in civil engineering, architecture, construction management, or a related field (at minimum, a Bachelor of Science degree).
Between 24 May and 29 May 2023, personalised email invitations were sent to a predefined list of recipients to distribute the questionnaire. The emails included a link to the online Google Form and a participant data sheet containing ethical information. The survey remained open for two months, with two follow-up reminders being sent to enhance the response rates. Of the 240 invitations, 86 responses were received, with 78 completed forms being retained for statistical analysis after eight incomplete responses were excluded. The response rate of 32.5% is considered satisfactory, aligning with the typical 20–30% response rate for construction industry-based surveys [21]. The participant demographics are presented in Figure 2, reflecting a diverse sample from various professional settings.

3.3. Statistical Pre-Testing of Questionnaire Survey Responses

The survey responses were coded in Excel and imported into SPSS (v.28.0.1.1) for statistical analysis. A 95% confidence level was used for the pre-tests. The first test, Cronbach’s alpha coefficient (α), assessed the reliability and the internal consistency of the questionnaire responses. The α value of 0.891 exceeds the threshold of 0.7 [45], indicating strong internal consistency and reliability in evaluating SDs. Secondly, the Shapiro–Wilk (S–W) test, commonly used in construction industry research, was applied to test the data normality [46]. Lastly, due to the data exhibiting a non-normal distribution, the non-parametric Kruskal–Wallis (K–W) test was applied to assess the statistical significance across different respondent groups.

3.4. Descriptive Statistics and Sustainability Driver-Wise Comparison

Descriptive methods, including the mean ( X ¯ i ) and standard deviation (SDe), were used to calculate and rank the key SDs for promoting PFC in Sri Lanka. Several methods were utilised to interpret the rankings based on the mean scores, drawing from prior research. The first technique (T1) recognises factors with average values above the midpoint (3) of the five-point Likert scale as significant [47]. The second technique (T2) follows the assessment scale of X ¯ i < 1.5 (very insignificant), 1.5 ≤ X ¯ i < 2.5 (insignificant), 2.5 ≤ X ¯ i < 3.5 (moderately significant), 3.5 ≤ X ¯ i < 4.5 (significant), and X ¯ i ≥ 4.5 (very significant) [48]. Finally, the Wilcoxon signed-rank test (WSRT), a non-parametric technique, was used to assess the statistical differences between matched SDs [49]. The outcomes are interpreted through the synergy of these techniques in identifying critical SDs for PFC adoption in Sri Lanka.

3.5. Exploratory Factor Analysis

Exploratory factor analysis (EFA) is a dimensionality reduction method that categorises individual variables into latent ones by examining their underlying structure [50]. This study used EFA to group driving factors into principal driver clusters, thereby developing a factor model that represents SDs which enable PFC in Sri Lanka. Four preliminary statistical requirements for EFA were met. The Kaiser–Meyer–Olkin (KMO) measure of sampling adequacy measure yielded a score of 0.822, exceeding the minimum threshold of 0.6 [51]. Bartlett’s test of sphericity (BTS) returned values that were statistically significant, with a p-value < 0.001 and an approximate Chi-square of 652.81 [52]. The third requirement was satisfied by all diagonal values of the anti-image correlation (coefficient) matrix being more than 0.5 [53]. Finally, all the initial communalities of the driving factors surpassed the threshold score of 0.3 [51]. Consequently, all factors were retained for the EFA.

3.6. Fuzzy Synthetic Evaluation Analysis

Based on fuzzy set theory, fuzzy synthetic evaluation (FSE) addresses ambiguous, imprecise, and subjective judgments [54]. FSE is popular in quantifying fuzzy linguistic variables in questionnaires to derive meaningful outcomes in construction industry-based research. The current analysis uses a four-step process that is widely recognized in the literature [55,56].

3.6.1. Setting up the Fuzzy Synthetic Evaluation System

The evaluation model includes three indexing elements [55]. Four categories of sustainability drivers (SDCs) can be expressed, SD = (d1, d2, d3, d4), which build the first tier of the index system. For the SDs, dn represents SDCn, such that d1 denotes SDC1. The second tier of the index system accepts SDs within each SDC, such that d1 = {d11, d12,…d1n)…d4 = {b41, b42,…b4n); where n denotes the number of SDs in each SDC. The final index component is the grade alternatives (Likert scale), Gi = {G1, G2, G3…Gv}; i.e., G1 = not at all important; G2 = slightly important; G3 = moderately important; G4 = very important; and G5 = extremely important.

3.6.2. Calculating the Weights of Sustainability Drivers and Driver Categories

The second step established the weighting for each SD and SDC. Equation (1) calculates the local weights of each SD and SDC and passes them into Equation (2).
W i = X ¯ i ( X ¯ i ) ;   0     W i     1   ,   ( W i ) = 1
WSD = {W1, W2, W3, … Wn}
where X ¯ i describe the mean value of an SD or the total mean value of an SDC; ( X ¯ i ) denotes the total of mean values of SDs in an SDC or the total of the mean scores of all SDCs; Wi denotes the weight of an SD or SDC; WSD denotes a set of weights for SDs in an SDC; n is the number of SDs in an SDC; and ( W i ) expresses the total of the local weights. Moreover, the global weights of each SD can be quantified using Equation (3).
W g = X ¯ i i = 1 15 X ¯ i ;   0     W g     1 ,   ( W g ) = 1
where X ¯ i expresses the mean value of an SD; i = 1 15 X ¯ i represents the summation of the mean values of all 15 SDs; Wg denotes the global weight of an SD; and ( W g ) denotes the total of the global weights.

3.6.3. Calculation of Membership Functions for Sustainability Drivers and Their Respective Categories

In the third stage, membership functions (MFs) were calculated for each SD and SDC. The FSE method utilises respondent-assigned Likert scale ratings for each SD to compute the MF of an SDi using Equation (4).
MF SD i = P 1 S D i G 1 + P 2 S D i G 2 + P 3 S D i G 3 + P 4 S D i G 4 + P 5 S D i G 5
In Equation (5), the MF of each SD is expressed by MF SD i (level 03). The percentage of questionnaire participants who appointed a grade of 1, 2, 3, 4, or 5 for the significance of a certain SD is represented by P 1 S D i , P 2 S D i , P 3 S D i , P 4 S D i , and P 5 S D i . For example, 0%, 1.3%, 15.4%, 44.9%, and 38.5% of the respondents graded ‘improved project quality control (SD11)’ as G1, G2, G3, G4, and G5, respectively. Therefore, the MF of SD11 is obtained as
MF SD 11 = 0.00 G 1 + 0.01 G 2 + 0.15 G 3 + 0.45 G 4 + 0.39 G 5 = ( 0.00 ,   0.01 ,   0.15 ,   0.45 ,   0.39 )
The MF of an SDC ( MF SDC i ) is computed as a product of the fuzzy matrix of the MFs of its SDs ( Z SD i ) and its weighting function computed using Equation (2). Z SD i can be expressed by Equation (5) and MF SDC i can be represented using Equation (6).
Z SD i = MF SD 1 MF SD 2 MF SD n = P 1 S D 1 P 2 S D 1 P 3 S D 1 P 4 S D 1 P 5 S D 1 P 1 S D 2 P 2 S D 2 P 3 S D 2 P 4 S D 2 P 5 S D 2 P 1 S D n P 2 S D n P 3 S D n P 4 S D n P 5 S D n
MF SDC i = W SD     Z SD i = ( W 1 ,   W 2 ,   W 3 , ,   W n )     P 1 S D 1 P 2 S D 1 P 3 S D 1 P 4 S D 1 P 5 S D 1 P 1 S D 2 P 2 S D 2 P 3 S D 2 P 4 S D 2 P 5 S D 2 P 1 S D n P 2 S D n P 3 S D n P 4 S D n P 5 S D n
MF SDC i   =   ( sdc i 1 ,   sdc i 2 ,   ,   sdc i g )
where “⊗ ” represents the fuzzy composition operator and sdcig denotes the degree of membership of level 02.

3.6.4. Determining the Significant Levels of Sustainability Driver Categories

Finally, the significance indes of each SDC was calculated. The significance index (SISDC) of each SDC is computed as a product of the MF SDC i and Gi, as shown in Equation (7).
SI SDC   = i v ( MF SDC i × G i )   =   ( sdc i 1 ,   sdc i 2 ,   ,   sdc i g )   X   ( G 1 ,   G 2 ,   G 3 ,   ,   G v ) SI SDC   =   ( sdc i 1 G 1 )   +   ( sdc i 2 G 2 )   +   ( sdc i 3 G 3 )   +   ( sdc i 4 G 4 )   +   ( sdc i 5 G 5 )
Further, likewise, the total significant score (SITotal) of an SDC can be computed using Equations (8)–(10).
WSDC = {W1, W2, W3,…, Wc}
MF SDC Total = W SDC     Z SDC i = ( W 1 ,   W 2 ,   W 3 , ,   W c )     MF SDC 1 MF SDC 2 MF SDC c
SI Total   = i v ( M F S D C T o t a l × G i )
where WSDC is the weight set of SDCs; c represents the number of SDCs; MF SDC Total is the level 01 MF; Z SDC i represents the fuzzy matrix of the MFs of SDCs.

3.7. Measurable Indicator System for Sustainability Drivers Linked with Sustainable Development Goals

The first step (refer to Figure 1) in the analysis involved identifying the relevant SDGs, their associated targets, and the corresponding indicators that relate to a PFC outcome. Measurable indicators for these connections were then developed. Two primary sources guided this process: the ‘global indicator framework for the SDGs’ (GIF-SDGs) [57] and the methodological proposal by Eberle et al. [16], titled ‘Assessing the contribution of products to the United Nations Sustainable Development Goals: a methodological proposal’. The framework by Eberle et al. [16] was originally developed to assess products as a whole. In the current study, it was adapted to evaluate construction outcomes, which are treated as products in this context. Therefore, the term ‘prefabricated construction outcome’ will henceforth be called the ‘product.’
The process began with identifying product-related SDG targets, taking into account both the direct impact of the product (e.g., resource consumption during material manufacturing) and the direct influence of organisations involved in the PFC life cycle (e.g., wages paid to construction workers). Then, suitable measurable indicators were selected from the GIF-SDGs and other recognised international guidelines, considering the three sustainability dimensions. For the environmental domain, the European Commission’s ‘Product Environmental Footprint Category Rules’ (PEFCR, 2018) was the primary reference [58]. For the social pillar, ‘Methodological Sheets for Subcategories in Social Life Cycle Assessment (S-LCA) 2021’ and ‘Guidelines for Social Life Cycle Assessment of Products and Organisations 2020’ were referred to [59,60]. In the economic domain, ‘ISO 15686-5:2017, Buildings and constructed assets- Service life planning- Part 5: Life-cycle costing’ was consulted [61]. Based on the guidelines, the developed indicators were then categorised into environmental and social sustainability impact categories, while the economic indicators were assigned as inventory indicators. Certain environmental indicators, such as the waste generated, were also classified as inventory indicators, given that these cannot be directly connected to an impact category.
The second step (refer to Figure 1) involved mapping the SDs identified in the first stage of the research to the relevant connections within the indicator system. Some SDs were broken down into individual indicators. For example, SD04—ensure cost and time certainty—was separated into two distinct indicators addressing cost and time, respectively. Moreover, some SDs spanned multiple pillars, as seen in SD14—improved productivity, which impacts the efficient consumption of materials (environmental and economic) and reduces the overall project time and cost (economic). The SDG targets linked to each SD were then identified, and the mappings from step one were applied to establish the connections between each SD and its relevant SDG targets. The outcome was the establishment of relationships between SDs, SDG targets, SDG indicators, relevant impact categories, inventory indicators, and measurable indicators. In the third step (refer to Figure 1), the indicator system from the second step was linked with benefits to stakeholders (e.g., workers, society, local community). The fourth step (refer to Figure 1) involved classifying the type of each measurable indicator (quantitative, qualitative, or semi-quantitative). The guidelines referenced in step one also provided support for both the third and fourth stages of the analysis.
The fifth step involved using case studies to showcase the application of the developed indicator system. The linked impact and inventory indicators can quantify the environmental performance of PFC practices. Comparing these with traditional construction methods and different PFC designs provides quantified evidence of PFC’s contributions (both positive and/or negative) to the SDGs. Score guidelines can be used to assess the scale of contribution by using a threshold value (reference product). For instance, the UNEP Life Cycle Initiative and its partner companies have proposed a +2 (contributing) and −2 (blocking) scale [62,63]. A +2 score is given when the environmental impact is more than 10% lower than that of the reference product, while a −2 score is assigned when the environmental impact exceeds that of the reference product by more than 10%. This scoring approach is implemented in the current study to investigate the positive or negative contributions of PFC practices towards the SDGs and SDs.

4. Statistical Analysis Results and Discussions

4.1. Primary Sustainability Drivers Influencing PFC in Sri Lanka

Table 2 summarises the outcomes of the statistical pretesting, descriptive analysis, and ranking of SDs that affect the implementation of PFC in Sri Lanka. The S–W test showed that the response data were not normally distributed (p-values < 0.001). Consequently, the non-parametric K–W test was used to assess the internal consistency among respondent groups. The outcomes reveal that, except for ‘simplify construction activities (SD12)’, ‘higher end-product quality (SD10)’ and ‘improved technology integration (SD13)’, all other SDs were not statistically significant across professions. However, the mean scores of SD12, SD10, and SD13 exceeded 4.0, justifying their inclusion in further analysis due to the high importance attributed to them by Sri Lankan CIPs. The mean values of the SDs ranged from 3.962 to 4.641 (Table 2). According to T1, introduced in Section 3.4, all 15 SDs are significant for PFC adoption ( X ¯ I > 3). Based on T2, one SD was ranked as very significant, while the remaining 14 were significant. Thus, considering that all 15 SDs are either very significant or significant, ranking them aids Sri Lankan CIPs, policymakers, and academia in prioritisation and strategic decision-making. The top five ranked SDs are examined in detail below, while the remaining factors are briefly discussed under the EFA results in Section 4.2.
‘Reduce overall project time (Fast delivery, SD02)’ ranked the highest, with a mean score of 4.641. The WSRT results (Table 3) indicate that, among the top five SDs, SD02 was the only factor whose assessment was statistically above all other drivers outside the top five. The importance of SD02 in PFC adoption aligns with findings from previous studies in developed and industrialised regions [19,26,32,64]. The top ranking of SD02 by Sri Lankan CIPs suggests a growing recognition of the competitive advantage of prefabrication, which enables parallel off-site and in situ construction, improving project scheduling and reducing overall construction times [20,32]. PFC supports the design for manufacturing and assembly (DfMA) approach, which can be applied in an early design stage, optimising material use and project coordination [65]. Considering Sri Lanka’s low PFC adoption, prioritising its application in education and healthcare projects could demonstrate its advantages under stringent time constraints.
The SD ‘efficient consumption of materials (SD06)’ ranked second ( X ¯ I = 4.346) based on the respondent ratings. The WSRT indicates that SD06 was statistically significant compared to seven factors outside the top five. ‘Overall project cost savings (SD01)’ closely followed SD06 with five statistically higher-ranked cases. In contrast, ‘improved project quality control (SD11)’ and ‘waste reduction and potential for better waste management practices (SD05)’ each recorded only two statistically significant cases, indicating relatively lower rankings. Prefabrication occurs in a controlled manufacturing environment, facilitating approaches such as DfMA, advanced technology integration, structured work schedules and purchasing, and the use of repetitive tasks that enhance specialised skills. These factors collectively improve material consumption efficiencies. Senarathna and Perera [34] highlighted that concrete waste is the most substantial material waste in Sri Lanka’s construction sector. Their study further revealed that prefabrication, particularly the use of precast concrete, optimises concrete use, reinforcing its potential for improving material efficiency in the Sri Lankan context [34].
SD01 ranked third, with a mean of 4.282. The cost advantage of PFC over conventional construction has been widely debated in both the industry and academia, impacting its global adoption [66]. Financial challenges such as economies of scale uncertainties, high capital costs, and expensive logistics have hindered the widespread implementation of PFC [11,67]. However, prefabrication offers more cost predictability than conventional construction, enabling precise project valuation and scheduling [33]. Additionally, parallel off-site manufacturing allows bulk material procurement while minimising transportation costs for machinery and labour, leading to overall cost reductions [20]. Further savings arise from shorter project durations, reduced risks, and lower expenses for wages and worker accommodation [22,38,68]. Amid Sri Lanka’s post-COVID-19 economic crisis, rising material, fuel, and logistics costs have stalled many construction projects [7]. Hence, cost reductions are essential for long-term resilience. With strategic mass adoption, PFC could enhance the Sri Lankan construction industry’s cost competitiveness.
SD11 ranked fourth in driving PFC adoption in Sri Lanka. Prefabrication enhances quality control due to requiring regulated manufacturing environments, ensuring consistent production standards [69,70]. Parallel off-site and on-site construction enables quality inspections and testing before installation, reducing the prevalence of defects [71]. The use of advanced technical systems in off-site manufacturing ensures compliance with mechanical and geometric standards, reinforcing quality assurance. Sri Lankan CIPs must recognise these advantages to facilitate wider PFC adoption. SD05 ranked fifth, highlighting its role in waste reduction and improved waste management. Similar to quality control, controlled production environments enable efficient waste management. The use of precision manufacturing, standardised components, repetitive processes, and specialised labour minimises material waste. These factors collectively enhance sustainability while improving construction efficiency, positioning PFC as a viable solution for Sri Lanka’s resource-constrained construction sector.

4.2. Exploratory Factor Analysis for Sustainability Drivers

The present study is among the first comprehensive investigations to identify key SDs and develop a factor category model for the adoption of PFC in the Sri Lankan construction sector. Based on the four criteria outlined in Section 3.5, all SDs were selected for EFA. Principal component analysis clustered the 15 SDs into four underlying groups (SDCs), facilitating PFC adoption in Sri Lanka (Table 4). These four SDCs all have eigenvalues exceeding one and explain 71.478% of the variance, surpassing the 60% threshold [47]. SDC01 encompasses three SDs related to workforce aspects: health and safety, working conditions, and skills. The most significant SD in SDC01 is ‘improved health and safety and working conditions of workers (SD09, X ¯ i = 4.026)’, followed by ‘less disturbance on-site from noise and dust (SD08, X ¯ i = 4.013)’ and ‘addressing the industry skills shortage (SD15, X ¯ I = 3.962)’. However, their rankings (12, 13, and 14) suggest they are not the most critical factors influencing PFC adoption in Sri Lanka.
SDC02 entails five SDs that enhance project performance and facilitate the integration of prefabrication technology into construction projects. The most critical SD within SDC02 is SD11, as discussed previously. Repetitive operations and specialised skilled workers contribute to stringent tolerances, superior finishes, and consistent colour specifications, leading to ‘higher end-product quality (SD10)’. SD11 is closely tailed by ‘simplify construction activities (SD12, X ¯ I = 4.167)’ and ‘improved productivity (SD14, X ¯ I = 4.141)’. The global construction industry faces persistent challenges, including low productivity, slow technology adoption, and limited automation [72]. Prefabrication fosters competitiveness by streamlining construction processes and enabling automation, digitisation, standardisation, and mass production [18]. SDs such as ‘improved technology integration, such as automation, 3D printing, BIM, immersive technologies and IoT (SD13)’ address these inefficiencies. Thus, a long-term strategic approach is essential for Sri Lanka to harness prefabrication’s competitive advantages.
SDC03 includes four SDs that enhance the economic aspects of construction projects through prefabrication. Among these, SD02 and SD01 ranked first and third as the most significant SDs of PFC adoption in Sri Lanka. On top of that, ‘minimise weather-related delays (SD03)’ and ‘ensure cost and time certainty (SD04)’ ranked sixth and seventh, respectively. These rankings suggest that the Sri Lankan CIPs understand that the SDs which optimise the economic factors of construction are more critical in diffusing prefabrication in the construction sector. The final category, SDC04, includes three SDs which are focused on environmental and resource management. As previously discussed, SD06 and SD05 ranked second and fifth in the mean rankings. However, ‘potential to enhance energy efficiency and reduce carbon emissions (SD07)’ ranked last, indicating that Sri Lankan construction stakeholders currently perceive it as less critical compared to the other 14 SDs.

4.3. Fuzzy Synthetic Evaluation Analysis Results

Equations (1) and (3) compute the local weights of SDs and SDCs that are crucial to elevating PFC in Sri Lanka, as shown in Table 5. The significance of SDCs is not solely based on their local weights, as their individual weight depends on the number of associated factors. Table 5 presents level 02 MFs of SDCs and level 03 MFs of SDs, derived using Equations (2) and (4)–(6). Subsequently, SDC SIs were computed using Equation (7) and MFs, as shown in Table 6. The overall SDC significance index was obtained via Equations (8)–(10). The level 01 MFs are 0.01, 0.03, 0.15, 0.42, and 0.40. The total SI score of 4.171 highlights the substantial influence of SDs on PFC adoption in Sri Lanka.
Among the SDCs, ‘economic optimization (SDC03)’ recorded the highest significance index (SI = 4.324), reflecting the industry’s continuous focus on enhancing economic outcomes. Given its time and cost efficiency, PFC presents a viable solution to Sri Lanka’s financial challenges in construction. ‘Environmental and resource management (SDC04)’ ranked second (SI = 4.167), followed closely by ‘project performance optimisation and technology integration (SDC02)’. Sri Lankan CIPs must recognise the technological advancements represented by PFC, along with its benefits regarding environmental management and economic efficiency. However, integrating these innovations depends on local builders’ technological and financial capacities [73]. Therefore, policies and regulations should be established by governmental and industry organisations to encourage and facilitate the adoption of innovative prefabrication practices among local and small-scale builders and manufacturers. ‘Worker health and safety, working conditions and skills (SDC01)’ ranked last (4.003) but remained above the 4.0 threshold, reinforcing the overall significance of all SDs in advancing PFC adoption in Sri Lanka.

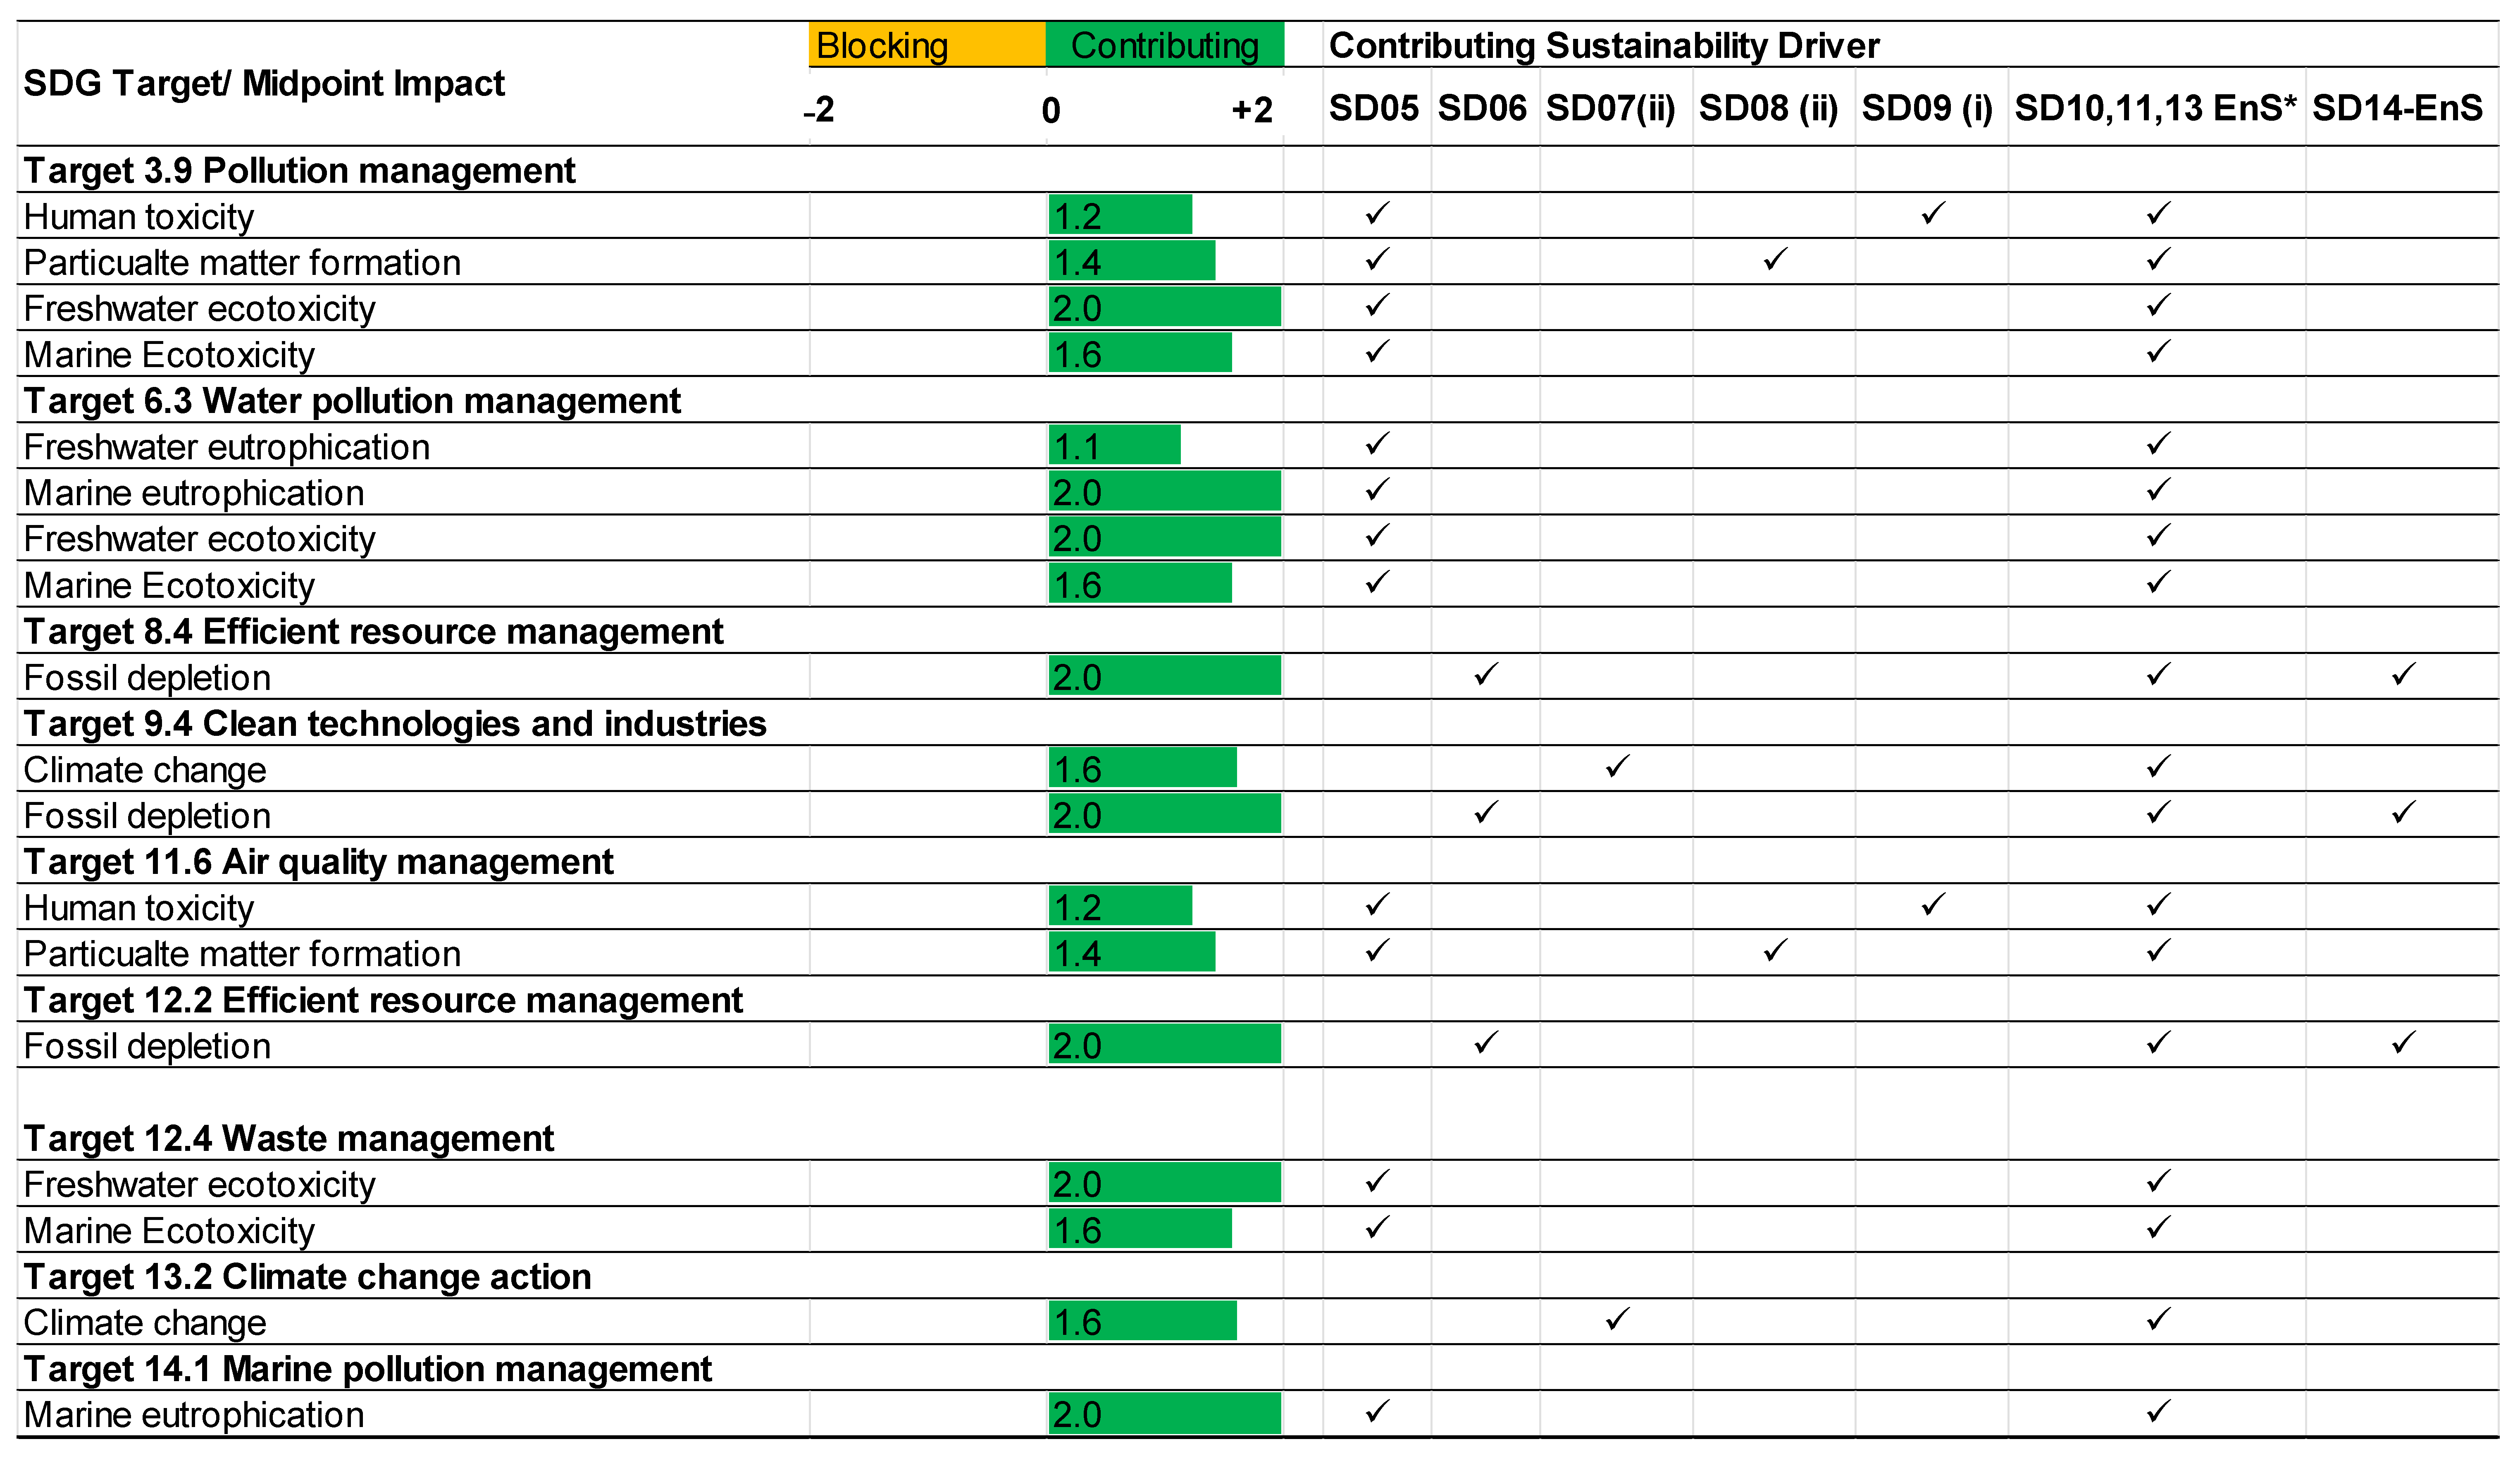
5. Sustainable Development Goals-Linked Measurable Indicator System

Table 7 presents the developed measurable indicator system for SDs in relation to the SDG targets and indicators, impact categories, benefits to stakeholders, and indicator types. Figure 3 further illustrates the contributions of these SDs to achieving the SDGs. The mappings in Table 7 are structured into four clusters (SDC01–SDC04), as they were derived from the EFA. Within SDC01, SD08 and SD09 were subdivided to facilitate the mapping process. For instance, SD09 was categorized into (i) improved health and safety and (ii) improved working conditions of workers.
To exemplify the mapping process, SD09 (i) improved health and safety is linked to 8 SDG targets (1.3, 3.8, 3.9, 6.1, 6.2, 6.3, 6.4, and 8.8), which are subsequently mapped to 12 SDG indicators. For instance, SDG target 3.9—“By 2030, substantially reduce the number of deaths and illnesses from hazardous chemicals and air, water, and soil pollution and contamination”—is associated with indicators 3.9.1, 3.9.2, and 3.9.3. These indicators can be quantitatively assessed using measures such as the ‘comparative toxic unit for human health (human toxicity): cancer and non-cancer’ and the ‘photochemical ozone creation potential.’ The impact category for this mapping is ‘health and safety,’ and the primary beneficiaries are ‘workers and society.’
In addition to quantitative indicators, qualitative and semi-quantitative indicators are employed for SDs such as addressing the industry skills shortage (SD15). For example, SD15 is linked to SDG target 4.4—“By 2030, substantially increase the number of youth and adults who have relevant skills, including technical and vocational skills, for employment, decent jobs, and entrepreneurship”. This target corresponds to the impact category ‘governance’ and benefits ‘workers and society,’ with its measurement facilitated by indicators such as ‘training in relevant skills (e.g., technical and vocational)’.
Similarly, SD04, under SDC03, was divided into (i) ensuring cost certainty and (ii) ensuring time certainty to enhance measurement clarity. Economic domain assessments remain challenging within the GIF-SDGs, as the strongest focus is on social and environmental aspects. Consequently, the direct construction-related economic targets are limited, and the relevant SDG targets tend to be broad in scope. Within SDC03, SDs such as ‘reduced overall project time’ (SD02) can be quantitatively measured using indicators like ‘construction project time.’ However, factors such as SD04 (ii)—ensuring time certainty—require semi-quantitative measures, such as ‘time certainty compared to conventional construction.’ Practitioners must evaluate these indicators in context, considering factors such as the project nature, its application, and its geographic relevance. The indicators primarily serve as inventory measures rather than influencing impact categories in the economic domain.
Within SDC04, SD07 was subdivided into (i) potential to enhance energy efficiency and (ii) potential to reduce carbon emissions. Unlike for the social and economic domains, the environmental indicators are well-established [77]. Notably, certain indicators under the SDC04 mappings cannot be directly assigned to impact categories and are instead classified as inventory indicators (e.g., use of recycled materials). Establishing connections within SDC02 was particularly challenging, as the SDs in this cluster are broad and multifaceted. For instance, improved productivity (SD14) contributes to efficient material consumption, reduced project durations, and cost savings. Consequently, some mappings under SDC01, SDC03, and SDC04 also capture these interrelated effects. Figure 3 illustrates the overall contributions of these SDs to the SDGs.
The competitive advantages of prefabrication technologies address limitations in conventional construction, supporting global sustainable development. Strengthening research efforts to highlight the contributions of modern construction methods is crucial to achieving their wider adoption. Economies with low socioeconomic conditions must also advance their technological capabilities to align with industrialised nations. The mappings presented in this study serve as a reference for global construction stakeholders in advancing the 2030 Agenda for Sustainable Development.

6. Case Study

The developed framework is illustrated through two case studies to showcase its practical application. The life-cycle assessment (LCA) results of two cases in Sri Lanka from previously published studies [10,78] are used to compute the ‘contributing’ or ‘blocking’ value of each mid-point impact linked with each SDG target and its SDs. Case A is an office building located in the central part of Sri Lanka, the analysis of which showed the comparative environmental performances of traditional and precast construction [10]. Case B considered a design for disassembly (DfD) and linear versions of a modular building designed for medical-related applications to compare the environmental sustainability of different modular designs [78]. Table A2 shows the LCA details of the two cases and Table A3 and Table A4 tabulate the mid-point environmental impacts of Case A and Case B, respectively.
Figure 4 shows the relative contribution of the precast approach compared to the that of the traditional construction in Case A towards nine specific SDG targets. These contributions were assessed using the indicator system detailed in Table 7. The relative contribution for each target was quantified using the scoring approach described in sub-Section 3.7. This scoring system assigns a score of +2 when the impact reductions are 10% or greater. Impact reductions between 0% and 10% are normalised to a score between 0 and 2. The assessment revealed notable improvements across various environmental impact categories, highlighting prefabrication as a significant contributor to sustainable development. The PFC approach demonstrated substantial contributions toward pollution management (SDG Target 3.9) by reducing impacts related to human toxicity (score 1.23) and particulate matter formation (score 1.43). Significant improvements in water pollution management (SDG Target 6.3) were observed, including maximum reductions (score 2) in marine eutrophication and freshwater ecotoxicity, reflecting an enhanced water quality and enhanced ecosystem protection. The contributions of different impact reductions to specific SDs are shown in Figure 4. For instance, reductions in eutrophication and ecotoxicity directly contribute to SDs 05, 10, 11, and 13.
In terms of efficient resource management (SDG targets 8.4 and 12.2), prefabrication achieved maximum scores (2) in fossil depletion reduction, showcasing the capacity for efficient resource utilisation and a reduced reliance on non-renewable resources. This improvement supports SDs 06, 10, 11, 13, and 14. The impact of prefabrication on clean technologies and climate action (SDG targets 9.4 and 13.2) was emphasised by significant climate change mitigation (score 1.61) and substantial fossil depletion improvements (score 2). Moreover, PFC practices supported air quality management (SDG target 11.6), showing positive scores in human toxicity reduction and particulate matter formation. Furthermore, waste management (SDG target 12.4) also benefited notably from the use of precast construction, with top scores being obtained for reductions in freshwater and marine ecotoxicity. Marine pollution management (SDG target 14.1) showed equal improvements through reduced marine eutrophication (score 2).
Relating to Case B, the analysis of modular construction designed for disassembly highlighted significant contributions to SDGs and SDs compared to linear construction (Figure 5), where reuse and recycling strategies are not integrated into the design phase. For this case study, impact reductions of 50% or more score +2, while reductions between 0–50% are linearly scaled to a score of 0–2. Key improvements include reduced human toxicity, freshwater ecotoxicity, and marine ecotoxicity, for which the PFC method achieved a score of 2.0 and directly supported health and pollution management objectives (SDG 3.9). DfD modular design notably improved freshwater and marine ecosystems (SDGs 6.3 and 12.4), with substantial reductions in ecotoxicity being observed. Additionally, this design significantly conserved non-renewable resources, achieving maximum scores in metal depletion (score 2), thus aligning with resource efficiency (SDGs 8.4, 9.4, and 12.2). Furthermore, DfD modular design greatly supported climate change mitigation efforts (SDGs 9.4 and 13.2), which was highlighted by impactful reductions in climate change indicators (score 2.0). These improvements contribute to SDs 07 (ii), 10, 11, and 13.
In contrast, linear designs without the integration of reuse or recycling strategies miss these substantial sustainability opportunities, which results in comparatively higher impacts across multiple environmental categories. Thus, it is paramount to consider principles of circularity at the design stage to enhance the environmental performance and sustainability contributions of construction projects, which clearly support global sustainability targets and strategies.

7. Discussion

7.1. Policy, Global and Industry Implications

The policy implications of this study’s findings highlight the necessity for governments and regulatory bodies to support and incentivise the use of PFC techniques [79]. Policy measures could include financial incentives, regulatory standards, and sustainability certifications aimed at accelerating the adoption of prefabrication [80,81]. At the global level, the promotion of PFC aligns well with international sustainability commitments and targets. International cooperation and knowledge-sharing initiatives could further enhance the global scaling of prefabrication practices, creating broader sustainability benefits [82]. From an industry perspective, adopting PFC methods can lead to transformative improvements in efficiency, cost-effectiveness, and overall sustainability [83]. Construction companies embracing prefabrication could not only reduce their ecological footprints but also enhance their market competitiveness and resilience to supply chain disruptions [84,85]. Hence, embracing PFC as a strategic sustainability driver can significantly contribute to achieving broader SDGs, enhancing the sustainability performance of the construction sector and supporting sustainable economic growth globally.

7.2. Geographical Implications

This research from Sri Lanka provides valuable insights into local/regional sustainable construction practices that could be scaled globally. Expanding these principles globally would align well with international sustainability agendas, such as the Paris Agreement and the United Nations SDGs. The developed indicator system is employable in global case studies in assessing the sustainability performance of PFC practices to highlight their contributions towards SDGs. Further, by standardising modular disassembly designs, facilitating knowledge sharing, and creating supportive policy frameworks, these local/regional practices can significantly impact the global sustainability agendas.

8. Conclusions, Study Constraints, and Future Directions

The present research determined the primary SDs of PFC adoption in Sri Lanka and established a comprehensive, measurable indicator framework connecting these drivers to the SDGs. The research methodology comprises a literature search, a pilot study, data collection via a questionnaire survey, and statistical analyses, which included EFA, FSE, and an SDG mapping process. Statistical ranking analysis indicated that all 15 identified SDs significantly contribute to PFC adoption in Sri Lanka. The five highest-ranked SDs were (1) reduces overall project time (fast delivery), (2) efficient consumption of materials, (3) overall project cost savings, (4) improved project quality control and waste reduction, and (5) potential for better waste management practices. The EFA grouped the SDs into four categories—(i) worker health and safety, working conditions and skills, (ii) project performance optimisation and technology integration, (iii) economic optimisation, and (iv) environmental and resource management—which explain 71.478% of the variance. The FSE analysis confirmed the significance of all four SD categories, with the significance indices of each exceeding 4.00 on a five-point Likert scale. The SDs were systematically mapped to relevant SDG targets, corresponding SDG indicators, impact categories, their benefit to stakeholders, and measurable indicators. The case study analysis showed that precast construction notably enhanced the resource efficiency, pollution management, and climate action of the studied project through obtaining the maximum reductions in key environmental impacts. Moreover, modular DfD significantly outperformed the linear version, strongly aligning with circular economy principles and sustainability goals.
This study makes significant theoretical and practical contributions to advancing sustainable PFC practices. It represents the first effort to develop an SD framework and factor model to support PFC uptake in Sri Lanka. Furthermore, this study introduces a universal measurable indicator system, enabling the assessment of the contributions of SDs to sustainable development. This system provides a reference for global construction practitioners working on SDG-aligned initiatives. Additionally, the research underscores the importance of project, process, quality, and sustainability management within construction projects. Despite these contributions, certain limitations must be acknowledged. While this study has comprehensively identified key SDs associated with the adoption of PFC in a developing economy, the presented list may not be exhaustive. Additionally, the rankings of these factors were based solely on evaluations by CIPs and were not corroborated through real-world case studies. Nevertheless, expert-based surveys are commonly accepted as a reliable method for developing factor models, as they mitigate potential biases. The case study-based application only employed the environmental aspects. Thus, this limitation can be addressed in future case study analyses.
Further research and development are required to expand the understanding of SDs in the Sri Lankan PFC context. Future studies may focus on comparative analyses with other South Asian economies and industrialised developing countries to assess the generalisability of the SDs and associated management practices discussed herein. Additionally, empirical case studies could be employed to validate the SDs’ effectiveness and inform strategic initiatives for advancing PFC adoption in Sri Lanka. On a global scale, further research is needed to explore the relationship between sustainable construction practices and the SDGs, which would strengthen the discourse on sustainable development within the construction sector.

Author Contributions

Conceptualization, J.J., M.S., A.K.K., J.A.S.C.J. and G.Z.; methodology, J.J. and M.S.; software, J.J., M.S. and G.Z.; validation, M.S., G.Z., A.K.K. and J.A.S.C.J.; formal analysis, J.J.; investigation, M.S., G.Z., A.K.K. and J.A.S.C.J.; writing—original draft preparation, J.J.; writing—review and editing, M.S., G.Z., A.K.K. and J.A.S.C.J.; visualization, J.J., M.S.; supervision, M.S., G.Z., A.K.K. and J.A.S.C.J.; project administration, M.S., G.Z., A.K.K. and J.A.S.C.J. All authors have read and agreed to the published version of the manuscript.

Funding

This research received no external funding.

Data Availability Statement

Data will be made available on request.

Acknowledgments

The authors extend their sincere gratitude to the industry experts and academic professionals from Sri Lanka’s construction sector for their valuable participation in the questionnaire survey and their support throughout this research. Also, the authors acknowledge the Journal for providing a free waiver for the publication of this research.

Conflicts of Interest

The authors declare no conflicts of interest.

Abbreviations

The following abbreviations are used in this manuscript:
SDSustainability driver
SDGSustainable development goals
PFCPrefabricated construction
LDLinear dichroism
CIPConstruction industry practitioner
S-WShapiro-Wilk
K-WKruskal-Wallis
SDeStandard deviation
WSRTWilcoxon signed-rank test
EFAExploratory factor analysis
KMOKaiser-Meyer-Olkin
BTSBartlett’s Test of Sphericity
FSEFuzzy synthetic evaluation
SDCSustainability driver category
MFMembership function
GIF-SDGsGlobal indicator framework for the SDGs
PEFCRProduct Environmental Footprint Category Rules
S-LCASocial Life Cycle Assessment
DfMADesign for manufacturing and assembly
EcSEconomic sustainability
ScSSocial sustainability
EnSEnvironmental sustainability
QLQualitative
QNQuantitative
SQNSemi-quantitative
ILOInternational labour organisation
BIMBuilding information modelling
IoTInternet of Things
LCALife-cycle assessment
DfDDesign for disassembly

Appendix A

Table A1. Search string formulation for the literature review.
Primary KeywordSearch String
Sustainability drivers“sustainability drivers” OR “drivers” OR “pros” OR “advantage *” OR “opportunities” OR “influencing” OR “enabling factors” OR “success factors”
AND
Prefabricated construction“modular construction” OR “prefabricated construction” OR “prefab *” OR “pre-fab *” OR “modular building *” OR “modular home” OR “modular house” OR “off-site construction” OR “offsite construction” OR “industrialized building” OR “industrialized construction” OR “panelized construction” OR “precast construction” OR “prefabricated prefinished volumetric construction” OR “off-site manufacturing” OR “offsite production” OR “off-site production” OR “modular integrated construction” OR “modern method of construction”
* acts as a wildcard operator to enhance search flexibility. For example, ‘advantage*’ can catch terms such as advantage, advantages and advantageous.
Table A2. LCA information of Case A and Case B [10,79].
LCA StageDescription
Case A
Goal and scopeSystem boundary: Cradle-to-gate
Functional unit: 1 m2 of the construction area
Life cycle impact assessmentMethod: ReCiPe Midpoint (H)
Case B
Goal and scopeSystem boundary: Product, end-of-life, and benefits and loads beyond the life cycle
Functional unit: Modular unit
Life-cycle impact assessmentMethod: ReCiPe Midpoint (H)
Table A3. Mid-point impacts of Case A [10].
Mid-Point Environmental ImpactUnitReduction * (%)
Global Warming Potential (GWP)kg CO2 eq8.06
Freshwater Eutrophication (FE)kg P eq 5.69
Marine Eutrophication (ME)kg N eq14.13
Particulate Matter Formation (PMF)kg PM10 eq7.17
Human Toxicity (HT)kg 1,4-DCB eq6.15
Freshwater Ecotoxicity (FET)kg 1,4-DCB eq11.93
Marine Ecotoxicity (MET)kg 1,4-DCB eq7.84
Fossil Depletion (FD)kg oil-eq12.89
* Reduction of the environmental impact of precast construction compared to the traditional construction.
Table A4. Mid-point impacts of Case B [79].
Mid-Point Environmental ImpactUnitReduction * (%)
Global Warming Potential (GWP)kg CO2 eq63.24
Freshwater Eutrophication (FE)kg P eq 40.00
Particulate Matter Formation (PMF)kg PM10 eq12.44
Human Toxicity (HT)kg 1,4-DCB eq90.60
Terrestrial Ecotoxicity (TET)kg 1,4-DCB eq24.53
Freshwater Ecotoxicity (FET)kg 1,4-DCB eq51.79
Marine Ecotoxicity (MET)kg 1,4-DCB eq74.24
Metal depletion (MD)kg Fe-eq70.21
Fossil Depletion (FD)kg oil-eq47.31
* Reduction in the environmental impact of the DfD modular design compared to the linear design.

References

  1. Zimmermann, M.; Althaus, H.-J.; Haas, A. Benchmarks for sustainable construction: A contribution to develop a standard. Energy Build. 2005, 37, 1147–1157. [Google Scholar] [CrossRef]
  2. Xu, X.; Wang, Y.; Tao, L. Comprehensive evaluation of sustainable development of regional construction industry in China. J. Clean. Prod. 2019, 211, 1078–1087. [Google Scholar] [CrossRef]
  3. Sev, A. How can the construction industry contribute to sustainable development? A conceptual framework. Sustain. Dev. 2009, 17, 161–173. [Google Scholar] [CrossRef]
  4. Son, H.; Kim, C.; Chong, W.K.; Chou, J.S. Implementing sustainable development in the construction industry: Constructors’ perspectives in the US and Korea. Sustain. Dev. 2011, 19, 337–347. [Google Scholar] [CrossRef]
  5. López-Guerrero, R.E.; Vera, S.; Carpio, M. A quantitative and qualitative evaluation of the sustainability of industrialised building systems: A bibliographic review and analysis of case studies. Renew. Sustain. Energy Rev. 2022, 157, 112034. [Google Scholar]
  6. Yeheyis, M.; Hewage, K.; Alam, M.S.; Eskicioglu, C.; Sadiq, R. An overview of construction and demolition waste management in Canada: A lifecycle analysis approach to sustainability. Clean Technol. Environ. Policy 2013, 15, 81–91. [Google Scholar]
  7. Jayawardana, J.; Jayasinghe, J.A.S.C.; Kulatunga, A.K.; Sandanayake, M.; Zhang, G. Prefabricated Construction in Sri Lanka: From a Sustainability Perspective. In International Conference on Sustainable Built Environment; Springer: Kandy, Sri Lanka, 2022. [Google Scholar]
  8. Yin, X.; Liu, H.; Chen, Y.; Al-Hussein, M. Building information modelling for off-site construction: Review and future directions. Autom. Constr. 2019, 101, 72–91. [Google Scholar] [CrossRef]
  9. Tian, Y.; Spatari, S. Environmental life cycle evaluation of prefabricated residential construction in China. J. Build. Eng. 2022, 57, 104776. [Google Scholar] [CrossRef]
  10. Jayawardana, J.; Sandanayake, M.; Jayasinghe, J.A.S.C.; Kulatunga, A.K.; Zhang, G. A comparative life cycle assessment of prefabricated and traditional construction–A case of a developing country. J. Build. Eng. 2023, 72, 106550. [Google Scholar]
  11. Jayawardana, J.; Kulatunga, A.K.; Jayasinghe, J.A.S.C.; Sandanayake, M.; Zhang, G. Environmental Sustainability of Off-Site Construction in Developed and Developing Regions: A Systematic Review. J. Archit. Eng. 2023, 29, 04023008. [Google Scholar] [CrossRef]
  12. Jayawardana, J.; Jayasinghe, J.A.S.C.; Sandanayake, M.; Kulatunga, A.K.; Zhang, G. Prefabricated Construction in Sri Lanka: A Proposed Adoption Strategy and a Pilot Case Study from Sustainability Perspective. Engineer 2023, 56, 71–80. [Google Scholar] [CrossRef]
  13. De Silva, C.S.R. Prefabricated Building Method in Sri Lanka and User Attitude. 2017. Available online: http://dl.lib.uom.lk/bitstream/handle/123/13324/TH3520-1.pdf?sequence=1&isAllowed=y (accessed on 13 May 2024).
  14. Jayasooriya, J.; Denagama, T. Comparative Analysis of Precast Construction and Conventional Construction of Small-scale Concrete Building in Terms of Cost. J. Civ. Eng. Sci. Technol. 2022, 10, 44229. [Google Scholar]
  15. Uthpala, H.; Ramachandra, T. Study on Modern Methods of Constructions Used in Sri Lanka. Constr. Mater. Syst. 2015, 155. [Google Scholar]
  16. Eberle, U.; Wenzig, J.; Mumm, N. Assessing the contribution of products to the United Nations’ Sustainable Development Goals: A methodological proposal. Int. J. Life Cycle Assess. 2022, 27, 959–977. [Google Scholar] [CrossRef]
  17. Alejandrino, C.; Mercante, I.; Bovea, M.D. Life cycle sustainability assessment: Lessons learned from case studies. Environ. Impact Assess. Rev. 2021, 87, 106517. [Google Scholar] [CrossRef]
  18. Wuni, I.Y.; Shen, G.Q. Holistic review and conceptual framework for the drivers of offsite construction: A total interpretive structural modelling approach. Buildings 2019, 9, 117. [Google Scholar] [CrossRef]
  19. Ismail, S.; Hon, C.K.; Crowther, P.; Skitmore, M.; Lamari, F. The drivers and challenges of adopting the Malaysia industrialised building system for sustainable infrastructure development. Constr. Innov. 2022. ahead-of-print. [Google Scholar] [CrossRef]
  20. Kamali, M.; Hewage, K. Life cycle performance of modular buildings: A critical review. Renew. Sustain. Energy Rev. 2016, 62, 1171–1183. [Google Scholar]
  21. Hwang, B.-G.; Shan, M.; Looi, K.-Y. Key constraints and mitigation strategies for prefabricated prefinished volumetric construction. J. Clean. Prod. 2018, 183, 183–193. [Google Scholar]
  22. Bello, A.O.; Eje, D.O.; Idris, A.; Semiu, M.A.; Khan, A.A. Drivers for the implementation of modular construction systems in the AEC industry of developing countries. J. Eng. Des. Technol. 2023, 22, 2043–2062. [Google Scholar] [CrossRef]
  23. Khan, A.; Yu, R.; Liu, T.; Guan, H.; Oh, E. Drivers towards adopting modular integrated construction for affordable sustainable housing: A Total Interpretive Structural Modelling (TISM) method. Buildings 2022, 12, 637. [Google Scholar] [CrossRef]
  24. Ahn, S.; Crouch, L.; Kim, T.W.; Rameezdeen, R. Comparison of worker safety risks between onsite and offsite construction methods: A site management perspective. J. Constr. Eng. Manag. 2020, 146, 05020010. [Google Scholar] [CrossRef]
  25. Boafo, F.E.; Kim, J.-H.; Kim, J.-T. Performance of modular prefabricated architecture: Case study-based review and future pathways. Sustainability 2016, 8, 558. [Google Scholar] [CrossRef]
  26. Sutrisna, M.; Ramnauth, V.; Zaman, A. Towards adopting off-site construction in housing sectors as a potential source of competitive advantage for builders. Archit. Eng. Des. Manag. 2022, 18, 165–183. [Google Scholar] [CrossRef]
  27. Jaillon, L.; Poon, C.-S.; Chiang, Y.H. Quantifying the waste reduction potential of using prefabrication in building construction in Hong Kong. Waste Manag. 2009, 29, 309–320. [Google Scholar]
  28. Lu, W.; Yuan, H. Investigating waste reduction potential in the upstream processes of offshore prefabrication construction. Renew. Sustain. Energy Rev. 2013, 28, 804–811. [Google Scholar] [CrossRef]
  29. Resolution, G.A. Transforming Our World: The 2030 Agenda for Sustainable Development, in UN Doc. A/RES/70/1 (25 September 2015). 2015. Available online: https://www.un.org/en/development/desa/population/migration/generalassembly/docs/globalcompact/A_RES_70_1_E.pdf (accessed on 13 May 2024).
  30. Cordella, M.; Horn, R.; Hong, S.H.; Bianchi, M.; Isasa, M.; Harmens, R.; Sonderegger, T.; Pihkola, H. Addressing sustainable development goals in life cycle sustainable assessment: Synergies, challenges and needs. J. Clean. Prod. 2023, 415, 137719. [Google Scholar] [CrossRef]
  31. Omer, M.A.; Noguchi, T. A conceptual framework for understanding the contribution of building materials in the achievement of Sustainable Development Goals (SDGs). Sustain. Cities Soc. 2020, 52, 101869. [Google Scholar]
  32. Razkenari, M.; Fenner, A.; Shojaei, A.; Hakim, H.; Kibert, C. Perceptions of offsite construction in the United States: An investigation of current practices. J. Build. Eng. 2020, 29, 101138. [Google Scholar]
  33. Wong, P.S.; Zwar, C.; Gharaie, E. Examining the drivers and states of organizational change for greater use of prefabrication in construction projects. J. Constr. Eng. Manag. 2017, 143, 04017020. [Google Scholar] [CrossRef]
  34. Senarathna, D.; Perera, B. Managing concrete wastes by implementing contemporary construction practices in Sri Lanka. In Proceedings of the 9th World Construction Symposium, Moratuwa, Sri Lanka, 9–10 July 2021. [Google Scholar]
  35. Li, Z.; Shen, G.Q.; Ji, C.; Hong, J. Stakeholder-based analysis of drivers and constraints in the use of off-site construction. In Proceedings of the ICCREM 2014, Smart Construction and Management in the Context of New Technology, Kunming, China, 31 October 2014; pp. 26–36. [Google Scholar]
  36. Kamar, K.A.M.; Azman, M.N.A.; Nawi, M.N.M. IBS survey 2010, Drivers, barriers and critical success factors in adopting industrialised building system (IBS) construction by G7 contractors in Malaysia. J. Eng. Sci. Technol. 2014, 9, 490–501. [Google Scholar]
  37. Hu, X.; Chong, H.-Y.; Wang, X. Sustainability perceptions of off-site manufacturing stakeholders in Australia. J. Clean. Prod. 2019, 227, 346–354. [Google Scholar] [CrossRef]
  38. Arif, M.; Bendi, D.; Sawhney, A.; Iyer, K.C. State of offsite construction in India-Drivers and barriers. In Journal of Physics: Conference Series; IOP Publishing: Bristol, UK, 2012. [Google Scholar]
  39. Hao, J.L.; Cheng, B.; Lu, W.; Xu, J.; Wang, J.; Bu, W.; Guo, Z. Carbon emission reduction in prefabrication construction during materialization stage: A BIM-based life-cycle assessment approach. Sci. Total Environ. 2020, 723, 137870. [Google Scholar]
  40. Hong, J.; Shen, G.Q.; Mao, C.; Li, Z.; Li, K. Life-cycle energy analysis of prefabricated building components: An input–output-based hybrid model. J. Clean. Prod. 2016, 112, 2198–2207. [Google Scholar] [CrossRef]
  41. Hao, J.; Chen, Z.; Zhang, Z.; Loehlein, G. Quantifying construction waste reduction through the application of prefabrication: A case study in Anhui, China. Environ. Sci. Pollut. Res. 2021, 28, 24499–24510. [Google Scholar]
  42. Mi, Z.; Deng, Q. Aligning building information modeling and prefabricated construction with sustainable development goals: A framework for sustainable urbanization. Appl. Comput. Eng. 2024, 70, 48–53. [Google Scholar]
  43. Wu, Z.; Luo, L.; Li, H.; Wang, Y.; Bi, G.; Antwi-Afari, M.F. An analysis on promoting prefabrication implementation in construction industry towards sustainability. Int. J. Environ. Res. Public Health 2021, 18, 11493. [Google Scholar] [CrossRef]
  44. Gallo, P.; Romano, R.; Belardi, E. Smart green prefabrication: Sustainability performances of industrialized building technologies. Sustainability 2021, 13, 4701. [Google Scholar] [CrossRef]
  45. Kamali, M.; Hewage, K. Development of performance criteria for sustainability evaluation of modular versus conventional construction methods. J. Clean. Prod. 2017, 142, 3592–3606. [Google Scholar]
  46. Wuni, I.Y.; Shen, G.Q. Exploring the critical production risk factors for modular integrated construction projects. J. Facil. Manag. 2023, 21, 50–68. [Google Scholar] [CrossRef]
  47. Darko, A.; Chan, A.P.C. Strategies to promote green building technologies adoption in developing countries: The case of Ghana. Build. Environ. 2018, 130, 74–84. [Google Scholar]
  48. Wuni, I.Y.; Shen, G.Q. Developing critical success factors for integrating circular economy into modular construction projects in Hong Kong. Sustain. Prod. Consum. 2022, 29, 574–587. [Google Scholar]
  49. Ngo, J.; Hwang, B.-G.; Zhang, C. Factor-based big data and predictive analytics capability assessment tool for the construction industry. Autom. Constr. 2020, 110, 103042. [Google Scholar]
  50. Yong, A.G.; Pearce, S. A beginner’s guide to factor analysis: Focusing on exploratory factor analysis. Tutor. Quant. Methods Psychol. 2013, 9, 79–94. [Google Scholar]
  51. Ali, A.H.; Kineber, A.F.; Qaralleh, T.J.O.; Alaboud, N.S.; Daoud, A.O. Classifying and evaluating enablers influencing modular construction utilization in the construction sector: A fuzzy synthetic evaluation. Alex. Eng. J. 2023, 78, 45–55. [Google Scholar]
  52. Bijivemula, S.K.R.; Sai, S.J.; Chepuri, A. A structural equation model of stakeholder roles in the implementation of green construction strategies in the Indian construction industry. Int. J. Constr. Manag. 2023, 24, 486–494. [Google Scholar]
  53. Buniya, M.K.; Othman, I.; Sunindijo, R.Y.; Kineber, A.F.; Mussi, E.; Ahmad, H. Barriers to safety program implementation in the construction industry. Ain Shams Eng. J. 2021, 12, 65–72. [Google Scholar]
  54. Zhao, X.; Hwang, B.-G.; Gao, Y. A fuzzy synthetic evaluation approach for risk assessment: A case of Singapore’s green projects. J. Clean. Prod. 2016, 115, 203–213. [Google Scholar]
  55. Xu, Y.; Yeung, J.F.; Chan, A.P.; Chan, D.W.; Wang, S.Q.; Ke, Y. Developing a risk assessment model for PPP projects in China—A fuzzy synthetic evaluation approach. Autom. Constr. 2010, 19, 929–943. [Google Scholar]
  56. Wuni, I.Y.; Shen, G.Q.; Osei-Kyei, R.; Agyeman-Yeboah, S. Modelling the critical risk factors for modular integrated construction projects. Int. J. Constr. Manag. 2022, 22, 2013–2026. [Google Scholar] [CrossRef]
  57. UN General Assembly. Global Indicator Framework for the Sustainable Development Goals and Targets of the 2030 Agenda for Sustainable Development. 2016. Available online: https://unstats.un.org/sdgs/indicators/Global%20Indicator%20Framework%20after%202022%20refinement_Eng.pdf (accessed on 13 May 2024).
  58. European Commission. Product Environmental Footprint Category Rules Guidance; Kluwer Academic Publishers: Drive Norwell, MA, USA, 2018. [Google Scholar]
  59. United Nations Environment Programme. Guidelines for Social Life Cycle Assessment of Products and Organisations 2020. 2020. Available online: https://wedocs.unep.org/20.500.11822/34554 (accessed on 13 May 2024).
  60. United Nations Environment Programme. Methodological Sheets for Subcategories in Social Life Cycle Assessment (S-LCA) 2021. 2021. Available online: https://www.lifecycleinitiative.org/library/methodological-sheets-for-subcategories-in-social-life-cycle-assessment-s-lca-2021/ (accessed on 13 May 2024).
  61. ISO 15686-5:2017; Buildings and Constructed Assets-Service Life Planning-Part 5. ISO Life-Cycle Costing: Geneva, Switzerland, 2017.
  62. Life Cycle Initiative. Linking UN SDGs to Life Cycle Impact Pathway Frameworks. 2020. Available online: https://www.lifecycleinitiative.org/activities/life-cycle-assessment-data-and-methods/linking-un-sdgs-to-life-cycle-impact-pathway-frameworks/ (accessed on 15 March 2025).
  63. PRé Sustainability. Linking LCA and SDG 12. 2020. Available online: https://www.lifecycleinitiative.org/wp-content/uploads/2021/02/SDG-12-Sustainable-consumption-and-production.pdf (accessed on 15 March 2025).
  64. Navaratnam, S.; Satheeskumar, A.; Zhang, G.; Nguyen, K.; Venkatesan, S.; Poologanathan, K. The challenges confronting the growth of sustainable prefabricated building construction in Australia: Construction industry views. J. Build. Eng. 2022, 48, 103935. [Google Scholar] [CrossRef]
  65. Wasim, M.; Serra, P.V.; Ngo, T.D. Design for manufacturing and assembly for sustainable, quick and cost-effective prefabricated construction–a review. Int. J. Constr. Manag. 2022, 22, 3014–3022. [Google Scholar] [CrossRef]
  66. Agapiou, A. Barriers to offsite construction adoption: A quantitative study among housing associations in England. Buildings 2022, 12, 283. [Google Scholar] [CrossRef]
  67. Aghasizadeh, S.; Tabadkani, A.; Hajirasouli, A.; Banihashemi, S. Environmental and economic performance of prefabricated construction: A review. Environ. Impact Assess. Rev. 2022, 97, 106897. [Google Scholar] [CrossRef]
  68. Tsz Wai, C.; Wai Yi, P.; Ibrahim Olanrewaju, O.; Abdelmageed, S.; Hussein, M.; Tariq, S.; Zayed, T. A critical analysis of benefits and challenges of implementing modular integrated construction. Int. J. Constr. Manag. 2021, 23, 1–24. [Google Scholar] [CrossRef]
  69. Gumusburun Ayalp, G.; Ay, I. Model validation of factors limiting the use of prefabricated construction systems in Turkey. Engineering, Constr. Archit. Manag. 2021, 28, 2610–2636. [Google Scholar] [CrossRef]
  70. Blismas, N.G.; Pendlebury, M.; Gibb, A.; Pasquire, C. Constraints to the use of off-site production on construction projects. Archit. Eng. Des. Manag. 2005, 1, 153–162. [Google Scholar] [CrossRef]
  71. Elnaas, H.; Gidado, K.; Philip, A. Factors and drivers effecting the decision of using off-site manufacturing (OSM) systems in house building industry. J. Eng. Proj. Prod. Manag. 2014, 4, 51–58. [Google Scholar] [CrossRef]
  72. Hossain, M.A.; Nadeem, A. Towards digitizing the construction industry: State of the art of construction 4.0. In Proceedings of the ISEC, Riverside, CA, USA, 1 August 2019. [Google Scholar]
  73. Chan, J.K.; Chan, A.P.; Kung, F.W. Using innovative prefabrications as the source of competitive advantage for contractors—Case studies in Hong Kong. Archit. Sci. Rev. 2004, 47, 183–192. [Google Scholar] [CrossRef]
  74. Hammad, A.W.; Akbarnezhad, A.; Wu, P.; Wang, X.; Haddad, A. Building information modelling-based framework to contrast conventional and modular construction methods through selected sustainability factors. J. Clean. Prod. 2019, 228, 1264–1281. [Google Scholar] [CrossRef]
  75. Liu, S.; Qian, S. Evaluation of social life-cycle performance of buildings: Theoretical framework and impact assessment approach. J. Clean. Prod. 2019, 213, 792–807. [Google Scholar] [CrossRef]
  76. Leadership Council of the Sustainable Development Solutions Network. Indicators and a Monitoring Framework for the Sustainable Development Goals; Leadership Council of the Sustainable Development Solutions Network: Selangor, Malaysia, 2015. [Google Scholar]
  77. Costa, D.; Quinteiro, P.; Dias, A. A systematic review of life cycle sustainability assessment: Current state, methodological challenges, and implementation issues. Sci. Total Environ. 2019, 686, 774–787. [Google Scholar] [CrossRef]
  78. Jayawardana, J.; Sandanayake, M.; Kulatunga, A.K.; Jayasinghe, J.A.S.C.; Zhang, G.; Osadith, S.U. Evaluating the Circular Economy Potential of Modular Construction in Developing Economies—A Life Cycle Assessment. Sustainability 2023, 15, 16336. [Google Scholar] [CrossRef]
  79. Gao, Y.; Tian, X.-L. Prefabrication policies and the performance of construction industry in China. J. Clean. Prod. 2020, 253, 120042. [Google Scholar] [CrossRef]
  80. Wang, J.; Qin, Y.; Zhou, J. Incentive policies for prefabrication implementation of real estate enterprises: An evolutionary game theory-based analysis. Energy Policy 2021, 156, 112434. [Google Scholar]
  81. Wang, Y.; Li, Y.; Zhuang, J. Research on the green development path of prefabricated building industry based on intelligent technology. Eng. Constr. Archit. Manag. 2024. ahead-of-print. [Google Scholar]
  82. Zhou, J.; Ren, D. A hybrid model of external environmental benefits compensation to practitioners for the application of prefabricated construction. Environ. Impact Assess. Rev. 2020, 81, 106358. [Google Scholar]
  83. Chippagiri, R.; Bras, A.; Sharma, D.; Ralegaonkar, R.V. Technological and sustainable perception on the advancements of prefabrication in construction industry. Energies 2022, 15, 7548. [Google Scholar] [CrossRef]
  84. Zhao, S.; Wang, J.; Ye, M.; Huang, Q.; Si, X. An evaluation of supply chain performance of China’s prefabricated building from the perspective of sustainability. Sustainability 2022, 14, 1299. [Google Scholar] [CrossRef]
  85. Wang, S.; Sinha, R. Life cycle assessment of different prefabricated rates for building construction. Buildings 2021, 11, 552. [Google Scholar] [CrossRef]
Figure 1. Research methodology. Note: (….)* represent the outcomes of Step 02 are used in Step 03 mappings. Similarly, {….}** mean that outcomes from Step 03 are incorporated in Step 04 mappings.
Buildings 15 01037 g001
Figure 2. Profile of the questionnaire survey respondents: (a) profession; (b) years of experience in the construction industry; (c) years of experience with PFC projects.
Buildings 15 01037 g002
Figure 3. Sustainability drivers mapped with contributing SDGs.
Buildings 15 01037 g003
Figure 4. Contribution of prefabrication case towards SDGs and SDs. * represents the environmental component of these SDGs.
Buildings 15 01037 g004
Figure 5. Contribution of the DfD design compared to the linear design of the modular unit. * represents the environmental component of these SDGs.
Buildings 15 01037 g005
Table 2. Statistical pretesting and descriptive analysis of sustainability drivers.
CodeSustainability DriverMeanSDeRankK–W Test
(p-Values)
SD02Reduce overall project time (Fast delivery)4.6410.55810.363
SD06Efficient consumption of materials4.3460.75320.266
SD01Overall project cost savings4.2820.85130.315
SD11Improved project quality control4.2050.74540.241
SD05Waste reduction and potential for better waste management practices4.1790.83350.897
SD03Minimise weather-related delays4.1790.84960.462
SD04Ensure cost and time certainty4.1670.69270.465
SD12Simplify construction activities4.1670.84480.019 *
SD14Improved productivity4.1410.80190.083
SD10Higher end-product quality (e.g., finishing, tolerances)4.1280.917100.018 *
SD13Improved technology integration, such as automation, 3D printing, BIM, Immersive technologies and IoT4.0640.931110.033 *
SD09Improved health and safety and working conditions of workers4.0260.821120.067
SD08Less disturbance on-site from noise and dust 4.0130.860130.089
SD15Addressing the industry skills shortage3.9620.874140.365
SD07Potential to enhance energy efficiency and reduce carbon emissions3.9620.904150.186
* The K–W test result is significant at the significance level of 0.05 (p-value < 0.05).
Table 3. Wilcoxon signed-ranks test for sustainability drivers.
SD02SD06SD01SD11SD05SD03SD04SD12SD14SD10SD13SD09SD08SD07SD15
SD02X0.003 *<0.001 *<0.001 *<0.001 *<0.001 *<0.001 *<0.001 *<0.001 *<0.001 *<0.001 *<0.001 *<0.001 *<0.001 *<0.001 *
SD06 X0.5730.1790.0520.0950.0650.0970.042*0.047*0.016 *0.002 *<.001 *<.001 *0.001 *
SD01 X0.2970.3480.4130.2060.2040.1620.1550.050*0.043*0.029 *0.014 *0.008 *
SD11 X0.8800.8480.6360.8420.4570.2940.1540.0590.0560.019 *0.008 *
SD05 X0.8560.9060.9460.8560.590.3580.2040.1180.028 *0.069 *
SD03 X0.9380.9880.9580.8020.3870.1790.0910.0870.130
SD04 X0.8940.9560.6250.5060.1690.1100.0980.064
SD12 X0.5820.6810.2210.1050.1420.0630.029 *
SD14 X0.7170.3330.1400.1060.0970.011
SD10 X0.6160.2860.2520.1530.138
SD13 X0.6990.6050.2870.225
SD09 X0.8530.4460.425
SD08 X0.5540.554
SD07 X1.000
SD15 X
* represents the statistically significant status of the sustainability driver in the respective row.
Table 4. Sustainability drivers’ dimensional reduction/categorisation.
CodeSustainability Driver Category/Sustainability DriverFactor Loadings of Sustainability Driver Categories
1234
SDC01Worker health and safety, working conditions and skills
SD09Improved health and safety and working conditions of workers0.778
SD08Less disturbance on-site from noise and dust 0.773
SD15Addressing the industry skills shortage0.658
SDC02Project performance optimisation and technology integration
SD12Simplify construction activities 0.796
SD11Improved project quality control 0.723
SD13Improved technology integration, such as automation, 3D printing, BIM, Immersive technologies and IoT 0.576
SD10Higher end-product quality (e.g., finishing, tolerances) 0.542
SD14Improved productivity 0.519
SDC03Economic optimisation
SD02Reduce overall project time (Fast delivery) 0.782
SD04Ensure cost and time certainty 0.763
SD03Minimise weather-related delays 0.752
SD01Overall project cost savings 0.451
SDC04Environmental and resource management
SD05Waste reduction and potential for better waste management practices 0.808
SD06Efficient consumption of materials 0.768
SD07Potential to enhance energy efficiency and reduce carbon emissions 0.482
Rotation Sums of Squared Loadings
Eigenvalue3.2092.7552.4022.355
Variance explained (%)21.39618.36816.01215.703
Cumulative variance explained (%)21.39639.76355.77571.478
Table 5. Sustainability drivers, driver category weightings, and membership functions.
CodeMeanLocal WeightsMFs (Level 03)MFs (Level 02)
SDC0112.0000.192 (0.00, 0.04, 0.21, 0.44, 0.30)
SD094.0260.335(0.00, 0.04, 0.21, 0.45, 0.31)
SD084.0130.334(0.00, 0.06, 0.17, 0.46, 0.31)
SD153.9620.330(0.01, 0.03, 0.24, 0.42, 0.30)
SDC0220.7050.331 (0.01, 0.03, 0.15, 0.43, 0.38)
SD124.1670.201(0.01, 0.03, 0.13, 0.45, 0.39)
SD114.2050.203(0.00, 0.01, 0.15, 0.45, 0.39)
SD134.0640.196(0.03, 0.03, 0.17, 0.42, 0.36)
SD104.1280.199(0.00, 0.06, 0.17, 0.35, 0.42)
SD144.1410.200(0.01, 0.01, 0.14, 0.49, 0.35)
SDC0317.2690.276 (0.00, 0.02, 0.09, 0.41, 0.47)
SD024.6410.269(0.00, 0.00, 0.04, 0.28, 0.68)
SD044.1670.241(0.00, 0.01, 0.13, 0.54, 0.32)
SD034.1790.242(0.00, 0.05, 0.13, 0.41, 0.41)
SD014.2820.248(0.01, 0.04, 0.06, 0.42, 0.46)
SDC0412.4870.200 (0.00, 0.03, 0.16, 0.40, 0.40)
SD054.1790.335(0.00, 0.04, 0.15, 0.40, 0.41)
SD064.3460.348(0.00, 0.01, 0.13, 0.54, 0.32)
SD073.9620.317(0.01, 0.05, 0.19, 0.45, 0.30)
Table 6. Sustainability driver category significant indices.
CodeSustainability Driver CategorySignificant IndexSignificance *
SDC01Worker health and safety, working conditions and skills4.003Significant
SDC02Project performance optimisation and technology integration4.143Significant
SDC03Economic optimisation4.324Significant
SDC04Environmental and resource management4.167Significant
Overall significant index4.171Significant
* Based on the T1 and T2 approaches presented in Section 3.4.
Table 7. Measurable indicator system connecting sustainability drivers and SDGs.
CodeSDC/SDSDG TargetSDG IndicatorImpact CategoryBenefitting StakeholdersMeasurable Indicator ***Indicator Type *
QLQNSQN
SDC01Worker health and safety, working conditions and skills
SD09 (i)Improved health and safety 1.31.3.1Health and safetyWorkersCoverage of social security support
3.83.8.1Health Insurance
3.9, 8.83.9.1, 3.9.2, 3.9.3, 8.8.1Occupational injuries
Access to personal protective equipment
3.93.9.1, 3.9.2, 3.9.3Workers, SocietyHuman toxicity: cancer and non-cancer
Photochemical ozone creation potential
6.16.1.1WorkersDrinking water at work
6.26.2.1Adequate sanitation at work
6.36.3.1, 6.3.2Workers, SocietyWastewater treatment
6.46.4.1, 6.4.2Scarcity-adjusted water use
SD09 (ii)Improved working conditions of workers1.11.1.1Working conditions (Fair salary)WorkersWorkers earning below UN poverty line of $1.90 per day
4.54.5.1Human rightsEqual share of training for men and women
5.1, 8.55.1.1, 8.5.1, 8.5.2Equal wages for men and women
5.55.5.2Equal managerial positions for men and women
8.78.7.1Working conditionsFulfilment of ILO ** conventions: child work andminimum age, forced labour
8.88.8.2Fulfilment of ILO conventions: freedom ofassociation, discrimination, collective bargaining for all employees, equal remuneration of workers
10.1, 10.310.1.1, 10.3.1Income spread
SD08 (i)Less disturbance on-site from noiseSDG 03Health and safetyWorkers, Local communityNoise levelsRefs: [74]
SD08 (ii)Less disturbance on-site from dust 3.9, 11.63.9.1, 11.6.2Disease incidences (Particulate matter)
SD15Addressing the industry skills shortage4.44.4.1GovernanceWorkers, SocietyTraining in relevant skills (e.g., technical and vocational)
4.74.7.1Training in sustainability issues: sustainability in general
9.59.5.1, 9.5.2Investments in research and development
SDC03Economic optimisation
SD02Reduce overall project time 8.2, 9.28.2.1, 9.2.1Inventory indicatorAll project stakeholdersConstruction project time
SD04 (i)Ensure cost certainty8.2, 9.2Cost certainty compared to conventional construction
SD04 (ii)Ensure time certainty8.2, 9.2Time certainty compared to conventional construction
SD03Minimise weather-related delays8.2, 9.28.2.1, 9.2.1(a) Weather-related time savings compared to conventional construction,
(b) Time certainty gained due to less weather disruptions
SD01Overall project cost savings8.2, 9.28.2.1, 9.2.1Construction project cost
12.212.2.1, 12.2.2Cost savings by efficient use of materials
SDC04Environmental and resource management
SD05Waste reduction and potential for better waste management practices3.9, 11.63.9.1, 3.9.2, 3.9.3, 11.6.1, 11.6.2Health and safetyWorkers, SocietyHuman toxicity: cancer and non-cancer
Photochemical ozone creation potential
11.611.6.1Inventory indicatorEcosystems, Society, ResourcesAmount of waste generated
11.611.6.2Health and safetyWorkers, SocietyDisease incidences (Particulate matter)
6.3, 12.46.3.1, 6.3.2, 12.4.1, 12.4.2Ecotoxicity EcosystemsComparative Toxic Unit for ecosystems (Ecotoxicity)
EutrophicationP-equivalents (Fresh water eutrophication)
12.412.4.1, 12.4.2Ionising radiationWorkers, SocietyIonising radiation potential
12.512.5.1Inventory indicatorResourcesUse of recycled material
14.1, 14.214.1.1Eutrophication EcosystemsN-equivalents (Marine eutrophication)
SD06Efficient consumption of materials8.4, 9.4, 12.28.4.1, 8.4.2, 12.2.1, 12.2.2Resource depletionResourcesAbiotic resource depletion: minerals and metals, fossils
SD07 (i)Potential to enhance energy efficiency7.37.3.1Inventory indicatorEnergy use: non-renewable
SD07 (ii)Potential to reduce carbon emissions9.49.4.1Climate changeSocietyGlobal Warming Potential
13.213.2.1
13.313.3.2GovernanceWorkersTraining in sustainability issues: climate change
SDC02Project performance optimisation and technology integration
SD12Simplify construction activities
SD12-EcS 1Ensure cost and time certaintySee SD04 (i) and SD04 (ii)
SD12-SoS 2Improved health and safety and working conditionsSee SD09 (i), SD09 (ii) and SD08
SD11Improved project quality control
SD11-EnS 3Potential for SD05, SD06, SD07See SD05-07
SD11-EcSEnsure cost and time certaintySee SD04 (i) and SD04 (ii)
SD11-SoSPotential to ensure consumer health and well-beingSDG03, SDG11Health and safetyConsumers(a) Functionality and usability, (b) Health and comfortRefs: [59,75]
SD13Improved technology integration
SD13-EnSPotential for SD05, SD06, SD07See SD05-07
SD13-EcSEnsure cost and time certaintySee SD04 (i) and SD04 (ii)
SD13-SoSPotential to address industry skill shortageSee SD15
Potential to ensure consumer health and well-beingSee SD11-SoS
SD10Higher end-product quality
SD10-EnSSD05, SD06, SD07See SD05-07
SD10-EcSEnsure cost and time certaintySee SD04 (i) and SD04 (ii)
SD10-SoSEnsure consumer health and well-beingSee SD11-SoS
SD14Improved productivity
SD14EnS, EcSEfficient material useSee SD06 and SD01
SD14-EcSReduce overall project time and costSee SD01 and SD02
1 EcS—economic sustainability, 2 SoS—social sustainability, 3 EnS—environmental sustainability, * QL—qualitative, QN—quantitative, SQN—semi-quantitative, ** ILO—international labour organisation, *** References [16,57,58,61,76].
Disclaimer/Publisher’s Note: The statements, opinions and data contained in all publications are solely those of the individual author(s) and contributor(s) and not of MDPI and/or the editor(s). MDPI and/or the editor(s) disclaim responsibility for any injury to people or property resulting from any ideas, methods, instructions or products referred to in the content.

