
Analysis of Cognitive Biases in Construction Health and Safety in New Zealand


Abstract
1. Introduction
- What are the key decision factors influencing H&S in the construction industry?
- What cognitive biases influence the decision factors affecting H&S in the construction industry?
- Which loops and critical paths involving cognitive biases influence the decision factors affecting H&S in the construction industry?
2. Literature Review
3. Research Methodology
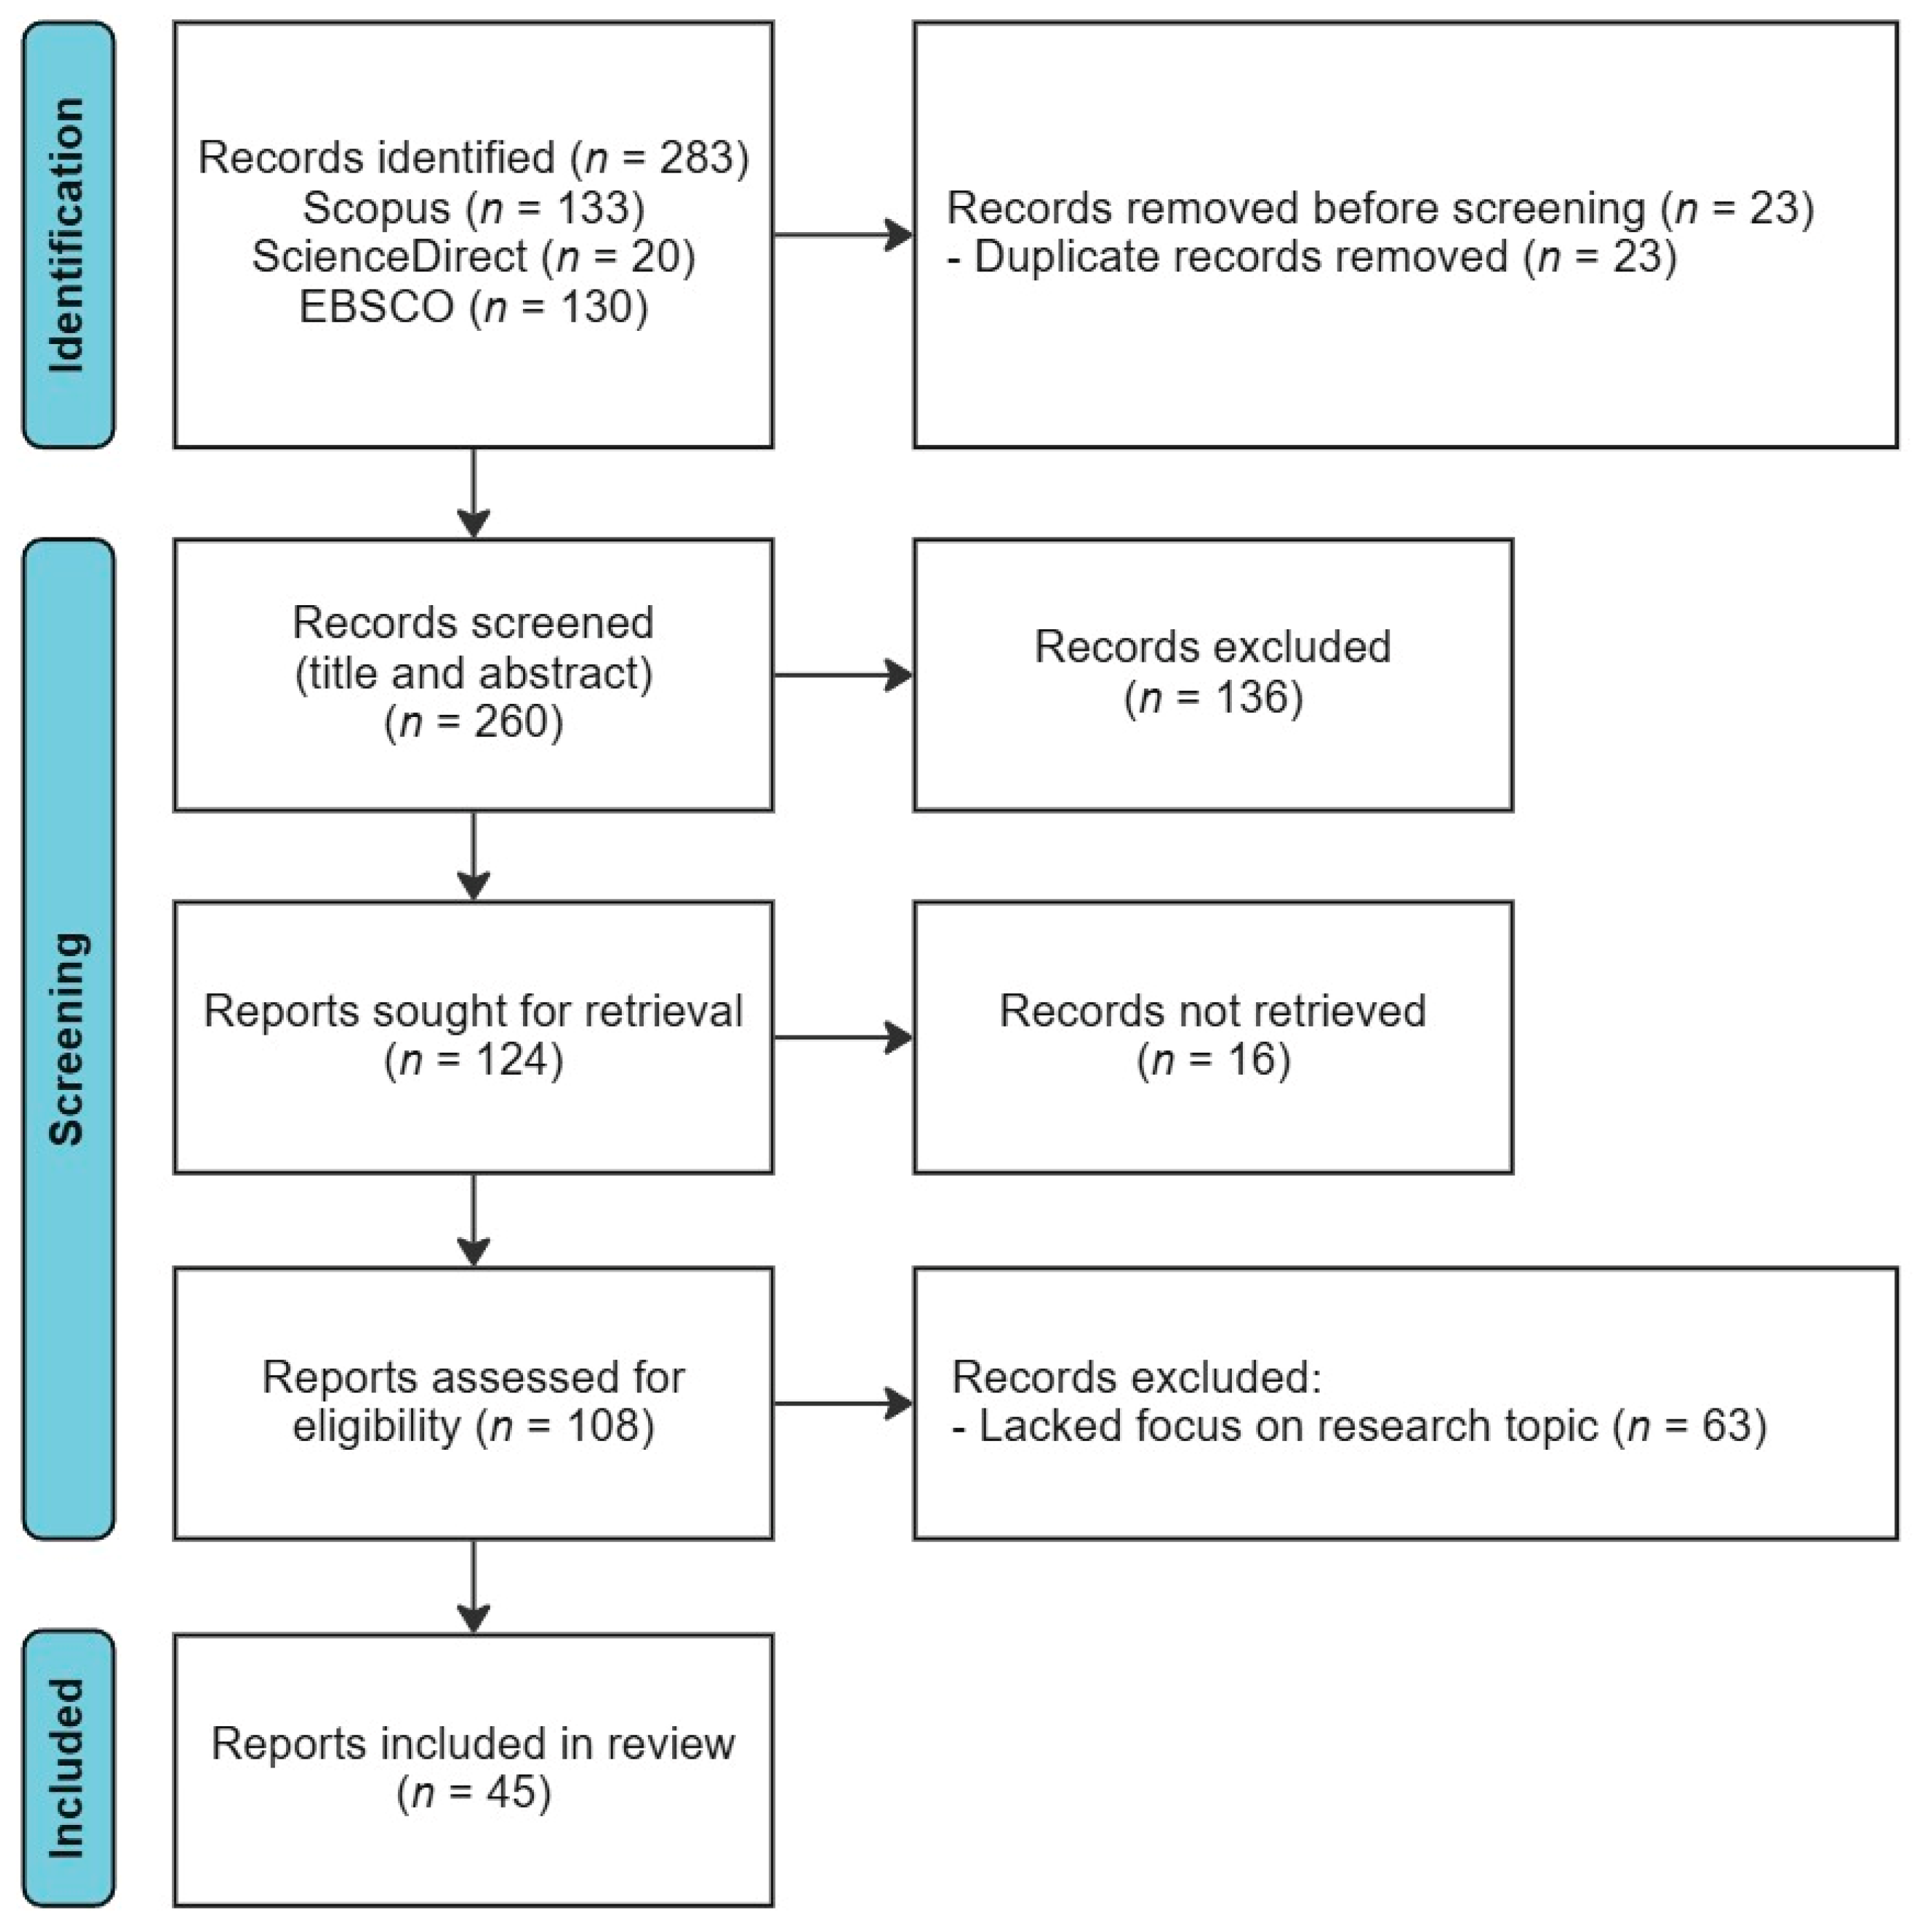
3.1. Database Search
3.2. Screening Process
3.3. Data Extraction
3.3.1. Key Factors
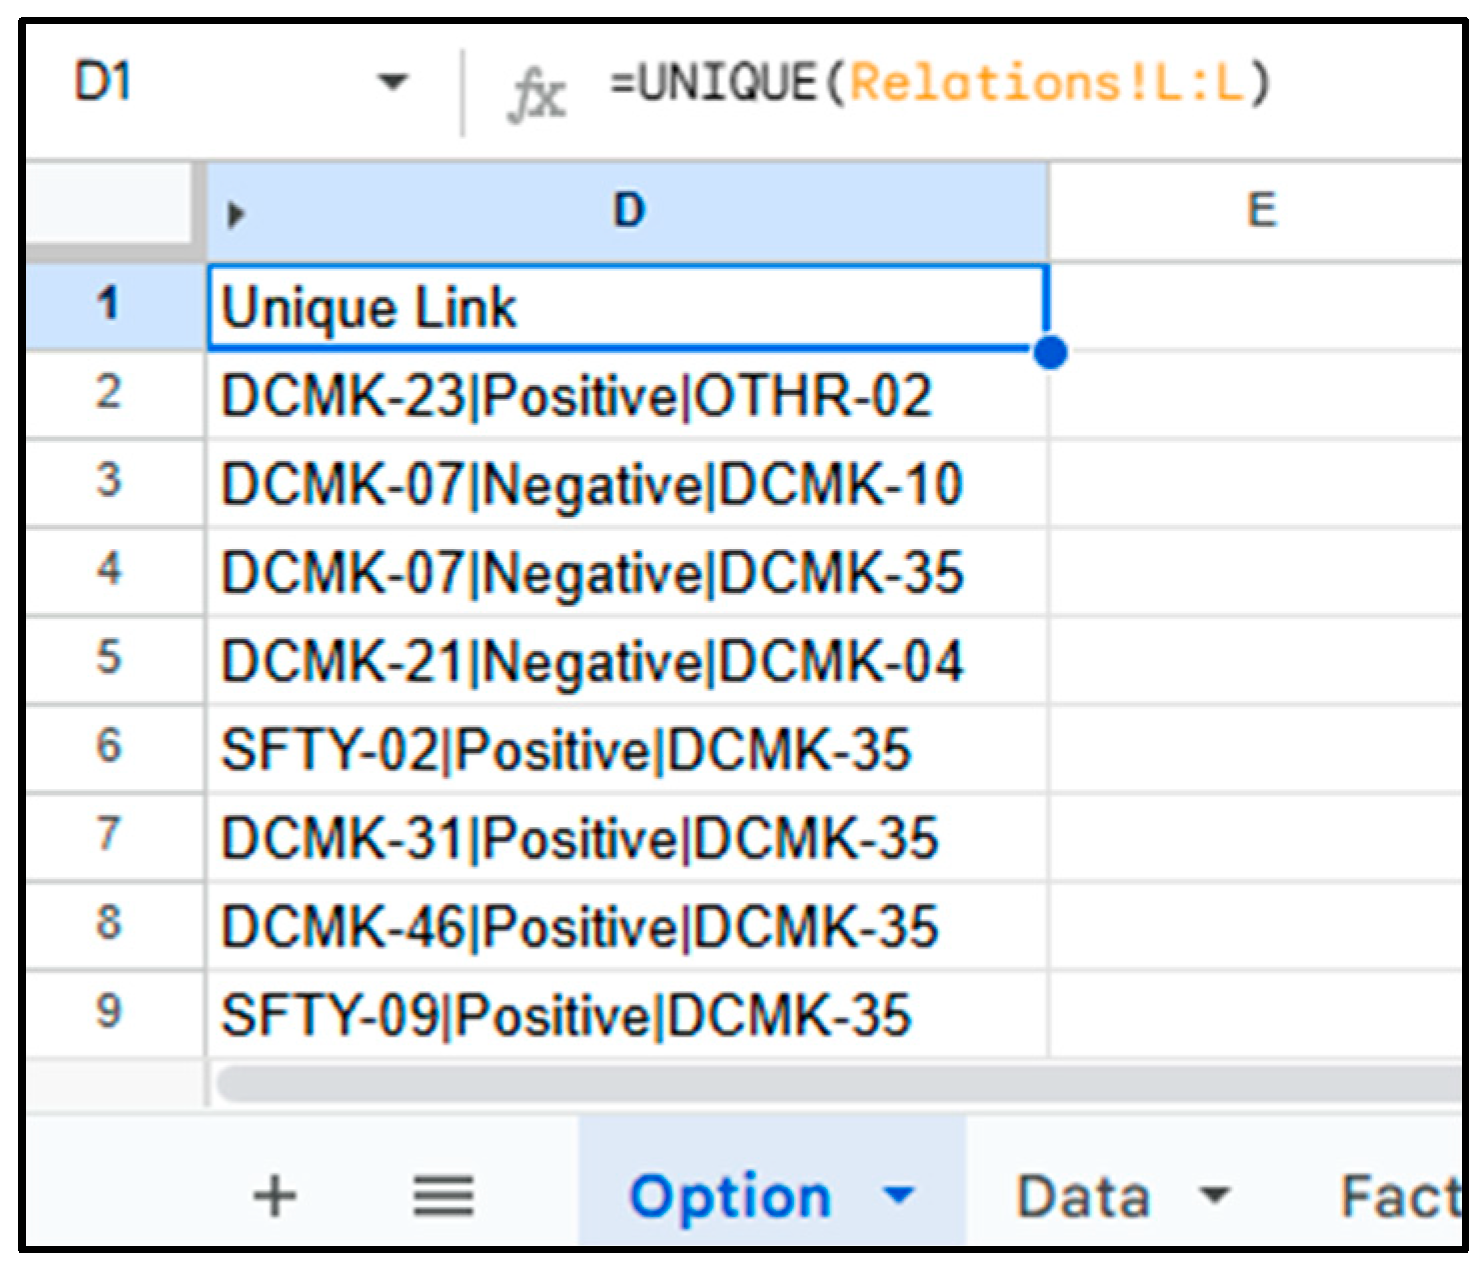
3.3.2. Interrelations
3.4. Data Analysis
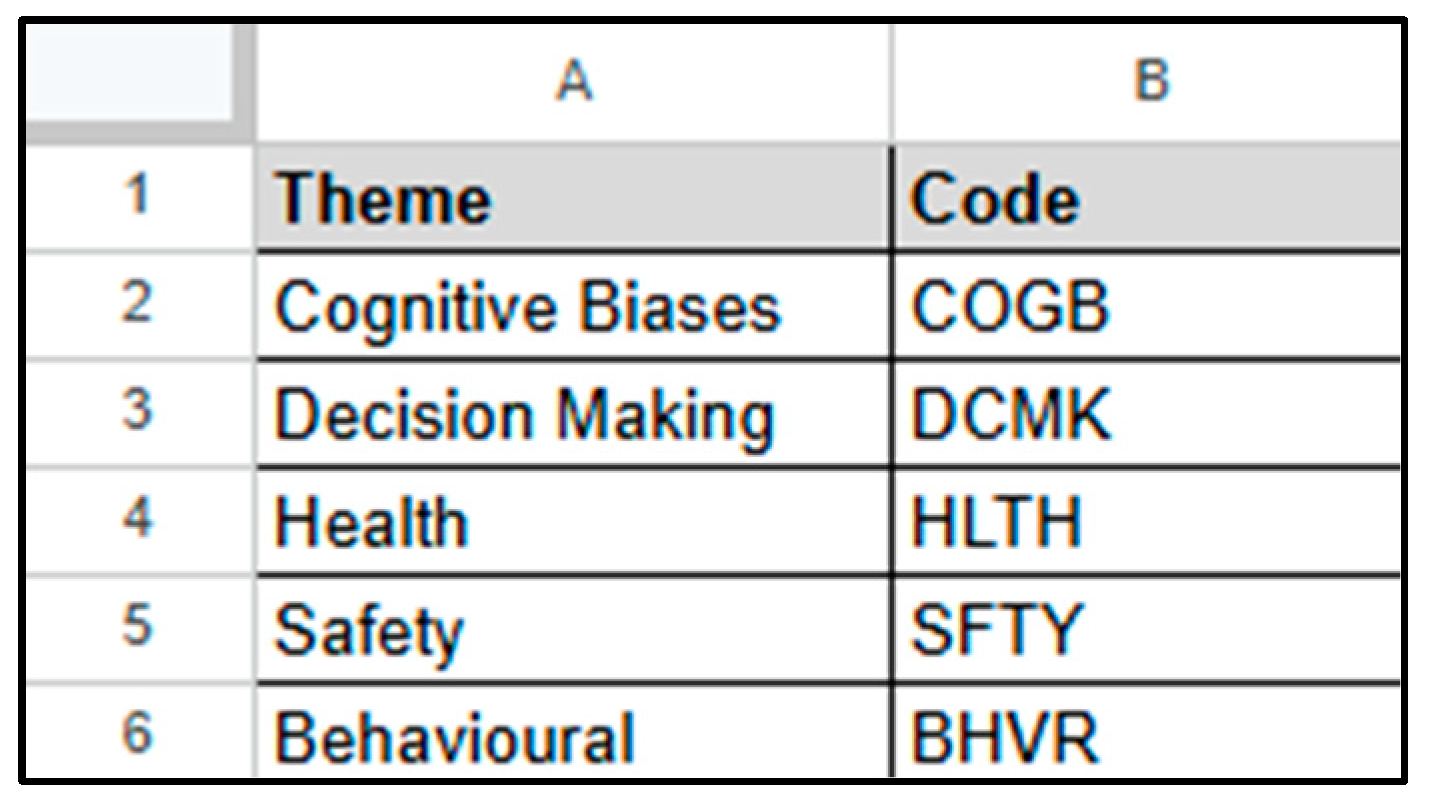
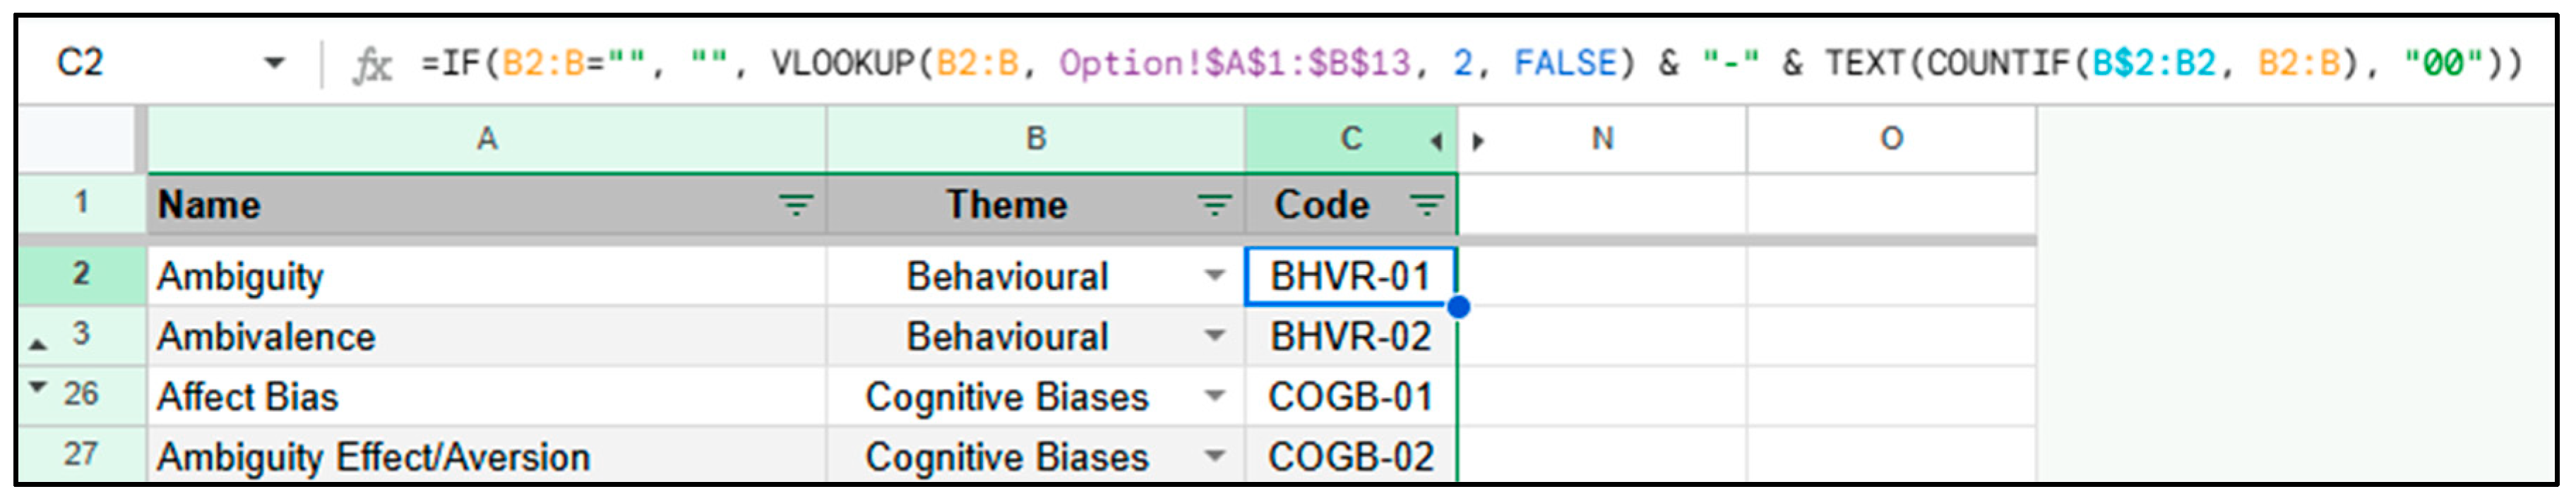
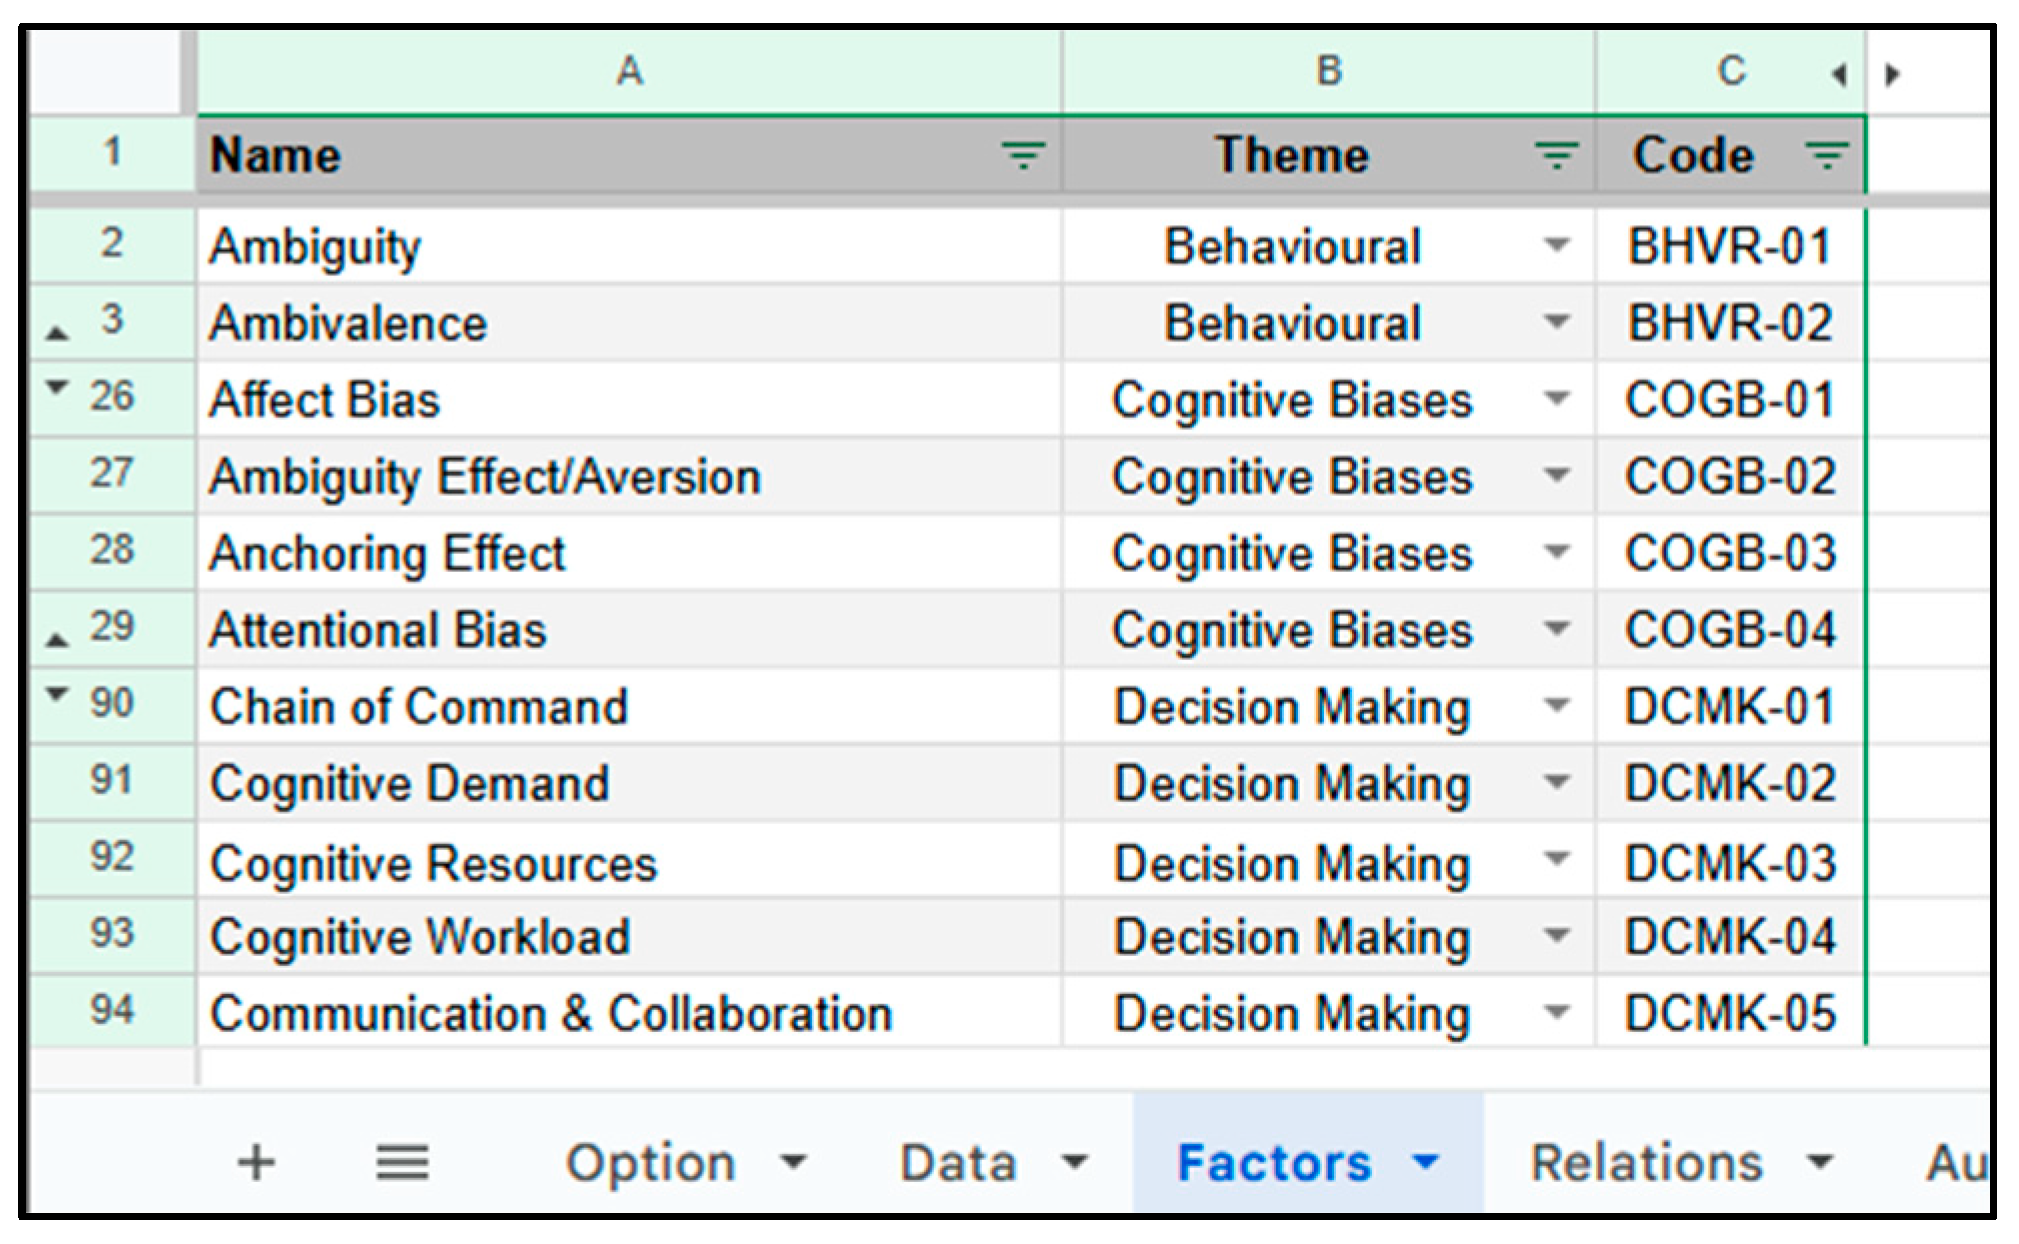
3.4.1. Author–Factor Matrix Generation
3.4.2. Interrelation Matrix Generation
3.4.3. Causal Loop Diagram Generation
3.4.4. SLR Frequency Generation
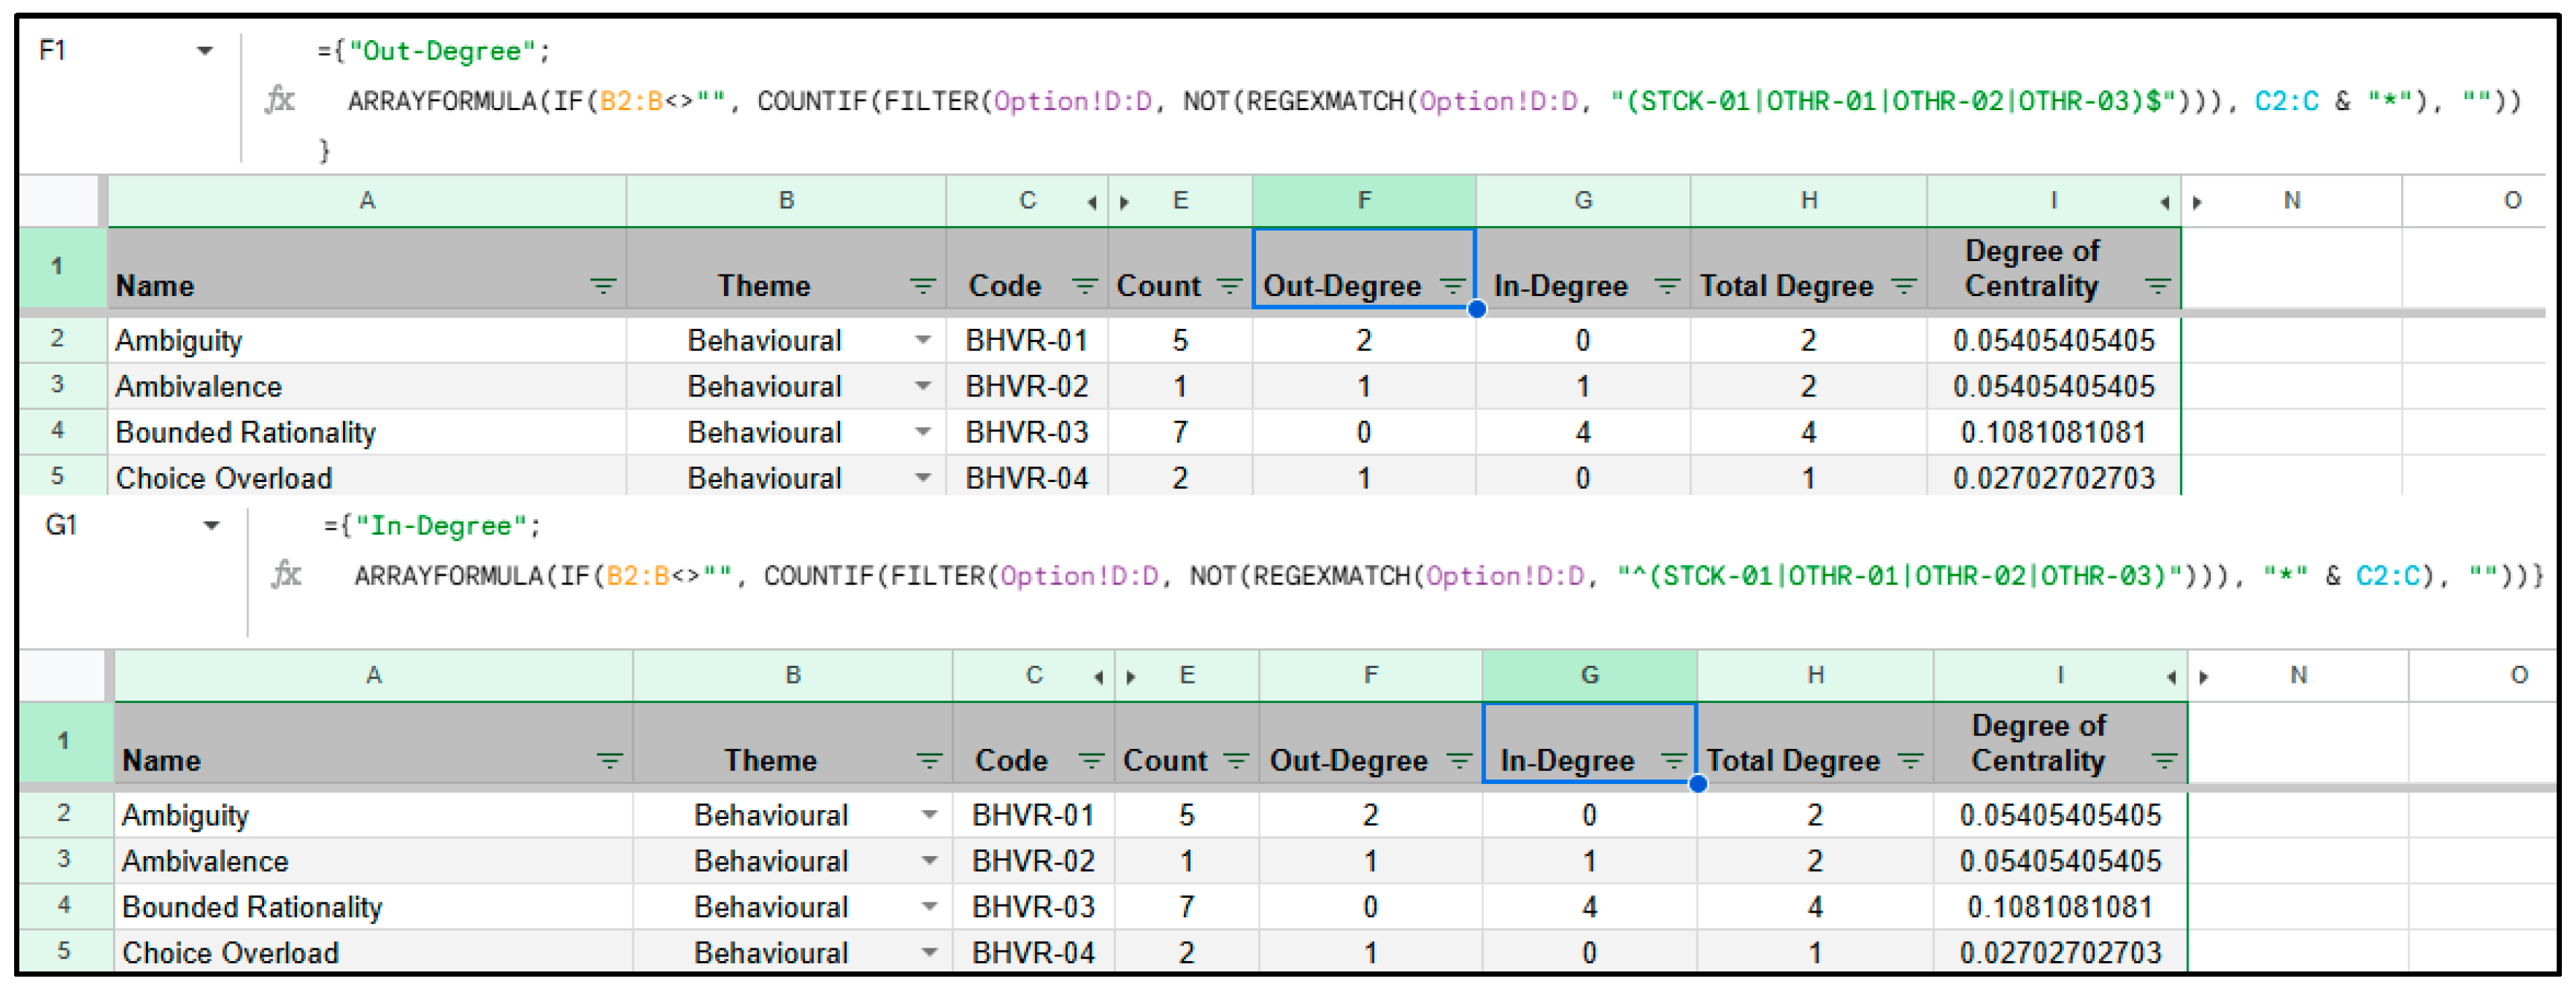
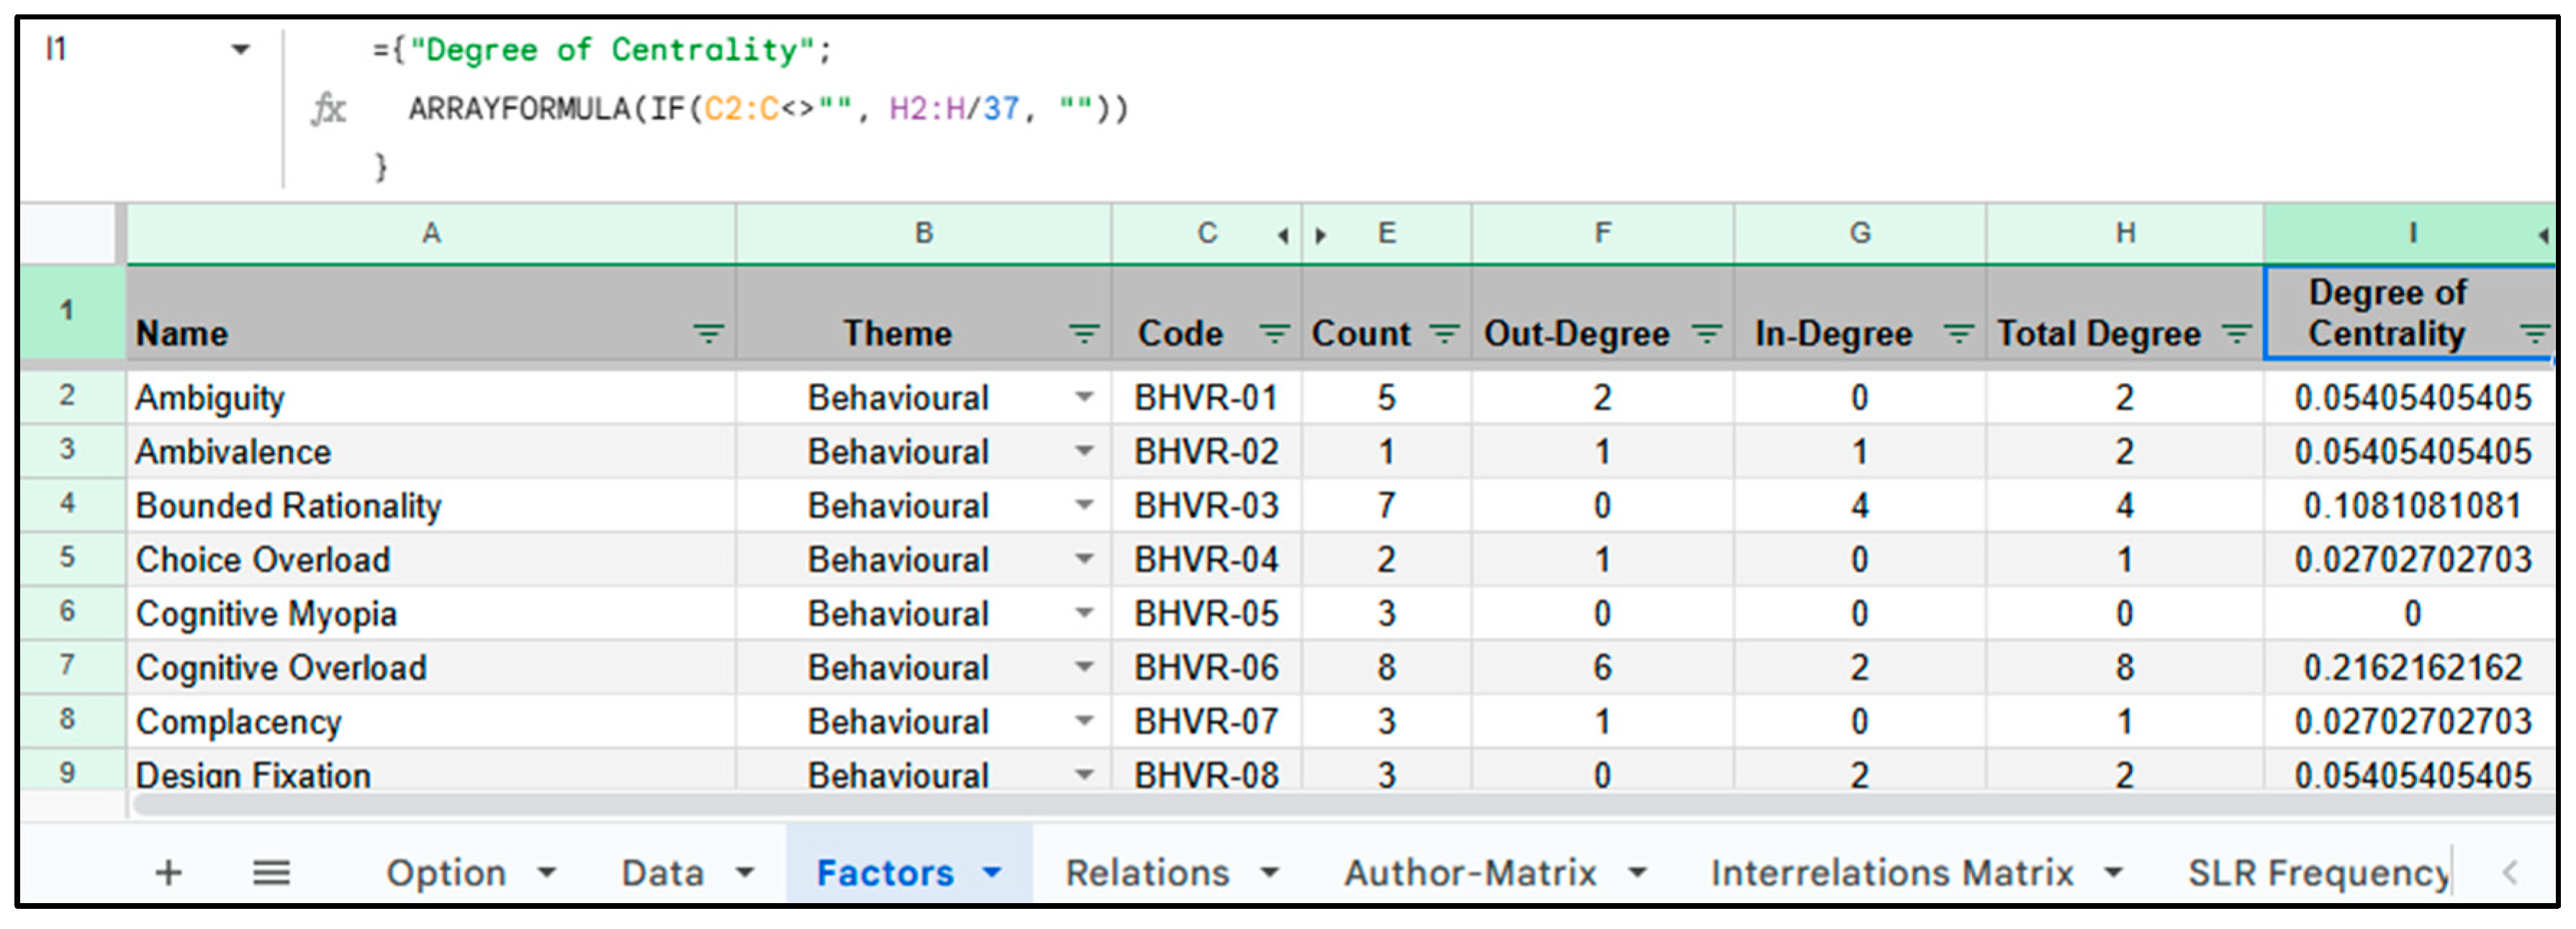
3.4.5. Degree of Centrality Calculation
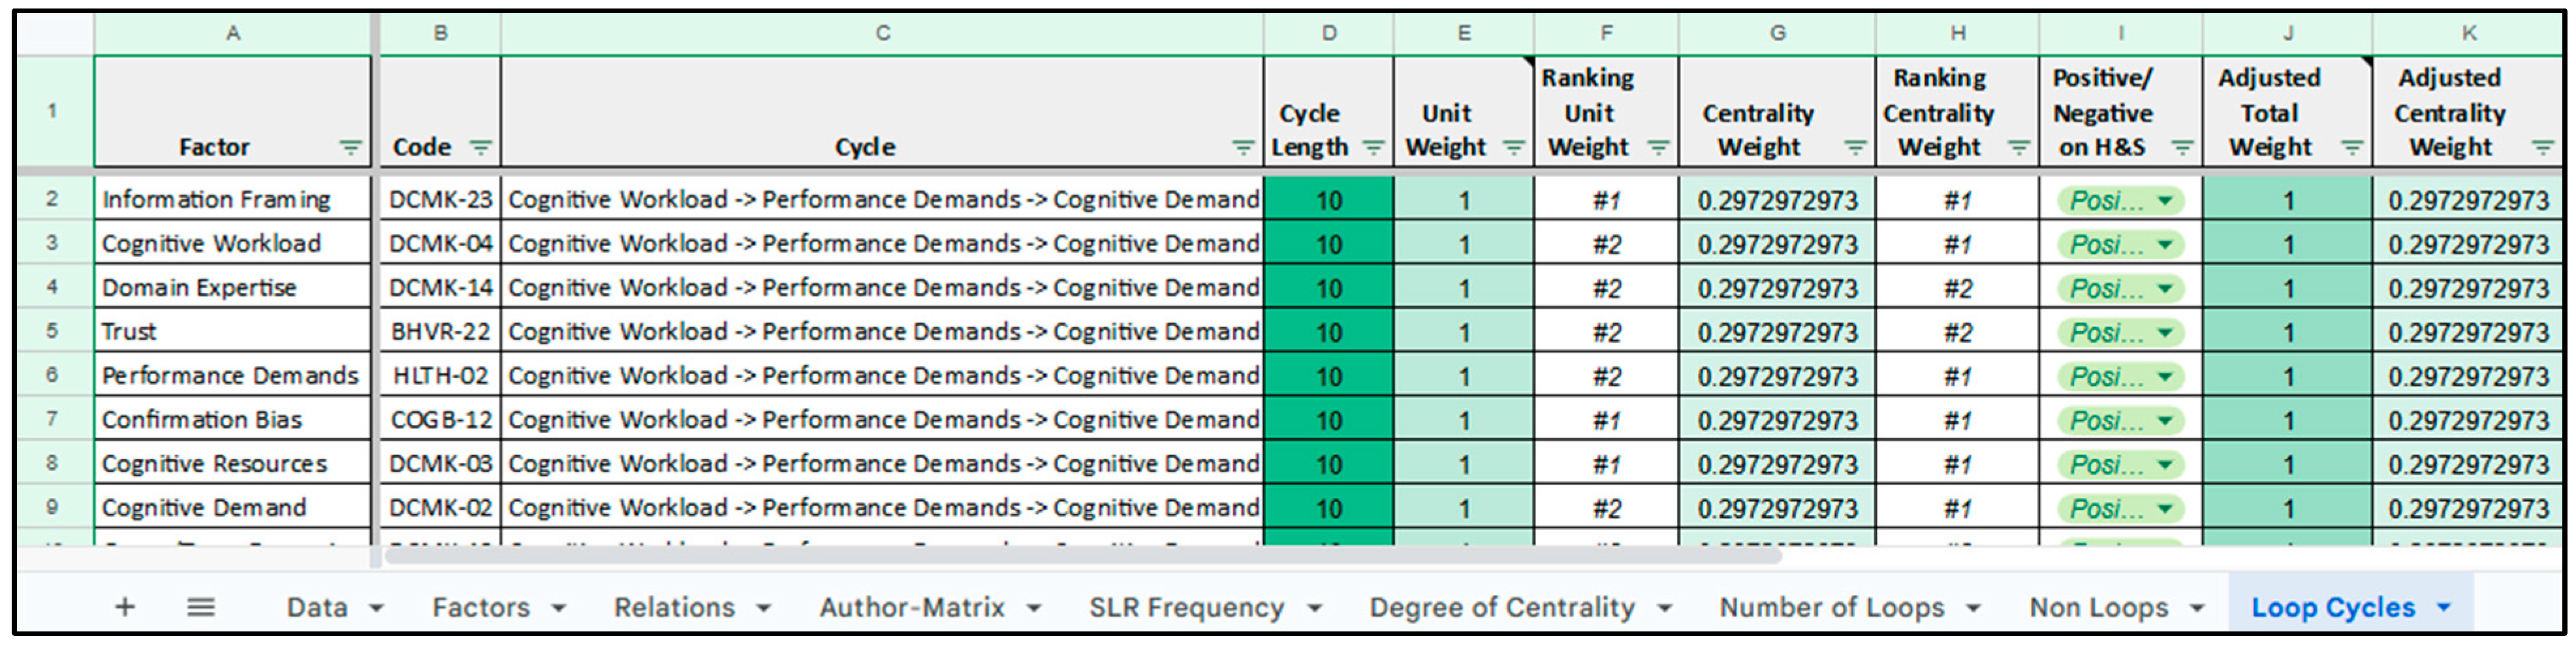
3.4.6. Loop Cycles
3.4.7. Critical Paths Generation
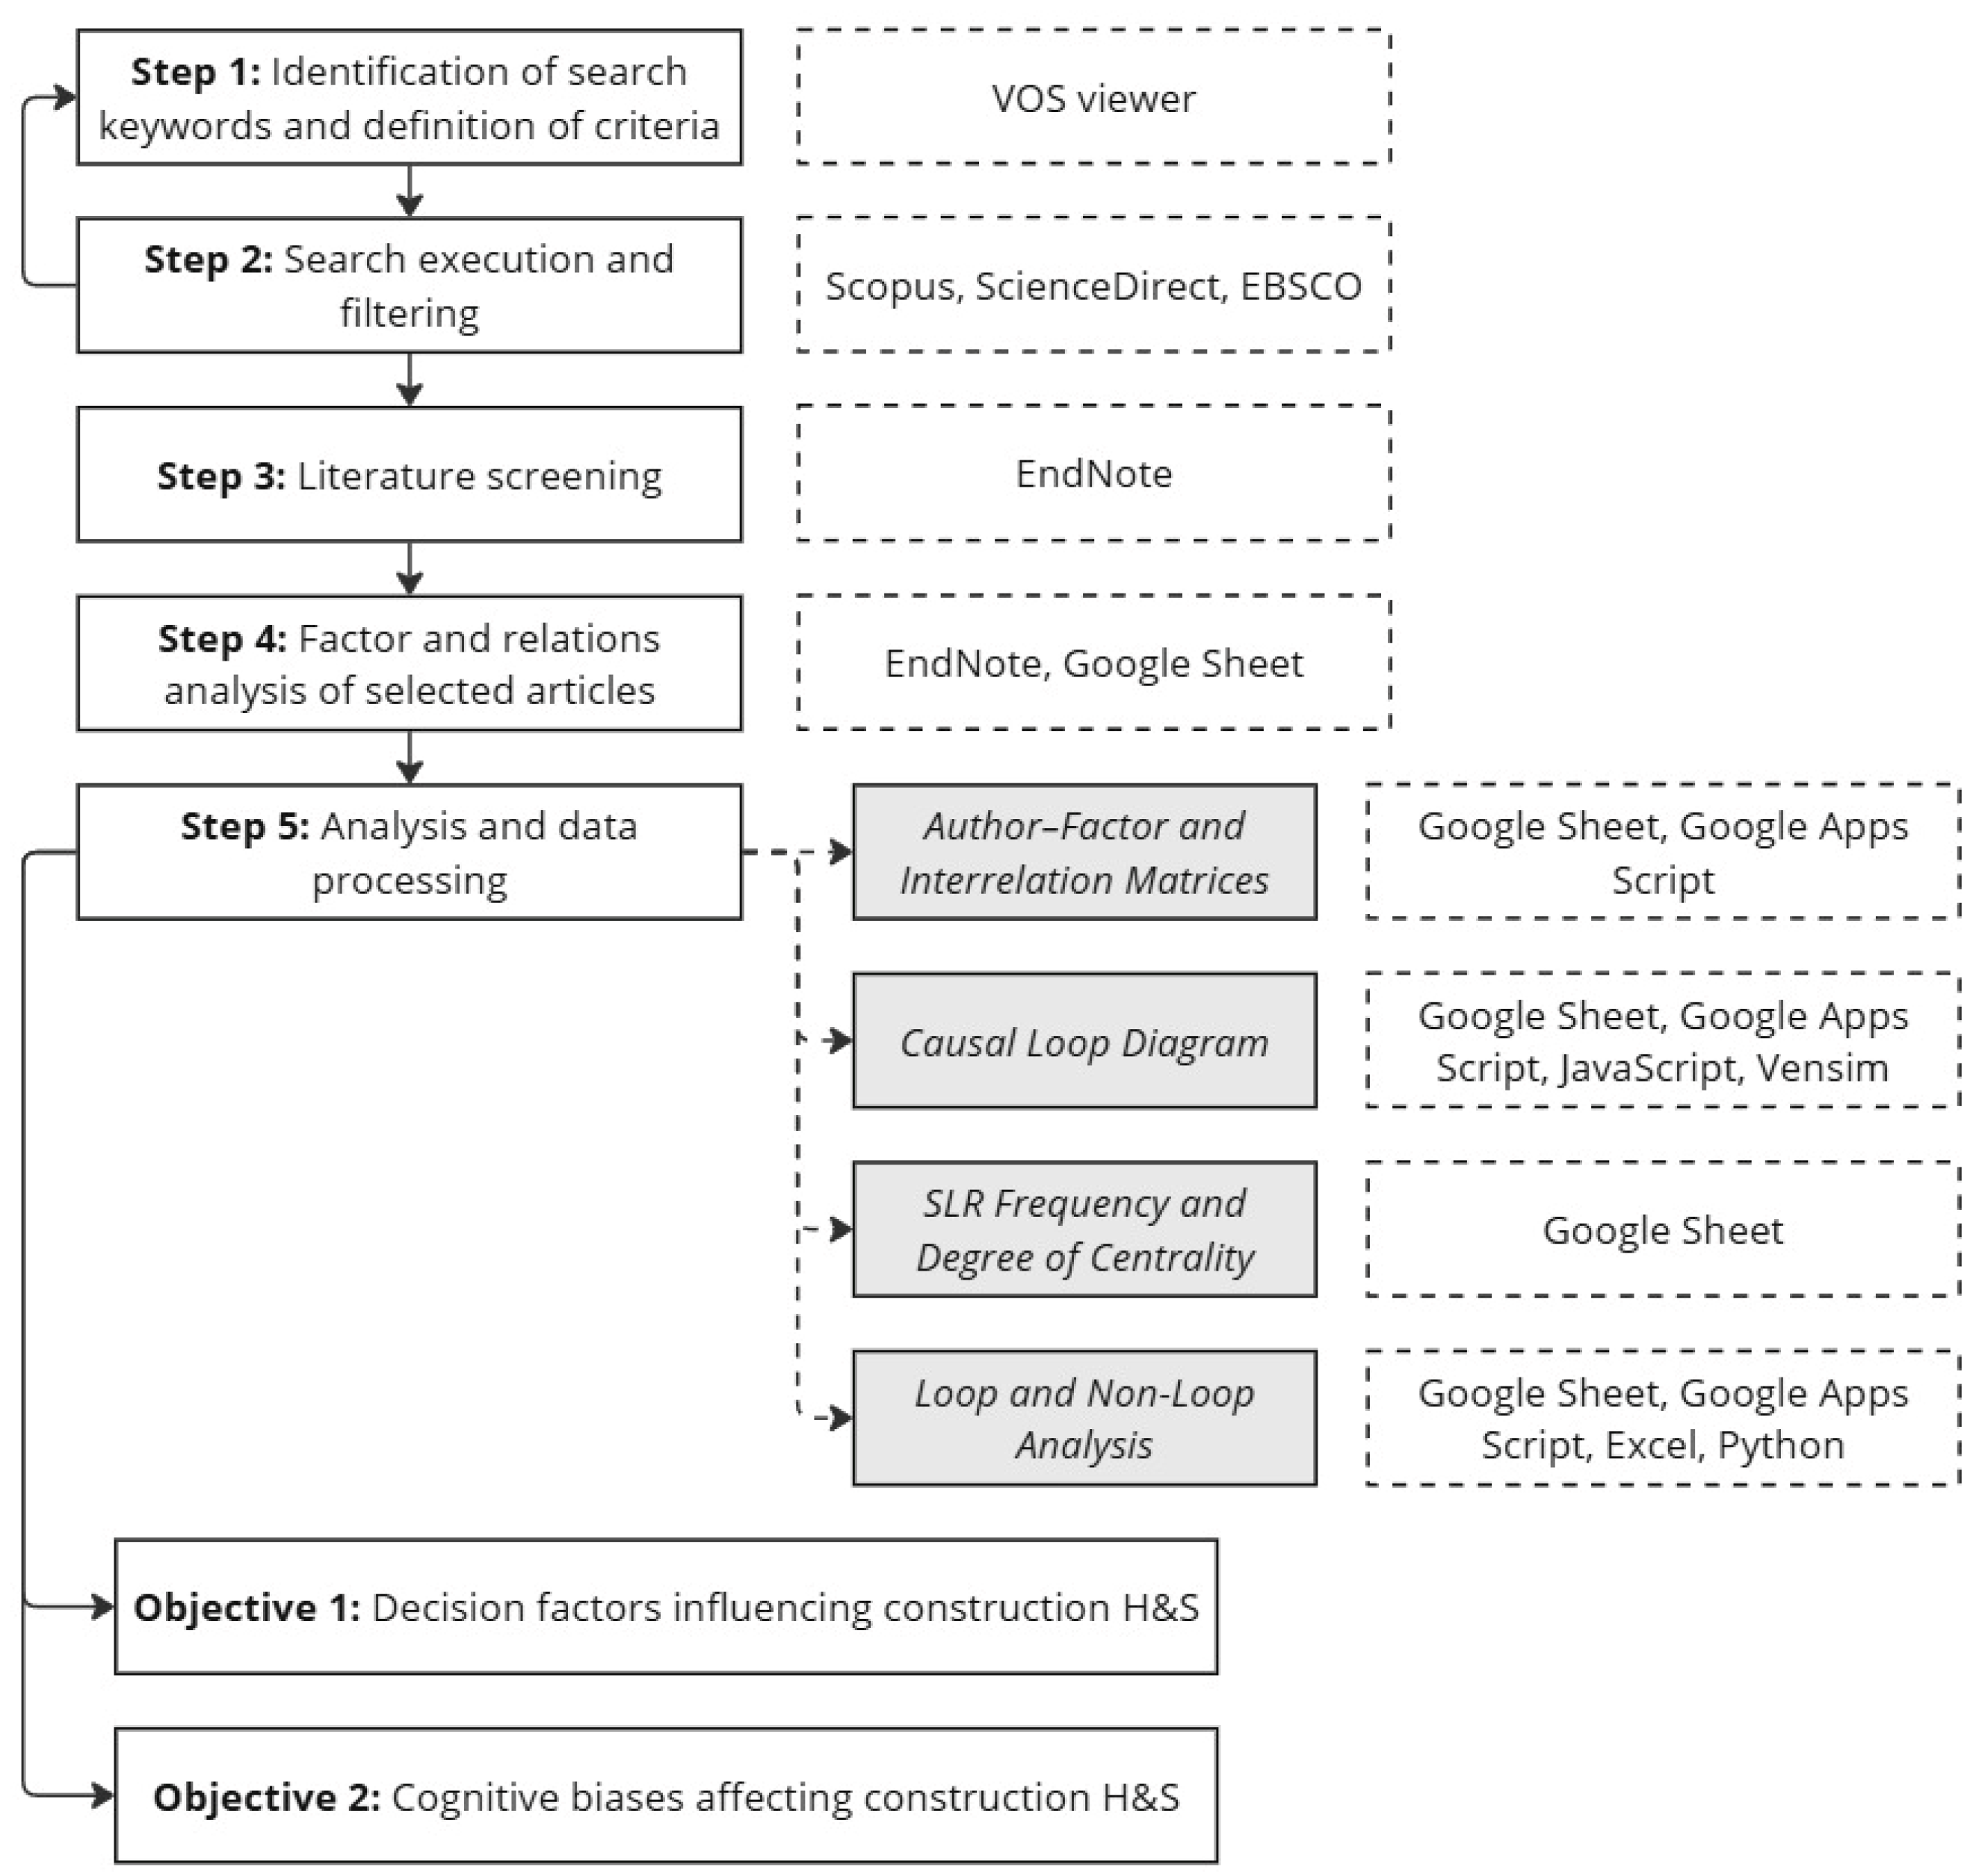
3.5. Research Workflow
4. Results
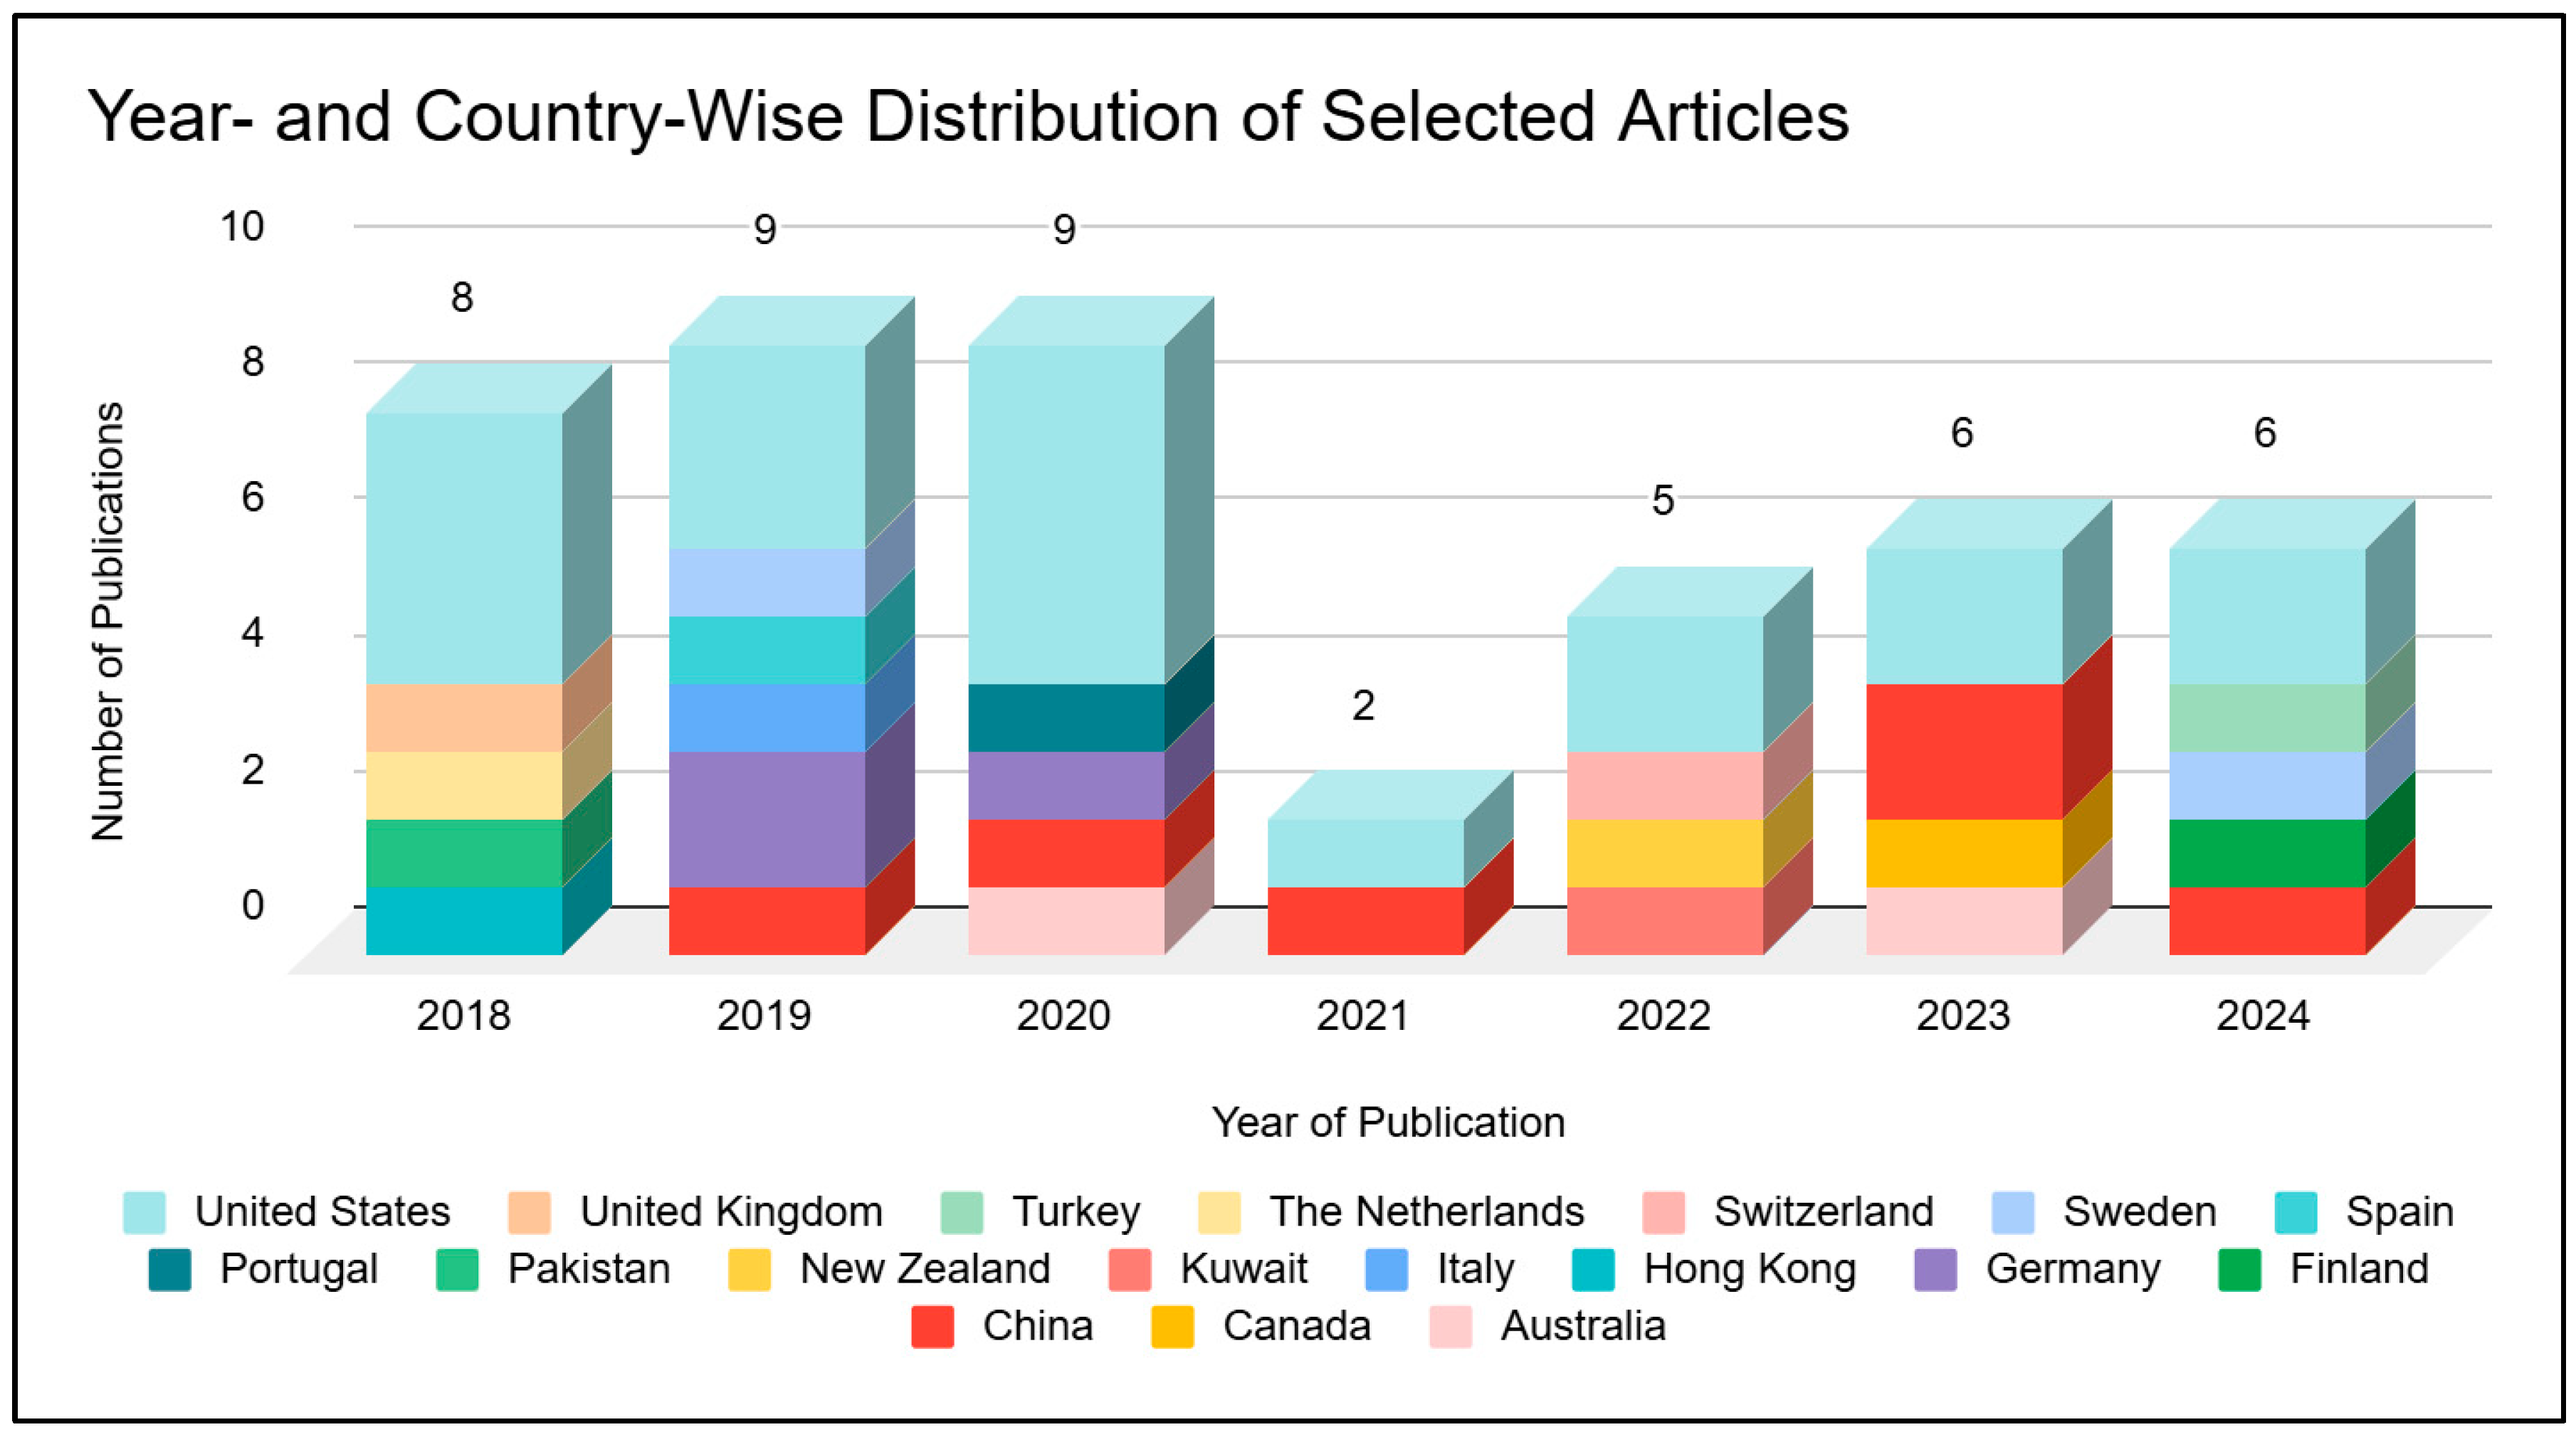
4.1. Distribution of Publications per Year
4.2. Factors and Cognitive Biases Identified in the Study
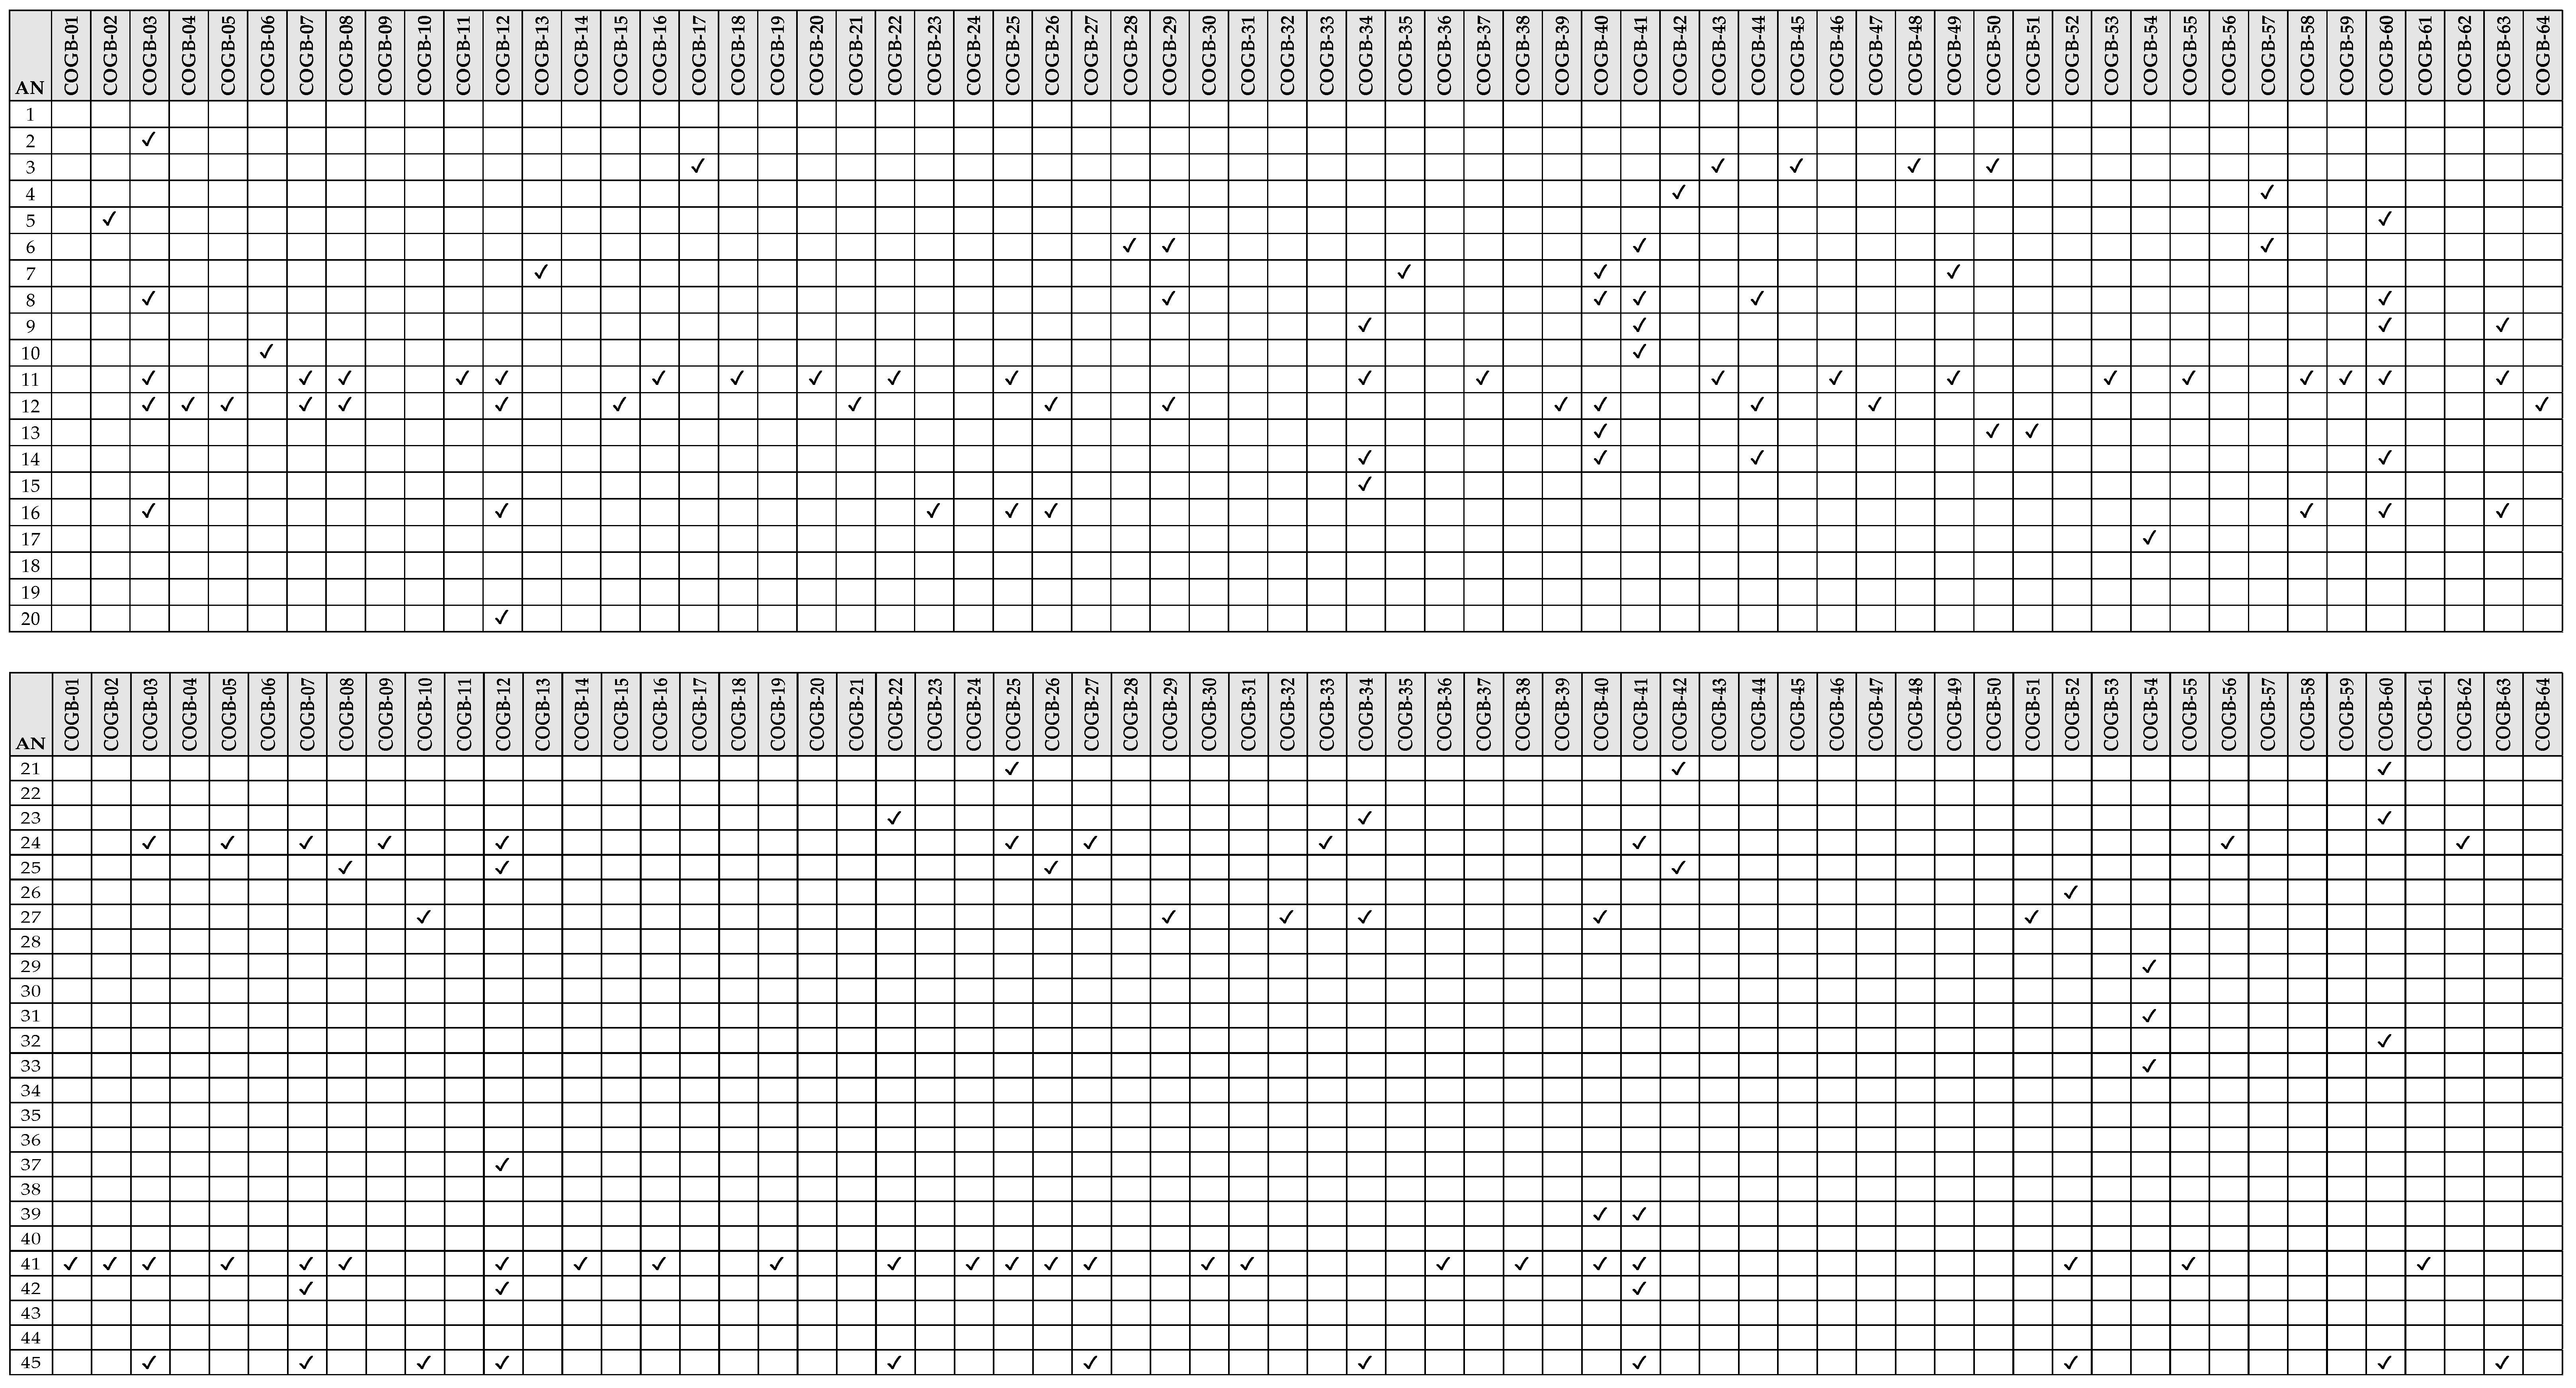
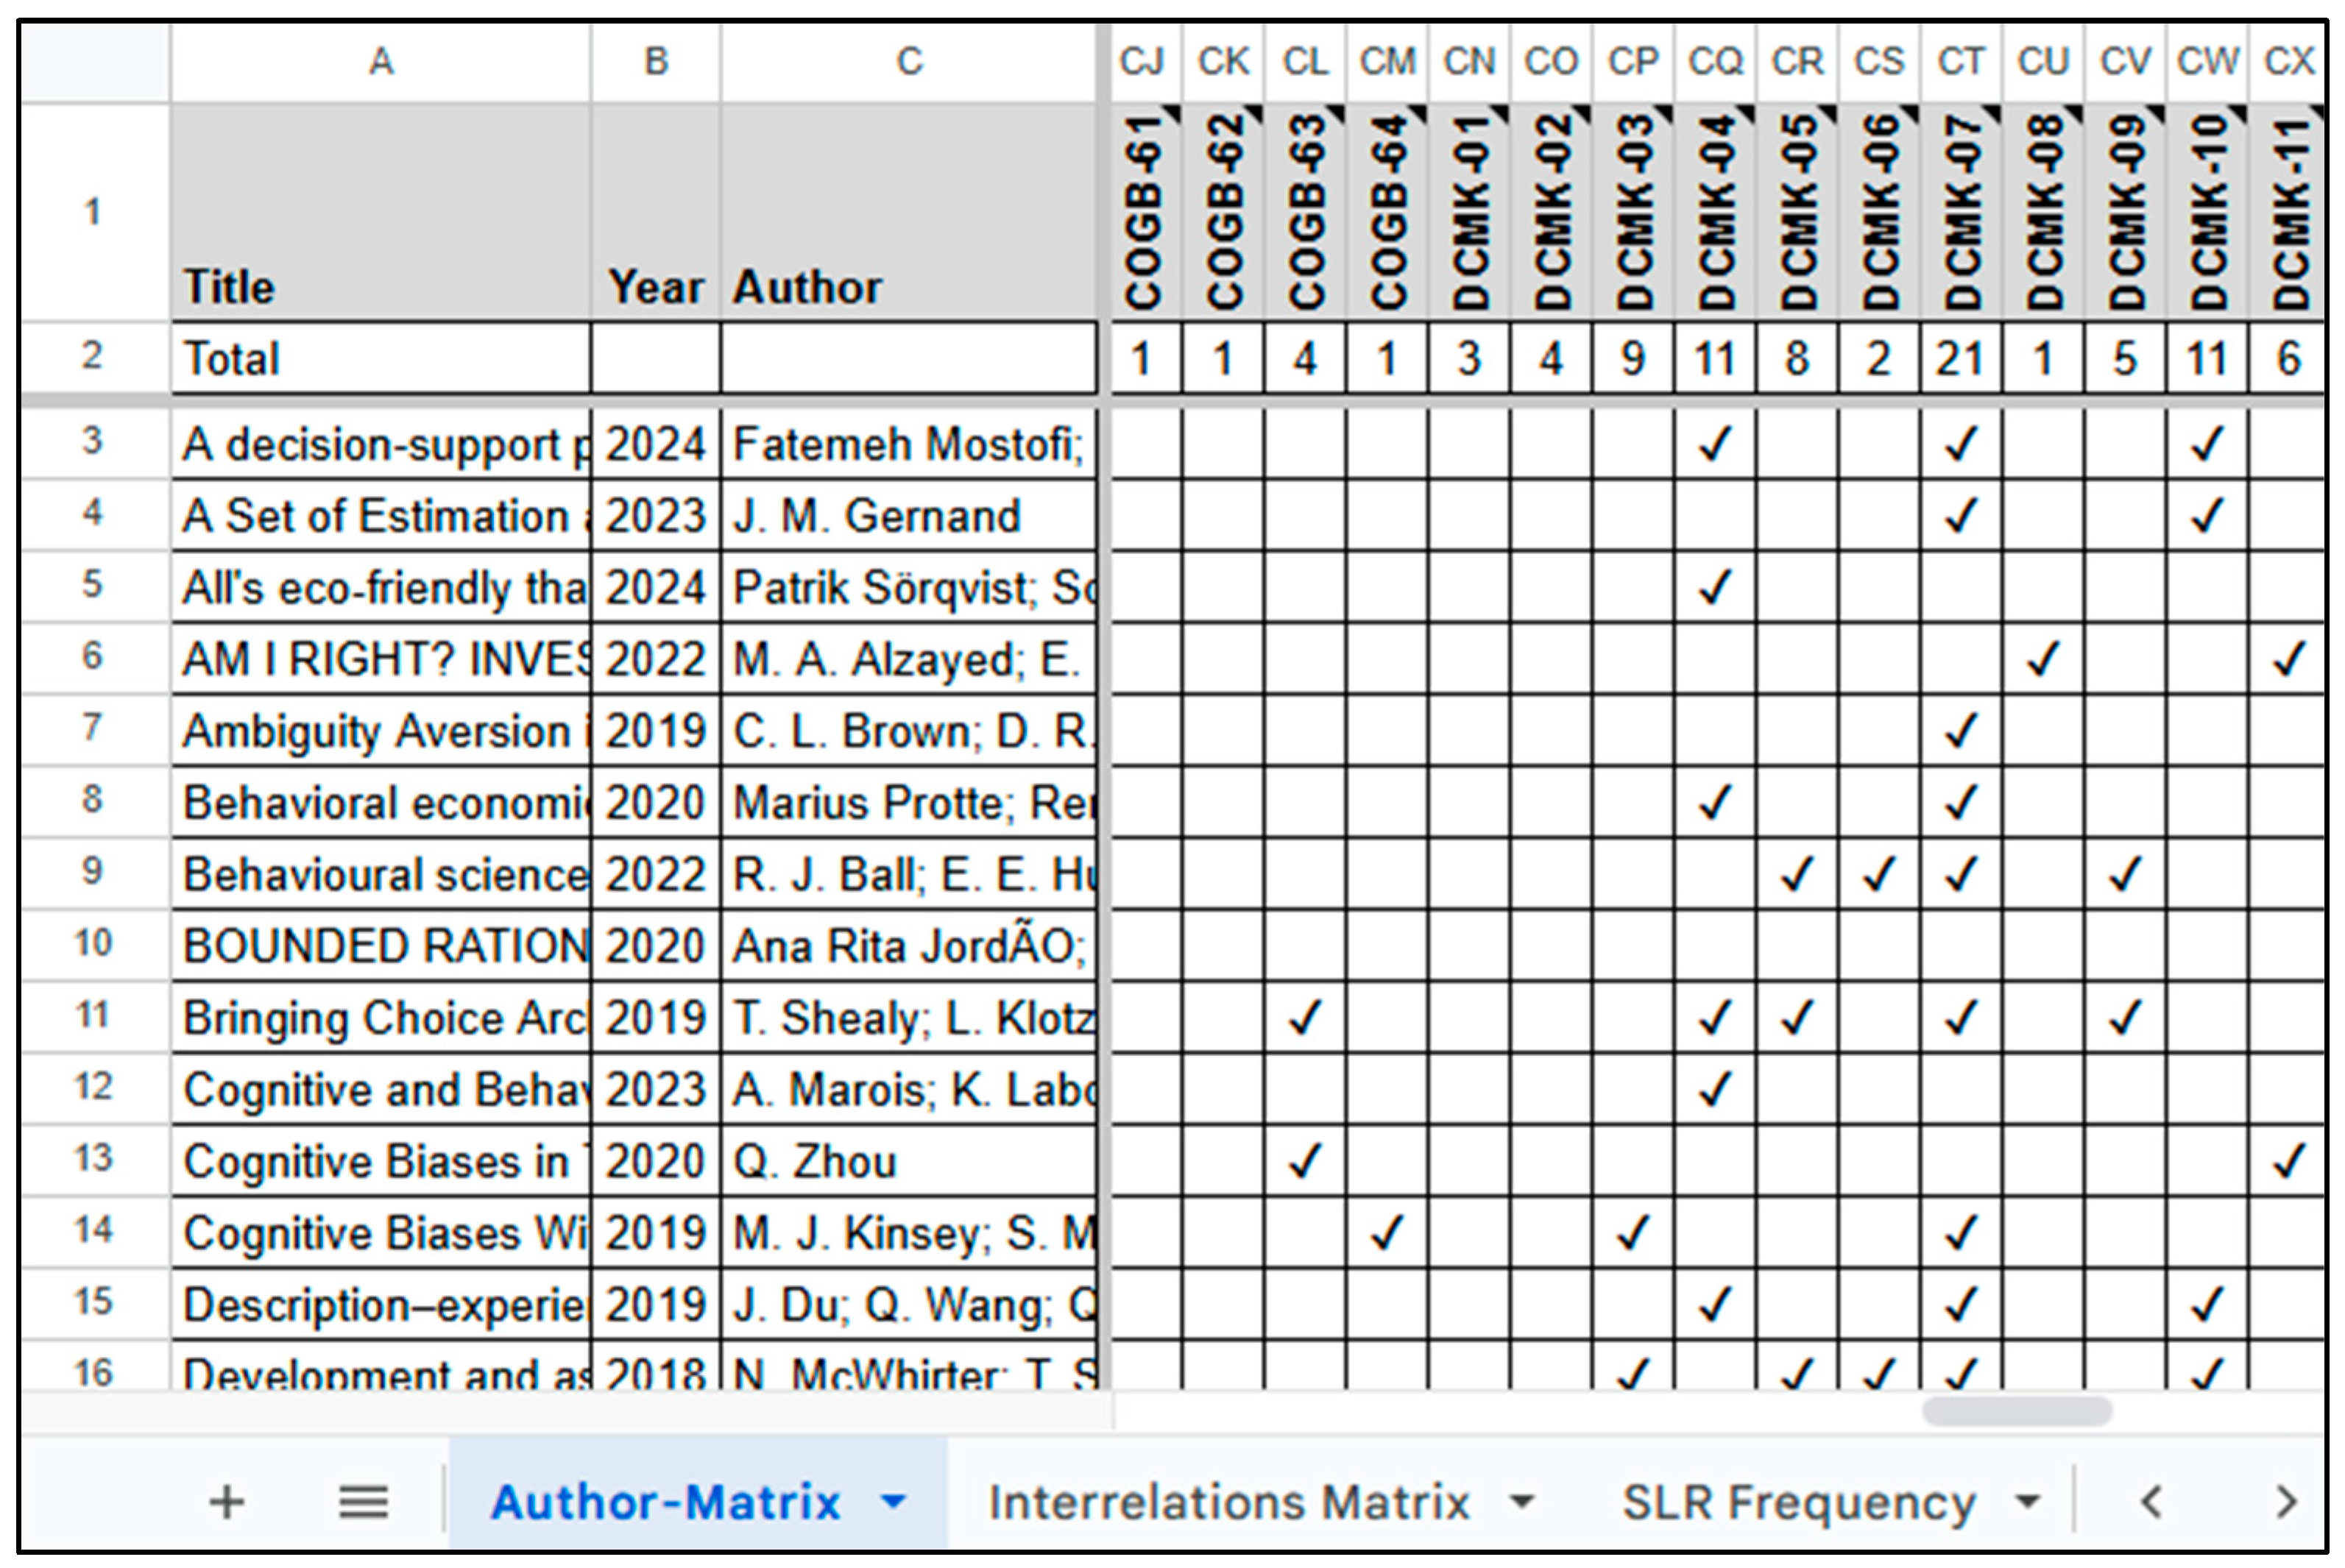
4.3. Author–Factor Matrix
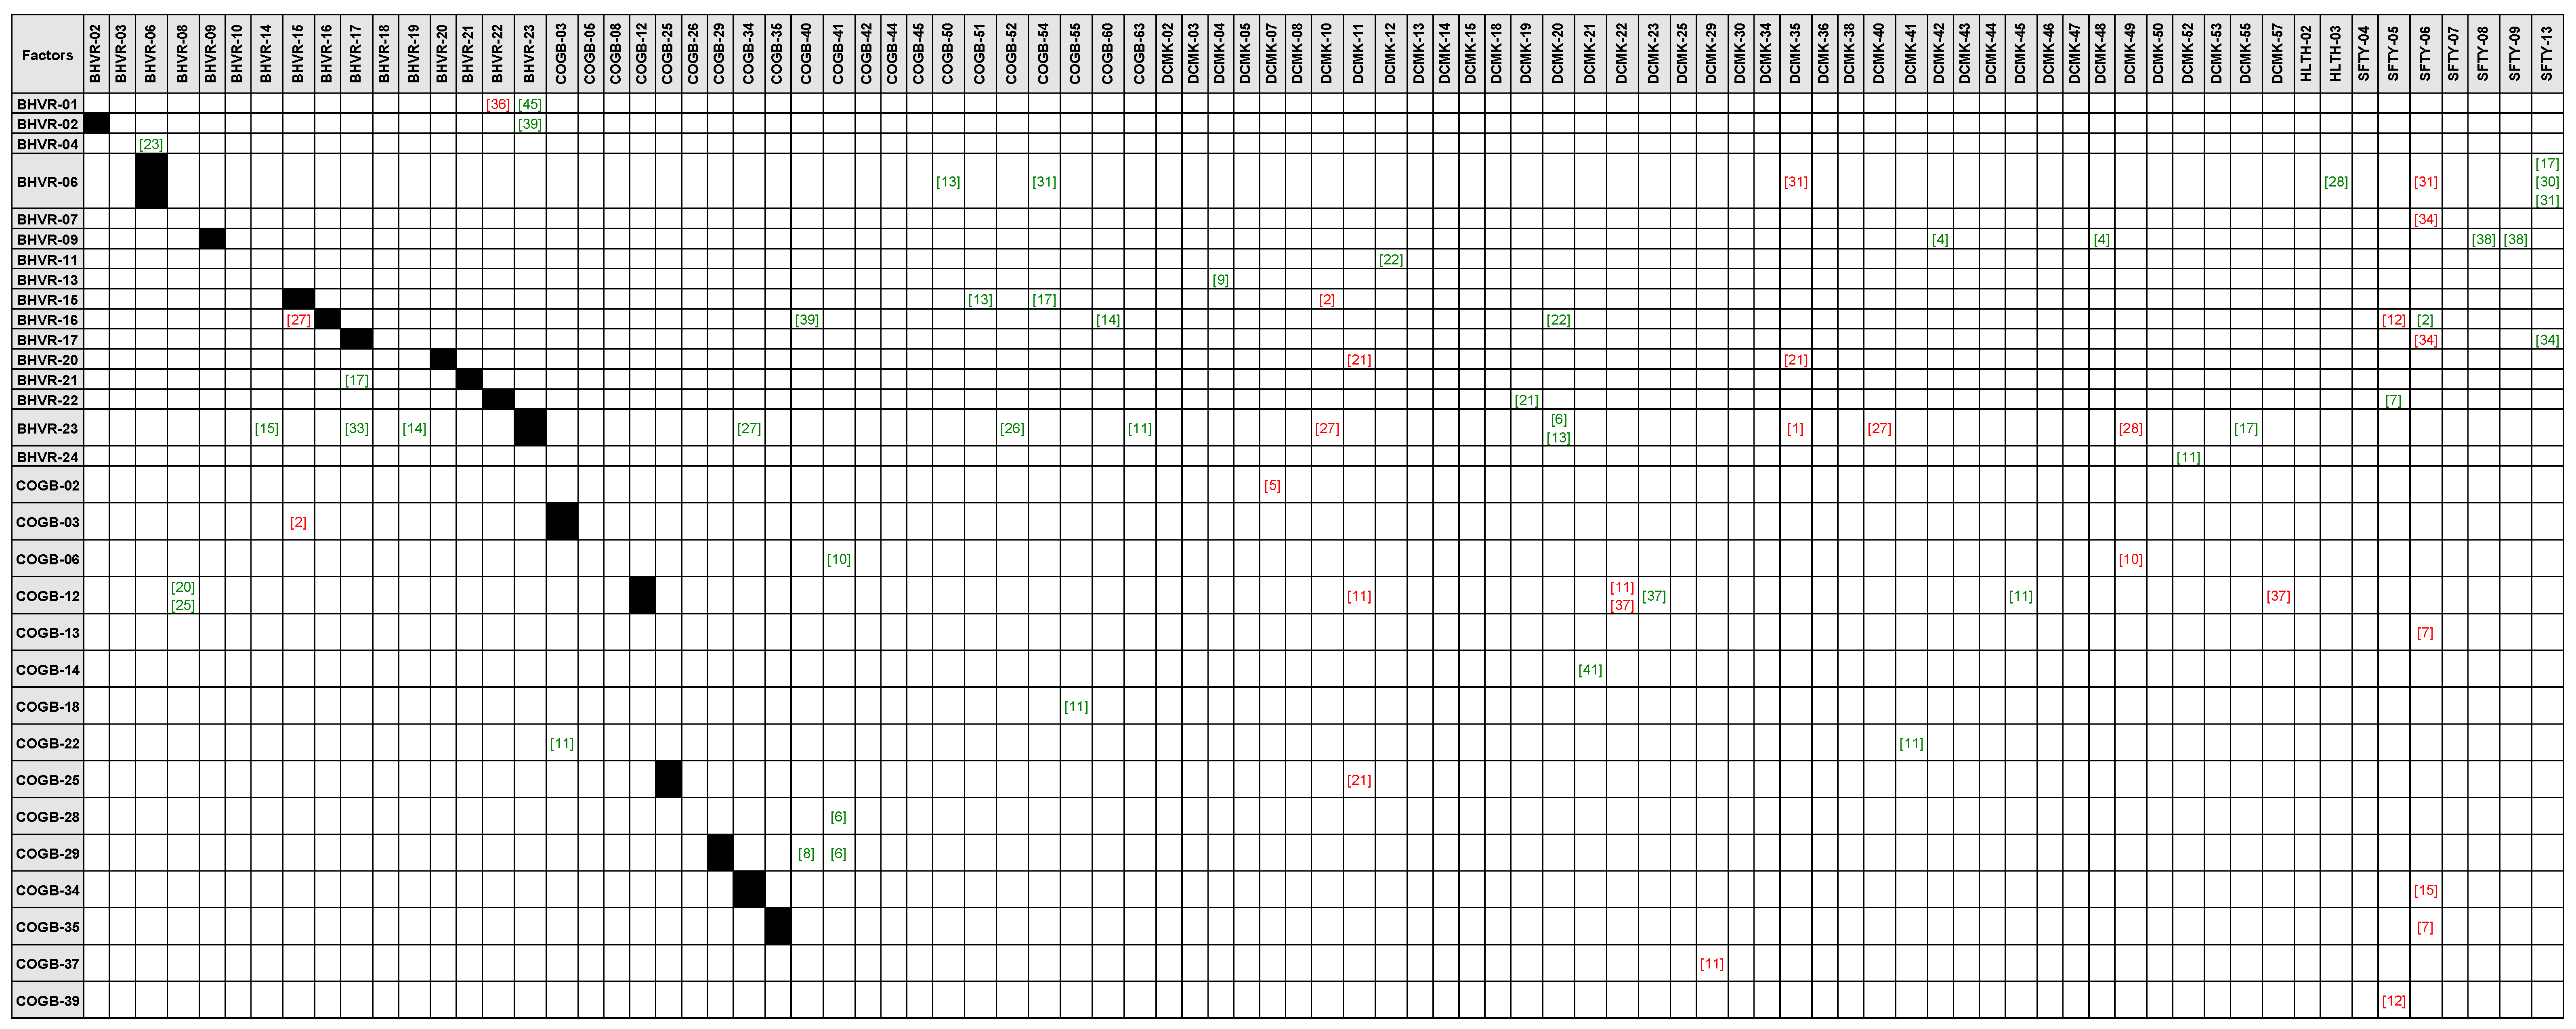
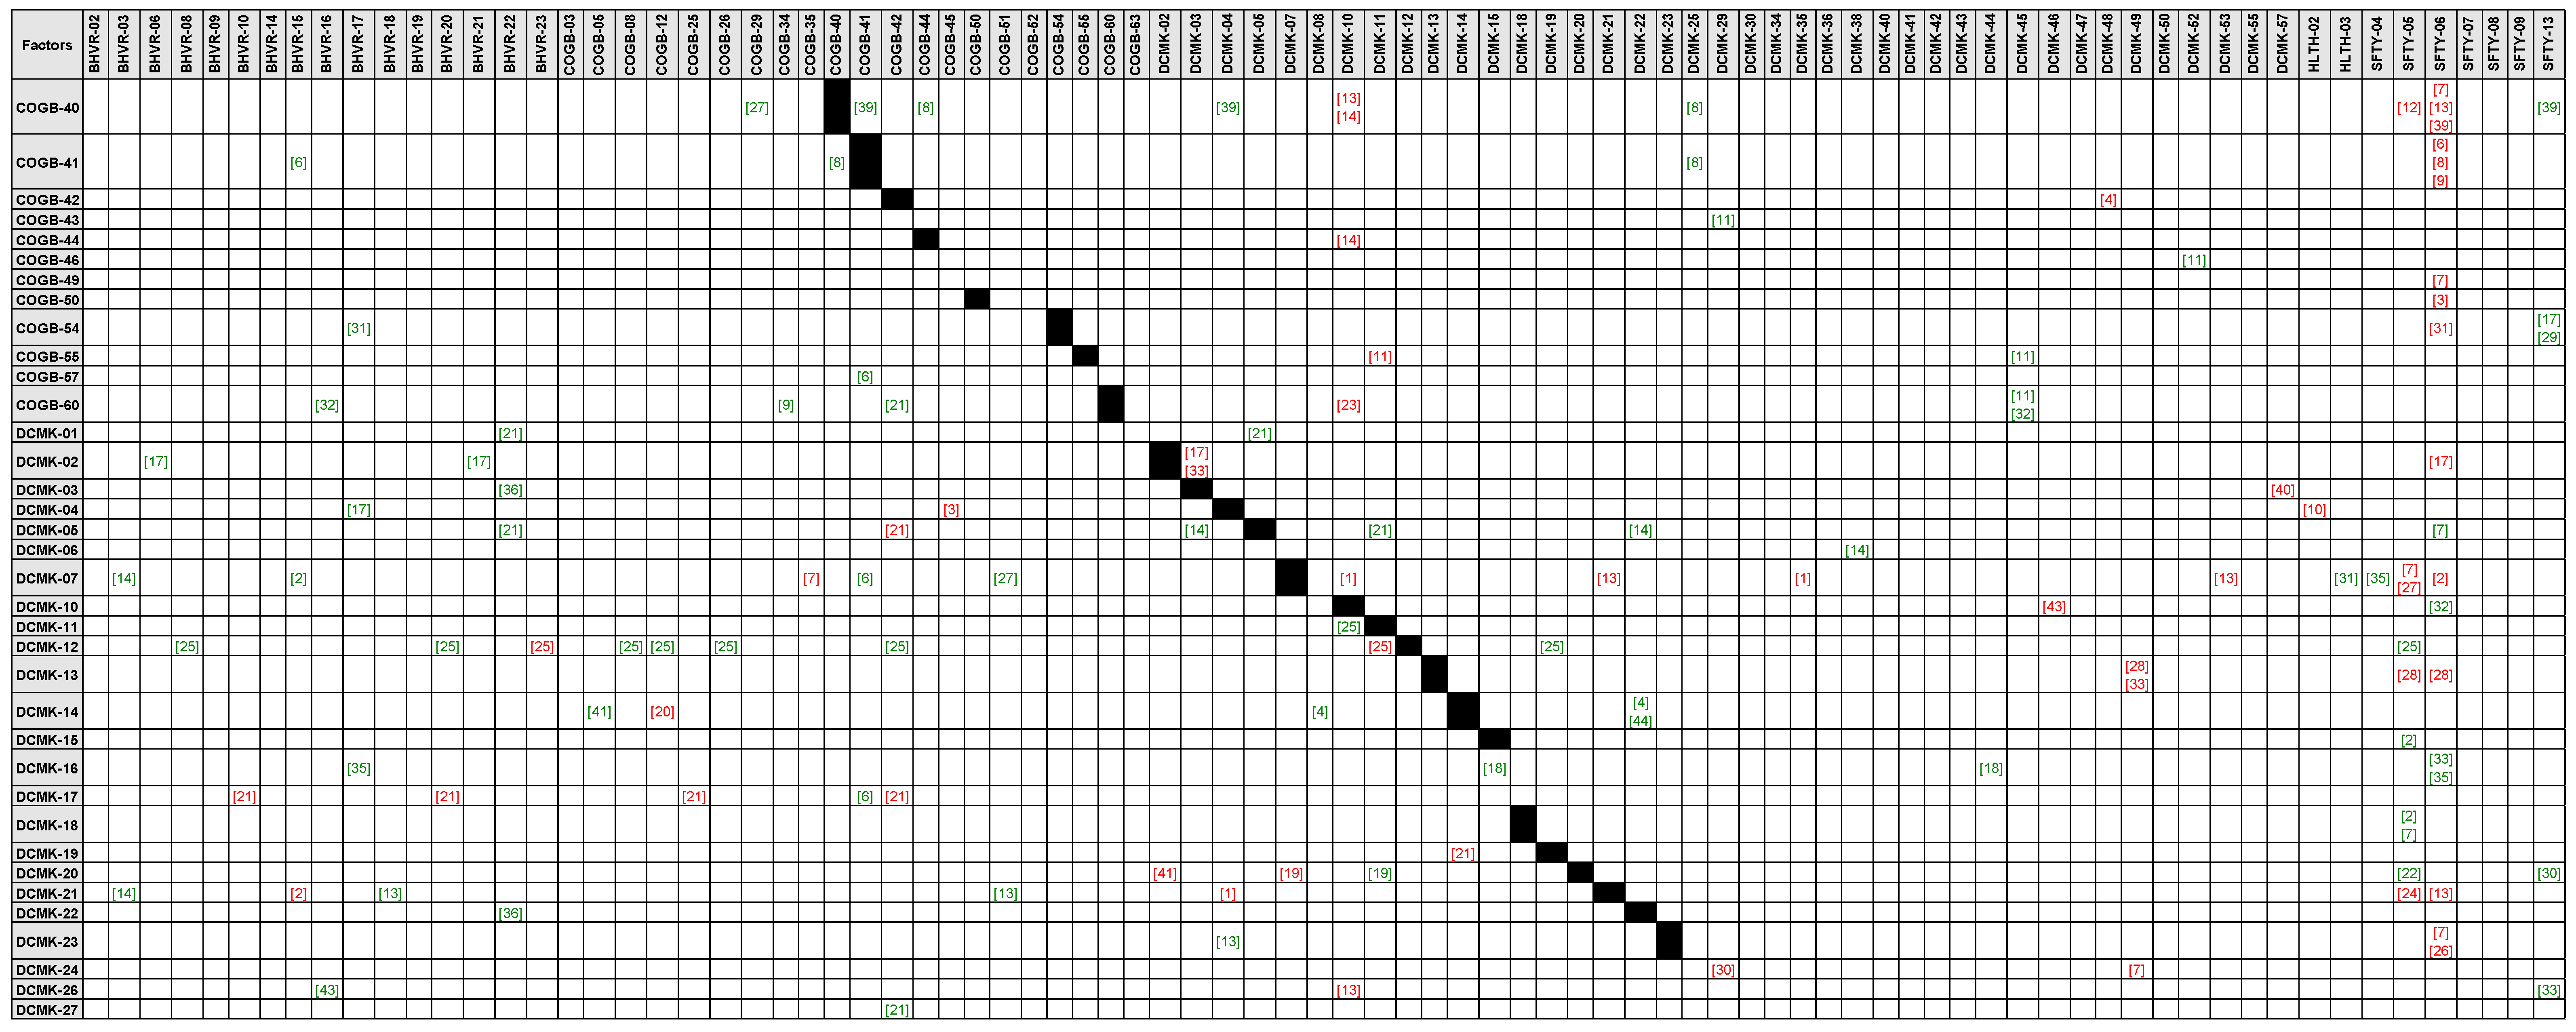
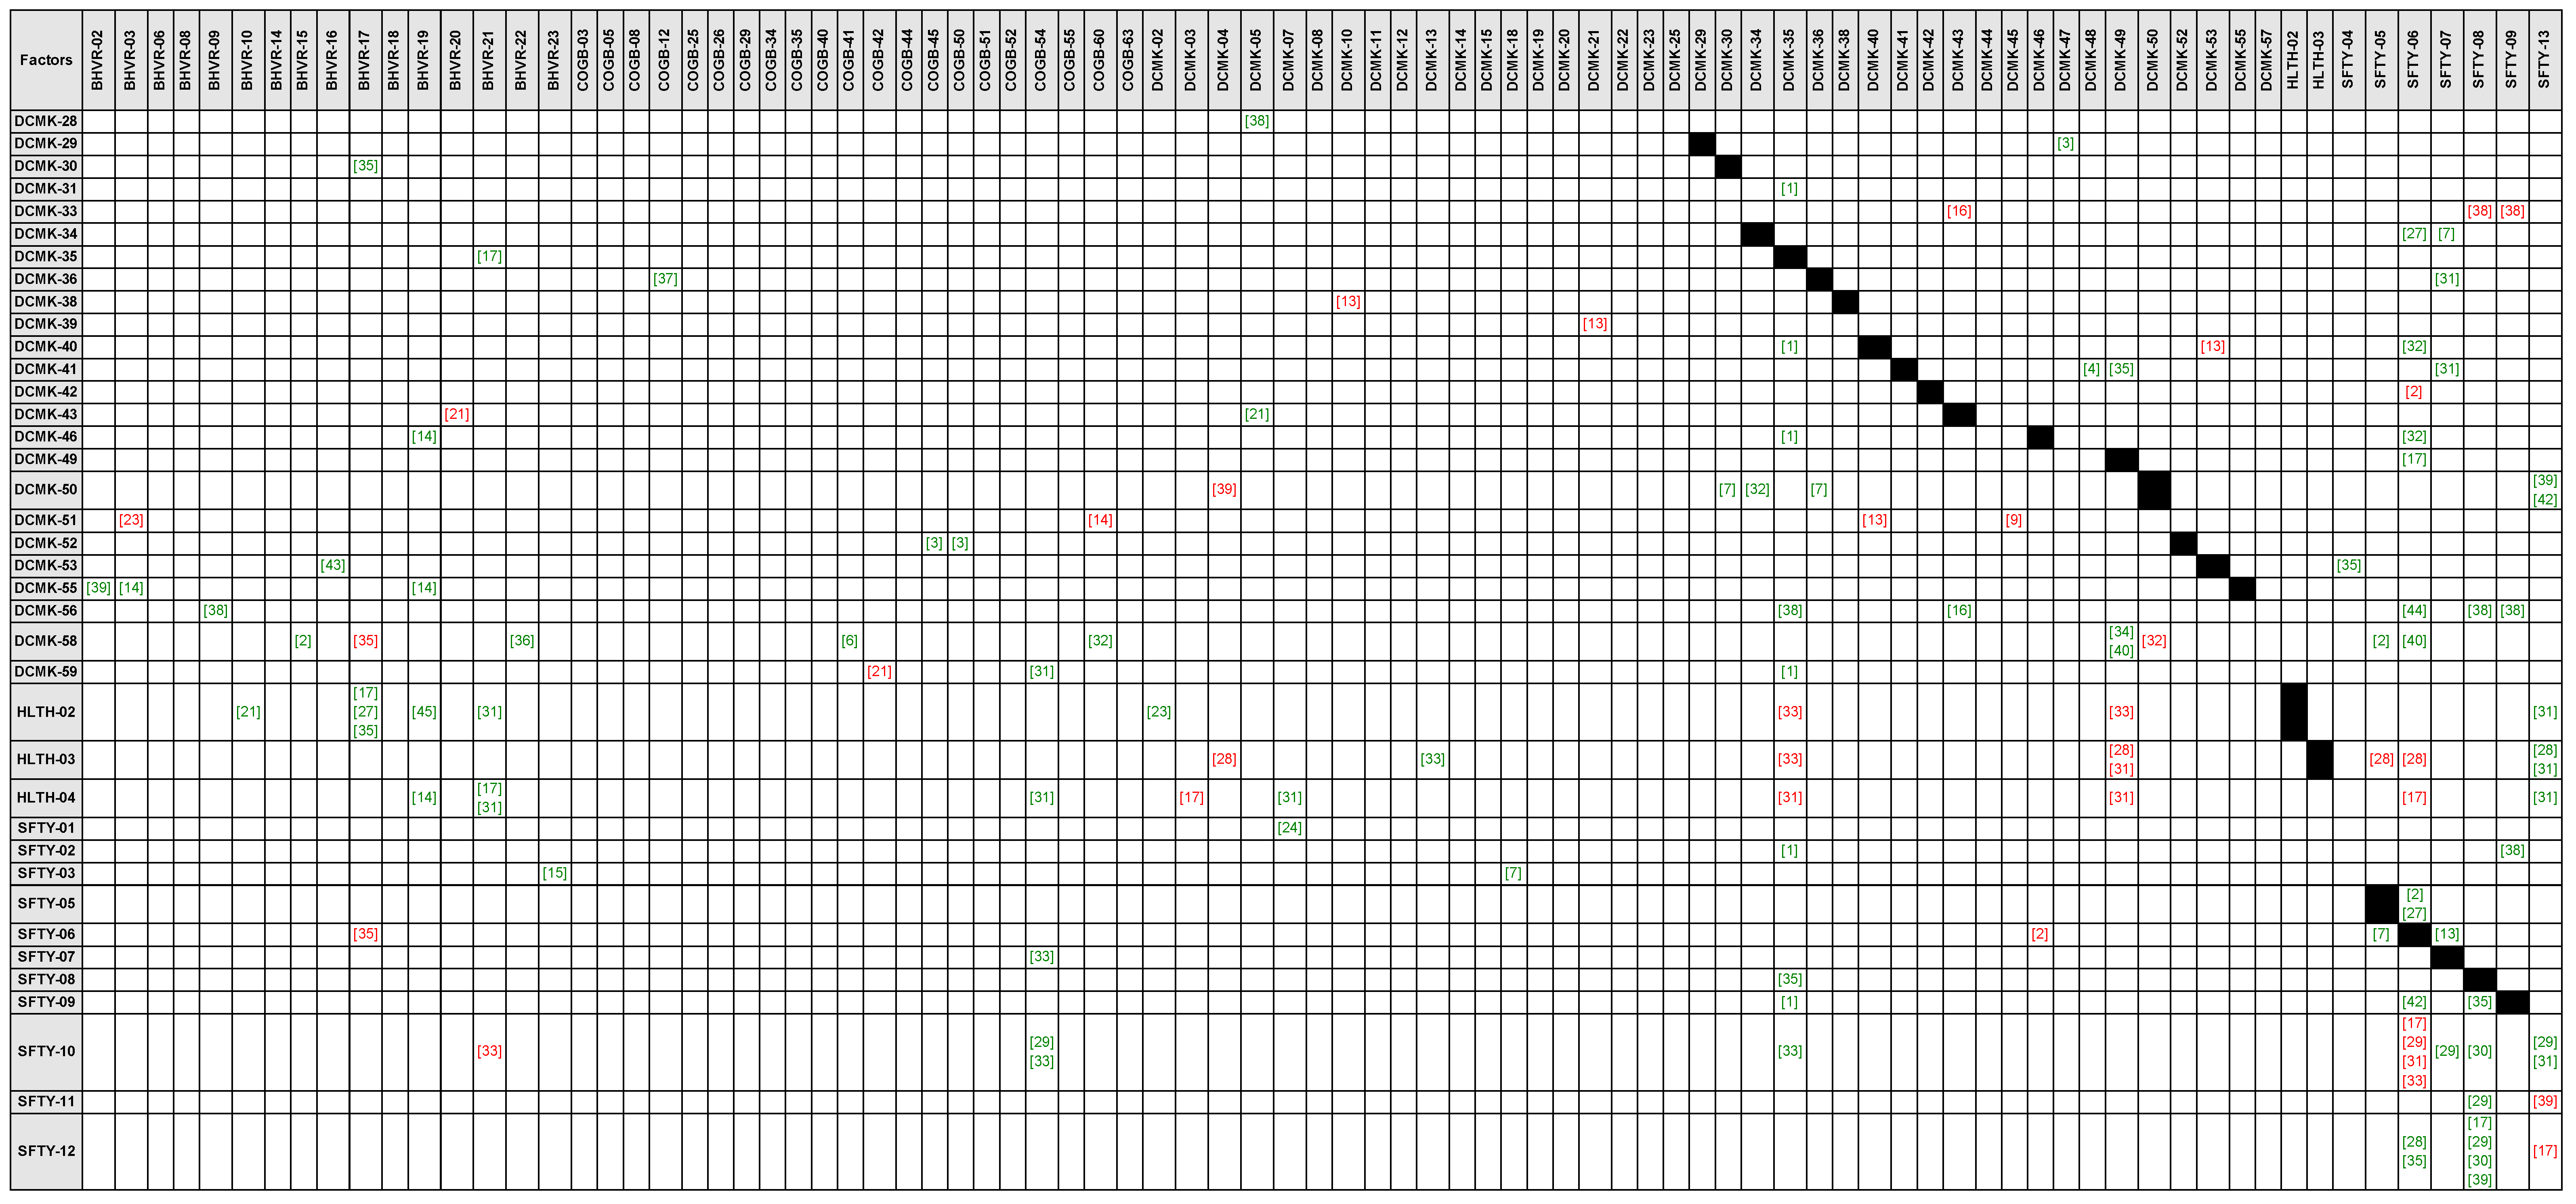
4.4. Interrelation Matrix
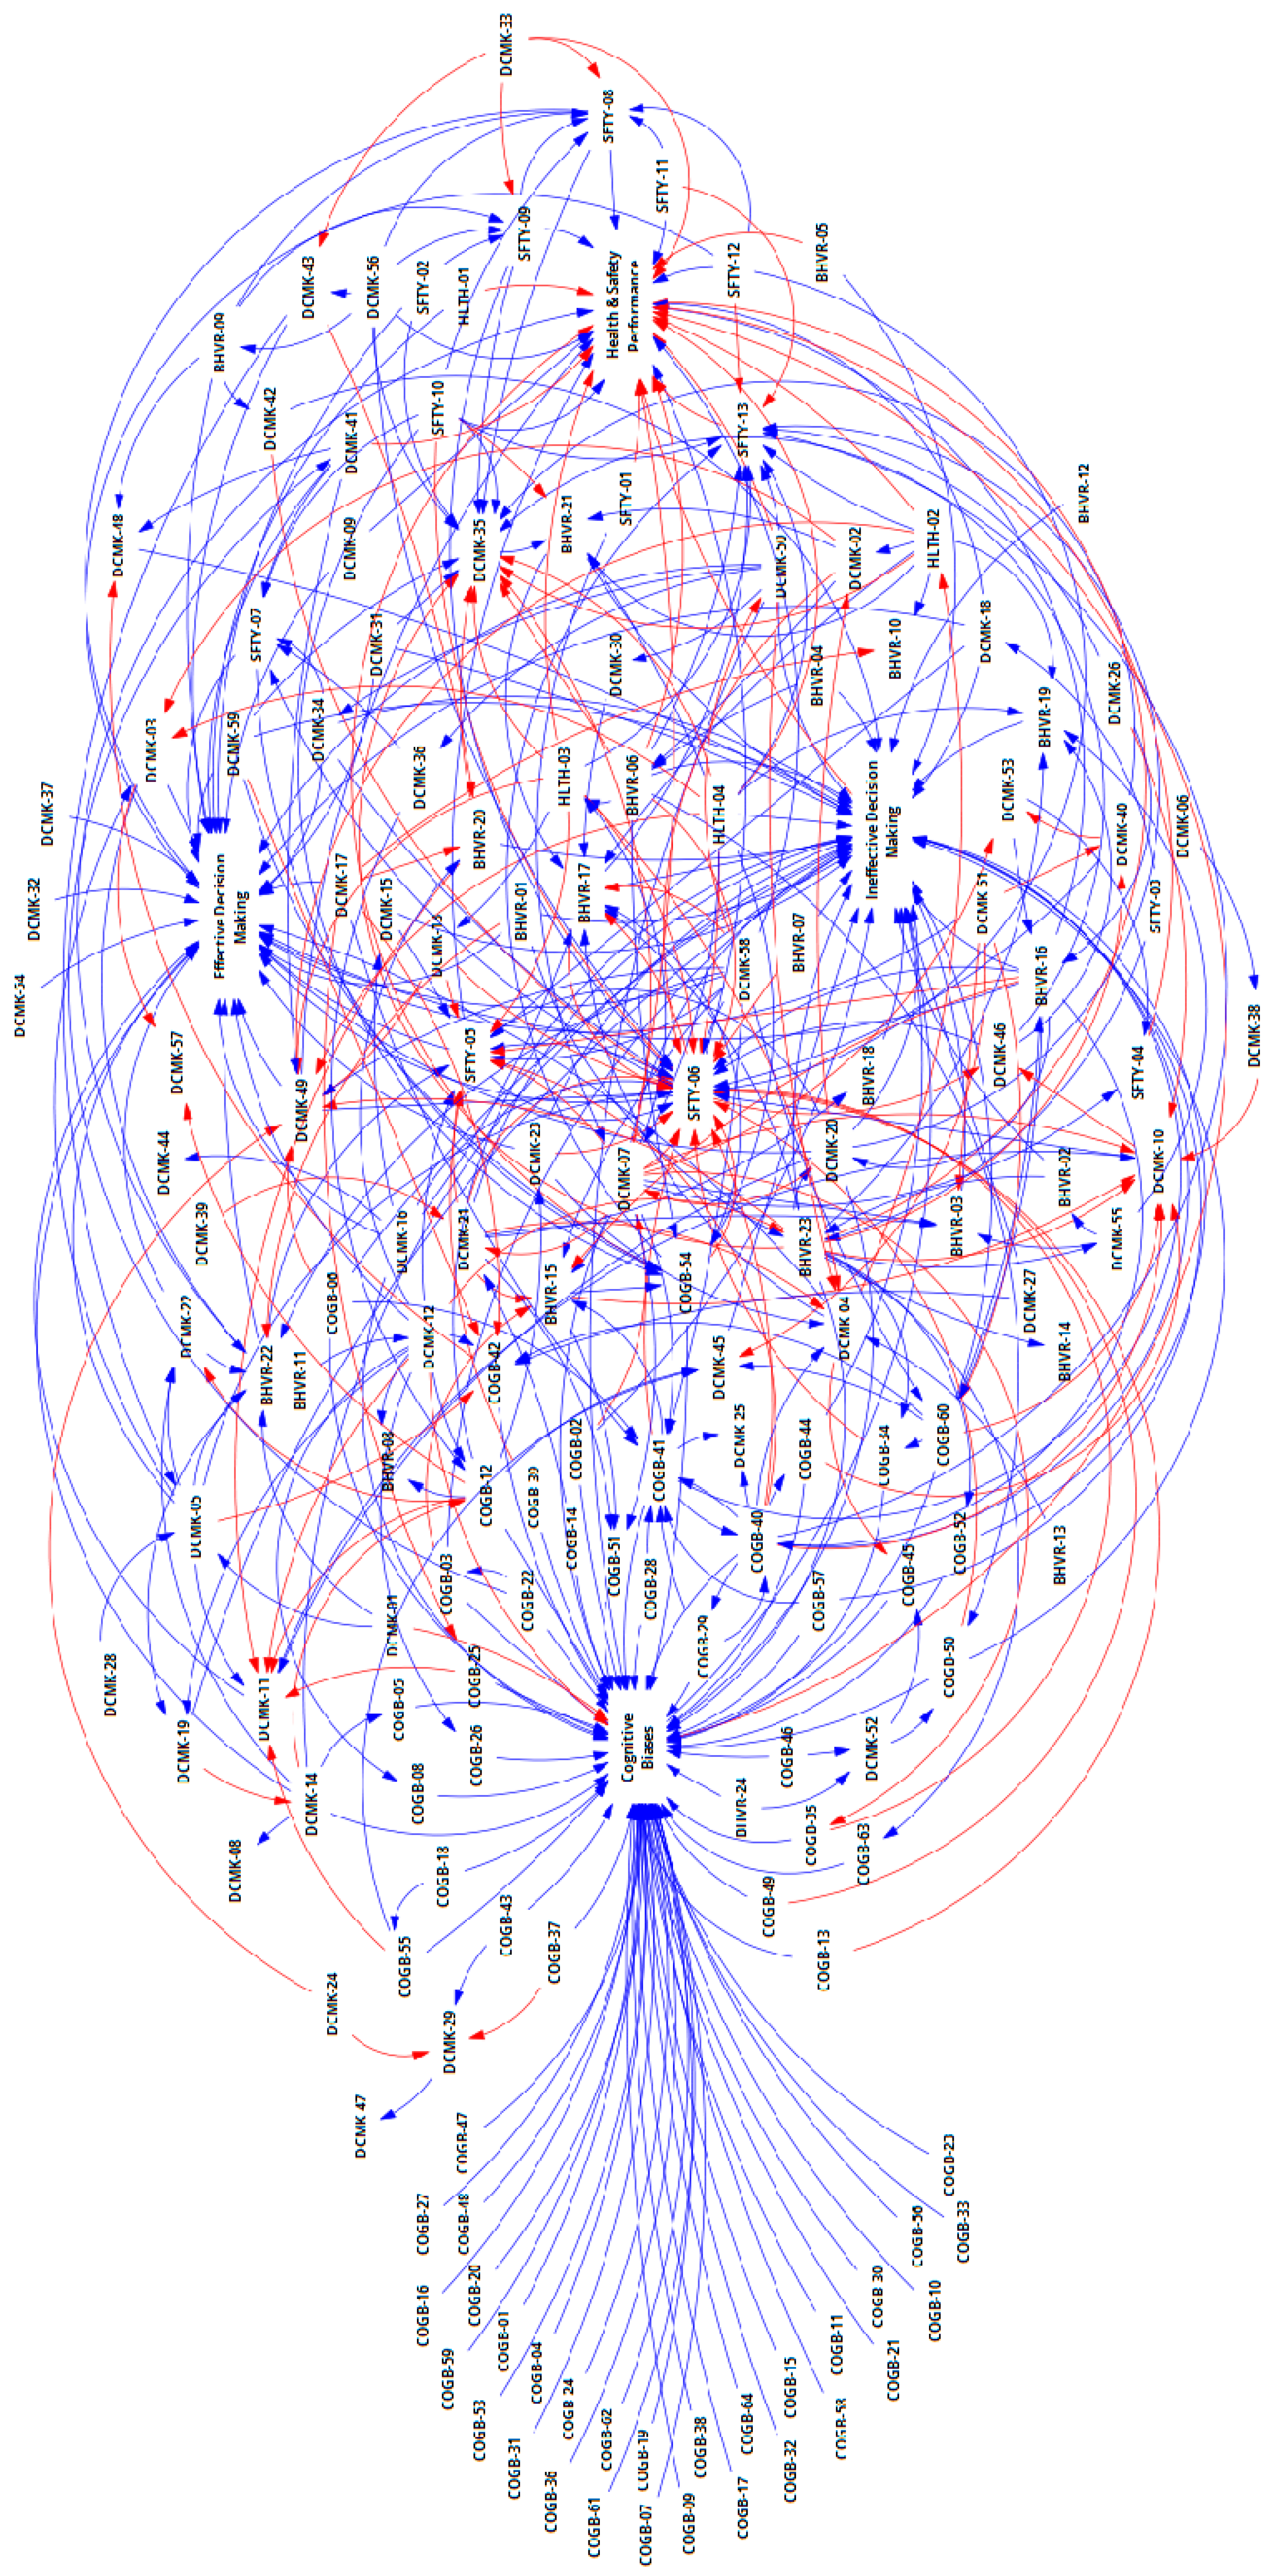
4.5. Causal Loop Diagram
4.6. SLR Frequency
4.7. Degree of Centrality
4.8. Loop Analysis
4.9. Critical Paths
5. Discussion
5.1. Factors and Cognitive Biases
5.2. Loops and Critical Paths
5.2.1. Loops
5.2.2. Critical Paths
- BHVR-11 → DCMK-12 → BHVR-23 → DCMK-40 → DCMK-53 → BHVR-16 → DCMK-20 → DCMK-07 → DCMK-21 → BHVR-15 → DCMK-10 → DCMK-46 → SFTY-06 → BHVR-17 → OTHR-03 → STCK-01.
- BHVR-11 → DCMK-12 → BHVR-23 → DCMK-40 → DCMK-53 → BHVR-16 → DCMK-20 → DCMK-07 → DCMK-21 → DCMK-04 → HLTH-02 → DCMK-02 → DCMK-03 → BHVR-22 → DCMK-19 → DCMK-14 → COGB-12 → DCMK-11 → DCMK-10 → DCMK-46 → SFTY-06 → BHVR-17 → OTHR-03 → STCK-01.
- BHVR-11 → DCMK-12 → BHVR-23 → DCMK-40 → DCMK-53 → BHVR-16 → DCMK-20 → DCMK-07 → DCMK-21 → DCMK-04 → HLTH-02 → DCMK-49 → SFTY-06 → BHVR-17 → OTHR-03 → STCK-01.
- BHVR-11 → DCMK-12 → BHVR-23 → DCMK-40 → DCMK-53 → BHVR-16 → DCMK-20 → DCMK-07 → DCMK-21 → DCMK-04 → HLTH-02 → DCMK-02 → SFTY-06 → BHVR-17 → OTHR-03 → STCK-01.
- BHVR-11 → DCMK-12 → BHVR-23 → DCMK-40 → DCMK-53 → BHVR-16 → DCMK-20 → DCMK-07 → DCMK-21 → DCMK-04 → HLTH-02 → DCMK-02 → DCMK-03 → BHVR-22 → DCMK-19 → DCMK-14 → COGB-12 → DCMK-23 → SFTY-06 → BHVR-17 → OTHR-03 → STCK-01.
- DCMK-58 → COGB-60 → BHVR-16 → DCMK-20 → DCMK-07 → COGB-41 → COGB-40 → DCMK-04 → HLTH-02 → DCMK-02 → BHVR-06 → HLTH-03 → DCMK-13 → DCMK-49 → SFTY-06 → SFTY-05 → OTHR-02 → STCK-01.
- DCMK-58 → COGB-60 → BHVR-16 → DCMK-20 → DCMK-07 → COGB-41 → COGB-40 → DCMK-04 → HLTH-02 → DCMK-02 → BHVR-06 → HLTH-03 → DCMK-13 → SFTY-05 → SFTY-06 → SFTY-07 → OTHR-02 → STCK-01.
- DCMK-55 → BHVR-02 → BHVR-23 → DCMK-20 → DCMK-07 → COGB-41 → COGB-40 → DCMK-04 → HLTH-02 → DCMK-02 → BHVR-06 → HLTH-03 → DCMK-13 → DCMK-49 → SFTY-06 → SFTY-05 → OTHR-02 → STCK-01.
- DCMK-55 → BHVR-02 → BHVR-23 → DCMK-20 → DCMK-07 → COGB-41 → COGB-40 → DCMK-04 → HLTH-02 → DCMK-02 → BHVR-06 → HLTH-03 → DCMK-13 → SFTY-05 → SFTY-06 → SFTY-07 → OTHR-02 → STCK-01.
- DCMK-58 → COGB-60 → BHVR-16 → DCMK-20 → DCMK-07 → COGB-41 → COGB-40 → DCMK-04 → HLTH-02 → DCMK-02 → BHVR-06 → HLTH-03 → DCMK-13 → DCMK-49 → SFTY-06 → SFTY-07 → OTHR-02 → STCK-01.
6. Conclusions
- Trust (DCMK-14) → Group/Team Dynamics (DCMK-22) → Domain Expertise (BHVR-22) → Information Availability (DCMK-19) → trust (DCMK-14).
- Risk aversion (BHVR-16) → status quo bias (COGB-60) → risk aversion (BHVR-16).
- Overconfidence bias (COGB-41) → optimism bias (COGB-40) → illusion of control (COGB-29) → overconfidence bias (COGB-41).
- Heuristics (DCMK-20) → complexity (DCMK-07) → overconfidence bias (COGB-41) → optimism bias (COGB-40) → cognitive workload (DCMK-04) → performance demands (HLTH-02) → cognitive demand (DCMK-02) → cognitive overload (BHVR-06) → physical fatigue (HLTH-03) → distractions (DCMK-13).
- Fast and frugal heuristics (BHVR-11) → Decision-Making Method/Framework (DCMK-12) → uncertainty (BHVR-23) → project scheduling (DCMK-40) → technical challenges (DCMK-53) → risk aversion (BHVR-16) → heuristics (DCMK-20) → complexity (DCMK-07) → Incomplete/Limited Information (DCMK-21).
6.1. Research Limitations
6.2. Practical and Theoretical Implications
Author Contributions
Funding
Data Availability Statement
Acknowledgments
Conflicts of Interest
Abbreviations
| CLD | Causal loop diagram |
| H&S | Health and safety |
| SLR | Systematic literature review |
Appendix A

| AN | Author | Country | BHVR-01 | BHVR-02 | BHVR-03 | BHVR-04 | BHVR-05 | BHVR-06 | BHVR-07 | BHVR-08 | BHVR-09 | BHVR-10 | BHVR-11 | BHVR-12 | BHVR-13 | BHVR-14 | BHVR-15 | BHVR-16 | BHVR-17 | BHVR-18 | BHVR-19 | BHVR-20 | BHVR-21 | BHVR-22 | BHVR-23 | BHVR-24 | HLTH-01 | HLTH-02 | HLTH-03 | HLTH-04 | SFTY-01 | SFTY-02 | SFTY-03 | SFTY-04 | SFTY-05 | SFTY-06 | SFTY-07 | SFTY-08 | SFTY-09 | SFTY-10 | SFTY-11 | SFTY-12 | SFTY-13 |
|---|---|---|---|---|---|---|---|---|---|---|---|---|---|---|---|---|---|---|---|---|---|---|---|---|---|---|---|---|---|---|---|---|---|---|---|---|---|---|---|---|---|---|---|
| 1 | Mostofi et al. [19] | Turkey | ✓ | ✓ | ✓ | ||||||||||||||||||||||||||||||||||||||
| 2 | Gernand [21] | United States | ✓ | ✓ | ✓ | ✓ | |||||||||||||||||||||||||||||||||||||
| 3 | Sörqvist et al. [35] | Sweden | ✓ | ||||||||||||||||||||||||||||||||||||||||
| 4 | Alzayed et al. [36] | Kuwait | ✓ | ✓ | ✓ | ||||||||||||||||||||||||||||||||||||||
| 5 | Brown et al. [37] | United States | ✓ | ✓ | ✓ | ||||||||||||||||||||||||||||||||||||||
| 6 | Protte et al. [33] | Australia | ✓ | ✓ | ✓ | ✓ | |||||||||||||||||||||||||||||||||||||
| 7 | Ball et al. [32] | New Zealand | ✓ | ✓ | ✓ | ✓ | ✓ | ✓ | ✓ | ✓ | ✓ | ||||||||||||||||||||||||||||||||
| 8 | JordÃO et al. [13] | Portugal | ✓ | ✓ | ✓ | ✓ | ✓ | ||||||||||||||||||||||||||||||||||||
| 9 | Shealy et al. [38] | United States | ✓ | ✓ | ✓ | ✓ | ✓ | ||||||||||||||||||||||||||||||||||||
| 10 | Marois et al. [39] | Canada | ✓ | ✓ | ✓ | ✓ | ✓ | ✓ | ✓ | ✓ | ✓ | ||||||||||||||||||||||||||||||||
| 11 | Zhou [30] | United States | ✓ | ✓ | |||||||||||||||||||||||||||||||||||||||
| 12 | Kinsey et al. [31] | China | ✓ | ✓ | |||||||||||||||||||||||||||||||||||||||
| 13 | Du et al. [34] | United States | ✓ | ✓ | ✓ | ✓ | ✓ | ✓ | ✓ | ✓ | |||||||||||||||||||||||||||||||||
| 14 | McWhirter et al. [40] | United States | ✓ | ✓ | ✓ | ✓ | ✓ | ✓ | ✓ | ✓ | ✓ | ||||||||||||||||||||||||||||||||
| 15 | Kavvada et al. [88] | United States | ✓ | ✓ | ✓ | ✓ | ✓ | ✓ | |||||||||||||||||||||||||||||||||||
| 16 | Schöttle et al. [89] | Germany | ✓ | ||||||||||||||||||||||||||||||||||||||||
| 17 | Pooladvand et al. [9] | United States | ✓ | ✓ | ✓ | ✓ | ✓ | ✓ | ✓ | ✓ | ✓ | ✓ | ✓ | ✓ | ✓ | ||||||||||||||||||||||||||||
| 18 | Kotluk et al. [90] | Switzerland | |||||||||||||||||||||||||||||||||||||||||
| 19 | ElSayed et al. [82] | United States | |||||||||||||||||||||||||||||||||||||||||
| 20 | Nelius et al. [14] | Germany | ✓ | ||||||||||||||||||||||||||||||||||||||||
| 21 | Witherell et al. [91] | United States | ✓ | ✓ | ✓ | ✓ | |||||||||||||||||||||||||||||||||||||
| 22 | Love et al. [92] | Australia | ✓ | ✓ | ✓ | ✓ | ✓ | ✓ | |||||||||||||||||||||||||||||||||||
| 23 | Delgado et al. [93] | United States | ✓ | ✓ | ✓ | ✓ | ✓ | ||||||||||||||||||||||||||||||||||||
| 24 | Bellamy et al. [12] | The Netherlands | ✓ | ✓ | ✓ | ✓ | ✓ | ✓ | |||||||||||||||||||||||||||||||||||
| 25 | Zheng et al. [94] | United States | ✓ | ✓ | ✓ | ✓ | ✓ | ||||||||||||||||||||||||||||||||||||
| 26 | Bolognani et al. [7] | Italy | ✓ | ✓ | |||||||||||||||||||||||||||||||||||||||
| 27 | Farooq et al. [60] | Pakistan | ✓ | ✓ | ✓ | ✓ | ✓ | ✓ | ✓ | ||||||||||||||||||||||||||||||||||
| 28 | Ibrahim et al. [84] | United States | ✓ | ✓ | ✓ | ✓ | ✓ | ✓ | ✓ | ✓ | ✓ | ✓ | |||||||||||||||||||||||||||||||
| 29 | Hasanzadeh et al. [83] | United States | ✓ | ✓ | ✓ | ✓ | ✓ | ✓ | ✓ | ||||||||||||||||||||||||||||||||||
| 30 | Chen et al. [85] | Hong Kong | ✓ | ✓ | ✓ | ✓ | ✓ | ✓ | ✓ | ✓ | |||||||||||||||||||||||||||||||||
| 31 | Pooladvand et al. [26] | United States | ✓ | ✓ | ✓ | ✓ | ✓ | ✓ | ✓ | ✓ | ✓ | ✓ | ✓ | ||||||||||||||||||||||||||||||
| 32 | Hu et al. [95] | United States | ✓ | ✓ | ✓ | ✓ | |||||||||||||||||||||||||||||||||||||
| 33 | Hasanzadeh et al. [25] | United States | ✓ | ✓ | ✓ | ✓ | ✓ | ✓ | ✓ | ✓ | ✓ | ✓ | ✓ | ✓ | ✓ | ||||||||||||||||||||||||||||
| 34 | Wang et al. [86] | China | ✓ | ✓ | ✓ | ✓ | ✓ | ✓ | |||||||||||||||||||||||||||||||||||
| 35 | Shi et al. [81] | China | ✓ | ✓ | ✓ | ✓ | ✓ | ✓ | ✓ | ✓ | |||||||||||||||||||||||||||||||||
| 36 | Xu et al. [96] | China | ✓ | ✓ | |||||||||||||||||||||||||||||||||||||||
| 37 | Nelius et al. [97] | Germany | ✓ | ✓ | ✓ | ||||||||||||||||||||||||||||||||||||||
| 38 | Grill et al. [4] | Sweden | ✓ | ✓ | ✓ | ✓ | |||||||||||||||||||||||||||||||||||||
| 39 | Ma et al. [15] | China | ✓ | ✓ | ✓ | ✓ | ✓ | ✓ | ✓ | ✓ | ✓ | ✓ | ✓ | ✓ | ✓ | ||||||||||||||||||||||||||||
| 40 | Aroke et al. [10] | United States | ✓ | ✓ | ✓ | ✓ | |||||||||||||||||||||||||||||||||||||
| 41 | Baybutt [41] | United States | ✓ | ✓ | |||||||||||||||||||||||||||||||||||||||
| 42 | Li et al. [8] | China | ✓ | ✓ | ✓ | ✓ | ✓ | ||||||||||||||||||||||||||||||||||||
| 43 | Gerassis et al. [98] | Spain | ✓ | ✓ | ✓ | ✓ | ✓ | ✓ | |||||||||||||||||||||||||||||||||||
| 44 | Lappalainen et al. [99] | Finland | ✓ | ✓ | |||||||||||||||||||||||||||||||||||||||
| 45 | Fellows et al. [100] | United Kingdom | ✓ | ✓ | ✓ | ✓ | ✓ | ✓ | ✓ |
| AN | DCMK-01 | DCMK-02 | DCMK-03 | DCMK-04 | DCMK-05 | DCMK-06 | DCMK-07 | DCMK-08 | DCMK-09 | DCMK-10 | DCMK-11 | DCMK-12 | DCMK-13 | DCMK-14 | DCMK-15 | DCMK-16 | DCMK-17 | DCMK-18 | DCMK-19 | DCMK-20 | DCMK-21 | DCMK-22 | DCMK-23 | DCMK-24 | DCMK-25 | DCMK-26 | DCMK-27 | DCMK-28 | DCMK-29 | DCMK-30 | DCMK-31 | DCMK-32 | DCMK-33 | DCMK-34 | DCMK-35 | DCMK-36 | DCMK-37 | DCMK-38 | DCMK-39 | DCMK-40 | DCMK-41 | DCMK-42 | DCMK-43 | DCMK-44 | DCMK-45 | DCMK-46 | DCMK-47 | DCMK-48 | DCMK-49 | DCMK-50 | DCMK-51 | DCMK-52 | DCMK-53 | DCMK-54 | DCMK-55 | DCMK-56 | DCMK-57 | DCMK-58 | DCMK-59 |
|---|---|---|---|---|---|---|---|---|---|---|---|---|---|---|---|---|---|---|---|---|---|---|---|---|---|---|---|---|---|---|---|---|---|---|---|---|---|---|---|---|---|---|---|---|---|---|---|---|---|---|---|---|---|---|---|---|---|---|---|
| 1 | ✓ | ✓ | ✓ | ✓ | ✓ | ✓ | ✓ | ✓ | ✓ | ✓ | ✓ | ||||||||||||||||||||||||||||||||||||||||||||||||
| 2 | ✓ | ✓ | ✓ | ✓ | ✓ | ✓ | ✓ | ✓ | |||||||||||||||||||||||||||||||||||||||||||||||||||
| 3 | ✓ | ✓ | ✓ | ✓ | |||||||||||||||||||||||||||||||||||||||||||||||||||||||
| 4 | ✓ | ✓ | ✓ | ✓ | ✓ | ✓ | ✓ | ✓ | ✓ | ||||||||||||||||||||||||||||||||||||||||||||||||||
| 5 | ✓ | ||||||||||||||||||||||||||||||||||||||||||||||||||||||||||
| 6 | ✓ | ✓ | ✓ | ✓ | ✓ | ||||||||||||||||||||||||||||||||||||||||||||||||||||||
| 7 | ✓ | ✓ | ✓ | ✓ | ✓ | ✓ | ✓ | ✓ | ✓ | ✓ | ✓ | ✓ | ✓ | ✓ | ✓ | ✓ | ✓ | ✓ | |||||||||||||||||||||||||||||||||||||||||
| 8 | ✓ | ✓ | ✓ | ✓ | ✓ | ✓ | |||||||||||||||||||||||||||||||||||||||||||||||||||||
| 9 | ✓ | ✓ | ✓ | ✓ | ✓ | ✓ | ✓ | ✓ | ✓ | ✓ | ✓ | ✓ | ✓ | ||||||||||||||||||||||||||||||||||||||||||||||
| 10 | ✓ | ✓ | ✓ | ✓ | |||||||||||||||||||||||||||||||||||||||||||||||||||||||
| 11 | ✓ | ✓ | ✓ | ✓ | ✓ | ✓ | ✓ | ||||||||||||||||||||||||||||||||||||||||||||||||||||
| 12 | ✓ | ✓ | ✓ | ✓ | ✓ | ✓ | |||||||||||||||||||||||||||||||||||||||||||||||||||||
| 13 | ✓ | ✓ | ✓ | ✓ | ✓ | ✓ | ✓ | ✓ | ✓ | ✓ | ✓ | ✓ | ✓ | ||||||||||||||||||||||||||||||||||||||||||||||
| 14 | ✓ | ✓ | ✓ | ✓ | ✓ | ✓ | ✓ | ✓ | ✓ | ✓ | ✓ | ✓ | ✓ | ||||||||||||||||||||||||||||||||||||||||||||||
| 15 | ✓ | ||||||||||||||||||||||||||||||||||||||||||||||||||||||||||
| 16 | ✓ | ✓ | ✓ | ✓ | ✓ | ✓ | ✓ | ✓ | ✓ | ✓ | ✓ | ✓ | ✓ | ||||||||||||||||||||||||||||||||||||||||||||||
| 17 | ✓ | ✓ | ✓ | ✓ | ✓ | ✓ | ✓ | ||||||||||||||||||||||||||||||||||||||||||||||||||||
| 18 | ✓ | ✓ | ✓ | ✓ | |||||||||||||||||||||||||||||||||||||||||||||||||||||||
| 19 | ✓ | ✓ | ✓ | ✓ | ✓ | ✓ | |||||||||||||||||||||||||||||||||||||||||||||||||||||
| 20 | ✓ | ||||||||||||||||||||||||||||||||||||||||||||||||||||||||||
| 21 | ✓ | ✓ | ✓ | ✓ | ✓ | ✓ | ✓ | ✓ | ✓ | ✓ | ✓ | ||||||||||||||||||||||||||||||||||||||||||||||||
| 22 | ✓ | ✓ | ✓ | ✓ | |||||||||||||||||||||||||||||||||||||||||||||||||||||||
| 23 | ✓ | ✓ | ✓ | ✓ | ✓ | ✓ | ✓ | ✓ | ✓ | ✓ | ✓ | ✓ | ✓ | ✓ | ✓ | ||||||||||||||||||||||||||||||||||||||||||||
| 24 | ✓ | ✓ | ✓ | ✓ | ✓ | ✓ | ✓ | ✓ | ✓ | ✓ | |||||||||||||||||||||||||||||||||||||||||||||||||
| 25 | ✓ | ✓ | ✓ | ✓ | |||||||||||||||||||||||||||||||||||||||||||||||||||||||
| 26 | ✓ | ✓ | ✓ | ✓ | ✓ | ||||||||||||||||||||||||||||||||||||||||||||||||||||||
| 27 | ✓ | ✓ | ✓ | ✓ | ✓ | ||||||||||||||||||||||||||||||||||||||||||||||||||||||
| 28 | ✓ | ✓ | ✓ | ✓ | ✓ | ||||||||||||||||||||||||||||||||||||||||||||||||||||||
| 29 | ✓ | ✓ | ✓ | ✓ | |||||||||||||||||||||||||||||||||||||||||||||||||||||||
| 30 | ✓ | ✓ | ✓ | ✓ | ✓ | ✓ | ✓ | ✓ | ✓ | ✓ | ✓ | ✓ | |||||||||||||||||||||||||||||||||||||||||||||||
| 31 | ✓ | ✓ | ✓ | ✓ | ✓ | ✓ | |||||||||||||||||||||||||||||||||||||||||||||||||||||
| 32 | ✓ | ✓ | ✓ | ✓ | ✓ | ✓ | ✓ | ✓ | ✓ | ||||||||||||||||||||||||||||||||||||||||||||||||||
| 33 | ✓ | ✓ | ✓ | ✓ | ✓ | ✓ | ✓ | ✓ | ✓ | ✓ | |||||||||||||||||||||||||||||||||||||||||||||||||
| 34 | ✓ | ✓ | ✓ | ||||||||||||||||||||||||||||||||||||||||||||||||||||||||
| 35 | ✓ | ✓ | ✓ | ✓ | ✓ | ✓ | ✓ | ✓ | ✓ | ✓ | |||||||||||||||||||||||||||||||||||||||||||||||||
| 36 | ✓ | ✓ | ✓ | ✓ | ✓ | ✓ | |||||||||||||||||||||||||||||||||||||||||||||||||||||
| 37 | ✓ | ✓ | ✓ | ✓ | |||||||||||||||||||||||||||||||||||||||||||||||||||||||
| 38 | ✓ | ✓ | ✓ | ✓ | ✓ | ✓ | ✓ | ✓ | |||||||||||||||||||||||||||||||||||||||||||||||||||
| 39 | ✓ | ✓ | ✓ | ✓ | ✓ | ✓ | ✓ | ✓ | ✓ | ||||||||||||||||||||||||||||||||||||||||||||||||||
| 40 | ✓ | ✓ | ✓ | ✓ | ✓ | ||||||||||||||||||||||||||||||||||||||||||||||||||||||
| 41 | ✓ | ✓ | ✓ | ✓ | ✓ | ||||||||||||||||||||||||||||||||||||||||||||||||||||||
| 42 | ✓ | ✓ | ✓ | ✓ | |||||||||||||||||||||||||||||||||||||||||||||||||||||||
| 43 | ✓ | ✓ | ✓ | ✓ | ✓ | ✓ | |||||||||||||||||||||||||||||||||||||||||||||||||||||
| 44 | ✓ | ✓ | ✓ | ✓ | ✓ | ✓ | ✓ | ✓ | |||||||||||||||||||||||||||||||||||||||||||||||||||
| 45 | ✓ | ✓ | ✓ | ✓ | ✓ | ✓ | ✓ |
 |
Appendix B
   |
Appendix C
| Path | Cycle Length | Unit Weight |
|---|---|---|
| DCMK-58 → COGB-60 → BHVR-16 → DCMK-20 → DCMK-07 → COGB-41 → COGB-40 → DCMK-04 → HLTH-02 → DCMK-02 → BHVR-06 → HLTH-03 → DCMK-13 → SFTY-05 → SFTY-06 → SFTY-07 → OTHR-02 → STCK-01 | 18 | 11 |
| DCMK-58 → COGB-60 → BHVR-16 → DCMK-20 → DCMK-07 → COGB-41 → COGB-40 → DCMK-04 → HLTH-02 → DCMK-02 → BHVR-06 → HLTH-03 → DCMK-13 → SFTY-05 → SFTY-06 → SFTY-07 → COGB-54 → OTHR-01 → OTHR-03 → STCK-01 | 20 | 11 |
| DCMK-58 → COGB-60 → BHVR-16 → DCMK-20 → DCMK-07 → COGB-41 → COGB-40 → DCMK-04 → HLTH-02 → DCMK-02 → BHVR-06 → HLTH-03 → DCMK-13 → SFTY-05 → SFTY-06 → SFTY-07 → COGB-54 → BHVR-17 → SFTY-13 → STCK-01 | 20 | 11 |
| DCMK-58 → COGB-60 → BHVR-16 → DCMK-20 → DCMK-07 → COGB-41 → COGB-40 → DCMK-04 → HLTH-02 → DCMK-02 → BHVR-06 → HLTH-03 → DCMK-13 → SFTY-05 → SFTY-06 → SFTY-07 → COGB-54 → BHVR-17 → OTHR-03 → STCK-01 | 20 | 11 |
| DCMK-58 → COGB-60 → BHVR-16 → DCMK-20 → DCMK-07 → COGB-41 → COGB-40 → DCMK-04 → HLTH-02 → DCMK-02 → BHVR-06 → HLTH-03 → DCMK-13 → DCMK-49 → SFTY-06 → SFTY-07 → OTHR-02 → STCK-01 | 18 | 11 |
| DCMK-58 → COGB-60 → BHVR-16 → DCMK-20 → DCMK-07 → COGB-41 → COGB-40 → DCMK-04 → HLTH-02 → DCMK-02 → BHVR-06 → HLTH-03 → DCMK-13 → DCMK-49 → SFTY-06 → SFTY-07 → COGB-54 → OTHR-01 → OTHR-03 → STCK-01 | 20 | 11 |
| DCMK-58 → COGB-60 → BHVR-16 → DCMK-20 → DCMK-07 → COGB-41 → COGB-40 → DCMK-04 → HLTH-02 → DCMK-02 → BHVR-06 → HLTH-03 → DCMK-13 → DCMK-49 → SFTY-06 → SFTY-07 → COGB-54 → BHVR-17 → SFTY-13 → STCK-01 | 20 | 11 |
| DCMK-58 → COGB-60 → BHVR-16 → DCMK-20 → DCMK-07 → COGB-41 → COGB-40 → DCMK-04 → HLTH-02 → DCMK-02 → BHVR-06 → HLTH-03 → DCMK-13 → DCMK-49 → SFTY-06 → SFTY-07 → COGB-54 → BHVR-17 → OTHR-03 → STCK-01 | 20 | 11 |
| DCMK-58 → COGB-60 → BHVR-16 → DCMK-20 → DCMK-07 → COGB-41 → COGB-40 → DCMK-04 → HLTH-02 → DCMK-02 → BHVR-06 → HLTH-03 → DCMK-13 → DCMK-49 → SFTY-06 → SFTY-05 → OTHR-02 → STCK-01 | 18 | 11 |
| DCMK-56 → DCMK-43 → DCMK-05 → DCMK-22 → BHVR-22 → DCMK-19 → DCMK-14 → COGB-12 → DCMK-23 → DCMK-04 → HLTH-02 → DCMK-02 → BHVR-06 → HLTH-03 → DCMK-13 → SFTY-05 → SFTY-06 → SFTY-07 → OTHR-02 → STCK-01 | 20 | 11 |
| DCMK-56 → DCMK-43 → DCMK-05 → DCMK-22 → BHVR-22 → DCMK-19 → DCMK-14 → COGB-12 → DCMK-23 → DCMK-04 → HLTH-02 → DCMK-02 → BHVR-06 → HLTH-03 → DCMK-13 → SFTY-05 → SFTY-06 → SFTY-07 → COGB-54 → OTHR-01 → OTHR-03 → STCK-01 | 22 | 11 |
| DCMK-56 → DCMK-43 → DCMK-05 → DCMK-22 → BHVR-22 → DCMK-19 → DCMK-14 → COGB-12 → DCMK-23 → DCMK-04 → HLTH-02 → DCMK-02 → BHVR-06 → HLTH-03 → DCMK-13 → SFTY-05 → SFTY-06 → SFTY-07 → COGB-54 → BHVR-17 → SFTY-13 → STCK-01 | 22 | 11 |
| DCMK-56 → DCMK-43 → DCMK-05 → DCMK-22 → BHVR-22 → DCMK-19 → DCMK-14 → COGB-12 → DCMK-23 → DCMK-04 → HLTH-02 → DCMK-02 → BHVR-06 → HLTH-03 → DCMK-13 → SFTY-05 → SFTY-06 → SFTY-07 → COGB-54 → BHVR-17 → OTHR-03 → STCK-01 | 22 | 11 |
| DCMK-56 → DCMK-43 → DCMK-05 → DCMK-22 → BHVR-22 → DCMK-19 → DCMK-14 → COGB-12 → DCMK-23 → DCMK-04 → HLTH-02 → DCMK-02 → BHVR-06 → HLTH-03 → DCMK-13 → DCMK-49 → SFTY-06 → SFTY-07 → OTHR-02 → STCK-01 | 20 | 11 |
| DCMK-56 → DCMK-43 → DCMK-05 → DCMK-22 → BHVR-22 → DCMK-19 → DCMK-14 → COGB-12 → DCMK-23 → DCMK-04 → HLTH-02 → DCMK-02 → BHVR-06 → HLTH-03 → DCMK-13 → DCMK-49 → SFTY-06 → SFTY-07 → COGB-54 → OTHR-01 → OTHR-03 → STCK-01 | 22 | 11 |
| DCMK-56 → DCMK-43 → DCMK-05 → DCMK-22 → BHVR-22 → DCMK-19 → DCMK-14 → COGB-12 → DCMK-23 → DCMK-04 → HLTH-02 → DCMK-02 → BHVR-06 → HLTH-03 → DCMK-13 → DCMK-49 → SFTY-06 → SFTY-07 → COGB-54 → BHVR-17 → SFTY-13 → STCK-01 | 22 | 11 |
| DCMK-56 → DCMK-43 → DCMK-05 → DCMK-22 → BHVR-22 → DCMK-19 → DCMK-14 → COGB-12 → DCMK-23 → DCMK-04 → HLTH-02 → DCMK-02 → BHVR-06 → HLTH-03 → DCMK-13 → DCMK-49 → SFTY-06 → SFTY-07 → COGB-54 → BHVR-17 → OTHR-03 → STCK-01 | 22 | 11 |
| DCMK-56 → DCMK-43 → DCMK-05 → DCMK-22 → BHVR-22 → DCMK-19 → DCMK-14 → COGB-12 → DCMK-23 → DCMK-04 → HLTH-02 → DCMK-02 → BHVR-06 → HLTH-03 → DCMK-13 → DCMK-49 → SFTY-06 → SFTY-05 → OTHR-02 → STCK-01 | 20 | 11 |
| DCMK-56 → DCMK-43 → DCMK-05 → DCMK-03 → BHVR-22 → DCMK-19 → DCMK-14 → COGB-12 → DCMK-23 → DCMK-04 → HLTH-02 → DCMK-02 → BHVR-06 → HLTH-03 → DCMK-13 → SFTY-05 → SFTY-06 → SFTY-07 → OTHR-02 → STCK-01 | 20 | 11 |
| DCMK-56 → DCMK-43 → DCMK-05 → DCMK-03 → BHVR-22 → DCMK-19 → DCMK-14 → COGB-12 → DCMK-23 → DCMK-04 → HLTH-02 → DCMK-02 → BHVR-06 → HLTH-03 → DCMK-13 → SFTY-05 → SFTY-06 → SFTY-07 → COGB-54 → OTHR-01 → OTHR-03 → STCK-01 | 22 | 11 |
| DCMK-56 → DCMK-43 → DCMK-05 → DCMK-03 → BHVR-22 → DCMK-19 → DCMK-14 → COGB-12 → DCMK-23 → DCMK-04 → HLTH-02 → DCMK-02 → BHVR-06 → HLTH-03 → DCMK-13 → SFTY-05 → SFTY-06 → SFTY-07 → COGB-54 → BHVR-17 → SFTY-13 → STCK-01 | 22 | 11 |
| DCMK-56 → DCMK-43 → DCMK-05 → DCMK-03 → BHVR-22 → DCMK-19 → DCMK-14 → COGB-12 → DCMK-23 → DCMK-04 → HLTH-02 → DCMK-02 → BHVR-06 → HLTH-03 → DCMK-13 → SFTY-05 → SFTY-06 → SFTY-07 → COGB-54 → BHVR-17 → OTHR-03 → STCK-01 | 22 | 11 |
| DCMK-56 → DCMK-43 → DCMK-05 → DCMK-03 → BHVR-22 → DCMK-19 → DCMK-14 → COGB-12 → DCMK-23 → DCMK-04 → HLTH-02 → DCMK-02 → BHVR-06 → HLTH-03 → DCMK-13 → DCMK-49 → SFTY-06 → SFTY-07 → OTHR-02 → STCK-01 | 20 | 11 |
| DCMK-56 → DCMK-43 → DCMK-05 → DCMK-03 → BHVR-22 → DCMK-19 → DCMK-14 → COGB-12 → DCMK-23 → DCMK-04 → HLTH-02 → DCMK-02 → BHVR-06 → HLTH-03 → DCMK-13 → DCMK-49 → SFTY-06 → SFTY-07 → COGB-54 → OTHR-01 → OTHR-03 → STCK-01 | 22 | 11 |
| DCMK-56 → DCMK-43 → DCMK-05 → DCMK-03 → BHVR-22 → DCMK-19 → DCMK-14 → COGB-12 → DCMK-23 → DCMK-04 → HLTH-02 → DCMK-02 → BHVR-06 → HLTH-03 → DCMK-13 → DCMK-49 → SFTY-06 → SFTY-07 → COGB-54 → BHVR-17 → SFTY-13 → STCK-01 | 22 | 11 |
| DCMK-56 → DCMK-43 → DCMK-05 → DCMK-03 → BHVR-22 → DCMK-19 → DCMK-14 → COGB-12 → DCMK-23 → DCMK-04 → HLTH-02 → DCMK-02 → BHVR-06 → HLTH-03 → DCMK-13 → DCMK-49 → SFTY-06 → SFTY-07 → COGB-54 → BHVR-17 → OTHR-03 → STCK-01 | 22 | 11 |
| DCMK-56 → DCMK-43 → DCMK-05 → DCMK-03 → BHVR-22 → DCMK-19 → DCMK-14 → COGB-12 → DCMK-23 → DCMK-04 → HLTH-02 → DCMK-02 → BHVR-06 → HLTH-03 → DCMK-13 → DCMK-49 → SFTY-06 → SFTY-05 → OTHR-02 → STCK-01 | 20 | 11 |
| DCMK-55 → BHVR-02 → BHVR-23 → DCMK-20 → DCMK-07 → COGB-41 → COGB-40 → DCMK-04 → HLTH-02 → DCMK-02 → BHVR-06 → HLTH-03 → DCMK-13 → SFTY-05 → SFTY-06 → SFTY-07 → OTHR-02 → STCK-01 | 18 | 11 |
| DCMK-55 → BHVR-02 → BHVR-23 → DCMK-20 → DCMK-07 → COGB-41 → COGB-40 → DCMK-04 → HLTH-02 → DCMK-02 → BHVR-06 → HLTH-03 → DCMK-13 → SFTY-05 → SFTY-06 → SFTY-07 → COGB-54 → OTHR-01 → OTHR-03 → STCK-01 | 20 | 11 |
| DCMK-55 → BHVR-02 → BHVR-23 → DCMK-20 → DCMK-07 → COGB-41 → COGB-40 → DCMK-04 → HLTH-02 → DCMK-02 → BHVR-06 → HLTH-03 → DCMK-13 → SFTY-05 → SFTY-06 → SFTY-07 → COGB-54 → BHVR-17 → SFTY-13 → STCK-01 | 20 | 11 |
| DCMK-55 → BHVR-02 → BHVR-23 → DCMK-20 → DCMK-07 → COGB-41 → COGB-40 → DCMK-04 → HLTH-02 → DCMK-02 → BHVR-06 → HLTH-03 → DCMK-13 → SFTY-05 → SFTY-06 → SFTY-07 → COGB-54 → BHVR-17 → OTHR-03 → STCK-01 | 20 | 11 |
| DCMK-55 → BHVR-02 → BHVR-23 → DCMK-20 → DCMK-07 → COGB-41 → COGB-40 → DCMK-04 → HLTH-02 → DCMK-02 → BHVR-06 → HLTH-03 → DCMK-13 → DCMK-49 → SFTY-06 → SFTY-07 → OTHR-02 → STCK-01 | 18 | 11 |
| DCMK-55 → BHVR-02 → BHVR-23 → DCMK-20 → DCMK-07 → COGB-41 → COGB-40 → DCMK-04 → HLTH-02 → DCMK-02 → BHVR-06 → HLTH-03 → DCMK-13 → DCMK-49 → SFTY-06 → SFTY-07 → COGB-54 → OTHR-01 → OTHR-03 → STCK-01 | 20 | 11 |
| DCMK-55 → BHVR-02 → BHVR-23 → DCMK-20 → DCMK-07 → COGB-41 → COGB-40 → DCMK-04 → HLTH-02 → DCMK-02 → BHVR-06 → HLTH-03 → DCMK-13 → DCMK-49 → SFTY-06 → SFTY-07 → COGB-54 → BHVR-17 → SFTY-13 → STCK-01 | 20 | 11 |
| DCMK-55 → BHVR-02 → BHVR-23 → DCMK-20 → DCMK-07 → COGB-41 → COGB-40 → DCMK-04 → HLTH-02 → DCMK-02 → BHVR-06 → HLTH-03 → DCMK-13 → DCMK-49 → SFTY-06 → SFTY-07 → COGB-54 → BHVR-17 → OTHR-03 → STCK-01 | 20 | 11 |
| DCMK-55 → BHVR-02 → BHVR-23 → DCMK-20 → DCMK-07 → COGB-41 → COGB-40 → DCMK-04 → HLTH-02 → DCMK-02 → BHVR-06 → HLTH-03 → DCMK-13 → DCMK-49 → SFTY-06 → SFTY-05 → OTHR-02 → STCK-01 | 18 | 11 |
| Path | Cycle Length | Unit Weight |
|---|---|---|
| DCMK-51 → DCMK-40 → DCMK-53 → BHVR-16 → DCMK-20 → DCMK-07 → DCMK-21 → DCMK-04 → HLTH-02 → STCK-01 | 10 | −5 |
| DCMK-51 → DCMK-40 → DCMK-53 → BHVR-16 → DCMK-20 → DCMK-07 → DCMK-21 → DCMK-04 → HLTH-02 → DCMK-49 → SFTY-06 → BHVR-17 → SFTY-13 → STCK-01 | 14 | −5 |
| DCMK-51 → DCMK-40 → DCMK-53 → BHVR-16 → DCMK-20 → DCMK-07 → DCMK-21 → DCMK-04 → HLTH-02 → DCMK-49 → SFTY-06 → BHVR-17 → OTHR-03 → STCK-01 | 14 | −5 |
| DCMK-51 → DCMK-40 → DCMK-53 → BHVR-16 → DCMK-20 → DCMK-07 → DCMK-21 → DCMK-04 → HLTH-02 → DCMK-02 → SFTY-06 → BHVR-17 → SFTY-13 → STCK-01 | 14 | −5 |
| DCMK-51 → DCMK-40 → DCMK-53 → BHVR-16 → DCMK-20 → DCMK-07 → DCMK-21 → DCMK-04 → HLTH-02 → DCMK-02 → SFTY-06 → BHVR-17 → OTHR-03 → STCK-01 | 14 | −5 |
| DCMK-51 → DCMK-40 → DCMK-53 → BHVR-16 → DCMK-20 → DCMK-07 → DCMK-21 → DCMK-04 → HLTH-02 → DCMK-02 → DCMK-03 → BHVR-22 → DCMK-19 → DCMK-14 → COGB-12 → DCMK-23 → SFTY-06 → BHVR-17 → SFTY-13 → STCK-01 | 20 | −5 |
| DCMK-51 → DCMK-40 → DCMK-53 → BHVR-16 → DCMK-20 → DCMK-07 → DCMK-21 → DCMK-04 → HLTH-02 → DCMK-02 → DCMK-03 → BHVR-22 → DCMK-19 → DCMK-14 → COGB-12 → DCMK-23 → SFTY-06 → BHVR-17 → OTHR-03 → STCK-01 | 20 | −5 |
| DCMK-51 → DCMK-40 → DCMK-53 → BHVR-16 → DCMK-20 → DCMK-07 → DCMK-21 → DCMK-04 → HLTH-02 → DCMK-02 → DCMK-03 → BHVR-22 → DCMK-19 → DCMK-14 → COGB-12 → DCMK-11 → DCMK-10 → DCMK-46 → SFTY-06 → BHVR-17 → SFTY-13 → STCK-01 | 22 | −5 |
| DCMK-51 → DCMK-40 → DCMK-53 → BHVR-16 → DCMK-20 → DCMK-07 → DCMK-21 → DCMK-04 → HLTH-02 → DCMK-02 → DCMK-03 → BHVR-22 → DCMK-19 → DCMK-14 → COGB-12 → DCMK-11 → DCMK-10 → DCMK-46 → SFTY-06 → BHVR-17 → OTHR-03 → STCK-01 | 22 | −5 |
| DCMK-51 → DCMK-40 → DCMK-53 → BHVR-16 → DCMK-20 → DCMK-07 → DCMK-21 → BHVR-15 → DCMK-10 → DCMK-46 → SFTY-06 → BHVR-17 → SFTY-13 → STCK-01 | 14 | −5 |
| DCMK-51 → DCMK-40 → DCMK-53 → BHVR-16 → DCMK-20 → DCMK-07 → DCMK-21 → BHVR-15 → DCMK-10 → DCMK-46 → SFTY-06 → BHVR-17 → OTHR-03 → STCK-01 | 14 | −5 |
| COGB-02 → DCMK-07 → DCMK-21 → DCMK-04 → HLTH-02 → STCK-01 | 6 | −5 |
| COGB-02 → DCMK-07 → DCMK-21 → DCMK-04 → HLTH-02 → DCMK-49 → SFTY-06 → BHVR-17 → SFTY-13 → STCK-01 | 10 | −5 |
| COGB-02 → DCMK-07 → DCMK-21 → DCMK-04 → HLTH-02 → DCMK-49 → SFTY-06 → BHVR-17 → OTHR-03 → STCK-01 | 10 | −5 |
| COGB-02 → DCMK-07 → DCMK-21 → DCMK-04 → HLTH-02 → DCMK-02 → SFTY-06 → BHVR-17 → SFTY-13 → STCK-01 | 10 | −5 |
| COGB-02 → DCMK-07 → DCMK-21 → DCMK-04 → HLTH-02 → DCMK-02 → SFTY-06 → BHVR-17 → OTHR-03 → STCK-01 | 10 | −5 |
| COGB-02 → DCMK-07 → DCMK-21 → DCMK-04 → HLTH-02 → DCMK-02 → DCMK-03 → BHVR-22 → DCMK-19 → DCMK-14 → COGB-12 → DCMK-23 → SFTY-06 → BHVR-17 → SFTY-13 → STCK-01 | 16 | −5 |
| COGB-02 → DCMK-07 → DCMK-21 → DCMK-04 → HLTH-02 → DCMK-02 → DCMK-03 → BHVR-22 → DCMK-19 → DCMK-14 → COGB-12 → DCMK-23 → SFTY-06 → BHVR-17 → OTHR-03 → STCK-01 | 16 | −5 |
| COGB-02 → DCMK-07 → DCMK-21 → DCMK-04 → HLTH-02 → DCMK-02 → DCMK-03 → BHVR-22 → DCMK-19 → DCMK-14 → COGB-12 → DCMK-11 → DCMK-10 → DCMK-46 → SFTY-06 → BHVR-17 → SFTY-13 → STCK-01 | 18 | −5 |
| COGB-02 → DCMK-07 → DCMK-21 → DCMK-04 → HLTH-02 → DCMK-02 → DCMK-03 → BHVR-22 → DCMK-19 → DCMK-14 → COGB-12 → DCMK-11 → DCMK-10 → DCMK-46 → SFTY-06 → BHVR-17 → OTHR-03 → STCK-01 | 18 | −5 |
| COGB-02 → DCMK-07 → DCMK-21 → BHVR-15 → DCMK-10 → DCMK-46 → SFTY-06 → BHVR-17 → SFTY-13 → STCK-01 | 10 | −5 |
| COGB-02 → DCMK-07 → DCMK-21 → BHVR-15 → DCMK-10 → DCMK-46 → SFTY-06 → BHVR-17 → OTHR-03 → STCK-01 | 10 | −5 |
| BHVR-11 → DCMK-12 → BHVR-23 → DCMK-40 → DCMK-53 → BHVR-16 → DCMK-20 → DCMK-07 → DCMK-21 → DCMK-04 → HLTH-02 → STCK-01 | 12 | −5 |
| BHVR-11 → DCMK-12 → BHVR-23 → DCMK-40 → DCMK-53 → BHVR-16 → DCMK-20 → DCMK-07 → DCMK-21 → DCMK-04 → HLTH-02 → DCMK-49 → SFTY-06 → BHVR-17 → SFTY-13 → STCK-01 | 16 | −5 |
| BHVR-11 → DCMK-12 → BHVR-23 → DCMK-40 → DCMK-53 → BHVR-16 → DCMK-20 → DCMK-07 → DCMK-21 → DCMK-04 → HLTH-02 → DCMK-49 → SFTY-06 → BHVR-17 → OTHR-03 → STCK-01 | 16 | −5 |
| BHVR-11 → DCMK-12 → BHVR-23 → DCMK-40 → DCMK-53 → BHVR-16 → DCMK-20 → DCMK-07 → DCMK-21 → DCMK-04 → HLTH-02 → DCMK-02 → SFTY-06 → BHVR-17 → SFTY-13 → STCK-01 | 16 | −5 |
| BHVR-11 → DCMK-12 → BHVR-23 → DCMK-40 → DCMK-53 → BHVR-16 → DCMK-20 → DCMK-07 → DCMK-21 → DCMK-04 → HLTH-02 → DCMK-02 → SFTY-06 → BHVR-17 → OTHR-03 → STCK-01 | 16 | −5 |
| BHVR-11 → DCMK-12 → BHVR-23 → DCMK-40 → DCMK-53 → BHVR-16 → DCMK-20 → DCMK-07 → DCMK-21 → DCMK-04 → HLTH-02 → DCMK-02 → DCMK-03 → BHVR-22 → DCMK-19 → DCMK-14 → COGB-12 → DCMK-23 → SFTY-06 → BHVR-17 → SFTY-13 → STCK-01 | 22 | −5 |
| BHVR-11 → DCMK-12 → BHVR-23 → DCMK-40 → DCMK-53 → BHVR-16 → DCMK-20 → DCMK-07 → DCMK-21 → DCMK-04 → HLTH-02 → DCMK-02 → DCMK-03 → BHVR-22 → DCMK-19 → DCMK-14 → COGB-12 → DCMK-23 → SFTY-06 → BHVR-17 → OTHR-03 → STCK-01 | 22 | −5 |
| BHVR-11 → DCMK-12 → BHVR-23 → DCMK-40 → DCMK-53 → BHVR-16 → DCMK-20 → DCMK-07 → DCMK-21 → DCMK-04 → HLTH-02 → DCMK-02 → DCMK-03 → BHVR-22 → DCMK-19 → DCMK-14 → COGB-12 → DCMK-11 → DCMK-10 → DCMK-46 → SFTY-06 → BHVR-17 → SFTY-13 → STCK-01 | 24 | −5 |
| BHVR-11 → DCMK-12 → BHVR-23 → DCMK-40 → DCMK-53 → BHVR-16 → DCMK-20 → DCMK-07 → DCMK-21 → DCMK-04 → HLTH-02 → DCMK-02 → DCMK-03 → BHVR-22 → DCMK-19 → DCMK-14 → COGB-12 → DCMK-11 → DCMK-10 → DCMK-46 → SFTY-06 → BHVR-17 → OTHR-03 → STCK-01 | 24 | −5 |
| BHVR-11 → DCMK-12 → BHVR-23 → DCMK-40 → DCMK-53 → BHVR-16 → DCMK-20 → DCMK-07 → DCMK-21 → BHVR-15 → DCMK-10 → DCMK-46 → SFTY-06 → BHVR-17 → SFTY-13 → STCK-01 | 16 | −5 |
| BHVR-11 → DCMK-12 → BHVR-23 → DCMK-40 → DCMK-53 → BHVR-16 → DCMK-20 → DCMK-07 → DCMK-21 → BHVR-15 → DCMK-10 → DCMK-46 → SFTY-06 → BHVR-17 → OTHR-03 → STCK-01 | 16 | −5 |
| Path | Cycle Length | Centrality Weight | Rank Centrality Weight |
|---|---|---|---|
| DCMK-58 → COGB-60 → BHVR-16 → DCMK-20 → DCMK-07 → COGB-41 → COGB-40 → DCMK-04 → HLTH-02 → DCMK-02 → BHVR-06 → HLTH-03 → DCMK-13 → SFTY-05 → SFTY-06 → SFTY-07 → COGB-54 → BHVR-17 → OTHR-03 → STCK-01 | 20 | 4.243243243 | #1 |
| DCMK-55 → BHVR-02 → BHVR-23 → DCMK-20 → DCMK-07 → COGB-41 → COGB-40 → DCMK-04 → HLTH-02 → DCMK-02 → BHVR-06 → HLTH-03 → DCMK-13 → SFTY-05 → SFTY-06 → SFTY-07 → COGB-54 → BHVR-17 → OTHR-03 → STCK-01 | 20 | 4.135135135 | #2 |
| DCMK-58 → COGB-60 → BHVR-16 → DCMK-20 → DCMK-07 → COGB-41 → COGB-40 → DCMK-04 → HLTH-02 → DCMK-02 → BHVR-06 → HLTH-03 → DCMK-13 → DCMK-49 → SFTY-06 → SFTY-07 → COGB-54 → BHVR-17 → OTHR-03 → STCK-01 | 20 | 4.108108108 | #3 |
| SFTY-03 → BHVR-23 → DCMK-20 → DCMK-07 → COGB-41 → COGB-40 → DCMK-04 → HLTH-02 → DCMK-02 → BHVR-06 → HLTH-03 → DCMK-13 → SFTY-05 → SFTY-06 → SFTY-07 → COGB-54 → BHVR-17 → OTHR-03 → STCK-01 | 19 | 4.027027027 | #4, #5 |
| BHVR-01 → BHVR-23 → DCMK-20 → DCMK-07 → COGB-41 → COGB-40 → DCMK-04 → HLTH-02 → DCMK-02 → BHVR-06 → HLTH-03 → DCMK-13 → SFTY-05 → SFTY-06 → SFTY-07 → COGB-54 → BHVR-17 → OTHR-03 → STCK-01 | 19 | 4.027027027 | |
| DCMK-55 → BHVR-02 → BHVR-23 → DCMK-20 → DCMK-07 → COGB-41 → COGB-40 → DCMK-04 → HLTH-02 → DCMK-02 → BHVR-06 → HLTH-03 → DCMK-13 → DCMK-49 → SFTY-06 → SFTY-07 → COGB-54 → BHVR-17 → OTHR-03 → STCK-01 | 20 | 4 | 6 |
| HLTH-04 → DCMK-07 → COGB-41 → COGB-40 → DCMK-04 → HLTH-02 → DCMK-02 → BHVR-06 → HLTH-03 → DCMK-13 → SFTY-05 → SFTY-06 → SFTY-07 → COGB-54 → BHVR-17 → OTHR-03 → STCK-01 | 17 | 3.972972973 | 7 |
| DCMK-58 → COGB-60 → BHVR-16 → DCMK-20 → DCMK-07 → COGB-41 → COGB-40 → DCMK-04 → HLTH-02 → DCMK-02 → BHVR-06 → HLTH-03 → DCMK-13 → SFTY-05 → SFTY-06 → SFTY-07 → COGB-54 → OTHR-01 → STCK-01 | 19 | 3.945945946 | #8, #9 |
| DCMK-58 → COGB-60 → BHVR-16 → DCMK-20 → DCMK-07 → COGB-41 → COGB-40 → DCMK-04 → HLTH-02 → DCMK-02 → BHVR-06 → HLTH-03 → DCMK-13 → SFTY-05 → SFTY-06 → SFTY-07 → COGB-54 → OTHR-01 → OTHR-03 → STCK-01 | 20 | 3.945945946 | |
| DCMK-58 → COGB-60 → BHVR-16 → DCMK-20 → DCMK-07 → COGB-41 → COGB-40 → DCMK-04 → HLTH-02 → DCMK-02 → DCMK-03 → BHVR-22 → SFTY-05 → SFTY-06 → SFTY-07 → COGB-54 → BHVR-17 → OTHR-03 → STCK-01 | 19 | 3.918918919 | 10 |
| SFTY-03 → BHVR-23 → DCMK-20 → DCMK-07 → COGB-41 → COGB-40 → DCMK-04 → HLTH-02 → DCMK-02 → BHVR-06 → HLTH-03 → DCMK-13 → DCMK-49 → SFTY-06 → SFTY-07 → COGB-54 → BHVR-17 → OTHR-03 → STCK-01 | 19 | 3.891891892 | #11, #12 |
| BHVR-01 → BHVR-23 → DCMK-20 → DCMK-07 → COGB-41 → COGB-40 → DCMK-04 → HLTH-02 → DCMK-02 → BHVR-06 → HLTH-03 → DCMK-13 → DCMK-49 → SFTY-06 → SFTY-07 → COGB-54 → BHVR-17 → OTHR-03 → STCK-01 | 19 | 3.891891892 | |
| DCMK-51 → COGB-60 → BHVR-16 → DCMK-20 → DCMK-07 → COGB-41 → COGB-40 → DCMK-04 → HLTH-02 → DCMK-02 → BHVR-06 → HLTH-03 → DCMK-13 → SFTY-05 → SFTY-06 → SFTY-07 → COGB-54 → BHVR-17 → OTHR-03 → STCK-01 | 20 | 3.891891892 | 13 |
| DCMK-58 → COGB-60 → BHVR-16 → DCMK-20 → DCMK-07 → COGB-41 → COGB-40 → DCMK-04 → HLTH-02 → DCMK-02 → BHVR-06 → HLTH-03 → DCMK-13 → SFTY-05 → SFTY-06 → SFTY-07 → COGB-54 → BHVR-17 → SFTY-13 → STCK-01 | 20 | 3.891891892 | 14 |
| DCMK-58 → COGB-60 → BHVR-16 → DCMK-20 → DCMK-07 → COGB-41 → COGB-40 → DCMK-04 → HLTH-02 → DCMK-02 → BHVR-06 → HLTH-03 → SFTY-05 → SFTY-06 → SFTY-07 → COGB-54 → BHVR-17 → OTHR-03 → STCK-01 | 19 | 3.864864865 | #15, #16 |
| DCMK-26 → BHVR-16 → DCMK-20 → DCMK-07 → COGB-41 → COGB-40 → DCMK-04 → HLTH-02 → DCMK-02 → BHVR-06 → HLTH-03 → DCMK-13 → SFTY-05 → SFTY-06 → SFTY-07 → COGB-54 → BHVR-17 → OTHR-03 → STCK-01 | 19 | 3.864864865 | |
| HLTH-04 → DCMK-07 → COGB-41 → COGB-40 → DCMK-04 → HLTH-02 → DCMK-02 → BHVR-06 → HLTH-03 → DCMK-13 → DCMK-49 → SFTY-06 → SFTY-07 → COGB-54 → BHVR-17 → OTHR-03 → STCK-01 | 17 | 3.837837838 | #17–#20 |
| DCMK-58 → COGB-60 → BHVR-16 → DCMK-20 → DCMK-07 → COGB-41 → COGB-40 → DCMK-04 → HLTH-02 → DCMK-02 → BHVR-06 → HLTH-03 → DCMK-13 → SFTY-06 → SFTY-07 → COGB-54 → BHVR-17 → OTHR-03 → STCK-01 | 19 | 3.837837838 | |
| DCMK-55 → BHVR-02 → BHVR-23 → DCMK-20 → DCMK-07 → COGB-41 → COGB-40 → DCMK-04 → HLTH-02 → DCMK-02 → BHVR-06 → HLTH-03 → DCMK-13 → SFTY-05 → SFTY-06 → SFTY-07 → COGB-54 → OTHR-01 → STCK-01 | 19 | 3.837837838 | |
| DCMK-55 → BHVR-02 → BHVR-23 → DCMK-20 → DCMK-07 → COGB-41 → COGB-40 → DCMK-04 → HLTH-02 → DCMK-02 → BHVR-06 → HLTH-03 → DCMK-13 → SFTY-05 → SFTY-06 → SFTY-07 → COGB-54 → OTHR-01 → OTHR-03 → STCK-01 | 20 | 3.837837838 |
| Path | Cycle Length | Centrality Weight | Rank Centrality Weight |
|---|---|---|---|
| BHVR-11 → DCMK-12 → BHVR-23 → DCMK-40 → DCMK-53 → BHVR-16 → DCMK-20 → DCMK-07 → DCMK-21 → BHVR-15 → DCMK-10 → DCMK-46 → SFTY-06 → BHVR-17 → SFTY-13 → STCK-01 | 16 | −2.864864865 | #1 |
| BHVR-11 → DCMK-12 → BHVR-23 → DCMK-40 → DCMK-53 → BHVR-16 → DCMK-20 → DCMK-07 → DCMK-21 → DCMK-04 → HLTH-02 → DCMK-49 → SFTY-06 → BHVR-17 → SFTY-13 → STCK-01 | 16 | −2.675675676 | #2, #3 |
| BHVR-11 → DCMK-12 → BHVR-23 → DCMK-40 → DCMK-53 → BHVR-16 → DCMK-20 → DCMK-07 → DCMK-21 → DCMK-04 → HLTH-02 → DCMK-02 → DCMK-03 → BHVR-22 → DCMK-19 → DCMK-14 → COGB-12 → DCMK-11 → DCMK-10 → DCMK-46 → SFTY-06 → BHVR-17 → SFTY-13 → STCK-01 | 24 | −2.675675676 | |
| BHVR-11 → DCMK-12 → BHVR-23 → DCMK-40 → DCMK-53 → BHVR-16 → DCMK-20 → DCMK-07 → DCMK-21 → DCMK-04 → HLTH-02 → DCMK-02 → SFTY-06 → BHVR-17 → SFTY-13 → STCK-01 | 16 | −2.621621622 | #4 |
| SFTY-03 → BHVR-23 → DCMK-40 → DCMK-53 → BHVR-16 → DCMK-20 → DCMK-07 → DCMK-21 → BHVR-15 → DCMK-10 → DCMK-46 → SFTY-06 → BHVR-17 → SFTY-13 → STCK-01 | 15 | −2.540540541 | #5, #6 |
| BHVR-01 → BHVR-23 → DCMK-40 → DCMK-53 → BHVR-16 → DCMK-20 → DCMK-07 → DCMK-21 → BHVR-15 → DCMK-10 → DCMK-46 → SFTY-06 → BHVR-17 → SFTY-13 → STCK-01 | 15 | −2.540540541 | |
| BHVR-11 → DCMK-12 → BHVR-23 → DCMK-40 → DCMK-53 → BHVR-16 → DCMK-20 → DCMK-07 → DCMK-21 → BHVR-15 → DCMK-10 → DCMK-46 → SFTY-06 → BHVR-17 → OTHR-03 → STCK-01 | 16 | −2.513513514 | #7, #8 |
| BHVR-11 → DCMK-12 → BHVR-23 → DCMK-40 → DCMK-53 → BHVR-16 → DCMK-20 → DCMK-07 → DCMK-21 → DCMK-04 → HLTH-02 → DCMK-02 → BHVR-06 → SFTY-06 → BHVR-17 → SFTY-13 → STCK-01 | 17 | −2.513513514 | |
| BHVR-11 → DCMK-12 → BHVR-23 → DCMK-40 → DCMK-53 → BHVR-16 → DCMK-20 → DCMK-07 → DCMK-21 → SFTY-06 → BHVR-17 → SFTY-13 → STCK-01 | 13 | −2.459459459 | #9, #10 |
| BHVR-11 → DCMK-12 → BHVR-23 → DCMK-40 → DCMK-53 → BHVR-16 → DCMK-20 → DCMK-07 → DCMK-21 → BHVR-15 → COGB-54 → SFTY-06 → BHVR-17 → SFTY-13 → STCK-01 | 15 | −2.459459459 | |
| BHVR-11 → DCMK-12 → BHVR-23 → DCMK-40 → DCMK-53 → BHVR-16 → DCMK-20 → DCMK-07 → DCMK-21 → DCMK-04 → HLTH-02 → BHVR-17 → SFTY-06 → DCMK-46 → BHVR-19 → OTHR-03 → STCK-01 | 17 | −2.432432432 | #11–#13 |
| BHVR-11 → DCMK-12 → BHVR-23 → DCMK-40 → DCMK-53 → BHVR-16 → BHVR-15 → DCMK-10 → DCMK-46 → SFTY-06 → BHVR-17 → SFTY-13 → STCK-01 | 13 | −2.432432432 | |
| DCMK-55 → BHVR-02 → BHVR-23 → DCMK-40 → DCMK-53 → BHVR-16 → DCMK-20 → DCMK-07 → DCMK-21 → BHVR-15 → DCMK-10 → DCMK-46 → SFTY-06 → BHVR-17 → SFTY-13 → STCK-01 | 16 | −2.432432432 | |
| BHVR-11 → DCMK-12 → BHVR-23 → DCMK-40 → DCMK-53 → BHVR-16 → DCMK-20 → DCMK-07 → DCMK-21 → BHVR-15 → DCMK-10 → SFTY-06 → BHVR-17 → SFTY-13 → STCK-01 | 15 | −2.405405405 | #14 |
| BHVR-11 → DCMK-12 → BHVR-23 → DCMK-40 → DCMK-53 → BHVR-16 → DCMK-20 → DCMK-07 → DCMK-21 → DCMK-04 → HLTH-02 → DCMK-49 → SFTY-06 → DCMK-46 → BHVR-19 → OTHR-03 → STCK-01 | 17 | −2.351351351 | #15–#20 |
| SFTY-03 → BHVR-23 → DCMK-40 → DCMK-53 → BHVR-16 → DCMK-20 → DCMK-07 → DCMK-21 → DCMK-04 → HLTH-02 → DCMK-49 → SFTY-06 → BHVR-17 → SFTY-13 → STCK-01 | 15 | −2.351351351 | |
| SFTY-03 → BHVR-23 → DCMK-40 → DCMK-53 → BHVR-16 → DCMK-20 → DCMK-07 → DCMK-21 → DCMK-04 → HLTH-02 → DCMK-02 → DCMK-03 → BHVR-22 → DCMK-19 → DCMK-14 → COGB-12 → DCMK-11 → DCMK-10 → DCMK-46 → SFTY-06 → BHVR-17 → SFTY-13 → STCK-01 | 23 | −2.351351351 | |
| BHVR-01 → BHVR-23 → DCMK-40 → DCMK-53 → BHVR-16 → DCMK-20 → DCMK-07 → DCMK-21 → DCMK-04 → HLTH-02 → DCMK-49 → SFTY-06 → BHVR-17 → SFTY-13 → STCK-01 | 15 | −2.351351351 | |
| BHVR-01 → BHVR-23 → DCMK-40 → DCMK-53 → BHVR-16 → DCMK-20 → DCMK-07 → DCMK-21 → DCMK-04 → HLTH-02 → DCMK-02 → DCMK-03 → BHVR-22 → DCMK-19 → DCMK-14 → COGB-12 → DCMK-11 → DCMK-10 → DCMK-46 → SFTY-06 → BHVR-17 → SFTY-13 → STCK-01 | 23 | −2.351351351 | |
| BHVR-11 → DCMK-12 → BHVR-23 → DCMK-40 → DCMK-53 → BHVR-16 → DCMK-20 → DCMK-07 → DCMK-10 → DCMK-46 → SFTY-06 → BHVR-17 → SFTY-13 → STCK-01 | 14 | −2.351351351 |
References
- Sepasgozar, S.M.E.; Davis, S. Construction Technology Adoption Cube: An Investigation on Process, Factors, Barriers, Drivers and Decision Makers Using NVivo and AHP Analysis. Buildings 2018, 8, 74. [Google Scholar] [CrossRef]
- Karakhan, A.A.; Gambatese, J.; Simmons, D.R.; Albert, A.; Breesam, H.K. Leading Indicators of the Health and Well-Being of the Construction Workforce: Perception of Industry Professionals. Pract. Period. Struct. Des. Constr. 2023, 28, 04022054. [Google Scholar] [CrossRef]
- U.S. Bureau of Labor Statistics. Number and Rate of Fatal Work Injuries, by Private Industry Sector. Available online: https://www.bls.gov/charts/census-of-fatal-occupational-injuries/number-and-rate-of-fatal-work-injuries-by-industry.htm (accessed on 20 January 2025).
- Grill, M.; Nielsen, K.; Grytnes, R.; Pousette, A.; Törner, M. The leadership practices of construction site managers and their influence on occupational safety: An observational study of transformational and passive/avoidant leadership. Constr. Manag. Econ. 2019, 37, 278–293. [Google Scholar] [CrossRef]
- Soh, J.; Jeong, J.; Jeong, J.; Lee, J. Quantitative Risk Evaluation by Building Type Based on Probability and Cost of Accidents. Buildings 2023, 13, 327. [Google Scholar] [CrossRef]
- Yiu, N.S.N.; Chan, D.W.M.; Sze, N.N.; Shan, M.; Chan, A.P.C. Implementation of Safety Management System for Improving Construction Safety Performance: A Structural Equation Modelling Approach. Buildings 2019, 9, 89. [Google Scholar] [CrossRef]
- Bolognani, D.; Verzobio, A.; Zonta, D.; Quigley, J. How heuristic behavior can affect SHM-based decision problems? In Proceedings of the 13th International Conference on Applications of Statistics and Probability in Civil Engineering, ICASP 2019, Seoul, Republic of Korea, 26–30 May 2019. [Google Scholar]
- Li, H.; Chen, H.; Zhao, Z.; Hu, X.; Cheng, B.; Huang, J. Tunnel Construction Workers’ Cognitive Biases and Unsafe Behaviors: The Mediating Effects of Risk Perceptions. Adv. Civ. Eng. 2020, 2020, 8873113. [Google Scholar] [CrossRef]
- Pooladvand, S.; Kiper, B.; Mane, A.; Hasanzadeh, S. Effect of Time Pressure and Cognitive Demand on Line Workers’ Risk-Taking Behaviors: Assessment of Neuro-Psychophysiological Responses in a Mixed-Reality Environment. In Proceedings of the Construction Research Congress 2022, Arlington, VA, USA, 9–12 March 2022. [Google Scholar]
- Aroke, O.; Esmaeili, B.; Hasanzadeh, S.; Dodd, M.D.; Brock, R. The Role of Work Experience on Hazard Identification: Assessing the Mediating Effect of Inattention under Fall-Hazard Conditions. In Proceedings of the Construction Research Congress 2020, Tempe, AZ, USA, 8–10 March 2020. [Google Scholar]
- Shringi, A.; Arashpour, M.; Golafshani, E.M.; Rajabifard, A.; Dwyer, T.; Li, H. Efficiency of VR-Based Safety Training for Construction Equipment: Hazard Recognition in Heavy Machinery Operations. Buildings 2022, 12, 2084. [Google Scholar] [CrossRef]
- Bellamy, L.J.; Chambon, M.; Van Guldener, V. Getting resilience into safety programs using simple tools—A research background and practical implementation. Reliab. Eng. Syst. Saf. 2018, 172, 171–184. [Google Scholar] [CrossRef]
- JordÃO, A.R.; Costa, R.; Dias, Á.L.; Pereira, L.; Santos, J.P. Bounded rationality in decision making: An analysis of the decision-making biases. Bus. Theory Pract. 2020, 21, 654–665. [Google Scholar] [CrossRef]
- Nelius, T.; Matthiesen, S. Experimental evaluation of a debiasing method for analysis in engineering design. In Proceedings of the Design Society: International Conference on Engineering Design, Delft, The Netherlands, 5–8 August 2019. [Google Scholar]
- Ma, H.; Cao, S.; Wang, Y.; Zhang, H. The Moderating Effect of Optimism Bias on Ambivalence of Workers’ Unsafe Behaviors. J. Constr. Eng. Manag. 2023, 149, 04023087. [Google Scholar] [CrossRef]
- Son, J. Complexity and Dynamics in Construction Project Organizations. Sustainability 2022, 14, 13599. [Google Scholar] [CrossRef]
- Habibi Rad, M.; Mojtahedi, M.; Ostwald, M.J.; Wilkinson, S. A Conceptual Framework for Implementing Lean Construction in Infrastructure Recovery Projects. Buildings 2022, 12, 272. [Google Scholar] [CrossRef]
- Ballard, G. Construction: One type of project production system. In Proceedings of the 13th Annual Conference of the International Group for Lean Construction, IGLC13, Sydney, Australia, 19–21 July 2005; pp. 29–35. [Google Scholar]
- Mostofi, F.; Behzat Tokdemir, O.; Toğan, V. A decision-support productive resource recommendation system for enhanced construction project management. Adv. Eng. Inform. 2024, 62, 102793. [Google Scholar] [CrossRef]
- Salari, S.A.-S.; Mahmoudi, H.; Aghsami, A.; Jolai, F.; Jolai, S.; Yazdani, M. Off-Site Construction Three-Echelon Supply Chain Management with Stochastic Constraints: A Modelling Approach. Buildings 2022, 12, 119. [Google Scholar] [CrossRef]
- Gernand, J.M. A Set of Estimation and Decision Preference Experiments for Exploring Risk Assessment Biases in Engineering Students. ASCE-ASME J. Risk Uncertain. Eng. Syst. Part B Mech. Eng. 2023, 9, 011206. [Google Scholar]
- Pan, Y.; Zhang, L. Roles of artificial intelligence in construction engineering and management: A critical review and future trends. Autom. Constr. 2021, 122, 103517. [Google Scholar]
- Liu, W.; Chen, Q.; Juang, C.H.; Chen, G. Uncertainty propagation of soil property in dynamic site response under different site conditions. Int. J. Numer. Anal. Methods Geomech. 2023, 47, 1521–1538. [Google Scholar]
- Kandalai, S.; John, N.J.; Patel, A. Effects of Climate Change on Geotechnical Infrastructures—State of the art. Environ. Sci. Pollut. Res. 2023, 30, 16878–16904. [Google Scholar]
- Hasanzadeh, S.; De La Garza, J.M. Productivity-safety model: Debunking the myth of the productivity-safety divide through a mixed-reality residential roofing task. J. Constr. Eng. Manag. 2020, 146, 04020124. [Google Scholar] [CrossRef]
- Pooladvand, S.; Hasanzadeh, S. Neurophysiological evaluation of workers’ decision dynamics under time pressure and increased mental demand. Autom. Constr. 2022, 141, 104437. [Google Scholar] [CrossRef]
- Literature Review: Systematic Literature Reviews. Available online: https://libguides.csu.edu.au/review/Systematic (accessed on 16 January 2025).
- Van Eck, N.J.; Waltman, L. Software survey: VOSviewer, a computer program for bibliometric mapping. Scientometrics 2010, 84, 523–538. [Google Scholar]
- Page, M.J.; McKenzie, J.E.; Bossuyt, P.M.; Boutron, I.; Hoffmann, T.C.; Mulrow, C.D.; Shamseer, L.; Tetzlaff, J.M.; Akl, E.A.; Brennan, S.E.; et al. The PRISMA 2020 statement: An updated guideline for reporting systematic reviews. BMJ 2021, 372, n71. [Google Scholar] [PubMed]
- Zhou, Q. Cognitive Biases in Technical Communication. In Proceedings of the 2020 IEEE International Professional Communication Conference (ProComm), Kennesaw, GA, USA, 19–22 July 2020. [Google Scholar]
- Kinsey, M.J.; Gwynne, S.M.V.; Kuligowski, E.D.; Kinateder, M. Cognitive Biases Within Decision Making During Fire Evacuations. Fire Technol. 2019, 55, 465–485. [Google Scholar]
- Ball, R.J.; Hudson-Doyle, E.E.; Nuth, M.; Hopkins, W.J.; Brunsdon, D.; Brown, C.O. Behavioural science applied to risk-based decision processes: A case study for earthquake prone buildings in New Zealand. Civ. Eng. Environ. Syst. 2022, 39, 144–164. [Google Scholar]
- Protte, M.; Fahr, R.; Quevedo, D.E. Behavioral economics for human-in-the-loop control systems design: Overconfidence and the hot hand fallacy. IEEE Control Syst. 2020, 40, 57. [Google Scholar]
- Du, J.; Wang, Q.; Shi, Q. Description–experience gap under imperfect information: Information continuum and aggressive cost estimating in capital projects. Eng. Constr. Archit. Manag. 2019, 26, 1151–1170. [Google Scholar] [CrossRef]
- Sörqvist, P.; Lindeberg, S.; Marsh, J.E. All’s eco-friendly that ends eco-friendly: Short-term memory effects in carbon footprint estimates of temporal item sequences. Appl. Cogn. Psychol. 2024, 38, e4204. [Google Scholar]
- Alzayed, M.A.; Starkey, E.M.; Ritter, S.C.; Prabhu, R. Am I Right? Investigating the Influence of Trait Empathy and Attitudes Towards Sustainability on the Accuracy of Concept Evaluations in Sustainable Design. In Proceedings of the ASME 2022 International Design Engineering Technical Conferences and Computers and Information in Engineering Conference, St. Louis, MO, USA, 14–17 August 2022. [Google Scholar]
- Brown, C.L.; Utley, D.R. Ambiguity Aversion in Engineers. EMJ Eng. Manag. J. 2019, 31, 2–7. [Google Scholar]
- Shealy, T.; Klotz, L.; Weber, E.U.; Johnson, E.J.; Bell, R.G. Bringing Choice Architecture to Architecture and Engineering Decisions: How the Redesign of Rating Systems Can Improve Sustainability. J. Manag. Eng. 2019, 35, 04019014. [Google Scholar] [CrossRef]
- Marois, A.; Labonté, K.; Lafond, D.; Neyedli, H.F.; Tremblay, S. Cognitive and Behavioral Impacts of Two Decision-Support Modes for Judgmental Bootstrapping. J. Cogn. Eng. Decis. Mak. 2023, 17, 215–235. [Google Scholar] [CrossRef]
- McWhirter, N.; Shealy, T. Development and assessment of three envision case study modules connecting behavioral decision science to sustainable infrastructure. In Proceedings of the 2018 ASEE Annual Conference & Exposition, Salt Lake City, UT, USA, 24–27 June 2018. [Google Scholar]
- Baybutt, P. The validity of engineering judgment and expert opinion in hazard and risk analysis: The influence of cognitive biases. Process Saf. Prog. 2018, 37, 205–210. [Google Scholar] [CrossRef]
- Mosier, K.L.; Skitka, L.J.; Dunbar, M.; McDonnell, L. Aircrews and Automation Bias: The Advantages of Teamwork? Int. J. Aviat. Psychol. 2001, 11, 1–14. [Google Scholar]
- Tversky, A.; Kahneman, D. Availability: A heuristic for judging frequency and probability. Cogn. Psychol. 1973, 5, 207–232. [Google Scholar] [CrossRef]
- Carter, C.R.; Kaufmann, L.; Michel, A. Behavioral supply management: A taxonomy of judgment and decision-making biases. Int. J. Phys. Distrib. Logist. Manag. 2007, 37, 631–669. [Google Scholar]
- Darley, J.M.; Latane, B. Bystander intervention in emergencies: Diffusion of responsibility. J. Personal. Soc. Psychol. 1968, 8, 377–383. [Google Scholar]
- Kahneman, D.; Tversky, A. Prospect Theory: An Analysis of Decision under Risk. Econometrica 1979, 47, 263–291. [Google Scholar]
- Stoll Benney, K.; Henkel, L.A. The role of free choice in memory for past decisions. Memory 2006, 14, 1001–1011. [Google Scholar]
- Baron, J.; Hershey, J.C. Outcome bias in decision evaluation. J. Personal. Soc. Psychol. 1988, 54, 569–579. [Google Scholar]
- Huh, Y.E.; Vosgerau, J.; Morewedge, C.K. Social Defaults: Observed Choices Become Choice Defaults. J. Consum. Res. 2014, 41, 746–760. [Google Scholar]
- Kruger, J.; Dunning, D. Unskilled and unaware of it: How difficulties in recognizing one’s own incompetence lead to inflated self-assessments. J. Personal. Soc. Psychol. 1999, 77, 1121–1134. [Google Scholar]
- Kahneman, D.; Fredrickson, B.L.; Schreiber, C.A.; Redelmeier, D.A. When More Pain Is Preferred to Less: Adding a Better End. Psychol. Sci. 1993, 4, 401–405. [Google Scholar] [CrossRef]
- Mahesh Babu, P.; Seadon, J.; Moore, D. Cognitive biases that influence Lean implementation and practices in a multicultural environment. Int. J. Lean Six Sigma 2023, 14, 1655–1714. [Google Scholar] [CrossRef]
- Przybylski, A.K.; Murayama, K.; Dehaan, C.R.; Gladwell, V. Motivational, emotional, and behavioral correlates of fear of missing out. Comput. Hum. Behav. 2013, 29, 1841–1848. [Google Scholar] [CrossRef]
- Kahneman, D.; Krueger, A.B.; Schkade, D.; Schwarz, N.; Stone, A.A. Would You Be Happier If You Were Richer? A Focusing Illusion. Science 2006, 312, 1908–1910. [Google Scholar] [CrossRef]
- Tversky, A.; Kahneman, D. The Framing of Decisions and the Psychology of Choice. Science 1981, 211, 453–458. [Google Scholar] [CrossRef]
- Eagly, A.H.; Karau, S.J. Role congruity theory of prejudice toward female leaders. Psychol. Rev. 2002, 109, 573–598. [Google Scholar] [CrossRef]
- Fischhoff, B. Hindsight is not equal to foresight: The effect of outcome knowledge on judgment under uncertainty. J. Exp. Psychol. Hum. Percept. Perform. 1975, 1, 288–299. [Google Scholar] [CrossRef]
- Gilovich, T.; Vallone, R.; Tversky, A. The hot hand in basketball: On the misperception of random sequences. Cogn. Psychol. 1985, 17, 295–314. [Google Scholar] [CrossRef]
- Thompson, S.C. Illusions of Control: How We Overestimate Our Personal Influence. Curr. Dir. Psychol. Sci. 1999, 8, 187–190. [Google Scholar] [CrossRef]
- Farooq, M.U.; Thaheem, M.J.; Arshad, H. Improving the risk quantification under behavioural tendencies: A tale of construction projects. Int. J. Proj. Manag. 2018, 36, 414–428. [Google Scholar] [CrossRef]
- Le Bon, G. Psychology of Crowds (Annotated); Sparkling Books: London, UK, 2009. [Google Scholar]
- Zajonc, R.B. Mere Exposure: A Gateway to the Subliminal. Curr. Dir. Psychol. Sci. 2001, 10, 224–228. [Google Scholar] [CrossRef]
- Wu, P.F. In Search of Negativity Bias: An Empirical Study of Perceived Helpfulness of Online Reviews. Psychol. Mark. 2013, 30, 971–984. [Google Scholar] [CrossRef]
- Tobin, G.A. Natural Hazards: Explanation and Integration; Guilford Press: New York, NY, USA, 1997. [Google Scholar]
- Moore, D.A.; Healy, P.J. The trouble with overconfidence. Psychol. Rev. 2008, 115, 502–517. [Google Scholar] [CrossRef]
- Sullivan, J. The Primacy Effect in Impression Formation: Some Replications and Extensions. Soc. Psychol. Personal. Sci. 2019, 10, 432–439. [Google Scholar] [CrossRef]
- Tulving, E.; Schacter, D.L. Priming and Human Memory Systems. Science 1990, 247, 301–306. [Google Scholar] [CrossRef]
- Hardman, D.K. Judgment and Decision Making: Psychological Perspectives; Wiley-Blackwell: Malden, MA, USA, 2009. [Google Scholar]
- Steiner, D.D.; Rain, J.S. Immediate and delayed primacy and recency effects in performance evaluation. J. Appl. Psychol. 1989, 74, 136–142. [Google Scholar] [CrossRef]
- Murdock, B.B. The serial position effect of free recall. J. Exp. Psychol. 1962, 64, 482–488. [Google Scholar] [CrossRef]
- Tversky, A.; Kahneman, D. Judgment under Uncertainty: Heuristics and Biases. Science 1974, 185, 1124–1131. [Google Scholar] [CrossRef] [PubMed]
- McGlone, M.S.; Tofighbakhsh, J. Birds of a Feather Flock Conjointly (?): Rhyme as Reason in Aphorisms. Psychol. Sci. 2000, 11, 424–428. [Google Scholar] [CrossRef]
- Peltzman, S. The Effects of Automobile Safety Regulation. J. Political Econ. 1975, 83, 677–725. [Google Scholar] [CrossRef]
- Wood, W.; Neal, D.T. A new look at habits and the habit-goal interface. Psychol. Rev. 2007, 114, 843. [Google Scholar] [PubMed]
- Miller, D.T.; Ross, M. Self-serving biases in the attribution of causality: Fact or fiction? Psychol. Bull. 1975, 82, 213–225. [Google Scholar] [CrossRef]
- Paulhus, D. Measurement and Control of Response Bias; Measures of Personality and Social Psychological Attitudes/Academic Press, Inc.: San Diego, CA, USA, 1991; pp. 17–59. [Google Scholar]
- Smith, C.D.; Scarf, D. Spacing Repetitions Over Long Timescales: A Review and a Reconsolidation Explanation. Front. Psychol. 2017, 8, 962. [Google Scholar]
- Samuelson, W.; Zeckhauser, R. Status quo bias in decision making. J. Risk Uncertain. 1988, 1, 7–59. [Google Scholar]
- Arkes, H.R.; Blumer, C. The psychology of sunk cost. Organ. Behav. Hum. Decis. Process. 1985, 35, 124–140. [Google Scholar]
- Geier, A.B.; Rozin, P.; Doros, G. Unit Bias. Psychol. Sci. 2006, 17, 521–525. [Google Scholar]
- Shi, J.; Sun, Y.; Su, H.; Wang, Y.; Huang, Z.; Gao, L. Risk-taking behavior of drilling workers: A study based on the structural equation model. Int. J. Ind. Ergon. 2021, 86, 103219. [Google Scholar]
- ElSayed, K.A.; Bilionis, I.; Panchal, J.H. Evaluating heuristics in engineering design: A reinforcement learning approach. In Proceedings of the ASME 2021 International Design Engineering Technical Conferences and Computers and Information in Engineering Conference, St. Louis, MO, USA, 17–19 August 2021. [Google Scholar]
- Hasanzadeh, S.; De La Garza, J.M.; Geller, E.S. Latent Effect of Safety Interventions. J. Constr. Eng. Manag. 2020, 146, 04020033. [Google Scholar] [CrossRef]
- Ibrahim, A.; Nnaji, C.; Namian, M.; Koh, A.; Techera, U. Investigating the impact of physical fatigue on construction workers’ situational awareness. Saf. Sci. 2023, 163, 106103. [Google Scholar]
- Chen, J.; Wang, R.Q.; Lin, Z.; Guo, X. Measuring the cognitive loads of construction safety sign designs during selective and sustained attention. Saf. Sci. 2018, 105, 9–21. [Google Scholar]
- Wang, J.; Su, Y.S.; Liao, P.C. Re-investigation of the Mediating Effect of Brain Activities between Dispositional Factors and Hazard Recognition: A Multilevel Logistic Regression Approach. KSCE J. Civ. Eng. 2023, 27, 3646–3658. [Google Scholar]
- Feng, Y.; Wu, P.; Ye, G.; Zhao, D. Risk-Compensation Behaviors on Construction Sites: Demographic and Psychological Determinants. J. Manag. Eng. 2017, 33, 04017008. [Google Scholar]
- Kavvada, I.; Horvath, A.; Moura, S. Distributionally Robust Budget Allocation for Earthquake Risk Mitigation in Buildings. ASCE-ASME J. Risk Uncertain. Eng. Syst. Part A Civ. Eng. 2024, 10, 04023050. [Google Scholar]
- Schöttle, A.; Christensen, R.; Arroyo, P. Does choosing by advantages promote inclusiveness in group decision-making? In Proceedings of the 27th Annual Conference of the International Group for Lean Construction, Dublin, Ireland, 3–5 July 2019. [Google Scholar]
- Kotluk, N.; Tormey, R. Emotional Empathy and Engineering Students’ Moral Reasoning. In Proceedings of the 50th Annual Conference of the European Society for Engineering Education, SEFI 2022, Barcelona, Spain, 19–22 September 2022. [Google Scholar]
- Witherell, C.J.; Maar, A.; Dougherty, P.; Letting, C.; Menold, J. Facilitating Success: Exploring the Influence of Design Facilitators’ Behaviors on Team Members’ Responses and Perceptions of Team Climate and Trust. In Proceedings of the ASME 2024 International Design Engineering Technical Conferences and Computers and Information in Engineering Conference, Washington, DC, USA, 25–28 August 2024. [Google Scholar]
- Love, P.E.D.; Ika, L.A.; Pinto, J.K. Fast-and-frugal heuristics for decision-making in uncertain and complex settings in construction. Dev. Built Environ. 2023, 14, 100129. [Google Scholar]
- Delgado, L.; Shealy, T.; Garvin, M.; Pearce, A. Framing Energy Efficiency with Payback Period: Empirical Study to Increase Energy Consideration during Facility Procurement Processes. J. Constr. Eng. Manag. 2018, 144, 04018027. [Google Scholar]
- Zheng, X.; Ritter, S.C.; Miller, S.R. How concept selection tools impact the development of creative ideas in engineering design education. J. Mech. Des. 2018, 140, 052002. [Google Scholar]
- Hu, M.; Shealy, T. Overcoming Status Quo Bias for Resilient Stormwater Infrastructure: Empirical Evidence in Neurocognition and Decision-Making. J. Manag. Eng. 2020, 36, 04020017. [Google Scholar]
- Xu, X.; Wang, S.; Du, Z.; Rong, H.; Li, Q.; Wu, T.; Li, S.; Zheng, J. Sustainable pavement maintenance and rehabilitation planning using the quantum cognitive trust network. Dev. Built Environ. 2024, 20, 100553. [Google Scholar]
- Nelius, T.; Doellken, M.; Zimmerer, C.; Matthiesen, S. The impact of confirmation bias on reasoning and visual attention during analysis in engineering design: An eye tracking study. Des. Stud. 2020, 71, 100963. [Google Scholar]
- Gerassis, S.; Albuquerque, M.T.D.; García, J.F.; Boente, C.; Giráldez, E.; Taboada, J.; Martín, J.E. Understanding complex blasting operations: A structural equation model combining Bayesian networks and latent class clustering. Reliab. Eng. Syst. Saf. 2019, 188, 195–204. [Google Scholar] [CrossRef]
- Lappalainen, E.; Uusitalo, P.; Seppänen, O.; Peltokorpi, A.; Ainamo, A.; Reinbold, A. User experiences of situational awareness systems in infrastructure construction. Constr. Manag. Econ. 2024, 42, 1012–1025. [Google Scholar] [CrossRef]
- Fellows, R.F.; Liu, A.M.M. Where do I go from here? Motivated reasoning in construction decisions. Constr. Manag. Econ. 2018, 36, 623–634. [Google Scholar] [CrossRef]


| Database | Search Strings |
|---|---|
| Scopus | (TITLE-ABS-KEY ((cognitive OR mental OR behavioural OR behavioral) AND (bias*)) AND TITLE-ABS-KEY (“safety management” OR “health and safety” OR “risk assessment” OR “risk perception” OR “risk management” OR “decision-making” OR “decision making” OR “occupational risks” OR “wellbeing” OR “well-being” OR “accident prevention”) AND TITLE-ABS-KEY (construction OR engineering)) |
| ScienceDirect | (construction OR engineering) AND ((cognitive OR mental OR behavioural OR behavioral) AND (bias OR biases)) AND (“safety management” OR “health and safety” OR “risk assessment” OR “risk perception” OR “risk management” OR “decision-making” OR “decision making” OR “occupational risks” OR “wellbeing” OR “well-being” OR “accident prevention”) |
| EBSCO | (construction OR engineering) AND ((cognitive OR mental OR behavioural OR behavioral) AND (bias*)) AND (“safety management” OR “health and safety” OR “risk assessment” OR “risk perception” OR “risk management” OR “decision-making” OR “decision making” OR “occupational risks” OR “wellbeing” OR “well-being” OR “accident prevention”) |
| Eligibility | Criteria |
|---|---|
| Inclusion | Published between 2018 and 2024 Peer-reviewed articles Open access |
| Exclusion | Not written in English Not related to the research topic Review papers |
| Column | Data Type | Values |
|---|---|---|
| Title | Dropdown | List of article titles from the “Data” sheet |
| Factor Code | Automated | Auto-assigned based on the selected factor |
| Factor | Dropdown | List of predefined factors from the “Factors” sheet |
| Relation Type | Dropdown | Positive/negative/none |
| Impact | Dropdown | List of predefined factors from the “Factors” sheet |
| Impact Code | Automated | Auto-assigned based on the selected impact |
| Details | Text | Extracted sentence from the article mentioning the relationship |
| Page Number | Number | Page number from the article where the relationship was found |
| Direct/Indirect | Dropdown | Direct/indirect |
| No. | Factor | Code |
|---|---|---|
| 1 | Ambiguity | BHVR-01 |
| 2 | Ambivalence | BHVR-02 |
| 3 | Bounded Rationality | BHVR-03 |
| 4 | Choice Overload | BHVR-04 |
| 5 | Cognitive Myopia | BHVR-05 |
| 6 | Cognitive Overload | BHVR-06 |
| 7 | Complacency | BHVR-07 |
| 8 | Design Fixation | BHVR-08 |
| 9 | Empathic Concern | BHVR-09 |
| 10 | Evaluation Apprehension | BHVR-10 |
| 11 | Fast and Frugal Heuristics | BHVR-11 |
| 12 | Hypovigilance | BHVR-12 |
| 13 | Loss of Attention | BHVR-13 |
| 14 | Optimizer’s Curse | BHVR-14 |
| 15 | Overestimation | BHVR-15 |
| 16 | Risk Aversion | BHVR-16 |
| 17 | Risk Propensity | BHVR-17 |
| 18 | Sampling Errors Effect | BHVR-18 |
| 19 | Satisficing | BHVR-19 |
| 20 | Social Loafing | BHVR-20 |
| 21 | Stress | BHVR-21 |
| 22 | Trust | BHVR-22 |
| 23 | Uncertainty | BHVR-23 |
| 24 | Von Restorff Effect | BHVR-24 |
| 25 | Chain of Command | DCMK-01 |
| 26 | Cognitive Demand | DCMK-02 |
| 27 | Cognitive Resources | DCMK-03 |
| 28 | Cognitive Workload | DCMK-04 |
| 29 | Communication and Collaboration | DCMK-05 |
| 30 | Community Impact | DCMK-06 |
| 31 | Complexity | DCMK-07 |
| 32 | Concept Evaluation | DCMK-08 |
| 33 | Cost | DCMK-09 |
| 34 | Cost Estimation | DCMK-10 |
| 35 | Creativity | DCMK-11 |
| 36 | Decision-Making Method/Framework | DCMK-12 |
| 37 | Distractions | DCMK-13 |
| 38 | Domain Expertise | DCMK-14 |
| 39 | Educational Level | DCMK-15 |
| 40 | Emotions | DCMK-16 |
| 41 | Feedback | DCMK-17 |
| 42 | Government Regulations | DCMK-18 |
| 43 | Group/Team Dynamics | DCMK-19 |
| 44 | Heuristics | DCMK-20 |
| 45 | Incomplete/Limited Information | DCMK-21 |
| 46 | Information Availability | DCMK-22 |
| 47 | Information Framing | DCMK-23 |
| 48 | Information Overload | DCMK-24 |
| 49 | Insider Perspective | DCMK-25 |
| 50 | Institutional Pressures | DCMK-26 |
| 51 | Lack of Trust | DCMK-27 |
| 52 | Leadership | DCMK-28 |
| 53 | Memory Processes | DCMK-29 |
| 54 | Organisational Cultures | DCMK-30 |
| 55 | Organisational Policies | DCMK-31 |
| 56 | Outsider Perspective | DCMK-32 |
| 57 | Passive Leadership | DCMK-33 |
| 58 | Preferences | DCMK-34 |
| 59 | Productivity | DCMK-35 |
| 60 | Professional Backgrounds | DCMK-36 |
| 61 | Professional Norms | DCMK-37 |
| 62 | Project Approval | DCMK-38 |
| 63 | Project Diversity | DCMK-39 |
| 64 | Project Scheduling | DCMK-40 |
| 65 | Psychological Disposition | DCMK-41 |
| 66 | Psychological Distance | DCMK-42 |
| 67 | Psychological Safety | DCMK-43 |
| 68 | Reflective Evaluation | DCMK-44 |
| 69 | Resistance to Change | DCMK-45 |
| 70 | Resource Allocation | DCMK-46 |
| 71 | Retrospective Evaluation | DCMK-47 |
| 72 | Self-Evaluation | DCMK-48 |
| 73 | Situational Awareness | DCMK-49 |
| 74 | Social Norms | DCMK-50 |
| 75 | Stakeholder Involvement | DCMK-51 |
| 76 | Stimuli Modality | DCMK-52 |
| 77 | Technical Challenges | DCMK-53 |
| 78 | Time Availability | DCMK-54 |
| 79 | Trade-Offs | DCMK-55 |
| 80 | Transformational Leadership | DCMK-56 |
| 81 | Visual Attention | DCMK-57 |
| 82 | Work Experiences | DCMK-58 |
| 83 | Workforce Diversity | DCMK-59 |
| 84 | Climate Threat | HLTH-01 |
| 85 | Performance Demands | HLTH-02 |
| 86 | Physical Fatigue | HLTH-03 |
| 87 | Time Pressure | HLTH-04 |
| 88 | Construction Environment | SFTY-01 |
| 89 | Management Commitment | SFTY-02 |
| 90 | Natural Disasters | SFTY-03 |
| 91 | Poor Working Environment | SFTY-04 |
| 92 | Risk Assessment | SFTY-05 |
| 93 | Risk Perception | SFTY-06 |
| 94 | Risk Tolerance | SFTY-07 |
| 95 | Safety Attitudes and Behaviours | SFTY-08 |
| 96 | Safety Climate | SFTY-09 |
| 97 | Safety Interventions | SFTY-10 |
| 98 | Safety Standards | SFTY-11 |
| 99 | Safety Training | SFTY-12 |
| 100 | Unsafe Behaviours | SFTY-13 |
| No. | Cognitive Bias | Code | Description |
|---|---|---|---|
| 1 | Affect Bias | COGB-01 | The tendency to let emotions, such as fear and pleasure, influence decisions [41] |
| 2 | Ambiguity Effect/Aversion | COGB-02 | The tendency to prefer options where the outcome is known over those with an unknown outcome [41] |
| 3 | Anchoring Effect | COGB-03 | The tendency to rely too heavily on the first piece of information encountered when making decisions [13] |
| 4 | Attentional Bias | COGB-04 | The tendency to focus on specific pieces of information while ignoring others [31] |
| 5 | Authority Bias | COGB-05 | The tendency to attribute greater accuracy and importance to the opinion of an authority figure, regardless of its validity [41] |
| 6 | Automation Bias | COGB-06 | The tendency to over-rely on automated systems and technology [42] |
| 7 | Availability Bias | COGB-07 | The tendency to be influenced by information that one can recall easily [43] |
| 8 | Bandwagon Effect | COGB-08 | The tendency to adopt behaviours, beliefs, or trends simply because many others do the same [44] |
| 9 | Bystander Effect | COGB-09 | The tendency to be less likely to help someone in distress when others are present, assuming someone else will take action [45] |
| 10 | Certainty Effect | COGB-10 | The tendency to prefer outcomes that are certain over those that are merely probable [46] |
| 11 | Choice-Supportive Bias | COGB-11 | The tendency to recall positive aspects more than negative ones when remembering past choices [47] |
| 12 | Confirmation Bias | COGB-12 | The tendency to search for, interpret, and recall information in a way that confirms one’s pre-existing beliefs [14] |
| 13 | Consequence Bias | COGB-13 | The tendency to judge a decision based on its outcome rather than the process used to make it [48] |
| 14 | Courtesy Bias | COGB-14 | The tendency to give socially desirable responses rather than honest opinions to avoid offending others [41] |
| 15 | Default Effect | COGB-15 | The tendency to go with the default option [49] |
| 16 | Dunning–Kruger Effect | COGB-16 | The tendency of people with low ability to overestimate their competence, while highly competent people underestimate their ability [50] |
| 17 | Duration Neglect | COGB-17 | The tendency to disregard the duration of an experience and judge it only by the peak and end moments [51] |
| 18 | Fading Affect Bias | COGB-18 | The tendency for negative events to be forgotten faster than positive ones [52] |
| 19 | False Consensus Bias | COGB-19 | The tendency to overestimate how much others share one’s beliefs, attitudes, and behaviours [41] |
| 20 | Fear of Missing Out | COGB-20 | The tendency to experience anxiety over the possibility of missing out on pleasant experiences that others are having [53] |
| 21 | Focusing Effect | COGB-21 | The tendency to place too much importance on one aspect of an event while ignoring others [54] |
| 22 | Framing Bias | COGB-22 | The tendency for decisions to be influenced by the way information is presented rather than by the actual content [55] |
| 23 | Gender Bias | COGB-23 | The tendency to favour one gender over another results in unequal treatment and stereotypes [56] |
| 24 | Group Polarisation | COGB-24 | The tendency to adopt the majority opinion, regardless of supporting facts or evidence [52] |
| 25 | Group Think Bias | COGB-25 | The tendency to align with a group to gain collective support [52] |
| 26 | Halo Effect | COGB-26 | The tendency to let a single characteristic shape one’s entire opinion, whether positively or negatively [41] |
| 27 | Hindsight Bias | COGB-27 | The tendency to see past events as more predictable than they were after they have happened [57] |
| 28 | Hot Hand Fallacy | COGB-28 | The tendency to believe that a person who has experienced success in a random event has a higher chance of future success [58] |
| 29 | Illusion of Control | COGB-29 | The tendency to overestimate one’s ability to control or affect events beyond one’s influence [59] |
| 30 | Illusion of Truth Effect | COGB-30 | The tendency to believe familiar statements over unfamiliar ones, regardless of their actual validity [41] |
| 31 | In-Group Bias | COGB-31 | The tendency to favour members of one’s group over outsiders [41] |
| 32 | Isolation Effect | COGB-32 | The tendency to remember unique or distinctive items better than common ones [60] |
| 33 | Lemming Effect | COGB-33 | The tendency to follow others mindlessly without evaluating potential risks or consequences [61] |
| 34 | Loss Aversion | COGB-34 | The tendency to prefer avoiding risks even when potential gains outweigh the losses [46] |
| 35 | Mere Exposure Effect | COGB-35 | The tendency to develop a preference for things merely because of repeated exposure to them [62] |
| 36 | Modality Effect | COGB-36 | The tendency to have stronger memory retention for recently spoken items compared to written ones [41] |
| 37 | Negativity Bias | COGB-37 | The tendency to pay more attention to negative experiences or information than positive ones [63] |
| 38 | Next-In-Line Effect | COGB-38 | The tendency to experience diminished recall of prior speakers’ words when waiting for one’s turn to speak [41] |
| 39 | Normalcy Bias | COGB-39 | The tendency to underestimate the possibility of disasters, assuming that things will continue as they always have [64] |
| 40 | Optimism Bias | COGB-40 | The tendency to believe that positive events are more likely to happen to oneself while negative events are more likely to happen to others [31] |
| 41 | Overconfidence Bias | COGB-41 | The tendency to overestimate one’s knowledge, abilities, or judgement, leading to poor decision-making [65] |
| 42 | Ownership Bias | COGB-42 | The tendency to overvalue objects simply because they belong to oneself [52] |
| 43 | Peak–End Rule | COGB-43 | The tendency to judge experiences based on how they felt at their peak and end rather than their entire duration [51] |
| 44 | Planning Fallacy | COGB-44 | The tendency to underestimate the time, costs, and risks associated with a task while overestimating the benefits [13] |
| 45 | Primacy Effect | COGB-45 | The tendency to remember the first items in a list better than later items [66] |
| 46 | Priming Bias | COGB-46 | The tendency to be influenced by prior stimuli in decision-making or behaviour without realising it [67] |
| 47 | Pseudo Certainty Effect | COGB-47 | The tendency to assume certainty in situations where the outcome remains unpredictable [68] |
| 48 | Quantity Insensitivity | COGB-48 | The tendency to underestimate the actual amount of an item when making decisions [46] |
| 49 | Recency Bias | COGB-49 | The tendency to give greater weight to recent information than to earlier information [69] |
| 50 | Recency Effect | COGB-50 | The tendency to remember the last items in a list better than earlier items [70] |
| 51 | Reflection Effect | COGB-51 | The tendency to avoid risks when presented with potential gains but seek risks when faced with potential losses [46] |
| 52 | Representativeness | COGB-52 | The tendency to judge probabilities based on how much something resembles a known category rather than on actual data [71] |
| 53 | Rhyme-as-Reason Bias | COGB-53 | The tendency to believe that statements that rhyme are more truthful than those that do not [72] |
| 54 | Risk Compensation | COGB-54 | The tendency to take greater risks when one feels more protected [73] |
| 55 | Rosy Retrospection | COGB-55 | The tendency to remember past events as more positive than they actually were [41] |
| 56 | Routine | COGB-56 | The tendency to favour familiar patterns of behaviour [74] |
| 57 | Self-Serving Bias | COGB-57 | The tendency to attribute successes to personal factors while blaming failures on external factors [75] |
| 58 | Social Desirability Bias | COGB-58 | The tendency to respond in ways that are viewed favourably by others rather than truthfully [76] |
| 59 | Spacing Bias | COGB-59 | The tendency to retain information better when learning is spaced out over time [77] |
| 60 | Status Quo Bias | COGB-60 | The tendency to prefer things to stay the same rather than change, even when alternatives may offer greater benefits [78] |
| 61 | Stereotyping | COGB-61 | The tendency to make generalisations about people based on group characteristics rather than individual traits [41] |
| 62 | Summit Fever | COGB-62 | The tendency to make irrational decisions near the completion of a goal due to heightened motivation [46] |
| 63 | Sunk Cost Fallacy | COGB-63 | The tendency to continue an endeavour because of past investments rather than considering future costs and benefits [79] |
| 64 | Unit Bias | COGB-64 | The tendency to view a single, complete unit—whether food, a task, or a product—as the appropriate amount, regardless of its actual size [80] |
| Code | SLR Frequency | Rank |
|---|---|---|
| COGB-60 | 10 | #1, #2 |
| COGB-12 | 10 | |
| COGB-41 | 9 | #3 |
| COGB-40 | 8 | #4, #5 |
| COGB-03 | 8 | |
| COGB-34 | 7 | #6 |
| COGB-07 | 6 | #7 |
| COGB-25 | 5 | #8 |
| COGB-63 | 4 | #9–#14 |
| COGB-54 | 4 | |
| COGB-29 | 4 | |
| COGB-26 | 4 | |
| COGB-22 | 4 | |
| COGB-08 | 4 | |
| COGB-52 | 3 | #15–#19 |
| COGB-44 | 3 | |
| COGB-42 | 3 | |
| COGB-27 | 3 | |
| COGB-05 | 3 | |
| COGB-58 | 2 | #20–#29 |
| COGB-57 | 2 | |
| COGB-55 | 2 | |
| COGB-51 | 2 | |
| COGB-50 | 2 | |
| COGB-49 | 2 | |
| COGB-43 | 2 | |
| COGB-16 | 2 | |
| COGB-10 | 2 | |
| COGB-02 | 2 | |
| COGB-64 | 1 | #30–#64 |
| COGB-62 | 1 | |
| COGB-61 | 1 | |
| COGB-59 | 1 | |
| COGB-56 | 1 | |
| COGB-53 | 1 | |
| COGB-48 | 1 | |
| COGB-47 | 1 | |
| COGB-46 | 1 | |
| COGB-45 | 1 | |
| COGB-39 | 1 | |
| COGB-38 | 1 | |
| COGB-37 | 1 | |
| COGB-36 | 1 | |
| COGB-35 | 1 | |
| COGB-33 | 1 | |
| COGB-32 | 1 | |
| COGB-31 | 1 | |
| COGB-30 | 1 | |
| COGB-28 | 1 | |
| COGB-24 | 1 | |
| COGB-23 | 1 | |
| COGB-21 | 1 | |
| COGB-20 | 1 | |
| COGB-19 | 1 | |
| COGB-18 | 1 | |
| COGB-17 | 1 | |
| COGB-15 | 1 | |
| COGB-14 | 1 | |
| COGB-13 | 1 | |
| COGB-11 | 1 | |
| COGB-09 | 1 | |
| COGB-06 | 1 | |
| COGB-04 | 1 | |
| COGB-01 | 1 |
| Code | SLR Frequency | Rank |
|---|---|---|
| SFTY-06 | 29 | #1 |
| DCMK-07 | 21 | #2, #3 |
| BHVR-23 | 21 | |
| DCMK-22 | 16 | #4 |
| DCMK-58 | 14 | #5 |
| DCMK-49 | 13 | #6, #7 |
| DCMK-41 | 13 | |
| SFTY-12 | 12 | #8 |
| DCMK-10 | 11 | #9–#11 |
| DCMK-04 | 11 | |
| BHVR-16 | 11 | |
| SFTY-05 | 10 | #12, #13 |
| DCMK-14 | 10 | |
| SFTY-13 | 9 | #14–#22 |
| SFTY-07 | 9 | |
| HLTH-04 | 9 | |
| HLTH-02 | 9 | |
| DCMK-50 | 9 | |
| DCMK-34 | 9 | |
| DCMK-21 | 9 | |
| DCMK-16 | 9 | |
| DCMK-03 | 9 | |
| SFTY-08 | 8 | #23–#29 |
| SFTY-01 | 8 | |
| DCMK-40 | 8 | |
| DCMK-23 | 8 | |
| DCMK-20 | 8 | |
| DCMK-05 | 8 | |
| BHVR-06 | 8 | |
| DCMK-46 | 7 | #30–#36 |
| DCMK-35 | 7 | |
| DCMK-15 | 7 | |
| BHVR-22 | 7 | |
| BHVR-17 | 7 | |
| BHVR-15 | 7 | |
| BHVR-03 | 7 | |
| SFTY-10 | 6 | #37–#40 |
| SFTY-09 | 6 | |
| DCMK-54 | 6 | |
| DCMK-11 | 6 | |
| SFTY-11 | 5 | #41–#49 |
| HLTH-03 | 5 | |
| DCMK-59 | 5 | |
| DCMK-51 | 5 | |
| DCMK-45 | 5 | |
| DCMK-12 | 5 | |
| DCMK-09 | 5 | |
| BHVR-19 | 5 | |
| BHVR-01 | 5 | |
| DCMK-31 | 4 | #50–#56 |
| DCMK-29 | 4 | |
| DCMK-24 | 4 | |
| DCMK-17 | 4 | |
| DCMK-13 | 4 | |
| DCMK-02 | 4 | |
| BHVR-21 | 4 | |
| SFTY-02 | 3 | #57–#71 |
| DCMK-56 | 3 | |
| DCMK-55 | 3 | |
| DCMK-53 | 3 | |
| DCMK-43 | 3 | |
| DCMK-42 | 3 | |
| DCMK-39 | 3 | |
| DCMK-36 | 3 | |
| DCMK-26 | 3 | |
| DCMK-19 | 3 | |
| DCMK-18 | 3 | |
| DCMK-01 | 3 | |
| BHVR-08 | 3 | |
| BHVR-07 | 3 | |
| BHVR-05 | 3 | |
| SFTY-03 | 2 | #72–#85 |
| HLTH-01 | 2 | |
| DCMK-57 | 2 | |
| DCMK-52 | 2 | |
| DCMK-38 | 2 | |
| DCMK-33 | 2 | |
| DCMK-32 | 2 | |
| DCMK-30 | 2 | |
| DCMK-27 | 2 | |
| DCMK-25 | 2 | |
| DCMK-06 | 2 | |
| BHVR-20 | 2 | |
| BHVR-09 | 2 | |
| BHVR-04 | 2 | |
| SFTY-04 | 1 | #86–#100 |
| DCMK-48 | 1 | |
| DCMK-47 | 1 | |
| DCMK-44 | 1 | |
| DCMK-37 | 1 | |
| DCMK-28 | 1 | |
| DCMK-08 | 1 | |
| BHVR-24 | 1 | |
| BHVR-18 | 1 | |
| BHVR-14 | 1 | |
| BHVR-13 | 1 | |
| BHVR-12 | 1 | |
| BHVR-11 | 1 | |
| BHVR-10 | 1 | |
| BHVR-02 | 1 |
| Code | Total Degree | Degree of Centrality | Rank |
|---|---|---|---|
| SFTY-06 | 37 | 1.00000 | #1 |
| DCMK-35 | 17 | 0.45946 | #2, #3 |
| DCMK-07 | 17 | 0.45946 | |
| BHVR-23 | 16 | 0.43243 | #4 |
| SFTY-05 | 15 | 0.40541 | #5 |
| SFTY-13 | 13 | 0.35135 | #6 |
| COGB-41 | 12 | 0.32432 | #7, #8 |
| COGB-40 | 12 | 0.32432 | |
| DCMK-12 | 11 | 0.29730 | #9–#11 |
| DCMK-10 | 11 | 0.29730 | |
| BHVR-17 | 11 | 0.29730 | |
| DCMK-49 | 10 | 0.27027 | #12, #13 |
| DCMK-21 | 10 | 0.27027 | |
| HLTH-04 | 9 | 0.24324 | #14–#23 |
| HLTH-03 | 9 | 0.24324 | |
| HLTH-02 | 9 | 0.24324 | |
| DCMK-58 | 9 | 0.24324 | |
| DCMK-05 | 9 | 0.24324 | |
| DCMK-04 | 9 | 0.24324 | |
| COGB-54 | 9 | 0.24324 | |
| COGB-12 | 9 | 0.24324 | |
| BHVR-16 | 9 | 0.24324 | |
| BHVR-15 | 9 | 0.24324 | |
| SFTY-08 | 8 | 0.21622 | #24–#28 |
| DCMK-11 | 8 | 0.21622 | |
| COGB-60 | 8 | 0.21622 | |
| BHVR-22 | 8 | 0.21622 | |
| BHVR-06 | 8 | 0.21622 | |
| SFTY-10 | 7 | 0.18919 | #29–#32 |
| SFTY-09 | 7 | 0.18919 | |
| DCMK-20 | 7 | 0.18919 | |
| COGB-42 | 7 | 0.18919 | |
| SFTY-07 | 6 | 0.16216 | #33–#37 |
| DCMK-56 | 6 | 0.16216 | |
| DCMK-50 | 6 | 0.16216 | |
| DCMK-02 | 6 | 0.16216 | |
| BHVR-21 | 6 | 0.16216 | |
| DCMK-46 | 5 | 0.13514 | #38–#45 |
| DCMK-40 | 5 | 0.13514 | |
| DCMK-17 | 5 | 0.13514 | |
| DCMK-14 | 5 | 0.13514 | |
| DCMK-03 | 5 | 0.13514 | |
| BHVR-20 | 5 | 0.13514 | |
| BHVR-19 | 5 | 0.13514 | |
| BHVR-09 | 5 | 0.13514 | |
| DCMK-55 | 4 | 0.10811 | #46–#57 |
| DCMK-53 | 4 | 0.10811 | |
| DCMK-52 | 4 | 0.10811 | |
| DCMK-51 | 4 | 0.10811 | |
| DCMK-45 | 4 | 0.10811 | |
| DCMK-43 | 4 | 0.10811 | |
| DCMK-41 | 4 | 0.10811 | |
| DCMK-29 | 4 | 0.10811 | |
| DCMK-22 | 4 | 0.10811 | |
| DCMK-16 | 4 | 0.10811 | |
| DCMK-13 | 4 | 0.10811 | |
| BHVR-03 | 4 | 0.10811 | |
| SFTY-12 | 3 | 0.08108 | #58–#71 |
| DCMK-59 | 3 | 0.08108 | |
| DCMK-48 | 3 | 0.08108 | |
| DCMK-36 | 3 | 0.08108 | |
| DCMK-34 | 3 | 0.08108 | |
| DCMK-33 | 3 | 0.08108 | |
| DCMK-26 | 3 | 0.08108 | |
| DCMK-23 | 3 | 0.08108 | |
| DCMK-19 | 3 | 0.08108 | |
| COGB-55 | 3 | 0.08108 | |
| COGB-51 | 3 | 0.08108 | |
| COGB-50 | 3 | 0.08108 | |
| COGB-34 | 3 | 0.08108 | |
| COGB-29 | 3 | 0.08108 | |
| SFTY-11 | 2 | 0.05405 | #72–#95 |
| SFTY-04 | 2 | 0.05405 | |
| SFTY-03 | 2 | 0.05405 | |
| SFTY-02 | 2 | 0.05405 | |
| DCMK-57 | 2 | 0.05405 | |
| DCMK-42 | 2 | 0.05405 | |
| DCMK-38 | 2 | 0.05405 | |
| DCMK-30 | 2 | 0.05405 | |
| DCMK-25 | 2 | 0.05405 | |
| DCMK-24 | 2 | 0.05405 | |
| DCMK-18 | 2 | 0.05405 | |
| DCMK-15 | 2 | 0.05405 | |
| DCMK-01 | 2 | 0.05405 | |
| COGB-45 | 2 | 0.05405 | |
| COGB-44 | 2 | 0.05405 | |
| COGB-35 | 2 | 0.05405 | |
| COGB-25 | 2 | 0.05405 | |
| COGB-22 | 2 | 0.05405 | |
| COGB-06 | 2 | 0.05405 | |
| COGB-03 | 2 | 0.05405 | |
| BHVR-10 | 2 | 0.05405 | |
| BHVR-08 | 2 | 0.05405 | |
| BHVR-02 | 2 | 0.05405 | |
| BHVR-01 | 2 | 0.05405 | |
| SFTY-01 | 1 | 0.02703 | #96–#127 |
| DCMK-47 | 1 | 0.02703 | |
| DCMK-44 | 1 | 0.02703 | |
| DCMK-39 | 1 | 0.02703 | |
| DCMK-31 | 1 | 0.02703 | |
| DCMK-28 | 1 | 0.02703 | |
| DCMK-27 | 1 | 0.02703 | |
| DCMK-08 | 1 | 0.02703 | |
| DCMK-06 | 1 | 0.02703 | |
| COGB-63 | 1 | 0.02703 | |
| COGB-57 | 1 | 0.02703 | |
| COGB-52 | 1 | 0.02703 | |
| COGB-49 | 1 | 0.02703 | |
| COGB-46 | 1 | 0.02703 | |
| COGB-43 | 1 | 0.02703 | |
| COGB-39 | 1 | 0.02703 | |
| COGB-37 | 1 | 0.02703 | |
| COGB-28 | 1 | 0.02703 | |
| COGB-26 | 1 | 0.02703 | |
| COGB-18 | 1 | 0.02703 | |
| COGB-14 | 1 | 0.02703 | |
| COGB-13 | 1 | 0.02703 | |
| COGB-08 | 1 | 0.02703 | |
| COGB-05 | 1 | 0.02703 | |
| COGB-02 | 1 | 0.02703 | |
| BHVR-24 | 1 | 0.02703 | |
| BHVR-18 | 1 | 0.02703 | |
| BHVR-14 | 1 | 0.02703 | |
| BHVR-13 | 1 | 0.02703 | |
| BHVR-11 | 1 | 0.02703 | |
| BHVR-07 | 1 | 0.02703 | |
| BHVR-04 | 1 | 0.02703 |
| Code | Number of Loops | Rank |
|---|---|---|
| SFTY-06 | 6 | #1 |
| DCMK-14 | 3 | #2–#6 |
| COGB-40 | 3 | |
| BHVR-22 | 3 | |
| BHVR-17 | 3 | |
| DCMK-19 | 3 | |
| DCMK-04 | 2 | #7–#17 |
| DCMK-46 | 2 | |
| BHVR-16 | 2 | |
| DCMK-22 | 2 | |
| COGB-41 | 2 | |
| COGB-29 | 2 | |
| SFTY-07 | 2 | |
| HLTH-02 | 2 | |
| COGB-12 | 2 | |
| DCMK-02 | 2 | |
| COGB-54 | 2 | |
| DCMK-23 | 1 | #18–#31 |
| DCMK-07 | 1 | |
| DCMK-35 | 1 | |
| BHVR-23 | 1 | |
| SFTY-05 | 1 | |
| COGB-60 | 1 | |
| DCMK-20 | 1 | |
| BHVR-06 | 1 | |
| BHVR-21 | 1 | |
| DCMK-53 | 1 | |
| DCMK-55 | 1 | |
| DCMK-03 | 1 | |
| HLTH-03 | 1 | |
| BHVR-02 | 1 |
| No. | Cycle | Positive/Negative Impact on H&S | Unit Weight | Rank Unit Weight | Centrality Weight | Rank Centrality Weight |
|---|---|---|---|---|---|---|
| 1 | SFTY-05 → SFTY-06 → SFTY-05 | Positive | 2 | #1–#3 | 1.405405405 | #1 |
| 2 | BHVR-16 → COGB-60 → BHVR-16 | Positive | 2 | 0.4594594595 | #3 | |
| 3 | DCMK-14 → DCMK-22 → BHVR-22 → DCMK-19 → DCMK-14 | Positive | 2 | 0.3783783784 | #4 | |
| 4 | DCMK-23 → DCMK-04 → HLTH-02 → DCMK-02 → DCMK-03 → BHVR-22 → DCMK-19 → DCMK-14 → COGB-12 → DCMK-23 | Positive | 1 | #4, #5 | 0.2972972973 | #5 |
| 5 | DCMK-14 → COGB-12 → DCMK-22 → BHVR-22 → DCMK-19 → DCMK-14 | Positive | 1 | 0.1351351351 | #6 | |
| 6 | DCMK-46 → SFTY-06 → DCMK-46 | Positive | 0 | #6, #7 | 0.8648648649 | #2 |
| 7 | BHVR-16 → DCMK-20 → DCMK-07 → DCMK-53 → BHVR-16 | Negative | 0 | −0.2972972973 | #8 | |
| 8 | BHVR-06 → HLTH-03 → DCMK-04 → HLTH-02 → DCMK-02 → BHVR-06 | Negative | −1 | #8–#10 | −0.1351351351 | #7 |
| 9 | DCMK-46 → DCMK-35 → BHVR-21 → BHVR-17 → SFTY-06 → DCMK-46 | Negative | −1 | −0.5405405405 | #10 | |
| 10 | COGB-54 → SFTY-06 → SFTY-07 → COGB-54 | Negative | −1 | −0.9189189189 | #14 | |
| 11 | COGB-40 → COGB-29 → COGB-40 | Negative | −2 | #11–#14 | −0.4054054054 | #9 |
| 12 | COGB-41 → COGB-40 → COGB-41 | Negative | −2 | −0.6486486486 | #12 | |
| 13 | COGB-54 → BHVR-17 → SFTY-06 → SFTY-07 → COGB-54 | Negative | −2 | −1.108108108 | #15 | |
| 14 | SFTY-06 → BHVR-17 → SFTY-06 | Negative | −2 | −1.297297297 | #16 | |
| 15 | BHVR-23 → DCMK-55 → BHVR-02 → BHVR-23 | Negative | −3 | #15, #16 | −0.5945945946 | #11 |
| 16 | COGB-41 → COGB-40 → COGB-29 → COGB-41 | Negative | −3 | −0.7297297297 | #13 |
| Code | SLR | Rank | Code | Degree of Centrality | Rank | Code | Number of Loops | Rank |
|---|---|---|---|---|---|---|---|---|
| SFTY-06 | 29 | 1 | SFTY-06 | 1.00000 | 1 | SFTY-06 | 6 | 1 |
| DCMK-07 | 21 | 2 | DCMK-35 | 0.45946 | 2 | DCMK-14 | 3 | 2 |
| BHVR-23 | 21 | 2 | DCMK-07 | 0.45946 | 2 | COGB-40 | 3 | 2 |
| DCMK-22 | 16 | 4 | BHVR-23 | 0.43243 | 4 | BHVR-22 | 3 | 2 |
| DCMK-58 | 14 | 5 | SFTY-05 | 0.40541 | 5 | BHVR-17 | 3 | 2 |
| DCMK-49 | 13 | 6 | SFTY-13 | 0.35135 | 6 | DCMK-19 | 3 | 2 |
| DCMK-41 | 13 | 6 | COGB-41 | 0.32432 | 7 | DCMK-04 | 2 | 7 |
| SFTY-12 | 12 | 8 | COGB-40 | 0.32432 | 7 | DCMK-46 | 2 | 7 |
| DCMK-10 | 11 | 9 | DCMK-12 | 0.29730 | 9 | BHVR-16 | 2 | 7 |
| DCMK-04 | 11 | 9 | DCMK-10 | 0.29730 | 9 | DCMK-22 | 2 | 7 |
| BHVR-16 | 11 | 9 | BHVR-17 | 0.29730 | 9 | COGB-41 | 2 | 7 |
| COGB-29 | 2 | 7 | ||||||
| SFTY-07 | 2 | 7 | ||||||
| HLTH-02 | 2 | 7 | ||||||
| COGB-12 | 2 | 7 | ||||||
| DCMK-02 | 2 | 7 | ||||||
| COGB-54 | 2 | 7 |
| Code | SLR | Rank | Code | Degree of Centrality | Rank | Code | Number of Loops | Rank |
|---|---|---|---|---|---|---|---|---|
| COGB-60 | 10 | 1 | SFTY-06 | 1.00000 | 1 | SFTY-06 | 6 | 1 |
| COGB-12 | 10 | 2 | DCMK-35 | 0.45946 | 2 | DCMK-14 | 3 | 2 |
| COGB-41 | 9 | 2 | DCMK-07 | 0.45946 | 2 | COGB-40 | 3 | 2 |
| COGB-40 | 8 | 4 | BHVR-23 | 0.43243 | 4 | BHVR-22 | 3 | 2 |
| COGB-03 | 8 | 5 | SFTY-05 | 0.40541 | 5 | BHVR-17 | 3 | 2 |
| COGB-34 | 7 | 6 | SFTY-13 | 0.35135 | 6 | DCMK-19 | 3 | 2 |
| COGB-07 | 6 | 6 | COGB-41 | 0.32432 | 7 | DCMK-04 | 2 | 7 |
| COGB-25 | 5 | 8 | COGB-40 | 0.32432 | 7 | DCMK-46 | 2 | 7 |
| COGB-63 | 4 | 9 | DCMK-12 | 0.29730 | 9 | BHVR-16 | 2 | 7 |
| COGB-54 | 4 | 9 | DCMK-10 | 0.29730 | 9 | DCMK-22 | 2 | 7 |
| COGB-29 | 4 | 9 | BHVR-17 | 0.29730 | 9 | COGB-41 | 2 | 7 |
| COGB-26 | 4 | 9 | COGB-29 | 2 | 7 | |||
| COGB-22 | 4 | 9 | SFTY-07 | 2 | 7 | |||
| COGB-08 | 4 | 9 | HLTH-02 | 2 | 7 | |||
| COGB-12 | 2 | 7 | ||||||
| DCMK-02 | 2 | 7 | ||||||
| COGB-54 | 2 | 7 |
Disclaimer/Publisher’s Note: The statements, opinions and data contained in all publications are solely those of the individual author(s) and contributor(s) and not of MDPI and/or the editor(s). MDPI and/or the editor(s) disclaim responsibility for any injury to people or property resulting from any ideas, methods, instructions or products referred to in the content. |
© 2025 by the authors. Licensee MDPI, Basel, Switzerland. This article is an open access article distributed under the terms and conditions of the Creative Commons Attribution (CC BY) license (https://creativecommons.org/licenses/by/4.0/).
Share and Cite
Purushothaman, M.B.; Jessica, P.; Rotimi, F.E. Analysis of Cognitive Biases in Construction Health and Safety in New Zealand. Buildings 2025, 15, 1033. https://doi.org/10.3390/buildings15071033
Purushothaman MB, Jessica P, Rotimi FE. Analysis of Cognitive Biases in Construction Health and Safety in New Zealand. Buildings. 2025; 15(7):1033. https://doi.org/10.3390/buildings15071033
Chicago/Turabian StylePurushothaman, Mahesh Babu, Pricilia Jessica, and Funmilayo Ebun Rotimi. 2025. "Analysis of Cognitive Biases in Construction Health and Safety in New Zealand" Buildings 15, no. 7: 1033. https://doi.org/10.3390/buildings15071033
APA StylePurushothaman, M. B., Jessica, P., & Rotimi, F. E. (2025). Analysis of Cognitive Biases in Construction Health and Safety in New Zealand. Buildings, 15(7), 1033. https://doi.org/10.3390/buildings15071033