Review

Systematic Exploration of the Effect of Urban Green Space on Land Surface Temperature: A Scientometric Analysis

1
Department of Landscape Architecture, Central South University of Forestry and Technology, Changsha 410004, China
2
Engineering Technology Research Centre of Big Data for Landscape Resources in Nature Protected Areas of Hunan Province, Changsha 410004, China
*
Author to whom correspondence should be addressed.
Buildings 2025, 15(7), 1032; https://doi.org/10.3390/buildings15071032
Submission received: 25 February 2025 / Revised: 18 March 2025 / Accepted: 20 March 2025 / Published: 24 March 2025
(This article belongs to the Section Architectural Design, Urban Science, and Real Estate)

Abstract

:
Urban green spaces (UGSs) are crucial for mitigating land surface temperature (LST) in the context of climate change and extremely high temperatures. Although numerous studies have explored the impact of UGSs on the LST, a systematic understanding of the research scope, knowledge network structure, data sources, main methods, and frontier trends in this field is lacking. In this study, 740 documents were retrieved from the Web of Science database, and the hotspots, trends, and frontiers of the impact of UGSs on LST were analyzed using scientometric analysis and CiteSpace 6.2.R4 software. The results revealed that the annual number of publications and citations in this field has increased consistently, with rapid growth from 2019 to 2024. However, the communication and dissemination of research findings were hindered by the lack of efficient international collaboration networks of academic institutions and authors, highlighting the need for more vigorous global academic exchanges and cooperation. Additionally, the eight identified research clusters extracted from literature keywords, covering remote sensing, urban green infrastructure, landscape patterns, spatial regression analysis, threshold values of efficiency, etc., have established a specific research knowledge structure, content system, and methodology. Furthermore, enhancing multi-disciplinary integration and incorporating practical case analysis will improve research accuracy and applicability and facilitate the translation of theoretical findings into practical applications. This study provided a comprehensive overview of current research on the impact of UGSs on LST and offered valuable guidance for studying urban thermal comfort and sustainable development in the future.

1. Introduction

According to the IPCC, the climate crisis is one of the most significant and challenging issues to humanity. Global urbanization is advancing, and the urbanization rate increased from 56% to 68% in 2021 [1]. Urban expansion causes the urban heat island (UHI) effect [2]. Urbanization has altered the natural appearance of urban land, replacing natural landscape with extensive impermeable surfaces and transforming it to an urban environment, changing the thermal characteristics of the urban surface, and increasing the intensity and scope of the UHI effect [3]. This has resulted in excessive use of energy and water resources, deteriorating air quality, limited plant growth, reduced biodiversity, and health risks to humans [4]. The global surface temperature increased by 1.1 °C between 2011 and 2020 compared to 1850–1900. The frequencies of heat waves are expected to increase by factors of 4.1, 5.6, and 9.4 and their intensities by factors of 1.9, 2.6, and 5.1 °C for average temperature increases of 1.5, 2, and 4 °C, respectively [5]. For each degree of increase in ambient urban temperature, cooling buildings will consume an additional 8.5% of electrical energy [6]. In addition to causing a series of climate change problems, urbanization has become a global public health concern owing to high summer temperatures and frequent heat waves. Nearly half of the global poor are affected by high temperatures [7]. Frequent extreme heat events increase disease morbidity, mortality, and health risks for urban residents [8,9], with 30 and 14% increases in deaths in high-temperature heat wave years compared to non-high-temperature heatwave years, respectively [10]. Therefore, as LST threatens urban ecology [11], human health [12], and well-being, urban surface thermal environments have become a research focus in many related fields, such as urban climatology, urban ecology, urban planning, and urban geography, worldwide [13,14].
LST refers to the radiant skin temperature of the surface, which is the actual temperature of the Earth’s surface [15]. The main contributors to LST are anthropogenic heat sources, including industrial activity, human metabolism, vehicle exhaust emissions, and a reduction in the offsetting potential of urban forests [16]. LST is a key parameter for understanding and responding to climate change, the UHI effect, land/atmosphere feedback, fire monitoring, land cover mapping and change detection, geomorphological studies, crop management, and water management [17]. UGSs are one of the fundamental components of the urban environment and land use type, with natural or semi-natural conditions within the city playing an essential role in preserving the urban ecosystem [18]. Plants in UGSs can significantly lower temperatures by absorbing heat from their surroundings through evapotranspiration, absorbing carbon dioxide through photosynthesis, and protecting areas from solar radiation via tree canopies [19]. Increasing UGSs or vegetation cover in urban areas mitigates the UHI effect [3,20]. Thus, to combat climate change, in-depth research on the relationship between UGSs and LST and the optimization of the layout of UGSs to enhance its cooling efficacy are crucial, given the limited nature of urban land resources and the constraints on UGS expansion.
In recent years, researchers have extensively studied the impact of UGSs on LST (e.g., GS patch configuration, shape, density, boundary, aggregation, dispersion, and edge effect) [21,22], the cooling effect (CE) of UGSs (e.g., the contribution of UGSs to LST, moderating effect on microclimate, threshold size, and seasonal variation) [23,24,25], and the interaction between UGSs and other urban elements and LST [26,27]. Numerous studies involving a broad range of research techniques, indicators, scales, and areas have been published. Some review papers have also been published. For example, Gago et al. systematically reviewed the research progress of the UHI effect, analyzed the impacts of urban form, land use, and building characteristics on local air temperature, and discussed mitigation strategies in terms of GS optimization, surface albedo enhancement, and urban design adjustments, emphasizing the importance of scientific planning for energy conservation and emission reduction [28]. Yu et al. conducted a systematic compendium of studies on the CE of water bodies, GSs, and parks, pointing out that previous studies have mainly focused on the correlation between different landscape types and temperature changes, as well as quantitative analyses of cooling intensity [29]. However, despite extensive research, a systematic understanding of the impact of UGSs on LST has not yet been achieved. Existing studies have focused on a single aspect of the field because of the diverse characteristic attributes of UGSs and the various research methods. Presenting the development trajectory, trend evolution, and future research directions of the CE of UGSs is challenging. The lack of systematic reviews and meta-analyses not only hinders the understanding of the impact of UGSs on LST but is also detrimental to the planning of GS systems and the formulation of urban construction strategies to enhance urban thermal comfort. Moreover, it is not conducive to effectively implementing climate change mitigation measures. Therefore, a systematic review of the CE of UGSs and the quantification of its impact on LST is of great significance. This can enhance our understanding of the ecosystem service value of UGSs, optimize the spatial layout of UGSs, improve the construction of urban green infrastructure (UGI), and enhance the structural composition of plant communities in UGSs. These efforts are essential for promoting the green and sustainable development of cities. However, a systematic understanding of the impact of UGSs on LST has not yet been established owing to the existing research scope, knowledge network structure, data sources, primary research methodologies and contents, and cutting-edge dynamics. To address these shortcomings, this study scientometrically analyzed previous academic publications to provide a thorough overview of the historical development, current trends and research clusters, and future research directions of the effect of UGSs on LST.
Scientific knowledge mapping is a new technique for data mining and analyzing vast amounts of literature owing to rapid advancements in computer science, metrological science, and information visualization technology [30]. The scientometric software CiteSpace effectively avoids subjective judgment while qualitatively and quantitatively analyzing the progress of a particular research field based on citation relationships, co-occurrence relationships, time series, and other information characteristics of the literature by visualizing the relationship between the literature and research trends through scientific knowledge mapping. Compared with traditional review methods, scientometric analysis has advantages in capturing and processing large amounts of literature information, providing a more accurate and reliable explanation of the developmental pulse of the research field [31,32]. Therefore, this study was based on scientometric analysis, and CiteSpace software was used to qualitatively and quantitatively analyze the hotspots, trends, and fronts in the field of research on the impact of UGSs on LST. This was performed to gain a more thorough understanding of the scope, development stage, and characteristics of the research on the impact of UGSs on LST, to identify the research hotspots and future directions, and to compensate for research deficiencies.
The main aims of this study include the following:
(1)
Quantitatively and qualitatively examine the publication characteristics of UGSs and LST research, revealing research trends and shifts in public and researcher attention;
(2)
Examine the contributions and collaboration patterns among nations, institutions, and authors of the published literature, uncover global patterns of academic cooperation and knowledge dissemination routes, and offer a guide for research cooperation;
(3)
To reveal the core concepts and research hotspots in the field, as well as the correlation between them, through high-frequency and high-medium centrality keyword clustering analyses, and to explore the knowledge structure, evolutionary history, research direction, research scope, and trends of research hotspots of the influence of UGSs on LST;
(4)
To systematically summarize the key influencing factors that affect the CE of UGS, parameters and thresholds to provide scientific basis for urban planning and climate adaptation strategies.
The results of this study can provide a complete and objective perspective for understanding the influence of UGSs on LST and, at the same time, predict the development trend and hot areas of future research and motivating novel research concepts. Furthermore, this study can help achieve more effective urban ecological environmental management and sustainable development strategies by offering a scientific foundation for decision-making related to urban planning and management.

2. Materials and Methods

2.1. Data Collection

The Web of Science Core Collection (hereinafter referred to as WOS) was the data source and was searched on 10 March 2025. The search mode of ‘subject’ combined with ‘document type’ was adopted. The search formula was TS = (urban green space) AND TS = (land surface temperature); the language of the document was limited to ‘English’; the type was limited to ‘Article’; and the year of publication was set to before 2025. In total, 893 pieces of related research were retrieved. To ensure the relevance and validity of the literature, two types of articles were removed:
(1)
Articles that do not address both urban green spaces (UGS) and land surface temperature (LST).
(2)
Articles that deviate from the core theme of our study. These include studies focusing on topics such as the impact of anthropogenic disturbance and urban spatial patterns on LST, the impact of the thermal environment on disease, the impact of green space on house prices, and other topics unrelated to the impact of UGSs on LST.
After manual screening, 740 original documents were saved as plain text in the form of full-text records and references cited for scientometric analysis.

2.2. Data Analyses Methods

CiteSpace is a quantitative scientometric visualization and analysis tool created by Chen et al. using Java programming [33]. CiteSpace can visualize substantial scientific information; identify the key literature, research hotspots, and development trends in a particular scientific field; and reveal the collaborative relationship between authors and the association between keywords through co-authorship, co-wording, and cluster analysis. Each node in the created network graph represents an item (such as authors or keywords), the size of which indicates how frequently an item occurs, and the connecting line between two nodes shows how these two nodes are correlated. CiteSpace can construct a broad framework for a research domain and reveal its macro-level knowledge structure and research hotspots. However, its analytical outcomes primarily focus on overall trends and the interconnections of knowledge, making it difficult to delve into each research topic’s specific methods and conclusions. Therefore, when reviewing research topics, it is still necessary to extensively read the original literature to accurately reconstruct the research methods, data sources, experimental designs, and conclusions.
Based on the literature on UGSs and LST in the WOS database, the CiteSpace scientometric analysis tool was used to analyze the relevant literature metrologically, form a corresponding knowledge map, and identify the knowledge structure and core research content of the research field. WOS was used to export citation reports to analyze the annual trends in the annual number of publications and citations, and the literature was imported into CiteSpace (6.2. R4). Collaborative network analyses of countries, institutions, and authors were performed with a time slice of one year to identify the collaboration between countries, institutions, and authors. Finally, keyword co-occurrence and clustering and emergent word analyses were performed to identify hotspots and trends (Figure 1). To prevent certain keywords from influencing the outcomes, similar keywords were combined, such as “land surface temperature” and “land surface temperature (LST)”; “heat island”, “urban heat island” and “urban heat island (UHI)”; and “green space”, “green area”, “urban green space”, and “urban greenspace”.

3. Results and Discussion

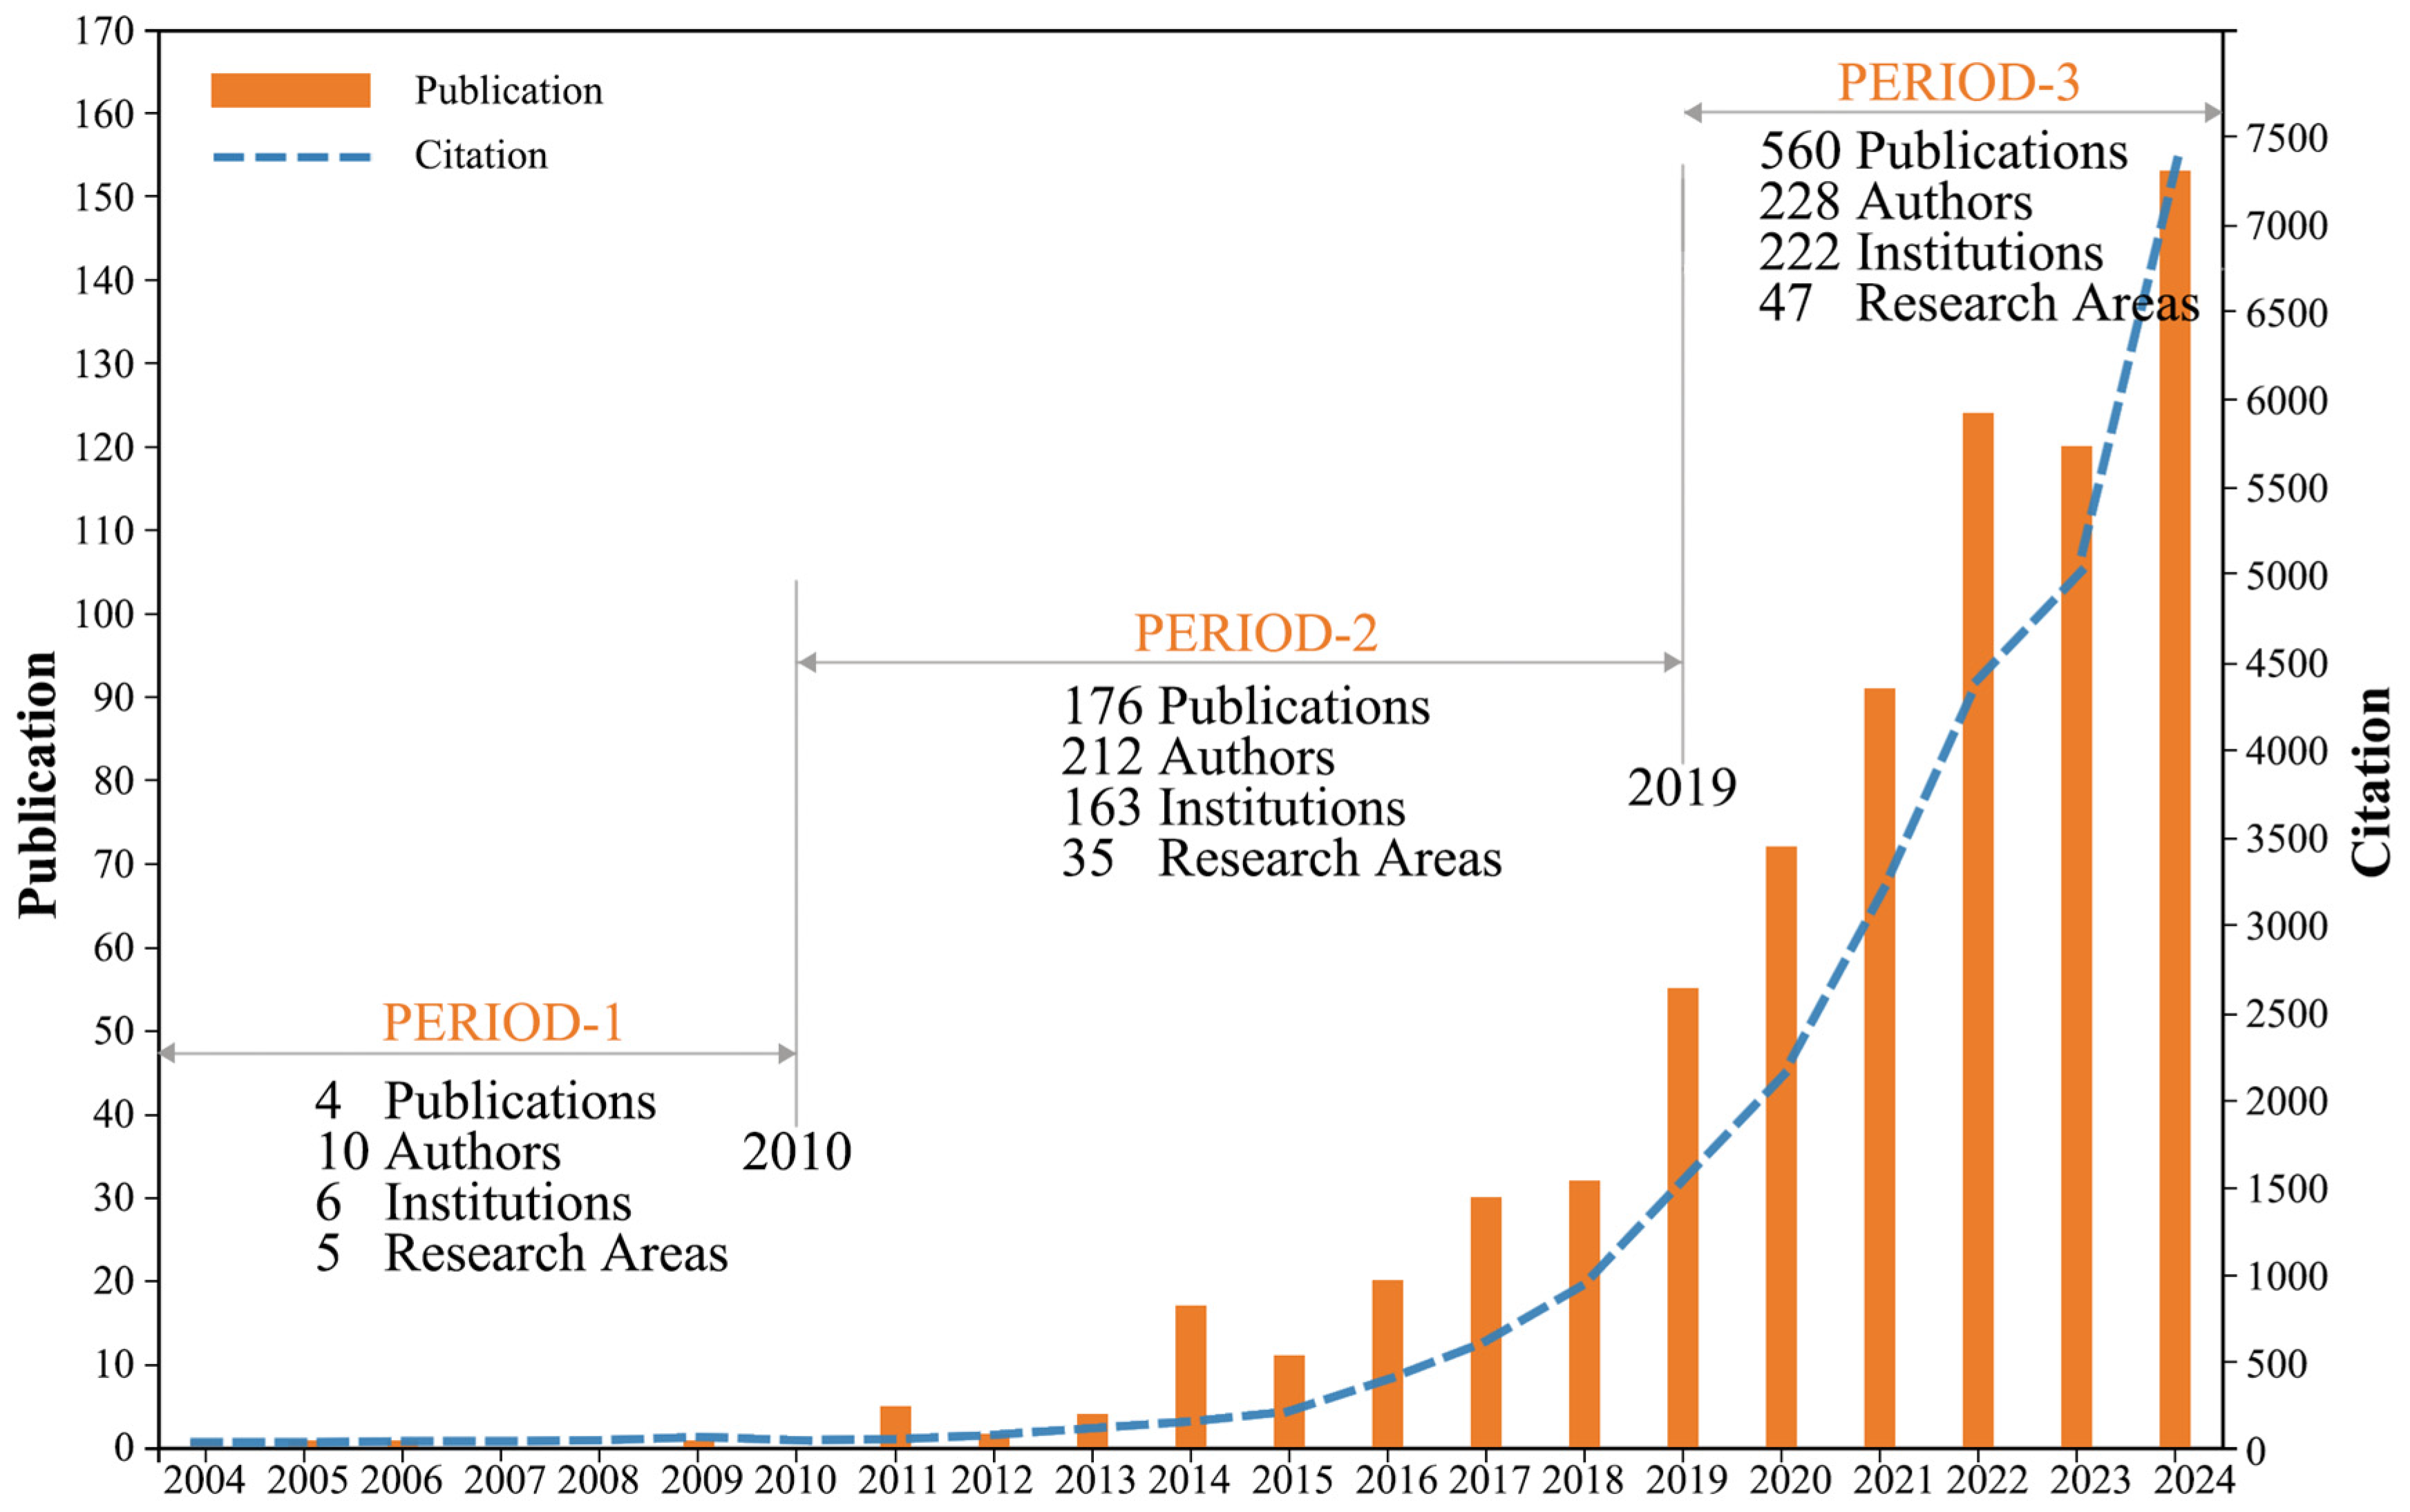
3.1. Analysis of Annual Trends in the Number of Publications and Citations

The annual publications, authors, and research areas in the fields of UGSs and LST exhibited an overall higher trend from 2004 to 2024 (Figure 2), indicating growing interest in the field among the public and academic community. In 2011 and 2014, there was a surge in the number of published papers, which may be attributed to policy direction, in-depth and refined research methodology, increasing attention from researchers to the UHI effect, and increasing urbanization. Between 2004 and 2024, there were 26,087 citations, with an average of 35.25 citations per article. The total number of citations increased yearly, indicating that the research results in this field are recognized and referred to by more and more scholars, and the influence is expanding. Moreover, the research field is becoming increasingly active, attracting the attention and participation of more researchers.
The research process was loosely categorized into three stages based on changes in the annual number of published articles. In the first stage, the budding stage (2004–2010), the research received less attention. The number of annual publications was minimal, with ≤1 publication yearly, which were mainly related to the relationship between LST and vegetation [3], the relationship between LST and the temporal dynamics of land use and land cover [34], and a preliminary analysis of the reasons for changes in LST [35]. Limited academic attention was paid to the environment and UGSs at this stage. The second stage, the preliminary development stage (2011–2018), saw the gradual emergence of environmental issues and recognition of the importance of its study. Consequently, the number of articles published increased annually until it suddenly reached 17 in 2014, and the CE of UGSs gained more attention. The third stage (2019–2024) was the rapid development stage, during which the number of publications and citations increased rapidly. In 2019, Europe, Africa, and South America experienced the hottest June on record, the rate of warming in the Northern Hemisphere accelerated, and an ‘exceptional’ heat wave hit the globe [36], prompting close global attention to mitigating urban thermal environments. Numerous studies were conducted in various sectors, and the scope and depth of research increased. The number of citations has increased significantly relative to the previous two phases. The most publications and the most significant increase in citations were in 2024, with 153 publications and 7320 citations. This shows that the research field continues to receive attention. The research boom has not abated and shows great potential for the future.

3.2. Knowledge Contribution and Collaborative Network Analysis

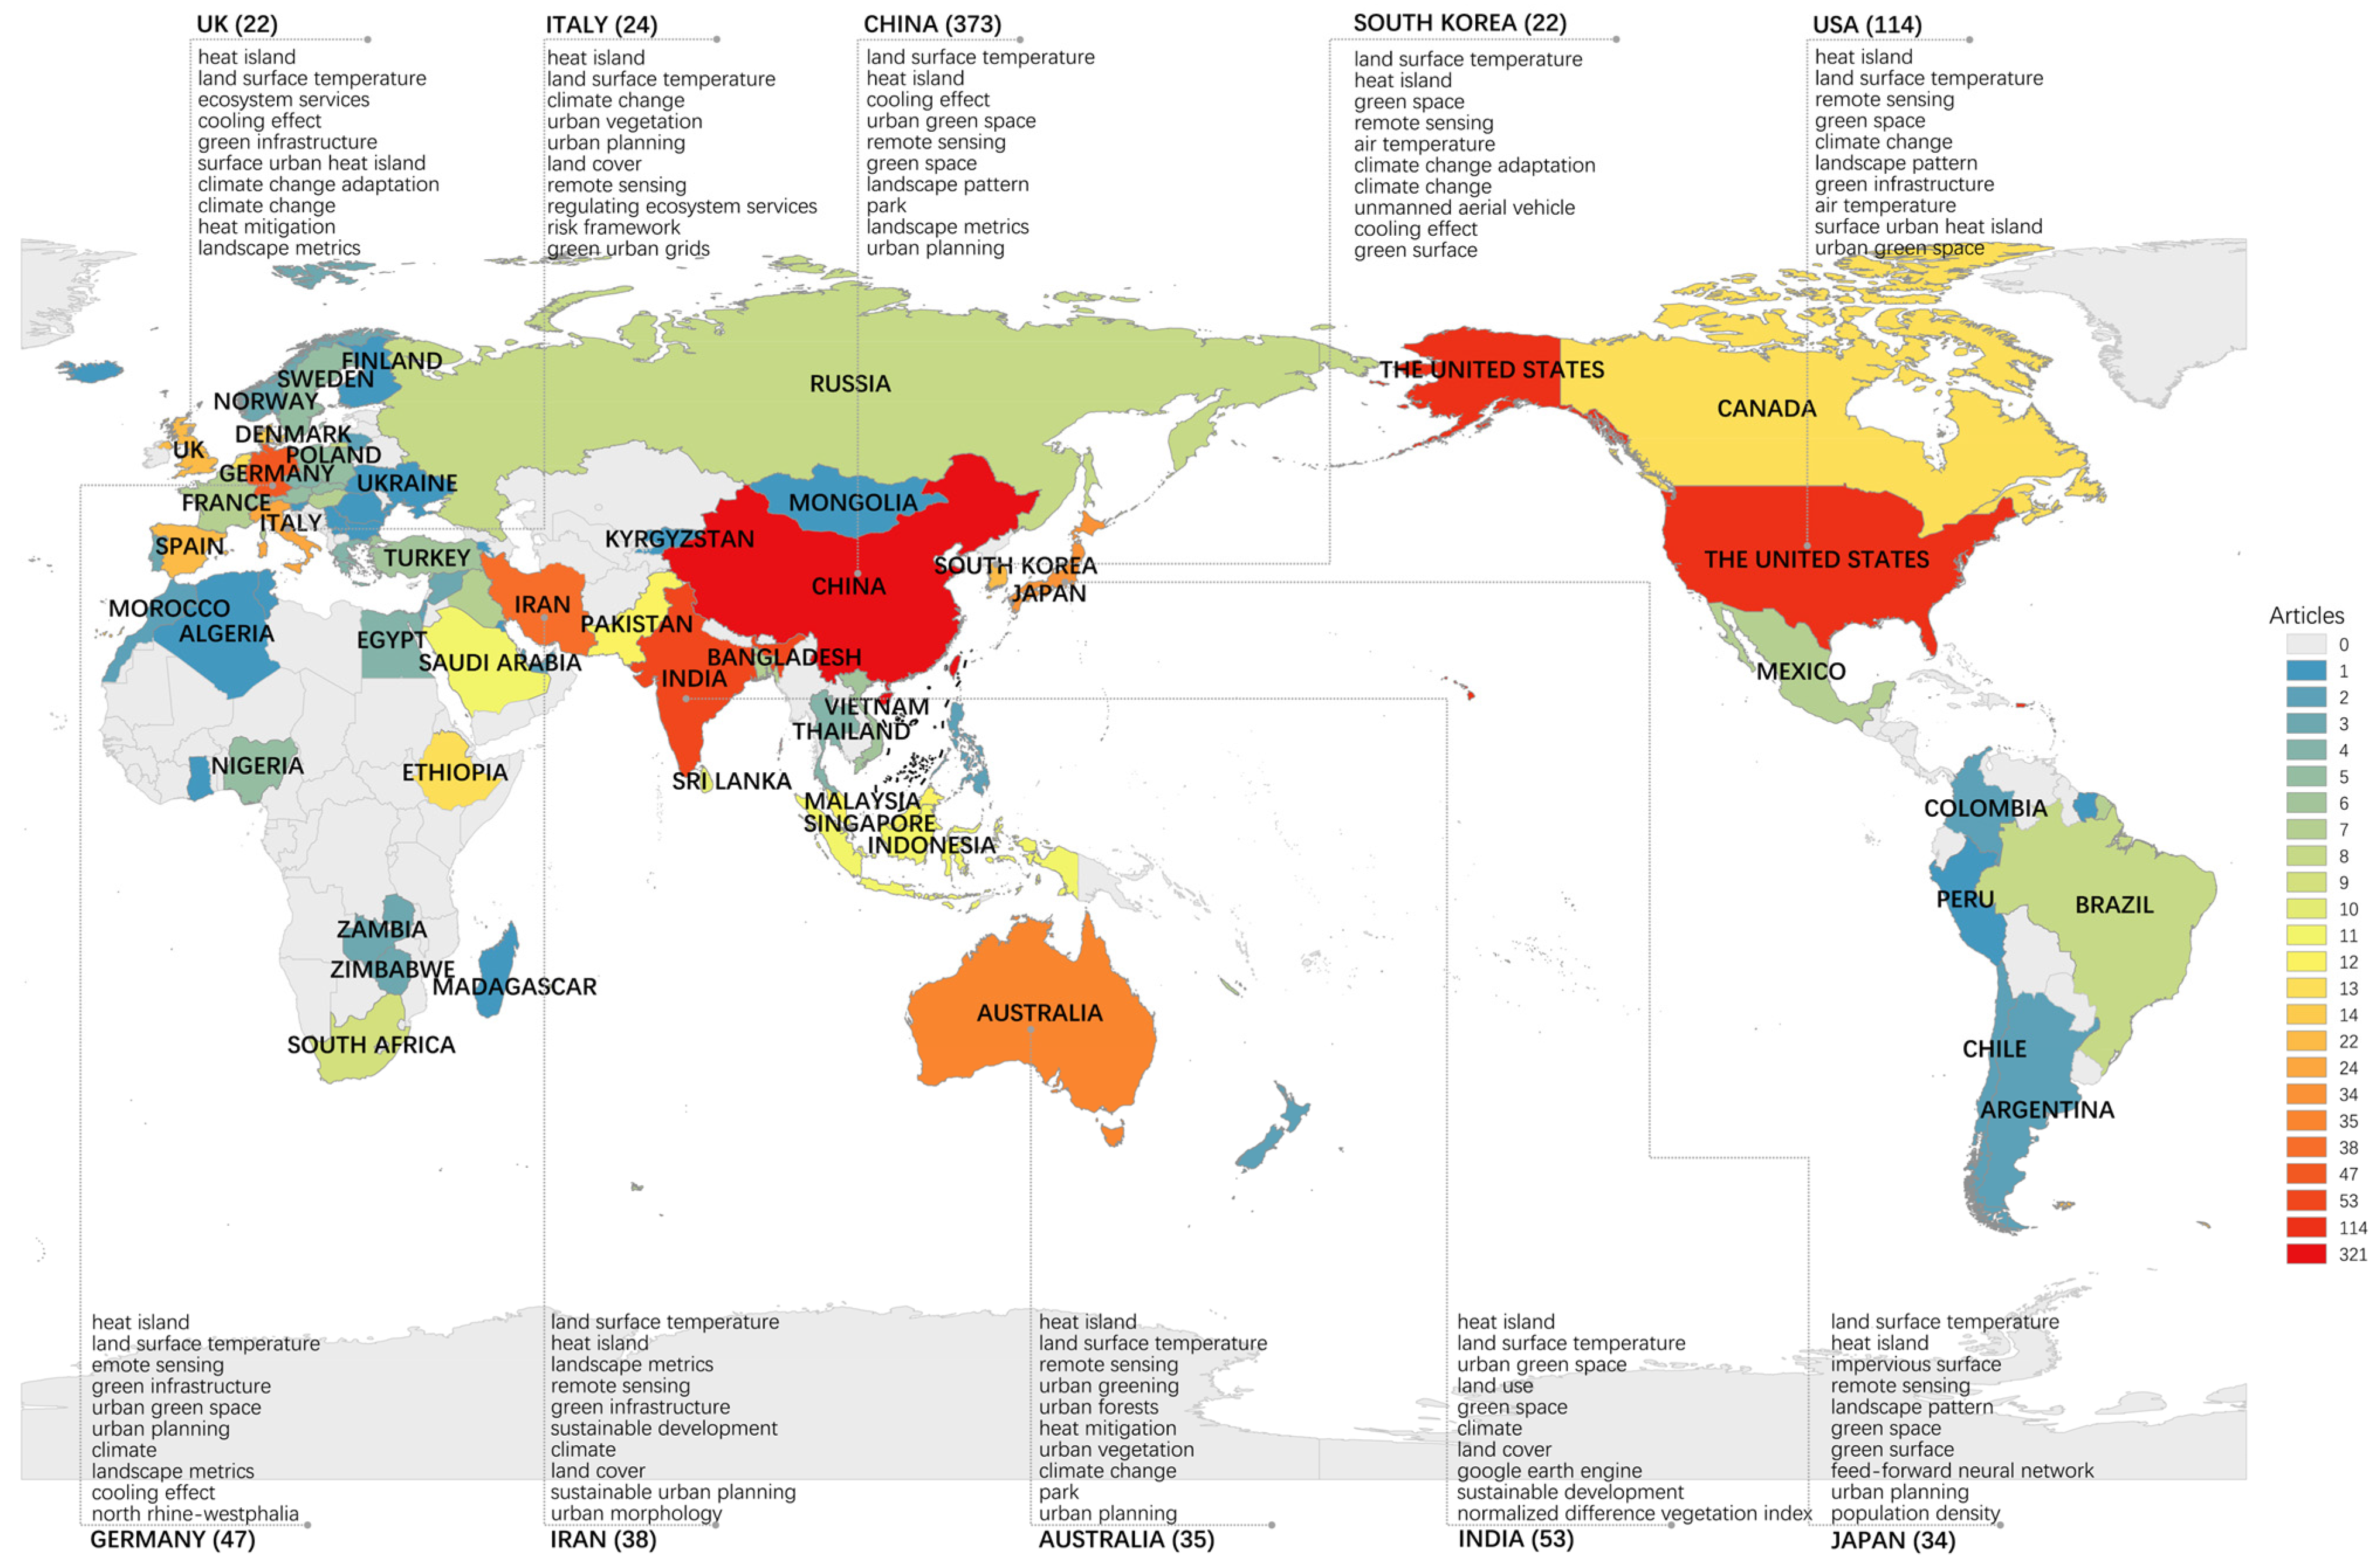
3.2.1. National Contribution and Cooperative Network Analysis

CiteSpace was used to analyze national contributions and collaboration networks, which aids in understanding the global patterns of academic collaboration and knowledge dissemination pathways. The countries with the most articles were China, the United States, India, Germany, Iran, and Australia (Table 1). Among them, the United States was the first to focus on this field, beginning to publish articles in 2004. China had the most articles, with 373 total (accounting for 50.40% of the total), with the earliest article published in 2011. Although research on the effect of UGSs on LST in China began late, the number of publications has been growing rapidly each year, exceeding 60 papers annually from 2022 to 2024. The spatiotemporal distribution of national publications and a visualization of keywords for the top ten countries in terms of publication volume are shown in Figure 3.
Generated country-cooperation network mapping (Figure 4) exhibited 80 nodes and 358 edges. The density of the cooperation network between countries was 0.1133, indicating cross-country cooperation and exchange between countries worldwide. The mapping nodes surrounded by purple circles represent high-influence countries with high mediator centralities. Germany had the highest centrality (0.40), demonstrated a strong academic influence, and worked closely with Poland, Australia, Finland, Denmark, and Slovakia. China’s centrality was also high (0.36) and mostly cooperated with countries such as Poland, Australia, Bangladesh, Slovakia, Malaysia, and Denmark. The United States and Australia had centralities of 0.22 and 0.21 (Table 2). The USA mostly collaborated with Australia, Poland, Bangladesh, Indonesia, and Malaysia. Cooperative relationships existed among Australia, Vietnam, Indonesia, and Malaysia. Several small international collaborations existed between Spain, Malaysia, Mexico, Argentina, India, Malaysia, South Africa, and Italy.

3.2.2. Institutional Contributions and Collaborative Networks

Generated institutional collaboration network mapping is shown in Figure 5, with 329 nodes and 439 edges. In terms of institutional publication volume, the Chinese Academy of Sciences had the highest publication volume of 92 articles, beginning in 2011. Other research institutions with more publications were the University of the Chinese Academy of Sciences, Peking University, University of Tsukuba, Beijing Forestry University, and Humboldt University, which published 45, 18, 15, 15, and 14 articles, respectively. These institutions contributed significantly to the accumulation of knowledge and academic development in this research area.
The density of institutional cooperation, which was 0.0081, revealed that research institutions were not closely collaborating nationally or internationally in this area, making it difficult to disseminate research findings. Universities in China, the USA, Japan, Germany, and Singapore developed a wide range of cooperative relationships. For instance, collaborations have been formed between the University of Chinese Academy of Sciences and Michigan State University in the USA, the University of Tsukuba in Japan and Arizona State University in the USA, Tongji University in China and National University Singapore in Singapore, and Humboldt University in Germany and the University of North Carolina in the USA. Other institutional cooperation is detailed in Table 3. It shows that most cooperation between institutions occurs within their respective countries, while cooperation between international institutions is relatively limited. The University of Chinese Academy of Sciences had the highest centrality (0.46) of any institution in the network of international collaborations, indicating a strong academic influence. Other institutions with high centrality included Indiana State University (0.20), the University of Tehran (0.16), Islamic Azad University (0.12), and Arizona State University (0.10).

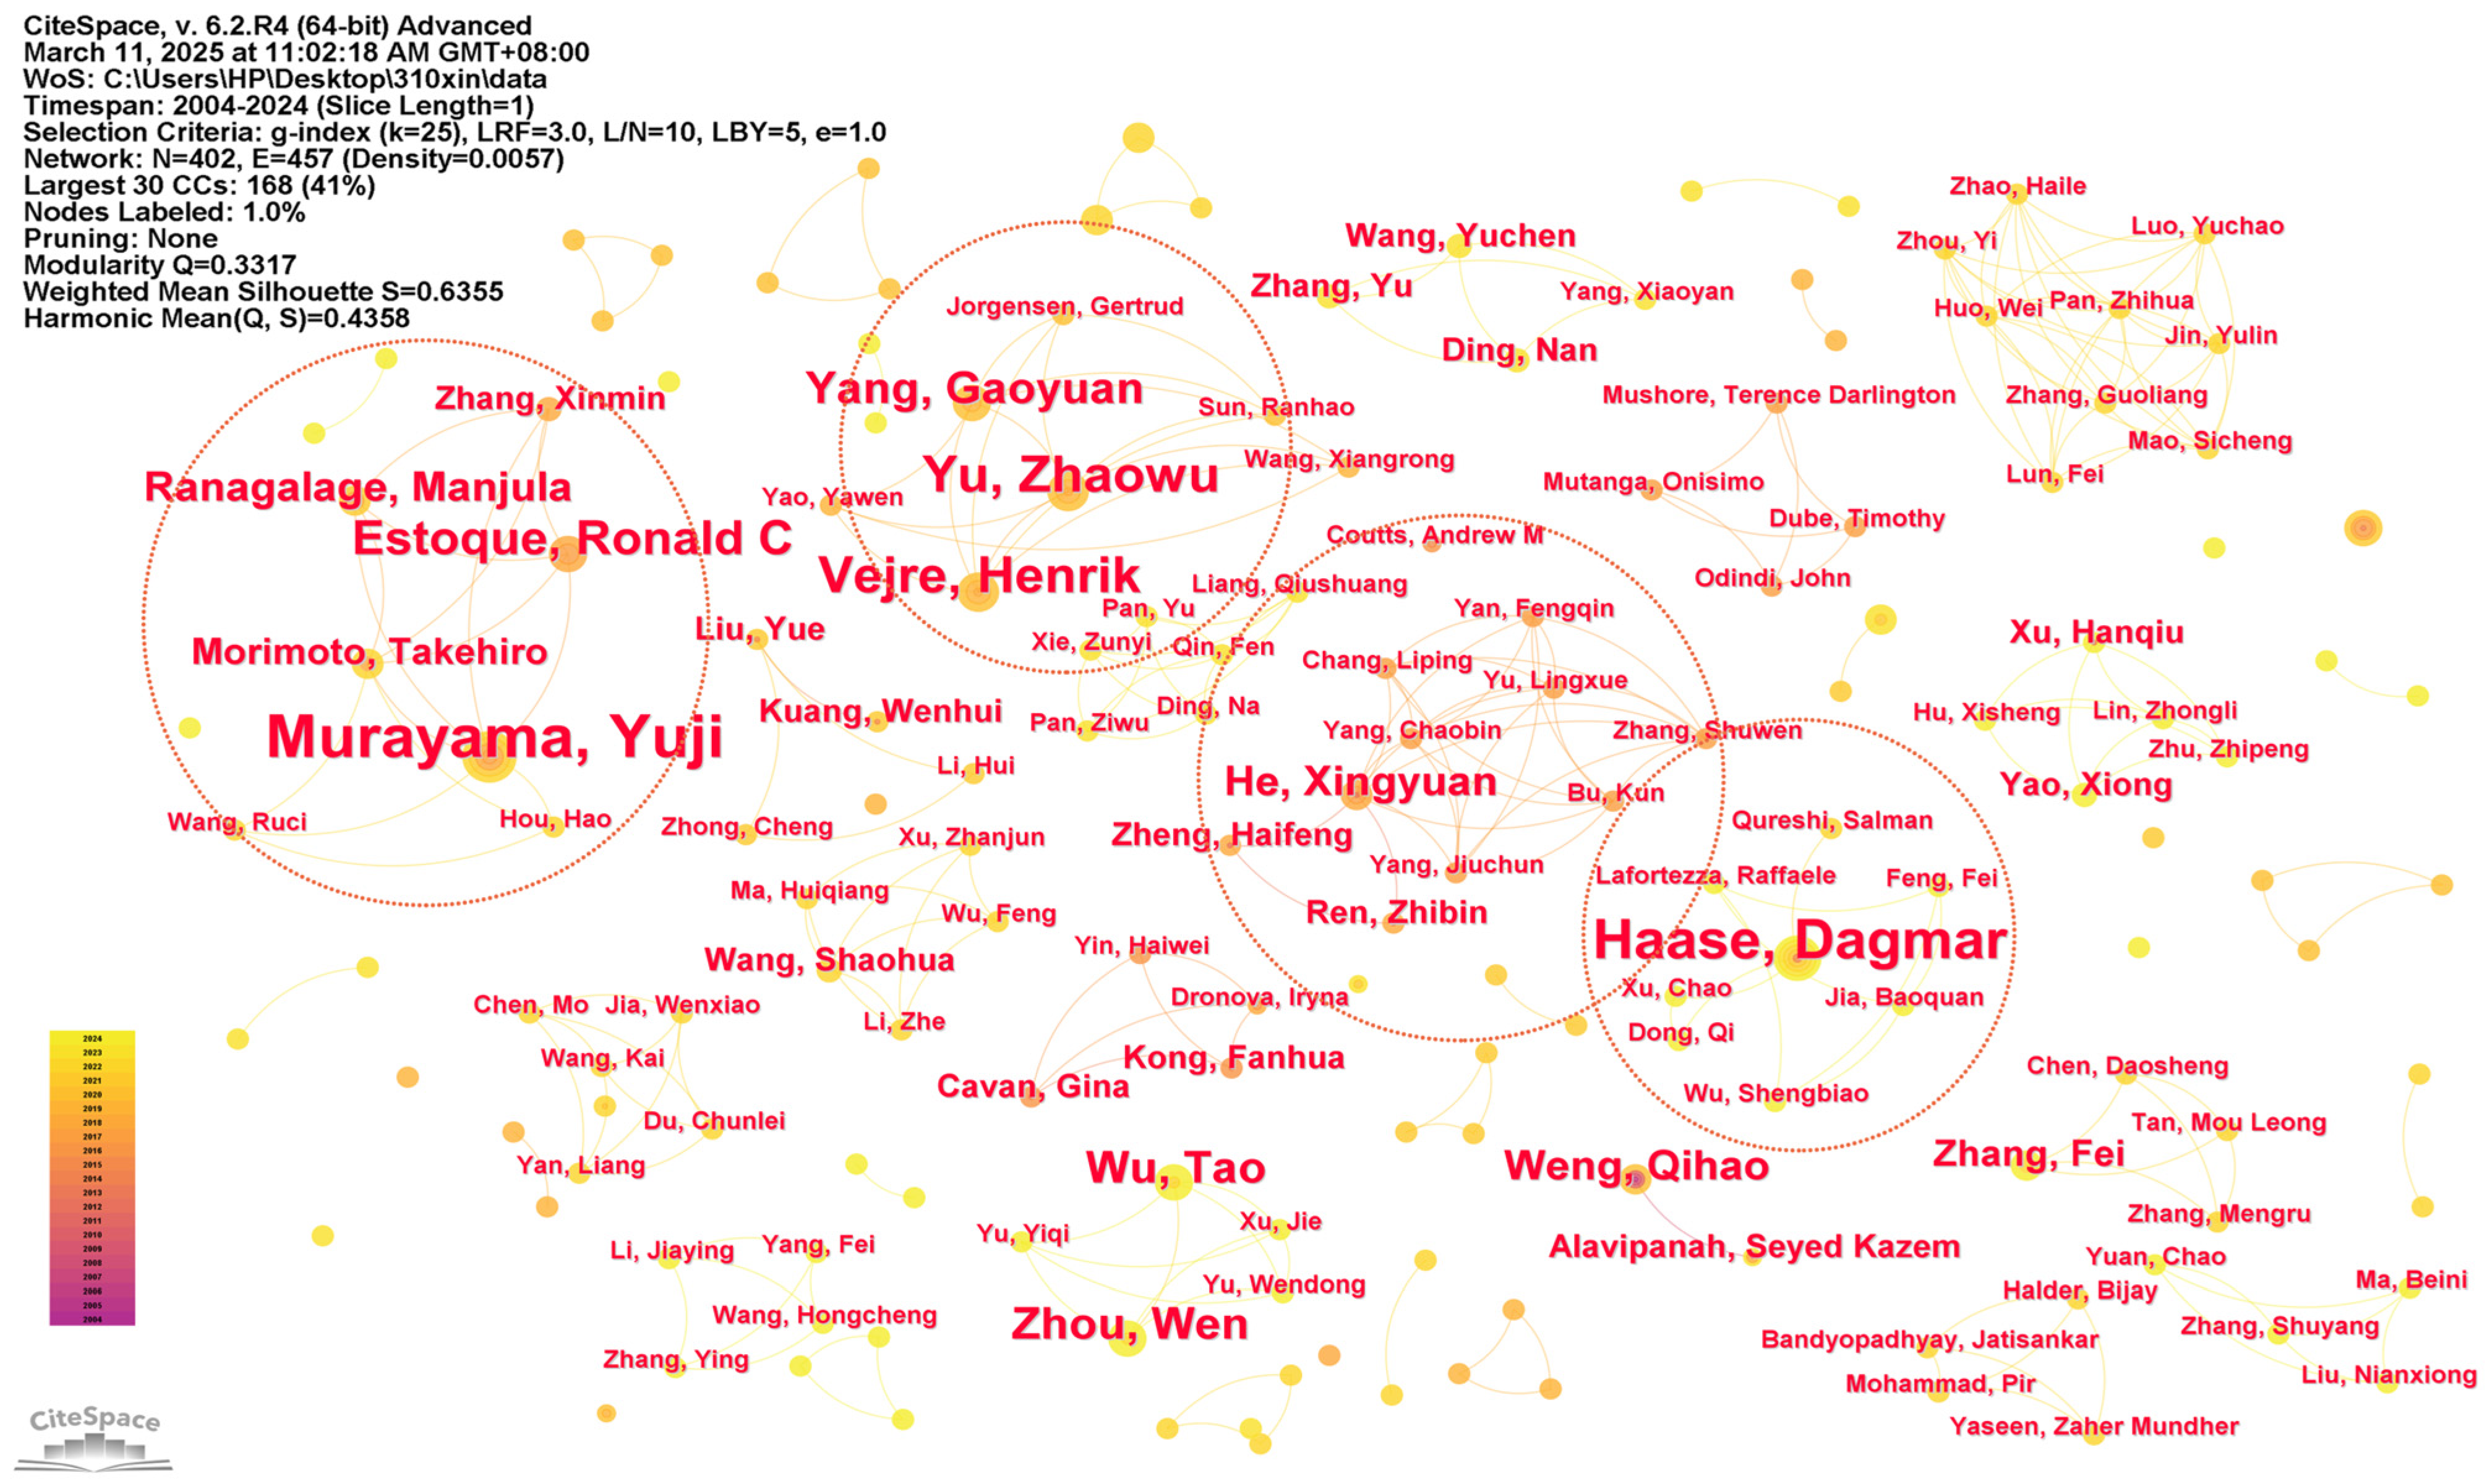
3.2.3. Author Contributions and Collaborative Network Analysis

Researchers are the driving force behind the advancement of subject areas, and analyzing authors in a research area reveals the social relationships among scholars. The generated knowledge network map had 402 nodes and 457 connecting lines (Figure 6). The size of the nodes intuitively reflects the degree of the authors’ contributions, with highly productive authors such as Murayama Yuji, Haase Dagmar, Vejre Henrik, and Yu Zhaowu publishing 13, 10, 8, and 8 papers, respectively, and making significant contributions to research on the impact of UGSs on LST.
From the perspective of author collaboration, network mapping had a collaboration density of 0.0057; however, several clusters of collaborations were identified. Eight researchers, including Murayama Yuji, Estoque Ronald C, Ranagalage Manjula, Morimoto Takehiro, and Zhang Xinmin, formed a small range of collaborations. Using Landsat data, multi-resolution grids, and spatial metrics, they studied Bangkok and Jakarta in Southeast Asia, Baguio City in the Philippines, Lagos and Nairobi in Africa, and Nanchang in China. Their research focused on monitoring and quantifying the mechanism of UHI formation, the relationship between LST and impervious surfaces, spatial patterns, composition, and allocation of GSs. The mechanisms of GSs and heat island formation and the cooling efficiency of GSs and water bodies were also explored [13,37,38,39].
Seven researchers, including Vejre Henrik, Yang Gaoyuan, Yu Zhaowu, and Yao Yawen, collaborated on a small scale, and their research horizons were expanded from ordinary single cities to include the study of typical urban agglomerations and high-latitude cities. Their studies mainly focused on the spatial and temporal patterns of heat islands as well as the CEs of UGSs, including cooling thresholds and GS landscape indicators [23,40,41].
Six researchers, including Haase Dagmar, Franck Ulrich, Xu Chao, and Hamstead Zoe A, also established small-scale collaborations to explore the spatial equity of UGSs, the cooling benefits of GSs, and the impacts of land use and urban functions on LST [42,43,44].
He Xingyuan, Ren Zhibin, Zheng Haifeng, Yu Lingxue, Chang Liping, Yang Chaobin, and 15 others formed a broader collaborative network, and their studies covered a wide range of fields, which further enriched the scope and content of the research. The effects of urban forest structure and location on urban cold islands (UCIs), the equity of the CE of urban forests, the relationship between UGSs and LST in different seasons and at different spatial scales, and the effects of urban park characteristics on individual temperatures were studied [45,46,47].
To date, international authors have not established a close network of cooperation. Most of these collaborations were limited to their respective nations’ universities, with few international academic exchanges or collaborations. Strengthening academic contact among foreign scholars is crucial for advancing global academic progress regarding the effects of UGSs on LST. In addition to facilitating broad knowledge exchange and strengthening research collaboration, it fosters academic innovation and amplifies the significance of academic accomplishments.

3.3. Research Hot Spots and Trend Analysis

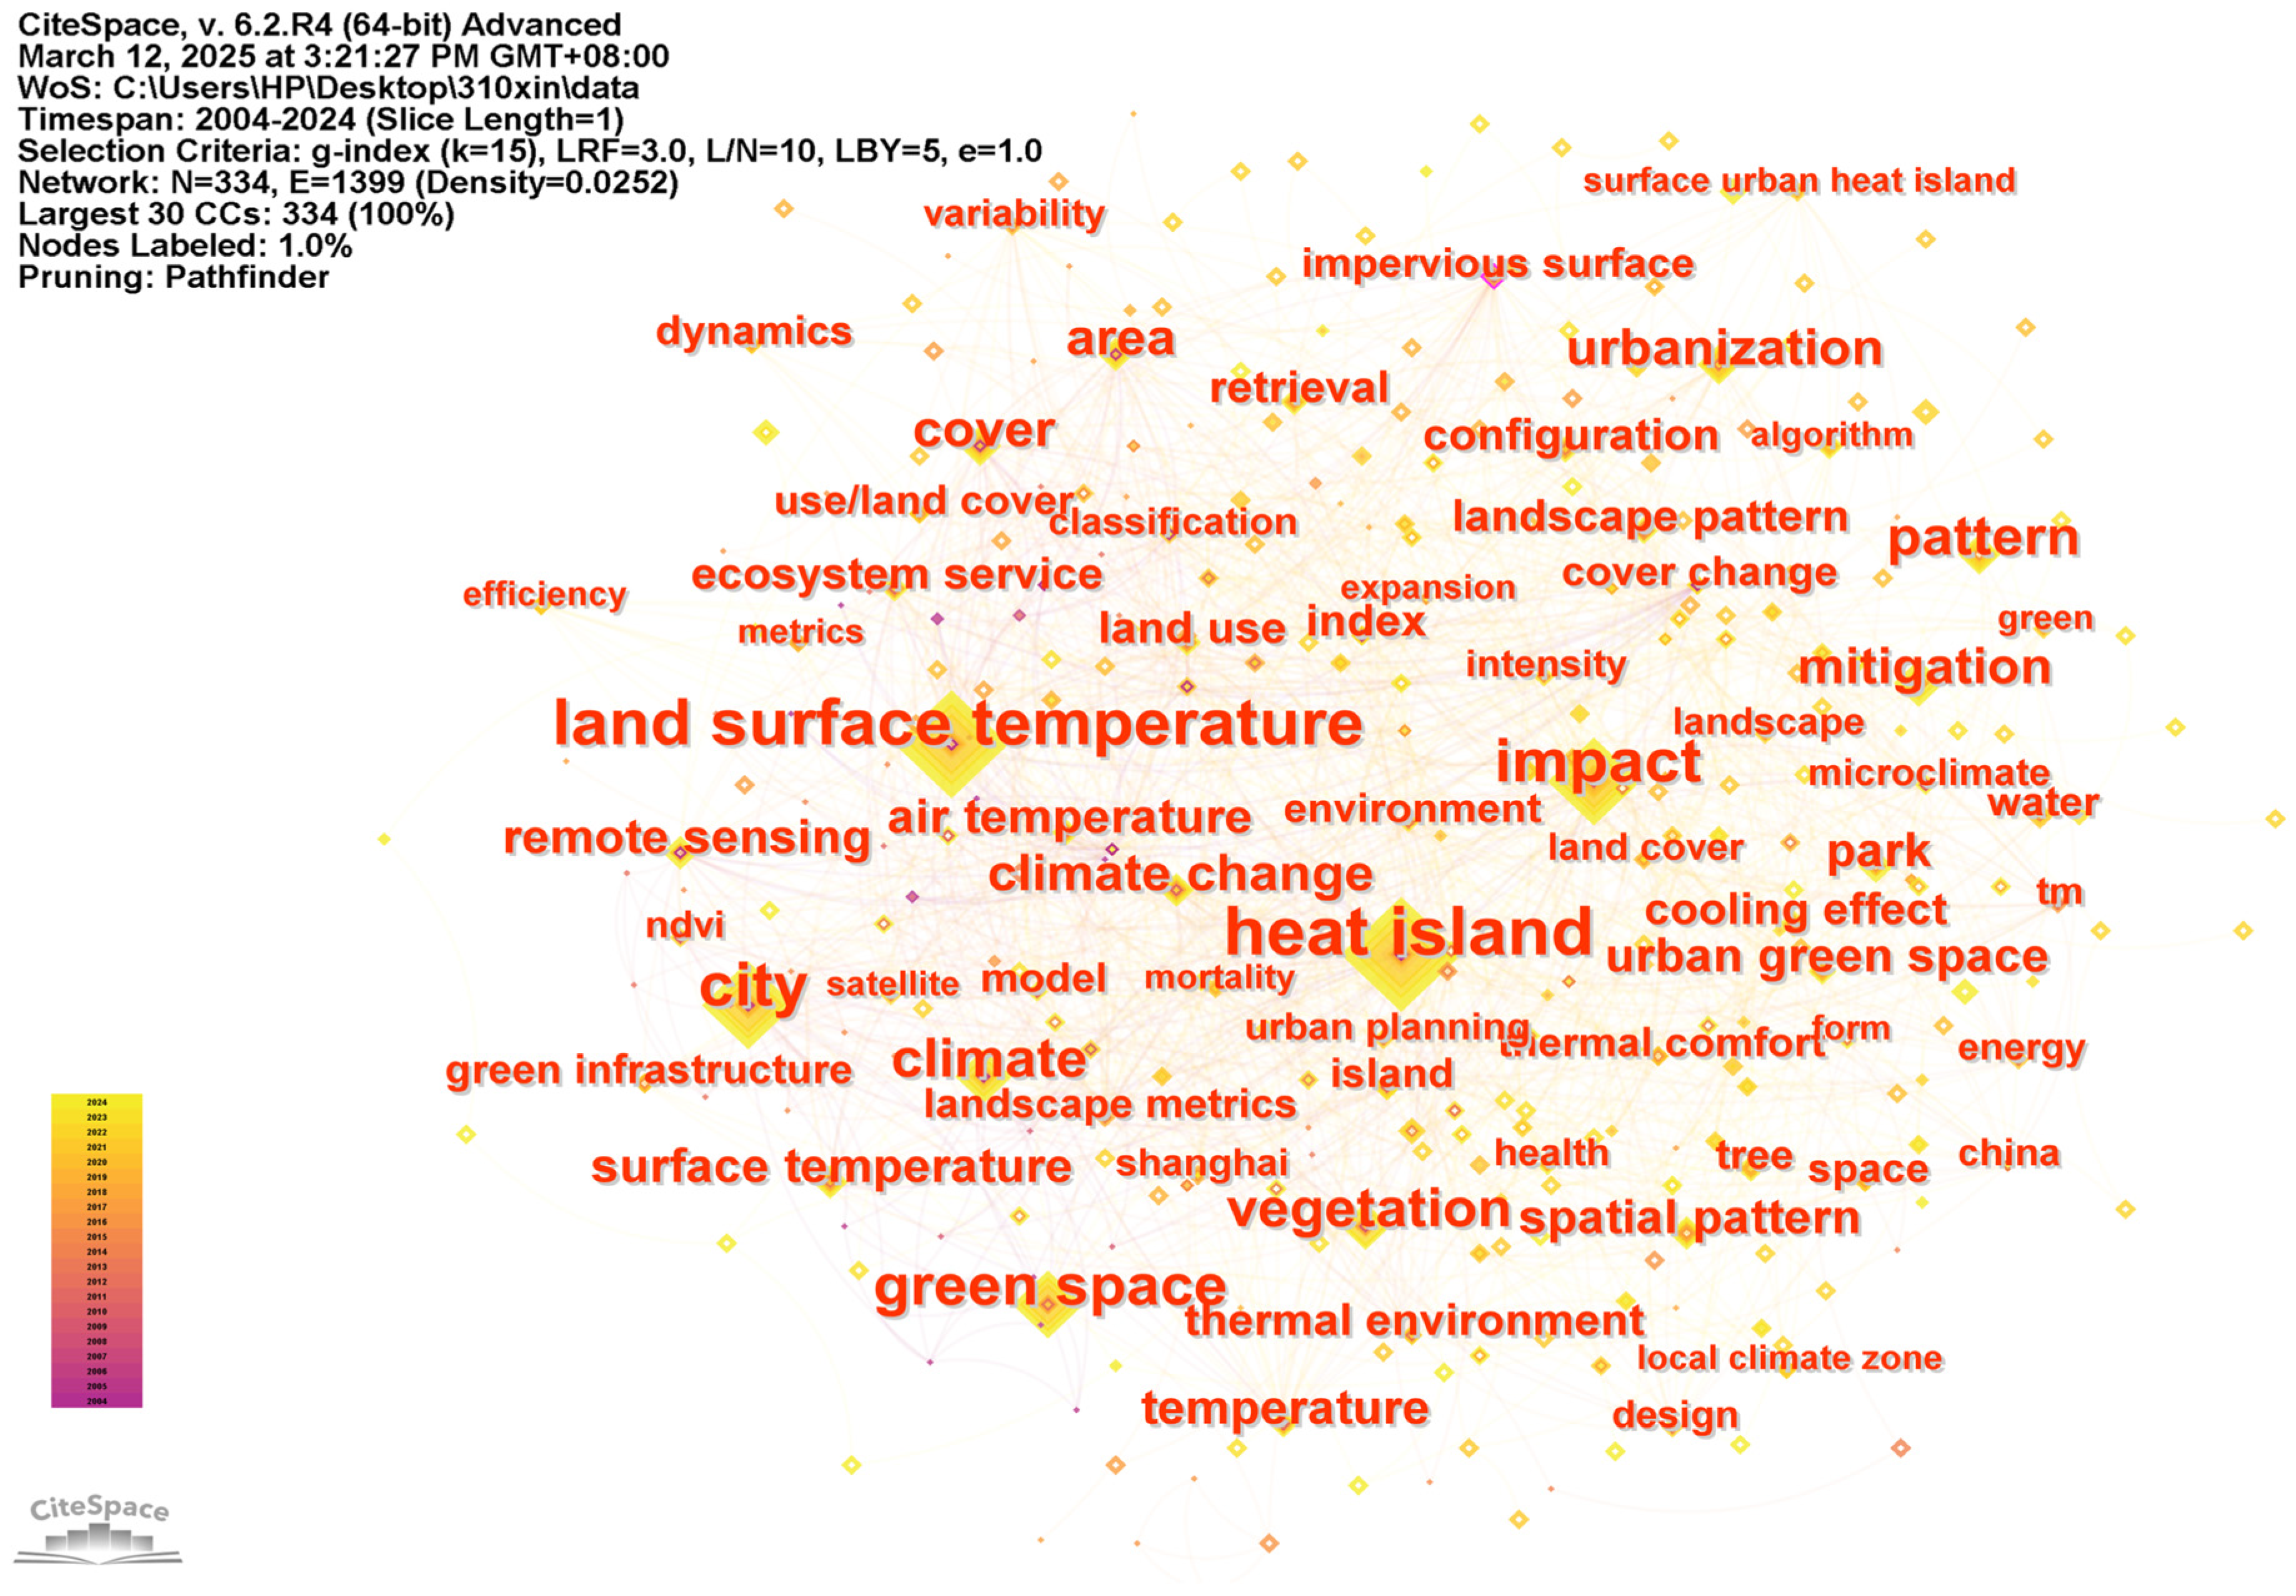
3.3.1. Keyword Analysis

The keywords reflect the themes and ideas of articles. A knowledge structure can be constructed, the research scope can be refined, the research hotspots can be mined, and future research trends can be further identified through co-occurrence network and clustering analyses of keywords.
The k-value was set to 15 in CiteSpace, and the merged network was clipped using ‘pathfinder’ and ‘pruning the merged network’ settings. The CiteSpace keyword clustering results generated a keyword co-occurrence network containing 334 nodes and 1399 edges (Figure 7) and a network density of 0.0252. The size of the nodes indicates the co-occurrence frequency, and the connected lines between the nodes indicate the co-occurrence connections between the different nodes. The most frequent keyword was “heat island”, which appeared 481 times and had the highest centrality of 0.09. The terms “cover change”, “normalized difference”, “avhrr data”, “city”, “climate change”, “air quality”, “land surface temperature”, and “circulation” were closely related. This revealed that “heat island” was a research hotspot, LST was a direct indicator of the heat island effect, and the increase in the LST was a direct manifestation of the heat island effect; therefore, the two terms were deemed to be closely related. The emergence of the heat island effect was closely related to climate change, cover change, etc. The term “environment” was also the most centrally occurring keyword, with a centrality of 0.09 and 37 occurrences. “Accuracy evaluation”, “expansion”, “heat reduction”, “convective boundary”, and “climate change” were all strongly associated with “environment”. This demonstrated that “environment” was the core of the research in this field, revealing that people paid increasing attention to the human environment, particularly in the context of global warming and rapid urban expansion.
Other keywords with high frequency were “land surface temperature”, “city”, “impact”, “green space”, “vegetation”, “climate”, and “pattern”, which appeared 456, 300, 295, 206, 160, 148, and 131 times, respectively. This indicated that UGSs are an important means of urban cooling for the mitigation of the urban thermal environment, which was widely studied.

3.3.2. Research Knowledge Structure Analysis

To further explore the research knowledge network structure, data sources, main research methods, and contents in the field of the effect of UGSs on LST, keywords were clustered using the log-likelihood ratio (LLR) clustering algorithm in CiteSpace [48]. Eight main clusters, including “remote sensing”, “urban green infrastructure”, and “landscape pattern”, were obtained, reflecting multiple research directions and categories (Figure 8). Modularity (Q) and weighted average profile (S) scores were used to gauge cluster plausibility. When the Q and S values were >0.3 and >0.5, respectively, clustering was dependable. With a Q value of 0.4646 and a S value of 0.7221, the resulting clustering map shows that the clusters were plausible. The research content for each clustering topic was as follows:
#0 Remote Sensing
Remote sensing, one of the most important technological tools for studying the impact of UGSs on the urban thermal environment, was mainly used for data acquisition. Further analysis of literature and keywords in the cluster map found that the application of remote sensing technology in the study of UGSs and LST had the following characteristics:
(1)
Satellite sensors
Using a variety of satellite sensors, remote sensing technology offers a practical method for collecting spatial distribution data on urban subsurface conditions and LST. These data support research on how UGSs affect LST. In particular, land use categories in cities, such as GSs, watersheds, and impervious surfaces, were identified and classified using satellite images with varying resolutions and spectral ranges. Land use data and vegetation indicator datasets were frequently used. The thermal infrared radiative transfer method was widely used to identify urban LST and its changes using multitemporal infrared remote sensing images. The satellite sensors used were mainly the Landsat TM/ETM+ series [13], Terra’s MODIS [49], and the Advanced Spaceborne Thermal Emission and Reflection Radiometer (ASTER) [50]. MODIS surface temperature data (MOD11) and FLDAS heat flux data were commonly used datasets. MODIS data are provided by remote sensing instruments jointly developed by NASA and NOAA, which can provide high-frequency, global multispectral image data that include daily data on LST and emissivity. The FLDAS dataset provides several parameters related to the LST, including evapotranspiration, soil moisture, and soil temperature. Previous studies demonstrated the high accuracy of these sensors. For example, Shen et al. used multitemporal satellite data and historical in situ observations to spatiotemporally explore temperature characteristics in Saskatoon, Canada. The findings indicated that the Landsat TM and MODIS LST data have high accuracy in estimating the daily mean air temperature at the 120 m and 1000 m spatial scales, respectively. Furthermore, when determining the daily mean air temperature in metropolitan areas, Landsat TM data can be more useful than MODIS LST data [51]. Naeem et al. used Gaofen-1 and Landsat-8 satellite images to investigate the relationship between GS characteristics and LST in Beijing, China, and Islamabad, Pakistan [52]; Rahaman et al. utilized 1988 and 2018 Landsat thematic mapper and OLI/TIRS remote sensing image data to analyze and assess the scale of change and spatial layout of UGSs in Mumbai [53].
Additionally, the effects of urbanization on the urban thermal environment were evaluated using a time series analysis of these remote sensing data to understand the temporal patterns of UGSs and LST. The urban thermal environment exhibited daily, seasonal, and interannual variations in the time series. For example, Chen et al. used MODIS thermal images and SPOT multispectral remote sensing images to investigate the effects of urbanization on landscape patterns and daily changes in LST in Taipei City. The negative effects of urbanization on daily changes were more evident in its early stages, and the daily changes in LST showed an increasing trend with an increase in the urbanization index [54].
(2)
LST inversion methods
Inversion methods for LST include the heat radiative transfer equation (RTE) method, single-window algorithm, split-window algorithm, and single-channel algorithm [55]. For example, Hasan et al. used the RTE model to derive the LST of the Mymensingh region of Bangladesh over several years [56]. Bekele et al. used a single-window algorithm to invert the LST from Landsat 7 ETM+ (band 6) and Landsat 8 TIRS (band 10) thermograms. The mean LST in Addis Ababa increased from 25.8 °C in 2006 to 27.2 °C in 2016 and 28.2 °C in 2021 [57]. Xue et al. used a split-window algorithm to estimate the LST from Landsat-8 TIRS satellites to estimate the heat island intensity of northeastern urban wetlands in China and quantitatively evaluated their CE [58]. Firozjaei et al. used a single-channel algorithm to calculate LST to assess the spatiotemporal patterns of land use change and heat island intensity in Babol City, Iran, from 1985 to 2015, and predicted possible future changes in heat island intensity [59].
The spatial distribution, typological changes, and relationship between LST and UGSs can be accurately monitored and assessed using remote sensing technology, supporting UGS mapping and quantification studies, LST monitoring, and the development of models for predicting changes in urban thermal environments. These results can guide decisions in urban planning and management, which not only enhances the understanding of the relationship between UGSs and LST but also provides a scientific foundation for sustainable urban development and climate adaptation strategies.
#1 Urban Green Infrastructure
UGI can be defined as an interconnected network of multifunctional GSs [60], including parks, private gardens, street trees, and engineered options such as green roofs, green walls, and rain gardens [61]. Strategic planning and management can provide various ecological, social, and economic benefits. Therefore, UGI is widely recognized as one of the most effective ways to reduce urban temperatures during heat waves and mitigate the adverse effects of extreme heat events on human health and well-being [62].
UGI is important for mitigating the UHI effect and regulating the urban microclimate. It can effectively reduce urban LST and improve the urban microclimate by providing shade, increasing water evaporation and the CE of vegetation, and providing a more comfortable living environment for residents. Di et al. examined how urbanization and UGI affect the average LST in Bobo-Dioulasso and found that the average LST in the UGI regions was 0.3 °C lower than that in nearby built-up areas [63]. The rational layout of green infrastructure plays an important role in mitigating the heat island effect and improving thermal comfort [64]. Adding landscaping around existing UGI and improving their continuity are efficient ways to cool them, and UGI with high connectedness have a more substantial CE than disconnected UGI [65]. In addition, the coupling of UGI with other environmental elements has a stronger CE than that of a single GSs. The average temperature difference between blue-green spaces and single GSs was 2.15 °C in Bhubaneswar, India [66]. The importance of integrating UGI with other environmental factors in urban planning to improve urban sustainability has been highlighted, and strategic interventions such as increasing the coverage of UGSs and optimizing access to water bodies have been proposed.
Moreover, UGI can be divided into three categories: ecological (sufficient UGI with stable cooling efficiency, strong cooling intensity, and the provision of a variety of ecosystem services), efficient (the most effective UGI size to achieve CE), and primary (small and dispersed UGI patterns, including pocket gardens, backyard gardens, and small ponds) [67]. The threshold sizes and cooling distances for cooling different types of UGI were derived based on the Ideal Urban Thermal Security model. This approach contributes to a better understanding of the CE of UGI in climate-resilient planning and decision-making. This study provided a new method to recognize the CE of UGI and mitigate the UHI effect.
#2 Landscape Pattern
Several studies have analyzed the relationship between UGSs and LST from the macro-landscape pattern perspective using landscape ecology methods. By clarifying the mechanism by which the GS landscape pattern affects the urban thermal environment, a more reasonable GS pattern can be sought to maximize the CE of UGSs, which is of great significance in alleviating the urban thermal environment.
Researchers chose different landscape measures based on the study topic. For instance, Maimaitiyiming et al. evaluated the impacts of GS composition and arrangement on LST using landscape metrics such as percentage of landscape (PLAND), edge density (ED), and patch density (PD) in the Aksu oasis in China. The results revealed that the composition of GSs is more important than the configuration of GSs in cooling, while the proportion of GS patch area is the most influential factor in mitigating the heat island effect; the higher the proportion of GS patch area, the lower the LST and the higher the mitigation of the heat island effect [20]. Zhang et al. computed four landscape indices—the aggregation index (AI), ED, PD, and area-weighted average shape index (Shape_am)—to examine the geographical distribution characteristics of UGS and LST and investigate their binary local spatial autocorrelation. The findings further supported the CE of GSs by demonstrating that ED, PD, and Shape_am were negatively correlated with LST, with correlation coefficients of −0.469, −0.388, and −0.411, respectively [11].
In addition to studying the shape, density, boundaries, agglomeration, and dispersion of UGS landscape patterns, studies have been conducted on the differences in the distribution patterns of GSs along a linear urban–rural gradient. Shukla and Jain used macro-pattern analysis to identify and analyze how changing landscape patterns (macro-level) and dynamics (micro-level) affect LST. The results revealed that there is a significant and strong correlation between the mean LST along the urban–rural gradient and the density of impervious surfaces (positive) and GSs (negative), and the mean LST of impervious surfaces was 4 °C higher than that of GSs in 2005, further increasing to 6 °C in 2016 [68].
This research can help us understand the mechanism of LST mitigation through the spatial distribution and morphological characteristics of UGSs. Therefore, a more reasonable and effective spatial layout and morphological design of UGSs for LST mitigation can be obtained in the future to sustainably improve the urban ecological environment and enhance the quality of life of residents. For instance, Song et al. determined that the main factors influencing urban LST in Hangzhou were landscape dominance indicators (e.g., PLAND and the Largest Patch Index (LPI)) [69]. Yang et al. demonstrated that the negative correlation between LST and the UGS area, as well as the Normalized Difference Vegetation Index (NDVI), was more significant than that with the shape index. On a 0.5 km × 0.5 km scale, the summer LST drops by 0.34 °C for every 10% increase in UGSs, and increasing the NDVI causes more wooded areas and denser vegetation, reflecting a better and more practical approach to UGS planning [46]. Masoudi and Tan showed that patches with larger areas, simple shapes, high connectivity, and low fragmentation have a lower LST [70]. Shih showed that large UGSs with compact or simple shapes, more water elements, and higher greenness have cooler environmental characteristics [71]. Landscape spatial patterns with larger areas and better connectivity are positively associated with lower LST, whereas those with higher fragmentation and isolation are negatively associated with lower LST [22].
#3 Spatial Regression Analysis
Owing to the complexity of the relationship between the UGS environment and LST, regression analysis was applied to establish a correlation study between UGS characteristics, LST, and CE to provide a scientific basis for UGS construction and environmental management. Peng et al., Van Ryswyk et al., Gago et al., and Lai et al. used linear regressions, such as piecewise linear regression (PLR), ordinary least squares (OLS), and multiple linear regression (MLR), to investigate the effects of UGSs on LST in Beijing, Ottawa, Seville, and Sardinia, respectively [72,73,74,75]. Sun et al. employed correlation and regression analysis methods, including Pearson correlations, logarithmic regressions, cubic fitting, and buffer zone analysis, to examine the relationships between vegetation cover, water cover, area, leaf area, patch shape index, and LST or CE intensity [76]. Peng et al. investigated the relationship between spatial changes in LST across different seasons and the influencing factors from five dimensions (GS, water body, landscape configuration and diversity, high albedo, and socioeconomic status) in Shenzhen, China, by comprehensively applying OLS regression, stepwise regression, full subset regression, and hierarchical partitioning analysis. These results indicate that artificial land surfaces and GSs play a dominant role in the spatial differentiation of LST. Furthermore, the normalized difference cumulative index most significantly influenced the spatial heterogeneity of LST in summer, with a contribution rate of 53.62% [77].
However, traditional statistical regression methods are limited by a high demand for data quality and quantity, strict statistical tests, and multicollinearity issues. In addition, the traditional OLS model assumes that the error terms are independent of each other; however, in real-world studies, the LST in neighboring regions is often similar and not completely independent. If OLS is used, this spatial autocorrelation may lead to bias in the coefficient estimation and inaccurate model results [78]. Coupled with this, UGSs may exhibit multicollinearity in the configuration indicators. Therefore, to further reveal the spatial heterogeneity of the effect of UGSs on LST, improve the ability of the model to explain spatial data, and help researchers understand the mechanism of UGS CEs in different spatial configurations and scales, spatial regression models have been widely used in studies on the spatial effect of UGSs on LST, such as the Spatial Autoregressive Model (SAR), Spatial Error Model (SEM), Geographically Weighted Regression (GWR), and Spatial Durbin model (SDM). Li et al. applied the GWR model to correlate UHI intensity with potential explanatory variables, such as changes in population density, changes in the proportion of impervious surfaces, changes in the proportion of water bodies, and changes in the proportion of GS [79]. The GWR model allows regression coefficients to vary spatially, which is more realistic and provides more reliable analytical results. Chen et al. used four scales of analysis (240, 480, 720, and 960 m) to unify the spatial scale of the data; performed multiple covariance tests and spatial autocorrelation analyses; and constructed OLS, GWR, and Geographically Temporally Weighted Regression (GTWR) models to analyze the relationship between UGSs and LST. The GTWR model is better than the OLS and GWR models and can better explain the influence of the GS pattern on LST [80]. Degefu et al. investigated and predicted the spatial dependence of LST and urbanized GS dynamics using multivariate linear regression methods and spatial regression models (SRMs), finding that the spatial patterns of expansion rates and UHI intensities differed significantly among cities and that the cooling contribution of the urban ground system varied among different land uses and in different regions [81]. Yang et al. used bivariate spatial autocorrelation and SAR to analyze the relationship between LST and the spatial pattern of UGSs at different grid point scales in Fuzhou City during summer, spring, and winter. The results showed that the LST in Fuzhou City exhibits significant spatial autocorrelation, and the results of the indicators differed by season. Population density and distance to water bodies were not significant in winter [2].
The spatial regression model has been optimized. Pramanik and Punia adopted three regression models to investigate the relationship between composition and configuration with LST: OLS, MLR, and spatial autoregression consisting of spatial lag and SEM. This increases the comprehensiveness and accuracy of the model in handling complex data, significantly improves the fitting effect of GS composition and configuration to LST data, and enhances the reliability and scientificity of the results [82]. Degefu et al. used a linear logarithmic function (log–log model) for non-spatial and spatial regression analyses. They used the spatial lag model and SEM to manage spatial autocorrelation and evaluate model performance [81]. Jiang et al. used a machine learning method to optimize the analysis of spatial data using a boosted regression tree (BRT) model to study the correlation between the UHI effect and the interaction of urban rivers and GS morphology in both two-dimensional and three-dimensional urban contexts [83]. Smith et al. constructed the Spatial Durbin Error Model (SDEM) to assess the direct and indirect effects of land cover and albedo on LST, incorporating independent variables such as spatial lag effects and model error, while accounting for multiple covariances [78].
In the spatial scale study, Terfa et al. analyzed the relationship between UGS patterns and LST by constructing OLS, spatial lag, and spatial error regression models through correlation analysis to explore the effects of different statistical methods and spatial scales on the results. The correlation between the landscape indices and LST decreased with an increase in spatial scale. The effect of PD on LST was more prominent at smaller scales (120–600 m), and the 240 m scale was considered better for exploring the relationship between the spatial patterns of UGSs and LST [84].
Spatial regression analysis helps to clarify the effects of each factor on LST in different configurations and scales, improve the interpretation of spatial data, propose targeted optimization strategies for UGS layouts, and achieve more efficient thermal mitigation effects.
#4 Threshold Value of Efficiency
The CE of GS is not a constant value. To optimize the scale of GS construction, improve the cooling capacity of GSs, and guide urban planning, Yu et al. introduced the concept of the ‘law of diminishing marginal utility’ in economics and proposed the concepts of CE and the threshold value of efficiency (TVoE) [40,55]. The CE of a GS patch is defined as the LST difference between the patch and its neighboring urban area, whereas the cooling efficiency is defined as the curve between the area (variable) and maximum cooling intensity of each GS. The point at which the cooling efficiency stabilizes is the TVoE (Figure 9a). When the GS area exceeds this threshold, the cooling efficiency of the GS will decreases. However, there are differences in how the threshold is determined, owing to ununified definitions of the threshold concept. The cooling intensity of the GS is logarithmically related to the size of the patch area. As the patch area increases, the cooling intensity also increases. However, the rate of increase gradually slows; therefore, some scholars believe that when the slope of the fitted logarithmic curve is 1, the corresponding area value is the TVoE (Figure 9b) [9,85,86]. There are also differences in the results owing to differences in research perspectives.
There are differences in the size of the TVoE owing to differences in urban characteristics, urban morphology, and the degree of urbanization in the study area (Table 4). For example, Yu et al. studied the changes in land cover and LST during urbanization and calculated a TVoE of 4.55 ± 0.5 ha in Fuzhou [40]. Li et al. investigated the different CEs of GSs on the UHI in tropical megacities and found that in Dhaka, Kolkata, and Bangkok, the maximum intensities of UCI were 5.64, 8.07, and 4.83 °C, and the optimal GS areas were 0.37, 0.77, and 0.42 ha, respectively [87]. Wu et al. investigated the CE of wetlands in Chengdu and the effect of wetland spatial morphology (size, shape, and hydrological connectivity) on the CE, revealing that the cooling intensity increased logarithmically with increasing wetland area and a TVoE of 1.47 ± 0.34 ha [88]. Gao et al. found that the spillover of park CE was best when the park area in Zhengzhou was 6–8 ha and the GS area inside the park was ≥5–6 ha [89]. Demisse Negesse et al. studied the effectiveness of UGSs in cooling and mitigating microclimate change in Addis Abab, calculating a threshold of 4.5 ± 0.5 ha for GSs [90].
Several researchers have discovered a strong correlation between local climatic conditions and the TVoE. For instance, the TVoE is typically 0.5 ha for cities with a Mediterranean climate and a temperate monsoon climate [91]. However, the TVoE is 0.81, 0.71, 0.70, and 0.66 ha for urban parks in four distinct climatic contexts: warm temperate sub-humid monsoon climate (WTC), northern subtropical sub-humid monsoon climate (NSC), northern subtropical humid monsoon climate (NHC), and meso-subtropical humid monsoon climate (MSC), respectively [92]. Cities in the same climate zone can use these studies as a guide.
Studies have also examined how the cooling effect is affected by water bodies, urban features, vegetation cover, vegetation type, and seasonal fluctuations. For instance, Pang et al. discovered that GSs with water bodies have stronger CEs than those without water bodies and that GSs with water bodies have a TVoE of approximately 0.52 ha, while GSs with water bodies have no discernible TVoE in cold regions of China [93]. Zheng et al. showed that in arid/semi-arid and semi-humid areas, the optimal area ratios of water bodies to vegetation in parks were approximately 1:2 and 1:1, respectively, with a park area threshold of 16 ha. However, in humid regions, increasing the area of water bodies in parks maximized the park cooling intensity (PCI), with a park area threshold of 19 ha [94]. Thresholds also varied for different types of UGSs. For example, Wang et al. found that the built-up area forest TVoE was 4.5 ha, whereas the green belt forest and grassland TVoE were 9 ha and 2.25 ha, respectively, in Taiyuan [95]. Fan et al. analyzed the thresholds of seven hot and humid cities and found that when the urban average NDVI and average background temperature are high, a greenbelt of 0.92–0.96 ha is optimal. However, 0.60–0.62 ha is the ideal patch size when the average NDVI and background temperature in a city are low [85].
The TVoE is a cost-effective cooling indicator that can provide a quantitative reference for planning and may be a key solution for balancing urban modernization and eco-environmental protection [9], which is of great theoretical and practical significance to maximize the CE of using limited GSs compared to simply increasing the amount of GS [96]. However, studies on the TVoE of GSs and the results vary widely. Numerous factors influence the CE of GSs, such as the GS’s shape and location, seasonal and diurnal variations, height and density of buildings surrounding the GSs, and the city’s wind direction and speed. Furthermore, the cooling efficiency of GSs is calculated using single-year data in most existing studies, and the conversion of shortwave radiation into latent evaporation heat cannot be captured by remote sensing imagery. Additionally, the selective absorption and reflection of incident radiation, as well as the modulation of latent and sensible heat exchanges, can introduce errors in the thermal cycle of GSs, limiting the depth and breadth of the study and affecting its accuracy [40].
Table 4. Statistics of threshold-related studies (note: some data on the area and climate type of some studied cities were queried and supplemented to facilitate data comparison).
No.CityCity Area (km2)Climatic TypeThreshold Size (ha)Source TitleReference
1Fuzhou, China12,251Humid subtropical climate4.55Ecological IndicatorsYu et al. [55]
2Fuzhou, China12,251Humid subtropical climate4.55 ± 0.5Urban Forestry & Urban GreeningYu et al. [40]
3Beijing, China16,410.54Temperate Monsoon Climate (TMC)0.5Scientific ReportsYu et al. [91]
Tianjin, China11,966.45
Tangshan, China13,472
Xi’an, China10,108
Rome1200Mediterranean Climate (MC)
Florence102.4
Milan181.67
Lisbon100.05
4Hong Kong, China1106Marine Subtropical Monsoon Climate0.60–0.62Agricultural and Forest MeteorologyFan et al. [85]
Jakarta, Indonesia662Tropical Monsoon Climate0.60–0.62
Kaohsiung, China2952Tropical Monsoon Climate0.92–0.96
Kuala Lumpur, Malaysia243Tropical Rain Forest0.92–0.96
Mumbai, India603Tropical Savanna Climate0.60–0.62
Singapore, Singapore719Tropical Rain Forest0.60–0.62
Tainan, China2192Subtropical Monsoon Climate0.92–0.96
5Copenhagen, Denmark88Temperate maritime climate0.69Sustainable Cities and SocietyYang et al. [23]
6Taiyuan, China6988Warm temperate continental monsoon climate4.5, 9, 2.25Journal of Environmental Engineering and Landscape ManagementWang et al. [95]
7Nanning, China22,112Humid subtropical monsoon climate0.3Sustainable Cities and SocietyTan et al. [86]
8Chengdu, China14,335Subtropical monsoon climate1.47 ± 0.34Building and EnvironmentWu et al. [88]
9Fuzhou, China12,251Humid subtropical climate0.57WaterCai et al. [9]
10Beijing, China16,410.54Temperate monsoon Climate (TMC)0.53Urban EcosystemsPang et al. [93]
Tianjin, China11,966.450.57
Xi’an, China10,7520.55
Zhengzhou, China74460.44
11Dacca, Bangladesh360Subtropical monsoon climate0.37Frontiers in Environmental ScienceLi et al. [87]
Calcutta, India187,33Tropical monsoon climate0.77
Bangkok, Thailand1568.73Tropical monsoon climate0.42
12Fuzhou, China12,251Humid subtropical climate1.08Journal of Cleaner ProductionYao et al. [97]
13207 urban parks in 27 cities in Shanghai, 9 cities in Anhui Province, 10 cities in Jiangsu Province and 7 cities in Zhejiang Province/Warm temperate Subhumid Monsoon Climate (WTC)0.81Science of the Total EnvironmentGeng et al. [92]
North Subtropical Subhumid Monsoon Climate (NSC)0.71
North subtropical Humid Monsoon Climate (NHC)0.7
Central Subtropical Humid Monsoon Climate (MSC)0.66
1429 cities in China/Arid/semi-arid regions;
Subhumid and humid climates
16International Journal of Environmental Research and Public HealthZheng et al. [94]
15Zhengzhou, China7567 (Research area 1019.5)Temperate continental monsoon climate6~8Frontiers in Earth ScienceGao et al. [89]
16Addis Ababa, Ethiopia540Subtropical highland climate4.5 ± 0.5 haJournal of Water and Climate ChangeDemisse Negesse et al. [90]
To increase the accuracy of the findings and provide urban planners with a solid reference, future research should consider using multiyear data and include studies from more cities. In addition to lowering the temperature and enhancing the microclimate, UGSs offer a wealth of recreational and cultural opportunities. To guarantee that the GS area satisfies its requirements, these functions should be considered in the planning and design. However, it is also essential to prioritize modest GS planning, given the limited GS resources and pressing need to reduce the UHI effect.
#5 Driving Factors Recognition
Determining the main GS factors influencing LST is crucial for reducing the UHI effect, which has a significant impact on climate change adaptation, environmental preservation, and resident comfort, in addition to assisting urban planners and decision makers in optimizing UGS layouts and cooling capacity.
The selected driving factors, research technique, and findings varied because of variations in the study site conditions. The research techniques can be divided into two categories: geodetectors and statistical procedures, and the most popular techniques are statistical methods. Shafizadeh-Moghadam et al. used four models—Random Forest (RF), generalized additive model, BRT, and support vector machine—to investigate the spatial effects of LST and primary interactions among the influencing factors in the Tehran Metropolitan Area, Iran. The findings indicated that 86% of the fluctuations in urban surface temperature were explained by elevation, land use, land cover, and the NDVI [98]. Wang et al. used an RF regression model to quantify the driving factors in the central area of Shanghai and showed that building density, percentage of water body area, percentage of vegetation area, building height, distance from the Yangtze River, and average GS patch area were the most important factors influencing changes in LST [99]. Geodetectors have emerged as a novel approach for driver research in recent years. Hu et al. investigated eleven possible LST drivers at four different levels and used a geodetector model to rank how well these factors explained LST. The findings indicated that imperviousness and greening were the two factors that most explained the LST for the entire city and the main urban core [100]. Li et al. examined the potential influences on LST changes in the Yakutsk region using a geo-detector and showed that changes in the Normalized Difference in Buildings Index and land use transfer were the main drivers of LST changes in the city [101].
#6 Cooling Effect of Green Space
By controlling shading, photosynthesis, evaporation–transpiration, and air movement shielding, GSs can provide surface heat exchange structures and help create UCI areas and cooler microclimates. GSs are also essential for controlling urban thermal environments. Compared to open areas devoid of vegetation, trees diminish wind speeds and trap heat and humidity beneath the urban canopy, resulting in higher nighttime temperatures and lower average daily temperatures [102]. Estoque et al. showed that the average LST of impervious surfaces was ~3 °C higher than that of GSs, further highlighting the important role of GSs in mitigating the UHI effect [13].
Factors affecting the CE of GSs include the physical characteristics of the GS (e.g., shape, size, vegetation index, and surrounding land use type) and the layout and spatial configuration of the GS. The scale of the study objects ranged from individual parks and neighborhoods to the whole city. The GS size has a significant impact on CE, and larger, simpler shaped, less fragmented, and more connected GSs are associated with lower LST [103]. Algretawee showed that large parks cooled the most, with a mean cooling interval of 3.28 °C and a mean cooling distance of 2500 m [104]. Menteş et al. selected three scales of GSs, small (0.58 ha), medium (1.50 ha), and large (17.0 ha), in the province of Elazig, Turkey, to observe the CE on internal and external buffers, and the results showed that the average LST of small-, medium-, and large-scale GSs was 2.4 °C, 4.3 °C, and 5.7 °C lower than that of the city center, respectively [105]. Bao et al. found that the larger the UGS area and mean NDVI, the longer the cooling distance [106].
Compared with clustered GSs, uniformly dispersed GSs had a higher CE [106]. CEs were provided more efficiently by GSs with higher tree densities [107]. According to Xu et al., improving the spatial distribution of GS to ensure that they are evenly dispersed decreases average urban LSTs by 1.06 °C, while increasing GS cover decreases average urban LSTs by 4.73 °C. Combining the two measures results in synergistic CEs that provide extra cooling advantages (0.034–0.341 °C) [108]. Thus, expanding the GS region is crucial in practice; however, this should also consider their general dispersion.
Simultaneously, the CE is significantly affected by the GS shape. Compared to compact GSs, ribbon-shaped GSs can reach CEs over greater distances [109], and the lowest LST is associated with large GSs with a high degree of green coverage and connectivity as well as those dispersed in the leeward direction of rivers [83]. Yang et al. examined the CE of blue-green spaces in Copenhagen during various seasons and found that blue-green spaces with complex shapes had a somewhat higher CE [23]. Nevertheless, other studies have indicated that the cooling distance of certain GS regions decreases as the form of the GS becomes more complex.
A scientific understanding of the CE of UGSs is helpful for the rational layout of UGSs in urban planning, reducing the UHI effect, and improving the quality of life of urban residents [97].
#7 Urban Planning and Design
As cities comprise multiple elements, the reasonable planning and design can better promote the improvement of the thermal environment through UGSs. With the deepening of the research, a growing number of scholars are exploring how UGSs and other urban elements can synergistically work together in order to improve the microclimate environment of the city and to mitigate the UHI effect using new techniques such as computer visualization, regression analysis, geographic information, and computer simulation instead of simply studying the effect of UGSs on urban temperature.
Urban morphological features, including the height, density, and layout of buildings, directly impact the thermal environment of cities. Sun et al. analyzed the relative contributions of urban form indicators (nighttime light intensity, building density, floor area ratio, road density, point-of-interest density, water surface ratio, and NDVI) to LST on three observational scales (100, 200, and 400 m) using OLS and RF [110]. In addition to increasing the coverage of vegetation and water bodies, the construction of high-rise and low-density urban buildings may be an effective measure to create a comfortable outdoor thermal environment. There were also interactive effects of urban landscape structural features and GS patterns on LST. For example, Zhou et al. used satellite images, the local contour tree algorithm, and the eXtreme gradient boosting (XGBoost) model to illustrate the interaction effects of landscape structure and LST in urban agglomerations at the spatial level in the Xi’an metropolitan area. The effects of some landscape structure indicators on LST are suppressed or facilitated by increases in other indicators, e.g., in the core area, with an increase in the spatial level of the urban thermal environment, the importance of impervious surfaces and UGSs on LST increased from 40.7% to 62.0% and decreased from 41.4% to 25.6%, respectively [111]. Liu et al. used machine learning, deep learning, and computer vision methods to predict LSTs based on street GS morphology and the surrounding built environment and explored their interaction. The results showed that streets with high levels of green environment exposure (Green View Index > 0.4 and NDVI > 4) accommodated more types of GS forms while maintaining the CE. Moreover, increased proportions of vegetation with simple geometry (Fractal Index < 0.2), large leaves (Fractal Dimension < 0.65), light-colored leaves (Chlorophyll Spectral Index > 13), and high leaf densities (Tree Density Estimate > 3) were proposed for streets with low levels of green environment exposure (Green View Index < 0.1 and NDVI < 2.5) [26]. The results of Norouzi et al. showed that park area, tree cover, and the presence of water bodies are the most influential design-related factors for improving cooling performance and that the urban structure can influence the overall cooling performance by affecting airflow patterns and shading [112]. Feng et al. applied explainable artificial intelligence to explain the non-linear interactions between LST and urban characteristics, and the results showed that the most important characteristics affecting LST in the inner city are the scale and height of buildings, while in the outer city, these are the height of trees and the compactness of impervious surfaces [113]. These findings can inform urban planning and design.
UGSs not only play an important role in mitigating the UHI effect and extreme heat but also synergistically contribute to the enhancement of a wide range of ecosystem services, including carbon sequestration, water retention, air quality improvement, and meeting the needs of residents for recreation and leisure. UGSs and other urban elements can further synergize to enhance the overall benefits of ecosystem services through sound urban planning and design. For example, the optimal combination of various types of blue-green systems and their connectivity provides multiple ecosystem services while enhancing the potential for heat reduction and regional ecological well-being [114]. Zhou et al. revealed the win–win interaction between blue and GSs for cooling, where the integration of water bodies and GSs can enhance the potential for mutual cooling. The LST of a riverfront GS is 4.2 °C lower than that of a non-riverfront GS at the same scale during the daytime in the summer, and the air temperature is 3.7 °C lower [27]. Moreover, the air temperature of a river decreases an additional 1–2.9 °C when surrounded by GSs. However, some researchers argue that the CE is not significant when the scale of the GSs and water bodies is small [81]. Therefore, the construction of a blue-green space network should be considered in urban planning to form a continuous ecological corridor through the connectivity of water bodies and GSs to enhance the ecological function and thermal comfort of the city and thus to improve the overall effectiveness of ecosystem services.

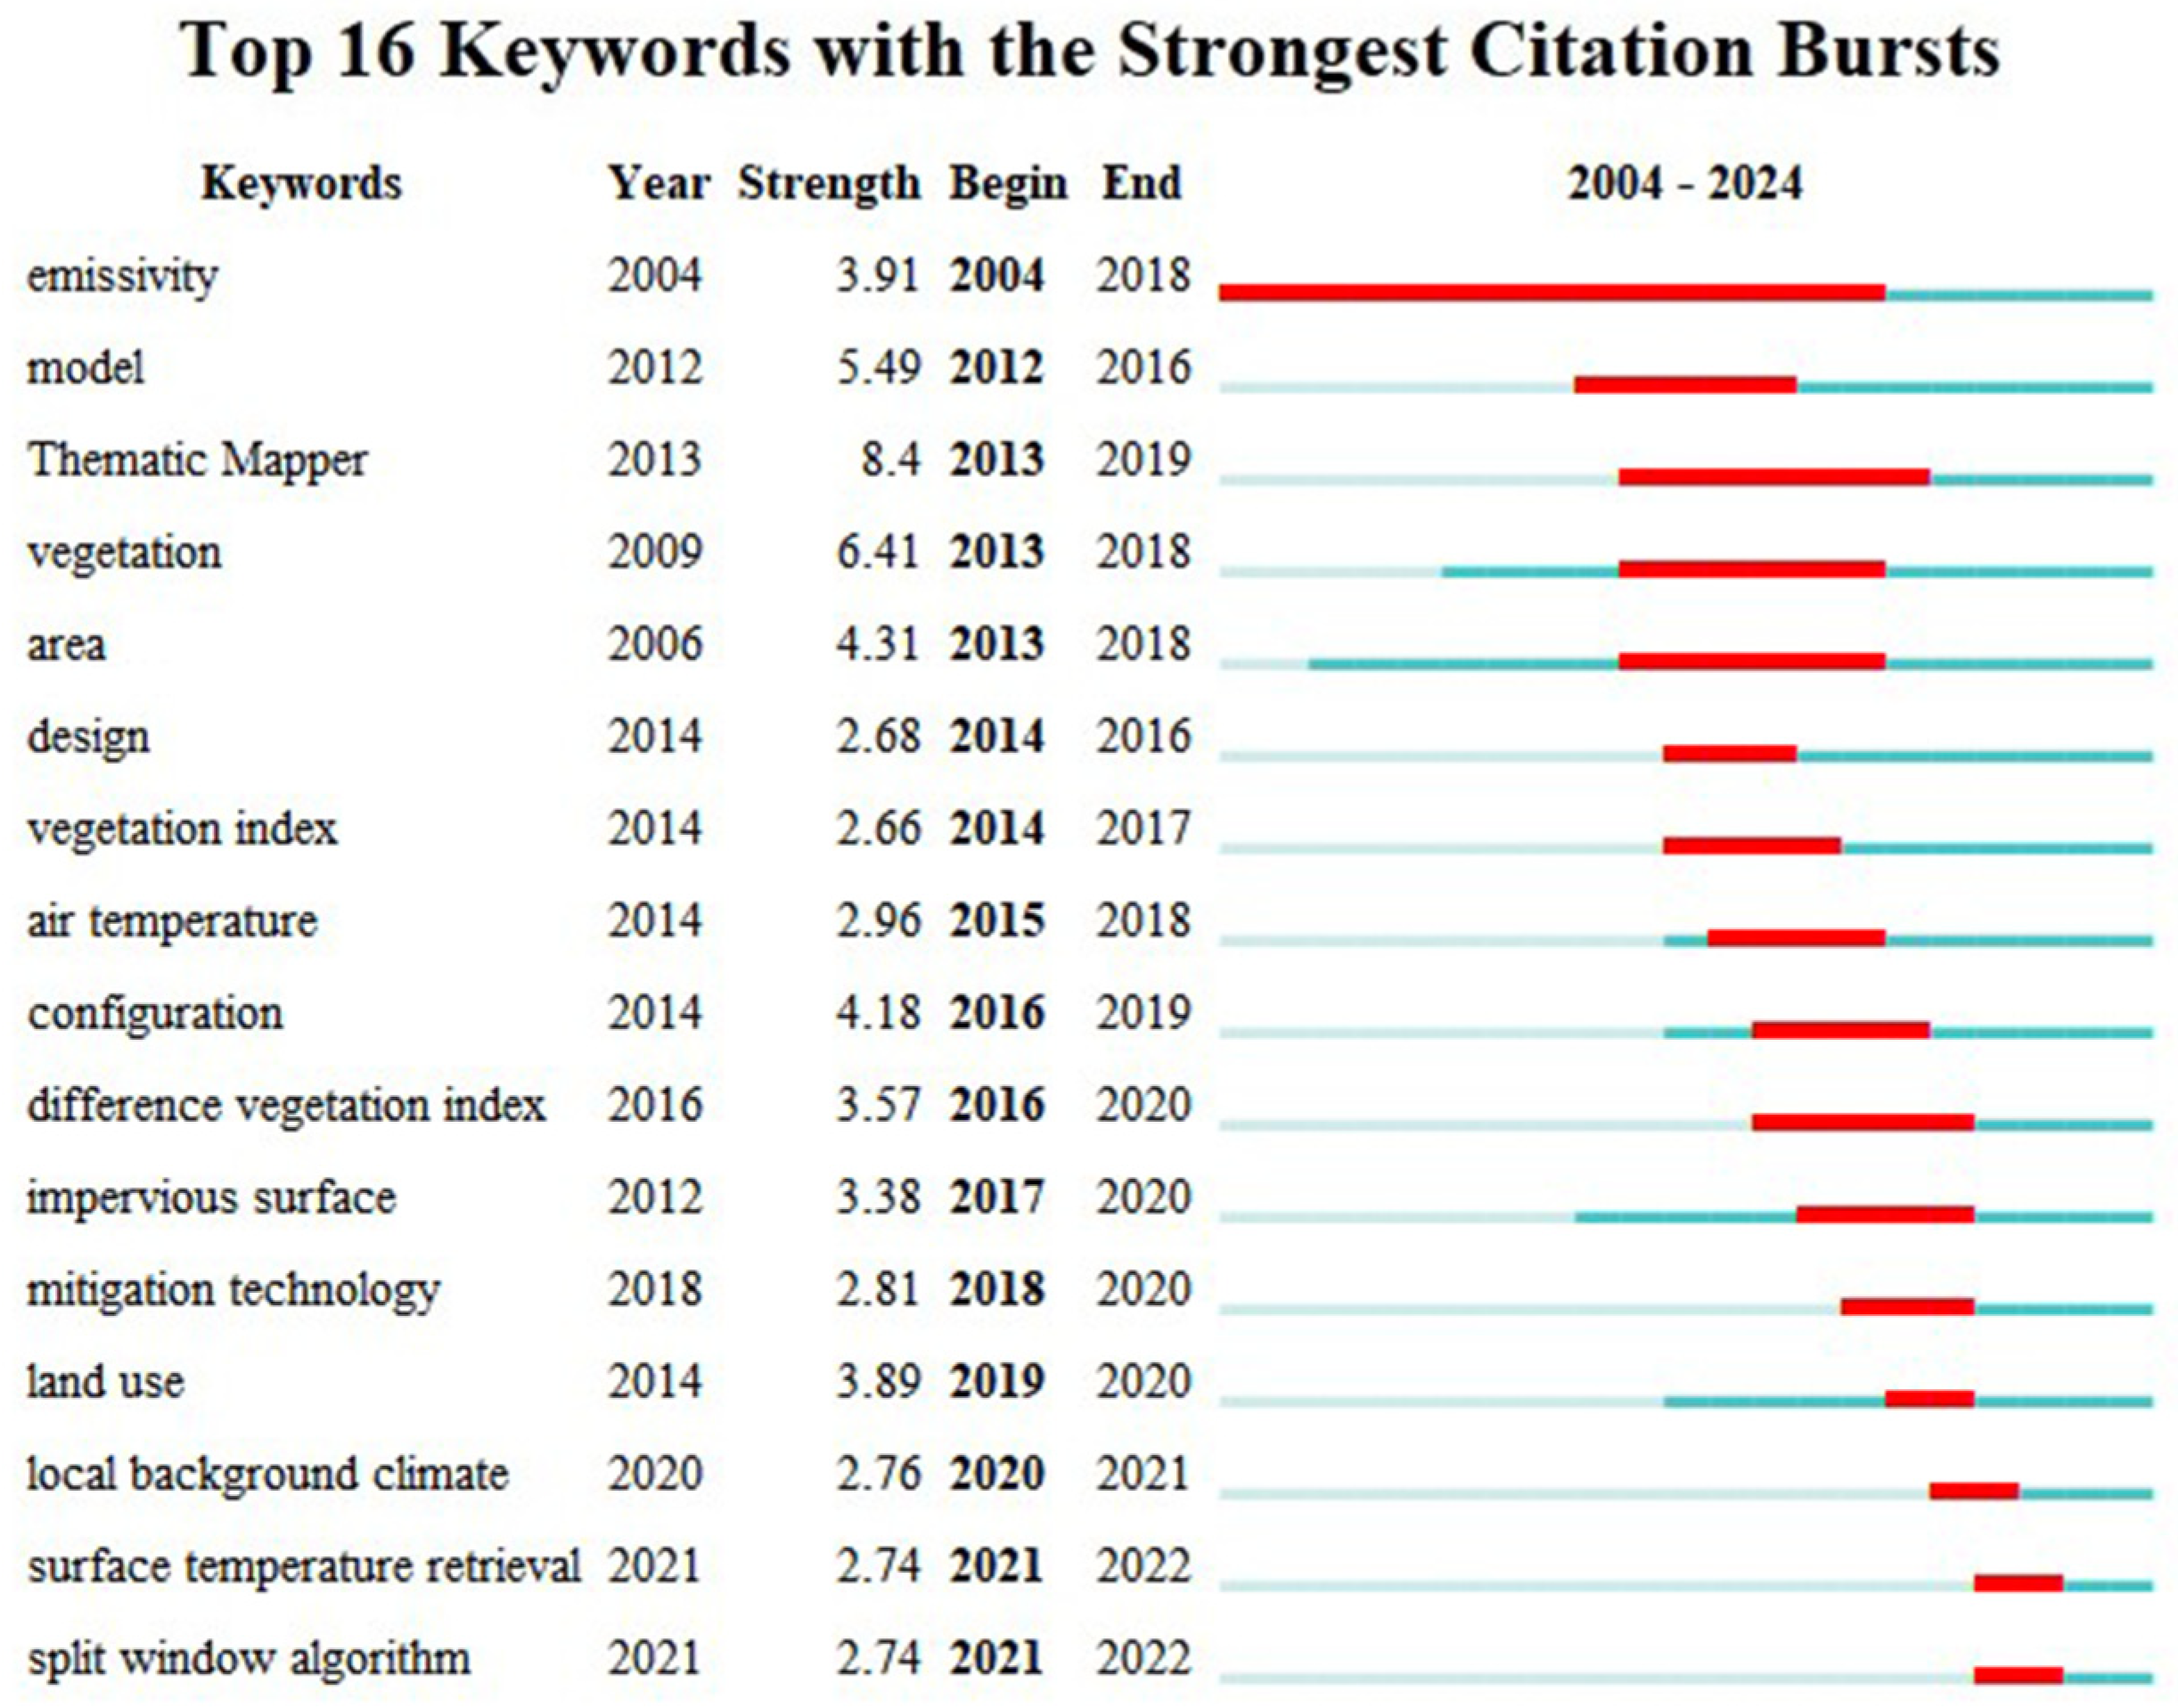
3.3.3. Frontier Analysis

CiteSpace was used to identify the research frontiers of UGSs and LST from 2004 to 2024 and to generate keyword mapping, which yielded 16 emergent words (Figure 10), including “emissivity”, “model”, “Thematic Mapper”, and “area”, reflecting the evolution of frontiers in this research area.
The analysis of the three phases of the UGS and LST research fields found that the emergent word in the budding phase (2004–2010) was “emissivity”; this is a physical quantity that describes the ability of a land surface or an object to emit infrared radiation and plays an important role in the estimation of LST and the assessment of the thermal environment. “Emissivity” is a key parameter in LST estimation, and its accuracy directly affects LST inversion results. Researchers have estimated emissivity using different methods and applied it to the inversion of LST. The emergent words in the slow development stage (2011–2018) were “model”, “Thematic Mapper”, “vegetation”, “area”, “design”, “vegetation index”, “air temperature”, “configuration”, “difference vegetation index”, “impervious surface”, and “mitigation technology”. The term “configuration” covers a number of dimensions, such as landscape, land use, and blue-green space. The “Vegetation index”, especially the NDVI, is commonly used to measure the growth and coverage of vegetation, which can not only visualize the relationship between GSs and LST but also reflect the changes in GSs and evaluate its ecological benefits. The research hotspots in this stage mainly focused on two aspects: exploring the influence of different configurations on LST and studying the relationship between vegetation indices and LST.
The emergent words in the rapid development stage (2019–2024) were “land use”, “local background climate”, “surface temperature retrieval”, and “split window algorithm”. In this phase, research gradually shifted to the impact of land use changes (e.g., shifting of UGSs and increase in impervious surfaces) on LST, the UHI effect and CE of GSs under different background climates, and the development and application of LST inversion techniques. Urbanization has a significant impact on LST through the construction of different infrastructures in urban areas for residential, transportation, industrial, etc., purposes, which generates a large number of land use changes that disrupt the surface energy balance [115]. Understanding the relationship between different urban land use categories and the urban thermal environment is crucial for urban planning, resource allocation, and decision support. The heat island intensity and CE of GSs vary significantly across different local background climates, resulting in findings that cannot be generalized. To better understand the cooling mechanism and UHI of GSs under various background climates, researchers have simultaneously and comparatively studied several objects under various background climates. Consequently, mitigation strategies are targeted to reduce risks associated with climate change. For example, Cui et al. studied the spatiotemporal dynamics of daytime and nighttime surface urban heat islands (SUHIs) and the cooling mechanism of UGSs in seven megacities under three global background climate zones. The daytime SUHI was highest (0–10 °C) in the temperate zone and lowest (−1–2 °C) in the arid zone; the daytime SUHI was higher than nighttime in the cold-temperate zone and lower than nighttime in the arid-temperate zone. The CE of the UGS during the daytime was highly dependent on the background climate (cold > temperate > arid), and when the UGS fraction is greater than 0.48, 0.82, 0.97, and 0.95, the nighttime SUHI can effectively be offset [116]. With the rapid development of remote sensing technology, LST inversion has become a major hotspot, which is able to provide high-precision and wide-range LST data, providing solid basic data support for the study of the impact of UGSs on LST.

3.3.4. Future Research Directions

In the future, GS configuration patterns and blue-green spatial layouts will remain hotspots for urban heat mitigation research, and further efforts are required.
  • An in-depth and accurate understanding of the spatiotemporal characteristics of UGSs and LST is crucial for mitigating localized urban heat. Composition and configuration are two important dimensions that affect the CE of UGSs [117]; therefore, the composition and configuration of landscapes will remain a focus of future research. However, the selection of UGS configuration indicators and the number of independent variables in existing studies are mostly limited. With the development of machine learning and spatial regression modeling, research is not limited to simple regression and linear relationships; it can elucidate what type and form of UGS can effectively reduce LST from a spatiotemporal heterogeneity perspective and can deeply evaluate the heat mitigation services of GSs to provide more accurate urban planning and policy recommendations [118].
  • Water body space has huge cooling potential, and it will remain a key research topic in the future to deeply investigate the quantitative relationship between blue-green spatial coupling and LST and to explore the CE of blue-green spaces on the thermal environment at multiple spatial scales. Future research should focus on building an ecological network with the thermal mitigation effect of blue-green space as the core and optimizing the urban ecological layout through the establishment of ecological corridors and ecological nodes. Research on the non-linear factors affecting the cold island effect of blue-green space and the CE and its influencing factors on the microscopic scale should be strengthened, especially regarding the influence of the characteristics of plant communities and the spatial structure relationship of water bodies on synergistic CE. The exploration of seasonal changes and diurnal differences in the CE of blue-green spaces should also be a major focus.
  • Multi-disciplinary integration should be promoted in the future, and UGS and LST research should be combined with ecological, urban planning, climatologic, and other related fields of research to guide the optimal design and mitigation of UGSs and to apply the theoretical research results to specific urban planning and design practices.

4. Conclusions and Limitations

4.1. Conclusions

Based on 740 studies in the WOS database, this study adopted scientometric analysis to reveal the research hotspots, trends, and frontiers on the influence of UGSs on LST to gain a deeper understanding of the knowledge structure, evolutionary history, research hotspots, and development trends and predict future research trends.
The research results showed the following:
(1)
Evolution history. The number of annual publications and citations showed an overall increasing trend, highlighting the increasing attention paid to the field by academics and the public. From 2019 to 2024, both the number of publications and citations increased rapidly, and the research content has become increasingly rich and diversified, covering a wide range of research areas.
(2)
Countries, institutions, author contributions, and cooperation. Nationally, China, the USA, India, Germany, Iran, Australia, and other countries have published a large number of articles in this field that have made significant contributions to the research and have a certain degree of cross-country cooperation and exchange. Institutionally, Chinese Acad Sci, University of Chinese Academy of Science, Peking University, University of Tsukuba, Beijing Forestry University, Humboldt University, and other institutions have published the most in this field, laying a solid foundation and playing an important role in the accumulation of knowledge and academic development. However, the proximity of interinstitutional cooperation remains insufficient, and a well-established cooperation network is yet to be constructed among international institutions. Therefore, strengthening international cooperation and exchange is crucial and urgent for future development. At the author level, Murayama, Yuji, Haase, Dagmar, Vejre, Henrik, Yu, Zhaowu, and other prolific authors have published 13, 10, 8, and 8 papers, respectively, and have made significant contributions. Several collaborative clusters have also been formed among the authors to help develop this research field. However, international authors have not yet formed a close cooperation network among themselves, and most cooperation is limited to universities in their respective countries, while international academic exchanges and cooperation are scarce. To promote global academic development in the field of the impact of UGSs on LST, it is particularly important to strengthen academic exchange among international scholars.
(3)
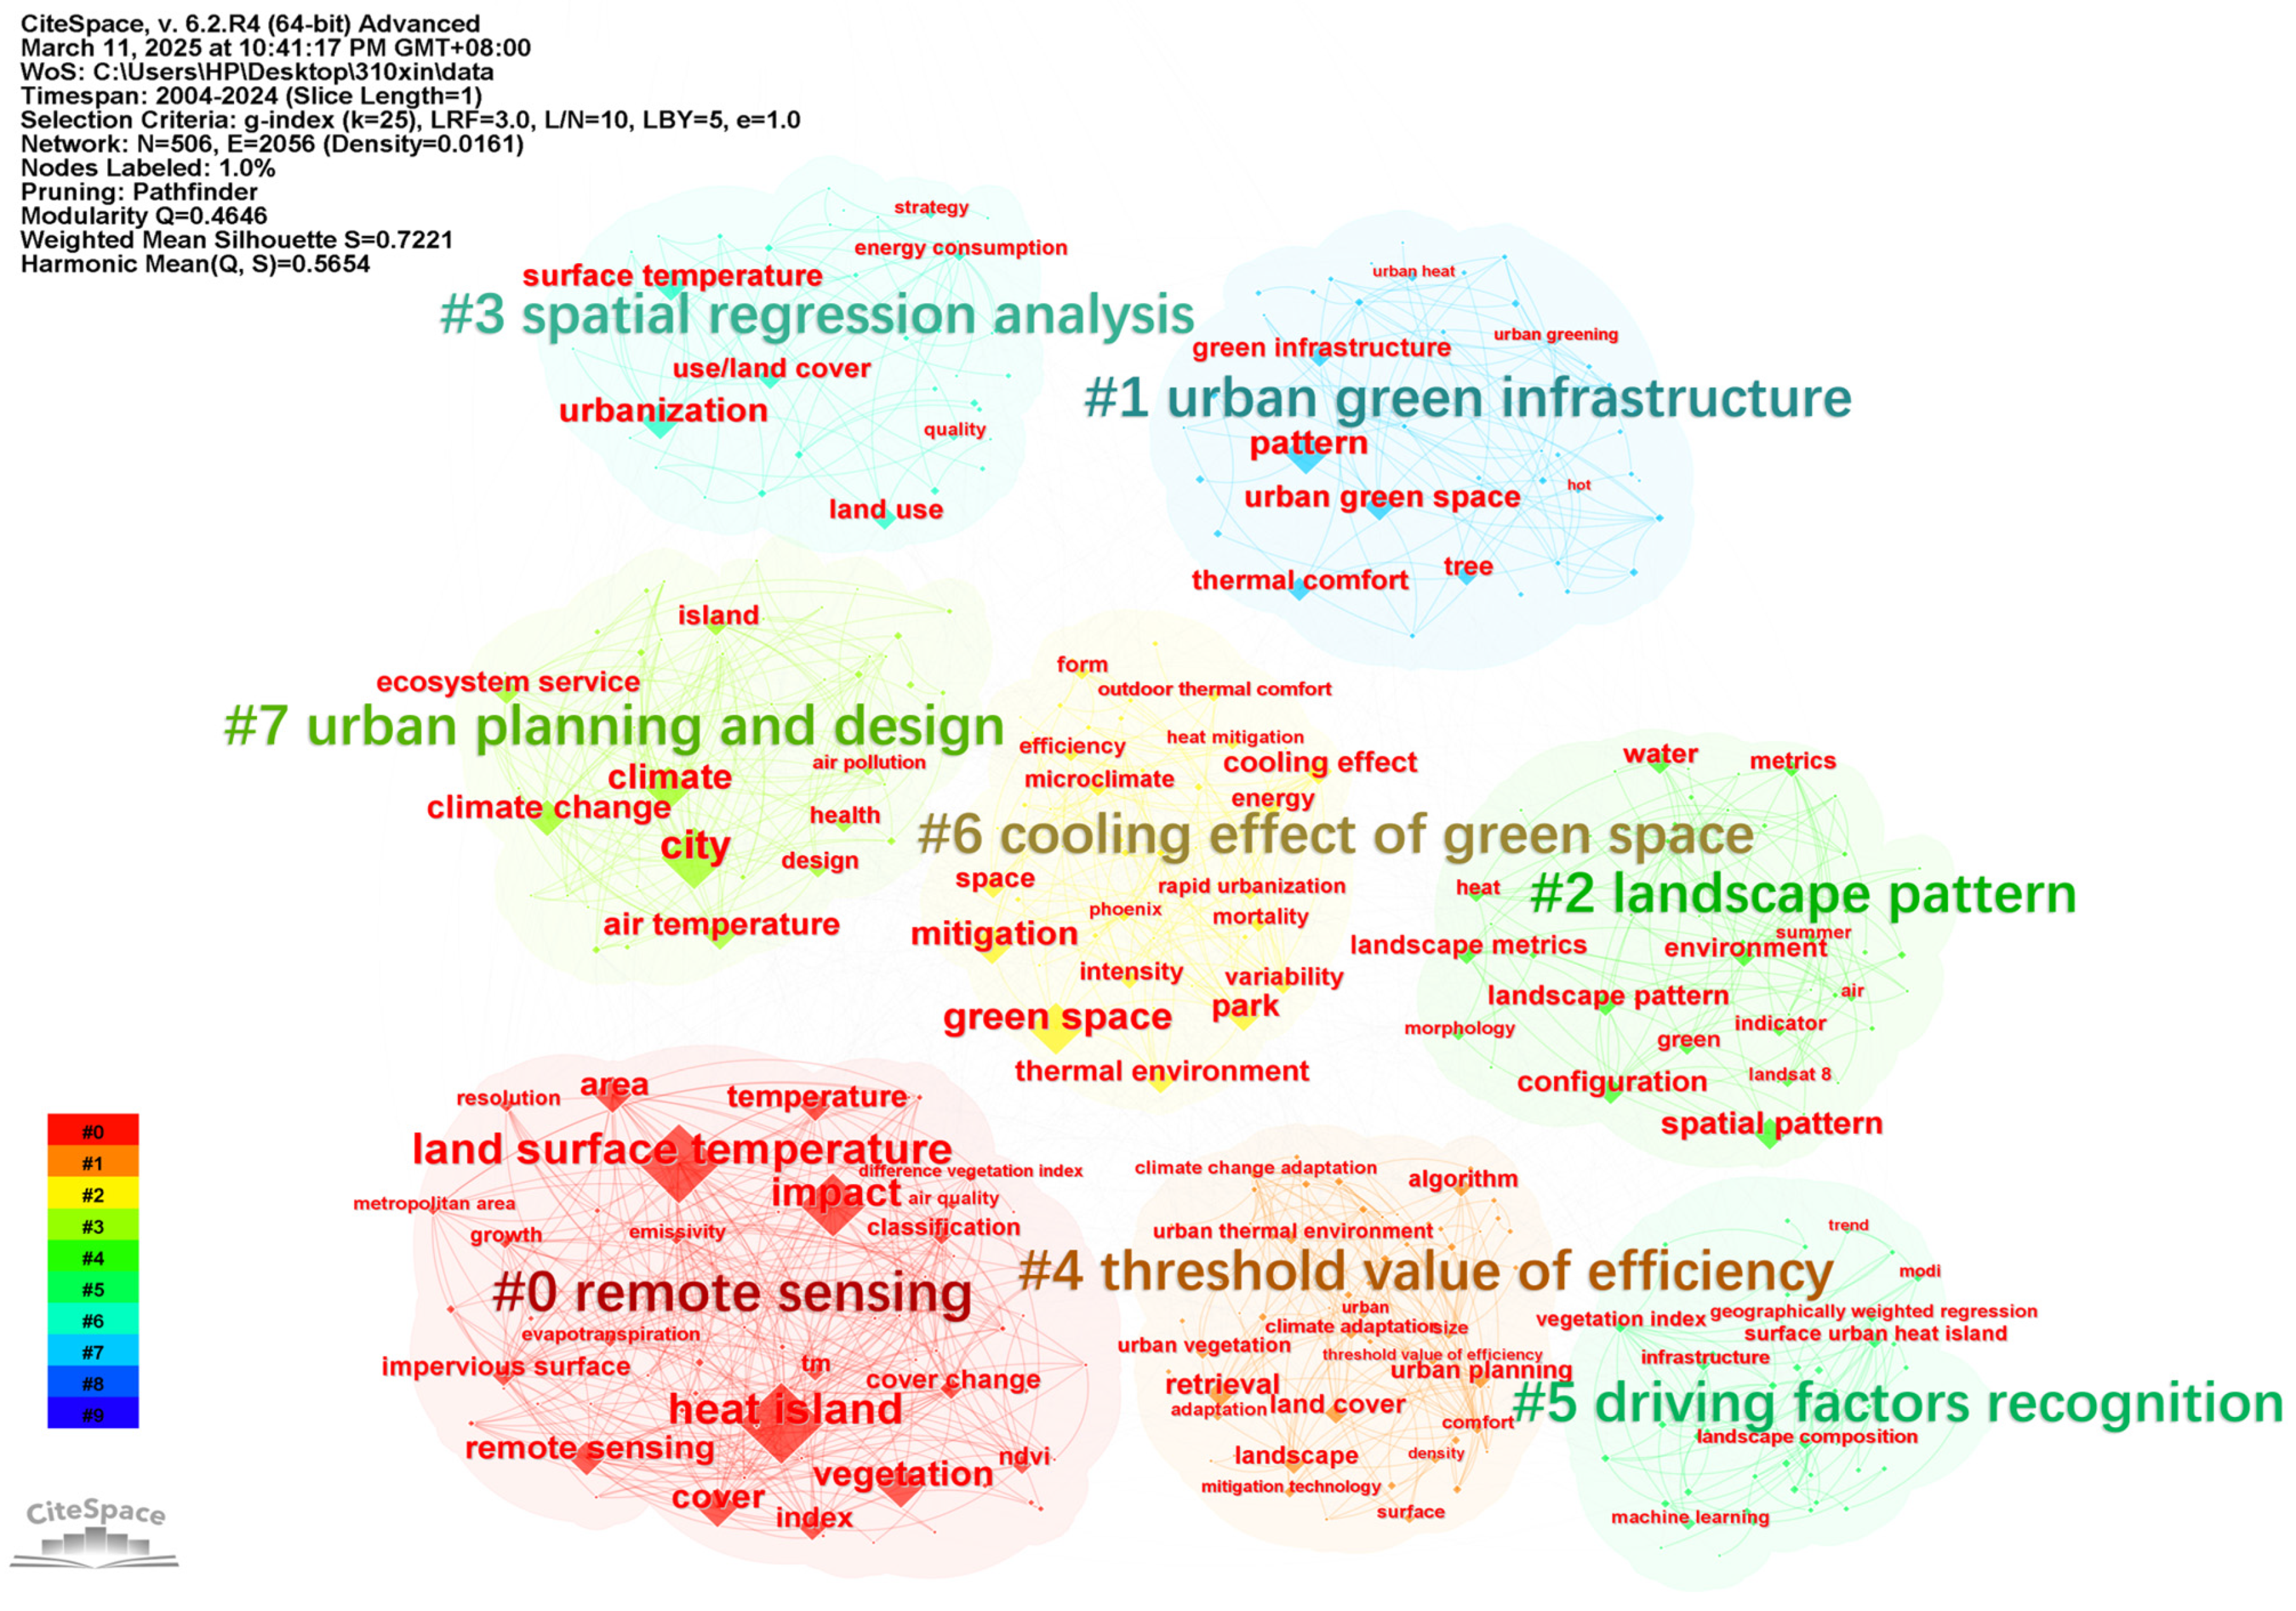
Knowledge structure and research scope. Fourteen clustering labels were generated in CiteSpace, reflecting multiple research directions and categories in the fields of UGSs and LST, and eight of the main clustering labels were summarized in detail. These research topics not only hold a significant position in current academic studies but also require further investigation to uncover and address their underlying scientific challenges.
(4)
Future trends and key directions. In the future, landscape configurations and blue-green spaces will continue to be hotspots for research in this field, and further efforts will be required. Remote sensing technology will remain essential for accurately monitoring the spatial distribution and types of UGSs and their relationship with LST. It will further enhance UGS mapping, quantitative analysis, and LST monitoring while continuously optimizing models for predicting changes in the urban thermal environment. This will provide valuable scientific support for urban planning and management decisions and support sustainable urban development and climate adaptation strategies. Spatial regression analysis and the study of dominant GS driving factors affecting LST should also be applied in depth to further clarify the influence of each factor on LST in different spatial configurations and scales, strengthen the ability to interpret spatial data, more accurately propose strategies for optimizing the layout of UGSs, and realize a more efficient thermal mitigation effect. Regarding threshold research, emphasis should be placed on integrating multi-year data and expanding studies to include more case cities. This approach will enhance the accuracy of research findings, provide stronger references for urban planning, and ensure more scientific and universally applicable decision-making. In the future, multi-disciplinary integration should be promoted, and the research fields of UGSs and LST should be combined with ecological, urban planning, climatological, and other related research to guide the optimal design and mitigation of UGSs and apply the theoretical research results to specific urban planning and design practices.
(5)
Planning and design strategy recommendations. Urban planners and policymakers should fully consider and optimize the layout pattern of UGSs in urban planning and increase the area and number of UGSs as much as possible, especially in city center areas and high-density development areas, and prioritize the allocation of sufficient UGSs to mitigate the UHI effect effectively. Micro-indicators such as the shape, vegetation index, and layout pattern of UGSs can also be incorporated into considering the impact on the CE during the planning process to maximize their cooling capacity. At the same time, it is recommended that the connectivity between existing UGSs be enhanced to improve the problem of severe fragmentation and dispersion of GS patches and to strengthen the maintenance and management of UGSs. Finally, it is recommended that a network of blue-green spaces be considered to form continuous ecological corridors through the connectivity of water bodies and GSs to enhance the city’s ecological function, thermal comfort, and urban resilience.

4.2. Limitations

This study used the WOS database, which is renowned for its high-quality and high-impact journals published globally since 1900, to ensure data reliability and credibility. We conducted a thorough analysis using the robust features of WOS, including citation tracking, paper journal evaluation, and discipline classification. However, relying solely on a single database may have limited the scope for our study. Future research could benefit from incorporating additional databases to enhance the comprehensiveness of scientometric analyses, thereby providing more nuanced insights into research trends and hotspots.

Author Contributions

Conceptualization, T.Z. and H.Q.; methodology, H.Q.; software, T.Z.; validation, T.Z., X.W. and Y.L.; formal analysis, T.Z.; investigation, T.Z. and X.W.; resources, T.Z. and Y.L.; data curation, T.Z. and H.Q.; writing—original draft preparation, T.Z.; writing—review and editing, H.Q.; visualization, T.Z. and X.W.; supervision, H.Q.; funding acquisition, H.Q. All authors have read and agreed to the published version of the manuscript.

Funding

This research was funded by the National Natural Science Foundation of China, grant number 32101578; the Ministry of education of Humanities and Social Science project, grant number 20YJC760077; the Research Foundation of Education Bureau of Hunan Province, China, grant number 22B0256; and the Provincial Teaching Reform Research Project of Degree and Graduate Education, grant number 2023JGYB164.

Data Availability Statement

Not applicable.

Conflicts of Interest

The authors declare no conflicts of interest.

References

  1. World Cities Report 2022: Envisaging the Future of Cities. UN-Habitat. 2022. Available online: https://digitallibrary.un.org/record/3984713/files/9789210054386.pdf (accessed on 25 February 2025).
  2. Yang, L.; Yu, K.; Ai, J.; Liu, Y.; Lin, L.; Lin, L.; Liu, J. The Influence of Green Space Patterns on Land Surface Temperature in Different Seasons: A Case Study of Fuzhou City, China. Remote Sens. 2021, 13, 5114. [Google Scholar] [CrossRef]
  3. Weng, Q.; Lu, D.; Schubring, J. Estimation of Land Surface Temperature–Vegetation Abundance Relationship for Urban Heat Island Studies. Remote Sens. Environ. 2004, 89, 467–483. [Google Scholar]
  4. Zheng, Y.; Li, Y.; Hou, H.; Murayama, Y.; Wang, R.; Hu, T. Quantifying the Cooling Effect and Scale of Large Inner-City Lakes Based on Landscape Patterns: A Case Study of Hangzhou and Nanjing. Remote Sens. 2021, 13, 1526. [Google Scholar] [CrossRef]
  5. Calvin, K.; Dasgupta, D.; Krinner, G.; Mukherji, A.; Thorne, P.W.; Trisos, C.; Romero, J.; Aldunce, P.; Barrett, K.; Blanco, G.; et al. IPCC, 2023: Climate Change 2023: Synthesis Report. Contribution of Working Groups I, II and III to the Sixth Assessment Report of the Intergovernmental Panel on Climate Change; Core Writing Team, Lee, H., Romero, J., Eds.; IPCC: Geneva, Switzerland, 2023. [Google Scholar]
  6. Santamouris, M.; Cartalis, C.; Synnefa, A.; Kolokotsa, D. On the Impact of Urban Heat Island and Global Warming on the Power Demand and Electricity Consumption of Buildings—A Review. Energy Build. 2015, 98, 119–124. [Google Scholar]
  7. Mora, C.; Dousset, B.; Caldwell, I.R.; Powell, F.E.; Geronimo, R.C.; Bielecki, C.R.; Counsell, C.W.W.; Dietrich, B.S.; Johnston, E.T.; Louis, L.V.; et al. Global Risk of Deadly Heat. Nat. Clim. Change 2017, 7, 501–506. [Google Scholar]
  8. Taylor, J.; Wilkinson, P.; Davies, M.; Armstrong, B.; Chalabi, Z.; Mavrogianni, A.; Symonds, P.; Oikonomou, E.; Bohnenstengel, S.I. Mapping the Effects of Urban Heat Island, Housing, and Age on Excess Heat-Related Mortality in London. Urban Clim. 2015, 14, 517–528. [Google Scholar]
  9. Cai, Y.-B.; Wu, Z.-J.; Chen, Y.-H.; Wu, L.; Pan, W.-B. Investigate the Difference of Cooling Effect between Water Bodies and Green Spaces: The Study of Fuzhou, China. Water 2022, 14, 1471. [Google Scholar] [CrossRef]
  10. Dutta, P.; Sathish, L.; Mavankar, D.; Ganguly, P.S.; Saunik, S. Extreme Heat Kills Even in Very Hot Cities: Evidence from Nagpur, India. Int. J. Occup. Environ. Med. 2020, 11, 188–195. [Google Scholar]
  11. Zhang, M.; Wang, J.; Zhang, F. The Influence of Spatial Heterogeneity of Urban Green Space on Surface Temperature. Forests 2024, 15, 878. [Google Scholar] [CrossRef]
  12. Khajuria, N.; Kaushik, S.P. Dynamic Trends in Land Surface Temperature and Land Use/Land Cover Transitions in Semi-Arid Metropolitan City, Jaipur. Environ. Monit. Assess. 2024, 197, 47. [Google Scholar] [CrossRef]
  13. Estoque, R.C.; Murayama, Y.; Myint, S.W. Effects of Landscape Composition and Pattern on Land Surface Temperature: An Urban Heat Island Study in the Megacities of Southeast Asia. Sci. Total Environ. 2017, 577, 349–359. [Google Scholar] [CrossRef] [PubMed]
  14. Korcz, N.; Kamińska, A.; Ciesielski, M. Is the Level of Quality of Life Related to the Frequency of Visits to Natural Areas? Forests 2024, 15, 2257. [Google Scholar] [CrossRef]
  15. Gillespie, A. Land Surface Temperature. In Encyclopedia of Remote Sensing; Springer: New York, NY, USA, 2014; pp. 314–319. [Google Scholar]
  16. Feyisa, G.L.; Meilby, H.; Darrel Jenerette, G.; Pauliet, S. Locally Optimized Separability Enhancement Indices for Urban Land Cover Mapping: Exploring Thermal Environmental Consequences of Rapid Urbanization in Addis Ababa, Ethiopia. Remote Sens. Environ. 2016, 175, 14–31. [Google Scholar] [CrossRef]
  17. Jaber, S.M. On the Relationship between Normalized Difference Vegetation Index and Land Surface Temperature: MODIS-Based Analysis in a Semi-Arid to Arid Environment. Geocarto Int. 2021, 36, 1117–1135. [Google Scholar] [CrossRef]
  18. Ngom, R.; Gosselin, P.; Blais, C. Reduction of Disparities in Access to Green Spaces: Their Geographic Insertion and Recreational Functions Matter. Appl. Geogr. 2016, 66, 35–51. [Google Scholar] [CrossRef]
  19. Rahman, M.A.; Moser, A.; Rötzer, T.; Pauleit, S. Within Canopy Temperature Differences and Cooling Ability of Tilia Cordata Trees Grown in Urban Conditions. Build. Environ. 2017, 114, 118–128. [Google Scholar] [CrossRef]
  20. Maimaitiyiming, M.; Ghulam, A.; Tiyip, T.; Pla, F.; Latorre-Carmona, P.; Halik, Ü.; Sawut, M.; Caetano, M. Effects of Green Space Spatial Pattern on Land Surface Temperature: Implications for Sustainable Urban Planning and Climate Change Adaptation. ISPRS J. Photogramm. Remote Sens. 2014, 89, 59–66. [Google Scholar] [CrossRef]
  21. Amani-Beni, M.; Zhang, B.; Xie, G.-D.; Shi, Y. Impacts of Urban Green Landscape Patterns on Land Surface Temperature: Evidence from the Adjacent Area of Olympic Forest Park of Beijing, China. Sustainability 2019, 11, 513. [Google Scholar] [CrossRef]
  22. Kim, J.-H.; Gu, D.; Sohn, W.; Kil, S.-H.; Kim, H.; Lee, D.-K. Neighborhood Landscape Spatial Patterns and Land Surface Temperature: An Empirical Study on Single-Family Residential Areas in Austin, Texas. Int. J. Environ. Res. Public Health 2016, 13, 880. [Google Scholar] [CrossRef]
  23. Yang, G.; Yu, Z.; Jørgensen, G.; Vejre, H. How Can Urban Blue-Green Space Be Planned for Climate Adaption in High-Latitude Cities? A Seasonal Perspective. Sustain. Cities Soc. 2020, 53, 101932. [Google Scholar] [CrossRef]
  24. Cui, Y.; Guo, B.; Li, W.; Kong, X. Assessment of Urban Blue-Green Space Cooling Effect Linking Maximum and Accumulative Perspectives in the Yangtze River Delta, China. Environ. Sci. Pollut. Res. 2023, 30, 121834–121850. [Google Scholar] [CrossRef] [PubMed]
  25. Zhang, N.; Zhen, W.; Shi, D.; Zhong, C.; Li, Y. Quantification and Mapping of the Cooling Effect of Urban Parks on the Temperate Monsoon Climate Zone. Sustain. Cities Soc. 2024, 101, 105111. [Google Scholar] [CrossRef]
  26. Liu, Z.; Ma, X.; Hu, L.; Liu, Y.; Lu, S.; Chen, H.; Tan, Z. Nonlinear Cooling Effect of Street Green Space Morphology: Evidence from a Gradient Boosting Decision Tree and Explainable Machine Learning Approach. Land 2022, 11, 2220. [Google Scholar] [CrossRef]
  27. Zhou, W.; Cao, W.; Wu, T.; Zhang, T. The Win-Win Interaction between Integrated Blue and Green Space on Urban Cooling. Sci. Total Environ. 2023, 863, 160712. [Google Scholar] [CrossRef]
  28. Gago, E.J.; Roldan, J.; Pacheco-Torres, R.; Ordóñez, J. The City and Urban Heat Islands: A Review of Strategies to Mitigate Adverse Effects. Renew. Sustain. Energy Rev. 2013, 25, 749–758. [Google Scholar] [CrossRef]
  29. Yu, Z.; Yang, G.; Zuo, S.; Jørgensen, G.; Koga, M.; Vejre, H. Critical Review on the Cooling Effect of Urban Blue-Green Space: A Threshold-Size Perspective. Urban For. Urban Green. 2020, 49, 126630. [Google Scholar] [CrossRef]
  30. Chen, L.; Li, W.; Li, J.; Fu, Q.; Wang, T. Evolution Trend Research of Global Ocean Power Generation Based on a 45-Year Scientometric Analysis. J. Mar. Sci. Eng. 2021, 9, 218. [Google Scholar] [CrossRef]
  31. Nalau, J.; Verrall, B. Mapping the Evolution and Current Trends in Climate Change Adaptation Science. Clim. Risk Manag. 2021, 32, 100290. [Google Scholar] [CrossRef]
  32. Sharifi, A. Urban Sustainability Assessment: An Overview and Bibliometric Analysis. Ecol. Indic. 2021, 121, 107102. [Google Scholar]
  33. Chen, C.; Dubin, R.; Kim, M.C. Emerging Trends and New Developments in Regenerative Medicine: A Scientometric Update (2000–2014). Expert Opin. Biol. Ther. 2014, 14, 1295–1317. [Google Scholar] [CrossRef]
  34. Amiri, R.; Weng, Q.; Alimohammadi, A.; Alavipanah, S.K. Spatial–Temporal Dynamics of Land Surface Temperature in Relation to Fractional Vegetation Cover and Land Use/Cover in the Tabriz Urban Area, Iran. Remote Sens. Environ. 2009, 113, 2606–2617. [Google Scholar]
  35. Weng, Q.; Lu, D.; Liang, B. Urban Surface Biophysical Descriptors and Land Surface Temperature Variations. Photogramm. Eng. Remote Sens. 2006, 72, 1275–1286. [Google Scholar]
  36. World Meteorological Organization. WMO Statement on the State of the Global Climate in 2019; World Meteorological Organization: Geneva, Switzerland, 2020; ISBN 978-92-63-11248-4. [Google Scholar]
  37. Estoque, R.C.; Murayama, Y. Monitoring Surface Urban Heat Island Formation in a Tropical Mountain City Using Landsat Data (1987–2015). ISPRS J. Photogramm. Remote Sens. 2017, 133, 18–29. [Google Scholar]
  38. Zhang, X.; Estoque, R.C.; Murayama, Y. An Urban Heat Island Study in Nanchang City, China Based on Land Surface Temperature and Social-Ecological Variables. Sustain. Cities Soc. 2017, 32, 557–568. [Google Scholar]
  39. Ranagalage, M.; Dissanayake, D.; Murayama, Y.; Zhang, X.; Estoque, R.; Perera, E.; Morimoto, T. Quantifying Surface Urban Heat Island Formation in the World Heritage Tropical Mountain City of Sri Lanka. ISPRS Int. J. Geoinf. 2018, 7, 341. [Google Scholar]
  40. Yu, Z.; Guo, X.; Zeng, Y.; Koga, M.; Vejre, H. Variations in Land Surface Temperature and Cooling Efficiency of Green Space in Rapid Urbanization: The Case of Fuzhou City, China. Urban For. Urban Green. 2018, 29, 113–121. [Google Scholar]
  41. Yu, Z.; Yao, Y.; Yang, G.; Wang, X.; Vejre, H. Spatiotemporal Patterns and Characteristics of Remotely Sensed Region Heat Islands during the Rapid Urbanization (1995–2015) of Southern China. Sci. Total Environ. 2019, 674, 242–254. [Google Scholar] [PubMed]
  42. Wu, C.; Li, J.; Wang, C.; Song, C.; Haase, D.; Breuste, J.; Finka, M. Estimating the Cooling Effect of Pocket Green Space in High Density Urban Areas in Shanghai, China. Front. Environ. Sci. 2021, 9, 657969. [Google Scholar]
  43. Chen, S.; Haase, D.; Qureshi, S.; Firozjaei, M.K. Integrated Land Use and Urban Function Impacts on Land Surface Temperature: Implications on Urban Heat Mitigation in Berlin with Eight-Type Spaces. Sustain. Cities Soc. 2022, 83, 103944. [Google Scholar]
  44. Xu, C.; Chen, G.; Huang, Q.; Su, M.; Rong, Q.; Yue, W.; Haase, D. Can Improving the Spatial Equity of Urban Green Space Mitigate the Effect of Urban Heat Islands? An Empirical Study. Sci. Total Environ. 2022, 841, 156687. [Google Scholar]
  45. Ren, Z.; He, X.; Pu, R.; Zheng, H. The Impact of Urban Forest Structure and Its Spatial Location on Urban Cool Island Intensity. Urban Ecosyst. 2018, 21, 863–874. [Google Scholar]
  46. Yang, C.; He, X.; Wang, R.; Yan, F.; Yu, L.; Bu, K.; Yang, J.; Chang, L.; Zhang, S. The Effect of Urban Green Spaces on the Urban Thermal Environment and Its Seasonal Variations. Forests 2017, 8, 153. [Google Scholar] [CrossRef]
  47. Dong, Y.; Ren, Z.; Fu, Y.; Hu, N.; Guo, Y.; Jia, G.; He, X. Decrease in the Residents’ Accessibility of Summer Cooling Services Due to Green Space Loss in Chinese Cities. Environ. Int. 2022, 158, 107002. [Google Scholar]
  48. Shen, Z.; Tian, Y.; Yao, Y.; Jiang, W.; Dong, J.; Huang, X.; Wu, X.; Farooq, T.H.; Yan, W. Ecological Restoration Research Progress and Prospects: A Bibliometric Analysis. Ecol. Indic. 2023, 155, 110968. [Google Scholar]
  49. Nastran, M.; Kobal, M.; Eler, K. Urban Heat Islands in Relation to Green Land Use in European Cities. Urban For. Urban Green. 2019, 37, 33–41. [Google Scholar]
  50. Weng, Q.; Rajasekar, U.; Hu, X. Modeling Urban Heat Islands and Their Relationship With Impervious Surface and Vegetation Abundance by Using ASTER Images. IEEE Trans. Geosci. Remote Sens. 2011, 49, 4080–4089. [Google Scholar]
  51. Shen, L.; Guo, X.; Xiao, K. Spatiotemporally Characterizing Urban temperatures Based on Remote Sensing and GIS analysis: A Case Study in the City of Saskatoon (SK, Canada). Open Geosci. 2014, 7, 27–39. [Google Scholar]
  52. Naeem, S.; Cao, C.; Qazi, W.; Zamani, M.; Wei, C.; Acharya, B.; Rehman, A. Studying the Association between Green Space Characteristics and Land Surface Temperature for Sustainable Urban Environments: An Analysis of Beijing and Islamabad. ISPRS Int. J. Geoinf. 2018, 7, 38. [Google Scholar]
  53. Rahaman, S.; Jahangir, S.; Haque, M.S.; Chen, R.; Kumar, P. Spatio-Temporal Changes of Green Spaces and Their Impact on Urban Environment of Mumbai, India. Environ. Dev. Sustain. 2021, 23, 6481–6501. [Google Scholar]
  54. Chen, Y.-C.; Chiu, H.-W.; Su, Y.-F.; Wu, Y.-C.; Cheng, K.-S. Does Urbanization Increase Diurnal Land Surface Temperature Variation? Evidence and Implications. Landsc. Urban Plan. 2017, 157, 247–258. [Google Scholar]
  55. Yu, Z.; Guo, X.; Jørgensen, G.; Vejre, H. How Can Urban Green Spaces Be Planned for Climate Adaptation in Subtropical Cities? Ecol. Indic. 2017, 82, 152–162. [Google Scholar]
  56. Hasan, M.; Hassan, L.; Al, M.A.; Abualreesh, M.H.; Idris, M.H.; Kamal, A.H.M. Urban Green Space Mediates Spatiotemporal Variation in Land Surface Temperature: A Case Study of an Urbanized City, Bangladesh. Environ. Sci. Pollut. Res. 2022, 29, 36376–36391. [Google Scholar] [CrossRef] [PubMed]
  57. Bekele, N.K.; Hailu, B.T.; Suryabhagavan, K.V. Spatial Patterns of Urban Blue-Green Landscapes on Land Surface Temperature: A Case of Addis Ababa, Ethiopia. Curr. Res. Environ. Sustain. 2022, 4, 100146. [Google Scholar]
  58. Xue, Z.; Hou, G.; Zhang, Z.; Lyu, X.; Jiang, M.; Zou, Y.; Shen, X.; Wang, J.; Liu, X. Quantifying the Cooling-Effects of Urban and Peri-Urban Wetlands Using Remote Sensing Data: Case Study of Cities of Northeast China. Landsc. Urban Plan. 2019, 182, 92–100. [Google Scholar]
  59. Firozjaei, M.K.; Kiavarz, M.; Alavipanah, S.K.; Lakes, T.; Qureshi, S. Monitoring and Forecasting Heat Island Intensity through Multi-Temporal Image Analysis and Cellular Automata-Markov Chain Modelling: A Case of Babol City, Iran. Ecol. Indic. 2018, 91, 155–170. [Google Scholar]
  60. Paschalis, A.; Chakraborty, T.; Fatichi, S.; Meili, N.; Manoli, G. Urban Forests as Main Regulator of the Evaporative Cooling Effect in Cities. AGU Adv. 2021, 2, 303. [Google Scholar]
  61. Norton, B.A.; Coutts, A.M.; Livesley, S.J.; Harris, R.J.; Hunter, A.M.; Williams, N.S.G. Planning for Cooler Cities: A Framework to Prioritise Green Infrastructure to Mitigate High Temperatures in Urban Landscapes. Landsc. Urban Plan. 2015, 134, 127–138. [Google Scholar] [CrossRef]
  62. Bosch, M.; Locatelli, M.; Hamel, P.; Remme, R.P.; Jaligot, R.; Chenal, J.; Joost, S. Evaluating Urban Greening Scenarios for Urban Heat Mitigation: A Spatially Explicit Approach. R. Soc. Open Sci. 2021, 8, 202174. [Google Scholar] [CrossRef] [PubMed]
  63. Di Leo, N.; Escobedo, F.J.; Dubbeling, M. The Role of Urban Green Infrastructure in Mitigating Land Surface Temperature in Bobo-Dioulasso, Burkina Faso. Environ. Dev. Sustain. 2016, 18, 373–392. [Google Scholar]
  64. Andersson, E.; Haase, D.; Scheuer, S.; Wellmann, T. Neighbourhood Character Affects the Spatial Extent and Magnitude of the Functional Footprint of Urban Green Infrastructure. Landsc. Ecol. 2020, 35, 1605–1618. [Google Scholar] [CrossRef]
  65. Zhu, S.; Yang, Y.; Yan, Y.; Causone, F.; Jin, X.; Zhou, X.; Shi, X. An Evidence-Based Framework for Designing Urban Green Infrastructure Morphology to Reduce Urban Building Energy Use in a Hot-Humid Climate. Build. Environ. 2022, 219, 109181. [Google Scholar]
  66. Pritipadmaja; Garg, R.D.; Sharma, A.K. Assessing the Cooling Effect of Blue-Green Spaces: Implications for Urban Heat Island Mitigation. Water 2023, 15, 2983. [Google Scholar] [CrossRef]
  67. Yu, Z.; Fryd, O.; Sun, R.; Jørgensen, G.; Yang, G.; Özdil, N.C.; Vejre, H. Where and How to Cool? An Idealized Urban Thermal Security Pattern Model. Landsc. Ecol. 2021, 36, 2165–2174. [Google Scholar] [CrossRef]
  68. Shukla, A.; Jain, K. Analyzing the Impact of Changing Landscape Pattern and Dynamics on Land Surface Temperature in Lucknow City, India. Urban For. Urban Green. 2021, 58, 126877. [Google Scholar] [CrossRef]
  69. Song, Y.; Song, X.; Shao, G. Effects of Green Space Patterns on Urban Thermal Environment at Multiple Spatial–Temporal Scales. Sustainability 2020, 12, 6850. [Google Scholar] [CrossRef]
  70. Masoudi, M.; Tan, P.Y. Multi-Year Comparison of the Effects of Spatial Pattern of Urban Green Spaces on Urban Land Surface Temperature. Landsc. Urban Plan. 2019, 184, 44–58. [Google Scholar] [CrossRef]
  71. Shih, W. The Cooling Effect of Green Infrastructure on Surrounding Built Environments in a Sub-Tropical Climate: A Case Study in Taipei Metropolis. Landsc. Res. 2017, 42, 558–573. [Google Scholar]
  72. Peng, J.; Xie, P.; Liu, Y.; Ma, J. Urban Thermal Environment Dynamics and Associated Landscape Pattern Factors: A Case Study in the Beijing Metropolitan Region. Remote Sens. Environ. 2016, 173, 145–155. [Google Scholar]
  73. Van Ryswyk, K.; Prince, N.; Ahmed, M.; Brisson, E.; Miller, J.D.; Villeneuve, P.J. Does Urban Vegetation Reduce Temperature and Air Pollution Concentrations? Findings from an Environmental Monitoring Study of the Central Experimental Farm in Ottawa, Canada. Atmos. Environ. 2019, 218, 116886. [Google Scholar]
  74. Gago, E.J.; Berrizbeitia, S.E.; Torres, R.P.; Muneer, T. Effect of Land Use/Cover Changes on Urban Cool Island Phenomenon in Seville, Spain. Energies 2020, 13, 3040. [Google Scholar] [CrossRef]
  75. Lai, S.; Leone, F.; Zoppi, C. Spatial Distribution of Surface Temperature and Land Cover: A Study Concerning Sardinia, Italy. Sustainability 2020, 12, 3186. [Google Scholar] [CrossRef]
  76. Sun, X.; Tan, X.; Chen, K.; Song, S.; Zhu, X.; Hou, D. Quantifying Landscape-Metrics Impacts on Urban Green-Spaces and Water-Bodies Cooling Effect: The Study of Nanjing, China. Urban For. Urban Green. 2020, 55, 126838. [Google Scholar]
  77. Peng, J.; Jia, J.; Liu, Y.; Li, H.; Wu, J. Seasonal Contrast of the Dominant Factors for Spatial Distribution of Land Surface Temperature in Urban Areas. Remote Sens. Environ. 2018, 215, 255–267. [Google Scholar]
  78. Smith, I.A.; Fabian, M.P.; Hutyra, L.R. Urban Green Space and Albedo Impacts on Surface Temperature across Seven United States Cities. Sci. Total Environ. 2023, 857, 159663. [Google Scholar] [PubMed]
  79. Li, F.; Sun, W.; Yang, G.; Weng, Q. Investigating Spatiotemporal Patterns of Surface Urban Heat Islands in the Hangzhou Metropolitan Area, China, 2000–2015. Remote Sens. 2019, 11, 1553. [Google Scholar] [CrossRef]
  80. Chen, M.; Sun, Y.; Yang, B.; Jiang, J. MSPA-Based Green Space Morphological Pattern and Its Spatiotemporal Influence on Land Surface Temperature. Heliyon 2024, 10, e31363. [Google Scholar]
  81. Degefu, M.A.; Argaw, M.; Feyisa, G.L.; Degefa, S. Dynamics of Green Spaces- Land Surface Temperature Intensity Nexus in Cities of Ethiopia. Heliyon 2023, 9, e13274. [Google Scholar]
  82. Pramanik, S.; Punia, M. Assessment of Green Space Cooling Effects in Dense Urban Landscape: A Case Study of Delhi, India. Model. Earth Syst. Environ. 2019, 5, 867–884. [Google Scholar]
  83. Jiang, Y.; Huang, J.; Shi, T.; Wang, H. Interaction of Urban Rivers and Green Space Morphology to Mitigate the Urban Heat Island Effect: Case-Based Comparative Analysis. Int. J. Environ. Res. Public Health 2021, 18, 11404. [Google Scholar] [CrossRef]
  84. Terfa, B.K.; Chen, N.; Zhang, X.; Niyogi, D. Spatial Configuration and Extent Explains the Urban Heat Mitigation Potential Due to Green Spaces: Analysis over Addis Ababa, Ethiopia. Remote Sens. 2020, 12, 2876. [Google Scholar] [CrossRef]
  85. Fan, H.; Yu, Z.; Yang, G.; Liu, T.Y.; Liu, T.Y.; Hung, C.H.; Vejre, H. How to Cool Hot-Humid (Asian) Cities with Urban Trees? An Optimal Landscape Size Perspective. Agric. For. Meteorol. 2019, 265, 338–348. [Google Scholar]
  86. Tan, X.; Sun, X.; Huang, C.; Yuan, Y.; Hou, D. Comparison of Cooling Effect between Green Space and Water Body. Sustain. Cities Soc. 2021, 67, 102711. [Google Scholar]
  87. Li, C.; Lu, L.; Fu, Z.; Sun, R.; Pan, L.; Han, L.; Guo, H.; Li, Q. Diverse Cooling Effects of Green Space on Urban Heat Island in Tropical Megacities. Front. Environ. Sci. 2022, 10, 1073914. [Google Scholar]
  88. Wu, S.; Yang, H.; Luo, P.; Luo, C.; Li, H.; Liu, M.; Ruan, Y.; Zhang, S.; Xiang, P.; Jia, H.; et al. The Effects of the Cooling Efficiency of Urban Wetlands in an Inland Megacity: A Case Study of Chengdu, Southwest China. Build. Environ. 2021, 204, 108128. [Google Scholar]
  89. Gao, Y.; Pan, H.; Tian, L. Analysis of the Spillover Characteristics of Cooling Effect in an Urban Park: A Case Study in Zhengzhou City. Front. Earth Sci. 2023, 11, 1133901. [Google Scholar]
  90. Demisse Negesse, M.; Hishe, S.; Getahun, K. LULC Dynamics and the Effects of Urban Green Spaces in Cooling and Mitigating Micro-Climate Change and Urban Heat Island Effects: A Case Study in Addis Ababa City, Ethiopia. J. Water Clim. Change 2024, 15, 3033–3055. [Google Scholar]
  91. Yu, Z.; Xu, S.; Zhang, Y.; Jørgensen, G.; Vejre, H. Strong Contributions of Local Background Climate to the Cooling Effect of Urban Green Vegetation. Sci. Rep. 2018, 8, 6798. [Google Scholar]
  92. Geng, X.; Yu, Z.; Zhang, D.; Li, C.; Yuan, Y.; Wang, X. The Influence of Local Background Climate on the Dominant Factors and Threshold-Size of the Cooling Effect of Urban Parks. Sci. Total Environ. 2022, 823, 153806. [Google Scholar]
  93. Pang, B.; Zhao, J.; Zhang, J.; Yang, L. How to Plan Urban Green Space in Cold Regions of China to Achieve the Best Cooling Efficiency. Urban Ecosyst. 2022, 25, 1181–1198. [Google Scholar]
  94. Zheng, S.; Liu, L.; Dong, X.; Hu, Y.; Niu, P. Dominance of Influencing Factors on Cooling Effect of Urban Parks in Different Climatic Regions. Int. J. Environ. Res. Public Health 2022, 19, 15496. [Google Scholar] [CrossRef]
  95. Wang, Y.; Huang, J.; Chen, C.; Shen, J.; Sheng, S. The Cooling Intensity Dependent on Landscape Complexity of Green Infrastructure in the Metropolitan Area. J. Environ. Eng. Landsc. Manag. 2021, 29, 318–336. [Google Scholar]
  96. Gong, Y.; Li, X.; Liu, H.; Li, Y. The Spatial Pattern and Mechanism of Thermal Environment in Urban Blocks from the Perspective of Green Space Fractal. Buildings 2023, 13, 574. [Google Scholar] [CrossRef]
  97. Yao, X.; Yu, K.; Zeng, X.; Lin, Y.; Ye, B.; Shen, X.; Liu, J. How Can Urban Parks Be Planned to Mitigate Urban Heat Island Effect in “Furnace Cities” ? An Accumulation Perspective. J. Clean. Prod. 2022, 330, 129852. [Google Scholar]
  98. Shafizadeh-Moghadam, H.; Weng, Q.; Liu, H.; Valavi, R. Modeling the Spatial Variation of Urban Land Surface Temperature in Relation to Environmental and Anthropogenic Factors: A Case Study of Tehran, Iran. GIsci. Remote Sens. 2020, 57, 483–496. [Google Scholar]
  99. Wang, Q.; Wang, X.; Zhou, Y.; Liu, D.; Wang, H. The Dominant Factors and Influence of Urban Characteristics on Land Surface Temperature Using Random Forest Algorithm. Sustain. Cities Soc. 2022, 79, 103722. [Google Scholar]
  100. Hu, D.; Meng, Q.; Zhang, L.; Zhang, Y. Spatial Quantitative Analysis of the Potential Driving Factors of Land Surface Temperature in Different “Centers” of Polycentric Cities: A Case Study in Tianjin, China. Sci. Total Environ. 2020, 706, 135244. [Google Scholar] [PubMed]
  101. Li, X.-L.; Zhang, Z.; Lu, J.-X.; Brouchkov, A.; Yan, Q.-K.; Yu, Q.-H.; Zhang, S.-R.; Melnikov, A. Evaluating the Thermal Environment of Urban Land Surfaces in Yakutsk, a City Located in a Region of Continuous Permafrost. Adv. Clim. Change Res. 2024, 15, 113–123. [Google Scholar]
  102. Sodoudi, S.; Shahmohamadi, P.; Vollack, K.; Cubasch, U.; Che-Ani, A.I. Mitigating the Urban Heat Island Effect in Megacity Tehran. Adv. Meteorol. 2014, 2014, 1–19. [Google Scholar]
  103. Masoudi, M.; Tan, P.Y.; Fadaei, M. The Effects of Land Use on Spatial Pattern of Urban Green Spaces and Their Cooling Ability. Urban Clim. 2021, 35, 100743. [Google Scholar]
  104. Algretawee, H. The Effect of Graduated Urban Park Size on Park Cooling Island and Distance Relative to Land Surface Temperature (LST). Urban Clim. 2022, 45, 101255. [Google Scholar]
  105. Menteş, Y.; Yilmaz, S.; Qaid, A. The Cooling Effect of Different Scales of Urban Parks on Land Surface Temperatures in Cold Regions. Energy Build. 2024, 308, 113954. [Google Scholar] [CrossRef]
  106. Bao, T.; Li, X.; Zhang, J.; Zhang, Y.; Tian, S. Assessing the Distribution of Urban Green Spaces and Its Anisotropic Cooling Distance on Urban Heat Island Pattern in Baotou, China. ISPRS Int. J. Geoinf. 2016, 5, 12. [Google Scholar] [CrossRef]
  107. Grilo, F.; Pinho, P.; Aleixo, C.; Catita, C.; Silva, P.; Lopes, N.; Freitas, C.; Santos-Reis, M.; McPhearson, T.; Branquinho, C. Using Green to Cool the Grey: Modelling the Cooling Effect of Green Spaces with a High Spatial Resolution. Sci. Total Environ. 2020, 724, 138182. [Google Scholar] [CrossRef]
  108. Xu, C.; Huang, Q.; Haase, D.; Dong, Q.; Teng, Y.; Su, M.; Yang, Z. Cooling Effect of Green Spaces on Urban Heat Island in a Chinese Megacity: Increasing Coverage versus Optimizing Spatial Distribution. Environ. Sci. Technol. 2024, 58, 5811–5820. [Google Scholar] [CrossRef]
  109. Park, J.-H.; Cho, G.-H. Examining the Association between Physical Characteristics of Green Space and Land Surface Temperature: A Case Study of Ulsan, Korea. Sustainability 2016, 8, 777. [Google Scholar] [CrossRef]
  110. Sun, Y.; Gao, C.; Li, J.; Wang, R.; Liu, J. Quantifying the Effects of Urban Form on Land Surface Temperature in Subtropical High-Density Urban Areas Using Machine Learning. Remote Sens. 2019, 11, 959. [Google Scholar] [CrossRef]
  111. Zhou, L.; Hu, F.; Wang, B.; Wei, C.; Sun, D.; Wang, S. Relationship between Urban Landscape Structure and Land Surface Temperature: Spatial Hierarchy and Interaction Effects. Sustain. Cities Soc. 2022, 80, 103795. [Google Scholar] [CrossRef]
  112. Norouzi, M.; Chau, H.-W.; Jamei, E. Design and Site-Related Factors Impacting the Cooling Performance of Urban Parks in Different Climate Zones: A Systematic Review. Land 2024, 13, 2175. [Google Scholar] [CrossRef]
  113. Feng, F.; Ren, Y.; Xu, C.; Jia, B.; Wu, S.; Lafortezza, R. Exploring the Non-Linear Impacts of Urban Features on Land Surface Temperature Using Explainable Artificial Intelligence. Urban Clim. 2024, 56, 102045. [Google Scholar] [CrossRef]
  114. Probst, N.; Bach, P.M.; Cook, L.M.; Maurer, M.; Leitão, J.P. Blue Green Systems for Urban Heat Mitigation: Mechanisms, Effectiveness and Research Directions. Blue-Green Syst. 2022, 4, 348–376. [Google Scholar] [CrossRef]
  115. Das, T.; Jana, A.; Mandal, B.; Sutradhar, A. Spatio-Temporal Pattern of Land Use and Land Cover and Its Effects on Land Surface Temperature Using Remote Sensing and GIS Techniques: A Case Study of Bhubaneswar City, Eastern India (1991–2021). GeoJournal 2022, 87, 765–795. [Google Scholar]
  116. Cui, F.; Hamdi, R.; Yuan, X.; He, H.; Yang, T.; Kuang, W.; Termonia, P.; De Maeyer, P. Quantifying the Response of Surface Urban Heat Island to Urban Greening in Global North Megacities. Sci. Total Environ. 2021, 801, 149553. [Google Scholar] [PubMed]
  117. Kache, P.A.; Santos-Vega, M.; Stewart-Ibarra, A.M.; Cook, E.M.; Seto, K.C.; Diuk-Wasser, M.A. Bridging Landscape Ecology and Urban Science to Respond to the Rising Threat of Mosquito-Borne Diseases. Nat. Ecol. Evol. 2022, 6, 1601–1616. [Google Scholar] [CrossRef] [PubMed]
  118. Huang, J.; Lu, X.; Wang, Y. Spatio−Temporal Changes and Key Driving Factors of Urban Green Space Configuration on Land Surface Temperature. Forests 2024, 15, 812. [Google Scholar] [CrossRef]
Figure 1. Research framework.
Buildings 15 01032 g001
Figure 2. Trends in the number of annual publications and citations of studies on the effects of UGSs on LST in the extended version of the Science Citation Index (WOS).
Buildings 15 01032 g002
Figure 3. Spatiotemporal distribution of national publications and keywords of the top ten countries in terms of publications.
Buildings 15 01032 g003
Figure 4. Collaboration network of countries.
Buildings 15 01032 g004
Figure 5. Collaboration network of institutions.
Buildings 15 01032 g005
Figure 6. Collaboration network of authors.
Buildings 15 01032 g006
Figure 7. Co-occurrence network of keywords.
Buildings 15 01032 g007
Figure 8. Keywords clustering map.
Buildings 15 01032 g008
Figure 9. Conceptual curves of TVoE (q2 − q1 = q4 − q3, u2 − u1 > u4 − u3). (a) shows the TVoE recognition method when cooling efficiency tends to be stable; (b) shows the TVoE recognition method when the slope of the fitted logarithmic curve is 1.
Buildings 15 01032 g009
Figure 10. Burst detection. Light blue represents the time interval 2004–2024, blue represents the duration of keyword occurrence, and red represents the duration of keyword eruption.
Buildings 15 01032 g010
Table 1. Top 10 countries in terms of number of articles and their share of articles.
NationNumber of Published PapersProportion (%)The Year of Its Earliest Appearance
China37350.402011
USA11415.412004
India537.162017
Germany476.352013
Iran385.142009
Australia354.732009
Japan344.592012
Italy243.242018
South Korea222.972005
UK222.972014
Table 2. Top 10 countries in terms of centrality.
NationCentralityNumber of Published PapersThe Year of Its Earliest Appearance
Germany0.40472013
China0.363732011
USA0.221142004
Australia0.21352009
Spain0.17222014
India0.10532017
Turkey0.09102022
Japan0.08342012
Netherlands0.08132016
Malaysia0.08122018
Table 3. Top 10 Institutions by number of publications and their collaboration situations.
InstitutionCountryNumber of PublicationsEarliest Year of PublicationCentralityTop 5 Collaborating Institutions
Chinese Academy of SciencesChina9220110.46Michigan State University
Shandong Jianzhu University
Tianjin University
Chinese Academy of Forestry Sciences
Southwest University of Science and Technology
University of Chinese Academy of SciencesChina4520130.03Michigan State University
Tianjin University
Xinjiang University
Chinese Academy of Sciences
Southwest University of Science and Technology
Peking UniversityChina1820150.04China University Geosciences
Chinese Academy of Sciences
Peking University
University of Chinese Academy of Sciences
Cornell University
Beijing Forestry UniversityChina1520110.04Beijing Institute of Technology
Chinese Academy of Forestry Sciences
Chinese Academy of Sciences
University of Freiburg
Beijing Tsinghua Tongheng Urban Planning & Design Institute
University of TsukubaJapan1520170.05Hangzhou Normal University
Japan Aerospace Exploration Agency
Rajarata University of Sri Lanka
University of Tsukuba
Arizona State University
Copperbelt University
Humboldt UniversityGermany1420140.05Chinese Academy of Sciences
University of Punjab
Potsdam Institute for Climate Impact Research
University of North Carolina
University of Wurzburg
Tongji UniversityChina1320210.02National University of Singapore
Tongji University
Center for Ecology
Planning and Environmental Effects Research
Southeast University
Beijing Normal UniversityChina1320110.01Chinese Academy of Forestry Sciences
Southwest University of Science and Technology
China University of Geosciences
Chinese Academy of Sciences
Oak Ridge National Laboratory
Fujian Agriculture and Forestry UniversityChina1220210.01Fuzhou University
Fujian University of Technology
Peking University
Tongji University
Fujian Agriculture and Forestry University
Wuhan UniversityChina1120150.03University of Punjab
CMA Key Open Laboratory of Transforming Climate Resources
University of Saskatchewan
Peking University
Tongji University
Disclaimer/Publisher’s Note: The statements, opinions and data contained in all publications are solely those of the individual author(s) and contributor(s) and not of MDPI and/or the editor(s). MDPI and/or the editor(s) disclaim responsibility for any injury to people or property resulting from any ideas, methods, instructions or products referred to in the content.

