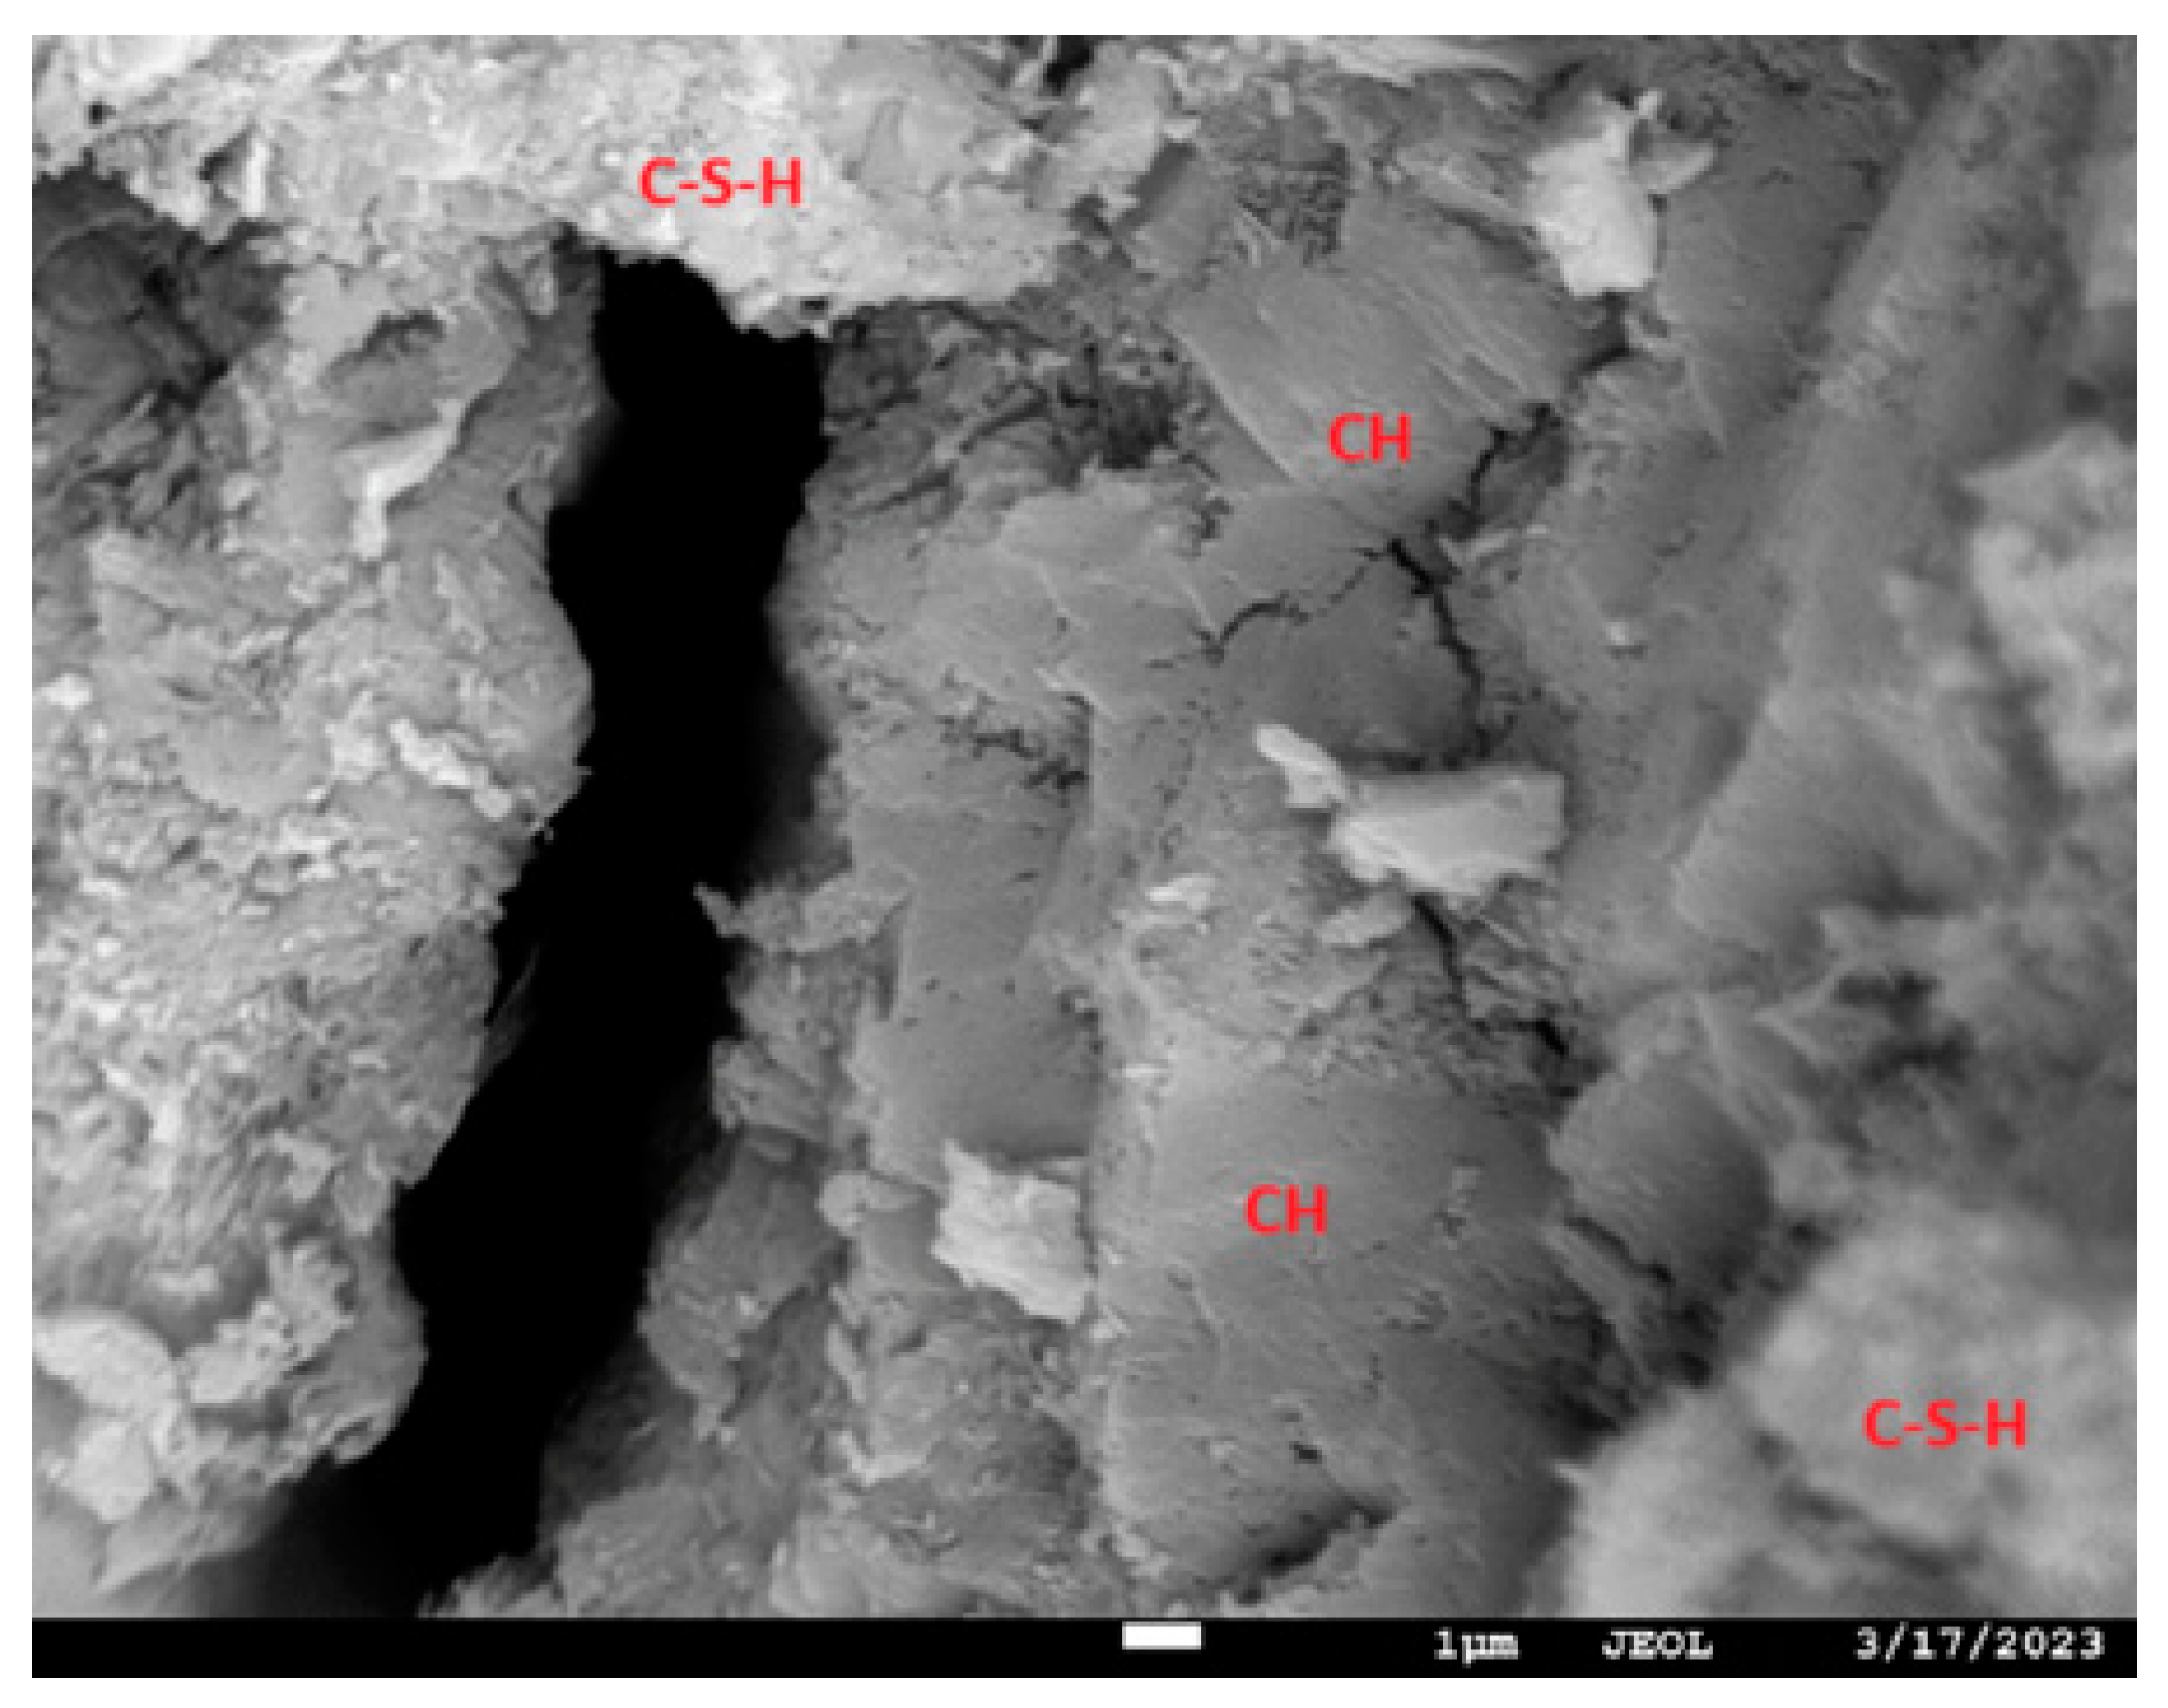
Article

Physical–Mechanical Behavior of High-Performance Concrete and Ordinary Concrete with Portland Cement Mixtures After Exposure to Selected Durability Tests Including High Thermal Stress

1
Department of Building Materials and Diagnostics of Structures, Faculty of Civil Engineering, VSB-Technical University of Ostrava, Ludvíka Podéště 1875/17, 70800 Ostrava-Poruba, Czech Republic
2
Centre for Energy and Environmental Technologies, VSB-Technical University of Ostrava, 17. listopadu 15, 70800 Ostrava-Poruba, Czech Republic
*
Author to whom correspondence should be addressed.
Buildings 2025, 15(7), 1029; https://doi.org/10.3390/buildings15071029
Submission received: 12 July 2024 / Revised: 19 February 2025 / Accepted: 1 March 2025 / Published: 24 March 2025
(This article belongs to the Special Issue Constructions in Europe: Current Issues and Future Challenges)

Abstract

This study examines the verification of the mechanical properties of ordinary concrete with Portland cement (OPC) and high-performance concretes (HPCs) after exposure to the effects of varying temperatures, in addition to durability tests as part of the experimental testing. Particular emphasis is placed on the comparison between OPC and HPC. Before describing the behavior of concrete under the influence of heat and the difference between ordinary and high-performance concrete, the microstructures of both hardened mixtures were monitored, and the chemical compounds of the used Portland cement and silica fume were analyzed using a scanning electron microscope (SEM) and Fourier transform infrared spectroscopy (FTIR). For the experiments, compressive strength and flexural strength tests were performed before and after stressing at elevated temperatures. Furthermore, the experiments included the following: a study of concrete color changes under the influence of elevated temperatures, the use of the ultrasonic pulse method, the determination of resistance to water and chemical de-icing agents, and an examination of the frost resistance of concrete. This study considers the differences between the two concretes—OPC and HPC—especially in terms of their mechanical properties, as well as their durability and resistance to chemicals. This research contributes to the understanding of the properties of the two types of concrete; subsequently, it can help in the selection of concrete for specific applications.

1. Introduction

The current trend in the development of building materials, in conjunction with the increasing demands for sustainability in the construction industry, influences the views regarding the future use of conventional building materials such as concrete. Due to its favorable mechanical properties and relatively low purchase price, concrete has become a widely used material in modern constructions, especially in combination with other materials such as steel. The most commonly used structural elements made of concrete include reinforced concrete [1,2,3] and prestressed concrete [4,5]. In addition to considering the design criteria, the main aspects of structural design include durability and service life requirements, which are closely related to sustainability in construction. The first step in research on construction materials involves the development of mixtures; this research focuses on composition design and production technology. Generally, the existing research is mainly concerned with high-performance concretes [6,7], fiber-reinforced concretes [8,9], concretes with recyclates [10,11,12] or geopolymers [13,14,15], and concretes used for additive technologies [16,17,18]. For the design of concrete structures, it is important to provide a comprehensive description not only of their mechanical properties, but also of their durability-related properties, such as resistance to chemicals and frost durability [19,20] or extreme temperatures [21]. Detailed descriptions of these properties are particularly important when using advanced numerical modeling based on nonlinear analysis.
The research in the study presented here focuses on the experimental comparison of the mechanical properties (compressive strength, flexural strength, and dynamic modulus of elasticity) and durability (resistance to water and defrosting chemicals and frost resistance) of OPC and HPC after exposure to different temperatures (250, 500, 750, and 1000 °C). There are several studies dealing with the behavior of Portland cement-based concrete composites at high temperatures. For example, Kalifa [21], in his research, deals with the spalling caused by the comparative pressure of OPC and HPCs exposed to high temperatures. The results show almost twice the pore pressure (38 bar) for HPC mixtures subjected to thermal stresses. These differences in thermodynamic behavior were due to the lower water permeability of HPC. Spalling at high temperatures was also investigated by Yermak [22], who observed this phenomenon in connection with the addition of steel and polypropylene fibers in a HPC mixture. In the case of polypropylene fibers, a higher water vapor permeability was obtained, which reduced the risk of spalling. In the case of steel fibers, water leakage from the concrete structure was limited, reducing the risk of spalling. The same conclusions were reached by Ma [23] using steel and polypropylene fibers. Thus, the different pore pressures in HPC and OPC induced by exposure at high temperatures is one of the main factors that affect not only the physical-mechanical properties, but also the durability and service life of the given composites. The role of water in the evaporation process was also emphasized by Hager in his study [24]. Thus, many studies clearly describe the causes of the effect of thermal stresses on certain properties of concrete composites, but few deal with testing the materials in a wide range of laboratory tests after exposure to high temperatures, which is the objective of this paper. In addition, observations were made of the microstructure and chemical analysis of the raw materials used, namely Portland cement and silica fume. This was conducted in connection with a review [25] examining the influence of nano-coatings and nano-reinforcements in concrete composites on their thermal resistance and the nature of their failure. The advantages of using HPC over OPC are clear: in addition to higher strength characteristics, HPC—with the use of silica fume—has a denser structure that prevents the penetration of water and other undesirable substances into the concrete structure; this extends the life of HPC, improves the structure, and reduces future costs for possible reconstruction/rehabilitation [26,27,28,29,30]. Silica fume plays a role in concrete by contributing significantly to the strength and durability of the resulting composite; however, there are also non-traditional additives (e.g., magnetic nano-additives) which, in addition to improving the mechanical properties of a given composite, significantly improve its dialectical properties [31]. Production costs and a more complex technological process compared to OPC are the main deciding factors when choosing HPC, and questions arise concerning the cases in which it is more economically and ecologically advantageous to use HPC [26,32].

2. Methodology for the Experimental Program

The tests and observations of the material–mechanical and durability characteristics conducted in the experimental program—in part Data Availability Statement and experiments [33] described below were carried out in the laboratory environment of VŠB-TU Ostrava (Faculty of Civil Engineering) according to the following regulations and standards:
  • Microstructure.
  • Volumetric weight of hardened concrete tested according to ČSN EN 12390-7 [34].
  • The bulk density was determined using three sample sizes, i.e., cubes measuring 150 × 150 × 150 mm (a total of 6 samples), cubes measuring 100 × 100 × 100 mm (a total of 6 samples), and beams measuring 40 × 40 × 160 mm (a total of 4 samples).
  • Compressive strength tested according to ČSN EN 12390-3 [35].
  • As part of the experimental testing of the OPC and HPCs, 3 types of compressive strength tests were performed in total; these tests differed in terms of the size of the tested sample. The following tests were carried out for the experimental program:
    Compressive strength test for cubes measuring 150 × 150 × 150 mm;
    Compressive strength test for cubes measuring 100 × 100 × 100 mm;
    Compressive strength test for half-beams measuring 40 × 40 × 160 mm.
For the compressive strength tests for the cubes measuring 150 × 150 × 150 mm and 100 × 100 × 100 mm, 6 samples from each mixture were prepared. In total, 12 test samples were prepared for each type of test.
The determination of compressive strength for the beams measuring 40 × 40 × 160 mm was carried out on 10 beams from each mixture. In total, 10 test samples were concreted for this type of test.
Flexural strength ČSN EN 12390-5 [36].
Flexural strength was determined for the beams measuring 40 × 40 × 160 mm. Flexural tensile strength testing was performed at sample ages of 1, 14, 28, and 56 days. In total, 30 samples from each mixture were tested, with 4 samples tested for 1-day flexural tensile strength, 6 samples tested for 14-day flexural tensile strength, and 10 samples tested for 28-day and 56-day flexural tensile strength. In total, 60 samples were prepared for the flexural tensile strength tests.
Concrete color changes due to increased temperature.
In total, 40 beams with dimensions of 40 × 40 × 160 mm from each mixture were tested; subsequently, they were placed in a furnace at temperatures of 250 °C, 500 °C, 750 °C, and 1000 °C.
  • Dynamic modulus of elasticity, tested according to ČSN 73 1371 [37].
    The same number of samples as in the temperature effect test were tested for dynamic elastic modulus, i.e., a total of 40 samples for each mixture.
  • Determination of frost resistance, tested according to ČSN 73 1322 [38]. Frost resistance was tested on 10 samples from each mixture. The start of the test took place 56 days after the production of the samples. The number of cycles was set at 50.
  • Resistance to water and defrosting chemicals, tested according to ČSN 73 1326 [39].
As part of this test, the testing of resistance to water and defrosting chemicals was performed; this was determined using cubes measuring 100 × 100 × 100 mm. In total, 6 samples were tested for each mixture.

3. Basic Raw Materials for Concrete Production

The compositions of the formulas for OPC and HPC are shown in Table 1 and Table 2. To improve processability and reduce the water ratio, plasticizers based on polyether carboxylate and polycarboxylate and polyphosphonate were used in the mixtures. The particle size distribution of the cement, limestone, and silica fume was given in the previous experimental program [40]. After the preparation of the fresh mixture and its placement in the molds, the samples were covered with a protective film against unwanted drying and were stored in this way for 1 day. Then, the samples were removed and placed in water during curing.

4. Microstructure

The observation of the microstructures of both types of concrete was carried out using SEM. Figure 1 shows the OPC microstructure; Figure 2 shows the HPC microstructure.
In Figure 1, we can observe the probable hydration products of C-S-H and portlandite (CH). In addition, a microcrack in the OPC structure is also noticeable.
In Figure 2, the needles of ettringite [41] are quite visible. Moreover, we can observe the probable products of C-S-H gel and portlandite, which are the same as those in the OPC sample in Figure 1.
In both the OPC and the HPC, the same C-S-H gel structure can be seen: it is amorphous, irregular, and disordered. In both cases, it can be described as curly, which does not agree with the results from [42], where, in the case of OPC, the C-S-H gel took on a rather fibrous shape. The morphology of the C-S-H gel may have been influenced by both the polycarboxylate and the polyphosphate plasticizer, as well as one of the fine admixtures. In his research, Li [43] also worked with C-S-H gels; his specific focus was on the cohesion of C-S-H clusters.

5. Analysis of Chemical Compounds

An FTIR spectrometer was used for the analysis of the chemical compounds. The results of the chemical analysis of Portland cement are shown in Figure 3; the results of the silica fume analysis are shown in Figure 4. In the case of the FTIR analysis of Portland cement (in Figure 3), we can point out, for example, the peak at 1431.6 cm−1, which reveals the carbonate groups contained in hydrated cement products, or the peak at 1116.4 cm−1, which may indicate the presence of sulfates in gypsum. As far as the FTIR analysis of the silica fume is concerned, the peak at 1034.8 cm−1 dominates; this reveals the amorphous silica characteristics of silica fume.

6. Determination of the Bulk Density of Hardened Concrete

The samples were removed from the water environment several hours before testing and were allowed to air-dry in the laboratory. Then, the samples were measured and weighed, and the bulk density was determined for the HPC and OPC, as shown in Table 3 and Table 4, respectively.
In the graph in Figure 5, a comparison of the OPC and HPC samples and their individual shapes can be seen. The shapes of the samples have a minimal effect on the difference in bulk density. The difference in bulk density is due to the difference between OPC and HPC. The average bulk density was 2280 kg/m3 for the reference concrete and 2400 kg/m3 for the high-value concrete. Both of these mixtures belong to ordinary concrete, in terms of their volumetric weight, when the range is 2000–2600 kg/m3. The bulk density of the HPC samples is higher because high-quality concrete is less porous than OPC.

7. Compressive Strength

The compressive strength of the concrete was tested after 28 days using cube-shaped samples of 150 × 150 × 150 mm and 100 × 100 × 100 mm and a half-beam sample of 40 × 40 × 160 mm (after the flexural strength test). Furthermore, the compressive strength was tested on the half-beams after 24 h, 14 days, and 56 days. Flexural strength was tested on the beams with dimensions of 40 × 40 × 160 mm after 24 h, 14 days, 28 days, and 56 days.

7.1. Compressive Strength for Cubes 150 × 150 × 150 mm

The compressive strength test was carried out after 28 days on six samples of the OPC mixture and six samples of the HPC mixture (see Table 5).

7.2. Compressive Strength for Cubes 100 × 100 × 100 mm

The compressive strength test was carried out after 28 days on six samples of the OPC mixture and six samples of the HPC mixture (see Table 6).

7.3. Compressive Strength for Half-Beams 40 × 40 × 160 mm

The test was begun 24 h after the making of both types of mixtures. Then, the compressive strength was tested after 1, 14, 28, and 56 days. In total, 30 samples from each mixture were tested for compressive strength (see Table 7). The course of the test is shown in Figure 6.
In the graph in Figure 7, it can be observed that the compressive strength increases for both mixes. It can also be seen that there is a significant difference in compressive strength between the OPC and HPC. Twenty-four hours after removing the samples, the average compressive strength of the OPC samples was 9.8 MPa, and it was 46.5 MPa for the HPC samples, which was almost five times greater than the compressive strength. With the increasing age of the tested samples, the compressive strength continued to increase. The difference between the two concretes was then approximately double. Specifically, after 28 days, the measured compressive strength was 59.2 MPa for the OPC samples and 123.2 MPa for the HPC samples. After 56 days, the values were 63.1 for the OPC samples and 124.8 for the HPC samples.
In the graph shown in Figure 8, we can observe the effect of pre-drying the samples during the compressive strength test. In total, ten beams from each mixture were used; they were placed in a drying oven at 105 °C 24 h before the actual test. The test was performed after the samples had aged for 28 days and 56 days. In Figure 8, we can also see that, after 28 days, the dried samples had higher strengths for both mixtures than the non-dried samples. After 56 days, this condition occurred only for the OPC samples.

8. Flexural Strength for Beams 40 × 40 × 160 mm

Flexural strength was tested using the same test samples that were used for the compressive strength tests (see Table 8). In Figure 9, the test sample is placed in the hydraulic press, which is ready for the test. Subsequently, it split in half during the test due to the load; these halves were further used for the compressive strength test.
In the graph in Figure 10, we can again observe an increase in strength for both mixtures. After 1 day, the flexural strength was 1.7 MPa for the OPC samples and 5.9 MPa for the HPC samples (i.e., a 3.5-fold difference). Over time, the measured values also increased, and the difference was approximately twofold, as it was with the compressive strength. After 28 days, the measured value was 6.9 MPa for the OPC samples and 12.3 MPa for the HPC samples. After 56 days, the value increased to 7.6 MPa for the OPC samples and to 15.3 for the HPC samples.
From the graph in Figure 11, it is possible to observe the influence of the pre-drying of the samples on the flexural strength. The pre-dried samples used for this test were the same as those used for the compressive strength test (see previous section). The graph shows that the flexural strength increased for the dried OPC samples after 28 and 56 days. This did not happen with the HPC samples.

9. Change in Strength Characteristics Due to Temperature

Twenty-eight days after the concrete samples were made, ten beams with dimensions of 40 × 40 × 160 mm from each mixture were placed in the furnace at 250 °C, 500 °C, 750 °C, and 1000 °C. When the oven temperature reached the desired temperature, it was maintained for another 120 min. After the process was completed, the furnace was opened; after 24 h, the samples were taken out and subsequently tested (see Table 9 and Table 10).
The graph in Figure 12 shows the change in compressive strength due to increased temperature. It can be seen that the compressive strength value increased for the OPC mixture when the samples were exposed to a temperature of 250 °C. The structure of the OPC mixture was more porous than that of the HPC samples. This allowed for water to escape better, and this phenomenon temporarily increased the strength of the concrete. Subsequently, the compressive strength decreased with increasing temperature.
The graph in Figure 13 presents the change in flexural strength due to increased temperature (see Table 10). The same processes occur here as those that occurred with the change in compressive strength, as shown in the graph in Figure 11, including the phenomenon of the increase in flexural strength for the OPC mixture at 250 °C.

10. Effect of Temperature on Weight Changes

For the samples exposed to elevated temperatures, the weight was measured before and after the exposure to heat. The graph in Figure 14 shows the percentage of weight loss at the given temperatures for both mixtures. As the temperature increased, the weight of the samples decreased, which means that the percentage loss increased. The weight loss for both mixtures was expressed as a percentage.

11. Changes in the Color of Concrete Due to Thermal Stress

In Figure 15, Figure 16, Figure 17, Figure 18, Figure 19 and Figure 20, three OPC samples on the left and three HPC samples on the right can be seen. If we compare the individual images, it is obvious that the color is different. Figure 15 shows concrete that was not exposed to an elevated temperature, and the samples have a normal gray color. Around 100 °C, the physically bound water and moisture in the pores will start to evaporate from the concrete, and the color should still be normal (Figure 16). In Figure 17, we can see, particularly for the OPC samples, that the concrete samples turned pink due to the temperature of 250 °C. In Figure 18, it is possible to observe that the surface of the concrete has another color, namely, whitish-gray. Subsequently, a slight change occurs at 750 °C (Figure 19), and the concrete turns yellow-brown. When the concrete was exposed to a temperature of 1000 °C, it acquired a yellow-brown color, which can be seen in Figure 20.

12. Determination of the Propagation Speed of Ultrasonic Waves

Ten samples of each mixture were placed in the furnace at temperatures of 250, 500, 750, and, finally, 1000 °C. Before placing the samples, the time that the ultrasonic wave takes to pass through the sample (see Table 11 and Table 12) in the longitudinal direction was measured. This measurement was later also performed on the cooled samples after they were removed from the furnace. With the measured values, it was possible to calculate the propagation speed of the longitudinal ultrasonic waves (see Table 13 and Table 14).
The vertical axis of the graph in Figure 21 captures the temperatures, and the longitudinal axis is the ratio of the speed of propagation of the ultrasonic waves. As the ratio of the propagation speed decreases and the temperature increases, the concrete samples show a greater degree of failure. The more the material is damaged, the longer the time for the wave to travel through the material and the smaller the value of the calculated velocity. Conversely, if the material is less broken, the time that the wave takes to travel through the material is shorter and the velocity value is higher.

13. Dynamic Modulus of Elasticity

The ultrasonic pulse method was used to test the dynamic modulus of elasticity (see Figure 22), using Proceq Pundit 200 (Screening Eagle Technologies AG, Zurich, Switzerland) with 150 kHz transducers. It was measured on ten samples from both mixtures for each temperature (250, 500, 750, and 1000 °C), and frost resistance was tested on the beams with dimensions of 40 × 40 × 160 mm. After determining the bulk density, the measurement itself was started; the result of the measurement was the transit time of the pulse of the ultrasonic waves, from which the dynamic modulus of elasticity was determined; the resulting values are shown in the graph in Figure 23 for the OPC samples and in the graph in Figure 24 for the HPC samples. The dynamic modulus of elasticity should be the same for all the samples from the same mixture before the temperature; however, because of the human factor, it was not (see the graphs in Figure 23 and Figure 24). The dynamic modulus of elasticity decreased with the increasing temperature, which means that there was a higher failure rate in the concrete samples. After thermal stress at 250 °C, it was found that the ratio of the dynamic modulus of elasticity between the reference samples and the temperature-exposed samples for the OPC was 0.63, and for the HPC it was 0.86. After reaching a temperature of 1000 °C, the ratio of the dynamic modulus of elasticity reached 0.03 for the OPC and 0.06 for the HPC samples, where a number close to 1 means the smallest possible influence on the dynamic modulus of elasticity of a sample exposed to thermal stress.
The dynamic modulus of elasticity before and after the frost resistance test is shown in Table 15. It follows from the data that this test did not cause the kind of damage that was caused by thermal stress. From the comparison of both mixtures, the HPC again proved to be better.

14. Frost Resistance Test

The frost resistance of the concrete (see Figure 25) was determined by testing ten samples from each mixture (see Table 16 and Table 17). The start of the test took place 56 days after the production of the samples. The number of cycles was set at 50. Standard ČSN 73 1322 [38] states that concrete is frost-resistant for the number of cycles in which the frost resistance factor is not less than 75%. With this information, it was possible to evaluate the measured results. For the OPC sample, the value of the frost resistance coefficient was 44%, which means that, after 50 cycles, this concrete was no longer frost-resistant. In contrast, the HPC samples achieved excellent results, and their frost resistance coefficient was 100%. Therefore, with the number of cycles set at 50, it is possible to mark the samples as frost-resistant.
In the graph in Figure 26, we can see the compressive strength before and after the frost resistance test. The compressive strength was measured before the frost resistance test. The frost resistance test lasted 56 days. After the test, the strength was measured again. The compressive strength decreased for the OPC samples after the test, while it increased for the HPC samples. After the test, the HPC samples had 2.5-fold higher compressive strength than the OPC samples.
The flexural strength was also tested before and after the frost resistance test, and the values are shown in the graph in Figure 27. For the HPC mixture, the strength increased again, and for the OPC specimens, the strength decreased more than twofold. After the test, the HPC samples had 4.7-fold higher flexural strength than the OPC samples.

15. Test of Resistance to Water and Chemical De-Icing Substances

In total, six cube-shaped samples with an edge length of 100 mm from the OPC and HPC samples were tested. The concrete’s resistance to water and chemical de-icing substances was tested in the local laboratory according to the standard ČSN 73 1326 [39] using method A. The samples were partially immersed in NaCl solution and subjected to a total of 200 cycles (see Table 18 and Table 19). According to the standard ČSN 73 1326 [39], the degree of violation can be assigned with respect to waste in g/m2. For the OPC samples (see Table 18) subjected to up to 100 cycles, the average waste was more than 3000 g/m2. The samples were therefore classified as “destroyed”. In the same way, the degree of damage could also be assigned to the HPC samples. Here, the average waste after 100 cycles was slightly more than 50 g/m2; therefore, the samples were “slightly disturbed” (see Table 19). The OPC samples after 200 cycles, with an average waste of more than 5000 g/m2, could be classified as “destroyed”; the HPC samples, with an average waste of almost 100 g/m2, were still classified as “slightly disturbed” (see Table 18 and Table 19).
In Figure 28, we see a significantly damaged OPC sample on the left side with visible used aggregate; on the right, the HPC sample is in relatively good condition, with slight degradation.
The graph in Figure 29 shows the increase in waste for the OPC samples after every 50 cycles. The average waste was 1626.6 g/m2. The amount of waste detected for this mixture was at a similar level for all the cycles. A different situation prevails with the HPC samples, as evidenced by the following graph in Figure 30. The highest waste was measured immediately after the first 50 cycles. In the following steps, the value of the waste decreased more than twofold.

16. Conclusions and Discussion

The present study examines the properties of selected concrete, where the first mixture was based on ordinary concrete using Portland cement and served as a reference, while the second mixture was based on high-performance concrete with a compressive strength of around 100 MPa. The workability and fluidity of the preferred HPC was significantly better.
An experiment was set up to investigate the development of the increase in compressive and flexural over time. The specialized tests included the exposure of the samples to thermal stress up to 1000 °C, resistance tests against water and chemical de-icing agents, and frost resistance tests.
The 28-day compressive strength results of the HPC mixture were twice the strength of the OPC mixture. After the first day, the HPC mixture reached more than one-third of the 28-day compressive strength. A high increase in HPC compressive strength after one day was also reported by Mateckova [6]. Both mixtures reached approximately 87% of the 28-day compressive strength within the first 14 days. After 56 days, only a minimal increase was observed [44].
In the case of static loading, the sample size also plays an important role [45]. For comparison, 28-day compressive strength tests were carried out on 150 mm and 100 mm edge cubes and 40 × 40 mm prism fragments. For the OPC mixture, an increase in compressive strength of approximately 17% was observed on the 100 mm edge cubes and approximately 25% on the 40 × 40 mm prism fragments compared to the 150 mm edge cubes. In the case of HPC, the increase in compressive strength on 100 mm cubes and 40 × 40 mm prism fragments compared to 150 mm cubes was almost the same, i.e., approximately 31–34%. A significant development in flexural strength was also observed in the HPC mixture after 28 days when it increased by more than 20%. Research by Siddique [46] shows that the silica fume content in the mixtures, among other factors, contributes significantly to the development of the flexural strength in time.
As part of the specialized tests, it was proven that the resistance of HPC to water and chemical de-icing substances was several times greater than that of OPC concrete. The most important specialized test involved exposure to thermal stress of compressive and flexural strengths (up to 1000 °C).
At a temperature of 250 °C, OPC exhibited a slight increase in both compressive strength and flexural strength. In contrast, the HPC mixture showed a slight decrease. This can be explained by the denser structure of HPC, which leads to higher pore pressures, causing spalling [21]. In OPC, water evaporation at these temperatures is facilitated by sufficient pore space. Between 500 and 750 °C, significant declines in strength characteristics were observed. Around 450 °C, calcium hydroxide begins to decompose into quicklime, and at 600 °C, significant aggregate expansion occurs [47]. Arioz [48] found that major crack formation happens between 600 and 800 °C, which supports the substantial decrease in strength characteristics observed in this temperature range in our study. Beyond 1000 °C, the flexural strengths of both mixtures became negligible. However, OPC retained approximately 15% of its original 28-day compressive strength, while HPC maintained around 20% of its 28-day strength. The color change due to exposure temperature is visible in Figure 15, Figure 16, Figure 17, Figure 18, Figure 19 and Figure 20. Arioz [48] suggests using a color scale as a method for assessing the exposure of concrete structures to high temperatures in retrospective evaluations.
The resulting ratio of propagation of the velocity of ultrasonic waves dropped to the range of 0.18–0.26. From the results of ultrasonic wave propagation, we also detected a significant number of cracks in the samples exposed to high temperatures. These were mainly caused by structural changes in the hydration products of the cement matrix and the formation of pores, which reduced the resulting strength and durability of the material. The use of micro- and nano-admixtures can eliminate this phenomenon to some extent, as experiments have shown [49].
During the frost resistance test, the flexural strength of the HPC samples had similar values, while the flexural strength of the OPC samples was reduced by 44%. In this case, it is also necessary to focus on the nature of the results. Wang [50] addressed this issue in his study and emphasized the importance of studying the pore structures and their fractal dimensions in a concrete composite. Simply put, the composition of HPC causes the formation of fewer pores than OPC, which has a positive effect on its frost resistance. In addition, as discussed in the study, a number of other additives can be used to further improve this property, such as fly ash, PVA fibers, MgO, or shrinkage-reducing admixtures. Wang investigated a similar issue in his following study [51], where he discussed the effect of finely ground phosphate slag and fly ash on the frost resistance and structure of pores. The results show that the addition of 15–45% phosphate slag or fly ash decreases the frost resistance of the 28-day specimens, but the addition of less than 30% phosphate slag improves the frost resistance of concrete. Phosphate slag also prevents the formation of pores more effectively than fly ash, when the authors will focus on this issue in further research.

Author Contributions

Conceptualization, O.S.; data curation, A.P., J.J., R.G. (Radoslav Gandel) and R.G. (Roman Gabor); methodology, O.S.; formal analysis A.P, J.J., R.G. (Radoslav Gandel) and R.G. (Roman Gabor); writing—original draft, A.P. and R.G. (Radoslav Gandel); supervision, V.B., Investigation, O.S. All authors have read and agreed to the published version of the manuscript.

Funding

This research was funded by the Jan Amos Komensky Operational Program, financed by the European Union and the state budget of the Czech Republic (grant number CZ.02.01.01/00/22_008/0004631 (Materials and technologies for sustainable development)). This research also received support from the Ministry of Education, specifically from the Student Research Grant Competition of the Technical University of Ostrava under identification number SP2023/058 and SP2024/084.

Data Availability Statement

Acknowledgments

This paper was written as part of project no. CZ.02.01.01/00/22_008/0004631 (Materials and technologies for sustainable development) within the Jan Amos Komensky Operational Program financed by the European Union and the state budget of the Czech Republic. This research also received support from the Ministry of Education, specifically from the Student Research Grant Competition of the Technical University of Ostrava under identification number SP2023/058 and SP2024/084.

Conflicts of Interest

The authors declare no conflicts of interest.

References

  1. Słowik, M.; Błazik-Borowa, E.; Sulewska, M.J.; Skrzypczak, I.; Kokoszka, W. Crack Resistance of Lightly Reinforced Concrete Structures. Materials 2024, 17, 2197. [Google Scholar] [CrossRef] [PubMed]
  2. Yang, Y.; Yang, H.; Fan, Z.; Mu, Z. Crack Propagation Law of Reinforced Concrete Beams. Appl. Sci. 2024, 14, 409. [Google Scholar] [CrossRef]
  3. Khmil, R.; Blikharskyy, Z.; Vegera, P.; Kopiika, N. Bearing Capacity of Reinforced Concrete Beams with and without Damages of Rebar. Prod. Eng. Arch. 2023, 29, 298–303. [Google Scholar] [CrossRef]
  4. Kraľovanec, J.; Moravčík, M. Experimental Measurements in the Field of Prestressing Force Monitoring. Civ. Environ. Eng. 2022, 18, 104–110. [Google Scholar] [CrossRef]
  5. Le, T.D.; Konecny, P.; Mateckova, P. Time Dependent Variation of Carrying Capacity of Prestressed Precast Beam. IOP Conf. Ser. Earth Environ. Sci. 2018, 143, 012013. [Google Scholar] [CrossRef]
  6. Mateckova, P.; Bilek, V.; Sucharda, O. Comparative Study of High-Performance Concrete Characteristics and Loading Test of Pretensioned Experimental Beams. Crystals 2021, 11, 427. [Google Scholar] [CrossRef]
  7. Jonnalagadda, S.; Chava, S. Ultra-High-Performance Concrete (UHPC): A State-of-the-Art Review of Material Behavior, Structural Applications and Future. Electron. J. Struct. Eng. 2023, 23, 25–30. [Google Scholar] [CrossRef]
  8. Sucharda, O.; Marcalikova, Z.; Gandel, R. Microstructure, Shrinkage, and Mechanical Properties of Concrete with Fibers and Experiments of Reinforced Concrete Beams without Shear Reinforcement. Materials 2022, 15, 5707. [Google Scholar] [CrossRef]
  9. Babaie, R.; Abolfazli, M.; Fahimifar, A. Mechanical Properties of Steel and Polymer Fiber Reinforced Concrete. J. Mech. Behav. Mater. 2019, 28, 119–134. [Google Scholar] [CrossRef]
  10. Taha, B.; Nounu, G. Properties of Concrete Contains Mixed Colour Waste Recycled Glass as Sand and Cement Replacement. Constr. Build. Mater. 2008, 22, 713–720. [Google Scholar] [CrossRef]
  11. Likes, L.; Markandeya, A.; Haider, M.M.; Bollinger, D.; McCloy, J.S.; Nassiri, S. Recycled Concrete and Brick Powders as Supplements to Portland Cement for More Sustainable Concrete. J. Clean. Prod. 2022, 364, 132651. [Google Scholar] [CrossRef]
  12. Roychand, R.; Gravina, R.J.; Zhuge, Y.; Ma, X.; Mills, J.E.; Youssf, O. Practical Rubber Pre-Treatment Approch for Concrete Use—An Experimental Study. J. Compos. Sci. 2021, 5, 143. [Google Scholar] [CrossRef]
  13. Nodehi, M.; Taghvaee, V.M. Alkali-Activated Materials and Geopolymer: A Review of Common Precursors and Activators Addressing Circular Economy. Circ. Econ. Sustain. 2021, 2, 165–196. [Google Scholar] [CrossRef]
  14. Bilek, V.; Sucharda, O.; Bujdos, D. Frost Resistance of Alkali-Activated Concrete—An Important Pillar of Their Sustainability. Sustainability 2021, 13, 473. [Google Scholar] [CrossRef]
  15. Palomo, A.; Maltseva, O.; Garcia-Lodeiro, I.; Fernández-Jiménez, A. Portland Versus Alkaline Cement: Continuity or Clean Break: “A Key Decision for Global Sustainability”. Front. Chem. 2021, 9, 705475. [Google Scholar] [CrossRef]
  16. Chen, Y.; He, S.; Gan, Y.; Çopuroğlu, O.; Veer, F.; Schlangen, E. A Review of Printing Strategies, Sustainable Cementitious Materials and Characterization Methods in the Context of Extrusion-Based 3D Concrete Printing. J. Build. Eng. 2022, 45, 103599. [Google Scholar] [CrossRef]
  17. Joh, C.; Lee, J.; Bui, T.Q.; Park, J.; Yang, I.-H. Buildability and Mechanical Properties of 3D Printed Concrete. Materials 2020, 13, 4919. [Google Scholar] [CrossRef]
  18. Lyu, F.; Zhao, D.; Hou, X.; Sun, L.; Zhang, Q. Overview of the Development of 3D-Printing Concrete: A Review. Appl. Sci. 2021, 11, 9822. [Google Scholar] [CrossRef]
  19. Liu, S.; Zhu, M.; Ding, X.; Ren, Z.; Zhao, S.; Zhao, M.; Dang, J. High-Durability Concrete with Supplementary Cementitious Admixtures Used in Corrosive Environments. Crystals 2021, 11, 196. [Google Scholar] [CrossRef]
  20. Wardeh, G.; Mohamed, M.A.; Ghorbel, E. Analysis of Concrete Internal Deterioration Due to Frost Action. J. Build. Phys. 2010, 35, 54–82. [Google Scholar] [CrossRef]
  21. Kalifa, P.; Menneteau, F.-D.; Quenard, D. Spalling and pore pressure in HPC at high temperatures. Cem. Concr. Res. 2000, 30, 1915–1927. [Google Scholar] [CrossRef]
  22. Yermak, N.; Pliya, P.; Beaucour, A.-L.; Simon, A.; Noumowé, A. Influence of steel and/or polypropylene fibres on the behaviour of concrete at high temperature: Spalling, transfer and mechanical properties. Constr. Build. Mater. 2017, 132, 240–250. [Google Scholar] [CrossRef]
  23. Ma, Q.; Guo, R.; Zhao, Z.; Lin, Z.; He, K. Mechanical properties of concrete at high temperature—A review. Constr. Build. Mater. 2015, 93, 371–383. [Google Scholar] [CrossRef]
  24. Hager, I. Behaviour of cement concrete at high temperature. Bull. Pol. Acad. Sci. Tech. Sci. 2013, 61, 145–154. [Google Scholar] [CrossRef]
  25. Chen, Y.; Li, X.; Du, H. A review of high temperature properties of cement based composites: Effects of nano materials. Mater. Today Commun. 2023, 35, 105954. [Google Scholar] [CrossRef]
  26. Bouhedja, S.; El Kechebour, B.; Boukhaled, A. Optimized Cost of High Performance Concrete in the Build. Adv. Mater. Res. 2014, 911, 479–483. [Google Scholar] [CrossRef]
  27. Mondal, S.; Banerjee, S. High Strength & High Performance Concrete. Int. J. Civ. Eng. Technol. 2017, 8, 782–786. [Google Scholar]
  28. Kynclova, M.; Fiala, C.; Hajek, P. High Performance Concrete as a Sustainable Material. Int. J. Sustain. Build. Technol. Urban Dev. 2011, 2, 63–68. [Google Scholar] [CrossRef]
  29. Marvila, M.T.; de Azevedo, A.R.G.; de Matos, P.R.; Monteiro, S.N.; Vieira, C.M.F. Materials for Production of High and Ultra-High Performance Concrete: Review and Perspective of Possible Novel Materials. Materials 2021, 14, 4304. [Google Scholar] [CrossRef]
  30. Lakshmi, M.J.; Balaji, C.; Dinesh, A. Study on Strength properties of High performance concrete. Int. J. Appl. Eng. Res. 2015, 10, 31–34. [Google Scholar]
  31. Yan, Y.; Tian, L.; Zhao, W.; Lazaro, S.A.M.; Li, X.; Tang, S. Dielectric and mechanical properties of cement pastes incorporated with magnetically aligned reduced graphene oxide. Dev. Built Environ. 2024, 18, 100471. [Google Scholar] [CrossRef]
  32. Isaia, G.C. High-Performance Concrete for Sustainable Constructions. Waste Manag. Ser. 2000, 1, 344–354. [Google Scholar] [CrossRef]
  33. Peknikova, A. Mechanical Properties of Selected Concretes at Elevated Temperatures. Bachelor’s Thesis, VSB—Technical University of Ostrava, Ostrava, Czech Republic, 2023. Available online: http://hdl.handle.net/10084/150619 (accessed on 11 July 2024).
  34. ČSN EN 12390-7; Testing Hardened Concrete—Part 7: Density of Hardened Concrete. The Czech Office for Standards, Metrology and Testing: Praha, Czech Republic, 2020.
  35. ČSN EN 12390-3; Testing Hardened Concrete—Part 3: Compressive Strength of Test Specimens. The Czech Office for Standards, Metrology and Testing: Praha, Czech Republic, 2020.
  36. ČSN EN 12390-5; Testing Hardened Concrete—Part 5: Flexural Strength of Test Specimens. The Czech Office for Standards, Metrology and Testing: Praha, Czech Republic, 2020.
  37. ČSN 73 1371; Non-Destructive Testing of Concrete—Method of Ultrasonic Pulse Testing of Concrete. The Czech Office for Standards, Metrology and Testing: Praha, Czech Republic, 2011.
  38. ČSN 73 1322; Determination of Frost Resistance of Concrete. The Czech Office for Standards, Metrology and Testing: Praha, Czech Republic, 1969.
  39. ČSN 73 1326; Resistance of Cement Concrete Surface to Water and Defrosting Chemicals. The Czech Office for Standards, Metrology and Testing: Praha, Czech Republic, 1985.
  40. Sucharda, O.; Gandel, R.; Cmiel, P.; Jerabek, J.; Bilek, V. Utilization of High-Performance Concrete Mixtures for Advanced Manufacturing Technologies. Buildings 2024, 14, 2269. [Google Scholar] [CrossRef]
  41. Zhang, Z.; Scherer, G.W.; Bauer, A. Morphology of cementitious material during early hydration. Cem. Concr. Res. 2018, 17, 85–100. [Google Scholar] [CrossRef]
  42. Li, Y.; Zhang, H.; Huang, M.; Yin, H.; Jiang, K.; Xiao, K.; Tang, S. Influence of Different Alkali Sulfates on the Shrinkage, Hydration, Pore Structure, Fractal Dimension and Microstructure of Low-Heat Portland Cement, Medium-Heat Portland Cement and Ordinary Portland Cement. Fractal Fract. 2021, 5, 79. [Google Scholar] [CrossRef]
  43. Li, Y.; Zhang, H.; Zhang, Z.; Li, Y.; Fang, H.; Yuan, J.; Tang, S. The early-age cracking sensitivity, shrinkage, hydration process, pore structure and micromechanics of cement-based materials containing alkalis with different metal ions. Dev. Built Environ. 2024, 18, 100454. [Google Scholar] [CrossRef]
  44. Rahal, K. Mechanical properties of concrete with recycled coarse aggregate. Build. Environ. 2007, 42, 407–415. [Google Scholar] [CrossRef]
  45. Li, M.; Hao, H.; Shi, y.; Hao, Y. Specimen shape and size effects on the concrete compressive strength under static and dynamic tests. Constr. Build. Mater. 2018, 161, 84–93. [Google Scholar] [CrossRef]
  46. Siddique, R. Utilization of silica fume in concrete: Review of hardened properties. Resour. Conserv. Recycl. 2011, 55, 923–932. [Google Scholar] [CrossRef]
  47. Rodríguez Elizalde, R. Fire Effects on Reinforced Concrete. J. Civ. Eng. Res. 2022, 4, e134. [Google Scholar] [CrossRef]
  48. Arioz, O. Effects of elevated temperatures on properties of concrete. Fire Saf. J. 2007, 42, 516–522. [Google Scholar] [CrossRef]
  49. Chen, Y.; Li, X.; Dong, B.; Du, B.; Yan, R.; Wang, L. High-temperature properties of cement paste with graphene oxide agglomerates. Constr. Build. Mater. 2022, 320, 126286. [Google Scholar] [CrossRef]
  50. Wang, L.; Guo, F.; Yang, H.; Wang, Y.; Tang, S. Comparison of fly ash, PVA fiber, MgO and shrinkage-reducing admixtures on the frost resistance of face slab concrate via pore structural and fractal analysis. Fractals 2021, 29, 2140002. [Google Scholar] [CrossRef]
  51. Wang, L.; Huang, Y.; Zhao, F.; Huo, T.; Chen, E.; Tang, S. Comparison between the Influence of Finely Ground Phosphorous Slag and Fly Ash on Frost Resistance, Pore Structures and Fractal Features of Hydraulic Concrete. Fractal Fract. 2022, 6, 598. [Google Scholar] [CrossRef]
Figure 1. SEM image of OPC (×4500, 30.0 kV, COMPO, SEM, WD 12.9 mm, 10:44:08).
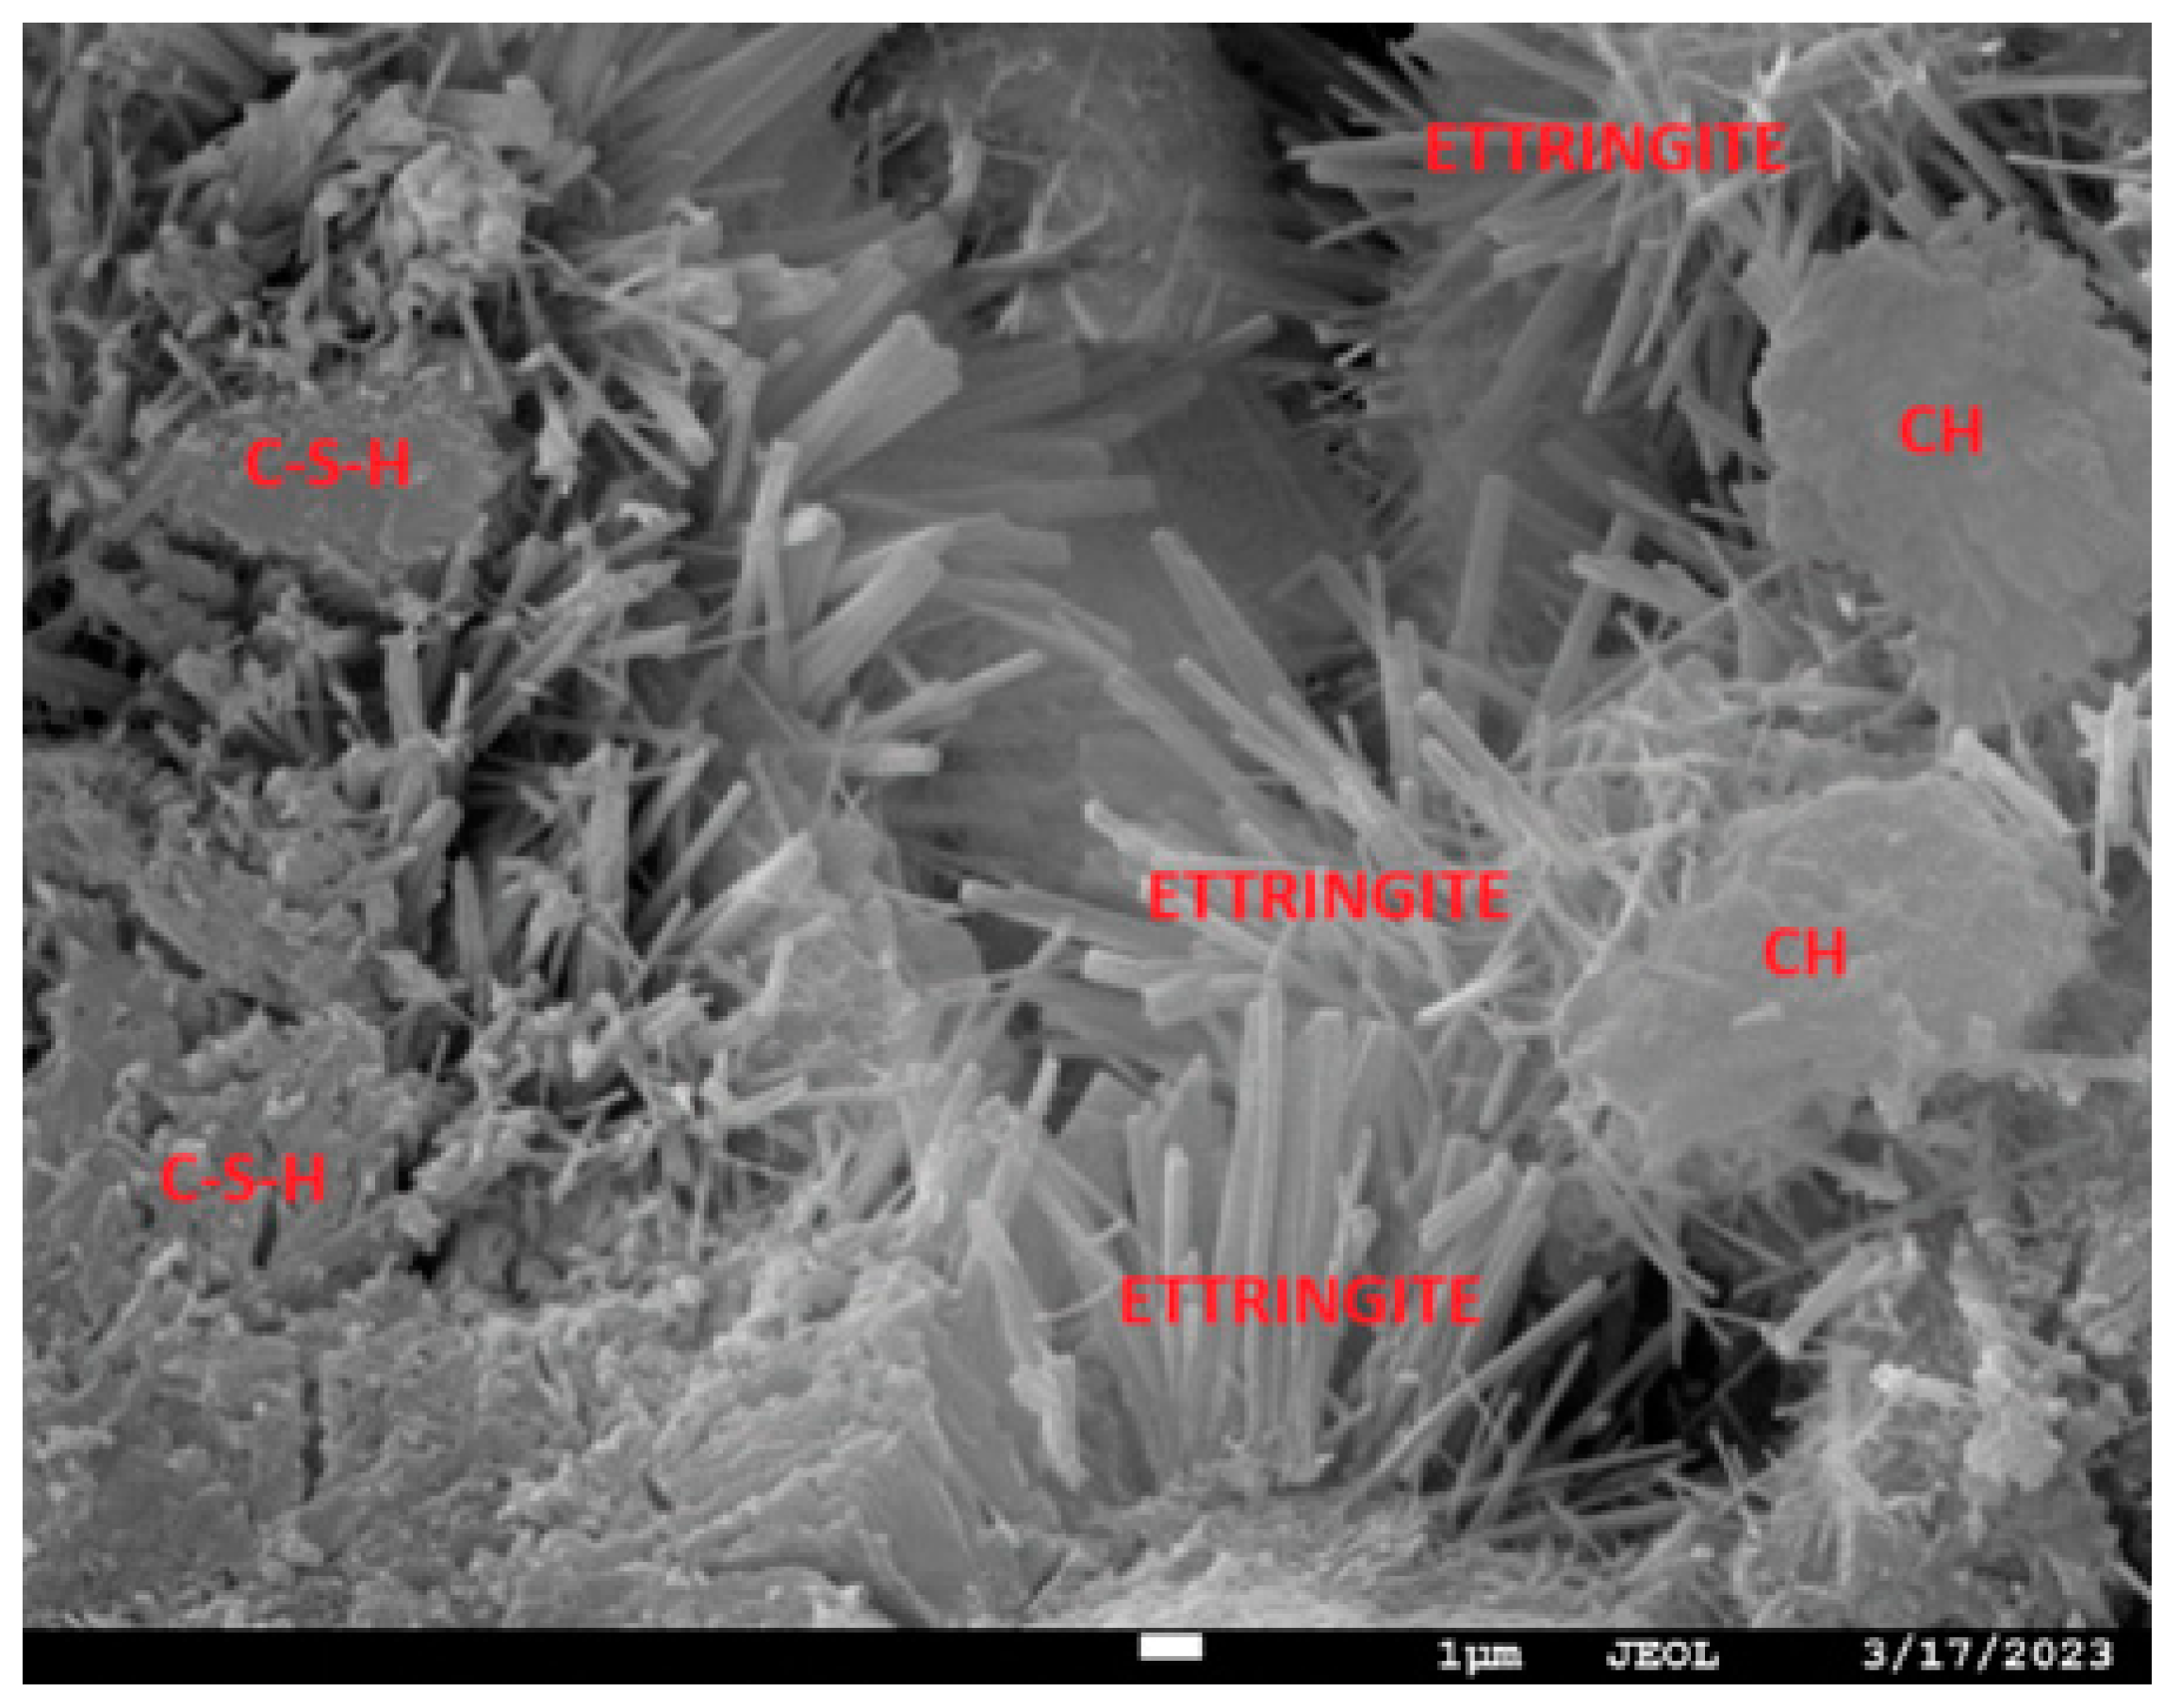
Buildings 15 01029 g001
Figure 2. SEM image of HPC (×3500, 30.0 kV, SEI, LM, WD 15.0 mm, 11:25:44).
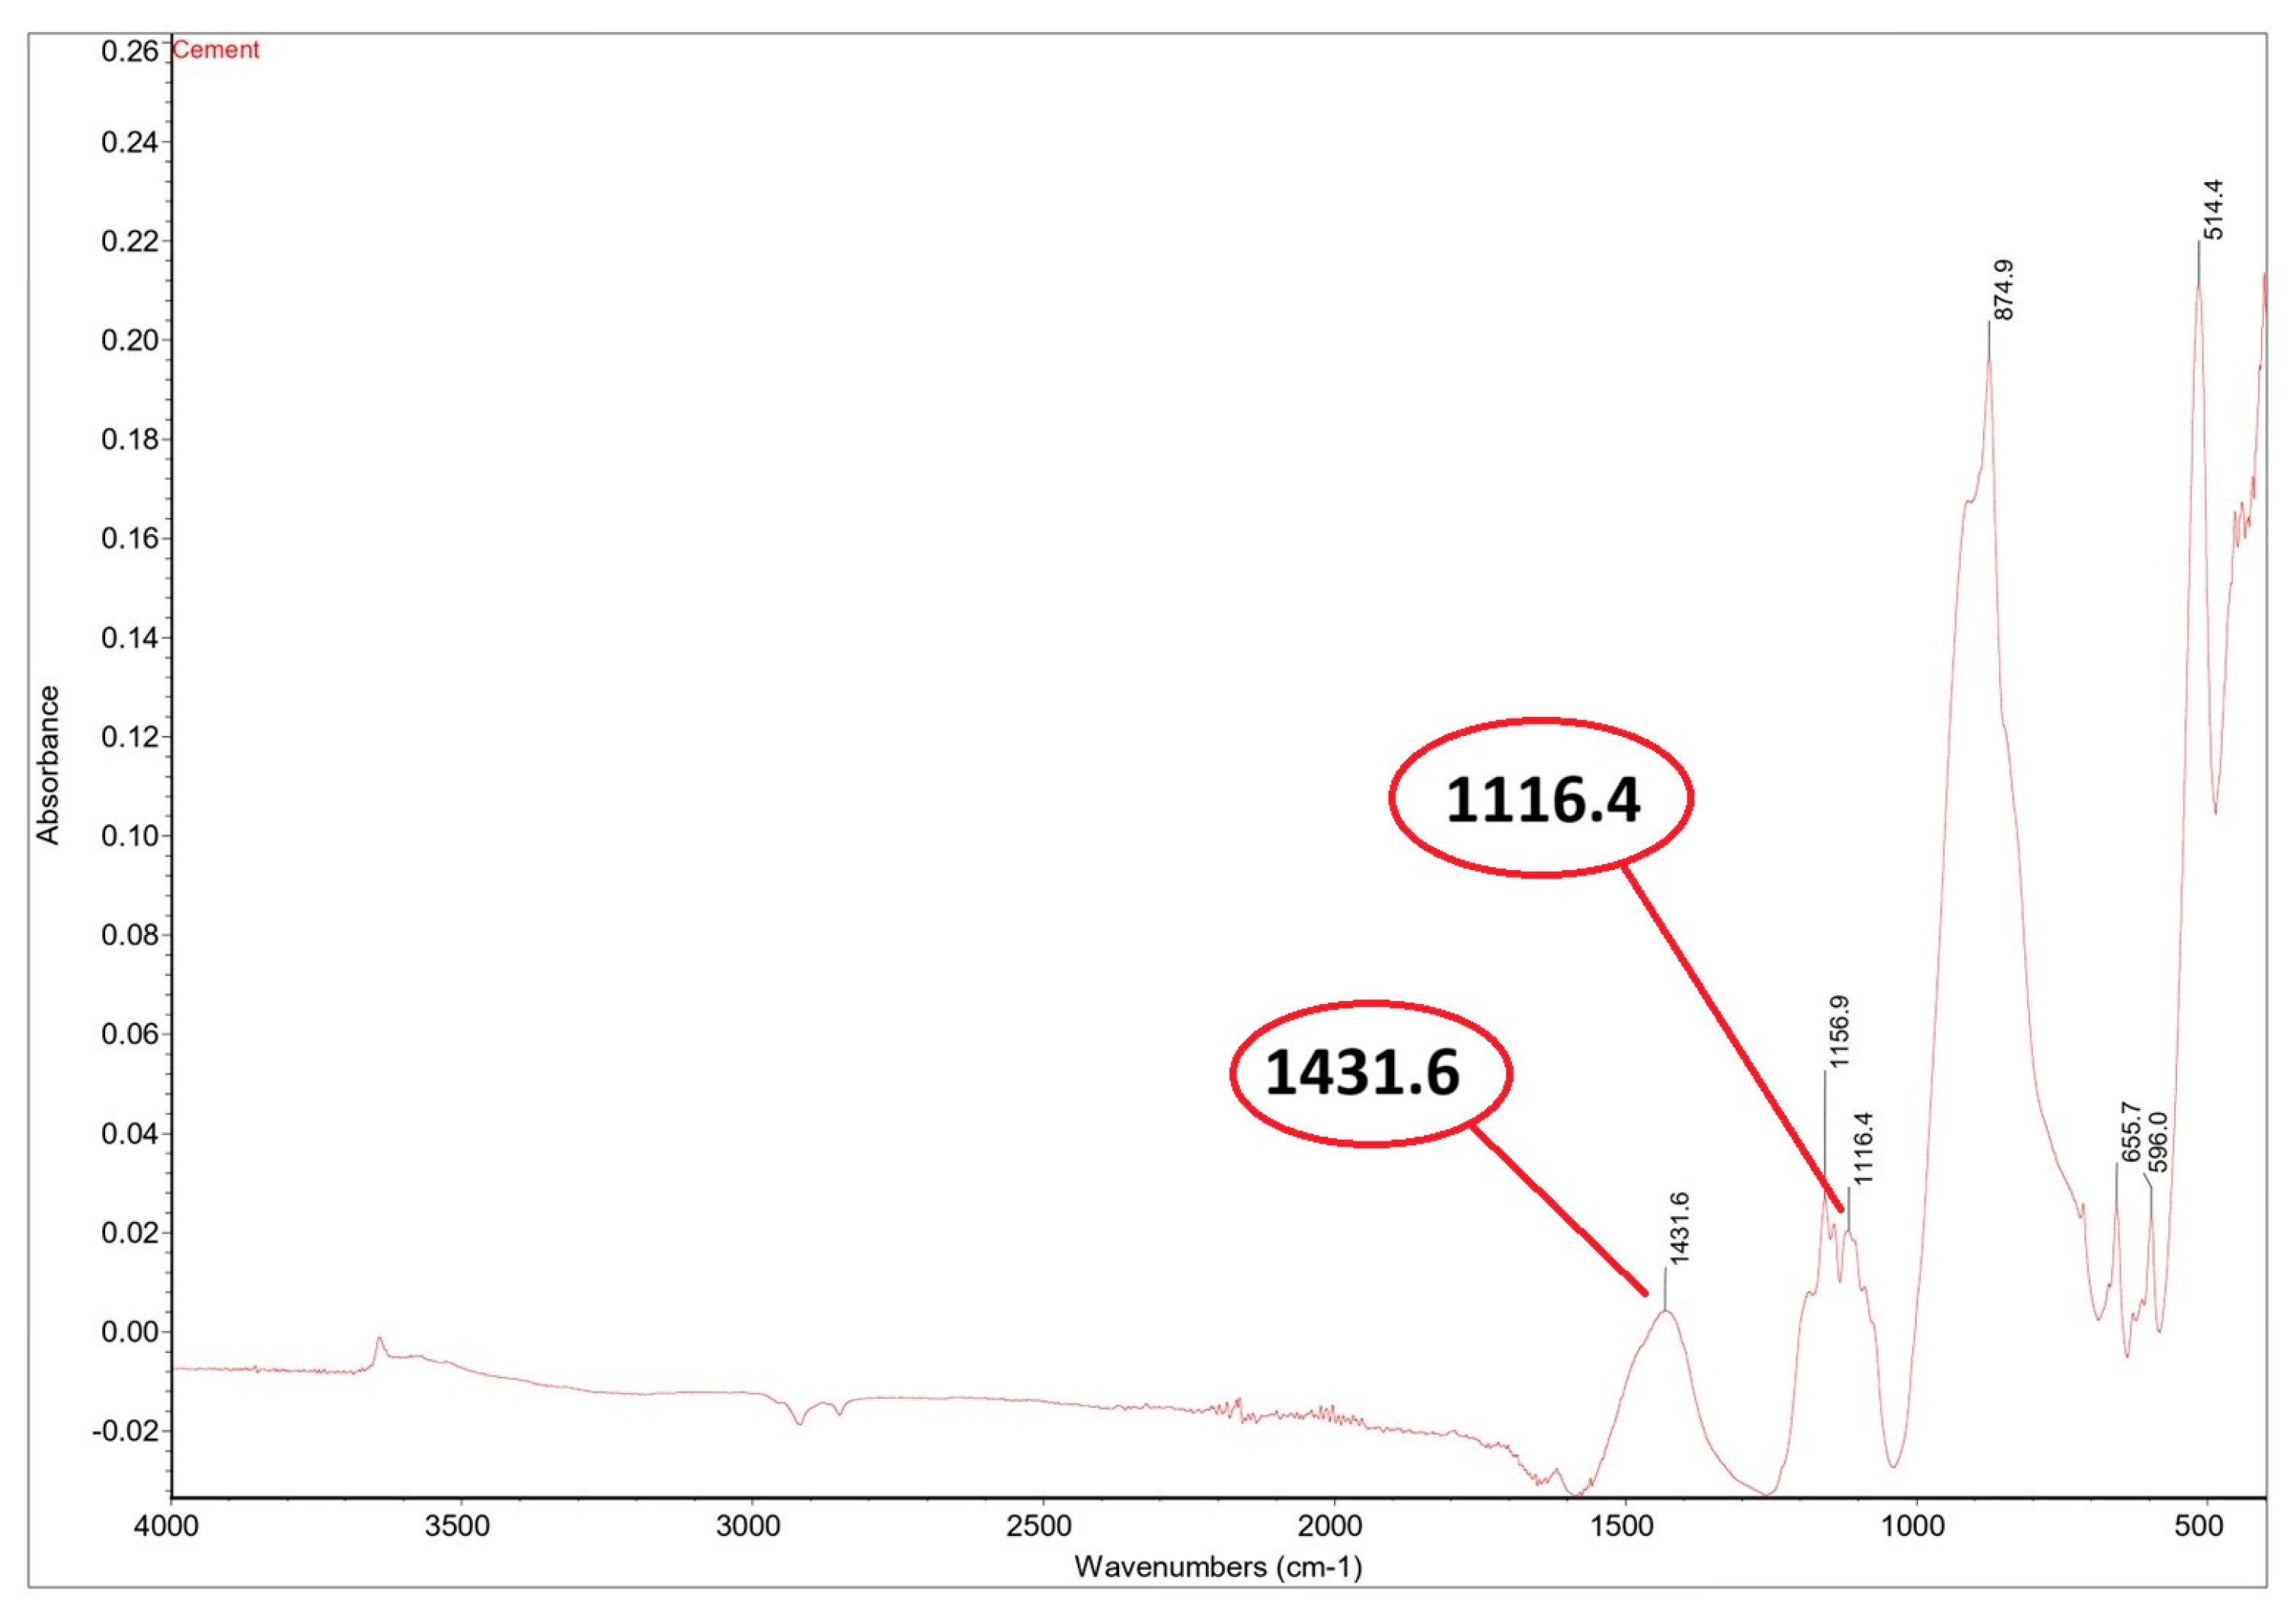
Buildings 15 01029 g002
Figure 3. FTIR analysis of used cement; horizontal axis (wavenumbers in cm−1), vertical axis (absorbance).
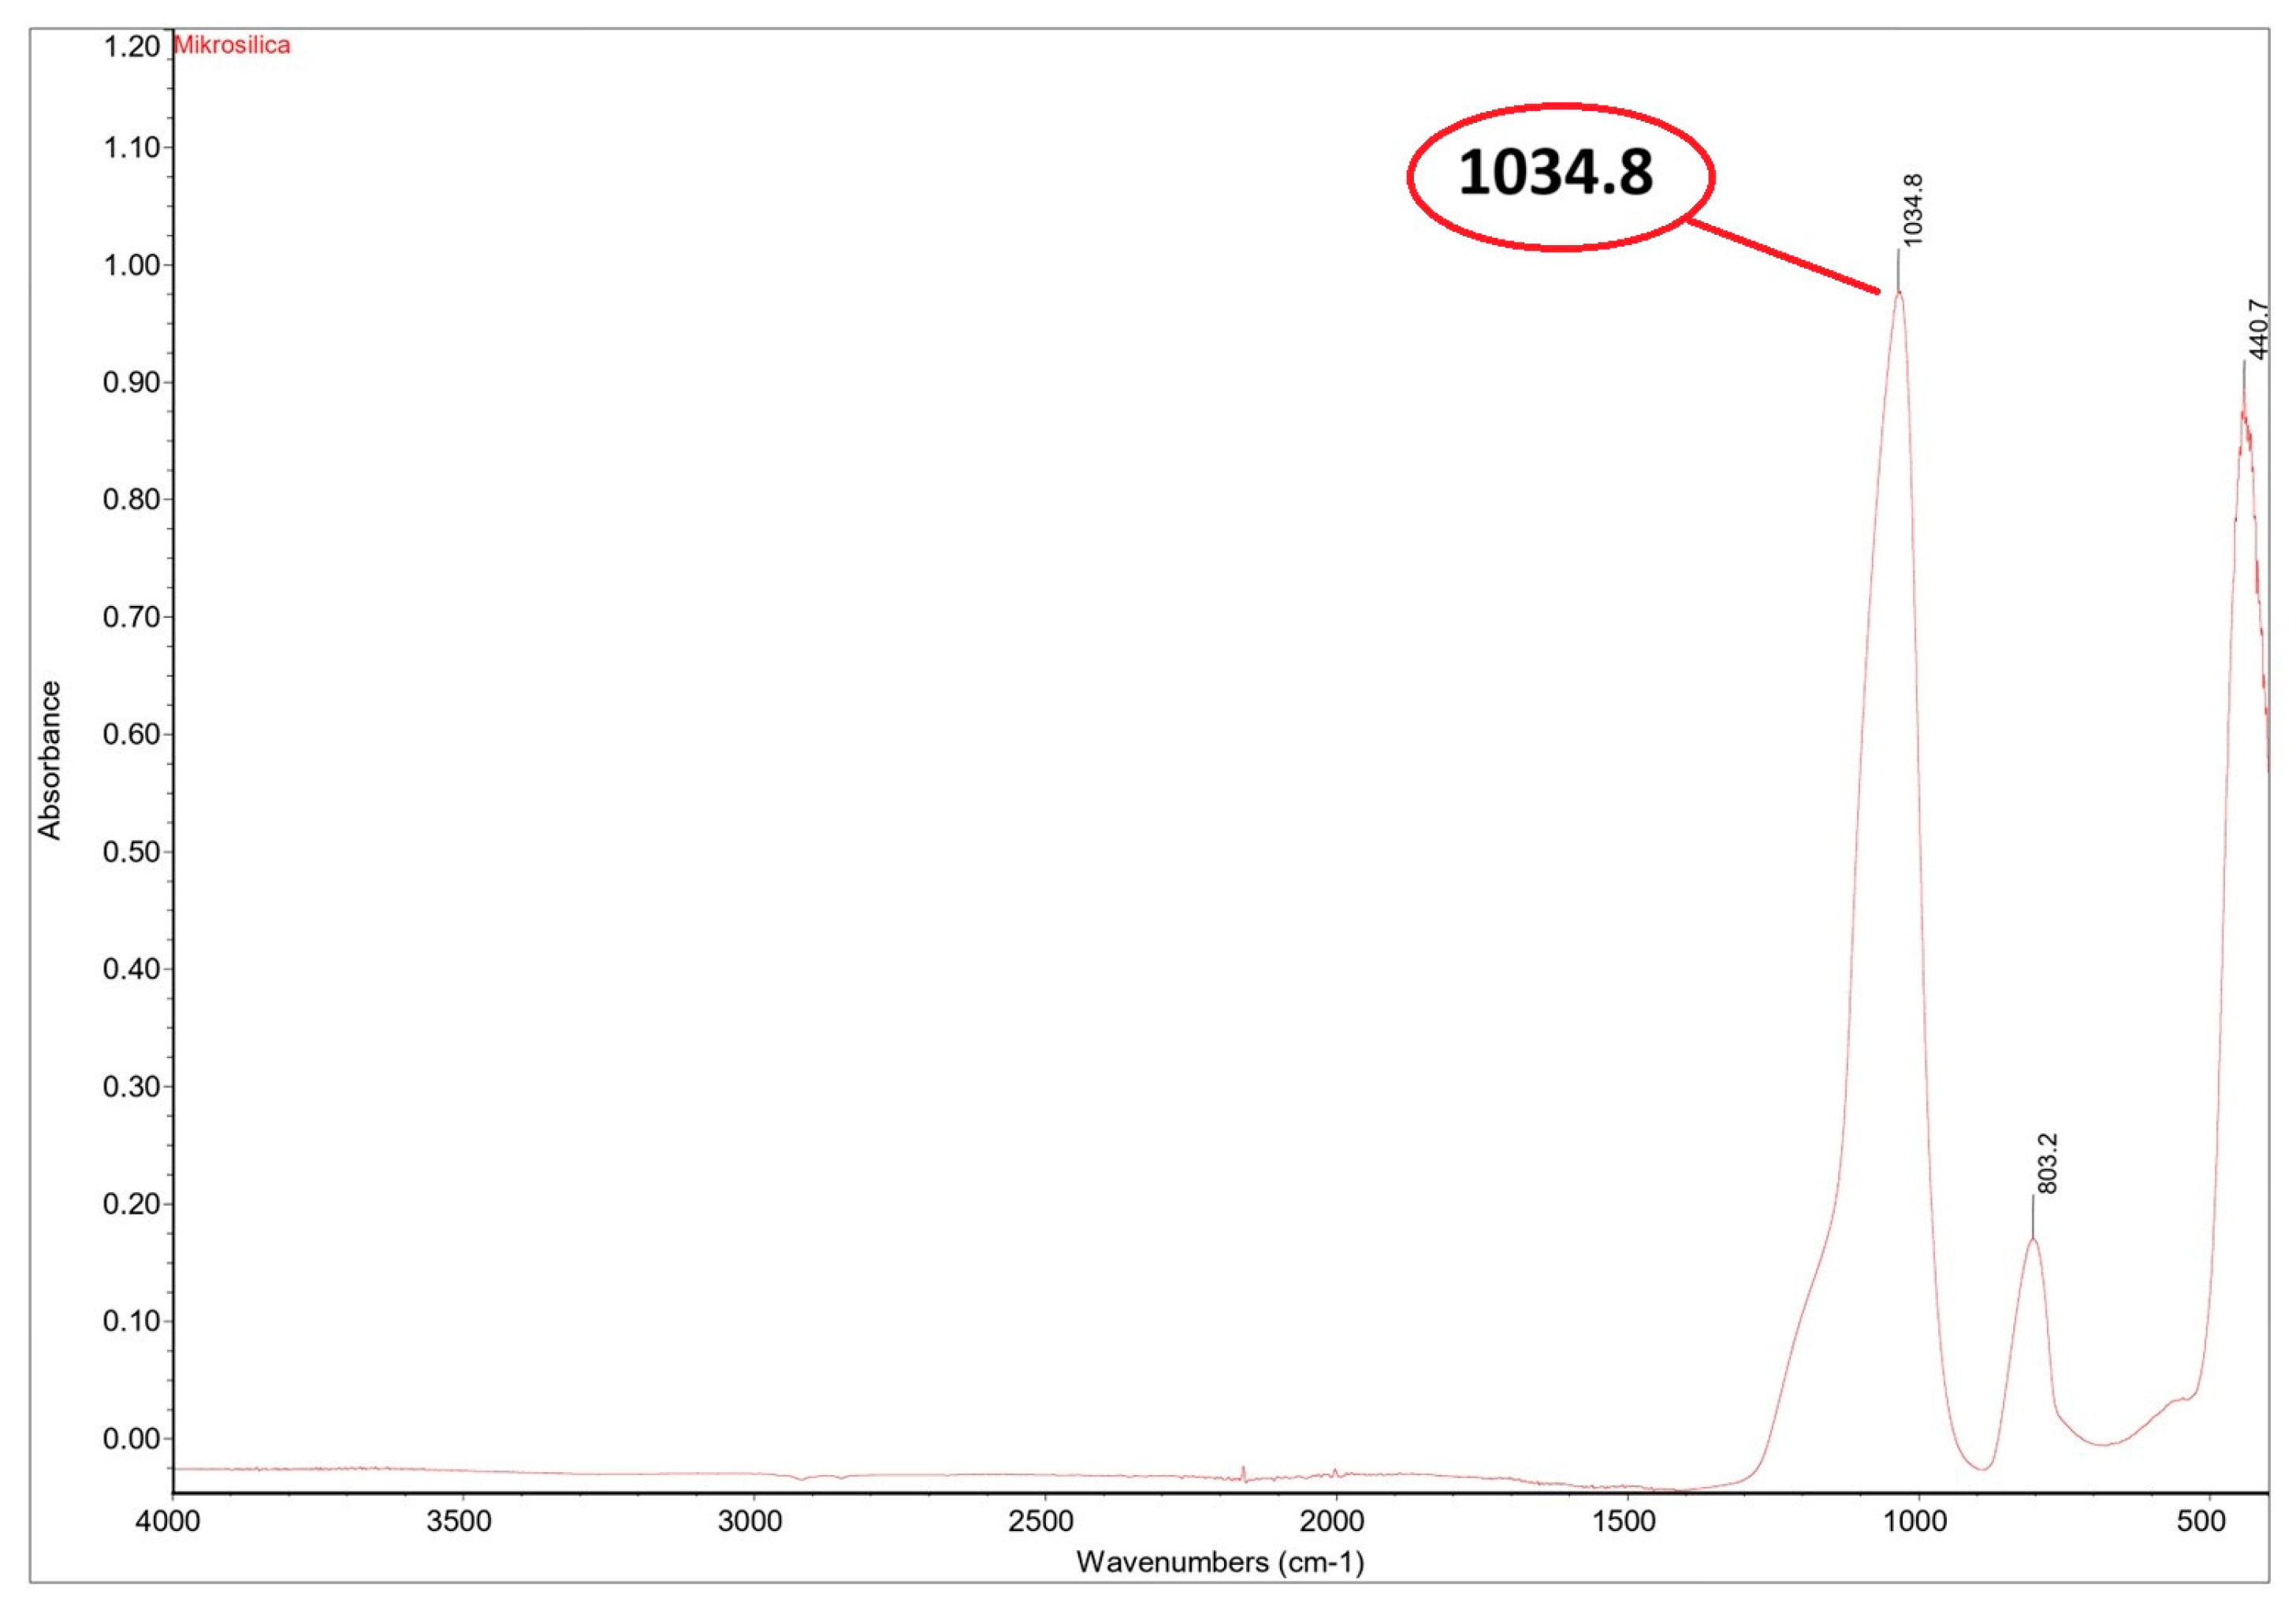
Buildings 15 01029 g003
Figure 4. FTIR analysis of used silica fume; horizontal axis (wavenumbers in cm−1), vertical axis (absorbance).
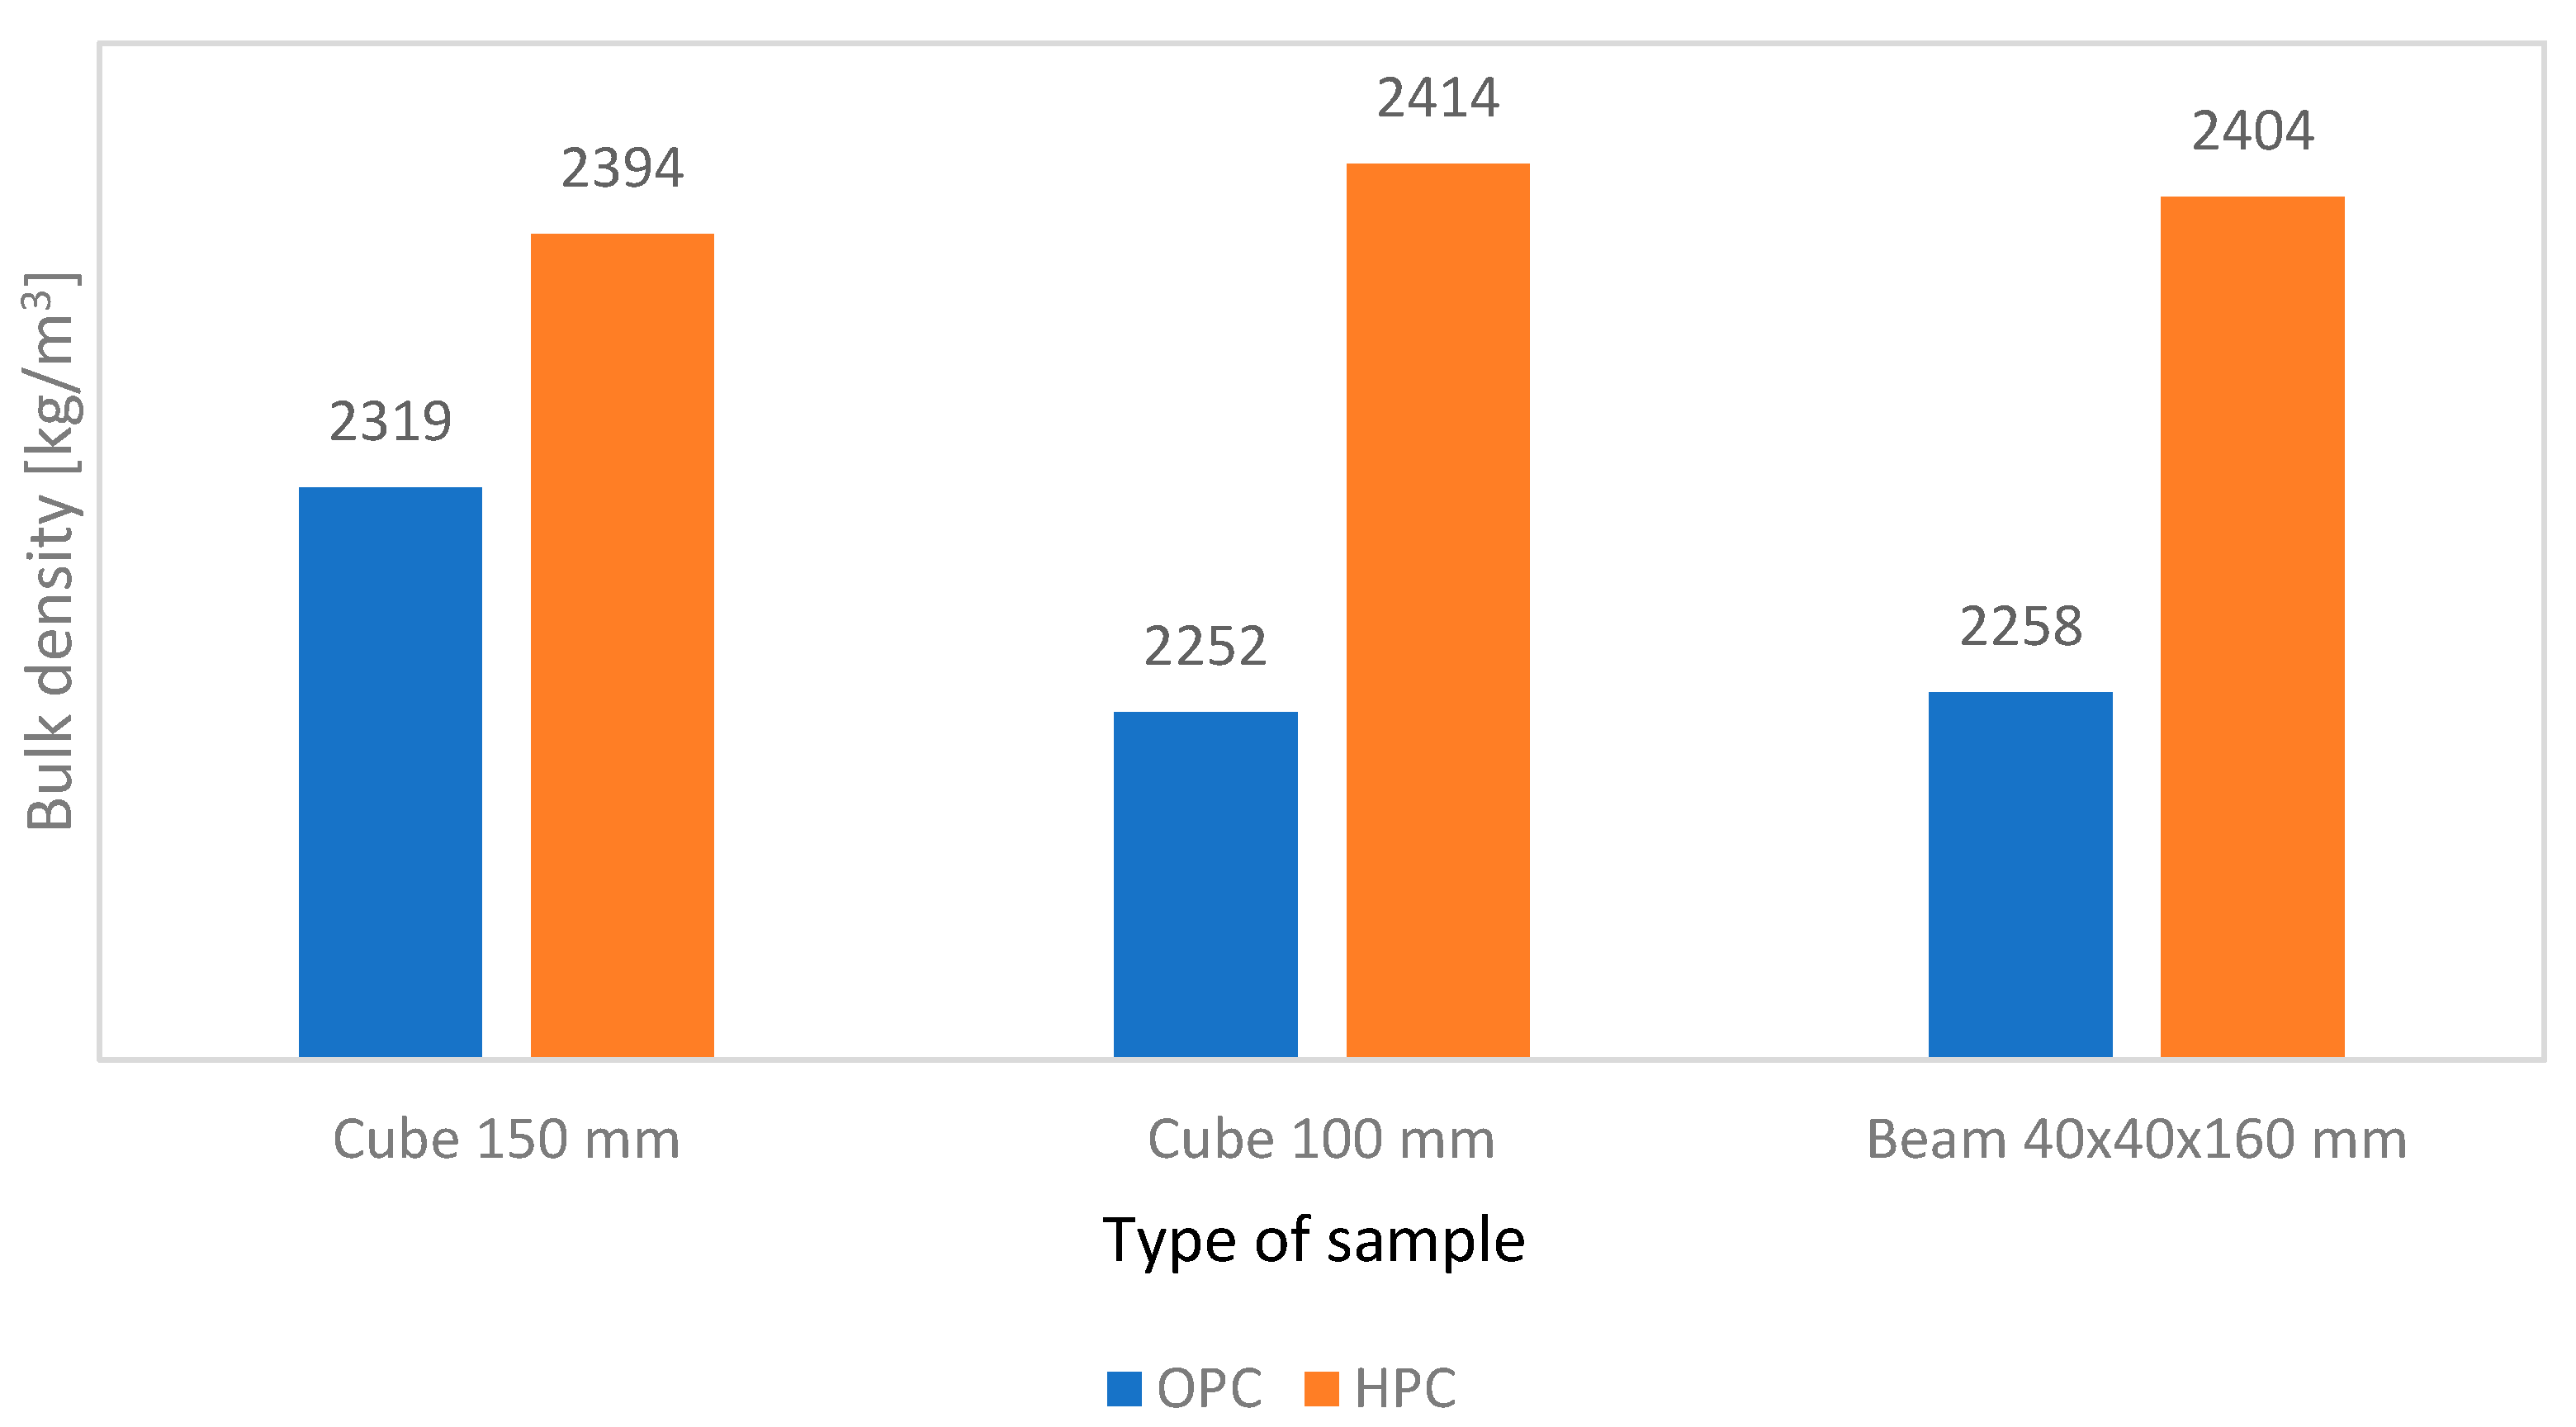
Buildings 15 01029 g004
Figure 5. Bulk density of different types of samples.
Buildings 15 01029 g005
Figure 6. Disintegrated prism half-beam specimen after compressive strength test.
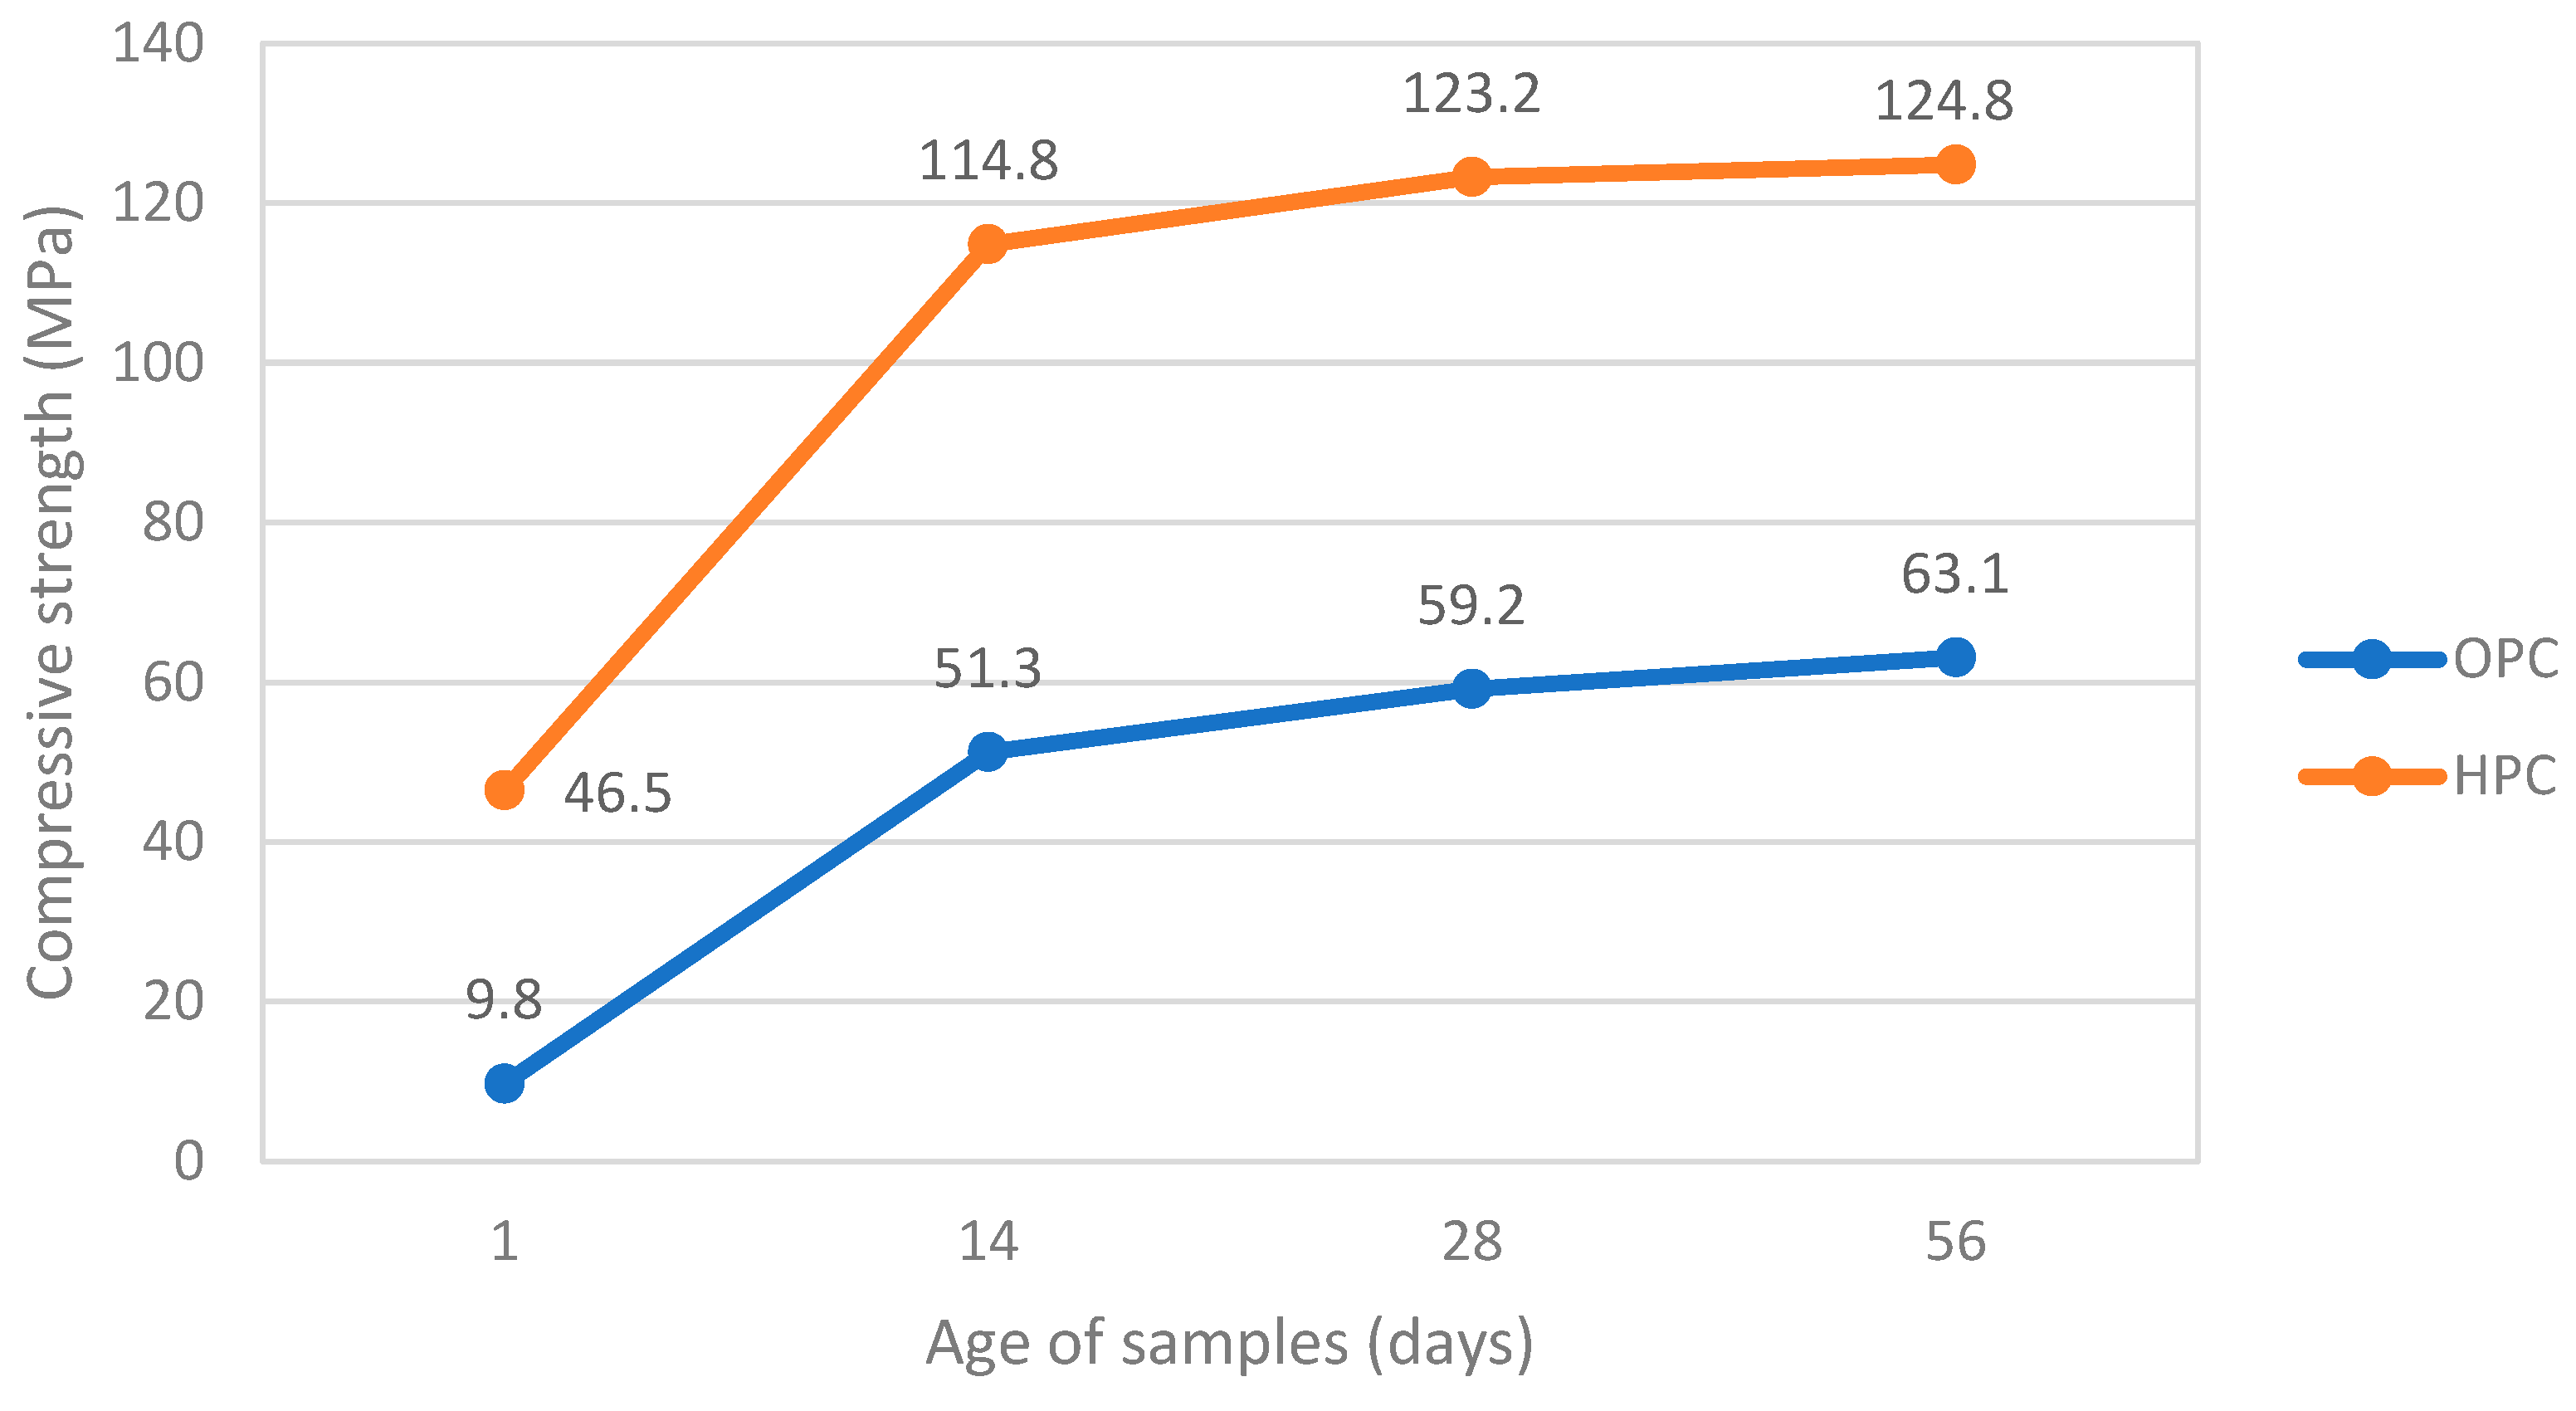
Buildings 15 01029 g006
Figure 7. Development of compressive strength for half-beams.
Buildings 15 01029 g007
Figure 8. Effect of pre-drying samples on compressive strength.
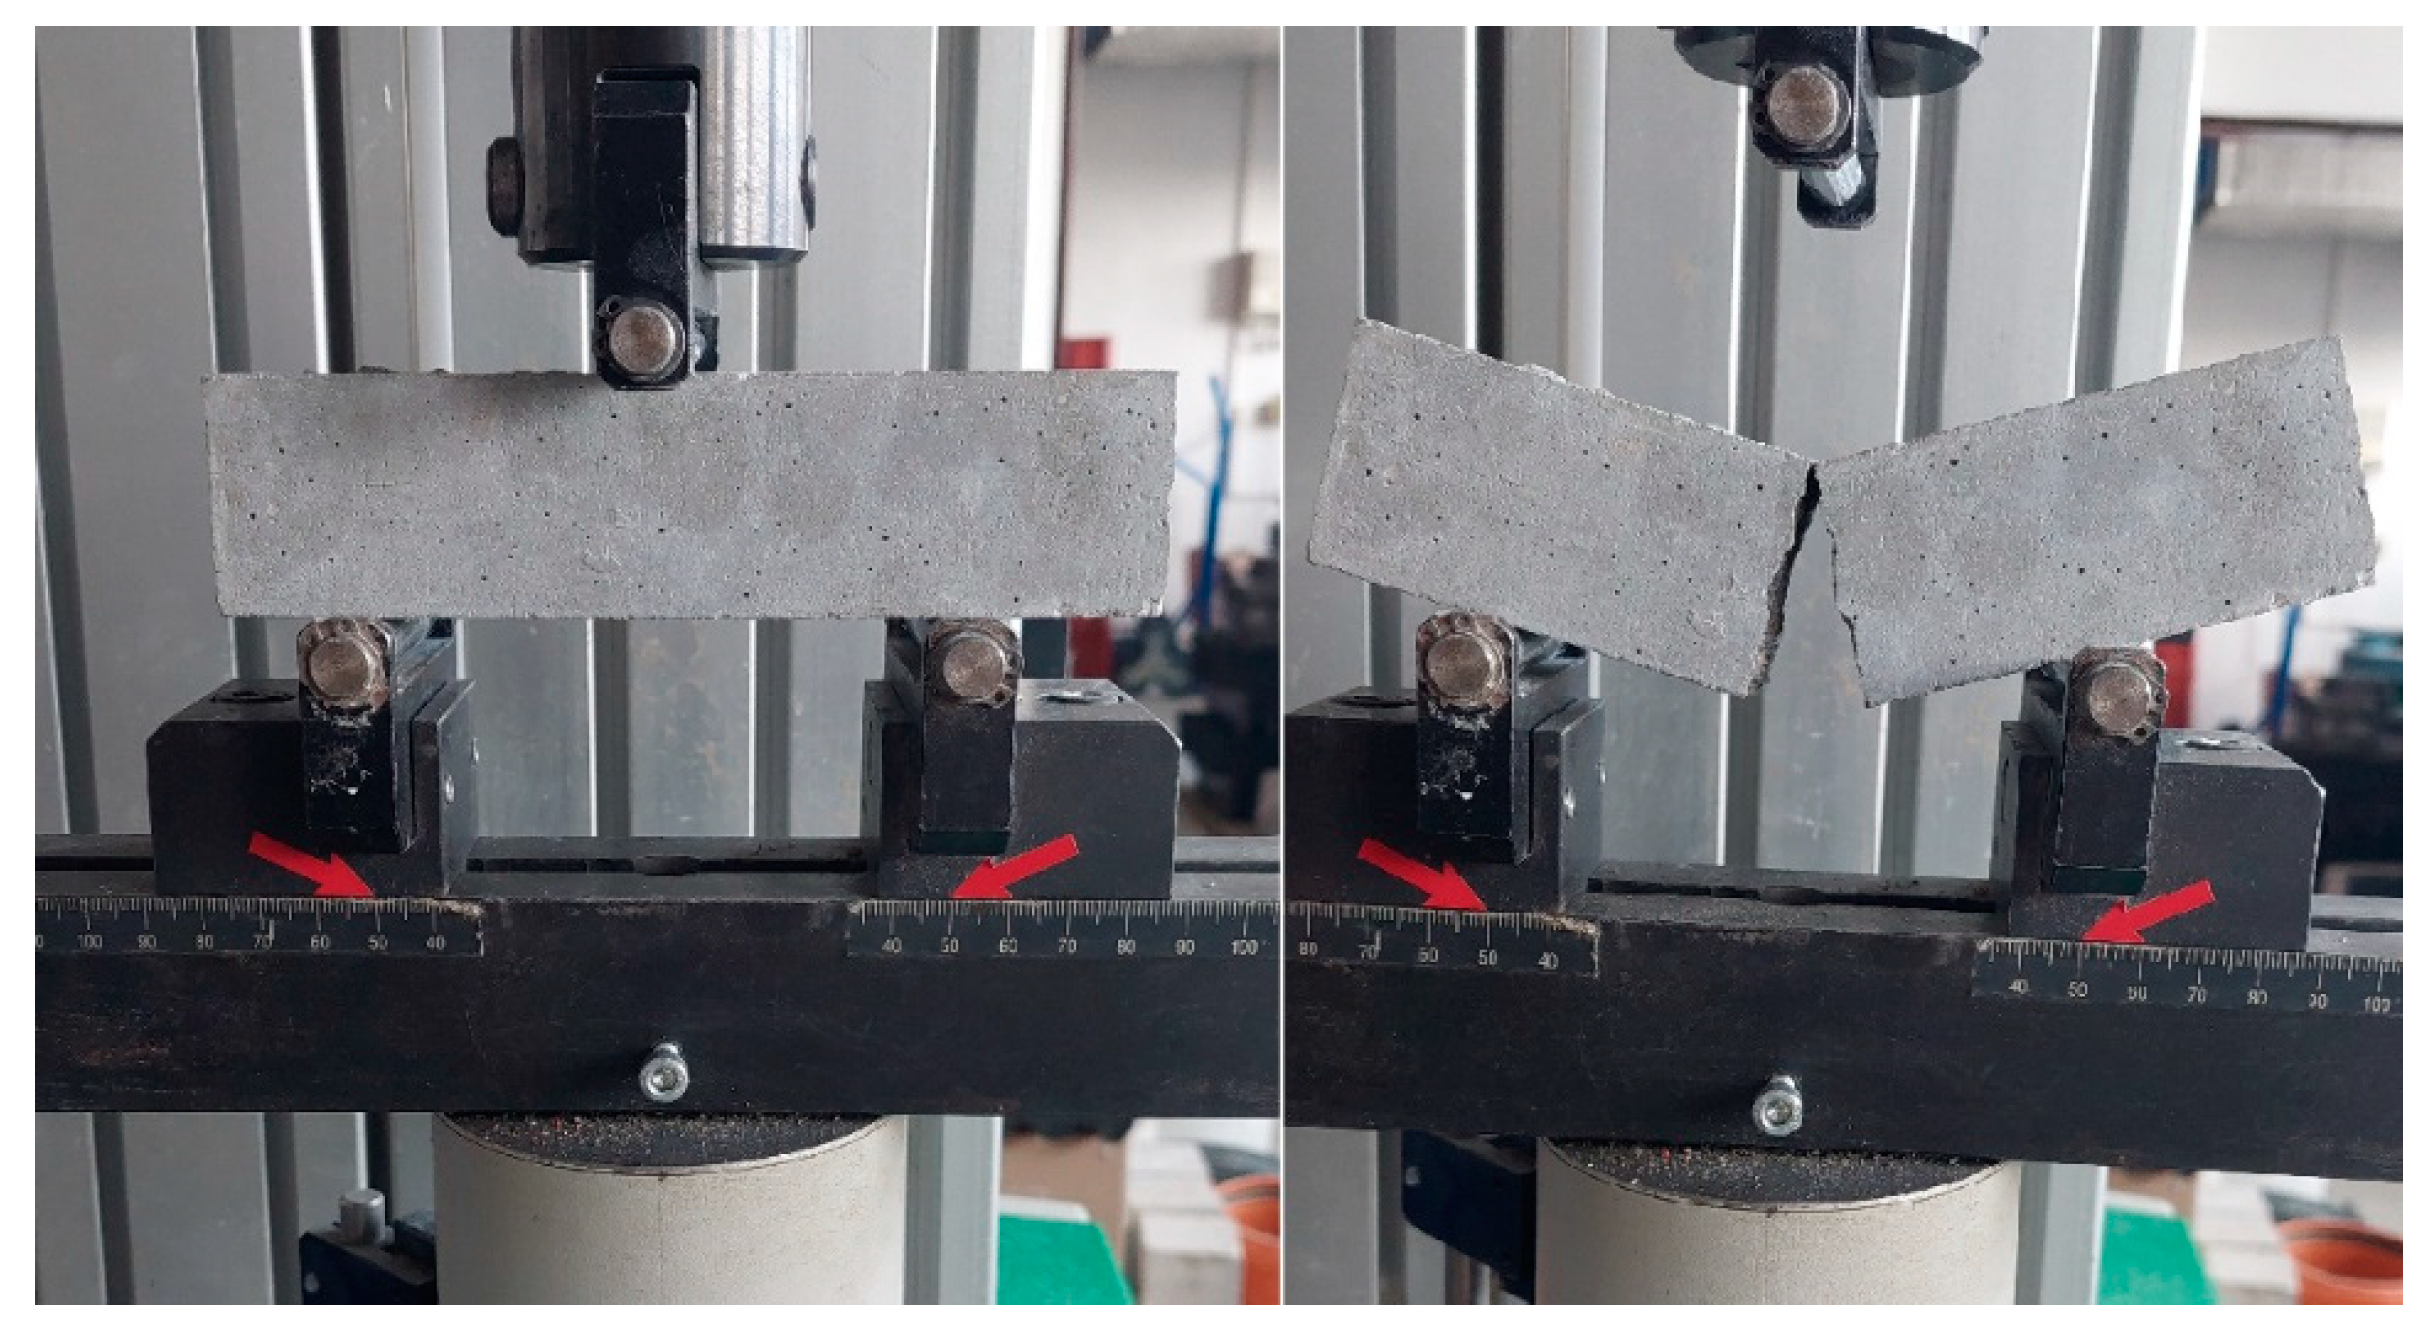
Buildings 15 01029 g008
Figure 9. Sample before (left) and after (right) flexural strength test.
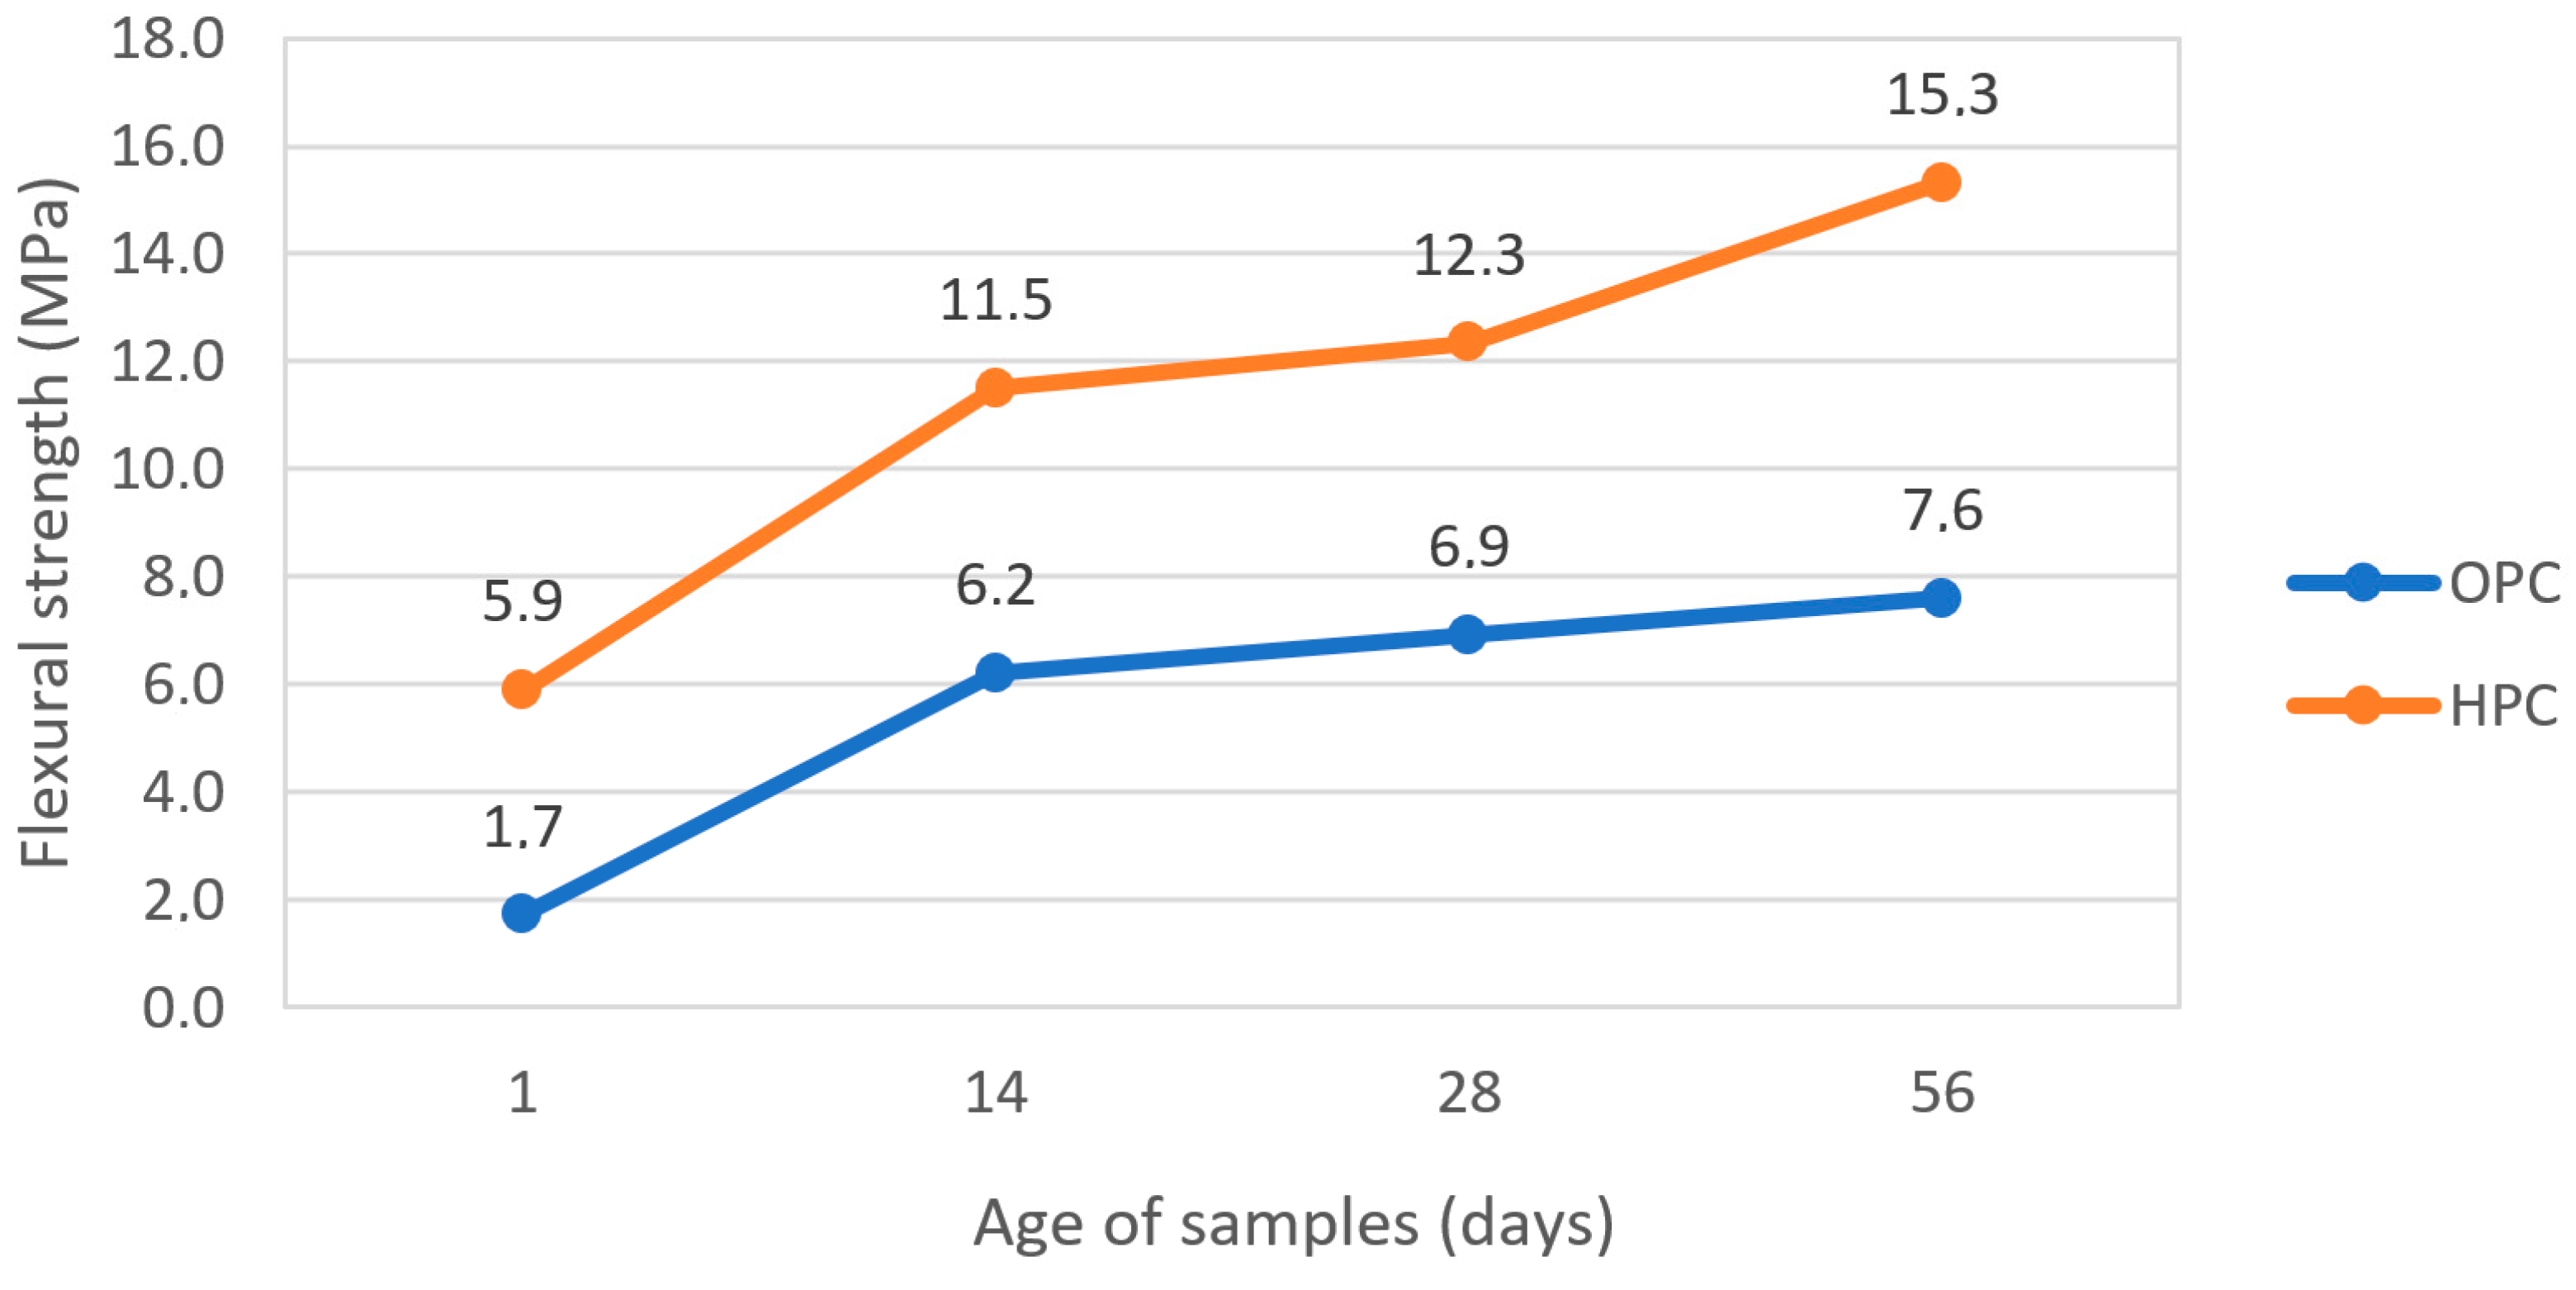
Buildings 15 01029 g009
Figure 10. Development of flexural strength for beams.
Buildings 15 01029 g010
Figure 11. Effect of pre-drying samples on flexural strength.
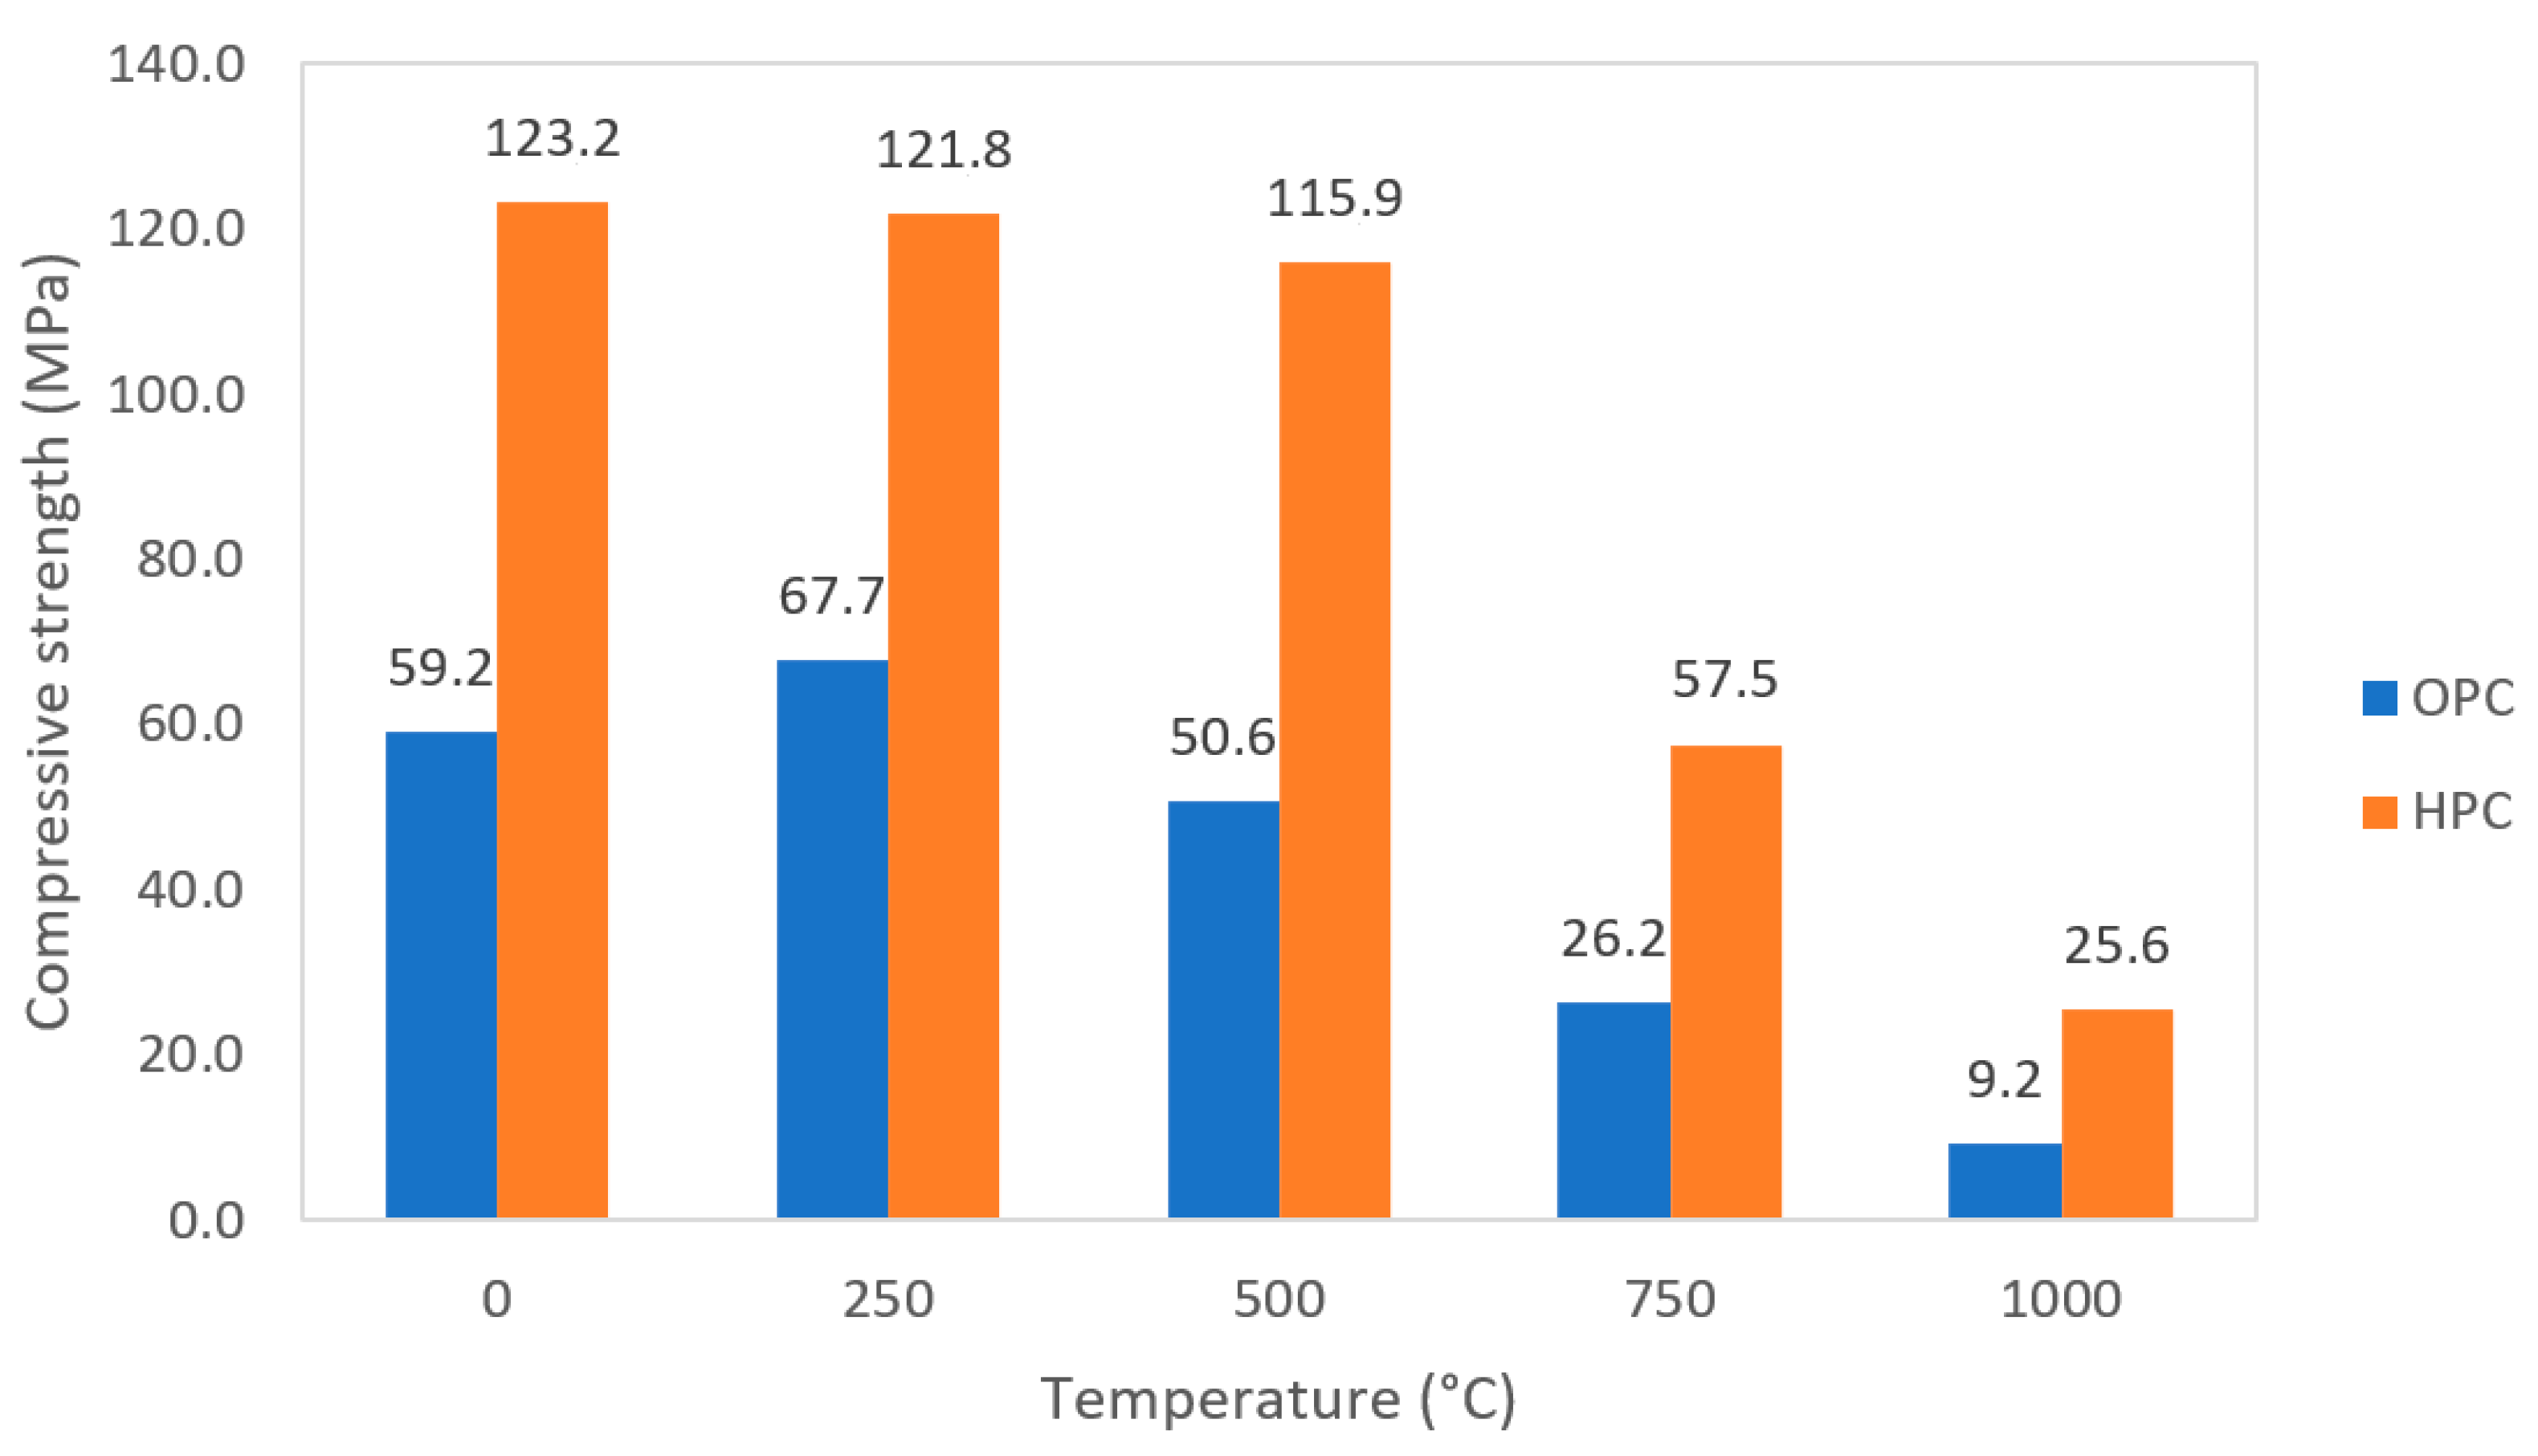
Buildings 15 01029 g011
Figure 12. Change in compressive strength due to temperature.
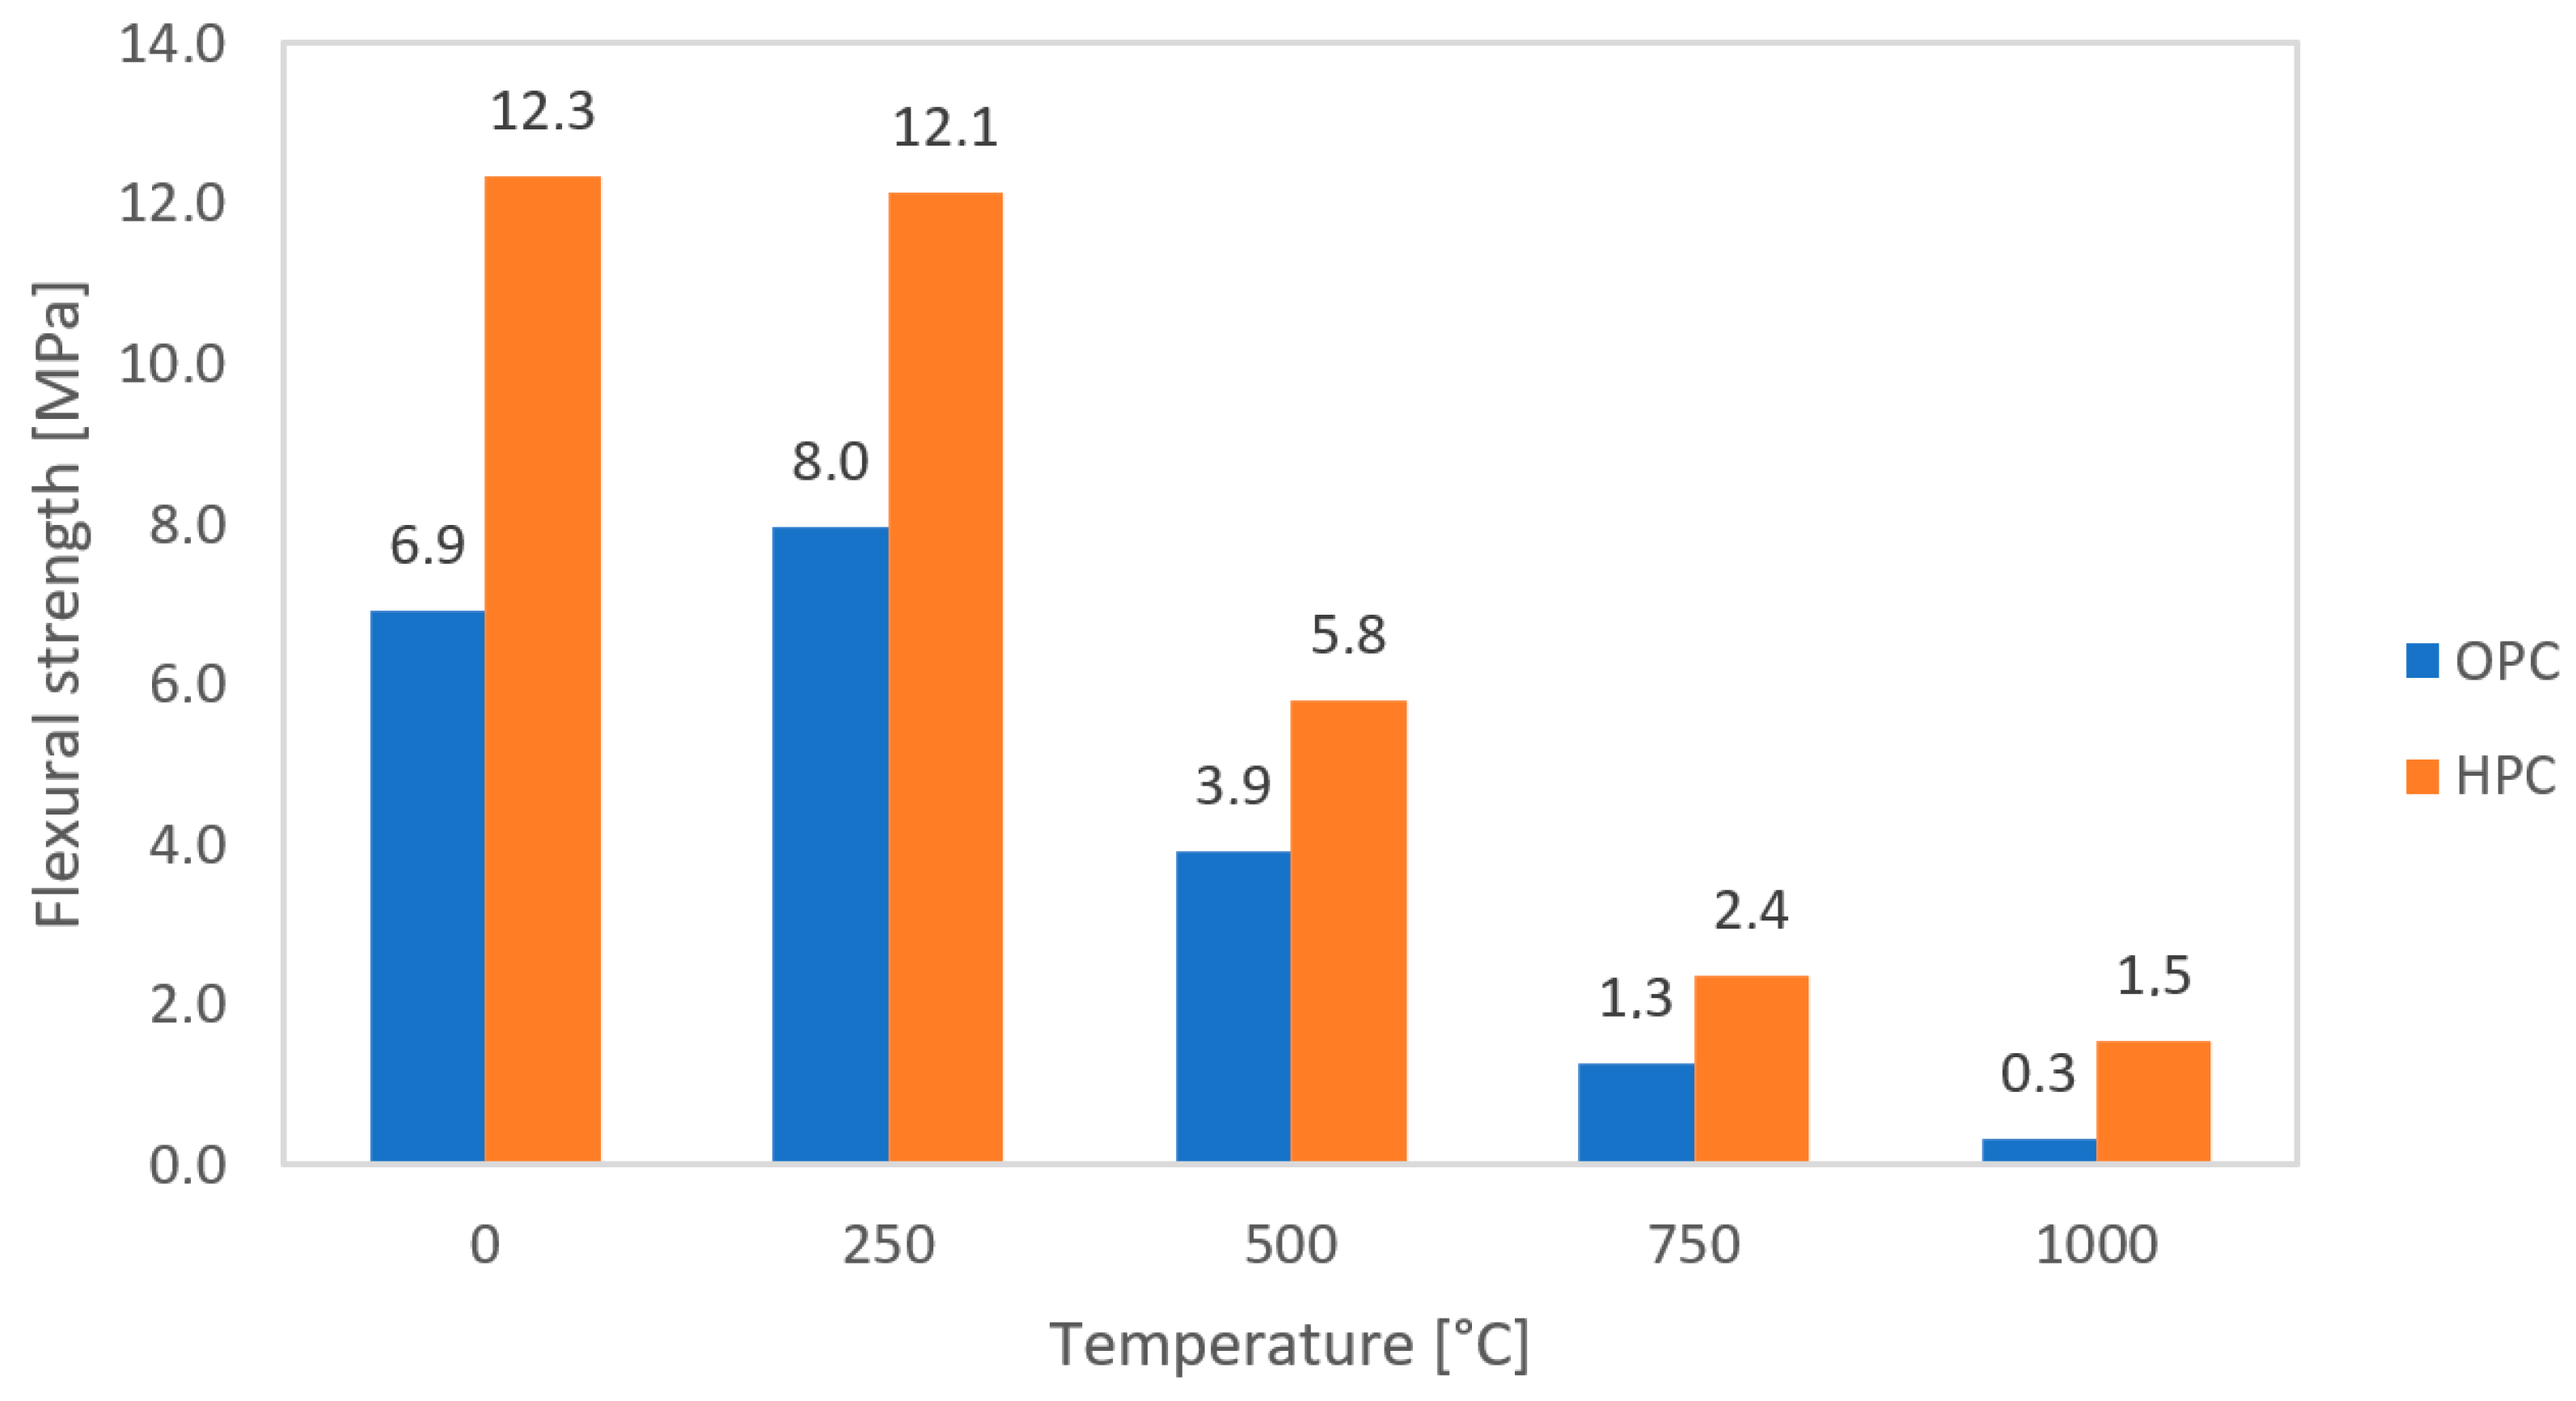
Buildings 15 01029 g012
Figure 13. Change in flexural strength due to temperature.
Buildings 15 01029 g013
Figure 14. Effect of temperature on weight changes.
Buildings 15 01029 g014
Figure 15. OPC samples (left) and HPC samples (right) before thermal stress.
Buildings 15 01029 g015
Figure 16. OPC samples (left) and HPC samples (right) dried in an oven at 105 °C.
Buildings 15 01029 g016
Figure 17. OPC samples (left) and HPC samples (right) after thermal stress at 250 °C.
Buildings 15 01029 g017
Figure 18. OPC samples (left) and HPC samples (right) after thermal stress at 500 °C.
Buildings 15 01029 g018
Figure 19. OPC samples (left) and HPC samples (right) after thermal stress at 750 °C.
Buildings 15 01029 g019
Figure 20. OPC samples (left) and HPC samples (right) after thermal stress at 1000 °C.
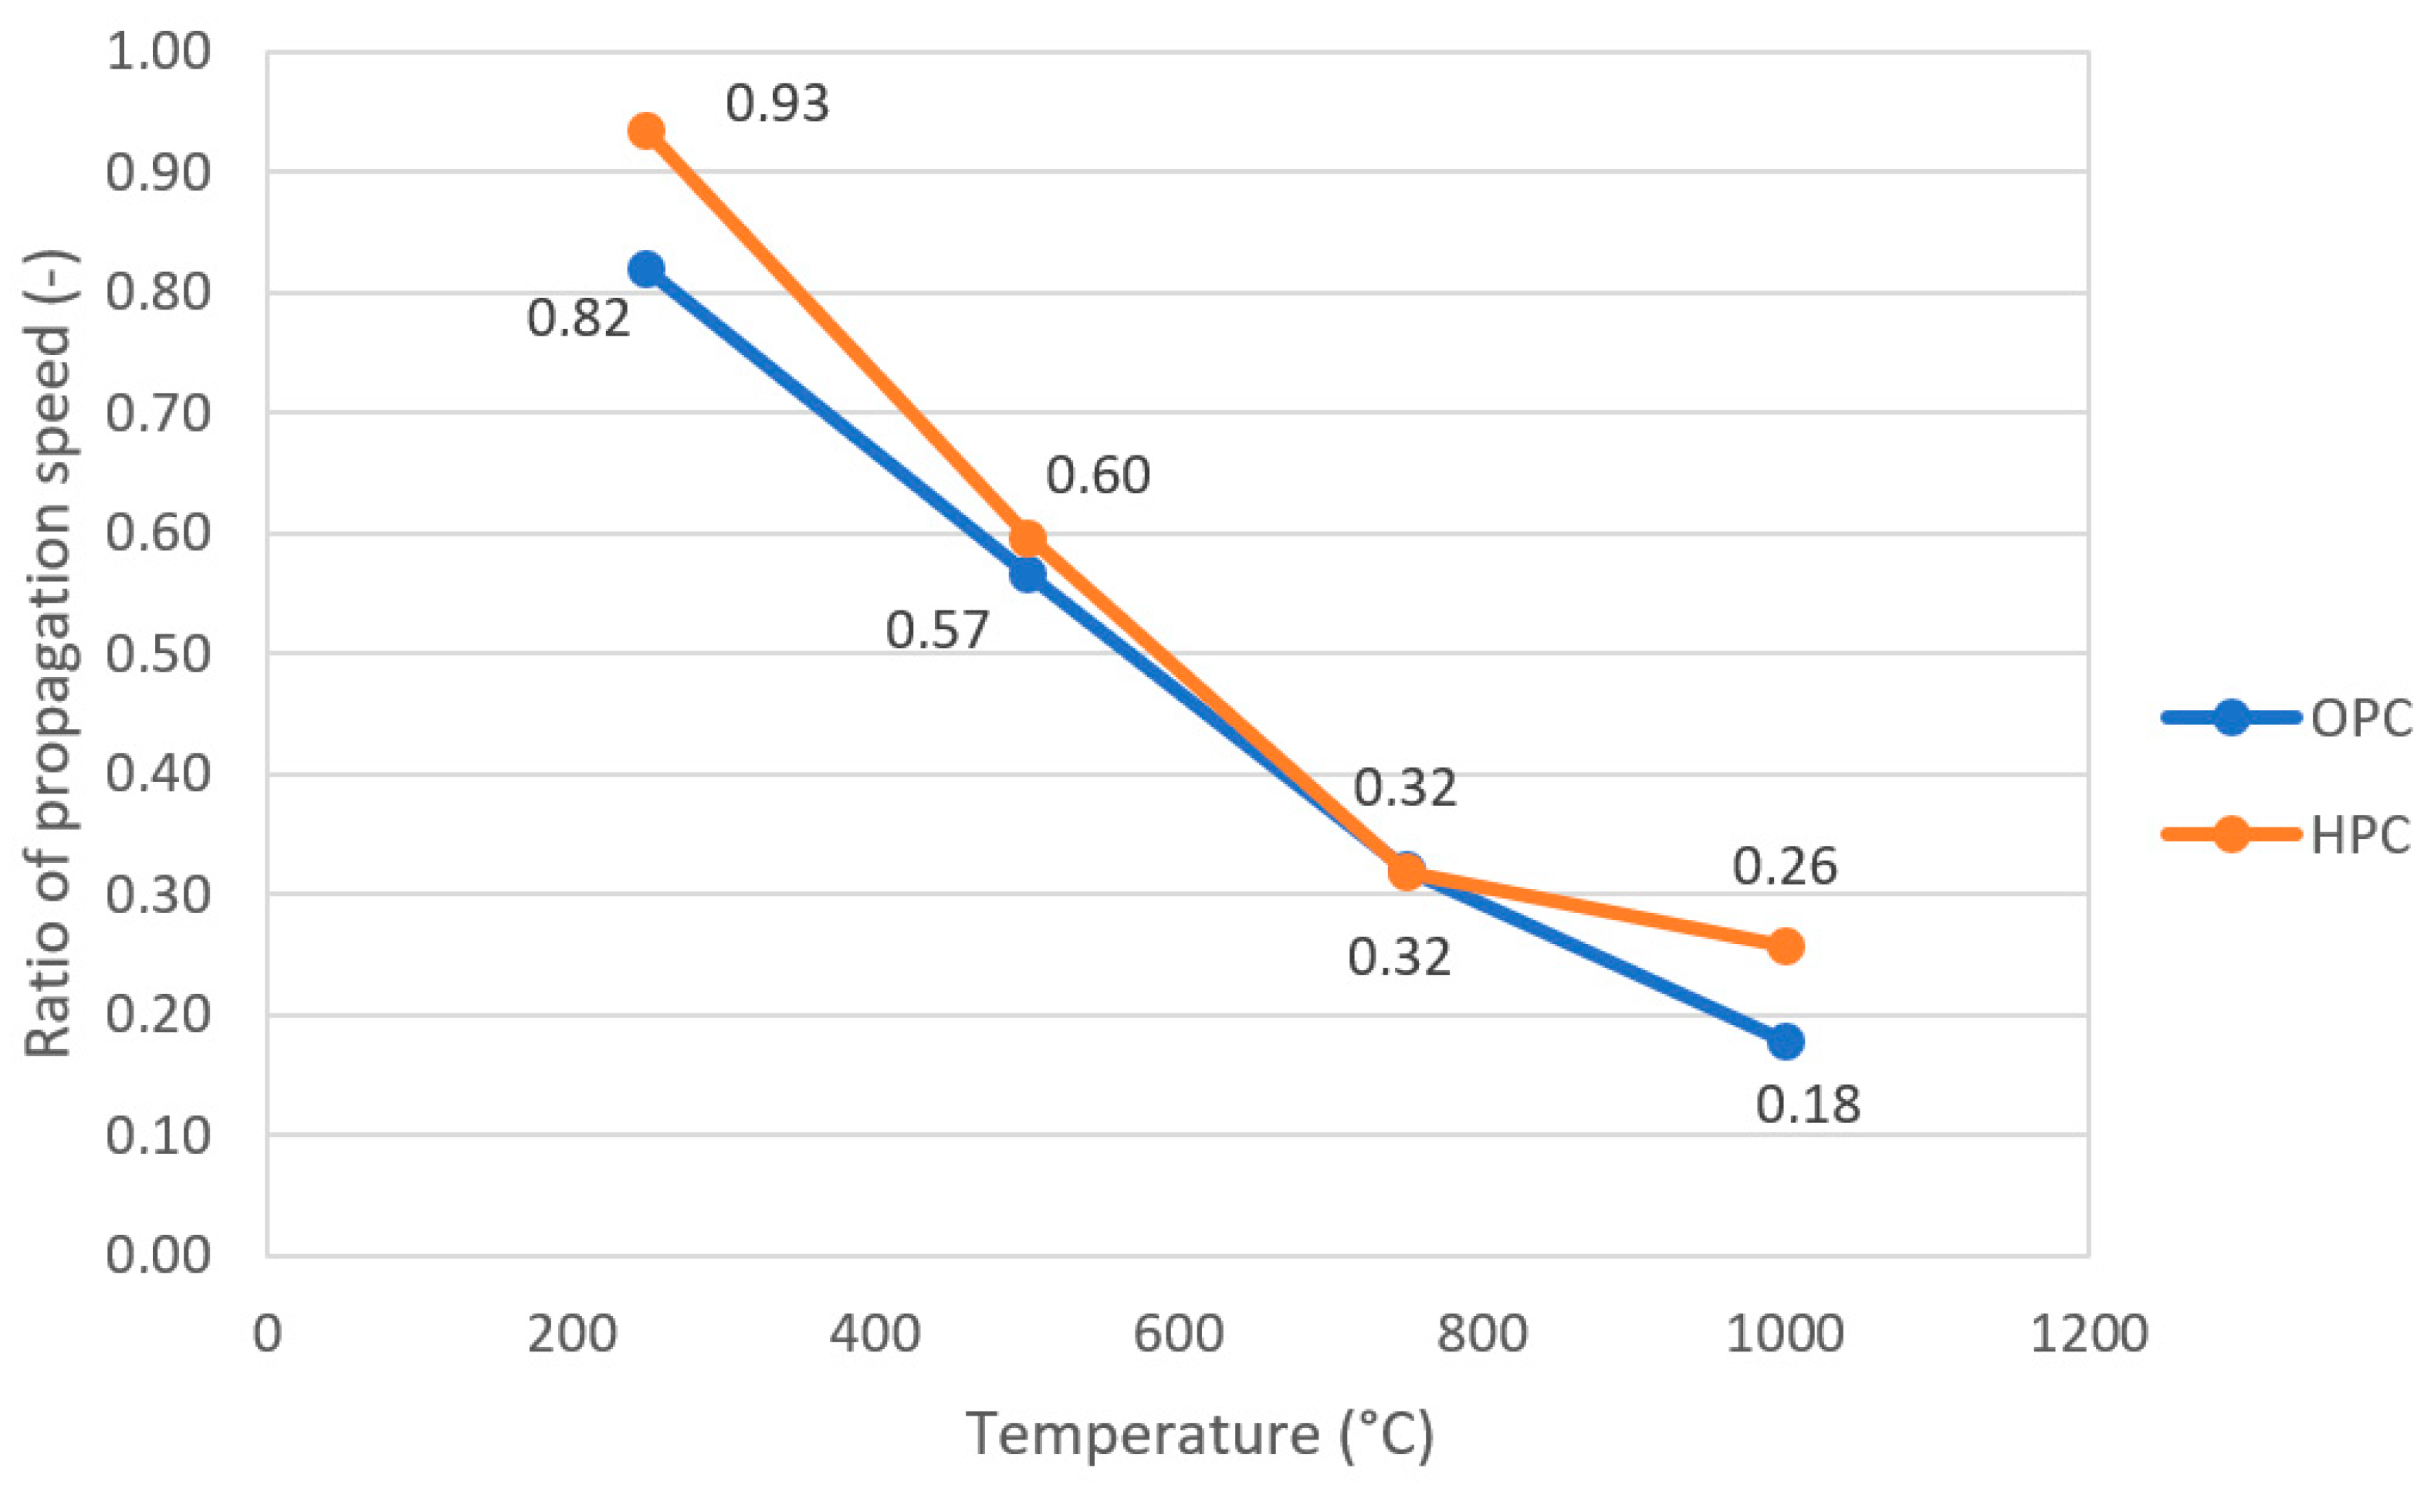
Buildings 15 01029 g020
Figure 21. Ratio of propagation speed of ultrasonic waves.
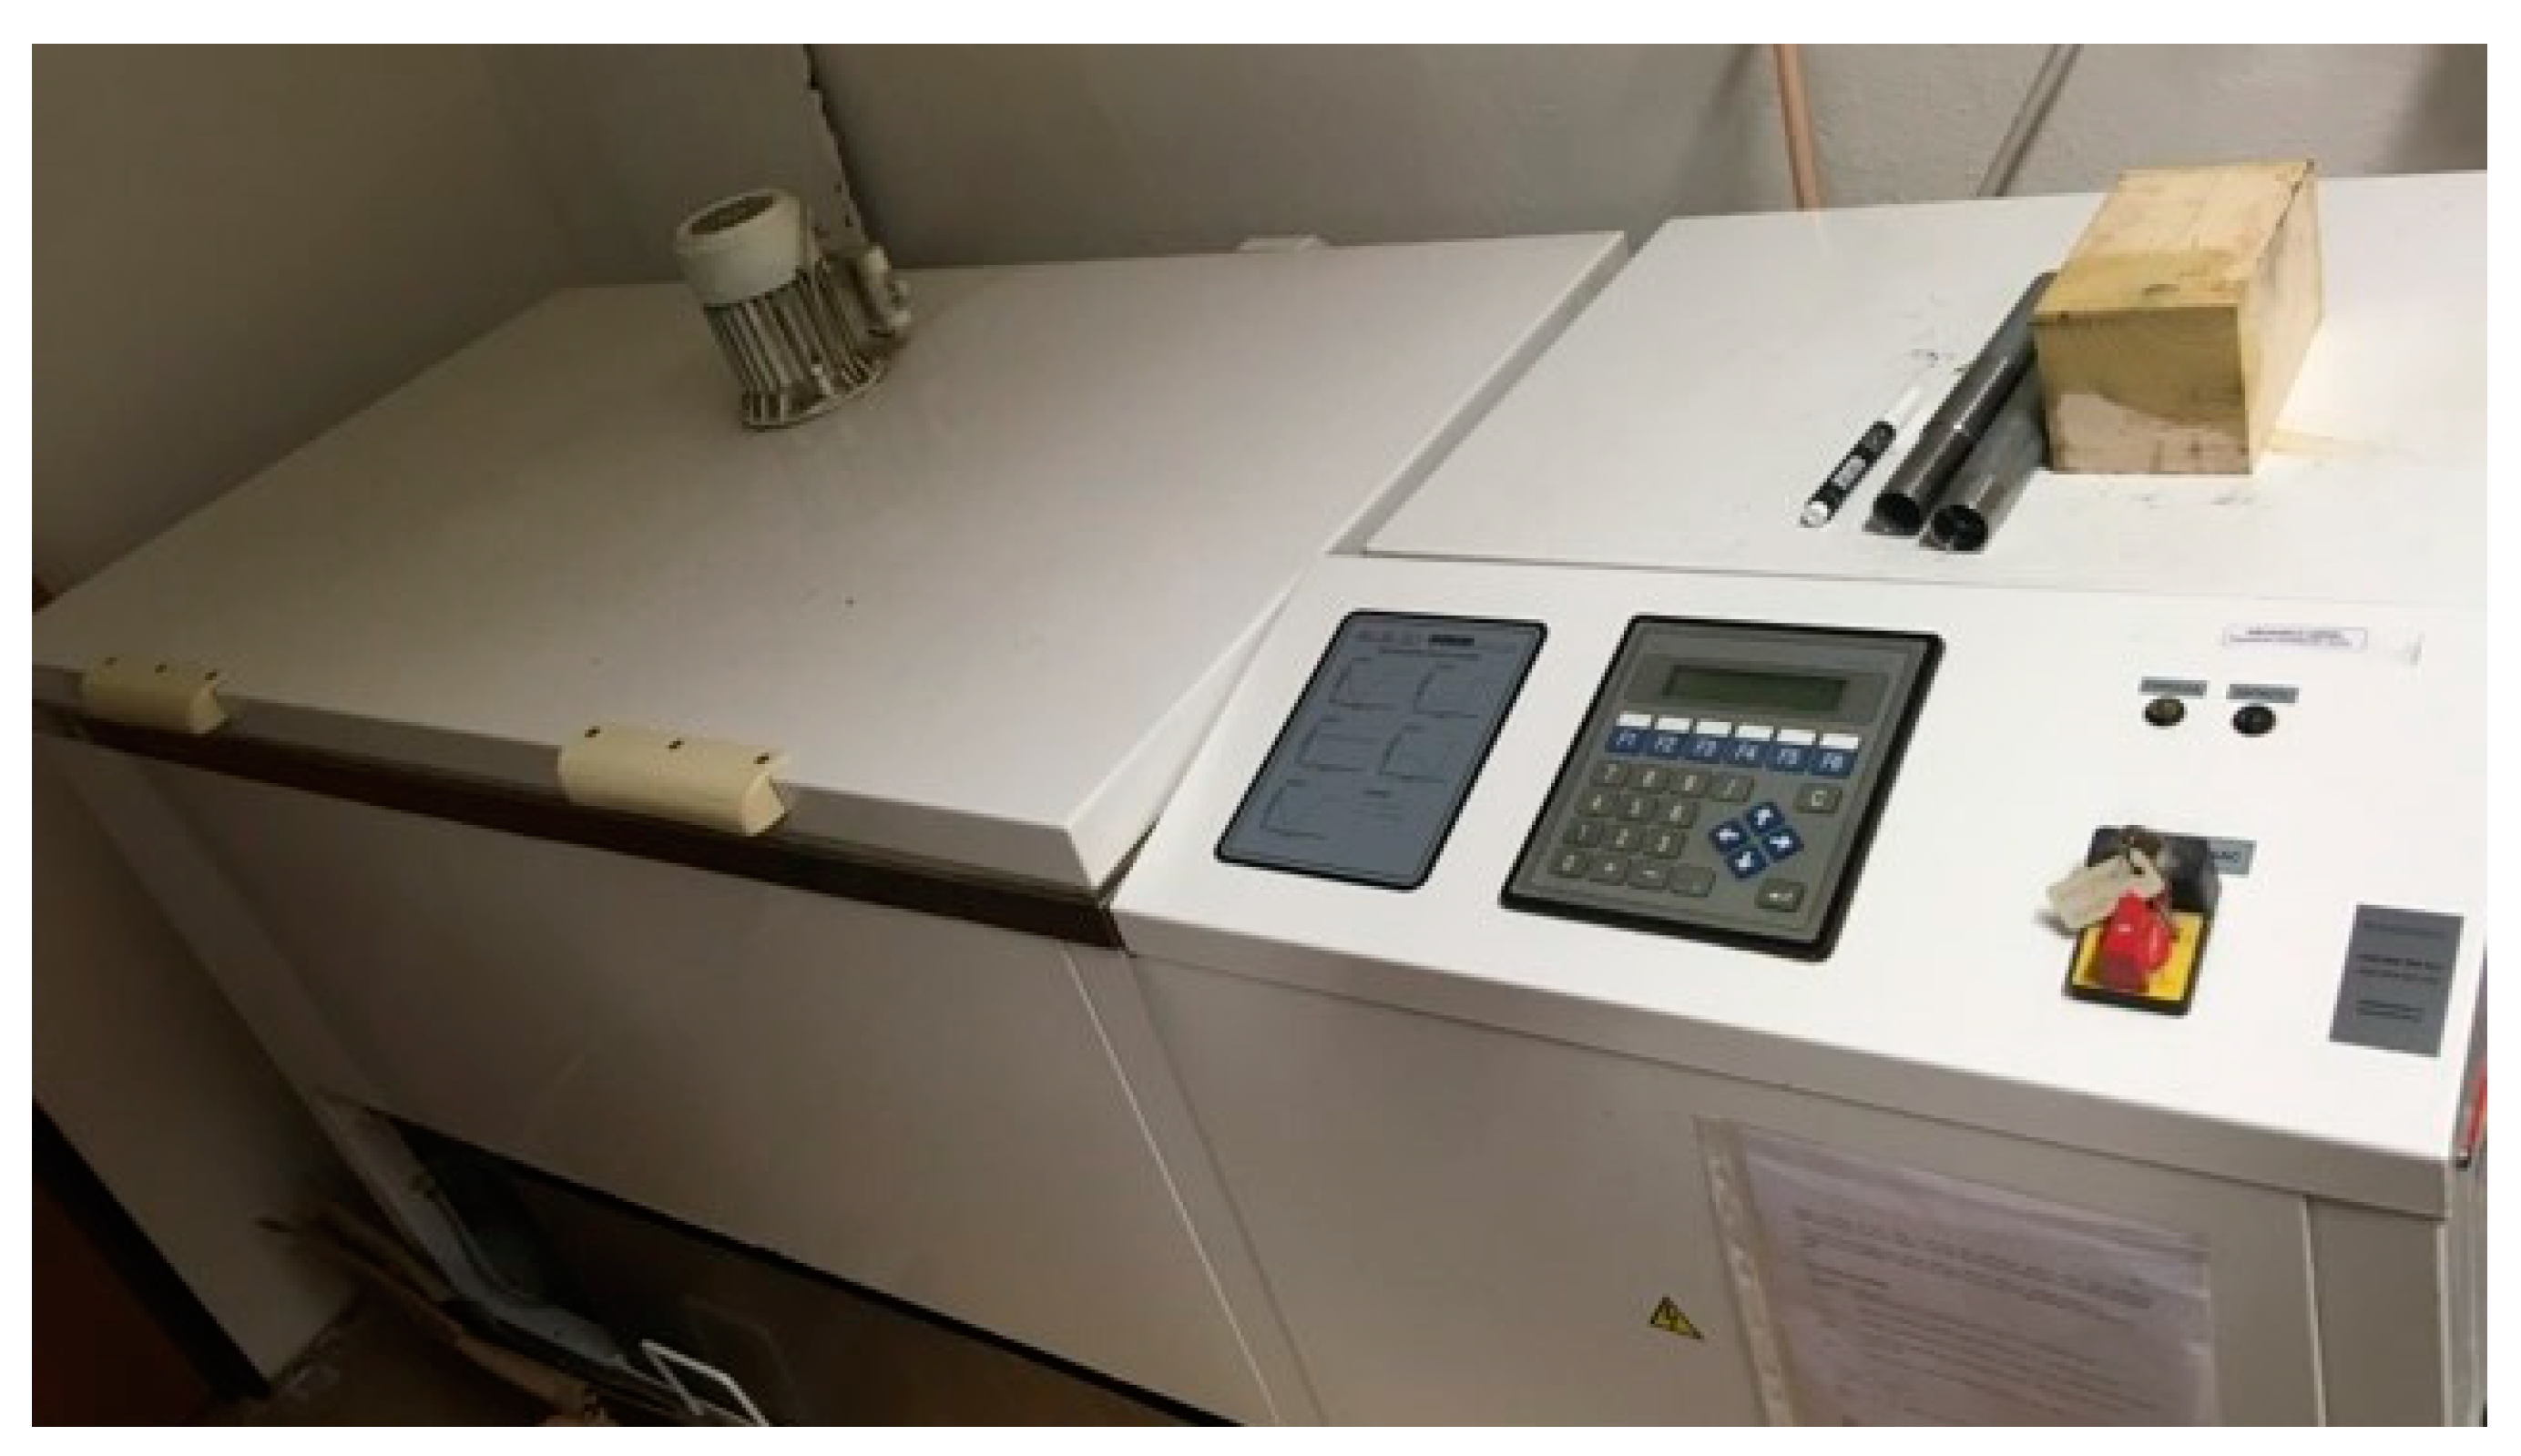
Buildings 15 01029 g021
Figure 22. Determination of the speed of propagation of waves using the ultrasonic pulse method.
Buildings 15 01029 g022
Figure 23. Effect of increased temperature on the dynamic modulus of elasticity for OPC samples.
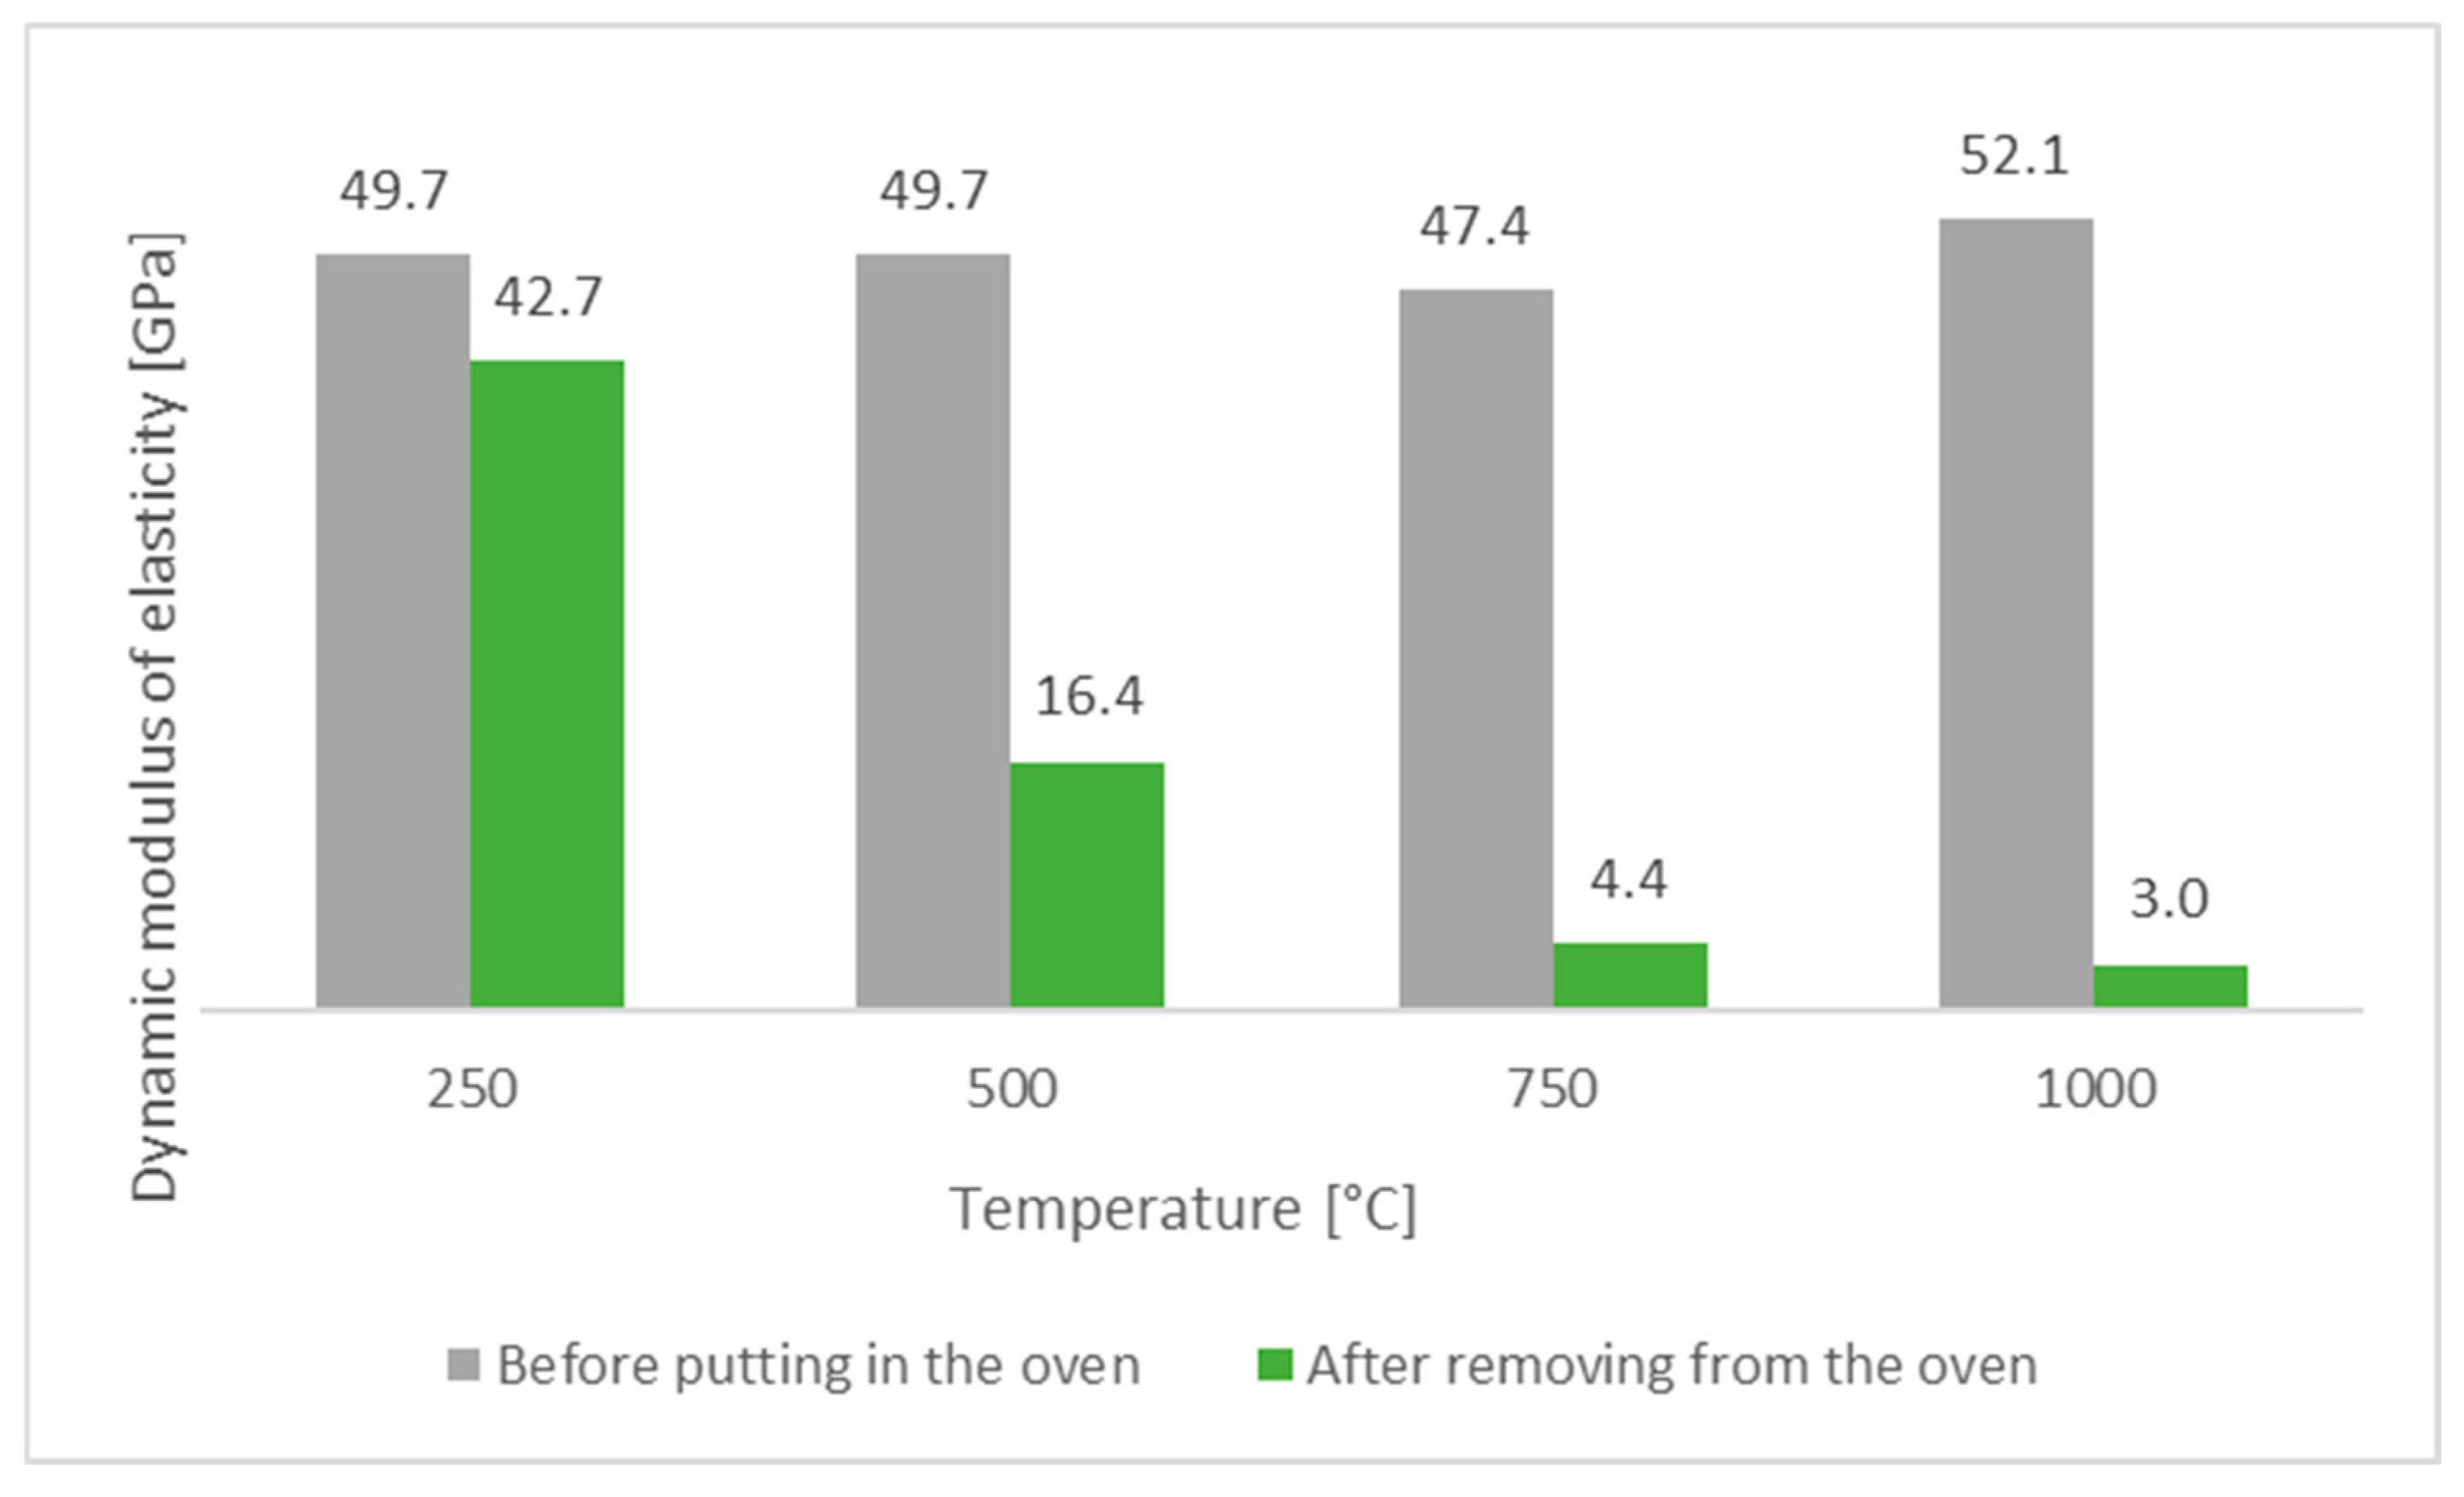
Buildings 15 01029 g023
Figure 24. Effect of increased temperature on the dynamic modulus of elasticity for HPC samples.
Buildings 15 01029 g024
Figure 25. Device for frost resistance test.
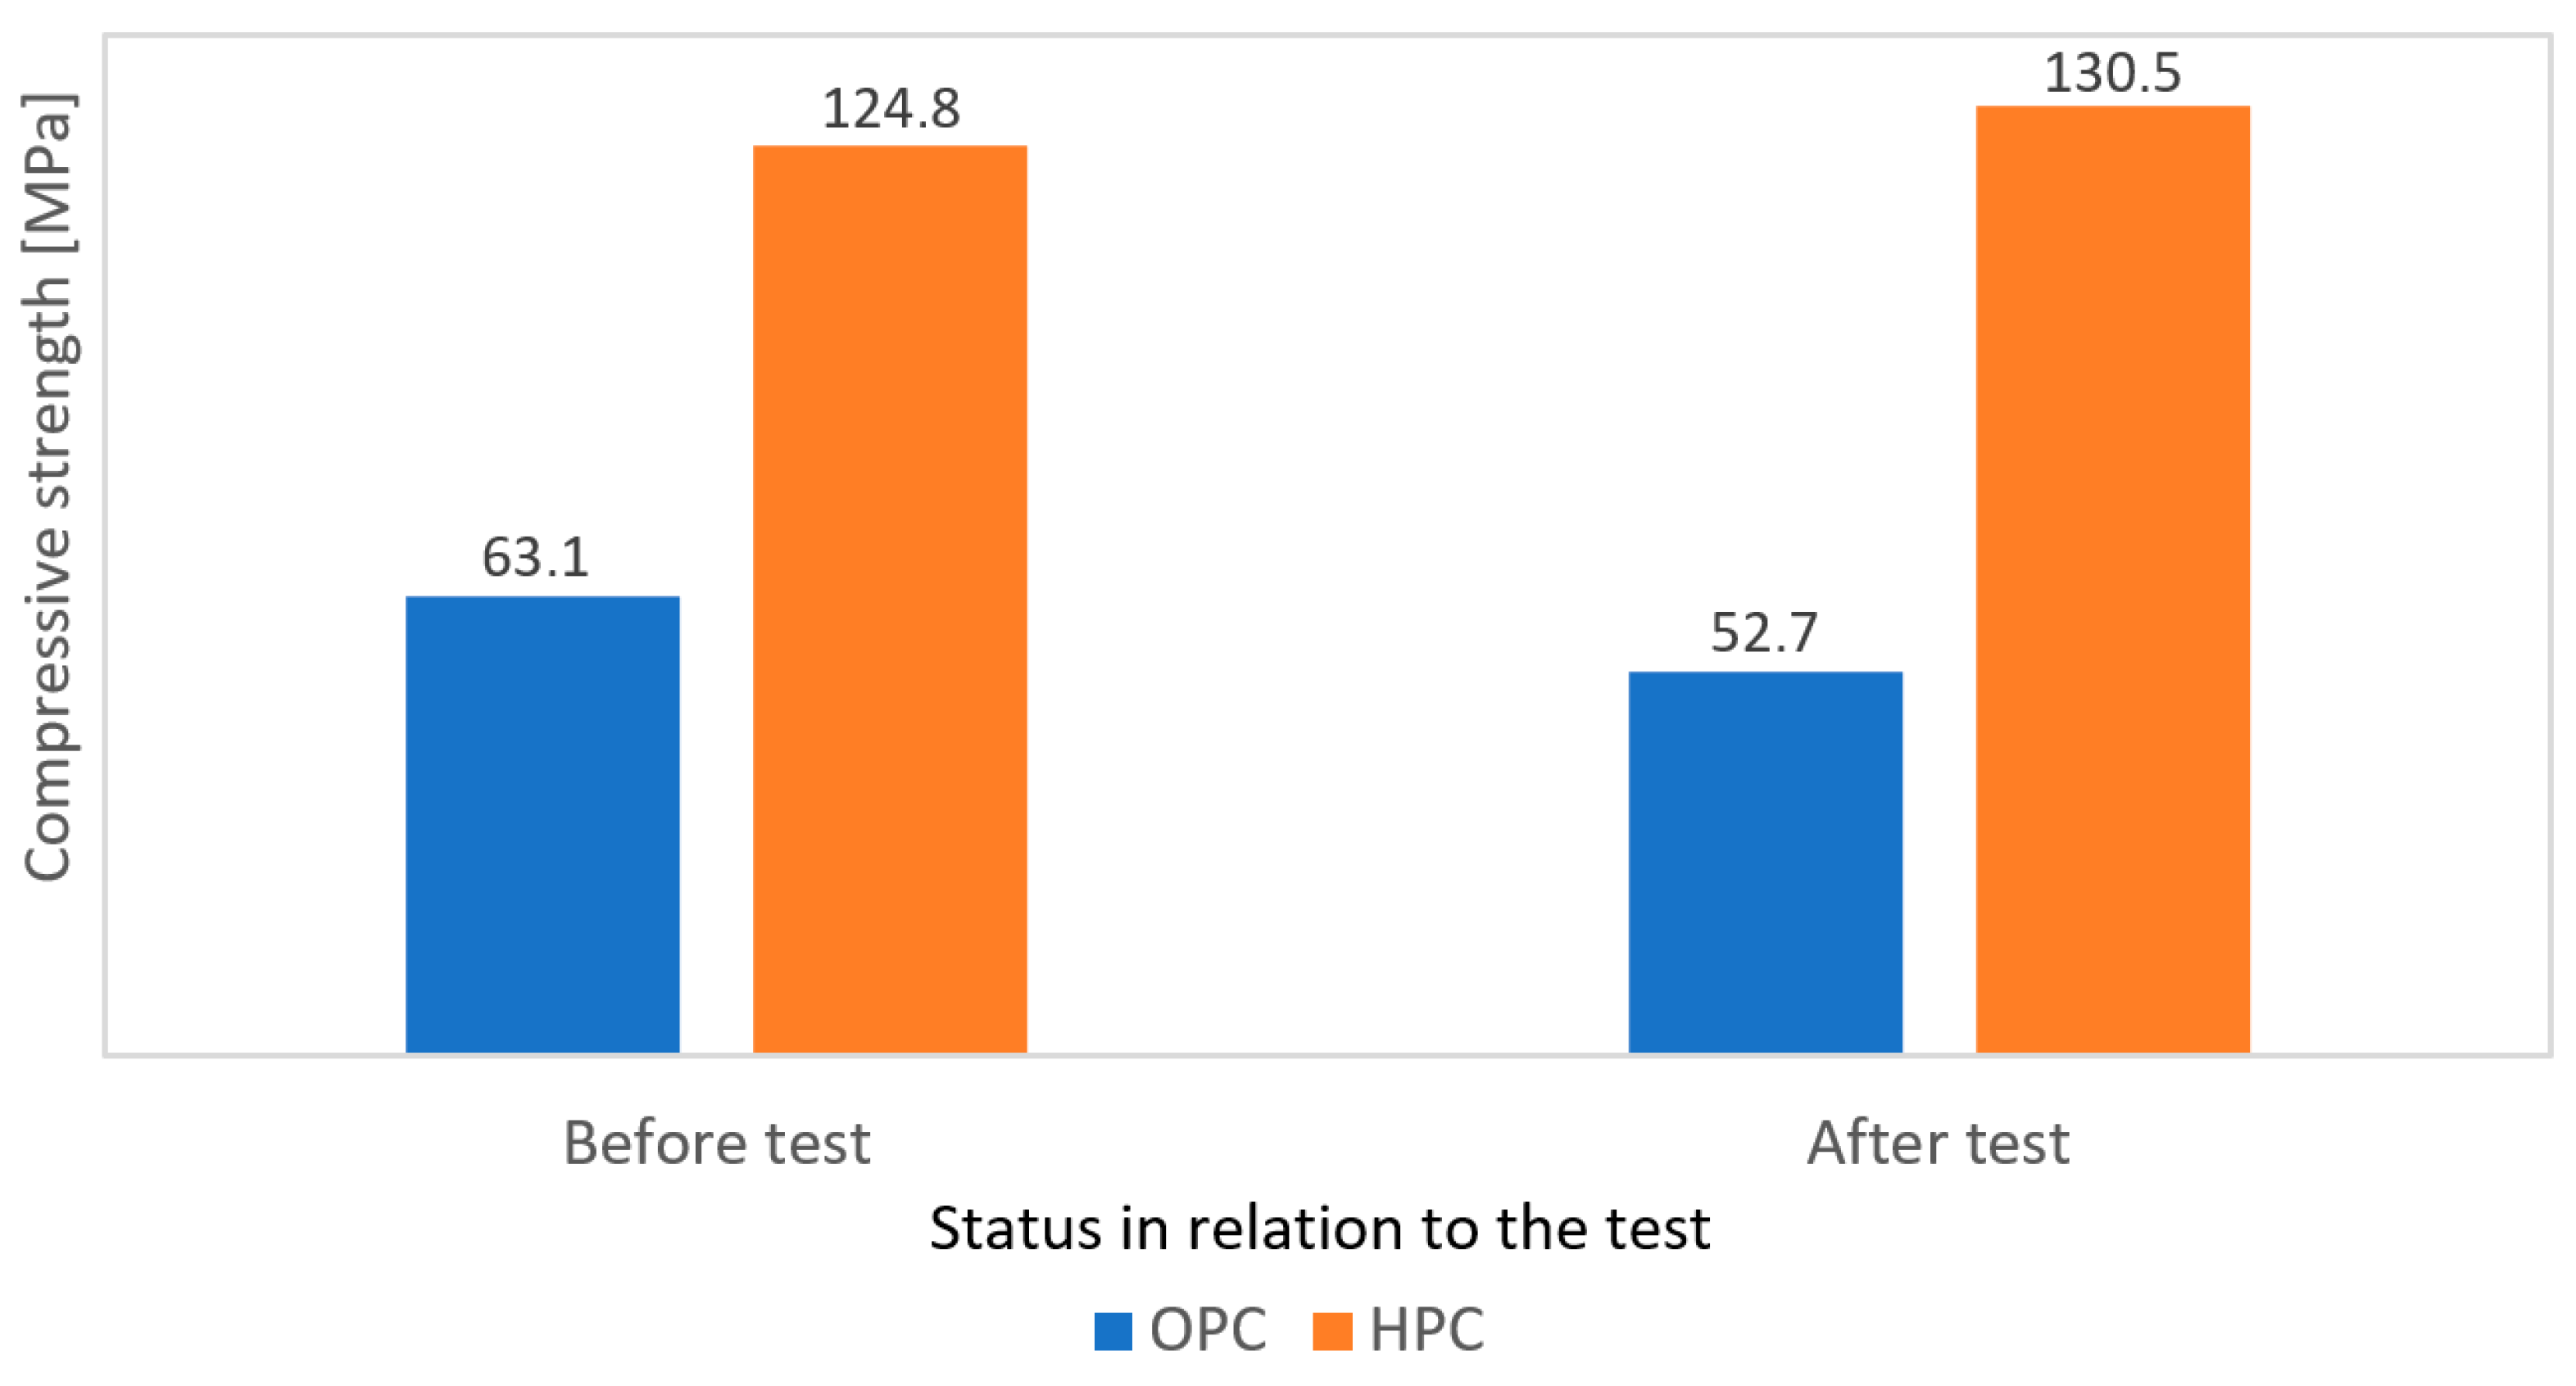
Buildings 15 01029 g025
Figure 26. Compressive strength before and after the frost resistance test.
Buildings 15 01029 g026
Figure 27. Flexural strength after the frost resistance test of concrete.
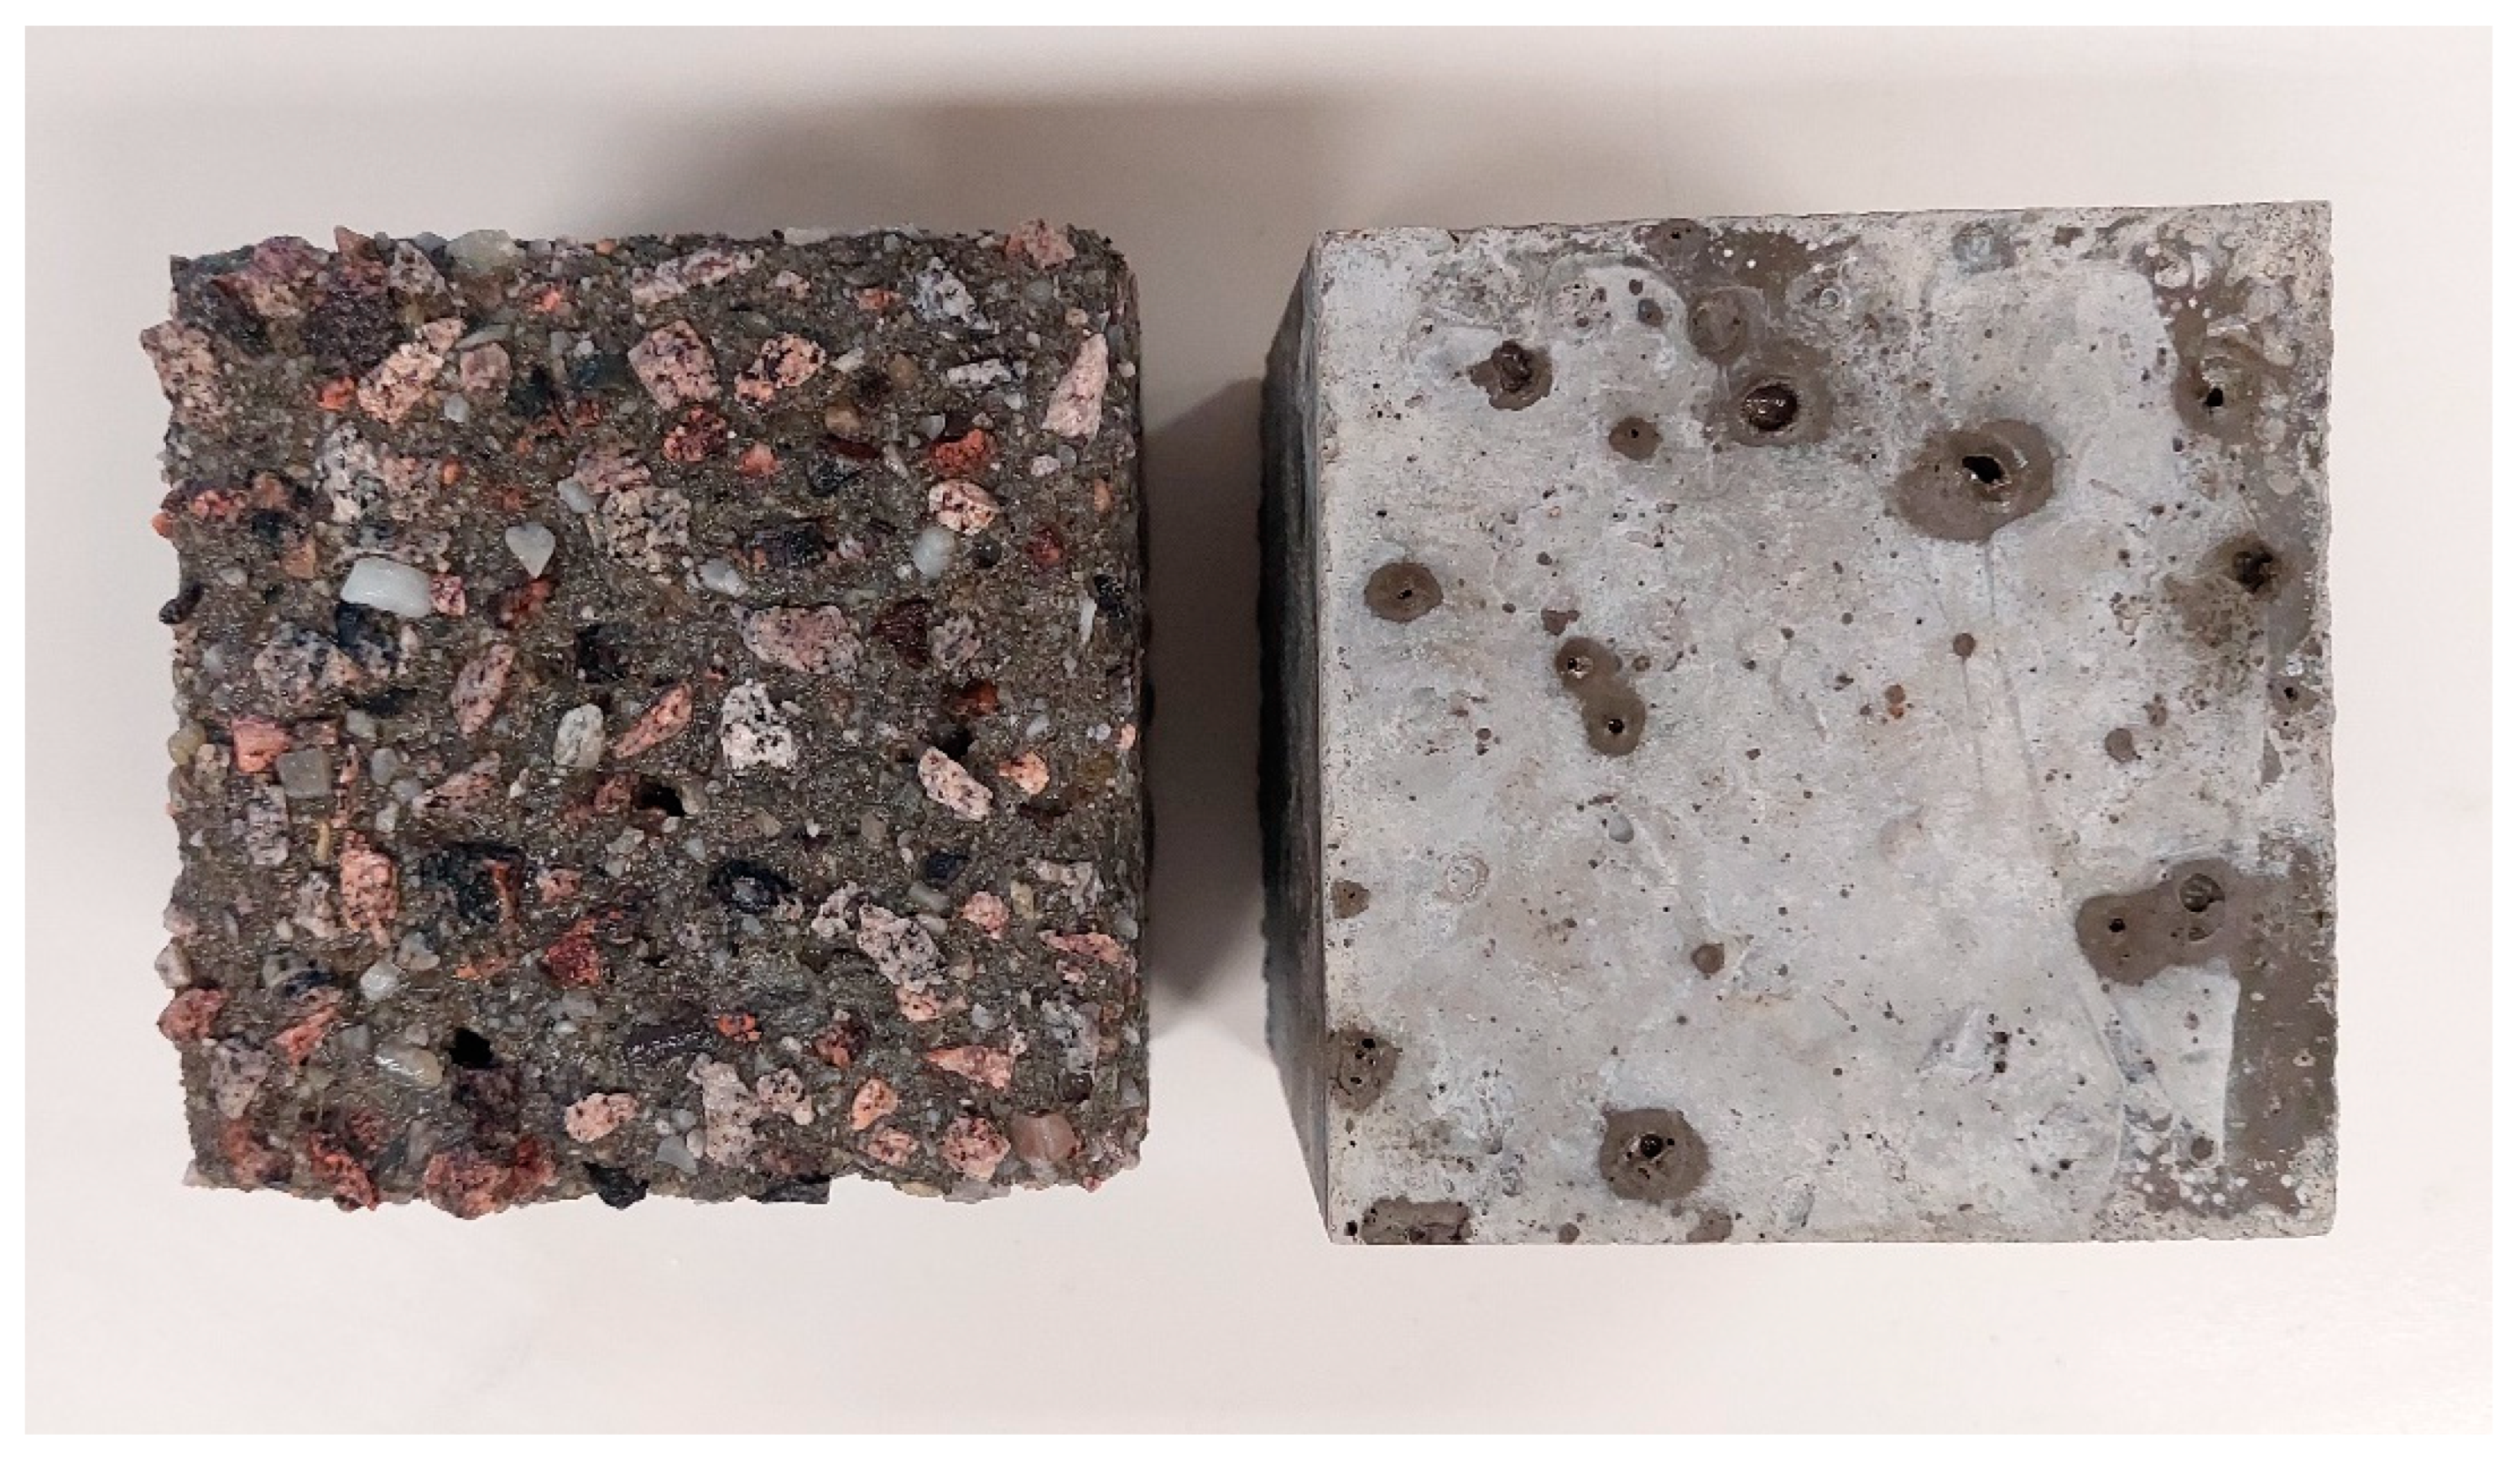
Buildings 15 01029 g027
Figure 28. Samples of OPC and HPC after 200 cycles of test of resistance to water and chemical de-icing substances.
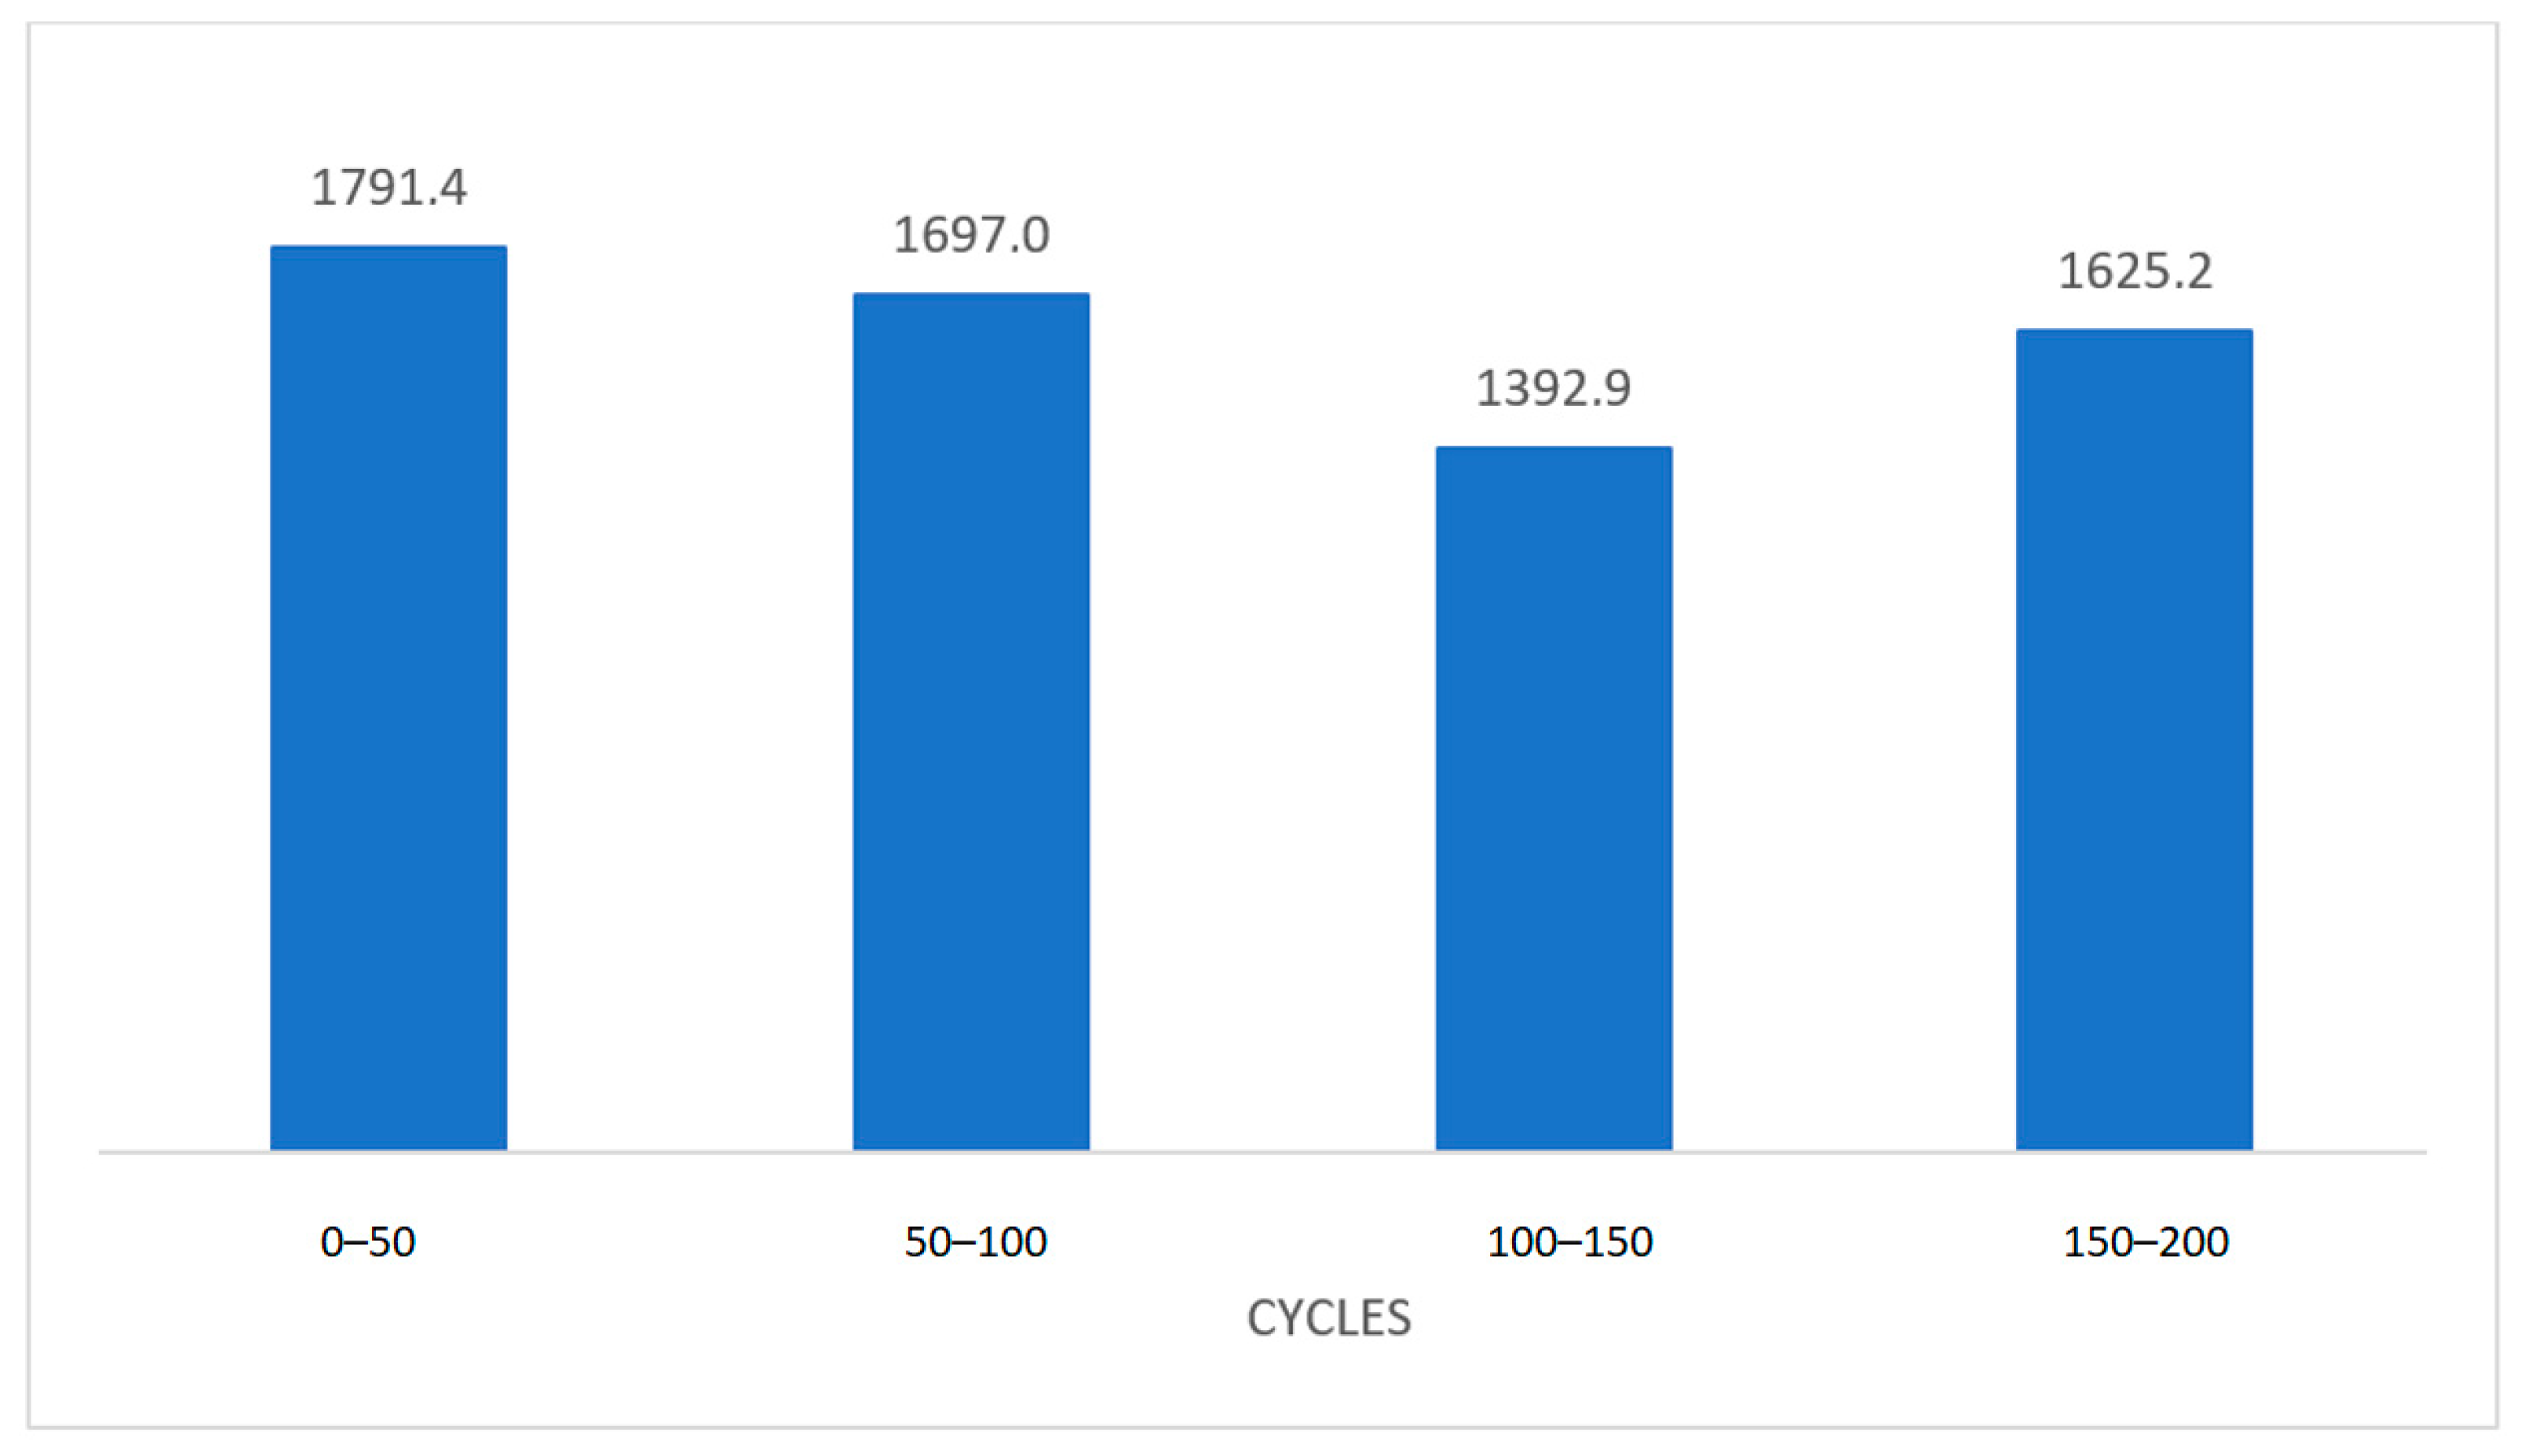
Buildings 15 01029 g028
Figure 29. Average waste in (g/m2) after every 50 cycles for OPC samples.
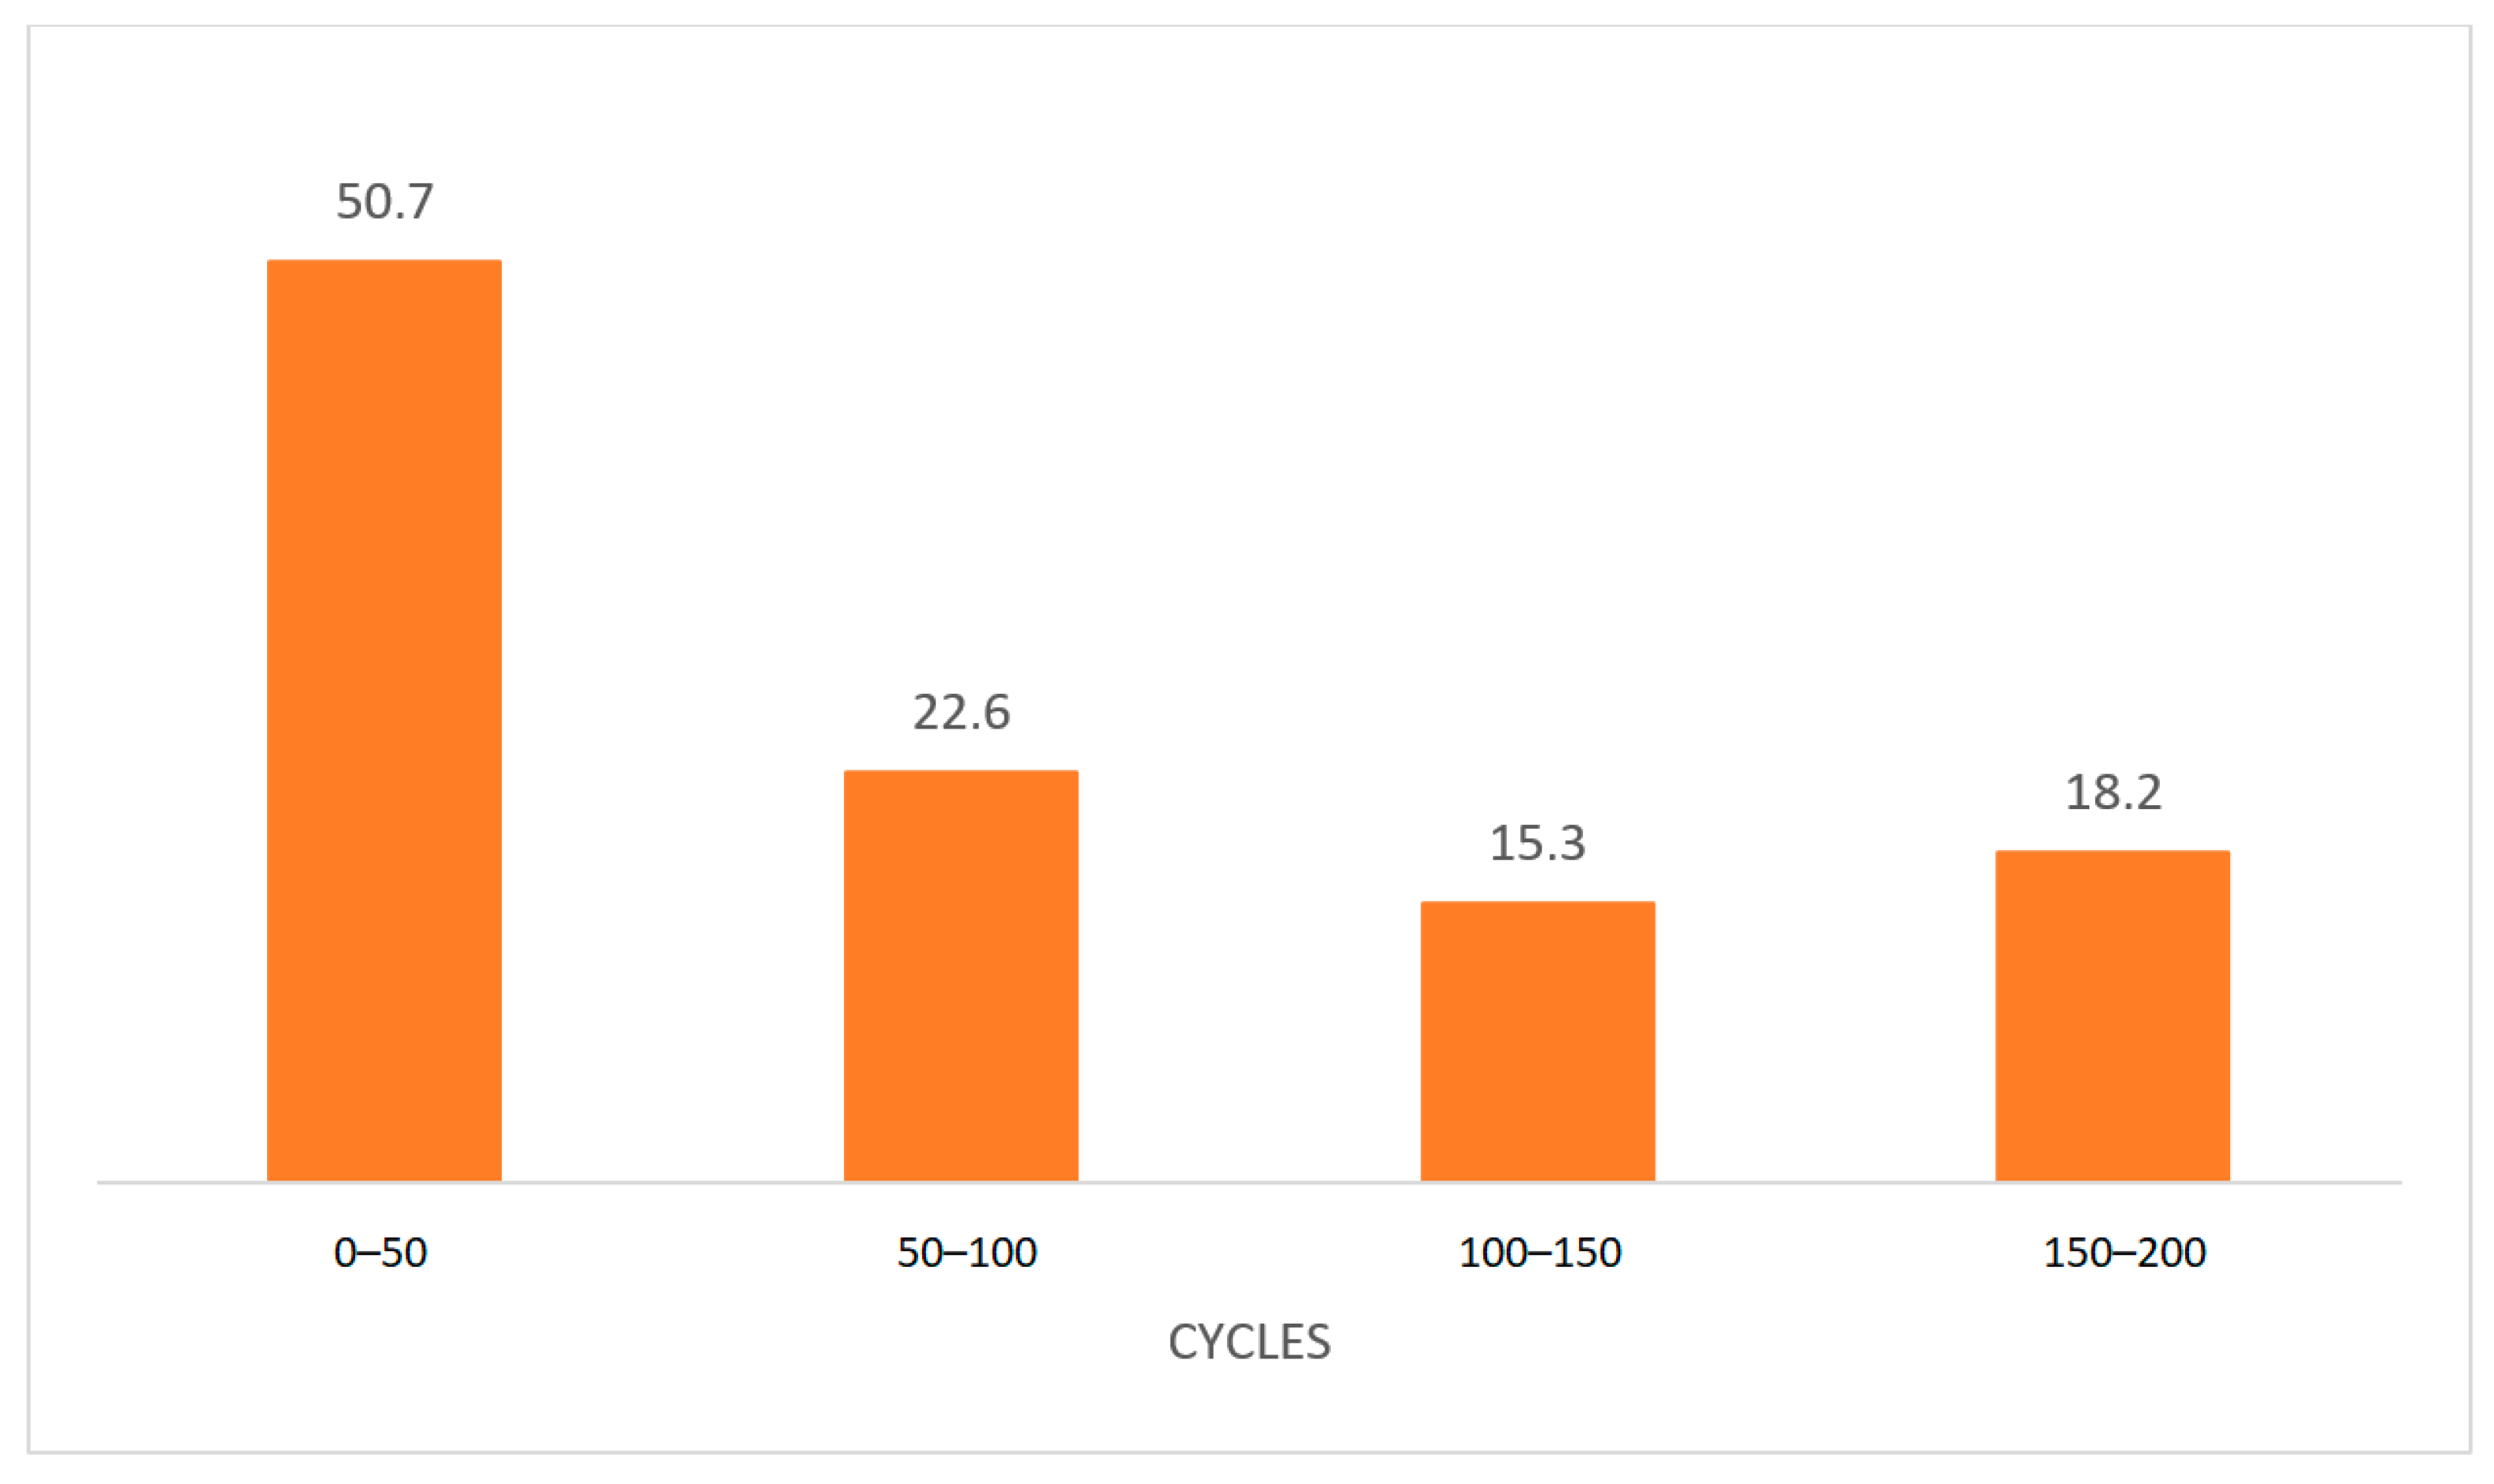
Buildings 15 01029 g029
Figure 30. Average waste in (g/m2) after every 50 cycles for HPC samples.
Buildings 15 01029 g030
Table 1. Designed mixture of OPC.
OPCQuantity per 1 m3
Cement CEM I 42.5 R450 kg
0/4 aggregate1230 kg
4/8 aggregate550 kg
Polyether carboxylate plasticizer3 kg
Water200 L
w/c0.44
Table 2. Designed mixture of HPC.
HPCQuantity per 1 m3
Cement CEM I 52.5 R650 kg
Silica fume70 kg
Limestone 880 kg
0/4 aggregate890 kg
4/8 aggregate570 kg
Polyether carboxylate plasticizer20 kg
Polycarboxylate and polyphosphonate plasticizer10 kg
Water150 L
w/c0.23
Table 3. Determination of the bulk density for HPC.
SamplesBulk Density (kg/m3)Standard Deviation (kg/m3)Coefficient of Variation (%)
Cube 150 mm239420.540.86
Cube 100 mm241450.462.09
Beam 40 × 40 × 160 mm240456.662.36
Table 4. Determination of the bulk density for OPC.
SamplesBulk Density (kg/m3)Standard Deviation (kg/m3)Coefficient of Variation (%)
Cube 150 mm231979.193.42
Cube 100 mm225212.790.57
Beam 40 × 40 × 160 mm225842.711.89
Table 5. Compressive strength OPC and HPC—standard deviation and coefficient of variation for cubes of 150 × 150 × 150 mm.
Cube 150 × 150 × 150 mmOPCHPC
Average compressive strength (MPa)47.594.4
Standard deviation (MPa)4.516.1
Coefficient of variation (%)9.417.1
Table 6. Compressive strength OPC and HPC—standard deviation and coefficient of variation for cubes of 100 × 100 × 100 mm.
Cube 100 × 100 × 100 mmOPCHPC
Average compressive strength (MPa)55.6126.4
Standard deviation (MPa)4.610.1
Coefficient of variation (%)8.38.0
Table 7. Compressive strength OPC and HPC—standard deviation and coefficient of variation for half-beams of 40 × 40 × 160 mm.
SamplesOPCHPC
Age of samples (days)11428561142856
Average compressive strength (MPa)9.851.359.263.146.5114.8123.2124.8
Standard deviation (MPa)0.52.67.86.05.76.36.79.7
Coefficient of variation (%)5.25.113.29.612.25.55.47.8
Table 8. Flexural strength OPC and HPC—Average, standard deviation and coefficient of variation for beams of 40 × 40 × 160 mm.
SamplesOPCHPC
Age of samples (days)11428561142856
Average flexural strength (MPa)1.76.26.97.65.911.512.315.3
Standard deviation (MPa)0.10.40.70.40.94.01.10.5
Coefficient of variation (%)6.15.99.95.815.734.99.23.1
Table 9. Compressive strength OPC and HPC—Average, standard deviation and coefficient of variation after thermal stress for beams of 40 × 40 × 160 mm.
SamplesOPCHPC
Temperature (°C)25050075010002505007501000
Average compressive strength (MPa)67.750.626.29.2121.8115.957.525.6
Standard deviation (MPa)10.85.62.00.610.74.32.31.7
Coefficient of variation (%)15.911.07.86.38.83.74.06.8
Table 10. Average, standard deviation and coefficient of variation for flexural strength (OPC and HPC) after thermal stress for beams of 40 × 40 × 160 mm.
SamplesOPCHPC
Temperature (°C)25050075010002505007501000
Average flexural strength (MPa)8.03.91.30.312.15.82.41.5
Standard deviation (MPa)1.40.60.10.20.90.60.10.1
Coefficient of variation (%)17.116.28.865.47.610.84.28.8
Table 11. Average, standard deviation and coefficient of variation for OPC samples before and after exposure to elevated temperatures, measured as T (µs).
Temperature (°C)2505007501000
BeforeAfterBeforeAfterBeforeAfterBeforeAfter
Average transit time of ultrasonic waves (µs)39.3548.2139.3569.6839.84124.8039.84124.80
Standard deviation (µs)0.972.330.974.940.546.480.546.48
Coefficient of variation (%)2.484.842.487.091.355.191.355.19
Table 12. Average, standard deviation and coefficient of variation for HPC samples before and after exposure to elevated temperatures, measured as T (µs).
Temperature (°C)2505007501000
BeforeAfterBefore AfterBefore AfterBefore After
Average transit time of ultrasonic waves (µs)35.1637.6235.1658.8536.09113.7634.35134.85
Standard deviation (µs)1.160.521.160.500.381.790.223.68
Coefficient of variation (%)3.301.403.300.851.071.570.632.73
Table 13. Average, standard deviation and coefficient of variation for OPC samples before and after exposure to elevated temperatures, measured as v (km/s).
Temperature (°C)2505007501000
BeforeAfterBeforeAfterBeforeAfterBeforeAfter
Average propagation speed of ultrasonic waves (km/s)4.083.344.082.314.031.294.160.74
Standard deviation (km/s)0.100.170.100.160.050.060.010.05
Coefficient of variation (%)2.414.952.417.011.324.960.247.39
Table 14. Average, standard deviation and coefficient of variation for HPC samples before and after exposure to elevated temperatures, measured as v (km/s).
Temperature (°C)2505007501000
BeforeAfterBeforeAfterBeforeAfterBeforeAfter
Average propagation speed of ultrasonic waves (km/s)4.564.264.562.724.441.414.681.20
Standard deviation (km/s)0.150.060.150.020.060.020.030.03
Coefficient of variation (%)3.231.433.230.871.271.370.572.90
Table 15. Dynamic modulus of elasticity before and after the frost resistance test for OPC and HPC samples.
Dynamic Modulus of Elasticity Before Frost Resistance Test (GPa)Dynamic Modulus of Elasticity After Frost Resistance Test (GPa)
OPC47.941.0
HPC55.555.1
Table 16. Average, standard deviation, and coefficient of variation for OPC samples before and after the frost resistance test.
Before TestAfter Test
T (µs)v (km/s)T (µs)v (km/s)Flexural Strength (MPa)Compressive Strength (MPa)
Average35.044.5937.904.253.352.7
Standard deviation0.350.040.650.080.513.16
Coefficient of variation (%)0.990.811.701.7815.375.99
Table 17. Average, standard deviation, and coefficient of variation for HPC samples before and after the frost resistance test.
Before TestAfter Test
T (µs)v (km/s)T (µs)v (km/s)Flexural Strength (MPa)Compressive Strength (MPa)
Average33.534.8033.694.7815.4130.5
Standard deviation0.150.020.310.031.285.73
Coefficient of variation (%)0.460.410.930.568.354.39
Table 18. Average wastes of OPC samples after certain cycles.
Cycles0–250–500–750–1000–1500–200
Average waste [g/m2]807.21791.42720.63488.44881.26506.4
Standard deviation [-]218.3386.1448.0550.0730.5908.1
Coefficient of variation [%]12.221.616.415.715:014.0
Table 19. Average wastes of HPC samples after certain cycles.
Cycles0–250–500–750–1000–1500–200
Average waste (g/m2)30.650.763.373.388.6106.76
Standard deviation (g/m2)12.015.918.022.424.625.27
Coefficient of variation (%)39.231.428.430.627.823.7
Disclaimer/Publisher’s Note: The statements, opinions and data contained in all publications are solely those of the individual author(s) and contributor(s) and not of MDPI and/or the editor(s). MDPI and/or the editor(s) disclaim responsibility for any injury to people or property resulting from any ideas, methods, instructions or products referred to in the content.

