Article

Deciphering the Risk of Area-Wide Coordinated Urban Regeneration in Chinese Small Cities from the Project Portfolio Perspective: A Case Study of Yancheng

1
Civil Engineering Department, Yancheng Institute of Technology, Yancheng 224051, China
2
School of Civil Engineering, North China University of Technology, Beijing 100144, China
3
School of Management Science & Real Estate, Chongqing University, Chongqing 400045, China
*
Author to whom correspondence should be addressed.
Buildings 2025, 15(6), 983; https://doi.org/10.3390/buildings15060983
Submission received: 11 February 2025 / Revised: 16 March 2025 / Accepted: 19 March 2025 / Published: 20 March 2025

Abstract

:
Area-wide coordinated urban regeneration is a strategic approach to upgrading urban functions, enhancing the allocation efficiency of land resources, and enhancing the overall urban environment from a project portfolio perspective. However, implementing area-wide coordinated urban regeneration faces significant challenges, including project delays, terminations, and difficulties in achieving investment returns. These challenges are particularly acute in smaller Chinese cities. While most previous research has paid attention to large Chinese cities, they usually neglect the risks associated with urban regeneration from an area-wide project portfolio perspective. To address this gap, this research develops a comprehensive list of risk indicators for area-side coordinated urban regeneration based on project portfolio management theory. Stakeholder opinions on the likelihood and impact of these risk indicators were collected by a questionnaire survey. A risk evaluation method, integrating the C-OWA operator and grey cluster analysis, was proposed to assess these risks. Risk management and control strategies were then proposed based on different risk levels. A case study of the coordinated urban regeneration of Yancheng’s Chaoyang area was conducted to evaluate comprehensive risk levels and provide tailored recommendations for risk control. This study offers practical guidance for urban planners and policymakers to improve decision-making in small cities and contributes new insights into risk management in the field of urban development.

1. Introduction

Sustainable urban development has attracted significant attention in both academic and practical fields in recent years [1]. Urban regeneration, as a strategic approach to achieving sustainable urban development, has become increasingly vital. However, regeneration projects often focus on individual sites, prioritizing those with favorable locations and strong profitability while neglecting areas with weaker foundations. This approach can lead to unsustainable urban development, as poorly developed areas remain neglected, hindering long-term urban sustainability. In response to these challenges, area-wide coordinated urban regeneration has emerged as a promising solution for policymakers and urban managers. This approach addresses fragmentation in urban development by upgrading urban functions, enhancing the allocation efficiency of land resources, and improving the overall urban environment from a project portfolio perspective [2]. Since 2021, area-wide coordinated regeneration has gained momentum in China, with cities such as Beijing, Shanghai, Shenzhen, and Chongqing undertaking significant regeneration initiatives. Many of these cities have not only completed substantial area-wide regeneration projects but also plan to expand these efforts in the coming years.
Although area-wide coordinated urban regeneration is gaining momentum, risk management during its implementation remains a critical concern, particularly in small cities. Factors such as incomplete or ineffective policies, a lack of experienced planning and management personnel, and reluctance from major investors to commit capital contribute to the difficulties faced in executing regeneration plans, recovering investment costs, and even completing projects within their intended timelines [3]. As a result, area-wide coordinated urban regeneration in small cities often remains at the conceptual stage, with actual implementation falling short of expectations. In contrast, large cities benefit from more comprehensive urban regeneration policies, more experienced planning and management teams, and active investment from major investors. These advantages make it easier for large cities to avoid the challenges encountered by smaller cities [4,5]. While several large cities in China have accumulated extensive experience in area-wide coordinated urban regeneration, the distinct development contexts of smaller cities mean that these experiences cannot be directly replicated. The complexity and uncertainty inherent in the process often lead small cities to consume more resources, increasing the likelihood of failure [6].
Due to the multitude of regeneration areas and limited resources, interdependencies between individual projects in area-wide coordinated urban regeneration are inherently complex. These projects must share and compete for constrained resources, while important interaction relationships in terms of resources, technologies, and benefits further complicate coordination [7]. The complex interaction between area-wide coordinated urban regeneration often leads to multi-dimensional systemic problems. It is manifested in the conflict of objectives of different subprojects and the dislocation of time and space in resource allocation, which form a dynamic and intertwined contradictory network. Such interaction relationships often cause risks in area-wide regeneration to diverge substantially from those in single-project contexts, as risks interact dynamically, creating cascading effects [8]. Moreover, unlike conventional projects, coordinated urban regeneration initiatives exhibit unique characteristics, including heterogeneous influencing factors, diverse stakeholder demands, and context-specific environmental conditions. Compared to the development in new urban areas, area-wide coordinated regeneration not only pursues economic and social objectives but also involves balancing competing stakeholder interests and mediating complex negotiations. This process typically requires significantly longer timelines than standard projects [2]. Generally, these distinctive features amplify the complexity and uncertainty of area-wide regeneration, heightening the potential for project failure.
In addition, empirical evidence from urban regeneration practices indicates that conventional risk management mechanisms embedded in generic project frameworks exhibit insufficient capacity to accommodate the complex demands of multi-stakeholder collaboration and multi-dimensional objective equilibrium inherent in area-wide coordinated urban regeneration. The absence of systematic risk management frameworks in area-wide coordinated urban regeneration has resulted in substantial implementation barriers, with even major metropolitan areas encountering difficulties in project implementation [9]. Furthermore, these operational dilemmas reveal that establishing a full-cycle management system encompassing “risk identification-quantitative assessment-dynamic prevention” not only enhances the stability of spatial reproduction processes but also facilitates the synergistic optimization of economic value capture and social benefit creation. Hence, traditional risk management theory, which focuses on identifying and mitigating risks at the individual project level, struggles to account for systemic interdependencies and cumulative effects. Consequently, existing risk management frameworks are ill-equipped to address the multifaceted challenges of area-wide coordinated regeneration.
To satisfy actual needs and fill the research gap, this study can add to the literature related to the risk management of area-wide coordinated regeneration in small Chinese cities. In addition, determining the risk indicators associated with area-wide coordinated regeneration in small cities enables urban planners and policymakers to improve decision-making in practice and customize the appropriate set of risk indicators for area-wide coordinated regeneration in small Chinese cities, so as to make contributions to the practice. Meanwhile, this paper proposes a hybrid risk assessment approach for area-wide coordinated urban regeneration in small Chinese cities, with the aim of providing actionable recommendations for risk mitigation. The structure of the remaining part of this study is as follows: First, a literature review synthesizes existing research on risk evaluation in area-wide coordinated urban regeneration, with a focus on small-city contexts. Second, the methodology section details the C-OWA operator and grey cluster analysis techniques, explaining their integration into the proposed framework. Third, a case study of a coordinated urban regeneration initiative in China is analyzed to demonstrate the applicability of the hybrid approach. Finally, this research discusses significant findings, outlines evidence-based strategies for risk control, and concludes with theoretical and practical implications for urban development stakeholders.

2. Literature Review

2.1. Research on Risk Management of Urban Regeneration

There is a considerable body of literature on urban regeneration risk management, exploring the topic from various perspectives. Most existing studies focus on risk management at the city and individual project scales. At the city scale, research has primarily examined the evolution mechanisms and impacts of social risks arising from urban regeneration activities [10,11,12]. These studies have highlighted that social risks often stem from the complex relationships between stakeholders and the challenges in aligning their interests [13,14]. Additionally, much of the research on urban regeneration risk management at the city scale has been conducted in typical large cities, such as Chongqing [13,15], Chengdu [11], Shenzhen [15], Guangzhou [14], and even in international contexts like Taiwan [16]. These studies primarily focus on the urban regeneration risks in representative large cities, revealing that the bulk of existing research has been centered around these urban contexts.
At the individual project scale, a substantial body of research has emerged, assessing urban regeneration risks from various dimensions. It is widely acknowledged that risk evaluation provides valuable insights into current challenges and future trends, which can help inform the development of appropriate strategies [17]. Much research, rather than proposing risk decision models, focuses on assessing the current state and presenting strategies based on indicator-based approaches across different risk assessment dimensions [18]. For example, Li et al. [19] proposed urban waterlogging indicators at the project implementation level to assess the waterlogging risk during urban renewal processes. Huo et al. [20] developed a list of risk indicators covering the entire lifecycle of retrofit projects, from the decision-making stage through design, implementation, and operation/maintenance, and assessed risks in the context of old residential areas. Mai et al. [21] categorized the social risks of urban renewal projects into 11 indicators, considering both external and internal factors from the perspective of stakeholders. Koc and Okudan [22] identified 55 risk factors across the deconstruction lifecycle, spanning nine phases, and evaluated the impact of each on the deliverables of urban regeneration projects. Yu et al. [23] examined critical stakeholder-related risk factors and applied social network analysis to evaluate the impact of each during the building demolition phase of urban renewal from the angle of quantitative analysis. Liu et al. [24] classified barriers to urban renewal into four aspects: administration, finance, knowledge/information, and technology, which contribute to high investment risks. From this body of research, it can be concluded that risk assessments of urban regeneration projects commonly focus on project implementation and management risks, as well as external environmental factors. These categories have emerged as essential components of urban regeneration risk evaluations.
Although a vast body of literature exists on urban regeneration risk evaluation, several research gaps remain. First, most studies focus on risk assessments at the city or individual project scale, often overlooking the coupling and coordination of risk factors at the area scale. However, it is crucial to consider area-wide coordinated urban regeneration, especially given the challenges of balanced funds, limited public resources, and the need to rehabilitate non-profitable or low-profitable projects in order to revitalize urban built-up areas [2]. In reality, urban regeneration projects are not implemented at the scale of individual projects but are coordinated at the area level to optimize resource allocation and ensure effective implementation [25]. Ignoring the interconnections and coordination risks between projects in urban regeneration areas may lead to a failure to address higher-level planning needs and functions [17]. Second, existing research on urban regeneration risk evaluation tends to focus on large, representative cities, with little attention given to smaller cities. While studies often suggest that urban regeneration practices in large cities are universally applicable, this assumption overlooks critical differences. In small cities, the lack of sufficient policy support, limited expert experience, and a shortage of pilot projects make it challenging to directly apply risk assessment findings from large cities. Consequently, the unique challenges of small cities require tailored risk evaluation frameworks that account for their specific conditions.

2.2. Existing Methods for Project Risk Evaluation

To evaluate the project risk, quantifying and ranking the identified risk types is an effective solution. Risk evaluation is a critical procedure in the broader risk management process, which typically contains risk determination, risk evaluation (or analysis), and risk control [26]. Risk evaluation incorporates assigning qualitative or quantitative values to the identified risk indicators. In urban development, a large body of research focuses on indicator-based evaluation methods [17]. The most common approach is the single indicator-based evaluation, where methods such as fuzzy synthetic evaluation [27], analytic hierarchy process (AHP) [28], fuzzy inference systems [29], intuitionistic fuzzy-decision making trial and evaluation laboratory (IF-DEMATEL) [30], structural equation modeling [31], cloud models [32], and fuzzy synthetic evaluation [33] have been widely adopted. These methods are well-established and relatively easy to implement. However, they have been criticized for their inability to fully accommodate the complexities of modern decision support [20]. In response, some scholars have combined different methods to improve risk assessment in urban development. For example, fuzzy analytic network process with failure mode and effect analysis [34], AHP with mixed center-point triangular weight function [35], mean scoring with fuzzy synthetic evaluation [36], C-OWA-grey cluster analysis [20], and evidence-based reasoning with improved fuzzy cognitive maps [37] have been explored. While these hybrid methods offer a more comprehensive approach, they share a common limitation: they often overlook the impact of extreme values in the decision data, which can skew risk assessment accuracy, and fail to adequately address the “graying” of risk factor information during the weighting process.
As highlighted in the literature review, despite the considerable body of research on risk assessment in urban development projects, some critical gaps remain. Existing risk assessment methods often overlook the impact of extreme indicator values on the accuracy of risk evaluations and fail to fully account for the inherent gray nature of risk factor information. To enhance the effectiveness of risk evaluation in area-wide coordinated urban regeneration, it is crucial to develop a practical hybrid approach. This approach should integrate a hybrid model that mitigates the influence of extreme values on decision data accuracy and incorporates grey system theory for more effective risk factor clustering analysis.

3. Research Methods

In this research, an integrated method was presented to assess the risk level of area-wide coordinated urban regeneration quantitatively. This research consisted of four main steps, as shown in Figure 1. The first step was to establish a hierarchical and theory-oriented risk indicator system for area-wide coordinated urban regeneration based on the research literature. Expert interviews were used to revise and modify the initial risk indicators to determine the final risk indicators by considering the practices of area-wide coordinated urban regeneration. In the second step, the typical area-wide coordinated urban regeneration in Yancheng was selected, and the data were obtained through field surveys and expert interviews. Accordingly, the weight of each risk indicator was identified through the C-OWA operator. The third step was to propose the grey clustering method to determine the risk level for area-wide coordinated urban regeneration. Finally, the corresponding risk control measures were proposed based on the literature and field survey.

3.1. Establishing an Indicator System for Evaluating the Risk Level

Due to diversification and differences, the process of determining a list of effective and scientific risk indicators is both complicated and challenging. The work regarding the risk of the combination of the individual project scale and the interaction relationships between the urban regeneration projects is quite scarce. Different from traditional project risk determination, risk identification in area-wide coordinated urban regeneration should take into account the systematic interaction relationships between the urban regeneration projects based on the perspective of project portfolio management. Based on the literature review and the project portfolio management theory, the risks of area-wide coordinated urban regeneration are identified and categorized into three aspects: single project level, multi-project area level, and environmental system level. The details of risk indicator selection and modification are illustrated as follows:
Based on the above-mentioned conceptual framework of the risk indicators for area-wide coordinated urban regeneration, the initial risk factors were examined in a literature review. The resources for this literature review are mainly secondary sources, for example, academic journals on the risk of urban regeneration/public projects or general project portfolios. The search rule used was (“urban renewal”, “urban regeneration”, “urban renewal project risk”, “project program risk”, and “project portfolio risk”), which was put in as the search criterion topic in the SCI database. Eventually, 23 initial risk indicators were identified according to the principle that they appeared more than twice. Although many risk indicators have been examined in existing research, these factors may not be absolutely in line with the special objective of this study. Hence, a Delphi method was used to revise and modify the initial risk indicators. Particularly, five experts from the urban regeneration company, government, real estate company, and university who have rich experience in urban regeneration studies and practice were consulted. The Delphi approach in this research went through two rounds of expert surveys utilizing a questionnaire to research consensus. Finally, a list of the 21 risk indicators of area-wide coordinated urban regeneration was determined, as presented in Table 1. The risk indicators were labeled as the form of F i j , denoting the j-th risk indicator in i-th category.

3.2. The Modelling Procedure of the Hybrid Approach

After determining and analyzing the final risk indicators in the risk indicators in area-wide coordinated urban regeneration, a risk evaluation method would be proposed to assess the risk degree in the area-wide coordinated urban regeneration. From the systems informatics perspective, the core difficulty of risk evaluation lies in the coexistence of external certainty and internal uncertainty. Fundamentally, it can be classified as a grey system problem. Given the innate uncertainty of risks, the grey clustering method emerges as a highly appropriate approach for risk level evaluation [20]. Hence, the proposed hybrid approach integrates two different methods: the C-OWA operator and the grey cluster analysis. As illustrated in Figure 1, to mitigate the adverse effects brought about by the subjective uncertainty of experts, the C-OWA operator grounded in the combination number is employed to allocate weights to each risk indicator. Then, the assessment matrix was identified by utilizing the grey cluster analysis approach. According to Huo et al. [20], compared with the traditional single-risk assessment approach, the hybrid approach can reduce the subjective deviation to identify the risk degree of the area-wide coordinated urban regeneration by integrating the assessment results and the risk factor weights. In general, the modeling steps include two main procedures as follows:

3.2.1. Indicator Weighting Based on the C-OWA Operator

In this study, the C-OWA operator is used, that is, the scores of invited experts are weighted in an orderly manner, so as to make more effective use of the information contained in the risk indicators and improve the scientific nature of the assignment. The detailed steps for determining the weight value of the risk indicators by the C-OWA operator are as follows.
Step 1: Identify the importance degree value of evaluation indicators.
The above n experts were invited to assess the importance of risk indicator F i j , utilizing the [0–10] scoring method, and the scores assigned by the experts for the constituent factors formed the initial data set A = α 1 ,   α 2 , , α n . Subsequently, the values within the original data set A were sorted in descending order. After that, each value was numbered starting from 0. As a result, a new data set Q = q 0 ,   q 1 , , q n 1 was generated, which was more conducive to subsequent analysis and operations based on the ordered data.
Step 2: Calculate the weight values of the data.
Identify the weight values of each data in the set Q detected by the combination number C n 1 k through the following equation.
δ k + 1 = C n 1 k k = 0 n 1 C n 1 k = C n 1 k 2 n 1 ,   k   ϵ   0 , n 1
where k = 0 n δ k + 1 = 1
Step 3: Calculate the absolute weight values of risk indicators.
The absolute weight values of the risk indicators are identified by weighting the dataset sequentially through the weights of the data, as presented in the following equation.
Q j = k = 0 n 1 δ k + 1 q m ,   δ i   ϵ   0 ,   1
Step 4: Identify the relative weight values of risk indicators.
The objective weight values of the risk indicators are determined through the absolute weight values of the factors, i.e., the relative weight values ω i = ( ω 1 ,   ω 2 ,   ω n ) of the risk indicators by the following equation.
ω i = Q j j = 1 n Q j ,   j = 1 ,   2 ,   ,   n

3.2.2. Grey Cluster Analysis Risk Evaluation Method

Grey cluster analysis is an uncertainty system theory which was proposed by Deng in 1982. It is suitable for modeling and analyzing the problems with restricted data deficiency or fuzzy uncertainty indicators. Grey cluster analysis can be effective in detecting evolution laws, because the assessment of the future may be inaccurate. Grey cluster analysis depends on whitenization weight functions or grey incidences that make the users obtain critical values and prioritize their preferences. In view of the fact that in the process of risk assessment, the judgments made by humans regarding preferences often exhibit fuzziness, it is therefore necessary to introduce grey system theory to effectively reduce the impact of subjective biases. The steps followed for the grey cluster analysis are presented below:
Step 1: Determine the grey category.
In this paper, we define the five grey classes of the risk indicators according to the risk evaluation. The grey classes could be described as “very low, low, medium, high, and very high”, which the center-point e of each grey class is (1, 2, 3, 4, and 5), respectively.
Step 2: Establish the whitenization weight function.
The whitening function is used to transform the original data into the membership degree of each grey class. For different grey classes, different whitening functions are established. The form of the whitening function is usually determined according to the central point proposed by Liu et al. [50]. Considering the connotation of risk evaluation of area-wide coordinated urban regeneration, the whitenization weight function was established based on the previous studies, as presented in Table 2.
Step 3: Calculate the clustering coefficients for each risk indicator and grey class.
On the basis of the divided grey classes and risk measures, m experts were engaged to assign scores to each risk indicator F i j to acquire assessment matrix D = d i j k s × m . The clustering weights η j of the indicator are identified based on the C-OWA operator. The membership degree of indicator F i j in e grey class is k = 1 m f e d i j k , and the clustering coefficient r i j e is calculated as:
r i j e = k = 1 m f e d i j k   ·   η j
Step 4: Calculate the grey clustering weight matrix.
Combined with the clustering coefficients calculated in the previous procedure, the grey clustering weight vector r i j = r i j 1 ,   r i j 2 ,   r i j 3 ,   r i j 4 ,   r i j 5 of risk indicator F i j for each grey class were acquired, and then the weight vector r i j of each secondary indicator subordinate to main indicator F i j was combined with the established grey clustering weight matrix of risk indicator F i j :
In combination with the clustering coefficients computed in the preceding procedure, the grey clustering weight vectors r i j = r i j 1 ,   r i j 2 ,   r i j 3 ,   r i j 4 ,   r i j 5 of the risk indicator were acquired. Subsequently, the weight vector r i j of each secondary indicator subordinate to the main indicator F i j was integrated to establish the grey clustering weight matrix of the risk indicator:
R i = r i 11 r i 12 r i 13 r i 14 r i 15 r i 21 r i 31 r i 22 r i 32 r i 23 r i 33 r i 24 r i 34 r i 25 r i 35 r i j 1 r i j 2 r i j 3 r i j 4 r i j 5
Step 4: Make the cluster decision-making.
Initially, the secondary risk factors underwent clustering operations. Based on the computational outcomes, the grey comprehensive clustering matrix R = Z 1 ,   Z 2 ,   Z 3 ,   Z 4 T was acquired. Subsequently, in conjunction with the weights assigned to the main risk factors, the integrated clustering assessment vector was determined as Z = ω 0 × R .
In accordance with the grey clustering assessment criterion, the risk evaluation threshold for area-wide coordinated urban regeneration was determined to be U = 9 7 5 3 1 , and the integrated risk evaluation value W = Z × U T . In the present research, the value range was set as 0 ,   10 , and the relevant risk level classifications were presented in Table 3. Once the integrated risk evaluation value was identified, the risk degree of the area-wide coordinated urban regeneration could be ascertained based on the internal range of W.

4. Case Study and Results

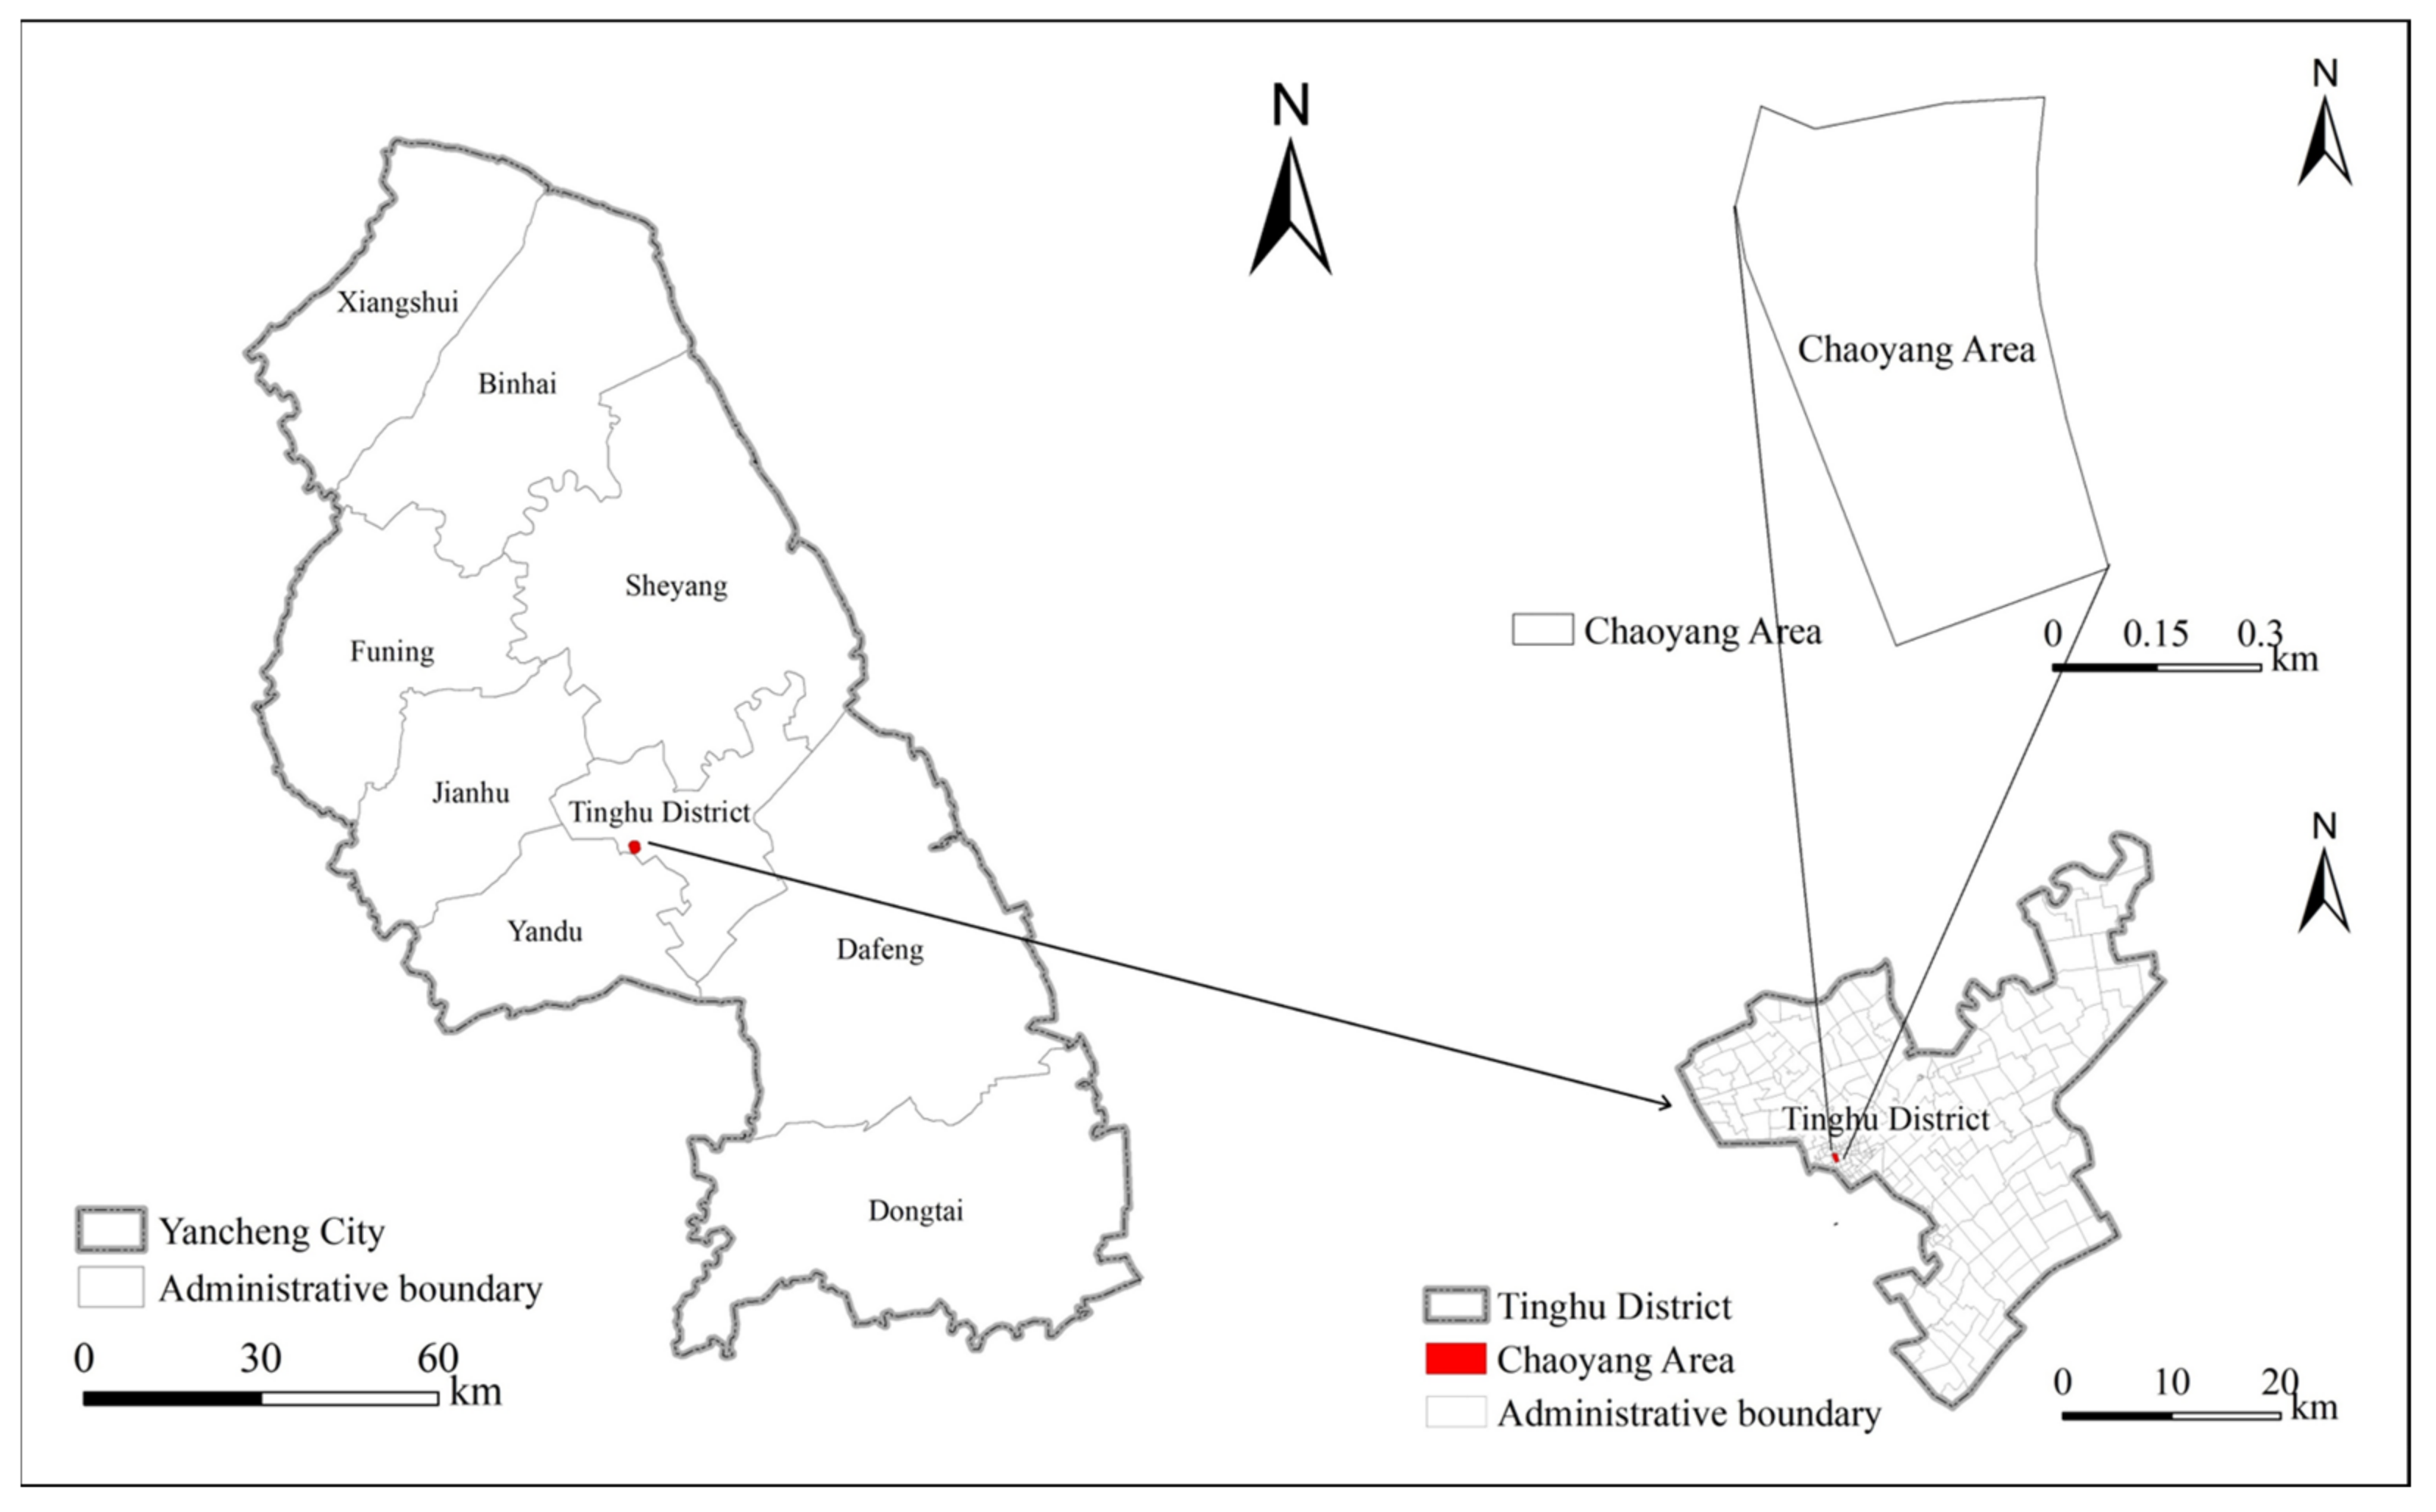
4.1. Case Description

Yancheng is situated in the eastern coastal area of China and is a typical plain city with an area of nearly 17,700 square kilometers and a population of nearly 6.689 million people. Its urban development is confronted with environmental, economic, and social issues such as dilapidated buildings, environmental deterioration, and economic recession. As these problems become increasingly prominent in Yancheng, it is extremely urgent to carry out the area-wide coordinated urban regeneration to tackle these difficult problems. Yancheng is one of the first pilot cities for carbon peak in China; therefore, urban regeneration has unique characteristics, emphasizing the improvement of urban connotation and sustainable urban development. In addition, Yancheng has become the only small city in Jiangsu to be included in the Yangtze River Delta urban agglomeration planning. Additionally, the number of urban regeneration pilot projects in Yancheng ranks first in Jiangsu Province. In recent years, a total of 43 area-wide coordinated urban regeneration divisions have been proposed in the main urban area of Yancheng. The coordinated regeneration of the Chaoyang area, as the “number one project” of the urban regeneration implementation plan, is a landmark livelihood and development project that comprehensively leads the high-quality development of Yancheng. Hence, the Chaoyang area is among the hotspots for urban regeneration in Yancheng compared to other areas. In order to conduct data collection and empirical analysis, this research selected the Chaoyang area in Yancheng as a typical case study, as shown in Figure 2.

4.2. Data Collection

To ascertain the importance levels of the 21 aforementioned risk indicators, the Urban Regeneration Research Group in the Chaoyang area organized a dedicated seminar. Since the hybrid method proposed in this research follows an expert-based decision-making model, a large-scale sample is not essential [51]. A total of six experts, each embodying different perspectives and playing diverse roles in the urban regeneration field, were invited to participate in this crucial activity. The characteristics of the six experts engaged in this study are listed in Table 4. This group encompassed government officials, whose viewpoints were shaped by their policy-making and regulatory experiences, professors, who brought in-depth academic knowledge and theoretical insights, and project managers, who could offer practical, hands-on insights gleaned from their daily project implementation. Drawing on their extensive practical experiences and profound professional expertise, these experts furnished a wealth of valuable opinions and perceptive insights. The data collection for this study was carried out in two consecutive stages. In the first stage, the six experts were asked to rate the weight of each risk indicator on a scale ranging from 0 to 10. This numerical rating enabled a quantitative assessment of the perceived significance of each risk factor. In the second stage, the same six experts were invited to assign values to the secondary risk indicators, taking into account the actual situation and the complex dynamics of the coordinated regeneration efforts in the Chaoyang area, thus ensuring that the collected data were highly relevant and context-specific.

4.3. Risk Evaluation in the Case Study

To carry out risk evaluation in this case study, first, the C-OWA operator was utilized, and six experts with advanced and above participating in the area-wide coordinated urban regeneration were invited to score the weight of each risk indicator. The numerical scores given by various experts for risk indicators at the individual project level are shown in Table 5.
On the basis of the above weighting procedures of the C-OWA operator, the final risk indicator weight coefficient was presented in Table 6.
Furthermore, grey cluster analysis is used to assess the risk degree of the coordinated regeneration of the Chaoyang area.
(1) The six experts were invited to assign values to the secondary risk indicators based on the virtual situation of the coordinated regeneration of the Chaoyang area, and the assessment matrix D was acquired, presented as follows.
D = 10.0 5.0 6.5 3.5 7.5 7.5 10.0 6.0 6.5 4.0 8.5 8.0 9.5 5.0 6.0 10.0 5.5 5.5 10.0 9.5 5.5 6.0 5.0 6.5 3.5 9.0 8.5 4.0 9.5 8.5 5.0 4.5 9.0 9.5 8.0 7.5 6 × 21 T
(2) We determined the grey evaluation weight matrix. In light of the previously obtained expert-derived score values and the whitenization weight functions, the grey evaluation coefficients of each risk factor can be ascertained. Subsequently, through a comprehensive analysis, the grey clustering weight matrix R can be determined, which is presented as follows.
R = 0.614 0.248 0.277 0.182 0.498 0.414 0.365 0.319 0.356 0.234 0.382 0.399 0.020 0.365 0.332 0.328 0.121 0.186 0.000 0.068 0.035 0.256 0.000 0.000 0.000 0.000 0.000 0.000 0.000 0.000 5 × 21 T
(3) The overall grey clustering evaluation matrix is derived by multiplying each individual clustering matrix by its respective weight vector and subsequently aggregating the resultant values.
R = W i × R i = 0.444 0.354 0.176 0.026 0.000 0.390 0.378 0.214 0.018 0.000 0.443 0.348 0.152 0.057 0.000
(4) We multiply the weights assigned to the main indicators by the overall grey clustering evaluation matrix. Through this operation, the comprehensive clustering evaluation vector can be derived.
Z = ω 0 × R = 0.425 0.360 0.181 0.034 0.000
(5) The final risk evaluation value is computed through the integration of the comprehensive hybrid clustering evaluation vector and the risk measurement threshold U = 9 7 5 3 1 .
W = Z × U T   =   7.35
Through a comparison with the risk measurement levels presented in Table 3, it can be determined that the risk degree of the coordinated regeneration of the Chaoyang area is classified as “High”.

5. Discussion

5.1. Overall Performance of the Proposed Method

This research proposes an integrated approach to evaluate the risk levels associated with area-wide coordinated urban regeneration. It highlights the complementarity between the C-OWA operator and grey cluster analysis, demonstrating how their combination provides systematic insights into the risk evaluation procedure. The C-OWA operator is particularly effective for determining the weights of risk indicators, as it mitigates the instability caused by extreme values (maxima and minima) in the data, thus yielding more scientific and objective results. The integrated use of both methods offers significant benefits, particularly through proposing a robust estimation model for an indicator-based approach. The results not only present a comprehensive picture of the overall risk level for area-wide coordinated urban regeneration but also offer insights into future risk management strategies.
Furthermore, the risk of area-wide coordinated urban regeneration is a macro-level concept made up of several layers of risk factors. Given the complexity of the regeneration process, involving numerous types of projects with intricate interrelationships, the sources of risk are more diversified. Many factors interact and are interdependent, leading to a coupled relationship among the risks [2]. The study finds that factors such as project coupling and coordination play a significant role, with core issues like an unsound coupling coordination mechanism triggering a chain reaction of other risks, thus amplifying the overall risk [43]. In comparison to existing research, the set of risk factors identified in this paper offers a more tailored and comprehensive framework for evaluating the risk levels of area-wide coordinated urban regeneration [20,21,22,52].

5.2. The Distinctive Features of This Research as a Whole

This paper highlights two key differences between the risk management of area-wide coordinated urban regeneration and existing studies. First, the inherent complexity of different project types and the non-linear interactions between them in area-wide coordinated urban regeneration result in higher risks than those associated with single projects. The interactions of various internal and external factors in area-wide coordinated regeneration create a coupled relationship among the risk elements. The results of the case analysis indicate that project coupling and coordination effects such as F 24 , F 25 , and F 27 have a high weight in the risk assessment at the multi-project area level. During the evolution of risks in area-wide coordinated regeneration, core issues like an unsound coupling coordination mechanism can trigger cascading effects, amplifying other risks and increasing the overall risk level [43,44]. Therefore, traditional risk management approaches for individual projects fail to account for the coupled relationships between risks across multiple projects, which significantly reduces the probability of successful implementation in area-wide regeneration compared to standalone projects [23,24].
Second, this paper concludes that factors such as the lack of professional urban planners, incomplete policy frameworks, and financing difficulties significantly impact the risk levels in area-wide coordinated urban regeneration in small cities. Thus, these factors, including F 14 , F 31 , F 32 , and F 34 , have a higher weight for the overall risk of the area-wide coordinated regeneration. This result is different from that in large cities. Most of the existing research on urban regeneration risk is rooted in representative large cities such as Guangzhou, Shenzhen, and Shanghai [11,13,14,15]. In these cities, urban regeneration benefits from more comprehensive policy systems, stronger financial capabilities, and a concentration of professional expertise. Specifically, in terms of substantive support policies alone, these cities have issued plot ratio incentives for urban regeneration, preferential loan policies, and special bond support, etc. On the contrary, in small cities such as Yancheng, urban regeneration policies are all measures to promote and encourage, and there is a lack of substantive support measures. In a word, several risk factors encountered in small cities do not apply to larger cities [53]. These risk factors constitute a larger proportion of the overall risks in small cities, indicating that the risks of area-wide coordinated urban regeneration are higher in small cities compared to large cities. This highlights that large cities, with their accumulated experience and unique advantages in urban regeneration, are in a better position to manage risks [54]. Consequently, the experiences and practices of large cities are difficult to replicate in smaller cities. Furthermore, the central government will allocate financial support for the urban regeneration of 15 urban demonstration cities in 2024, focusing primarily on China’s megacities and large cities along the Yangtze River Economic Belt. In contrast, most small cities still lack such state-level policy support and financial backing, meaning their urban regeneration efforts remain in the exploratory stage.

5.3. The Corresponding Countermeasures in Risk Control

Through the literature review and field research, this paper proposes corresponding countermeasures in risk control for the coordinated regeneration of the Chaoyang area in Yancheng. On the one hand, the critical points of the three dimensions for the identified risk factors above are different, and the monitoring focus needs to be adjusted according to the risk characteristics of each dimension. First, according to the weight of risk indicators, the important risks at the single project level are project demolition coordination and project financing difficulties. The government urgently needs to develop a sound mechanism for distributing benefits and a top-down coordination mechanism among multiple stakeholders based on in-depth investigation of their differentiated demands. The government leverages social capital from different participating entities through investment to participate in urban regeneration, which aims to resolve the financing difficulties [55]. Second, it is indicated that the interaction relationships can trigger many specific risks frequently and easily occur at the multi-project area level. So, properly handling the interaction relationships among risks can help minimize these risks in the process of area-wide coordinated urban regeneration. Finally, the important risks at the environmental system level are incomplete laws and policies related to urban regeneration and there is insufficient support within the government. Government departments should establish and improve policies and regulations for area-wide coordinated urban regeneration and shift the focus of urban construction management to the renovation of existing buildings.
On the other hand, by concentrating on monitoring the risk factors with higher weights in the established risk indicator system, the likelihood of risks occurring can be minimized, and the adverse impacts of risk occurrence can be reduced. The corresponding departments involved in urban regeneration should collaborate to establish a risk control mechanism, ensure the implementation of relevant departments’ responsibilities, and clearly define the risk-responsible entities. Referring to the risk indicator weight coefficients in Table 6, for risks with a high probability of occurrence and a significant impact level, it is advisable that urban managers and policymakers adopt a risk-transfer strategy. They should reasonably share risks through communication and negotiation to lower the overall risk level. This conclusion has also been confirmed by other previous research [44].

6. Conclusions

To achieve sustainable urban development, promoting area-wide coordinated urban regeneration instead of single-scale urban regeneration project demolition and reconstruction has been urgently advocated. Nevertheless, area-wide coordinated urban regeneration across the entire area engenders the complexity of risk management attributable to the intricate interaction relationships among features like multiple targets, clustered content processes, and the arduousness of coordination. So, it is critical to determine and assess risk indicators in multi-project area-scale urban regeneration, and to develop corresponding risk response measures systematically. A case study in Yancheng is presented to validate the hybrid approach and contribute to real-world practice.
The main findings of this study include two aspects. On the one hand, a total of 21 risk indicators related to area-wide coordinated urban regeneration are identified. On the other hand, an integrated risk evaluation method based on the C-OWA operator and grey cluster analysis is proposed, and the effectiveness of the approach is verified through a case study, and decision-makers can take corresponding risk control measures according to different risk weights. This research offers practical guidance for urban planners and policymakers to improve decision-making in small cities and contributes new insights into risk management in the field of urban development.
This study makes significant theoretical and practical contributions. In terms of theoretical advancements, a comprehensive risk evaluation system in the area-wide coordinated urban regeneration is built from a new perspective of multi-project coupling coordination based on project portfolio management. Previous studies have failed to identify the risk factors by taking into account project interaction relationships. This study also comprehensively determines risk indicators from three dimensions and addresses the issue in previous research that only focused on unilateral risks in area-wide coordinated urban regeneration. So, this research bridges the gap in knowledge of risk identification and creates the basis for urban regeneration management. In terms of practical significance, the proposed hybrid approach is utilized in risk evaluation, which is an innovation for identifying the risk level. This is different from the use of single indicator-based evaluation approaches, they all have a common limitation in that they ignore the impact of extreme values in decision data on the accuracy of risk assessment and fail to fully consider the graying of risk factor information in the process of indicator weighting. On the practical front, the hybrid method may assist urban development managers in enhancing decision-making and better managing urban regeneration. Utilizing the model to assess urban regeneration enables organizations to monitor urban regeneration continuously to determine whether area-wide coordinated urban regeneration is on track. On this basis, urban managers can formulate and implement informed risk response strategies according to their own risk preferences. In the long-term perspective, this practice is conducive to enabling organizations to adeptly adapt to environmental changes and deftly seize potential opportunities. As a result, it will ultimately augment the probability of organizations successfully attaining their strategic objectives.
This paper also has its limitations in research. The risk assessment approach proposed in this study only evaluates one case of area-wide coordinated urban regeneration in Yancheng, and the conclusions drawn may not fully reflect the actual situation. Therefore, future research needs to conduct risk assessments on multiple cases of area-wide coordinated urban regeneration and invite more industry and academic experts to obtain universal results, so as to propose universal recommendations.

Author Contributions

Conceptualization, T.Z.; methodology, Y.C. and T.Z.; software, Y.C. and F.Y.; writing—original draft preparation, Y.C. and F.Y.; writing—review and editing, T.Z.; supervision, T.Z.; funding acquisition, Y.C. All authors have read and agreed to the published version of the manuscript.

Funding

The authors wish to express their sincere gratitude to the MOE (Ministry of Education in China) Project of Humanities and Social Sciences (Project No. 23YJC630017), the Yancheng City Policy Guidance Program (Soft Science Research) Project (No. YCBR2024010), the Yancheng Institute of Technology High-level Talent Research Project (No. xjr2023018), and the Yuxiu Innovation Project of NCUT (2024NCUTYXCX208) for funding this research project.

Data Availability Statement

Data are contained within the article. Further inquiries can be directed to the corresponding author.

Conflicts of Interest

The authors declare no conflicts of interest.

References

  1. Wang, H.; Liu, Z.; Zhou, Y. Assessing urban resilience in China from the perspective of socioeconomic and ecological sustainability. EIA Rev. 2023, 102, 107163. [Google Scholar] [CrossRef]
  2. Chen, Y.; Liu, G.; Zhuang, T. How to promote urban regeneration projects? An area-wide portfolio selection approach considering interaction effects and multiple objectives. EIA Rev. 2023, 103, 107283. [Google Scholar] [CrossRef]
  3. Shen, X.; Huang, G.; Zhang, X. Financing urban land development in underdeveloped small cities in western China: The role of earmarked funds. J. Urban Manag. 2024, 14, 121–131. [Google Scholar] [CrossRef]
  4. Shen, L.; Liu, Y.; Ren, Y.; Wong, S. A methodological framework for analysing the justice phenomenon embedded in urban regeneration: A Chinese perspective based at the project level. Land Use Policy 2024, 145, 107287. [Google Scholar] [CrossRef]
  5. Zhao, P.; Md Ali, Z.; Nik Hashim, N.H.; Ahmad, Y.; Wang, H. Evaluating social sustainability of urban regeneration in historic urban areas in China: The case of Xi’an. J. Environ. Manag. 2024, 370, 122520. [Google Scholar] [CrossRef]
  6. Vitiello, V.; Castelluccio, R.; Zaccaria, A.; Rapicano, A.; Fraiese, M.; Negri, E.; Terenzi, G. A methodological approach to classify good practices for urban and metropolitan risk management. Int. J. Disaster Risk Reduct. 2024, 115, 105069. [Google Scholar] [CrossRef]
  7. Zhang, B.; Hu, S.; Lakes, T. Coupling renewal and sprawl processes on block level to simulate urban residential growth in Berlin. Sustain. Cities Soc. 2025, 121, 106183. [Google Scholar] [CrossRef]
  8. Shen, C.; Wang, Y.; Xu, Y.; Li, X. Unveiling citizen-government interactions in urban renewal in China: Spontaneous online opinions, reginal characteristics, and government responsiveness. Cities 2024, 148, 104857. [Google Scholar] [CrossRef]
  9. Cao, K.; Harris, R.; Liu, S.; Deng, Y. How does urban renewal affect residential segregation in Shenzhen, China? A multi-scale study. Sustain. Cities Soc. 2024, 102, 105228. [Google Scholar] [CrossRef]
  10. Sun, H.; Wang, Y.; Li, R.; Wu, H.; Wang, Y. Research on the Dynamic Evolution of Social Risks in Community Renewal Projects: Considering the Coupling Effects of Factors. J. Manage. Eng. 2024, 40, 04024043. [Google Scholar] [CrossRef]
  11. Wang, D.; Li, S. Social conflicts and their resolution paths in the commercialized renewal of old urban communities in China under the perspective of public value. J. Urban Manag. 2024, in press. [Google Scholar] [CrossRef]
  12. Xie, H.; Zhang, L.; Cui, P.; Yuan, J.; Li, Q. Exploring the Evolution Mechanisms of Social Risks Associated with Urban Renewal from the Perspective of Stakeholders. Buildings 2024, 14, 14051470. [Google Scholar] [CrossRef]
  13. Liu, G.; Wei, L.; Gu, J.; Zhou, T.; Liu, Y. Benefit distribution in urban renewal from the perspectives of efficiency and fairness: A game theoretical model and the government’s role in China. Cities 2020, 96, 102422. [Google Scholar]
  14. Wang, H.; Long, Z.; Jia, K.; Zhang, X.; Liang, X. Tactics to Balance Benefits among Stakeholders in Government-Led Urban Renewal: Case Study in Guangzhou, China. J. Urban Plan. Dev. 2024, 150, 05024034. [Google Scholar]
  15. Zhang, W.; Zhang, X.; Wu, G. The network governance of urban renewal: A comparative analysis of two cities in China. Land Use Policy 2021, 106, 105448. [Google Scholar] [CrossRef]
  16. Cheng, H.-T.; Chang, H.-S. A spatial DEA-Based framework for analyzing the effectiveness of disaster risk reduction policy implementation: A case study of earthquake-oriented urban renewal policy in Yongkang, Taiwan. Sustainability 2018, 10, 10061751. [Google Scholar] [CrossRef]
  17. Huang, L.; Zheng, W.; Hong, J.; Liu, Y.; Liu, G. Paths and strategies for sustainable urban renewal at the neighbourhood level: A framework for decision-making. Sustain. Cities Soc. 2020, 55, 102074. [Google Scholar]
  18. Kamble, T.; Bahadure, S. Neighborhood sustainability assessment in developed and developing countries. Environ. Dev. Sustain. 2019, 22, 4955–4977. [Google Scholar] [CrossRef]
  19. Li, F.; Lynam, A.; Huang, H.; Wei, J. Institutional co-production at neighbourhood scale: Cases of urban renewal for Shanghai’s ageing population. Habitat. Int. 2024, 144, 103000. [Google Scholar] [CrossRef]
  20. Huo, X.; Xue, H.; Jiao, L. Risk management of retrofit project in old residential areas under green development. Energy Build. 2023, 279, 112708. [Google Scholar]
  21. Mai, Y.; Wu, J.; Zhang, Q.; Liang, Q.; Ma, Y.; Liu, Z. Confront or comply? Managing social risks in China’s urban renewal projects. Sustainability 2022, 14, 141912553. [Google Scholar] [CrossRef]
  22. Koc, K.; Okudan, O. Assessment of life cycle risks of deconstruction in urban regeneration projects. J. Constr. Eng. Manag. 2021, 147, 04021137. [Google Scholar] [CrossRef]
  23. Yu, T.; Shen, G.Q.; Shi, Q.; Lai, X.; Li, C.Z.; Xu, K. Managing social risks at the housing demolition stage of urban redevelopment projects: A stakeholder-oriented study using social network analysis. Int. J. Proj. Manag. 2017, 35, 925–941. [Google Scholar]
  24. Liu, G.; Li, X.; Tan, Y.; Zhang, G. Building green retrofit in China: Policies, barriers and recommendations. Energy Policy 2020, 139, 111356. [Google Scholar]
  25. Liu, Z.; Wang, S.; Wang, F. Isolated or integrated? Planning and management of urban renewal for historic areas in Old Beijing city, based on the association network system. Habitat. Int. 2019, 93, 102049. [Google Scholar]
  26. Hiremath, R.B.; Balachandra, P.; Kumar, B.; Bansode, S.S.; Murali, J. Indicator-based urban sustainability—A review. Energy Sustain. Dev. 2013, 17, 555–563. [Google Scholar]
  27. Zhao, X.; Hwang, B.-G.; Gao, Y. A fuzzy synthetic evaluation approach for risk assessment: A case of Singapore’s green projects. J. Clean. Prod. 2016, 115, 203–213. [Google Scholar]
  28. Chiu, M.; Tai, P.; Chu, C. Developing a smart green supplier risk assessment system integrating natural language processing and life cycle assessment based on AHP framework: An empirical study. Resour. Conserv. Recycl. 2024, 207, 107671. [Google Scholar]
  29. Asadi, P.; Zeidi, J.R.; Mojibi, T.; Yazdani-Chamzini, A.; Tamošaitienė, J. Project Risk Evaluation by Using a New Fuzzy Model Based on Elena Guideline. J. Civ. Eng. Manag. 2018, 24, 284–300. [Google Scholar]
  30. Wu, Y.; Zhou, J. Risk assessment of urban rooftop distributed PV in energy performance contracting (EPC) projects: An extended HFLTS-DEMATEL fuzzy synthetic evaluation analysis. Sustain. Cities Soc. 2019, 47, 101524. [Google Scholar]
  31. Cao, P.; Lei, X. Evaluating risk in prefabricated building construction under EPC contracting using structural equation modeling: A case study of Shaanxi Province, China. Buildings 2023, 13, 131465. [Google Scholar] [CrossRef]
  32. Wang, Y.; Gong, E.; Zhang, Y.; Yao, Y.; Zhou, X. Risk assessment of infrastructure REITs projects based on cloud model: A case study of China. Eng. Constr. Archit. Manag. 2023, 31, 4330–4352. [Google Scholar] [CrossRef]
  33. Wuni, I.Y. Developing a multidimensional risk assessment model for sustainable construction projects. Eng. Constr. Archit. Manag. 2024. ahead-of-print. [Google Scholar] [CrossRef]
  34. Yazdani, M.; Abdi, M.R.; Kumar, N.; Keshavarz-Ghorabaee, M.; Chan FT, S. Improved Decision Model for Evaluating Risks in Construction Projects. J. Constr. Eng. Manag. 2019, 145, 04019024. [Google Scholar] [CrossRef]
  35. Zhai, W.; Ding, J.; Ding, L. Investment Risk Grade Evaluation of New Town Construction PPP Projects: Perspective from Private Sector. J. Urban Plan. Dev. 2021, 147, 040021005. [Google Scholar] [CrossRef]
  36. Nguyen, H.D.; Macchion, L. A comprehensive risk assessment model based on a fuzzy synthetic evaluation approach for green building projects: The case of Vietnam. Eng. Constr. Archit. Manag. 2022, 30, 2837–2861. [Google Scholar] [CrossRef]
  37. Chen, H.; Wang, J.; Feng, Z.; Liu, Y.; Xu, W.; Qin, Y. Research on the risk evaluation of urban wastewater treatment projects based on an improved fuzzy cognitive map. Sustain. Cities Soc. 2023, 98, 104796. [Google Scholar] [CrossRef]
  38. Yu, R.; Ma, L. Risk evaluation of mega infrastructure construction supply chain in engineering-procurement-construction projects: An integrated fuzzy AHP and fuzzy DEMATEL approach. Eng. Constr. Archit. Manag. 2024. ahead-of-print. [Google Scholar] [CrossRef]
  39. Chou, J.-S.; Chang, Y.-H.; Molla, A.; Chong, W.O. Determining critical success factors for residential reconstruction in the urban city from the perspective of developers. Sustain. Cities Soc. 2023, 99, 104977. [Google Scholar] [CrossRef]
  40. Lai, Y.; Feng, X.; Ma, T. Green retrofit of existing residential buildings in China: An investigation on residents’ perceptions. Energy Environ. 2022, 33, 332–353. [Google Scholar] [CrossRef]
  41. Zhang, Y.; Wang, S.; Wang, C.; Luo, X. Risk identification and analysis for the green redevelopment of industrial brownfields: A social network analysis. Environ. Sci. Pollut. Res. Int. 2023, 30, 30557–30571. [Google Scholar] [PubMed]
  42. Chen, Y.; Han, Q.; Liu, G.; Wu, Y.; Li, K.; Hong, J. Determining Critical Success Factors of Urban Renewal Projects: Multiple Integrated Approach. J. Urban Plan. Dev. 2022, 148, 04021058. [Google Scholar]
  43. Bai, L.; Shi, H.; Kang, S.; Zhang, B. Project portfolio risk analysis with the consideration of project interdependencies. Eng. Constr. Archit. Manag. 2021, 30, 647–670. [Google Scholar] [CrossRef]
  44. Bai, L.; Song, C.; Zhou, X.; Tian, Y.; Wei, L. Assessing project portfolio risk via an enhanced GA-BPNN combined with PCA. Eng. Appl. Artif. Intel. 2023, 126, 106779. [Google Scholar]
  45. Zhu, S.; Li, D.; Jiang, Y. The impacts of relationships between critical barriers on sustainable old residential neighborhood renewal in China. Habitat. Int. 2020, 103, 102232. [Google Scholar] [CrossRef]
  46. Bai, L.; Xie, Q.; Lin, J.; Liu, S.; Wang, C.; Wang, L. Dynamic selection of risk response strategies with resource allocation for construction project portfolios. Comput. Ind. Eng. 2024, 191, 110116. [Google Scholar]
  47. Gu, H. Differential impacts of urban revitalization projects on land prices: A case study of Seongnam, South Korea. Cities 2024, 154, 105256. [Google Scholar]
  48. Zhang, B.; Bai, L.; Zhang, K.; Kang, S.; Zhou, X. Dynamic assessment of project portfolio risks from the life cycle perspective. Comput. Ind. Eng. 2023, 176, 108922. [Google Scholar]
  49. Ghasemi, F.; Sari MH, M.; Yousefi, V.; Falsafi, R.; Tamošaitienė, J. Project Portfolio Risk Identification and Analysis, Considering Project Risk Interactions and Using Bayesian Networks. Sustainability 2018, 10, 10051609. [Google Scholar] [CrossRef]
  50. Liu, S.; Forrest, J.; Vallee, R. Emergence and development of grey systems theory. Kybernetes 2009, 38, 1246–1256. [Google Scholar]
  51. Chen, C.-S.; Chiu, Y.-H.; Tsai, L. Evaluating the adaptive reuse of historic buildings through multicriteria decision-making. Habitat. Int. 2018, 81, 12–23. [Google Scholar]
  52. Huo, X.; Hao, T.; Jiao, L. Critical risk factors of public building green retrofit projects—An empirical study in Chongqing, China. J. Asian. Archit. Build. 2023, 1–13. [Google Scholar] [CrossRef]
  53. Fu, X.; Liu, G.; Wu, H.; Zhuang, T.; Huang, R.; Yuan, F.; Zhang, Y. Dissecting behavioral inertia in shaping different resident participation behaviors in neighborhood regeneration: A quantitative behavioral experiment. EIA. Rev. 2024, 109, 107632. [Google Scholar]
  54. Zhou, Y.; Lan, F.; Zhou, T. An experience-based mining approach to supporting urban renewal mode decisions under a multi-stakeholder environment in China. Land Use Policy 2021, 106, 105428. [Google Scholar]
  55. Cordeiro TA, A.; Ferreira FA, F.; Spahr, R.W.; Sunderman, M.A.; Ferreira NC MQ, F. Enhanced planning capacity in urban renewal: Addressing complex challenges using neutrosophic logic and DEMATEL. Cities 2024, 150, 105006. [Google Scholar]
Figure 1. Risk evaluation framework of area-wide coordinated urban regeneration.
Buildings 15 00983 g001
Figure 2. Location of Chaoyang area, Tinghu District, Yancheng, China.
Buildings 15 00983 g002
Table 1. Risk indicator system of area-wide coordinated urban regeneration.
DimensionNo.Risk IndicatorJustification
Single project level F 11 Project demolition coordination risk[12,23,38,39]
F 12 The technical personnel of relevant units are inexperienced[12,20,36,40,41]
F 13 Project stakeholder conflict[12,13,41,42,43,44]
F 14 Project financing difficulties[20,23,43,44,45,46]
F 15 Project costs and benefits are difficult to predict accurately[20,36,40,42,44,47,48]
F 16 Project budget overruns[20,23,36,43]
F 17 The project lacks public support[23,36,45]
Multi-project area level F 21 There is insufficient coordination between projects[36,43,46,49]
F 22 Lack of high-quality cooperation among project managers[36,43,45,48]
F 23 The overall coordinated progress of multiple urban regeneration projects lags behind[2,23,43,44]
F 24 Multi-project resource coordination risk[2,43,46,49]
F 25 Low resource sharing among projects[2,43,44,48,49]
F 26 The planning and design of the urban regeneration area are unreasonable[12,23,41,45,48]
F 27 The operation effect of the area-wide coordinated urban regeneration is not good[12,25,36,41]
Environmental system level F 31 Alterations in incentive policies and corresponding standards[12,20,36,41,45]
F 32 Urban regeneration related laws and policies are not perfect[20,39,45]
F 33 Force majeure of the natural environment[12,23,41]
F 34 There is insufficient support within the government[41,45]
F 35 Construction operation and residents’ life cross risk[12,20,41,46]
F 36 The history and culture of the area-wide coordinated urban regeneration have been destroyed[12,23,41]
F 37 The external environment of relevant policies has changed[12,36,45]
Table 2. Establish the whitenization weight function.
Evaluation Grey CategoryGrey Number ⊗Whitenization Weight Function
e = 1 1 0 , 9 , f 1 d i j k = d i j k 9 , d i j k 0 , 9     1 ,   d i j k 9 ,     0 , d i j k 0 ,    
e = 2 2 0 , 7 , 14 f 2 d i j k = d i j k 7 , d i j k 0 , 7     2 d i j k 7 ,   d i j k 7 , 14   0 , d i j k 0 , 14
e = 3 3 0 , 5 , 10 f 3 d i j k = d i j k 5 , d i j k 0 , 5     2 d i j k 5 ,   d i j k 5 , 10   0 , d i j k 0 , 10
e = 4 4 0 , 3 , 6 f 4 d i j k = d i j k 3 , d i j k 0 , 3     2 d i j k 6 ,   d i j k 3 , 6   0 , d i j 0 , 6
e = 5 5 0,1 , 2 f 5 d i j k = 1 , d i j k 0 , 1     2 d i j k ,   d i j k 1 , 2   0 , d i j k 0 , 2
Table 3. Risk level division of area-wide coordinated urban regeneration.
Value RangeRisk Level
(8, 10]Very High
(6, 8]High
(4, 6]Commonly
(2, 4]Low
(0, 2]Very Low
Table 4. Certain characteristics of the six experts.
NoAgeEducationWork
1 > 40Master of engineering managementGovernment officer of “Property Supervision and Management” under the “Housing and Urban Rural Development Bureau”
2 > 45Master of architectural engineeringWorks at a project management company on urban regeneration projects
3 > 50Doctor of management science and engineeringWorks at a university as a professor in sustainable urban regeneration
4 > 45Doctor of urban planning and developmentWorks at an institute of urban–rural construction and development
5 > 45Doctor of project managementWorks at a university as a professor in urban regeneration project management
6 > 40Doctor of management science and engineeringWorks at a university as a professor in sustainable urban development
Table 5. Risk indicator weight score of the coordinated regeneration of the Chaoyang area.
IndicatorExpert Number
123456
F 11 91099109.5
F 12 5.565554.5
F 13 987898.5
F 14 8.59910109.5
F 15 78576.55.5
F 16 66776.57.5
F 17 454565.5
F 21 4645.566
F 22 65455.55
F 23 6756.577.5
F 24 784887.5
F 25 674687
F 26 87455.56.5
F 27 997999.5
F 31 89788.59
F 32 888.5999.5
F 33 3444.555.5
F 34 8.5958.599.5
F 35 34655.56
F 36 23545.54.5
F 37 6.5756.57.55.5
Table 6. Risk indicator weight coefficient of the coordinated regeneration of the Chaoyang area.
Primary IndicatorWeightSecondary IndicatorWeight
Single project level0.284 F 11 0.186
F 12 0.101
F 13 0.165
F 14 0.186
F 15 0.131
F 16 0.133
F 17 0.098
Multi-project area level0.355 F 21 0.118
F 22 0.110
F 23 0.144
F 24 0.164
F 25 0.140
F 26 0.130
F 27 0.194
Environmental system level0.361 F 31 0.182
F 32 0.190
F 33 0.095
F 34 0.190
F 35 0.112
F 36 0.091
F 37 0.140
Disclaimer/Publisher’s Note: The statements, opinions and data contained in all publications are solely those of the individual author(s) and contributor(s) and not of MDPI and/or the editor(s). MDPI and/or the editor(s) disclaim responsibility for any injury to people or property resulting from any ideas, methods, instructions or products referred to in the content.

