Article

Study on Shear Resistance of Composite Interface of Steel Truss Ceramsite Concrete and Finite Element Simulation

1
School of Civil Engineering, University of South China, Hengyang 421200, China
2
Hunan Engineering Research Center of Development and Application of Ceramsite Concrete Technology, Hunan City University, Yiyang 413000, China
*
Author to whom correspondence should be addressed.
Buildings 2025, 15(6), 981; https://doi.org/10.3390/buildings15060981
Submission received: 18 February 2025 / Revised: 16 March 2025 / Accepted: 17 March 2025 / Published: 20 March 2025
(This article belongs to the Section Building Structures)

Abstract

This study investigates the shear behavior of steel truss ceramsite concrete composite interfaces through double-sided direct shear tests and finite element simulations. The results reveal three distinct shear response phases: elastic deformation, plastic softening, and full yielding. The interfacial shear capacity arises from synergistic contributions of bond strength, friction, and truss reinforcement action. Comparative analysis of design codes identifies Eurocode 2 as providing an optimal alignment with the experimental data. An ABAQUS-based finite element model incorporating a cohesive spring composite interface mechanism confirms the model’s reliability. The findings validate Eurocode 2 for ceramsite concrete interface design and propose single-row truss configurations as economically efficient solutions for lightweight high-strength composite structures. The research results are aimed at providing a theoretical basis for the design optimization and code revision of ceramsite concrete composite structures, and promoting the wide application of lightweight high-strength concrete in sustainable buildings.

1. Introduction

Concrete composite structures, which combine the high construction efficiency of prefabricated components and the strong integrity of cast-in-place structures, have been widely used in the fields of prefabricated buildings, bridge reinforcement, and existing structure renovation. The composite interface, as the key part where new and old concrete work together under load, directly determines the overall load-bearing capacity and durability of the structure. However, due to the differences in material properties between new and old concrete, changes in interface roughness, shrinkage and creep effects, and construction processes, the composite interface is prone to becoming the weak link in the structure, which may cause interface slippage, shear crack propagation, and even overall failure. In recent years, with the promotion of lightweight high-strength ceramsite concrete, its potential in reducing structural self-weight, improving seismic performance, and reducing carbon emissions has attracted much attention [1,2,3,4,5,6]. Research on concrete composite structures has made significant progress. Various scholars have studied the bond–slip behavior, shear–friction mechanisms, and the function of steel truss reinforcement at the composite interface in depth [7,8,9,10,11,12]. Yet, despite enriching the theoretical basis, some issues remain. First, the shear performance of ceramsite concrete composite interfaces, especially under diverse conditions and reinforcement schemes, needs systematic investigation. Second, the applicability of existing design codes to ceramsite concrete composite structures is unverified, hindering their practical use. Additionally, numerical simulation techniques face challenges in modeling the complex mechanical behavior of composite interfaces, requiring further development and model optimization. These gaps and challenges set the context and direction for the present study.
The mechanical properties of the interface between new and old concrete, especially the shear strength, have a crucial impact on the safety and durability of concrete structures. Many scholars have conducted in-depth research on this. Zhang, J. H. et al. [13], Liu, J. et al. [14], Wu, F. et al. [15], Monserrat-López et al. [16], Qian, P. et al. [17], and Liu, C. et al. [18] focused on the bond–slip and shear–friction mechanisms of the interface between new and old concrete, and established shear strength prediction models that included the interface treatment method. They also analyzed the role of concrete strength in the shear-bearing capacity. The results showed that increasing concrete strength could significantly enhance the shear-bearing capacity. Peng, H. D. et al. [19], Vasiliki Palieraki et al. [20], Hongbing Zhu et al. [21], Tian, J. et al. [22], and Xia, J. et al. [23] investigated the bond performance of new and old concrete under the condition of planted reinforcement, and analyzed the influence of the interface reinforcement ratio and reinforcement yield strength on the shear-bearing capacity. The results showed that planted reinforcement could greatly improve the interface shear performance, and that the number and diameter of planted reinforcement had a significant impact on the shear strength. He et al. [24], Espeche et al. [25], Rashid et al. [26], Fan, J. et al. [27], Daneshvar, D. et al. [28], Bai, M. et al. [29], and Qasim, M.et al. [30] studied the influence of different interface roughness and interface agent types on the interface shear strength, and found that an increase in interface roughness could significantly improve the shear strength.
In addition, Hongbing Zhu et al. [21] and Zhu, H. et al. [31] used full-light ceramsite concrete to repair ordinary concrete and tested its interface bonding properties. Mo, K. H. et al. [32] proposed a model that could sufficiently predict the experimental bond stress–slip curve of lightweight and ordinary concrete. Based on the surface roughness parameter, Costa, H. et al. [33] proposed expressions for predicting the cohesion and friction coefficients of lightweight and ordinary concrete, providing a basis for more accurate evaluation of interface performance. Čairović, Đ. et al. [34] studied the interface shear performance between lightweight concrete and ordinary concrete layers cast at different times. Gołdyn, M. et al. [35] pointed out that artificial chiseling was easy to cause the aggregate of lightweight concrete to break, and suggested using non-destructive interface treatment techniques such as high-pressure water jets. Zhuangcheng Fang et al. [36] and Martins, R. et al. [37] studied the interface shear behavior of composite beams using lightweight concrete, and found that the change in interface height had a significant impact on the distribution of normal stress and shear stress. They proposed more accurate equations to predict the interface shear strength of composite concrete beams. These studies provided important references for the application of lightweight concrete.
In conclusion, the research on the mechanical properties of the interface between new and old concrete not only focuses on its shear strength but also involves the impact of different materials and repair processes, which provides important references for this study. Despite the important progress made in the existing research, the following issues still need to be resolved: (1) The bonding mechanism of ceramsite concrete interface is different from that of ordinary concrete due to the porous characteristics of the aggregate, and the applicability of the existing code formulas lacks systematic verification; (2) The influence of the arrangement form of steel truss (such as the number and angle of web members) on the interface shear stiffness and failure mode is not clear; (3) The simulation accuracy of the bond–friction composite behavior at the interface in the finite element model needs to be improved, and a refined modeling method of the interaction between ceramsite concrete and the reinforcement especially needs to be perfected. Based on this, this study takes the composite interface of steel truss ceramsite concrete as the object, and systematically analyzes the evolution law and failure characteristics of the interface shear-bearing capacity by designing six groups of double-sided direct shear specimens with different reinforcement ratios. The applicability of the European code [38], ACI 318 [39], CSA A23.3 [40], and Chinese code [41] is assessed by comparing their predicted results. Furthermore, an ABAQUS finite element model is established, and the interface bond–slip behavior is simulated using the cohesive spring composite model to verify the consistency of the numerical simulation and the test results. The research results are aim to provide a theoretical basis for the design optimization and code revision of ceramsite concrete composite structures, and to promote the wide application of lightweight high-strength concrete in sustainable buildings. This study’s flowchart is shown in Figure 1.

2. Experimental Overview

2.1. Specimen Design

As shown in Figure 2, two identical ceramsite concrete precast slabs were symmetrically placed vertically to form side molds, and then the ceramsite concrete was cast in situ in the middle. The upper and lower chord reinforcements were HRB400 steel bars with a diameter of 8 mm, and the web reinforcements were HPB300 steel bars with a diameter of 6 mm. The specimen consisted of two composite interfaces, and direct shear tests were conducted by applying loads to the cast-in-place composite layer. Table 1 provides the dimensional parameters of all specimens, where m represents the number of rows of the reinforcement truss. To investigate the effect of the reinforcement truss on the shear-bearing capacity of ceramsite concrete composite slabs, the number of rows was set to 0, 1, and 2, respectively. This selection of reinforcement ratios allows for a systematic examination of the impact of truss reinforcement on the shear behavior, ranging from an un-reinforced baseline to an increasingly reinforced configurations. The physical meanings of the other parameters are shown in Figure 2. Figure 3 illustrates the binding conditions of the reinforcement truss before casting the precast slabs and the roughness conditions before casting the composite slabs. The roughness values are shown in Table 2, where Roughness 1 and Roughness 2 represent the roughness of the two composite interfaces, respectively, meeting the requirements of current standards [42].

2.2. Loading Scheme

The experiments were conducted using a 100-ton universal testing machine in the structural laboratory of Hunan City University, with geometric and physical alignments performed before the loading tests. As shown in Figure 4, the shear capacity tests of the composite interfaces were carried out by placing the precast slabs on both sides of the specimen on supports. A distribution plate was used to apply the actuator’s force relatively uniformly on the post-cast composite layer to prevent local bearing failure. As illustrated in Figure 4b, four displacement measurement points were symmetrically arranged on the front and back of the post-cast composite layer.

3. Results and Analysis

3.1. Experimental Phenomena and Failure Characteristics

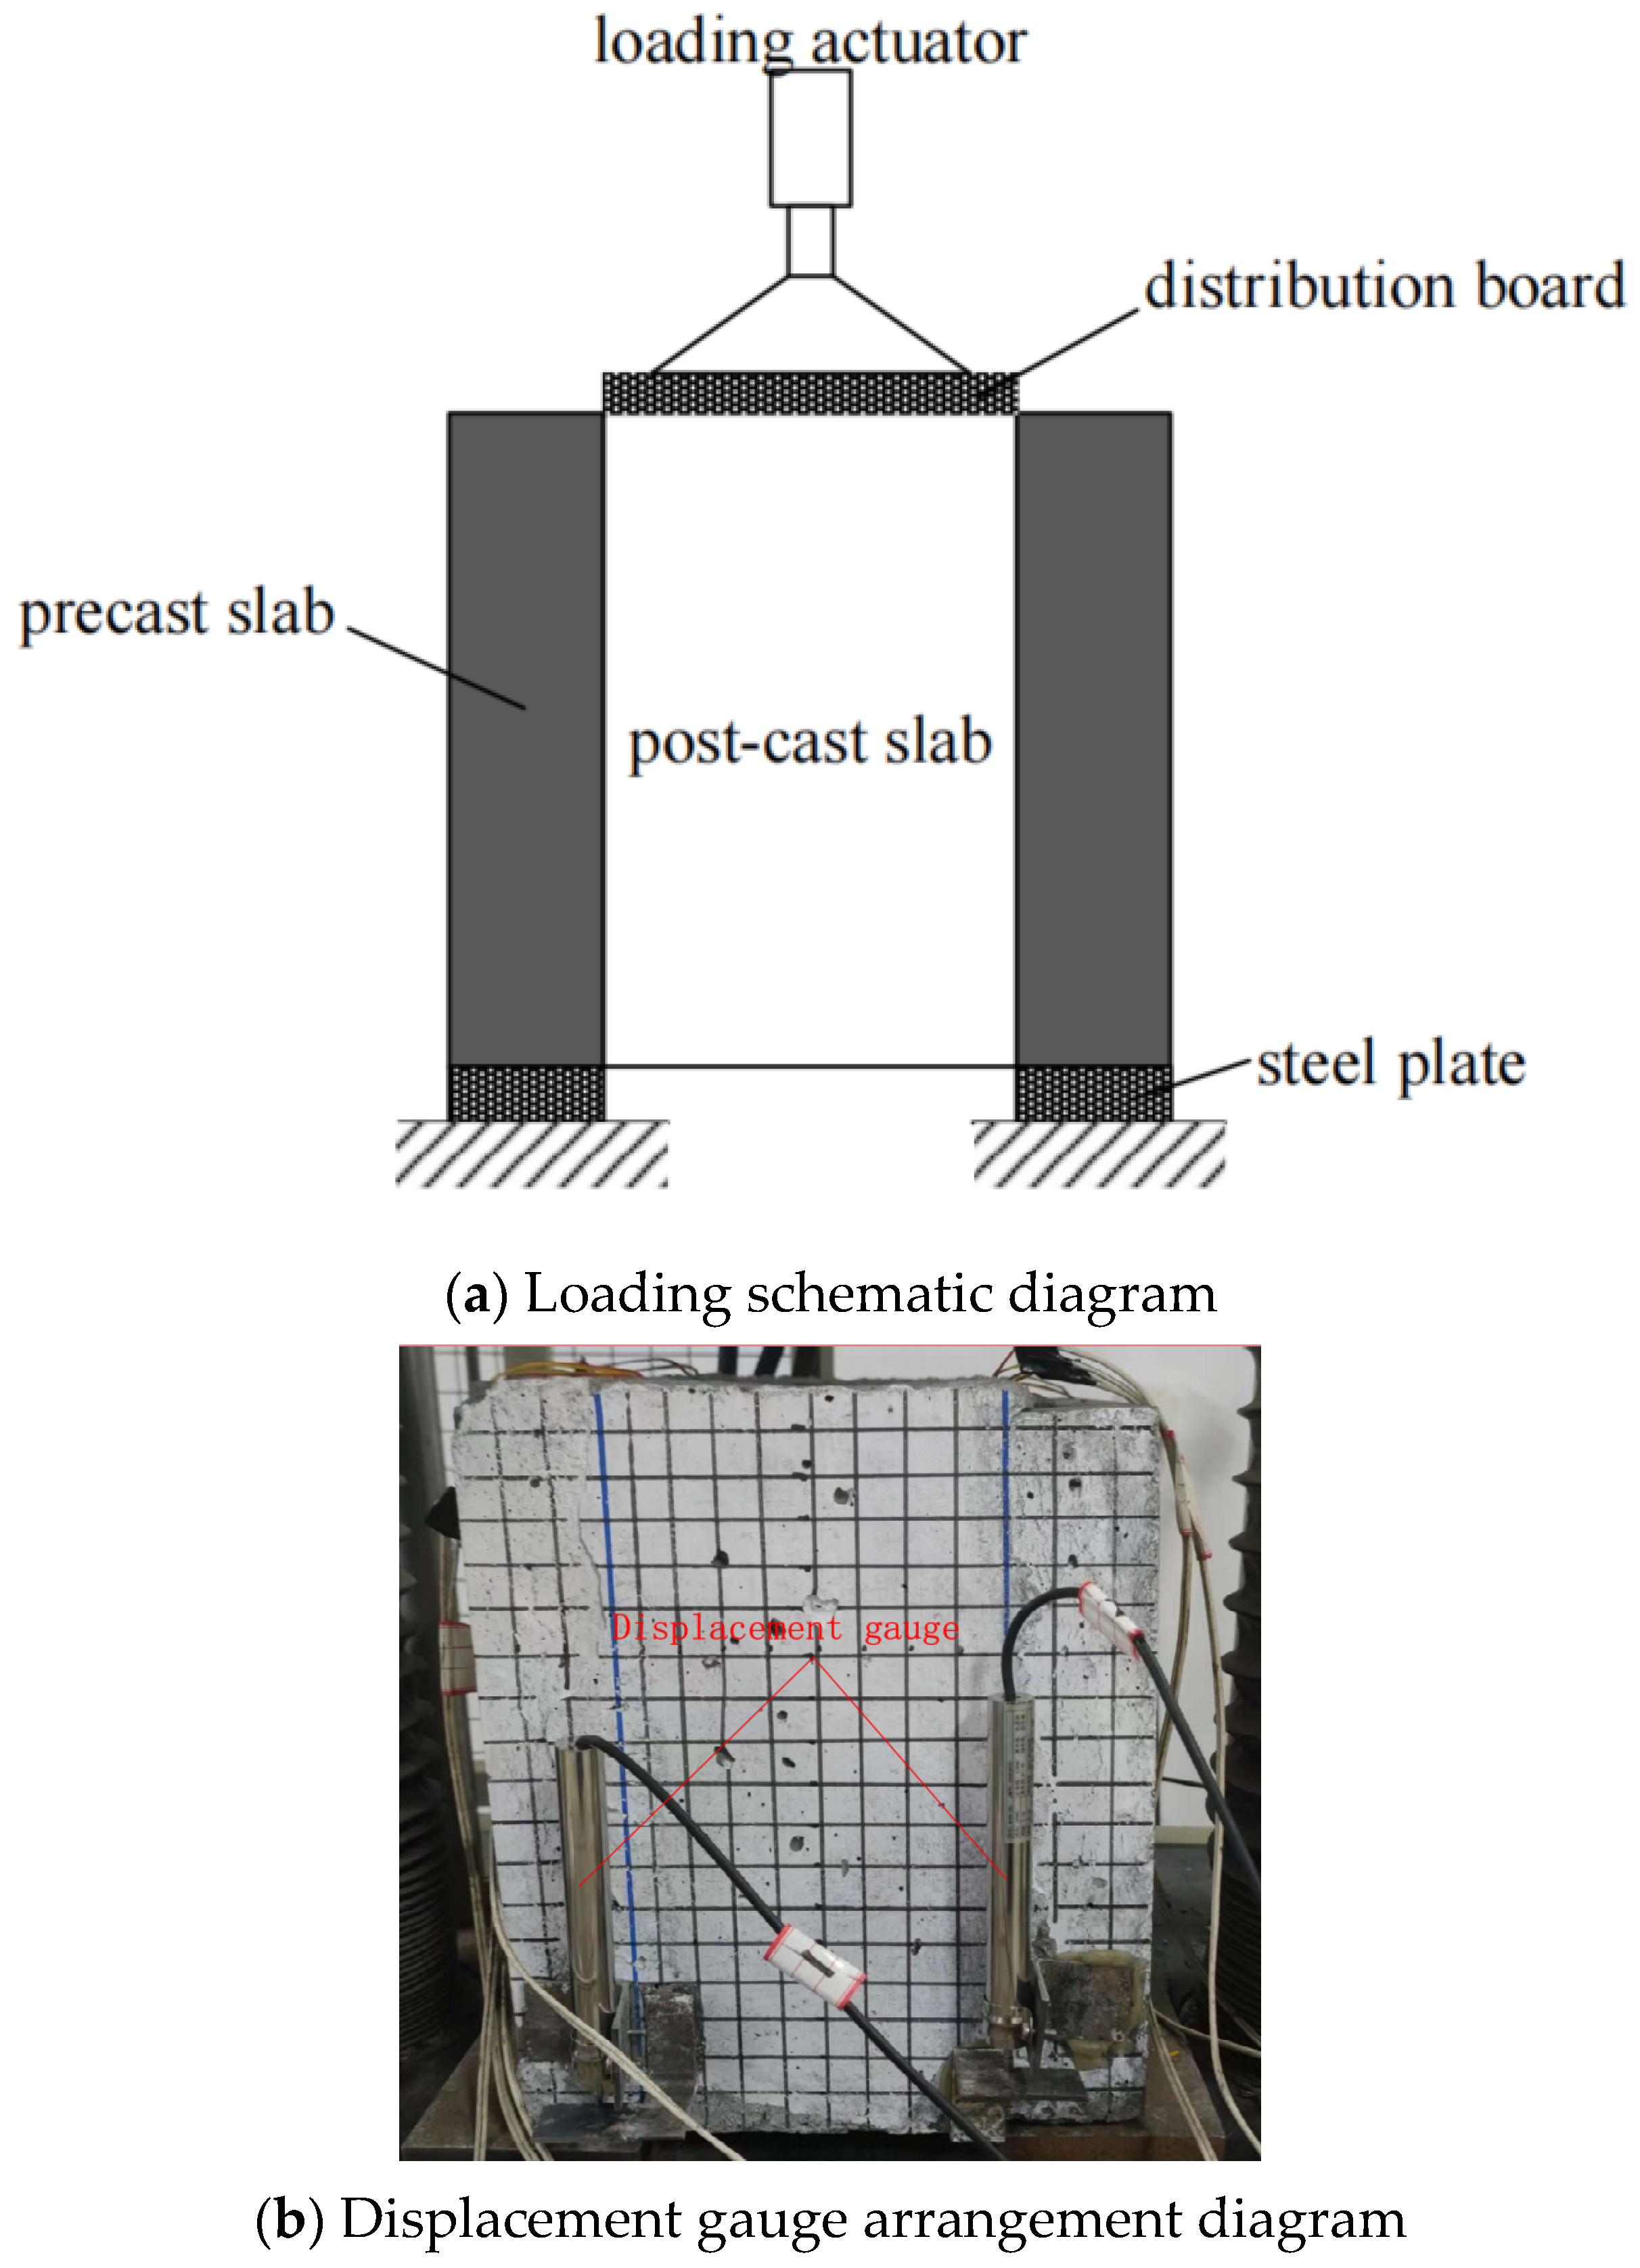
The experimental results show that all specimens failed in a brittle manner, and their failure modes were basically consistent. Taking specimen TH3-2 as an example, from the beginning of loading until failure, there were no obvious signs of damage. When the load reached the ultimate load of 571.9 kN (the shear force on the composite interface was 571.9 kN/2 = 285.95 kN), the specimen suddenly emitted a dull sound, and a full-length vertical crack appeared on both sides of the composite interface. Thereafter, the load rapidly decreased, the displacement continued to increase, and the specimen lost its bearing capacity.
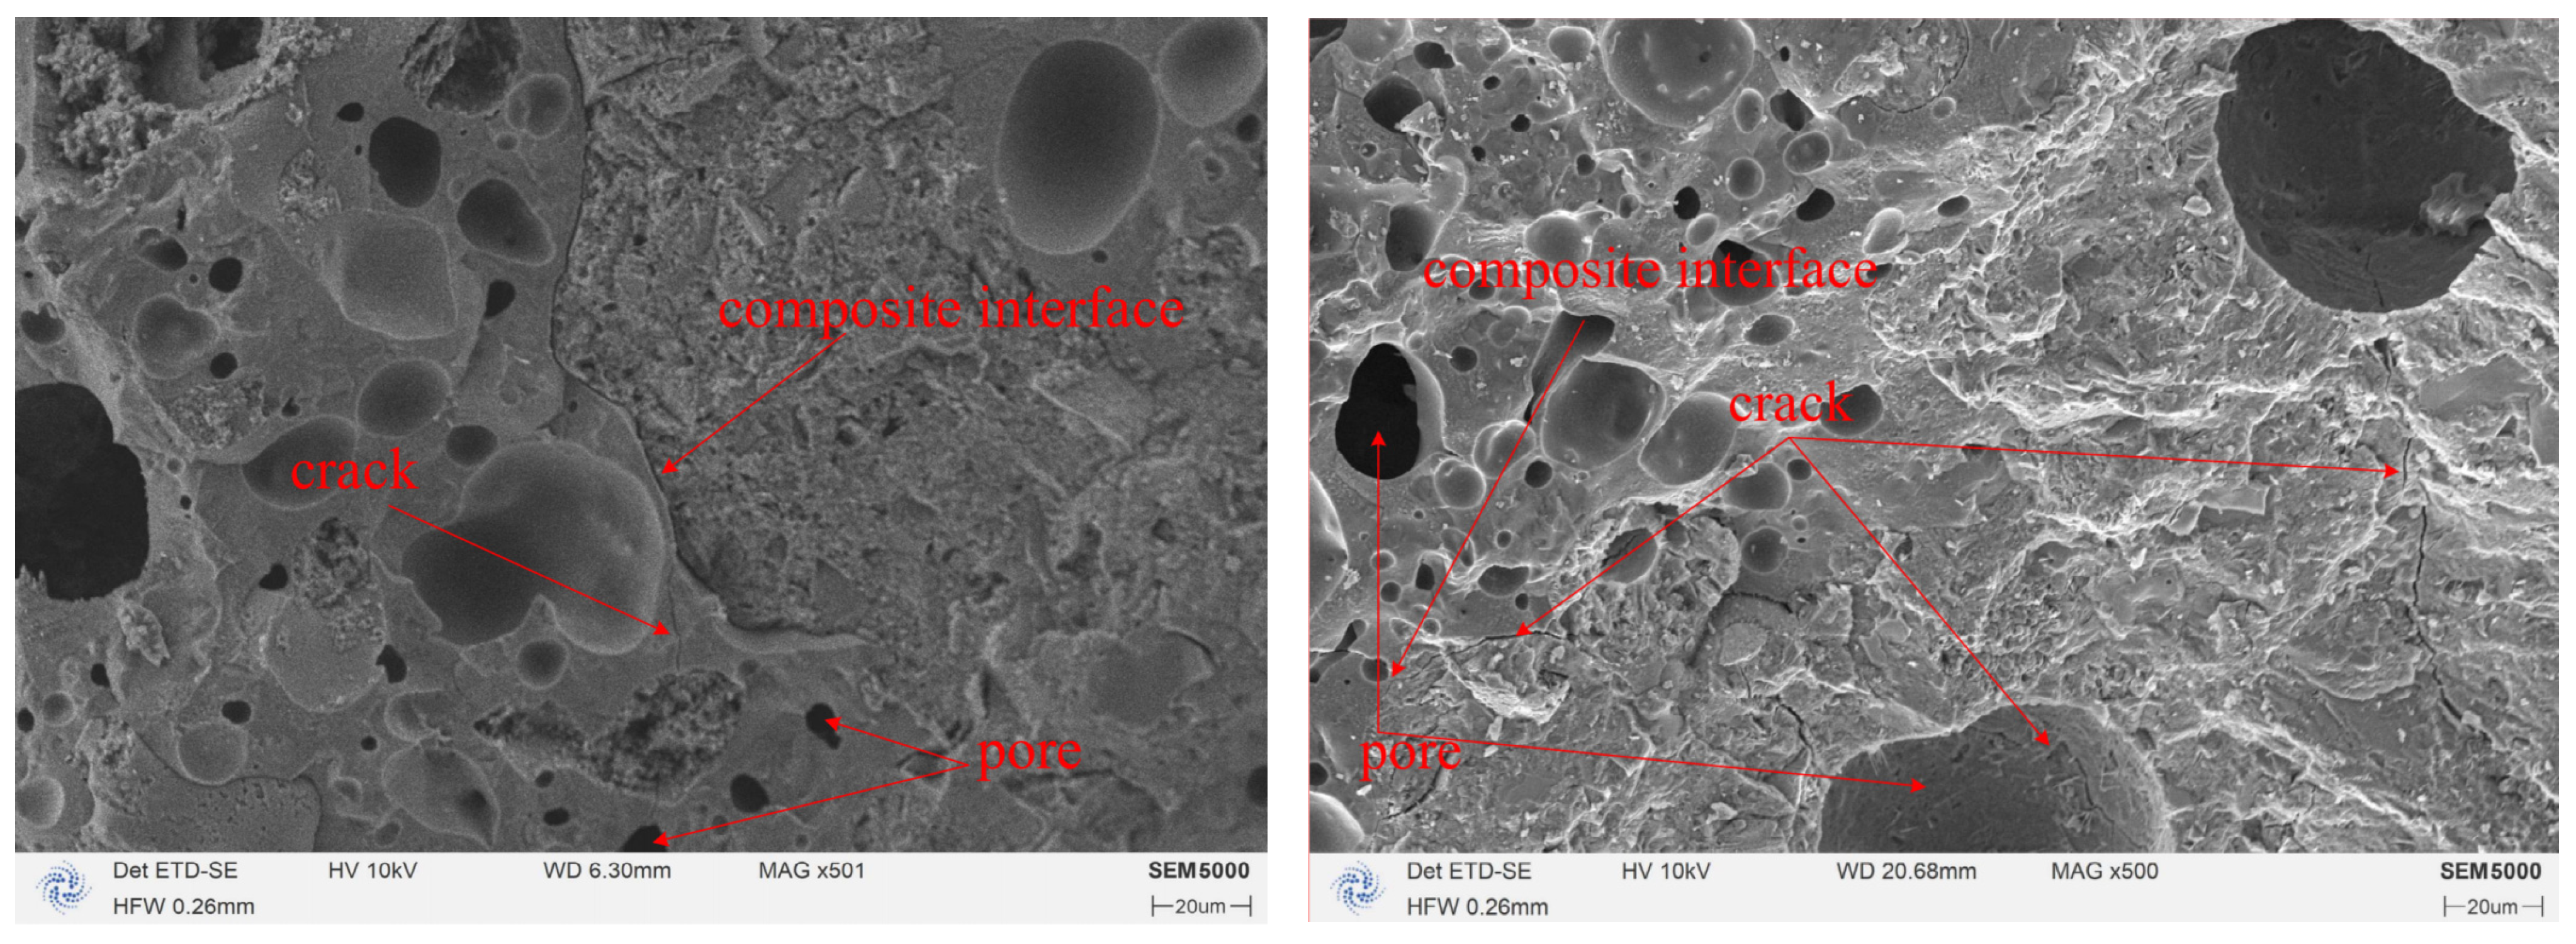
During loading, shear stress was generated within the loading plane of the specimen, and its direction was parallel to the loading direction. Concrete is a composite material composed of porous, multiphase substances with cracks, and there are potential internal defects in its structure. The failure of the concrete structure begins with the initiation of cracking due to high stress concentration around these potential microcracks under load. After a relatively stable crack development process, it expands into unstable cracks, eventually leading to complete failure of the concrete structure. As shown in Figure 5, the SEM characterization of the ceramsite concrete specimen after failure clearly reveals that concrete is a porous and multiphase material. Crack propagation predominantly occurs at pores or interfaces. When the shear stress reaches the ultimate failure value, the specimen is sheared into two halves. The failure mechanism of the composite concrete bonded specimens is basically the same as that of monolithically cast concrete, except that the internal potential defects are more severe and the internal stress is more complex. Therefore, the mechanical properties of composite concrete bonded specimens are lower than those of monolithically cast concrete. The main failure mode of each specimen is the relative slip between the new and old concrete on both sides of the composite interface, and cracks appear along the shear direction on the composite interface.
The mechanical behavior of the reinforced truss ceramsite concrete composite interface can be divided into three stages:
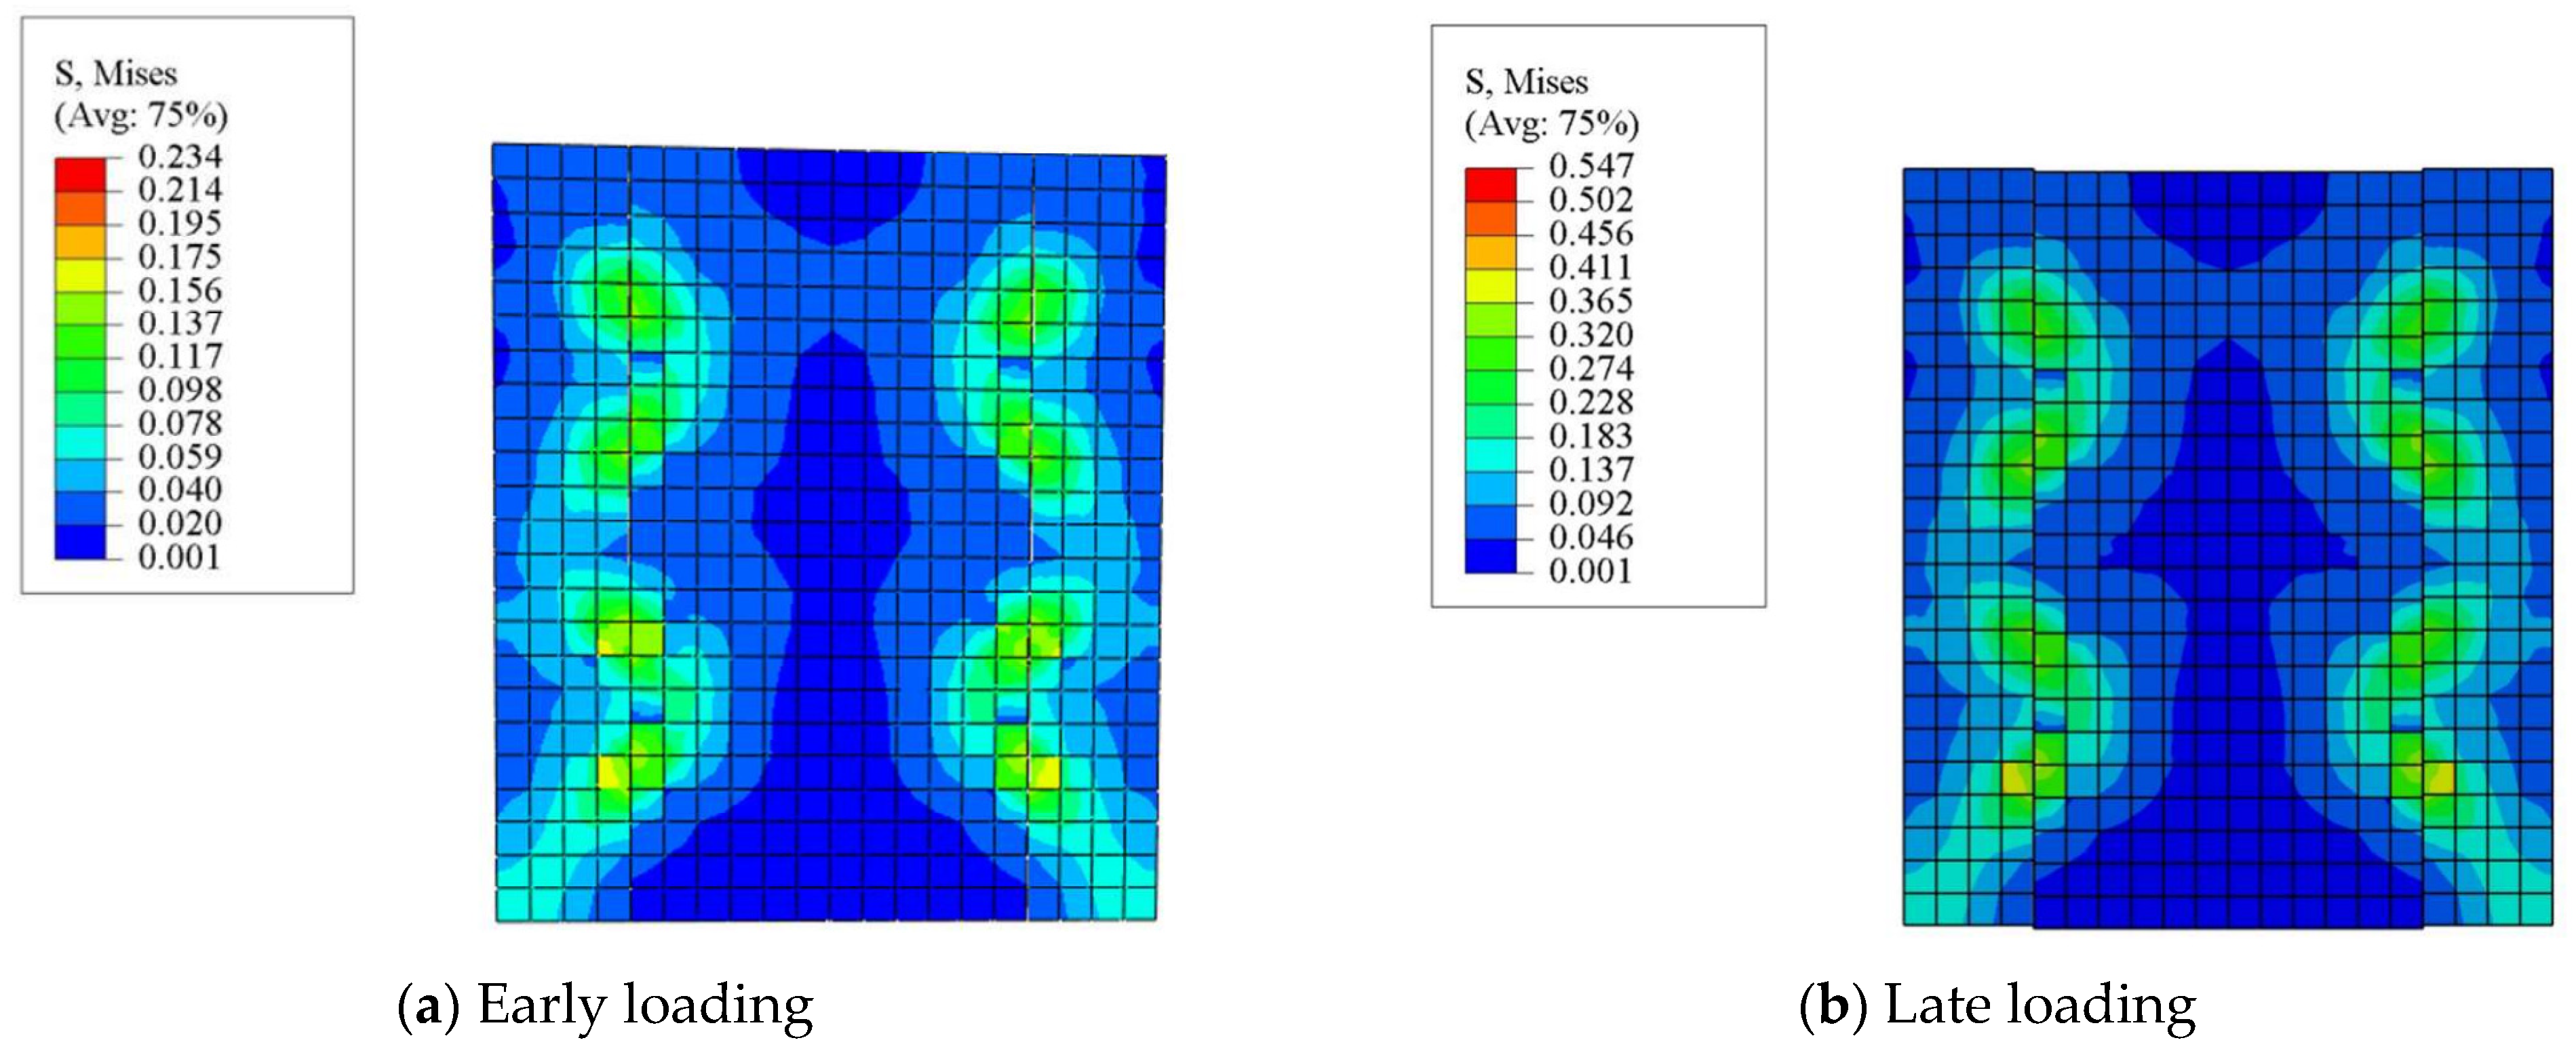
First Stage: In the early stage of loading, before cracks appear on the composite interface between new and old concrete and within the concrete itself, the interface slip only involves the shear deformation of the interface concrete. At this time, the stiffness of the interface is large, so the slip between interfaces is very small, which is also reflected in the experiment—the collected data show that the maximum displacement at ultimate bearing capacity is only 0.15 mm. As the load continues to increase, since the load is applied to the new concrete, due to the combined action of compression and shear, the new concrete transfers the shear force at the interface to the old concrete through the truss reinforcement. The concentrated force of the truss reinforcement acting on the new concrete is transmitted to the interface between new and old concrete in the form of an oblique compressive stress flow, so inclined cracks will appear in the new concrete. In the experiment, half of the specimens’ post-cast composite layers exhibited inclined cracks developing from the composite interface toward the loading center.
Second Stage: As the load continues to increase to the ultimate bearing capacity, the stress state of the composite concrete reaches the interface’s stress failure plane and fails. Part of the stress at the interface of the new concrete is released and borne by the web reinforcements of the truss and the upper and lower chord reinforcements passing through the inclined cracks. The reinforcements transition from the elastic stage to the plastic stage, and the composite concretes gradually separate. Because the shear stiffness of the reinforcements is relatively small, there will be a certain amount of slip from the load-bearing stage to the reinforcement yielding stage. Thereafter, the reinforcements enter the yielding stage, and the load maintains a constant value without further increase.
Third Stage: The load remains constant while the slip between the composite interfaces continues to increase. All web reinforcements enter the yielding stage, rigid body motion occurs between the composite concretes, and the interface completely enters the plastic stage.
The three-phase shear behavior (elastic deformation, plastic softening, and full yielding) identified in this study has critical implications for real-world construction practices. For instance:
Elastic Phase: In prefabricated building systems, the elastic phase corresponds to the serviceability limit state where composite interfaces must maintain minimal slip under routine loads (e.g., wind or live loads). Ensuring adequate interfacial stiffness during this phase is vital for structural integrity and occupant safety.
Plastic Softening: This phase may manifest in scenarios involving localized overloading or fatigue (e.g., bridge deck retrofits). The gradual reduction in shear stiffness highlights the need for redundancy in reinforcement design to prevent sudden failures.
Full Yielding: Structural retrofits in seismic zones must account for this phase, as yielding of truss reinforcements could act as an energy-dissipation mechanism. However, excessive slip at this stage may compromise post-earthquake reparability, necessitating strict control of reinforcement ratios.
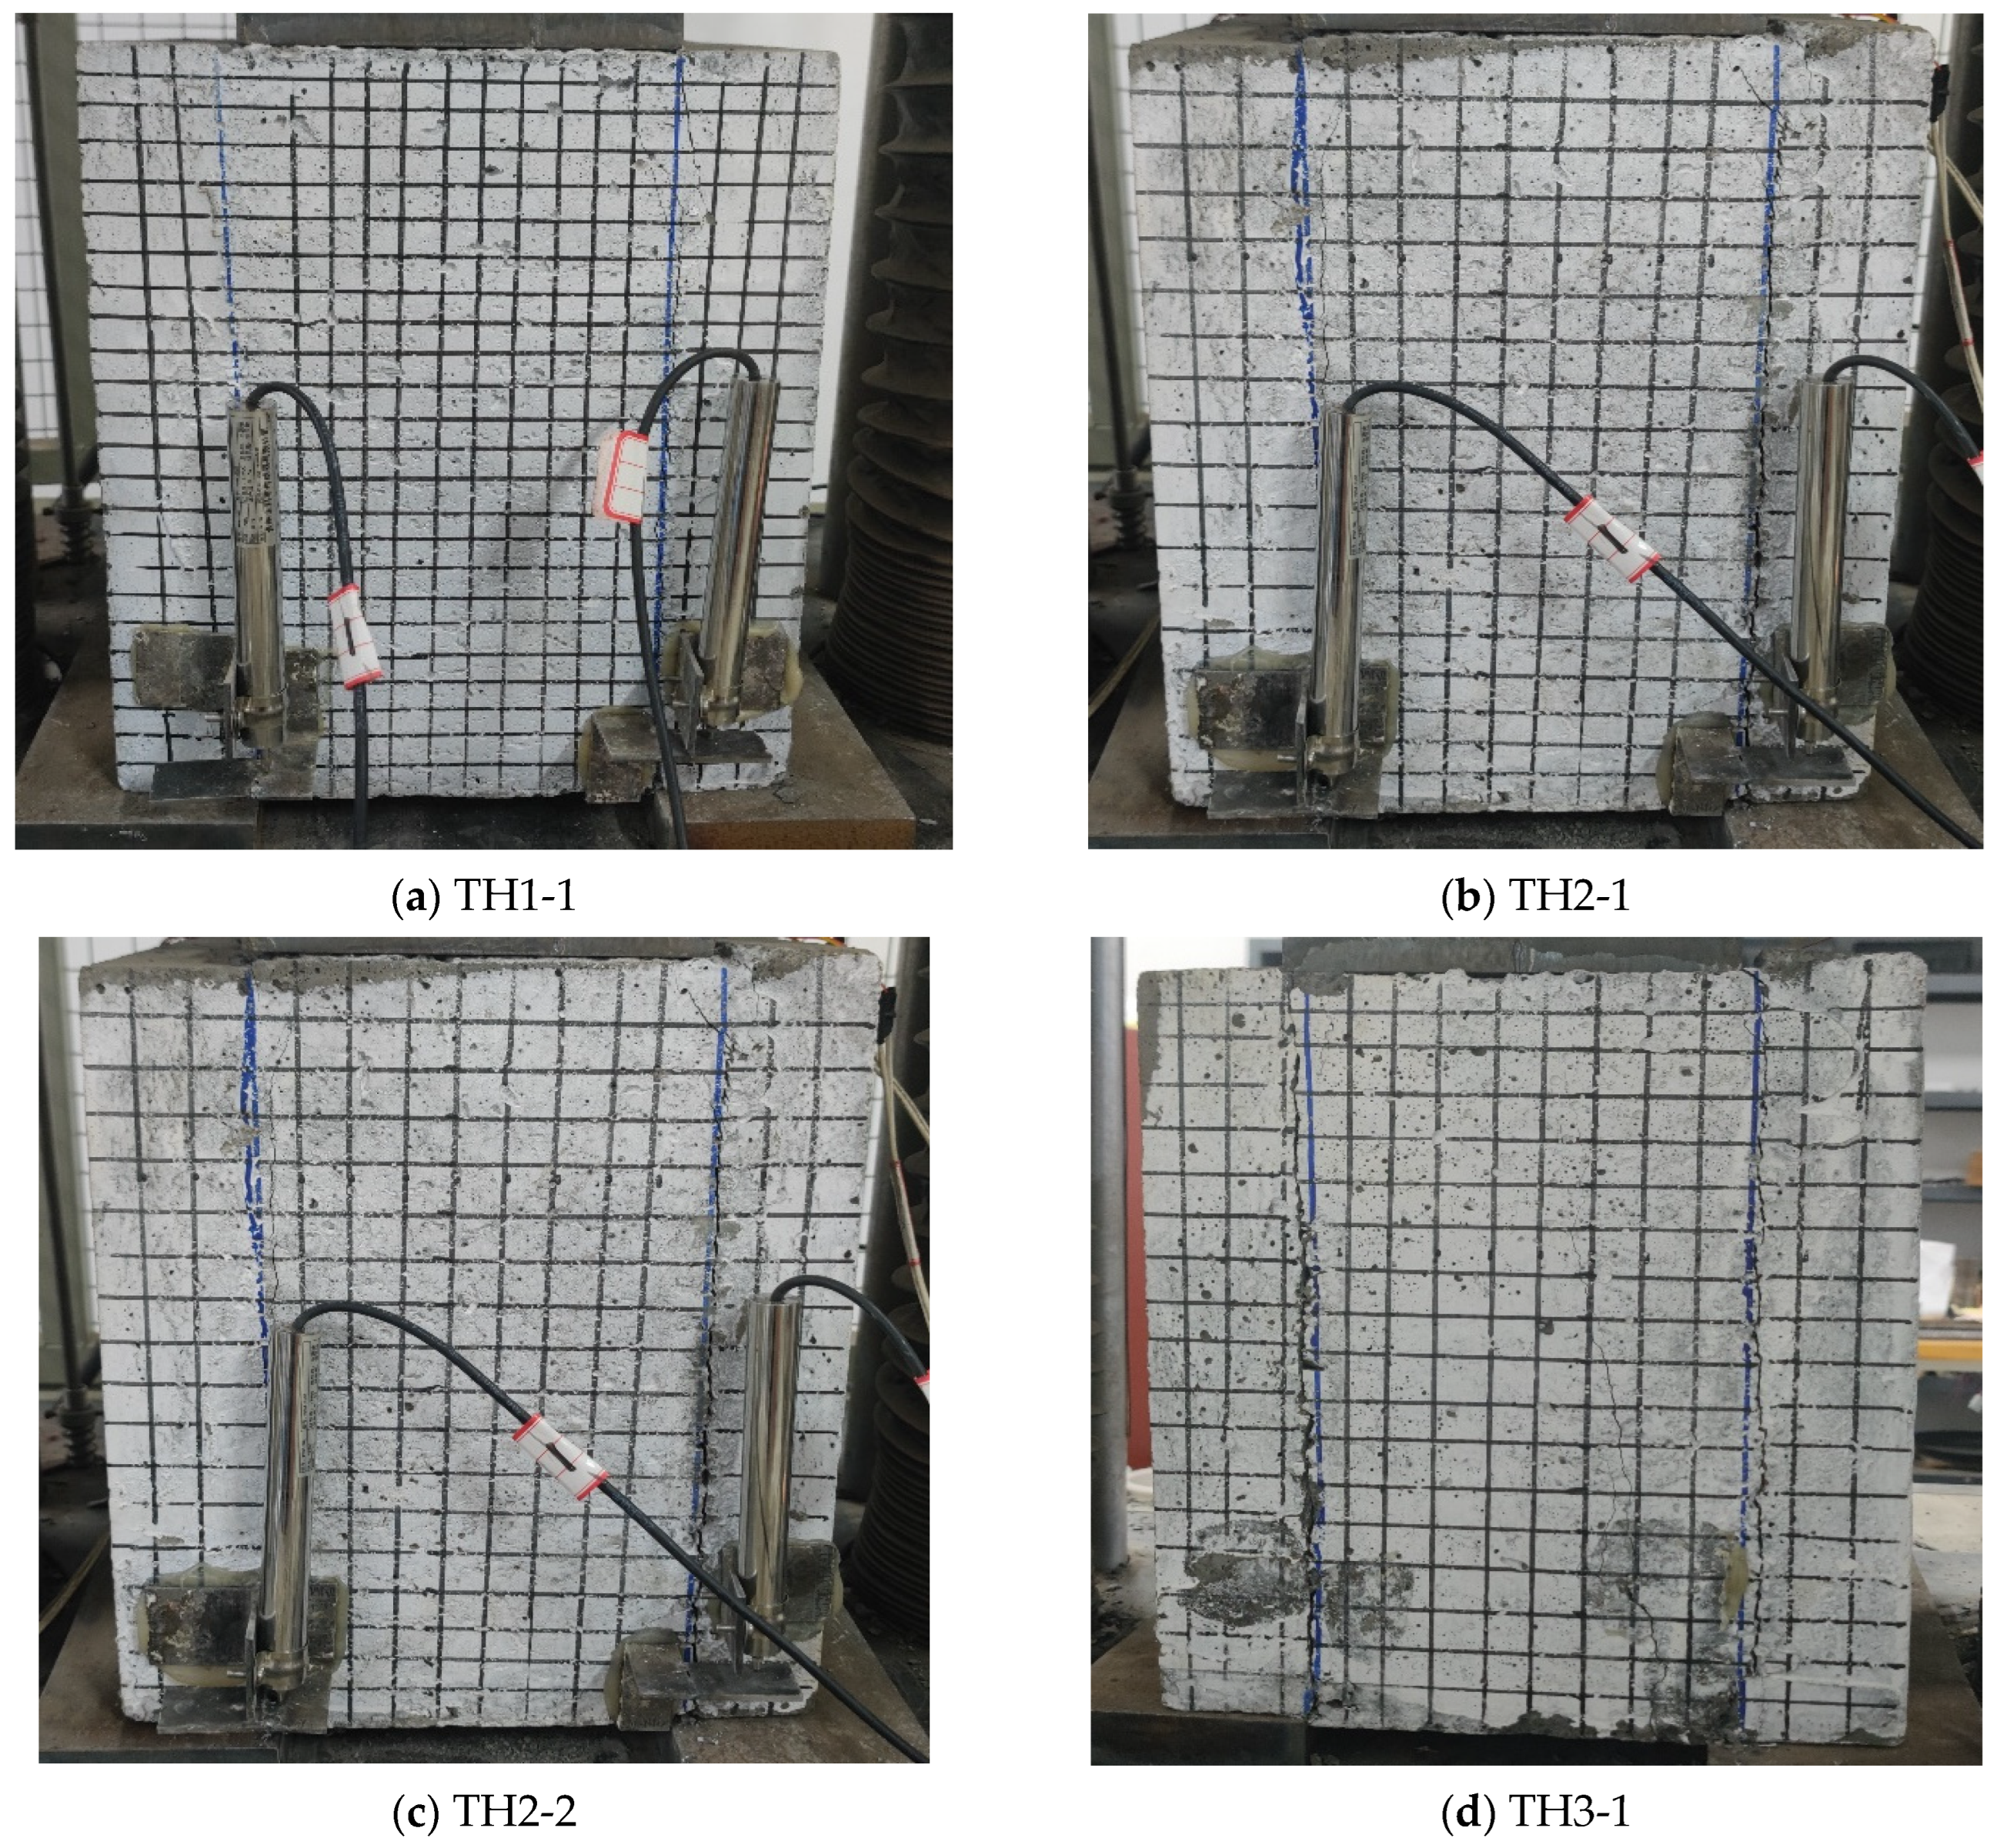
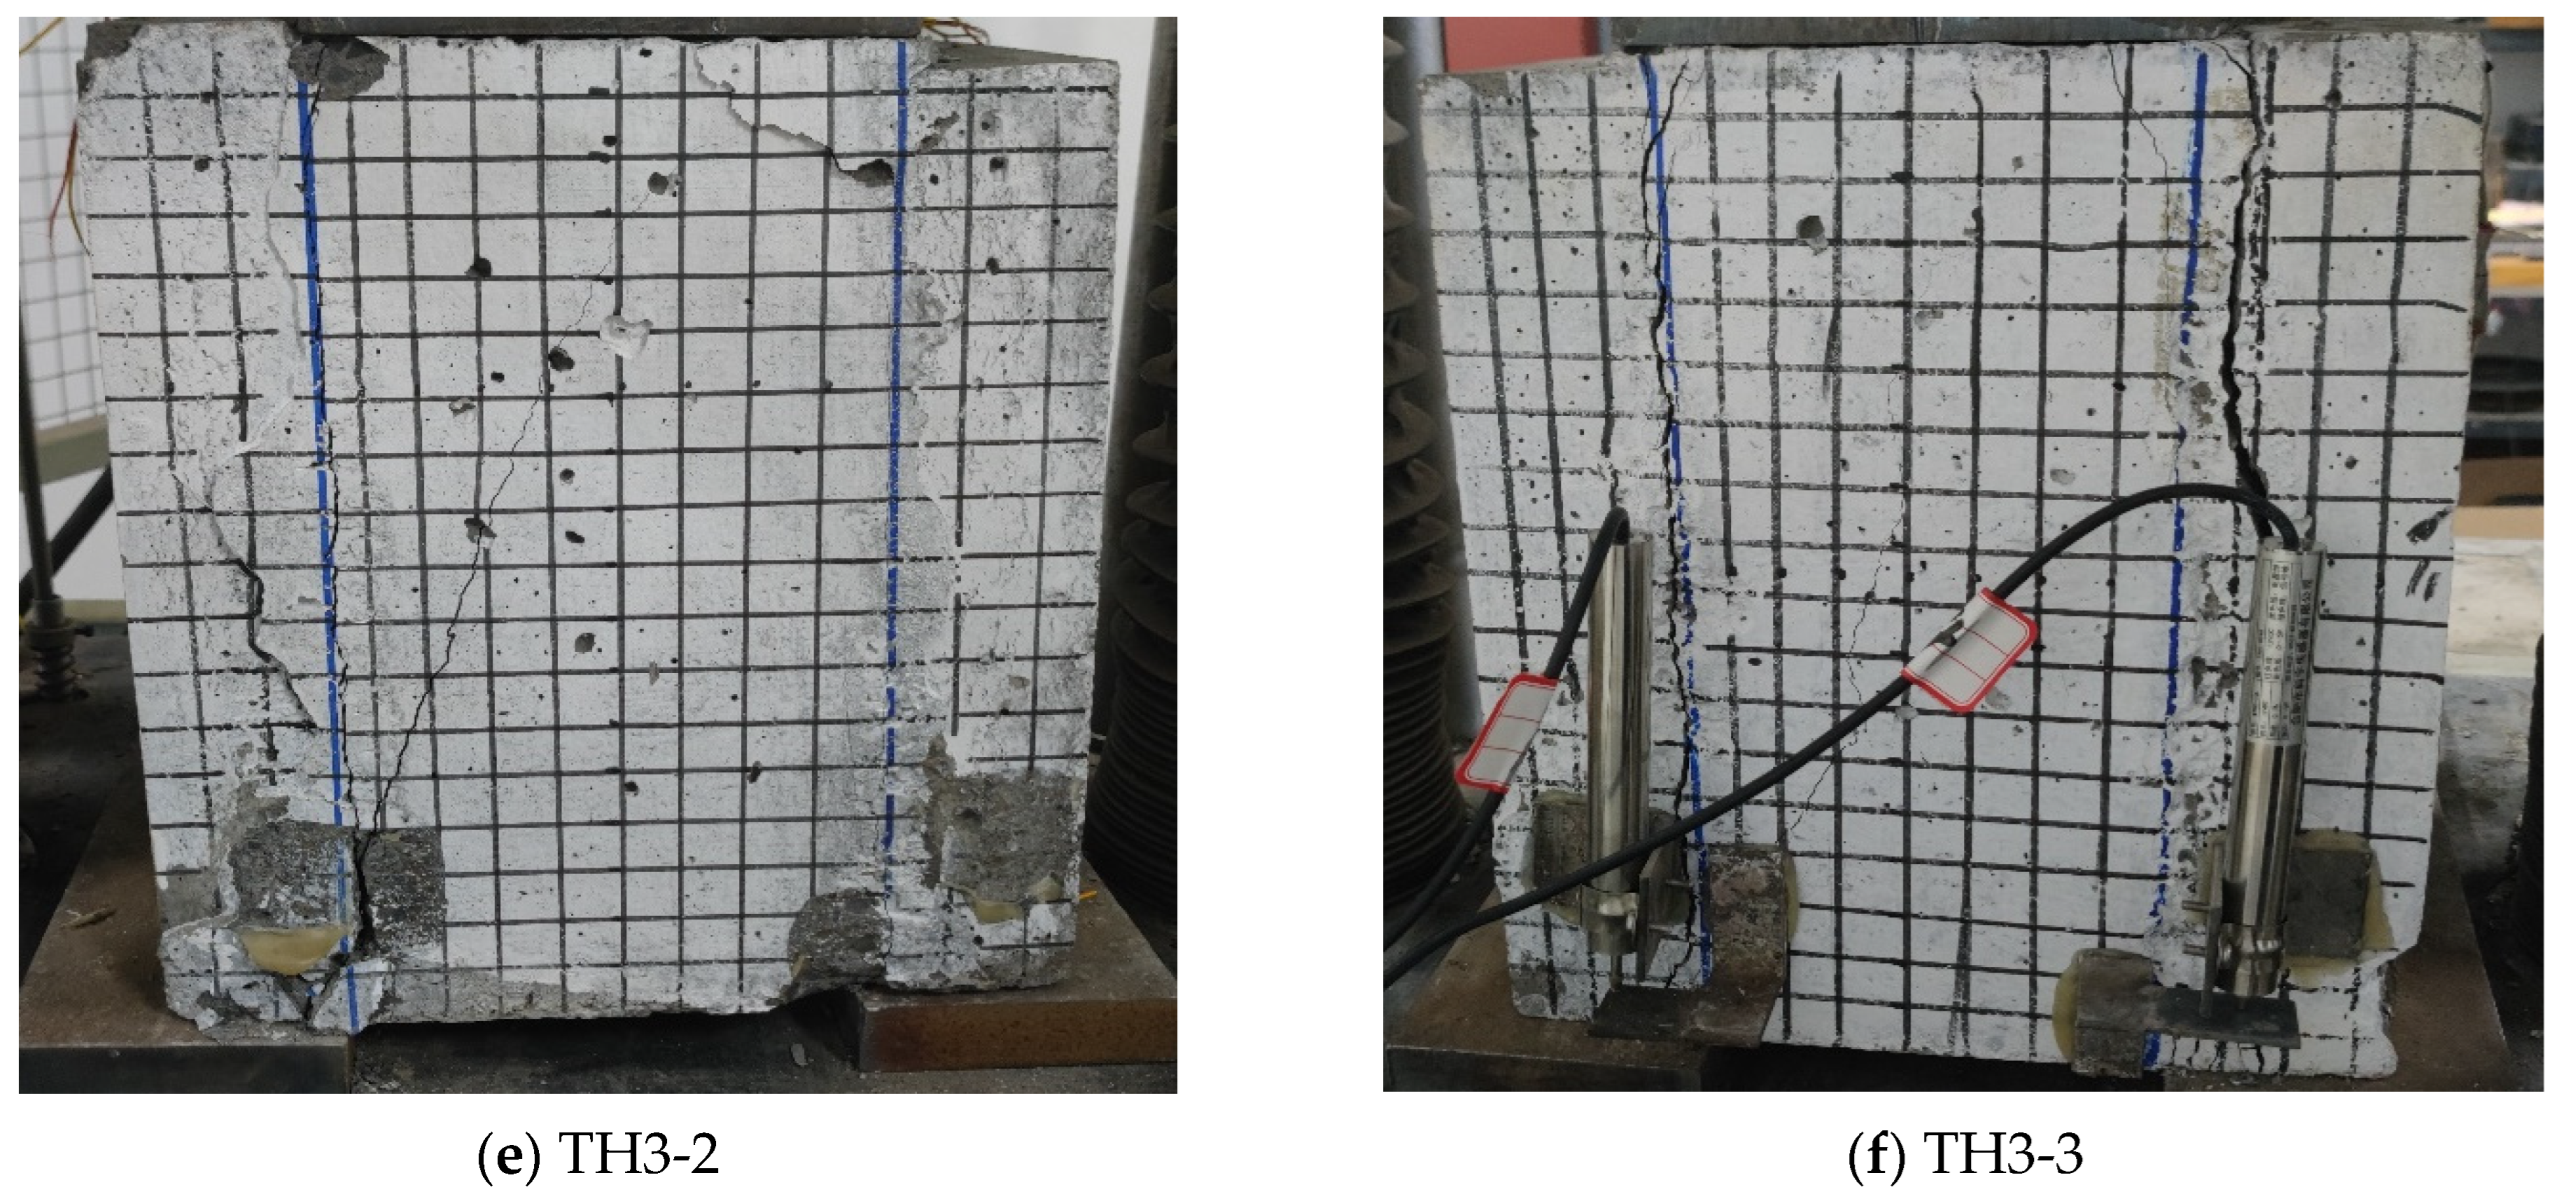
The failure modes of each specimen are shown in Figure 6; no cracks were found in the precast slabs.

3.2. Analysis of Shear-Bearing Capacity

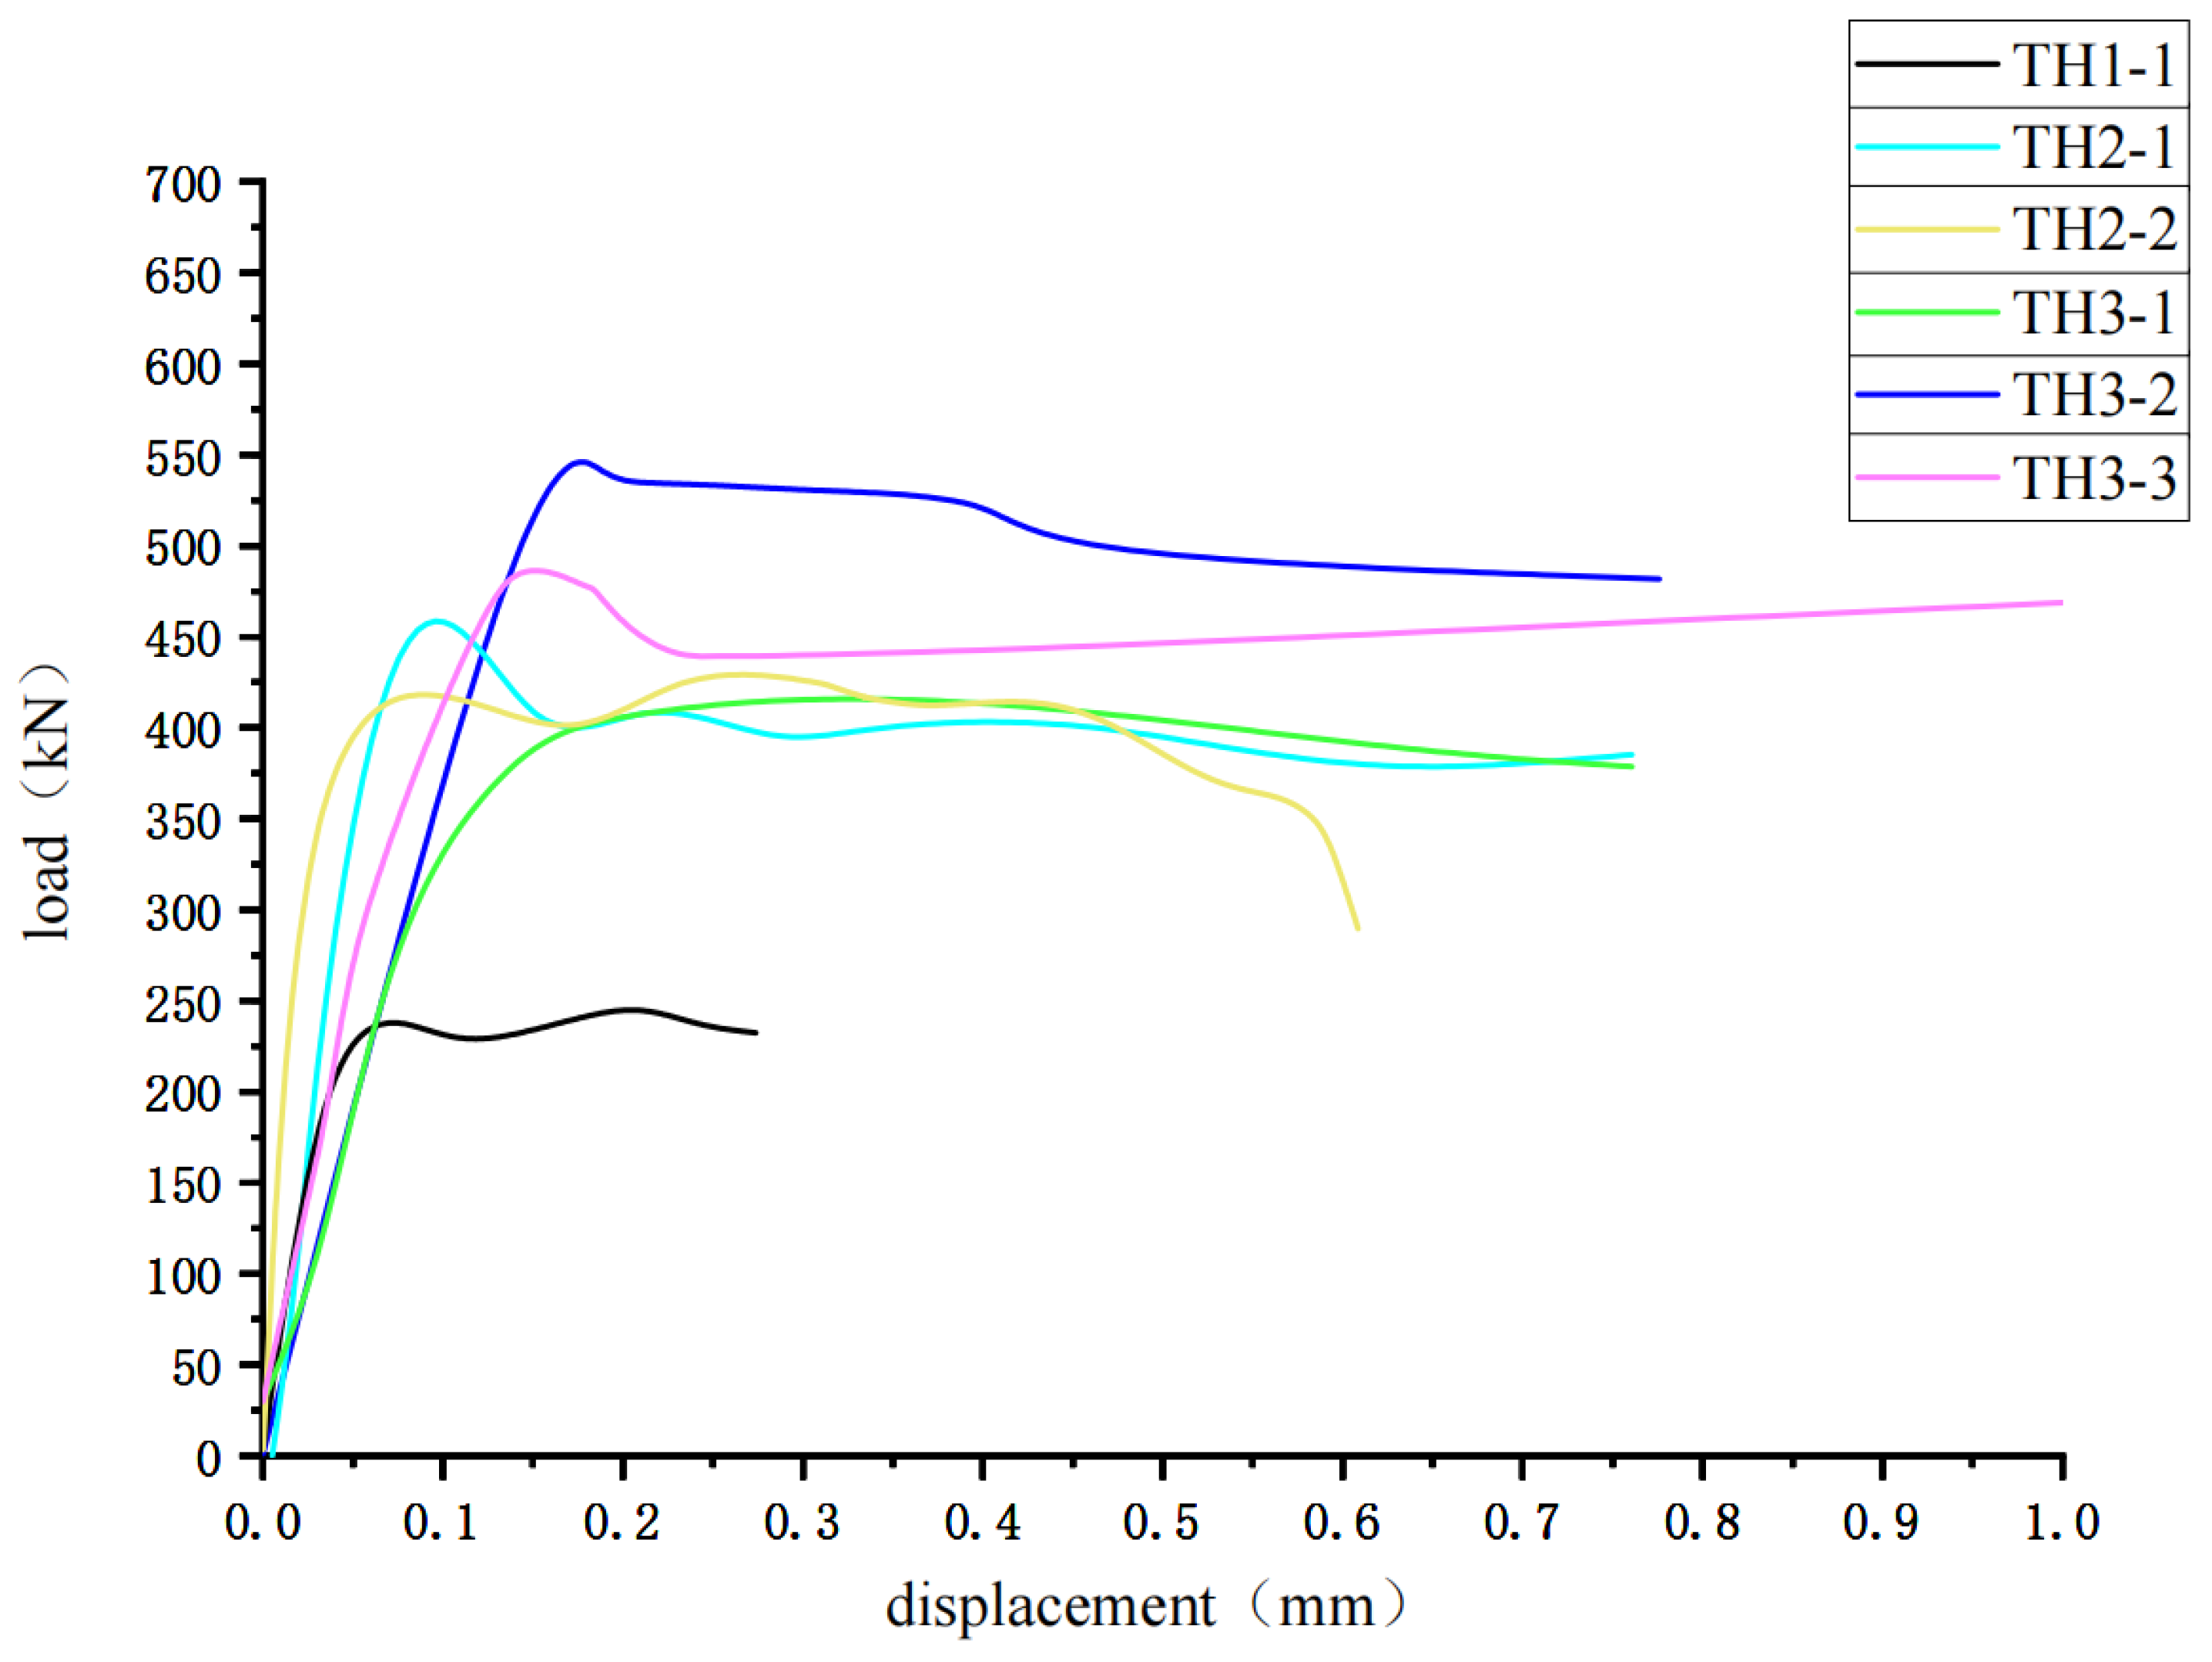
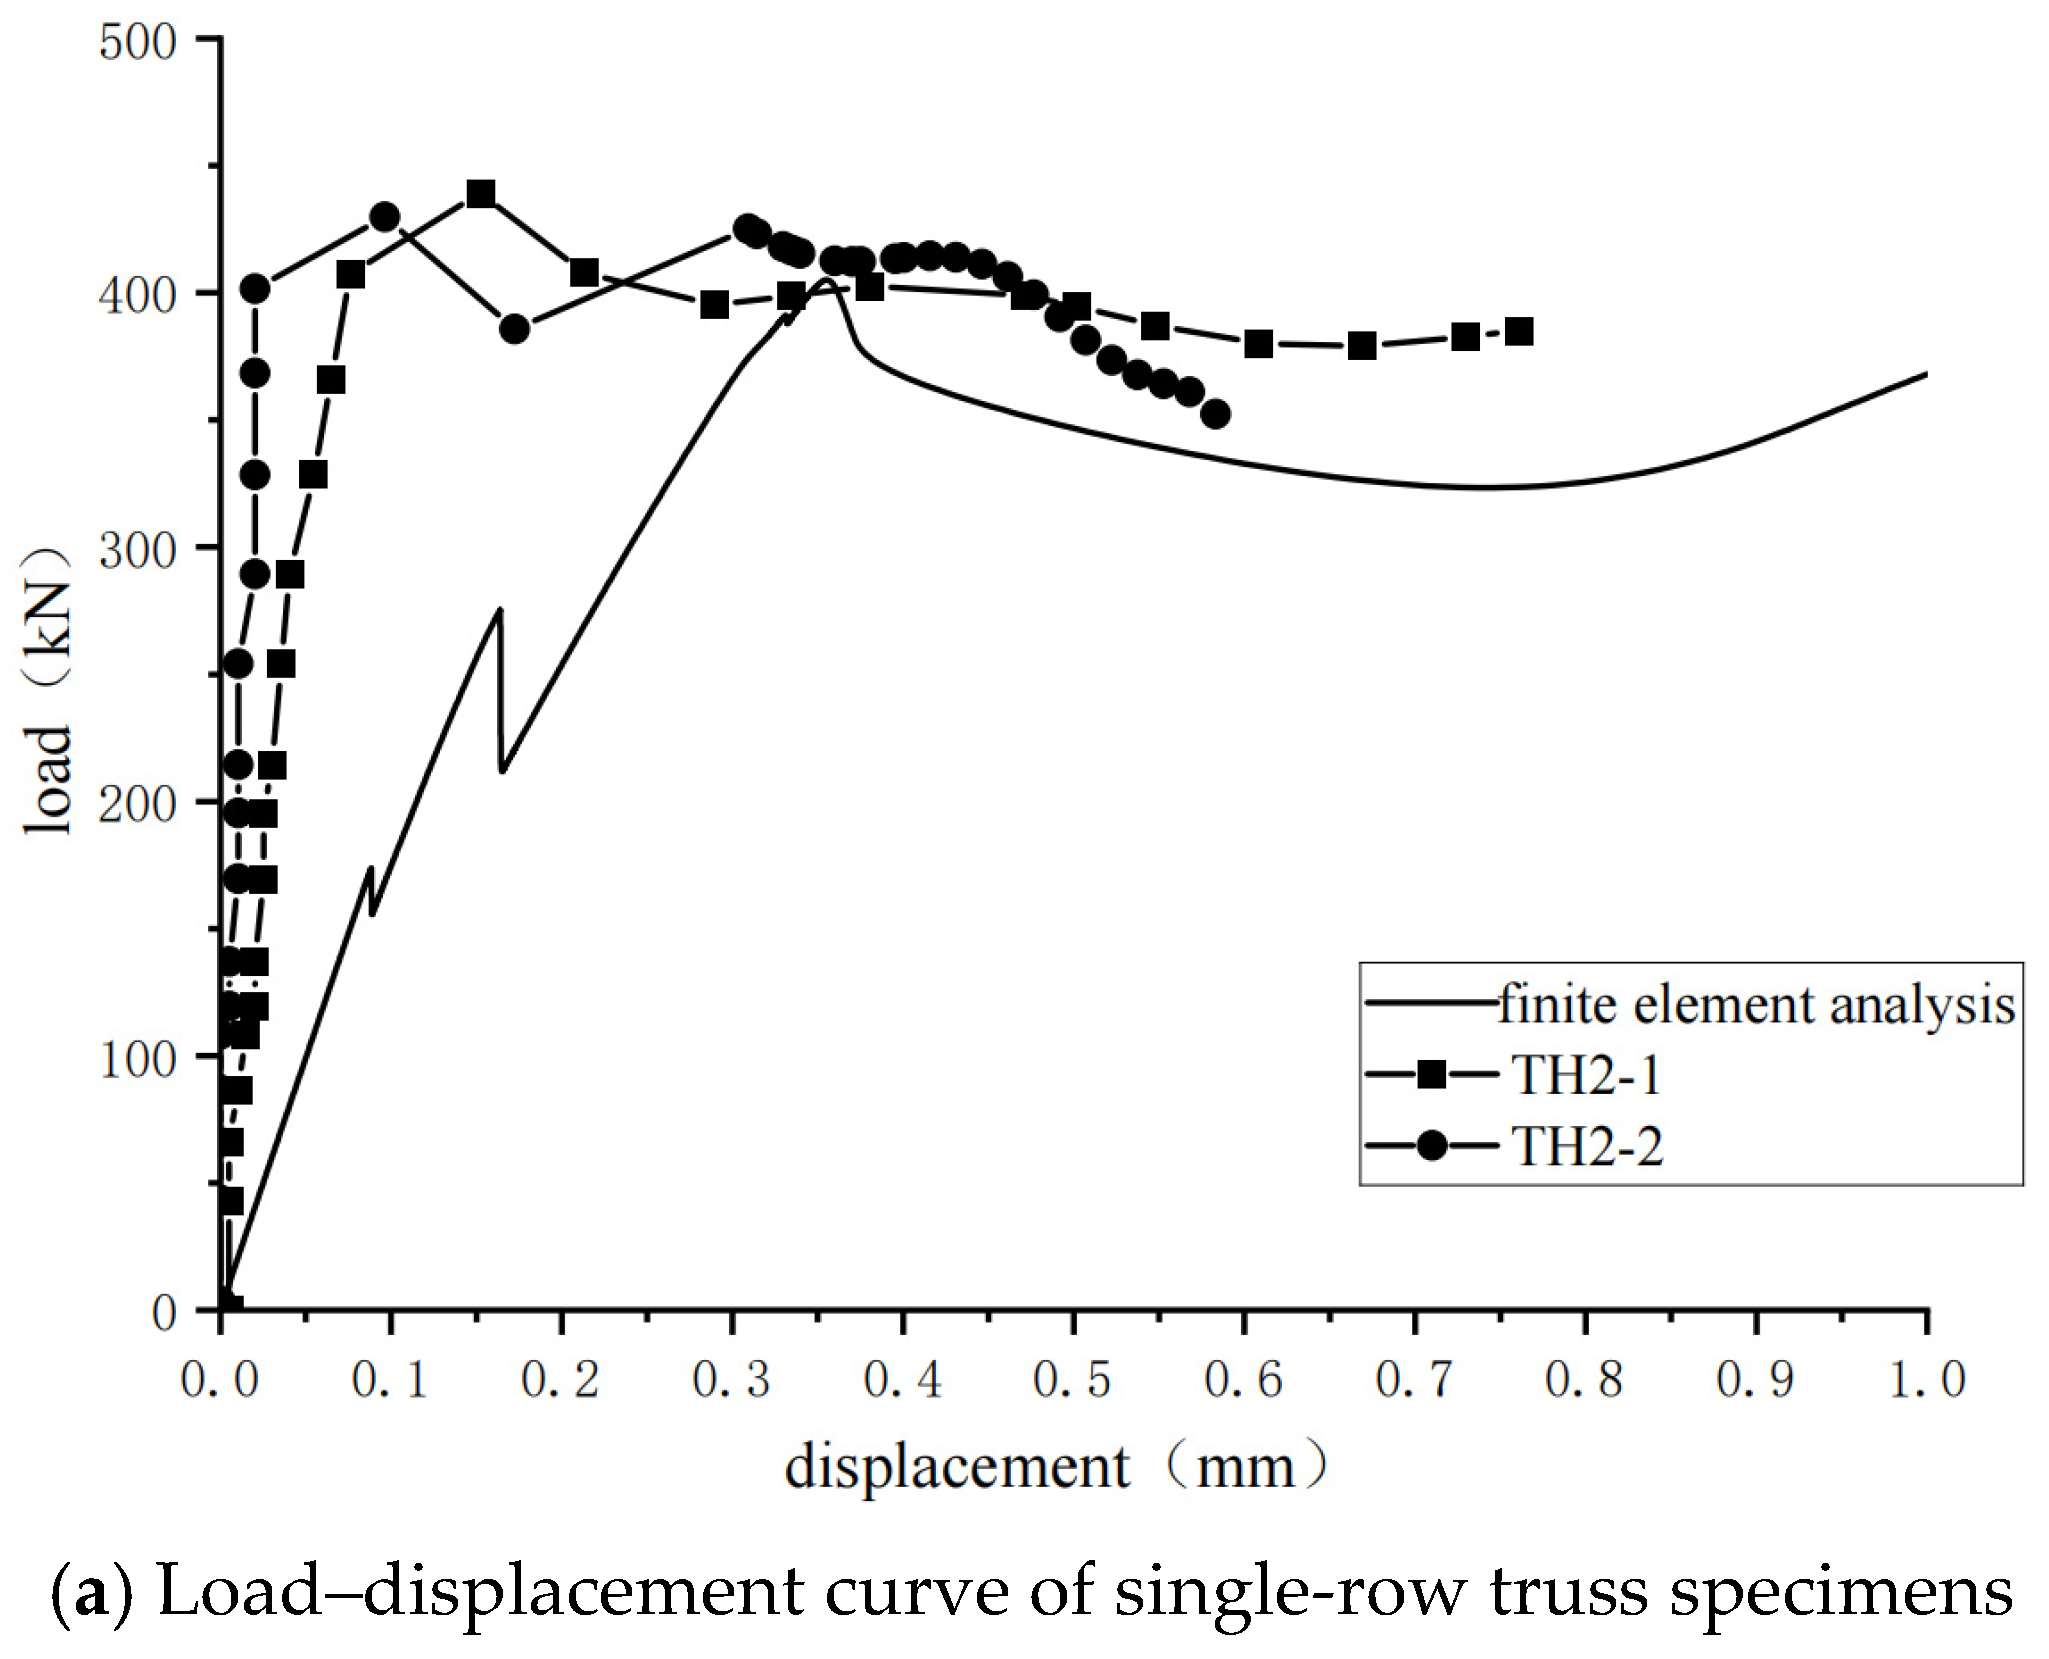
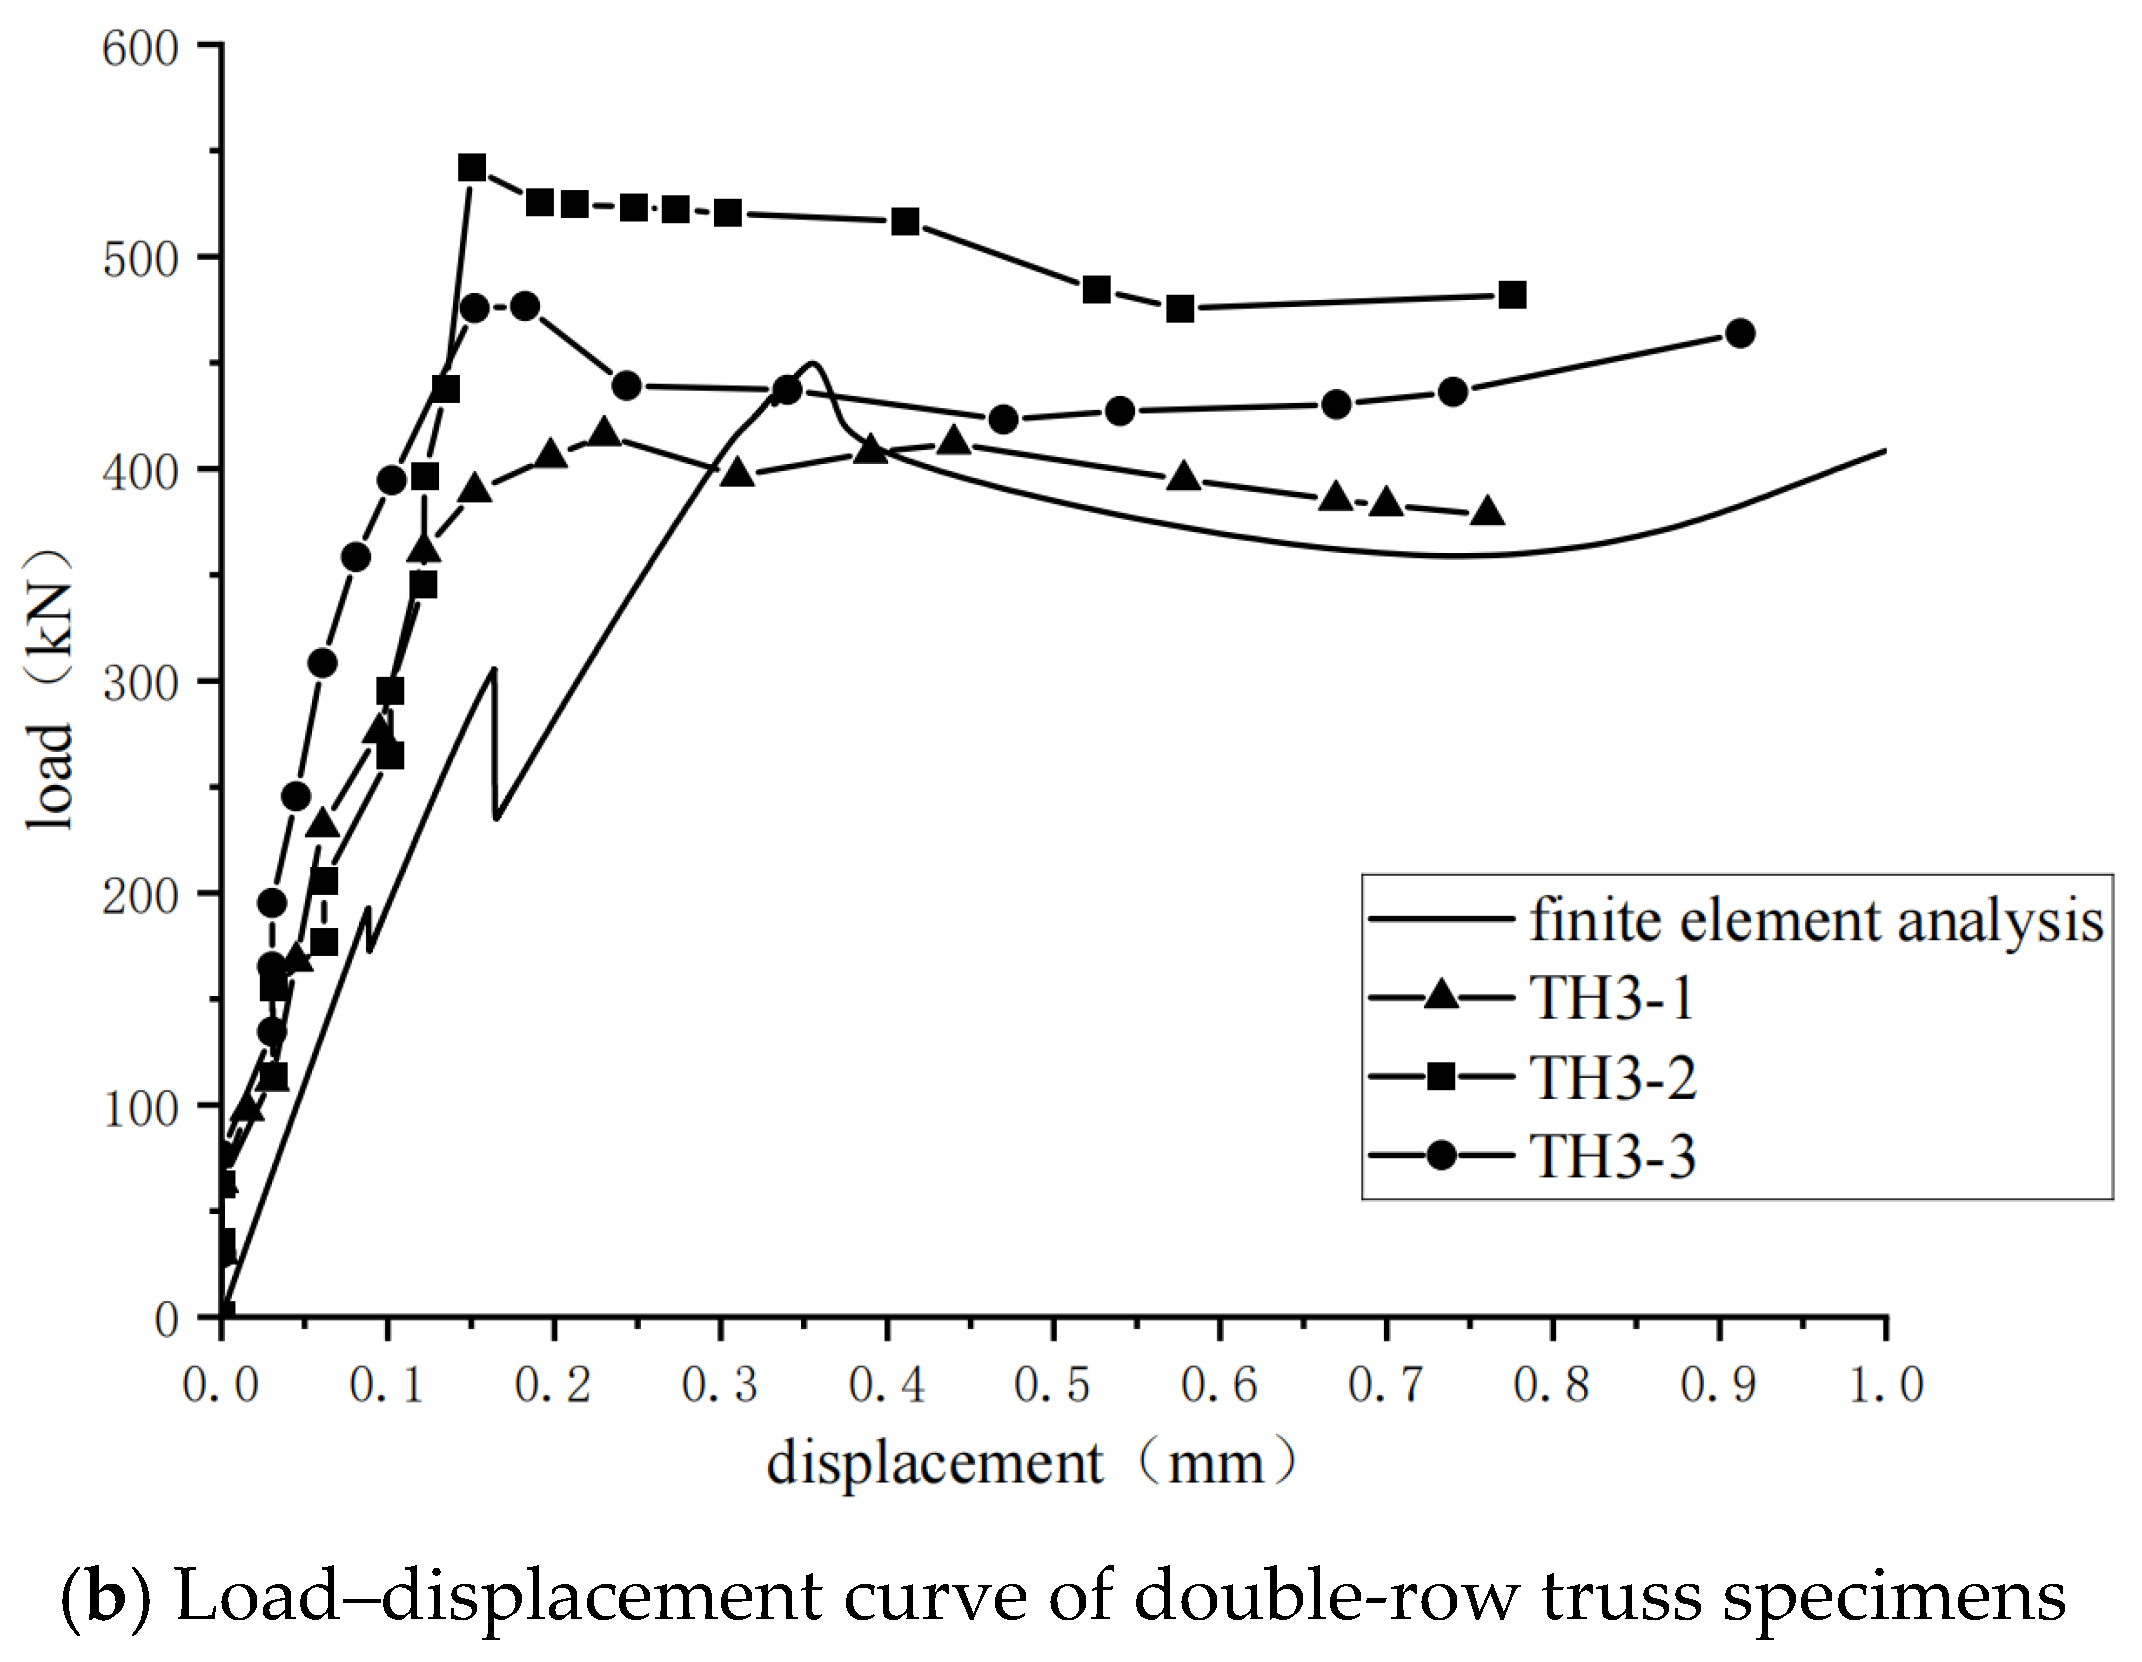
Figure 7 shows the variation in relative displacement between the precast slab and the composite layer with the load. The experimental results indicate that the web reinforcements of the reinforcement truss have a significant impact on the shear-bearing capacity of the composite interface. In the early stage of loading, the shear-bearing capacity is mainly contributed by bonding force and friction. In the later stage of loading, the web reinforcements play a role in resisting shear at the composite interface. When the shear-bearing capacity of the composite interface is insufficient, relative slip cracks appear at the interface, and the specimen loses its bearing capacity. Under similar roughness conditions, the shear-bearing capacity of specimens without reinforcement is smaller than that of specimens with reinforcement. Compared with specimens without truss reinforcement, the shear-bearing capacity of specimens with a single row of reinforcement truss increased by 75.6%. Compared with specimens with a single row of reinforcement truss, those with a double row showed a 13.2% increase in shear-bearing capacity.
The limited 13.2% increase in the shear capacity of double-row truss specimens compared to single-row specimens can be attributed to several factors. Firstly, the stress concentration effect is more pronounced in double-row truss specimens, which may exacerbate interfacial stress concentration and diminish shear stiffness. During loading, this stress concentration can accelerate the propagation and penetration of interfacial cracks, thereby reducing the shear stiffness. Secondly, the presence of double-row trusses may compromise the uniformity of concrete pouring, leading to a decline in interfacial bonding quality and the emergence of localized poor adhesion. Consequently, the overall shear performance is weakened, restricting the improvement in shear capacity of double-row truss specimens. Moreover, from the perspective of structural optimization, in the structural configuration of this study, single-row trusses are usually sufficient to meet most bearing requirements. When an extra row of trusses is added, the resulting effects may tend to saturate, failing to significantly enhance.
It is generally considered that the shear-bearing capacity F of the interface between new and old concrete includes the bonding force F c v between interfaces, the friction force F c f between interfaces, the dowel action F d of shear reinforcement, and the component F v of shear reinforcement in the direction of the composite interface [43], that is:
F = F c v + F c f + F d + F v
Since the dowel action is difficult to calculate, the calculation formulas in these codes do not consider the dowel action.
Figure 8 illustrates the components of the tensile force F t in the web reinforcement in various directions. From the figure, it can be seen that the calculation methods for its component perpendicular to the composite interface F n and its component parallel to the composite interface F v are as follows:
F n = F t sin β
F v = F t cos β cos γ
sin β = 2 H X 2 + S 2 + 4 H 2 cos β = X 2 + S 2 X 2 + S 2 + 4 H 2 cos γ = S X 2 + S 2
It can be seen that the spatial positioning of the web reinforcement has a certain impact on the shear-bearing capacity of the composite interface.
Currently, the codes in Europe, the United States, Canada, and China all consider the influence of reinforcement on the shear-bearing performance of concrete composite interfaces. To accurately determine the shear-bearing capacity of the reinforced ceramsite concrete interfaces, a comparative analysis of the applicability of shear capacity formulas from various codes to ceramsite concrete composite interfaces is conducted below. To facilitate comparison with the experimental results, the strength values in the calculation formulas are all taken as standard values; that is, the material partial factors in the formulas are all set to 1.0, and the units are unified as N, mm, and MPa.

3.2.1. Eurocode 2

The European code [38] (hereinafter referred to as Eurocode 2) specifies the method for calculating the shear stress v R at the interface between the new and old concrete as:
v R = c f ct + μ σ + ρ v   f y ( μ s i n β + c o s β )
where:
c —coefficient reflecting bond stress;
f ct —axial tensile strength of concrete on both sides of the interface;
μ —friction coefficient;
ρ v —reinforcement ratio of shear reinforcement at the composite interface;
f y —yield strength of shear reinforcement;
β —angle between web reinforcement and shear plane;
σ n —normal stress generated by the minimum interface normal force acting simultaneously with the interface shear force.
c and μ are coefficients determined by the interface roughness, and their values are related to the average roughness R a , as shown in Table 3. R a can be measured using the sand-patch method; according to Table 3, the values of c and μ are 0.7 and 0.45, respectively.

3.2.2. ACI 318-19

The American Concrete Institute’s standard [39] ignores the bonding force and the normal stress generated by permanent actions, that is:
V R = ρ v   f y ( μ s i n β + c o s β )
The friction coefficient μ is determined based on the roughness of the interface, and when lightweight concrete is used, the friction coefficient needs to be reduced; see Table 4.

3.2.3. CSA A23.3-04

The Canadian Standards Association’s standard [40] (CSA A23.3-04) considers the bonding force and the normal stress generated by permanent actions, that is:
v R = λ ( v c + μ σ ) + ρ v f y cos β
where λ has the same meaning and value as in the American code, and v c is the bonding stress; σ = ρ v f y sin α + σ n .
The values of λ and μ depend on the surface roughness, according to Table 5.

3.2.4. GB 50010-2010

GB 50010-2010 “Code for Design of Concrete Structures” [41] provides corresponding provisions for the shear-bearing capacity of composite interfaces in composite beams and slabs. When the composite beam meets all structural requirements, the shear-bearing capacity of the composite interface satisfies:
Q b h 0 1.2 f t + 0.85 f y ρ v
where Q is the shear force of the member; b is the width of the cross-section; h 0 is the effective depth of the cross-section; and f t is the design value of the tensile strength of concrete, taking the lower value between the composite layer and the precast concrete.
Table 6 presents the ultimate shear-bearing capacity and corresponding shear stress of the specimen–composite interfaces.
Dividing both sides of Equation (1) by A v c , and ignoring the dowel action, the shear stress in various regional codes can be uniformly expressed as:
v R = v c v + v c f + v v
where v c v is the shear stress component provided by bonding force; v c f is the shear stress component provided by friction force; and v v is the shear stress component provided by shear reinforcement.
Using Equations (2) and (3), and F c f = μ F n , the shear stress components corresponding to each calculation formula can be obtained, as shown in Table 7. Since the Chinese code’s calculation formula is applicable to composite beams with stirrups (perpendicular to the composite interface), the friction force is multiplied by sin β to consider the inclined web reinforcement. According to the material test results and reinforcement specifications, f c t = 2.15   M P a , f y = 270   M P a , sin β = 0.745 , cos β = 0.667 , cos γ = 0.868 .
The theoretical calculation results obtained from Table 7 are listed in Table 8 ( σ n = 0 ).
It can be seen that there are significant differences in the ultimate shear-bearing capacity of ceramsite concrete interfaces obtained from different regional codes. The results calculated using the European code are the closest to the experimental results. The shear-bearing capacity of reinforced truss ceramsite concrete composite interfaces follows a pattern similar to that of ordinary concrete.

3.3. Shear Stiffness Analysis

The average shear stress and shear stiffness of the interface can be calculated according to Equation (10) [37].
τ = F A K = Δ τ Δ s
In the formula:
F —Shear force acting on the interface (N)
A —Interface area (mm2)
K —Interface shear stiffness (MPa/mm)
Δ τ —Difference in shear stress on the interface (MPa)
Δ s —Difference in interface slip (mm)
The shear stiffness of each specimen in the elastic stage is shown in Table 9.
In the experiment, the shear stiffness of specimens with two rows of reinforcement trusses was lower than that of specimens without reinforcement trusses, and the specimens without reinforcement trusses were lower than those with only one row of reinforcement trusses. This phenomenon may be due to the increased number of trusses leading to more significant stress concentration at the interface, thereby reducing the shear stiffness. The two rows of reinforcement trusses may guide the concentrated development of cracks during loading, causing the cracks to penetrate faster, leading to a decrease in shear stiffness. Additionally, the dense arrangement of trusses may affect the uniformity of concrete pouring, leading to decreased interface bonding quality and the appearance of local poor bonding areas, thus weakening the overall shear performance. In contrast, in specimens with only one row of reinforcement trusses, concrete vibration and pouring are more adequate, resulting in relatively better bonding quality and thereby improving the shear stiffness.

4. Finite Element Simulation

4.1. Finite Element Model

To clarify the mechanical characteristics of the reinforced truss ceramsite concrete composite interface, the ABAQUS 2024 finite element software was used to perform numerical analysis on the stress and deformation performance of the tested specimens. The model simulates using double-sided direct shear specimens, with dimensions identical to the experimental specimens. The model parameters are the same as those of the experimental specimens.

4.2. Load, Interaction, and Parameter Selection

To facilitate the convergence of the finite element model, displacement loading was used. The top loading steel plate was coupled to a predefined reference point, and the vertical displacement (using displacement loading) was directly applied to this reference point. According to the experimental conditions, the translational and rotational displacements in the X, Y, and Z directions of the bottom steel plate of the model were constrained, and the displacements in the X and Z directions of the top reference point were constrained. Concrete was modeled using three-dimensional solid elements C3D8R, and reinforcement bars were modeled using truss elements. The mesh size for the new concrete was 30 mm and for the old concrete 35 mm, and the mesh size for the upper and lower chord reinforcements was 10 mm and for the web reinforcements 2 mm. The upper and lower pads were set to be tied to the specimen through a tie connection. Reinforcement bars and concrete were fully bonded, using embedded region constraints. The finite element analysis model is shown in Figure 9.

4.3. Composite Interface Bond-Slip Model

Through extensive experimental research, many calculation formulas for the shear strength of concrete composite interfaces have been developed. Generally, the shear strength of concrete composite interfaces consists of three parts: the bonding force and friction force between interfaces, the stress generated by the normal stress acting on the interface, and the shear strength provided by reinforcement passing through the composite interface.
The ABAQUS software provides three basic models that can be used to simulate the interface bond-slip behavior of composite concrete, namely the Coulomb friction model, the spring model, and the cohesive model. These basic models can also be combined to form new composite models, such as the cohesive friction model, spring friction model, etc. Based on the characteristics of various interface models in ABAQUS software, this study adopts the cohesive spring composite model. Under shear loading, the initial slip value at the interface between new and old concrete is very small, mainly relying on the cohesion between new and old concrete. At this time, the shear resistance of the model mainly comes from the bilinear cohesive model, and the spring model hardly works. As the interface slip increases, damage occurs in the cohesive model, corresponding to the weakening of the cohesion between new and old concrete. The shear friction effect corresponding to the spring model begins to generate shear stress as the main shear-bearing model. When the cohesive model completely fails, the spring model works alone.

4.4. Analysis and Comparison of Experimental and Finite Element Calculation Results

All specimens failed in a brittle manner. From the beginning of loading to before failure, there were no obvious signs of damage. When the load reached the ultimate load, the specimen suddenly emitted a dull sound, and a continuous vertical crack appeared on both sides of the composite interface, resulting in complete separation of the interface. Therefore, this test mainly verifies its ultimate shear-bearing capacity. As shown in Figure 10, the comparison between the experimental results and numerical analysis of the load-displacement curves at the interface between new and old concrete in the reinforced truss ceramsite concrete specimens is presented. The experimental results agree well with the simulation results, indicating that the cohesive spring composite model has good applicability for the shear performance of reinforced truss ceramsite concrete composite interfaces.
From Figure 10, it can be seen that the shear–relative displacement curves of the five specimens with truss reinforcement are significantly different from the basic specimen, and the curves exhibit three stages. Comparing the five specimens, the stiffness in the first-stage linear elastic segment is slightly less than the experimental values, mainly because the shear displacement is extremely small before the interface cracks, and due to the limitations of experimental sensor accuracy, the stiffness of the experimental linear elastic segment is mostly infinite. The second stage is the plastic softening segment. There is no obvious softening segment in the experimental curves of the specimens, mainly because the development time of interface cracks is short, and the sampling frequency of experimental data is limited. There may be some data that were not collected in time, failing to capture the displacement changes promptly. The simulated ultimate bearing capacities of the five groups of reinforced truss ceramsite concrete composite slabs are 92.7%, 94.8%, 109.7%, 84.4%, and 94.8% of the experimental results, respectively. The finite element model predicts the peak load effectively.
Figure 11 presents the typical Mises stress distribution of the specimen during initial loading and at failure. It clearly shows that the maximum stress is always concentrated near the interface, consistent with the experimental observations. Also, due to the presence of truss reinforcement, higher stresses occur near the reinforcement and closer to the loading end. During loading, as the load increases, the stress near the loading end grows and starts to spread to areas further away from the loading end.
Although the ABAQUS finite element model in this paper was verified by experimental results, it still has certain limitations. For example, the current model assumes uniform concrete properties, ignoring the porous nature of ceramsite aggregates and local voids observed in SEM images (Figure 5). It may also fail to fully capture the impact of complex geometry and irregular roughness of new-to-old concrete interfaces on shear performance. Moreover, the existing model may not adequately consider material nonlinear behavior, temperature effects, and time-dependent characteristics under long-term loads in construction processes. Future research can optimize these aspects.

5. Discussion

Shear capacity tests on composite interfaces were conducted on six ceramsite concrete composite slab specimens with different numbers of truss reinforcement rows and reinforcement ratios. The research results indicate that:
(1)
The shear behavior of ceramsite concrete composite interfaces can be divided into three stages. The shear failure of the composite interface is brittle; before shear failure, the stiffness is high with almost no slip, and the new and old ceramsite concrete can be considered as an integral whole. After brittle failure of the composite interface, the slip increases continuously while the shear-bearing capacity remains essentially constant. When all the web reinforcements enter the yielding stage, rigid body motion occurs between the new and old concrete, and the interface completely enters the yielding stage.
(2)
The shear-bearing capacity of the interface is provided by the bonding force and friction between interfaces and the reinforcement passing through the composite interface. Under similar roughness conditions, specimens with higher reinforcement ratios exhibit higher shear-bearing capacity. The shear-bearing capacity of specimens with a single row of truss reinforcement increased by 75.6% compared to those without truss reinforcement, indicating that truss reinforcement can effectively bear shear forces and enhance the overall structural performance. Further comparison between specimens with double rows and a single row of truss reinforcement shows only a 13.2% increase in shear-bearing capacity. Although increasing the number of trusses enhances the bearing capacity to some extent, the effect may become saturated under certain structural forms. Therefore, a single row of truss reinforcement can meet most bearing requirements, and excessive truss design may not lead to proportional performance improvement. Combined with the findings on shear stiffness, it can be inferred that the optimal design of truss structures should consider the balance between bearing capacity and stiffness to achieve more efficient material usage and structural safety. In future research, exploring the impact of different truss arrangements and material combinations on shear performance will be a direction worth pursuing.
(3)
Shear-bearing capacity calculations of ceramsite concrete composite slabs based on existing code formulas show significant differences among the formulas. Theoretical calculations indicate that the results from the European code align well with experimental results. The shear-bearing capacity behavior of reinforced truss ceramsite concrete composite interfaces is similar to that of ordinary concrete. This study provides a theoretical foundation for the design optimization and code revision of ceramsite concrete composite structures, thereby promoting the extensive application of lightweight high-strength concrete in sustainable construction.
(4)
Nonlinear finite element modeling based on the shear stress mechanism of interface reinforcement between new and old concrete was conducted. The cohesive spring composite model effectively simulates the bonding performance of the ceramsite concrete interface, and the numerical calculations of ultimate bearing capacity agree well with experimental results, providing a reference for the design of ceramsite concrete composite structures.

Author Contributions

writing—original draft preparation, Y.X.; writing—review and editing, Z.Z.; data curation, Y.X.; formal analysis, Y.X.; analysis, Y.X.; model, Y.X.; validation, Y.X.; conceptualization, Z.Z. and G.C.; Supervision, Z.Z and G.C.; Methodology, Z.Z.; investigation, Z.Z. and G.C.; project administration, Z.Z. and G.C.; funding acquisition, Z.Z. and G.C. All authors have read and agreed to the published version of the manuscript.

Funding

This research was funded by the Scientific Research Project of the Education Department of Hunan Province (19A095) and the Hunan Natural Science Foundation (2018JJ2020, 2020JJ5018).

Data Availability Statement

The data presented in this study are available on request from the corresponding author.

Conflicts of Interest

The authors declare no conflicts of interest.

References

  1. Fan, L.; Zhang, Z.; Yu, Y.; Li, P.; Cosgrove, T. Effect of elevated curing temperature on ceramsite concrete performance. Constr. Build. Mater. 2017, 153, 423–429. [Google Scholar] [CrossRef]
  2. Lin, H.; Zhu, B.; Yuan, J.; He, H.; Li, R.; Yu, J.; Shen, X.; He, C.; Liu, J.; Xu, W. Study on the impact of HTPP fibers on the mechanical properties of ceramsite concrete. Case Stud. Constr. Mater. 2023, 19, e02471. [Google Scholar] [CrossRef]
  3. Cao, G.; Liu, R.; He, S.; Liao, S.; Zhang, Z. Mechanical Properties and Chloride Salt Corrosion Resistance of All-Lightweight Shale Ceramsite Concrete. Buildings 2024, 14, 1684. [Google Scholar] [CrossRef]
  4. Wu, X.; Wang, S.; Yang, J.; Zhao, J.; Chang, X. Damage characteristics and constitutive model of lightweight shale ceramsite concrete under static-dynamic loading. Eng. Fract. Mech. 2022, 259, 108137. [Google Scholar] [CrossRef]
  5. Liu, P.; Luo, A.; Liu, L.; Li, Y.; Zhang, S.; Zhi, W.; Pan, D.; Chen, Y.; Yu, Z. Study on the preparation and performances analysis of lightweight high strength ceramsite aerated concrete. J. Mater. Res. Technol. 2023, 25, 6672–6683. [Google Scholar] [CrossRef]
  6. Bu, C.; Zhu, D.; Liu, L.; Lu, X.; Sun, Y.; Yan, Z.; Yu, L.; Wei, Q. A study on the mechanical properties and microcosmic mechanism of basalt fiber modified rubber ceramsite concrete. Buildings 2022, 12, 103. [Google Scholar] [CrossRef]
  7. Xie, Z.Y.; Zhang, D.W.; Wu, X. Investigation of fatigue damage of new-old concrete interface based on piezomagnetic effect. Int. J. Fatigue 2023, 176, 107884. [Google Scholar] [CrossRef]
  8. Zhang, J.; Pan, Y.; Li, J.; Yun, H.; Guan, Z. Experimental study on chloride penetration of the new-to-old concrete interface. Constr. Build. Mater. 2024, 420, 135585. [Google Scholar] [CrossRef]
  9. Liu, Q.; Ma, J.; Qiao, P.; Wu, E.; Zhou, G. Mesoscale modeling of new-to-old concrete interface under combined shear and compressive loads. Eng. Fract. Mech. 2024, 307, 110331. [Google Scholar] [CrossRef]
  10. Fan, J.; Zhang, B. Study on freeze-thaw deterioration model of new-to-old concrete based on pore surface fractal characteristics. Constr. Build. Mater. 2024, 421, 135757. [Google Scholar] [CrossRef]
  11. Zhang, J.; Li, J.; Yun, H.; Long, J.; Zhu, Q.; Guan, Z. Durability of new-to-old concrete interface under coupling action of freeze-thaw cycle and chloride salt erosion. Structures 2024, 70, 107867. [Google Scholar] [CrossRef]
  12. Shu, Y.; Shen, Z.; Zhang, H.; Sun, Y. Experimental investigation and peridynamic modelling on tensile failure of new-to-old concrete bonding zone. Structures 2025, 71, 108165. [Google Scholar] [CrossRef]
  13. Zhang, J.H.; Li, B.; Zhao, Y.C.; Niu, Z.Q.; Guan, Z.G. Shear Resistance Test and Simulation Analysis on New-to-old Concrete Interface with Closed Steel Bars. J. Highw. Transp. Res. Dev. 2023, 40, 102–111. (In Chinese) [Google Scholar] [CrossRef]
  14. Liu, J.; Bu, Y.; Chen, J.; Wang, Q. Contribution of shear reinforcements and concrete to the shear capacity of interfaces between concretes cast at different times. KSCE J. Civ. Eng. 2021, 25, 2065–2077. [Google Scholar] [CrossRef]
  15. Wu, F.; Ma, Y.; Cao, J.; Chen, A.; Li, Z. Investigation on shear behavior of the interface between engineered cementitious composites and normal-strength concrete. Structures 2024, 62, 106238. [Google Scholar] [CrossRef]
  16. Monserrat-López, A.; Nogales, A.; de la Fuente, A. Experimental characterization of concrete-to-concrete interface shear strength design-oriented constitutive parameters. Structures 2023, 55, 1172–1185. [Google Scholar] [CrossRef]
  17. Qian, P.; Xu, Q. Experimental investigation on properties of interface between concrete layers. Constr. Build. Mater. 2018, 174, 120–129. [Google Scholar] [CrossRef]
  18. Liu, C.; Zhou, S.; Yu, C.; Ma, E.; Kong, F.; Tang, X.; Gao, X.; Zhang, X.; Lai, J. Damage behaviours of new-to-old concrete interfaces and a damage prediction model of reinforced concrete. Eur. J. Environ. Civ. Eng. 2022, 26, 7138–7154. [Google Scholar] [CrossRef]
  19. Peng, H.D.; Liu, D.W.; Dai, Y.B.; Zeng, S.S.; Chu, F.J. Experimental research on load-shear performance of interface between new and old concrete with corroded planting bar. Chin. J. Eng. 2018, 40, 23–30. (In Chinese) [Google Scholar] [CrossRef]
  20. Qin, L.; Guo, C.; Sun, W.; Guan, H.; Yan, W.; Wang, F. Experimental investigation on the interfacial shear bond performance of non-water reacting polymer and concrete. Constr. Build. Mater. 2022, 331, 127351. [Google Scholar] [CrossRef]
  21. Zhu, H.; Xiao, Y.; Li, X.; Wang, Y.; Wen, S. Study on Flexural Strength of Interface between Full Lightweight Ceramsite Concrete and Ordinary Concrete. Coatings 2023, 13, 1383. [Google Scholar] [CrossRef]
  22. Tian, J.; Wu, X.; Zheng, Y.; Hu, S.; Du, Y.; Wang, W.; Sun, C.; Zhang, L. Investigation of interface shear properties and mechanical model between ECC and concrete. Constr. Build. Mater. 2019, 223, 12–27. [Google Scholar] [CrossRef]
  23. Xia, J.; Shan, K.Y.; Wu, X.H.; Gan, R.L.; Jin, W.L. Shear-friction behavior of concrete-to-concrete interface under direct shear load. Eng. Struct. 2021, 238, 112211. [Google Scholar] [CrossRef]
  24. He, Y.; Zhang, X.; Hooton, R.D.; Zhang, X. Effects of interface roughness and interface adhesion on new-to-old concrete bonding. Constr. Build. Mater. 2017, 151, 582–590. [Google Scholar] [CrossRef]
  25. Espeche, A.D.; León, J. Estimation of bond strength envelopes for old-to-new concrete interfaces based on a cylinder splitting test. Constr. Build. Mater. 2011, 25, 1222–1235. [Google Scholar] [CrossRef]
  26. Rashid, K.; Ahmad, M.; Ueda, T.; Deng, J.; Aslam, K.; Nazir, I.; Sarwar, M.A. Experimental investigation of the bond strength between new to old concrete using different adhesive layers. Constr. Build. Mater. 2020, 249, 118798. [Google Scholar] [CrossRef]
  27. Fan, J.; Wu, L.; Zhang, B. Influence of old concrete age, interface roughness and freeze-thawing attack on new-to-old concrete structure. Materials 2021, 14, 1057. [Google Scholar] [CrossRef]
  28. Daneshvar, D.; Behnood, A.; Robisson, A. Interfacial bond in concrete-to-concrete composites: A review. Constr. Build. Mater. 2022, 359, 129195. [Google Scholar] [CrossRef]
  29. Bai, M.; Ding, T.; Zhao, Y.; Zhao, Y. Shear performance of new-to-old concrete interface based on various surface preparation techniques and roughness. Case Stud. Constr. Mater. 2024, 21, e03549. [Google Scholar] [CrossRef]
  30. Qasim, M.; Lee, C.K.; Zhang, Y.X. An experimental study on interfacial bond strength between hybrid engineered cementitious composite and concrete. Constr. Build. Mater. 2022, 356, 129299. [Google Scholar] [CrossRef]
  31. Zhu, H.; Fu, Z.; Wang, Y.; Zhang, N. Study on splitting tensile strength of interface between the full lightweight ceramsite concrete and ordinary concrete. Case Stud. Constr. Mater. 2023, 18, e01829. [Google Scholar] [CrossRef]
  32. Mo, K.H.; Alengaram, U.J.; Visintin, P.; Goh, S.H.; Jumaat, M.Z. Influence of lightweight aggregate on the bond properties of concrete with various strength grades. Constr. Build. Mater. 2015, 84, 377–386. [Google Scholar] [CrossRef]
  33. Costa, H.; Carmo, R.N.F.; Júlio, E. Influence of normal stress and reinforcement ratio on the behavior of LWAC interfaces. Constr. Build. Mater. 2018, 192, 317–329. [Google Scholar] [CrossRef]
  34. Čairović, Đ.; Girgle, F.; Kostiha, V.; Kadlec, J.; Stepanek, P. Comparison and Review of Concrete-to-Concrete Interface Shear Resistance According to Major Design Codes. Solid State Phenom. 2016, 249, 166–172. [Google Scholar] [CrossRef]
  35. Gołdyn, M.; Urban, T. Experimental investigations on interface between ordinary and lightweight aggregate concretes cast at different times. Materials 2021, 14, 1664. [Google Scholar] [CrossRef] [PubMed]
  36. Fang, Z.; Jiang, H.; Liu, A.; Feng, J.; Chen, Y. Horizontal shear behaviors of normal weight and lightweight concrete composite T-beams. Int. J. Concr. Struct. Mater. 2018, 12, 55. [Google Scholar] [CrossRef]
  37. Martins, R.; Carmo, R.N.F.; Costa, H.; Júlio, E.; Cordeiro, T.; Almeida, V. Interface role in composite RC beams with a light-weight concrete core and an ultra high-durability concrete skin. Eng. Struct. 2021, 228, 111524. [Google Scholar] [CrossRef]
  38. EN 1992-1-1: 2004; Eurocode 2: Design of Concrete Structures-Part 1-1: General Rules and Rules for Buildings. European Committee for Standardization: Brussels, Belgium, 2004.
  39. ACI 318-19; Building Code Requirements for Structural Concrete. ACI (American Concrete Institute): Detroit, MI, USA, 2019.
  40. Bentz, E.C.; Collins, M.P. Development of the 2004 Canadian Standards Association (CSA) A23.3 shear provisions for reinforced concrete. Can. J. Civ. Eng. 2006, 33, 521–534. [Google Scholar] [CrossRef]
  41. GB/T 228-2010; Standardization Administration of the People’s Republic of China. Standards Press of China: Beijing, China, 2010.
  42. Gadelmawla, E.S.; Koura, M.M.; Maksoud, T.M.; Elewa, I.M.; Soliman, H.H. Roughness parameters. J. Mater. Process. Technol. 2002, 123, 133–145. [Google Scholar] [CrossRef]
  43. Guo, Z.M.; Xia, L.B.; Chen, Y.; Ye, W.; Wang, H.; Mo, J. Experimental study on shear bearing capacity of combined interface in concrete composite slabs with truss rebars. Concrete 2021, 10, 105–109+114. (In Chinese) [Google Scholar] [CrossRef]
Figure 1. Flowchart.
Buildings 15 00981 g001
Figure 2. Specimen dimensional parameters.
Buildings 15 00981 g002
Figure 3. Arrangement of reinforcement truss and surface roughness conditions.
Buildings 15 00981 g003aBuildings 15 00981 g003b
Figure 4. Schematic diagram of shear test on composite interfaces.
Buildings 15 00981 g004
Figure 5. SEM characterization of ceramsite concrete.
Buildings 15 00981 g005
Figure 6. Failure modes of specimens.
Buildings 15 00981 g006aBuildings 15 00981 g006b
Figure 7. Curves of relative interface displacement on both sides of the composite interface with load variation.
Buildings 15 00981 g007
Figure 8. Decomposition of internal forces in web reinforcement.
Buildings 15 00981 g008
Figure 9. Finite element analysis model.
Buildings 15 00981 g009
Figure 10. Shear load–displacement curves of double-sided direct shear specimens of new and old concrete.
Buildings 15 00981 g010aBuildings 15 00981 g010b
Figure 11. Typical Mises stress distribution of the specimen.
Buildings 15 00981 g011
Table 1. Dimensional parameters of specimens for shear capacity of composite interfaces.
SpecimenSpecimen DimensionsTruss ReinforcementNumber of SpecimensSpecimen IDs
a/mmb/mmc/mmd/mmx/mmS/mmL/mmH/mmm
TH13503503006070115907001TH1-1
TH23503503006070115907012TH2-1, TH2-2
TH33503503006070115907023TH3-1, TH3-2, TH3-3
Table 2. Measured roughness values of ceramsite concrete composite interfaces.
Specimen IDRoughness 1Roughness 2
TH1-12.462.88
TH2-12.762.83
TH2-22.362.68
TH3-12.82.6
TH3-22.542.74
TH3-32.732.49
Table 3. Values of c and μ.
RaSurface Descriptionμc
Almost 0Very smooth0.50.025
<1.5 mmSmooth0.60.350
≥1.5 mmRough0.70.450
≥3 mmVery rough0.90.500
Table 4. Values of friction coefficient μ.
ConditionInterface Condition μ
1Concrete cast on clean, laitance-free hardened concrete with full amplitude roughness of 1/4 inch or more 1.0 λ 1
2Concrete cast on clean, laitance-free hardened concrete not intentionally roughened 0.6 λ
Note: λ 1 is the factor considering the effect of lightweight aggregate on concrete performance. For normal-weight concrete, λ = 1.0 ; for lightweight concrete, λ = 0.75 .
Table 5. Values of λ and μ.
ConditionInterface Condition μ
1Concrete cast on clean, laitance-free hardened concrete with surface roughness of 5 mm or more1.0
2Concrete cast on clean, laitance-free hardened concrete not intentionally roughened0.6
Table 6. Shear test results of specimen–composite interfaces.
Specimen Number A v c /m2 A v f /mm2 ρ v = A v f / A v c /10−3 V u / K N V R / M P a
TH1-10.122500121.90.995
TH2-10.12251130.92219.61.793
TH2-20.12251130.92208.41.701
TH3-10.12252261.84202.71.655
TH3-20.12252261.84285.92.334
TH3-30.12252261.84238.41.946
Table 7. Calculation formulas for shear stress on composite interfaces.
Regulation v c v v c f v v
Eurocode 2 0.45 f c t 0.7 σ n + 0.7 ρ v f y sin β ρ v f y cos β cos γ
ACI318-140 0.45 ρ v f y sin β ρ v f y cos β cos γ
CSA23.3-040.1875 0.45 σ n + 0.45 ρ v f y sin β ρ v f y cos β cos γ
GB50010-2010 1.2 f ct 0.85 ρ v f y sin β 0
Table 8. Shear stress v R (MPa) obtained by different formulas.
Specimen NumberTest ValueEurocode 2ACI318-14CSA23.3-04GB50010-2010
TH1-10.9950.96800.1882.58
TH2-11.7931.2410.2270.4152.737
TH2-21.7011.2410.2270.4152.737
TH3-11.6551.5150.4540.6422.895
TH3-22.3341.5150.4540.6422.895
TH3-31.9461.5150.4540.6422.895
Table 9. Shear stiffness of different specimens.
Specimen Number Maximum   Shear   Stress   V R ( M P a ) Shear Stiffness K (MPa/mm)
TH1-10.99516.36
TH2-11.79322.37
TH2-21.70130.92
TH3-11.65513.60
TH3-22.33415.52
TH3-31.94612.79
Disclaimer/Publisher’s Note: The statements, opinions and data contained in all publications are solely those of the individual author(s) and contributor(s) and not of MDPI and/or the editor(s). MDPI and/or the editor(s) disclaim responsibility for any injury to people or property resulting from any ideas, methods, instructions or products referred to in the content.

