
The Impact of Coarse Aggregate Parent Rock Types on the Freeze–Thaw Performance of Concrete: A Comparative Study


Abstract
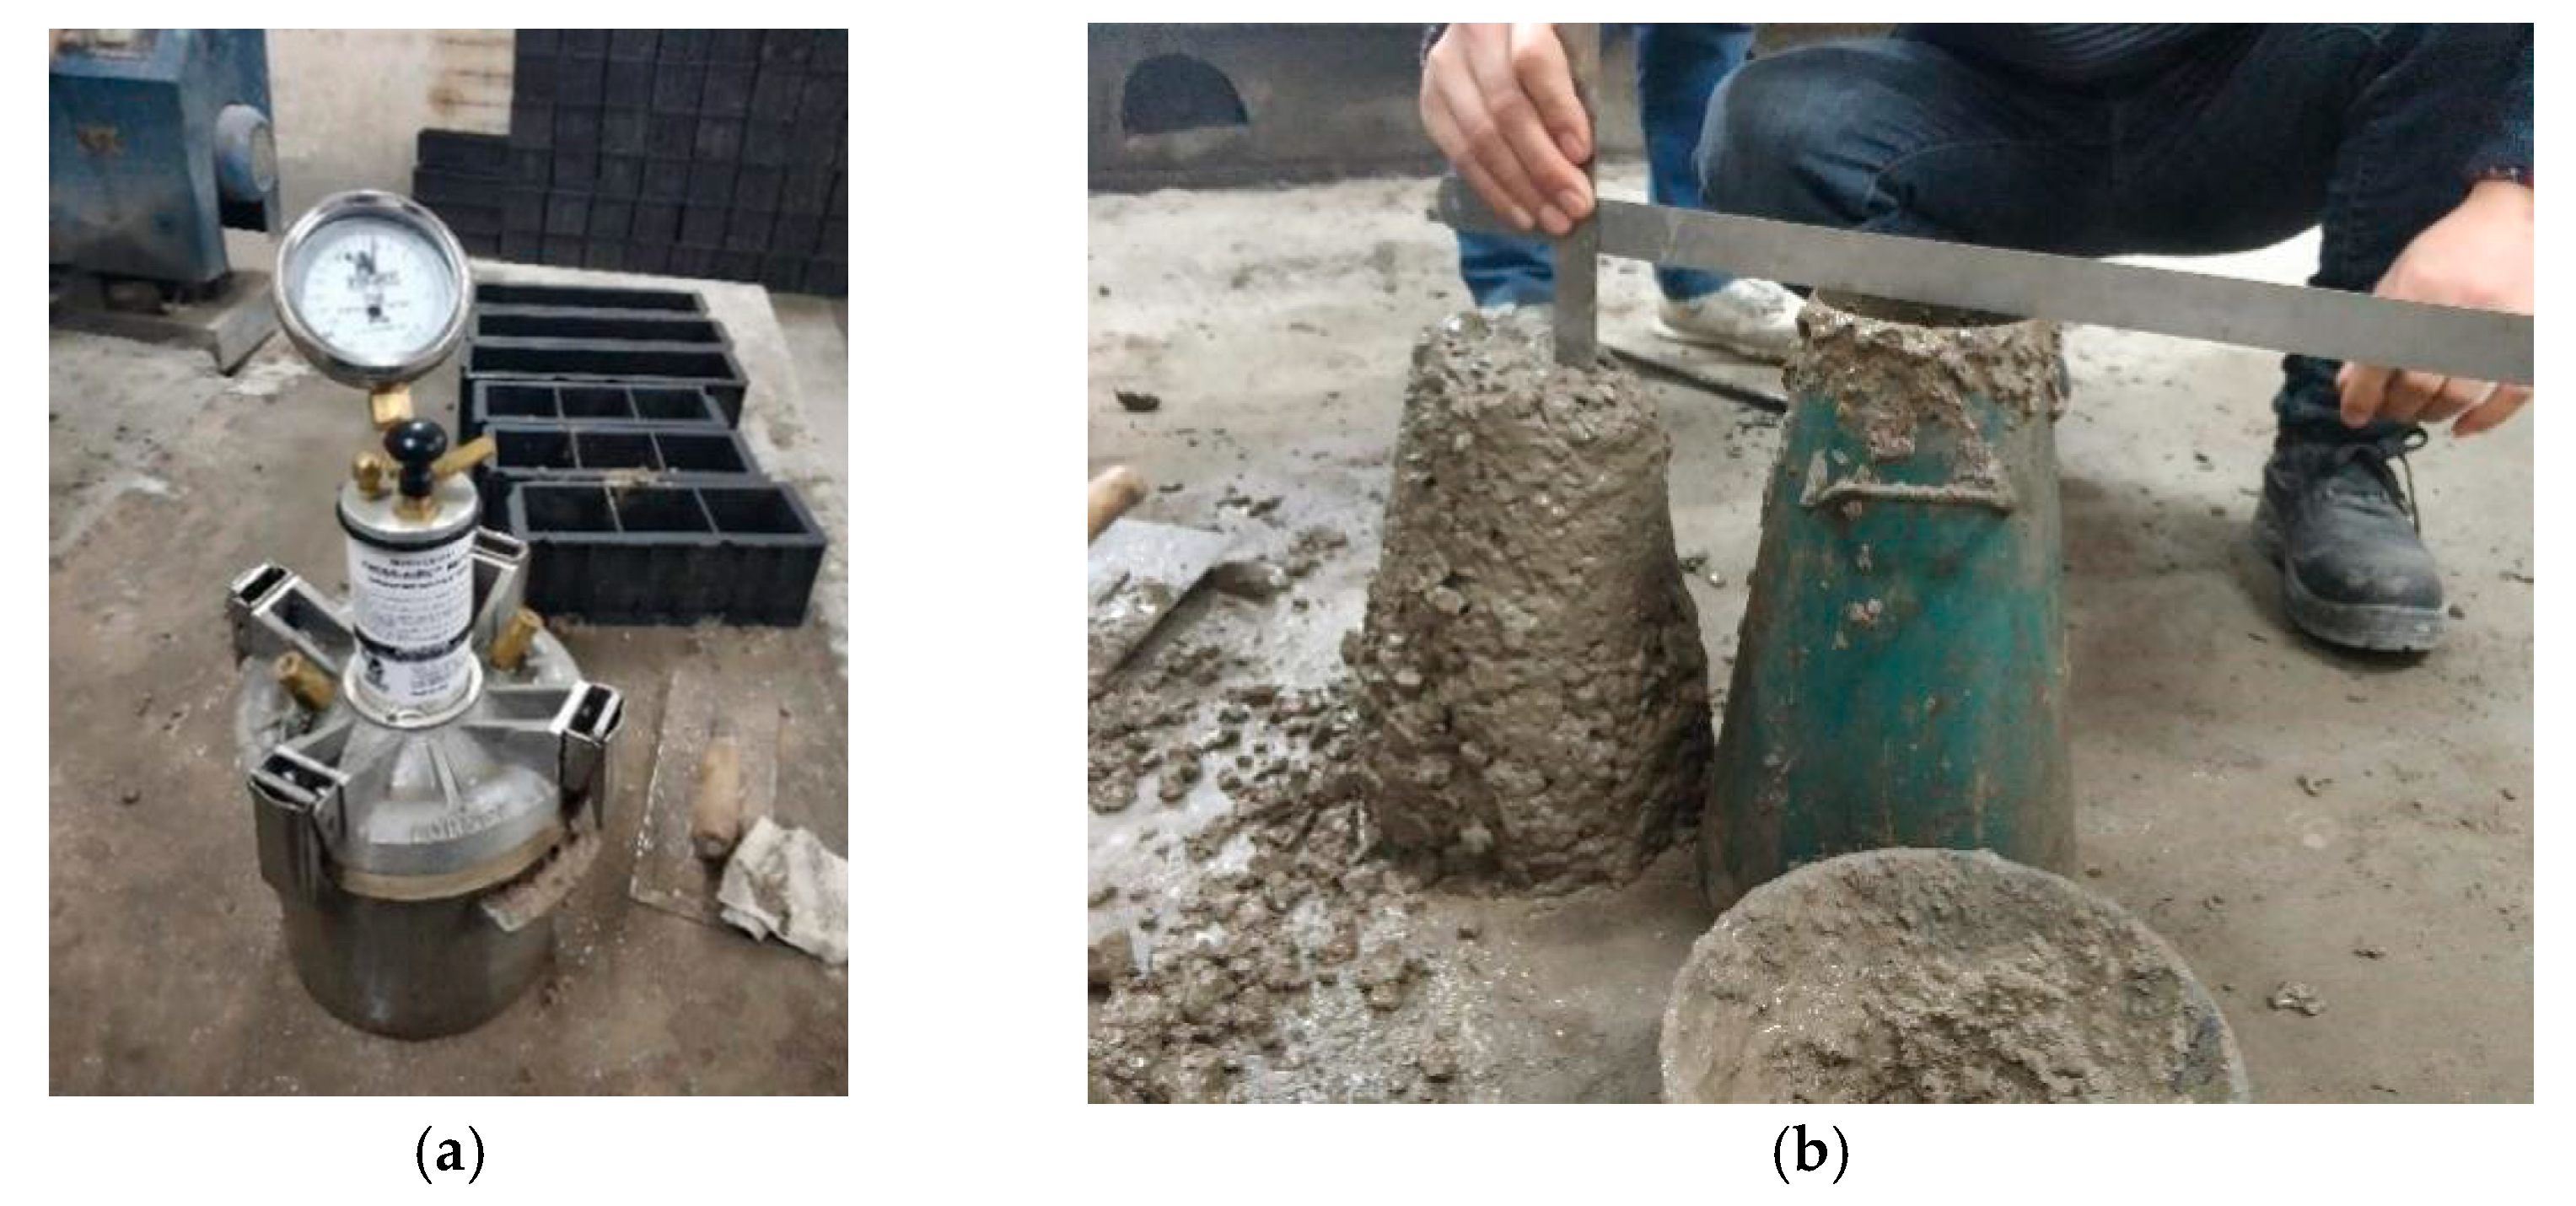
1. Introduction
2. Experimental Details
2.1. Materials
2.1.1. Cement and Mixtures
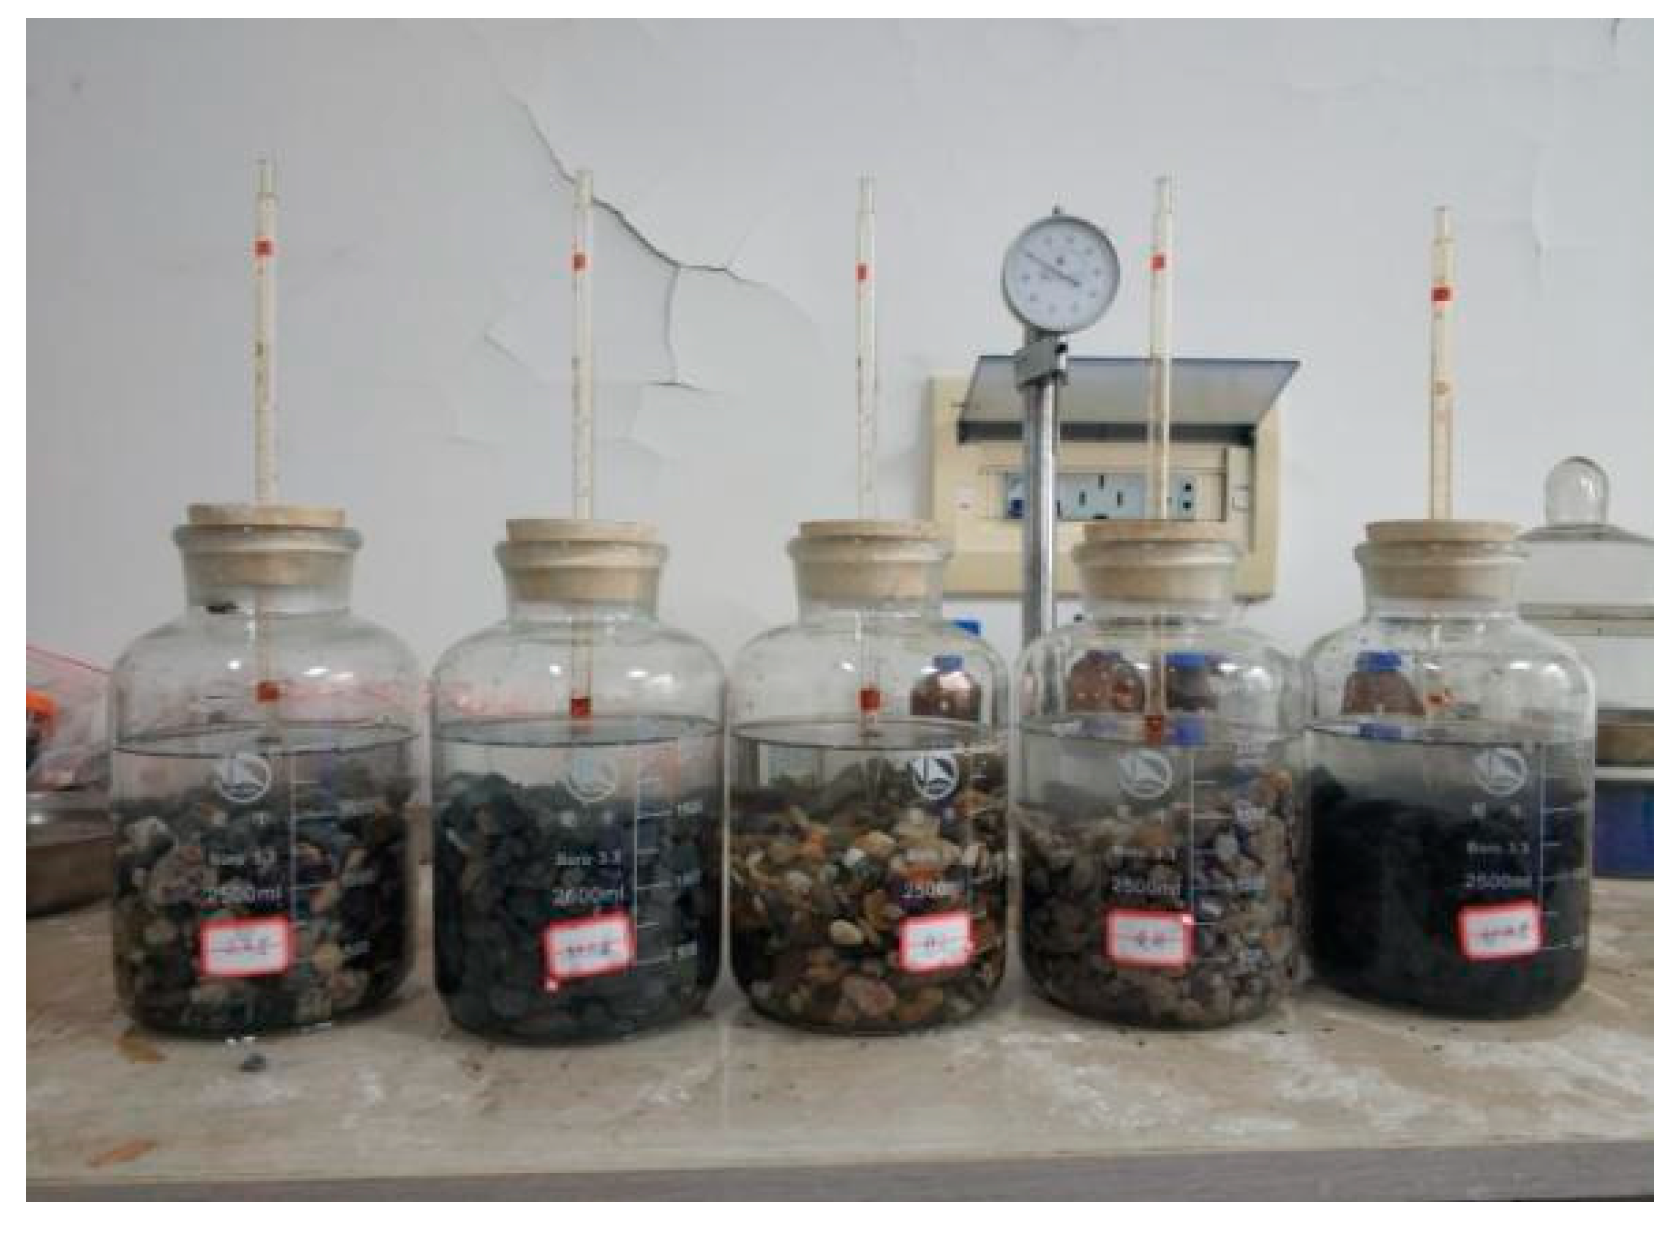
2.1.2. Coarse Aggregates and Mix Proportion
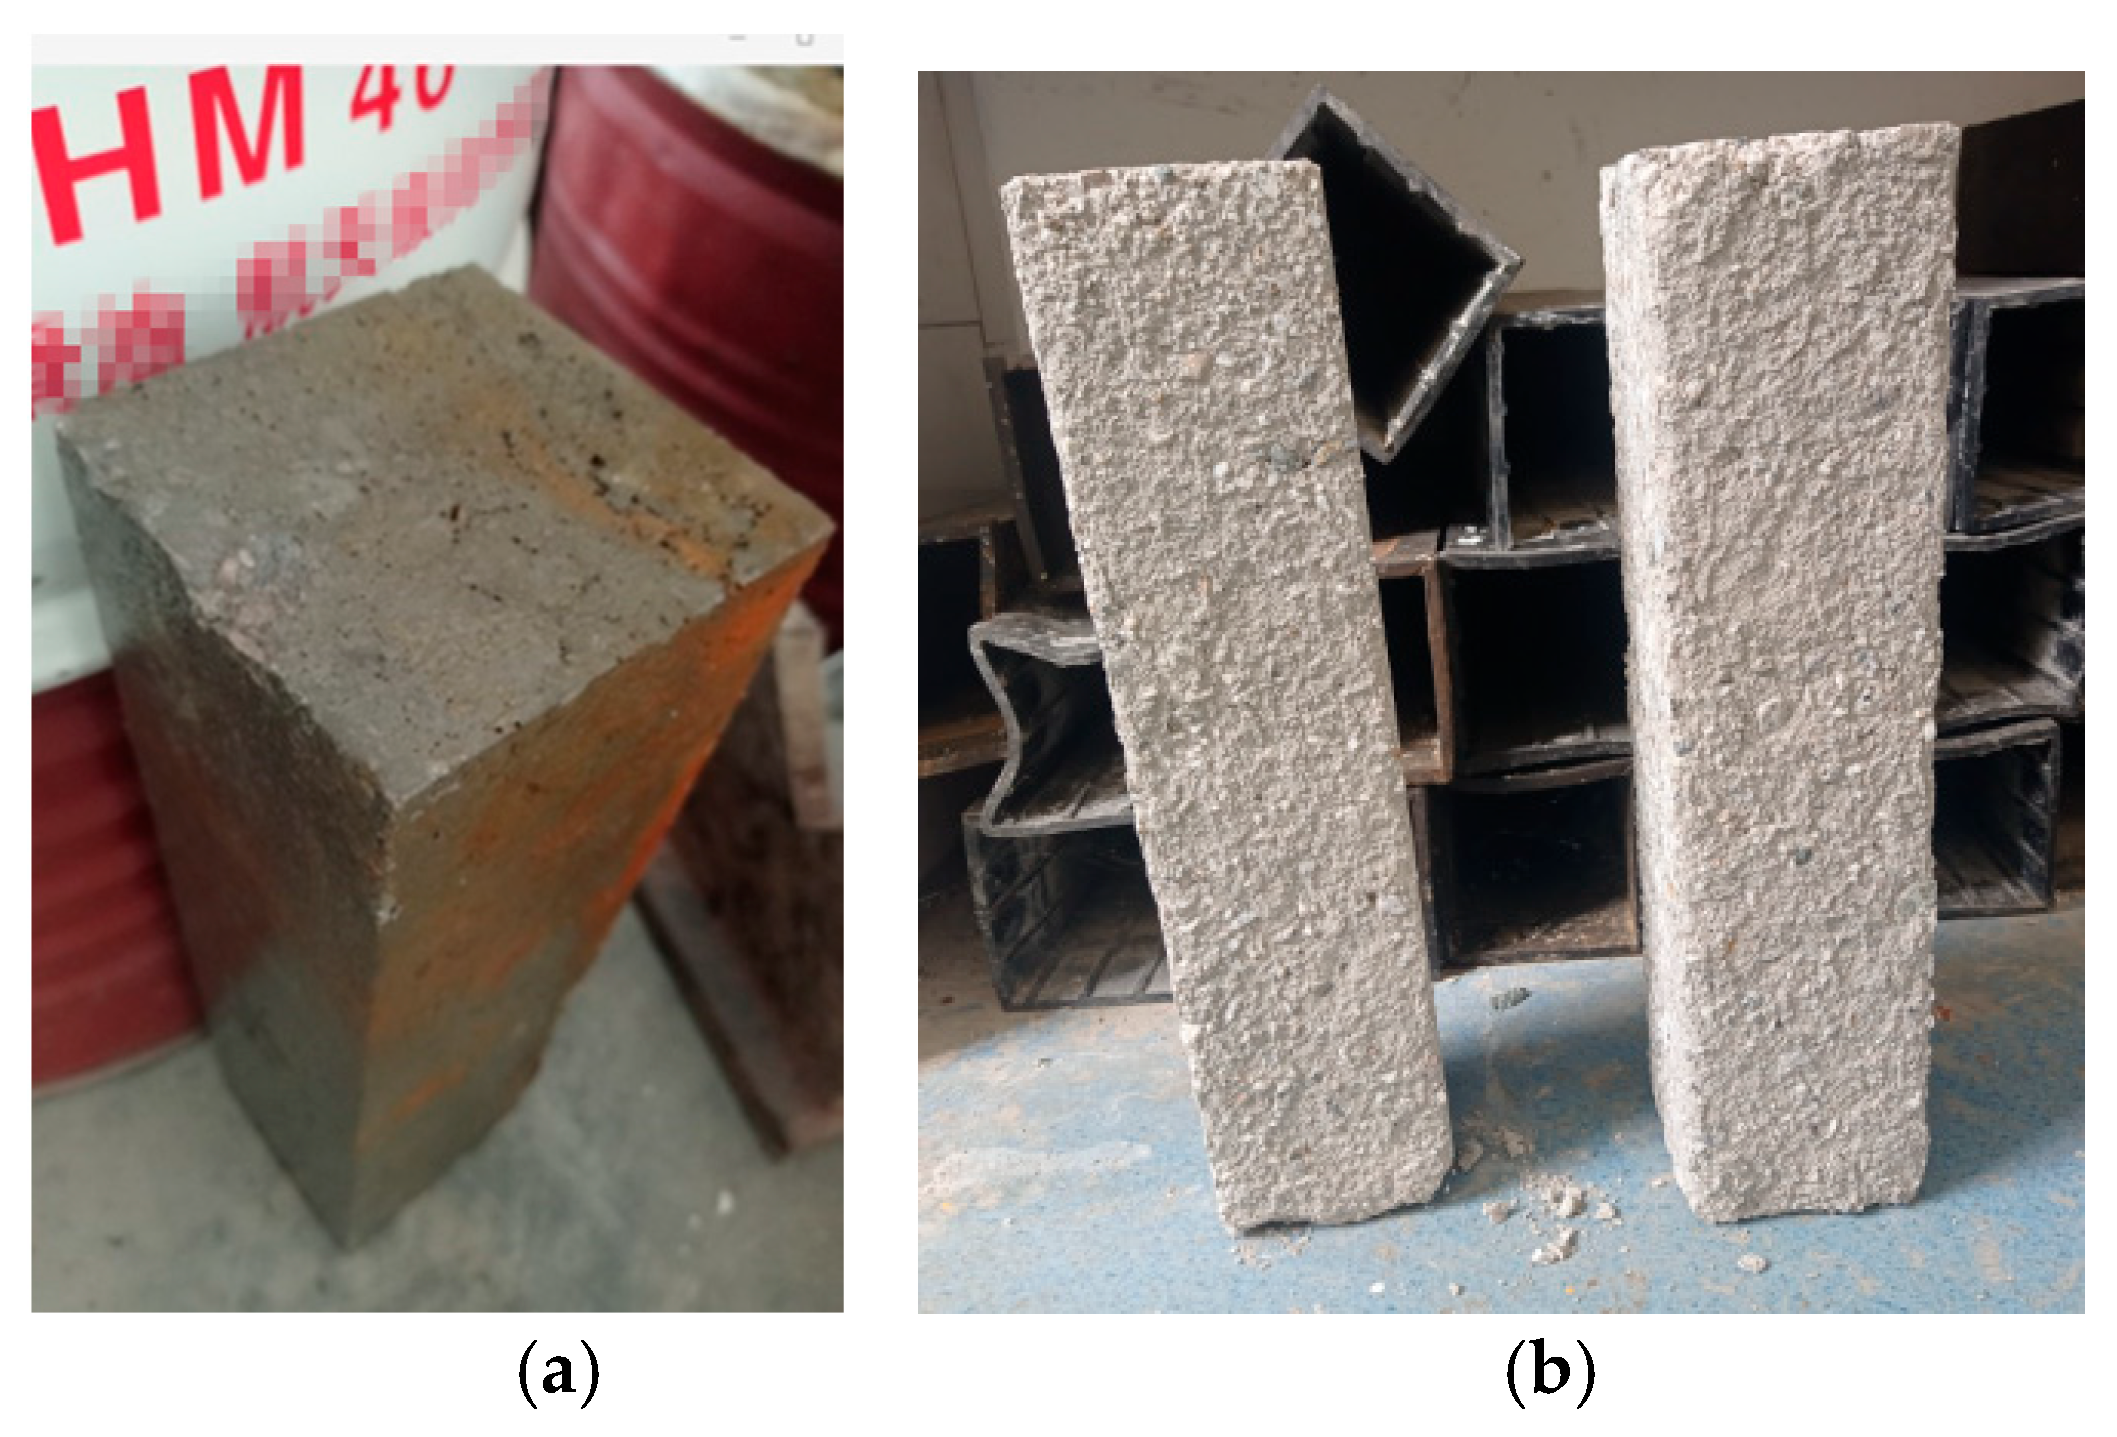
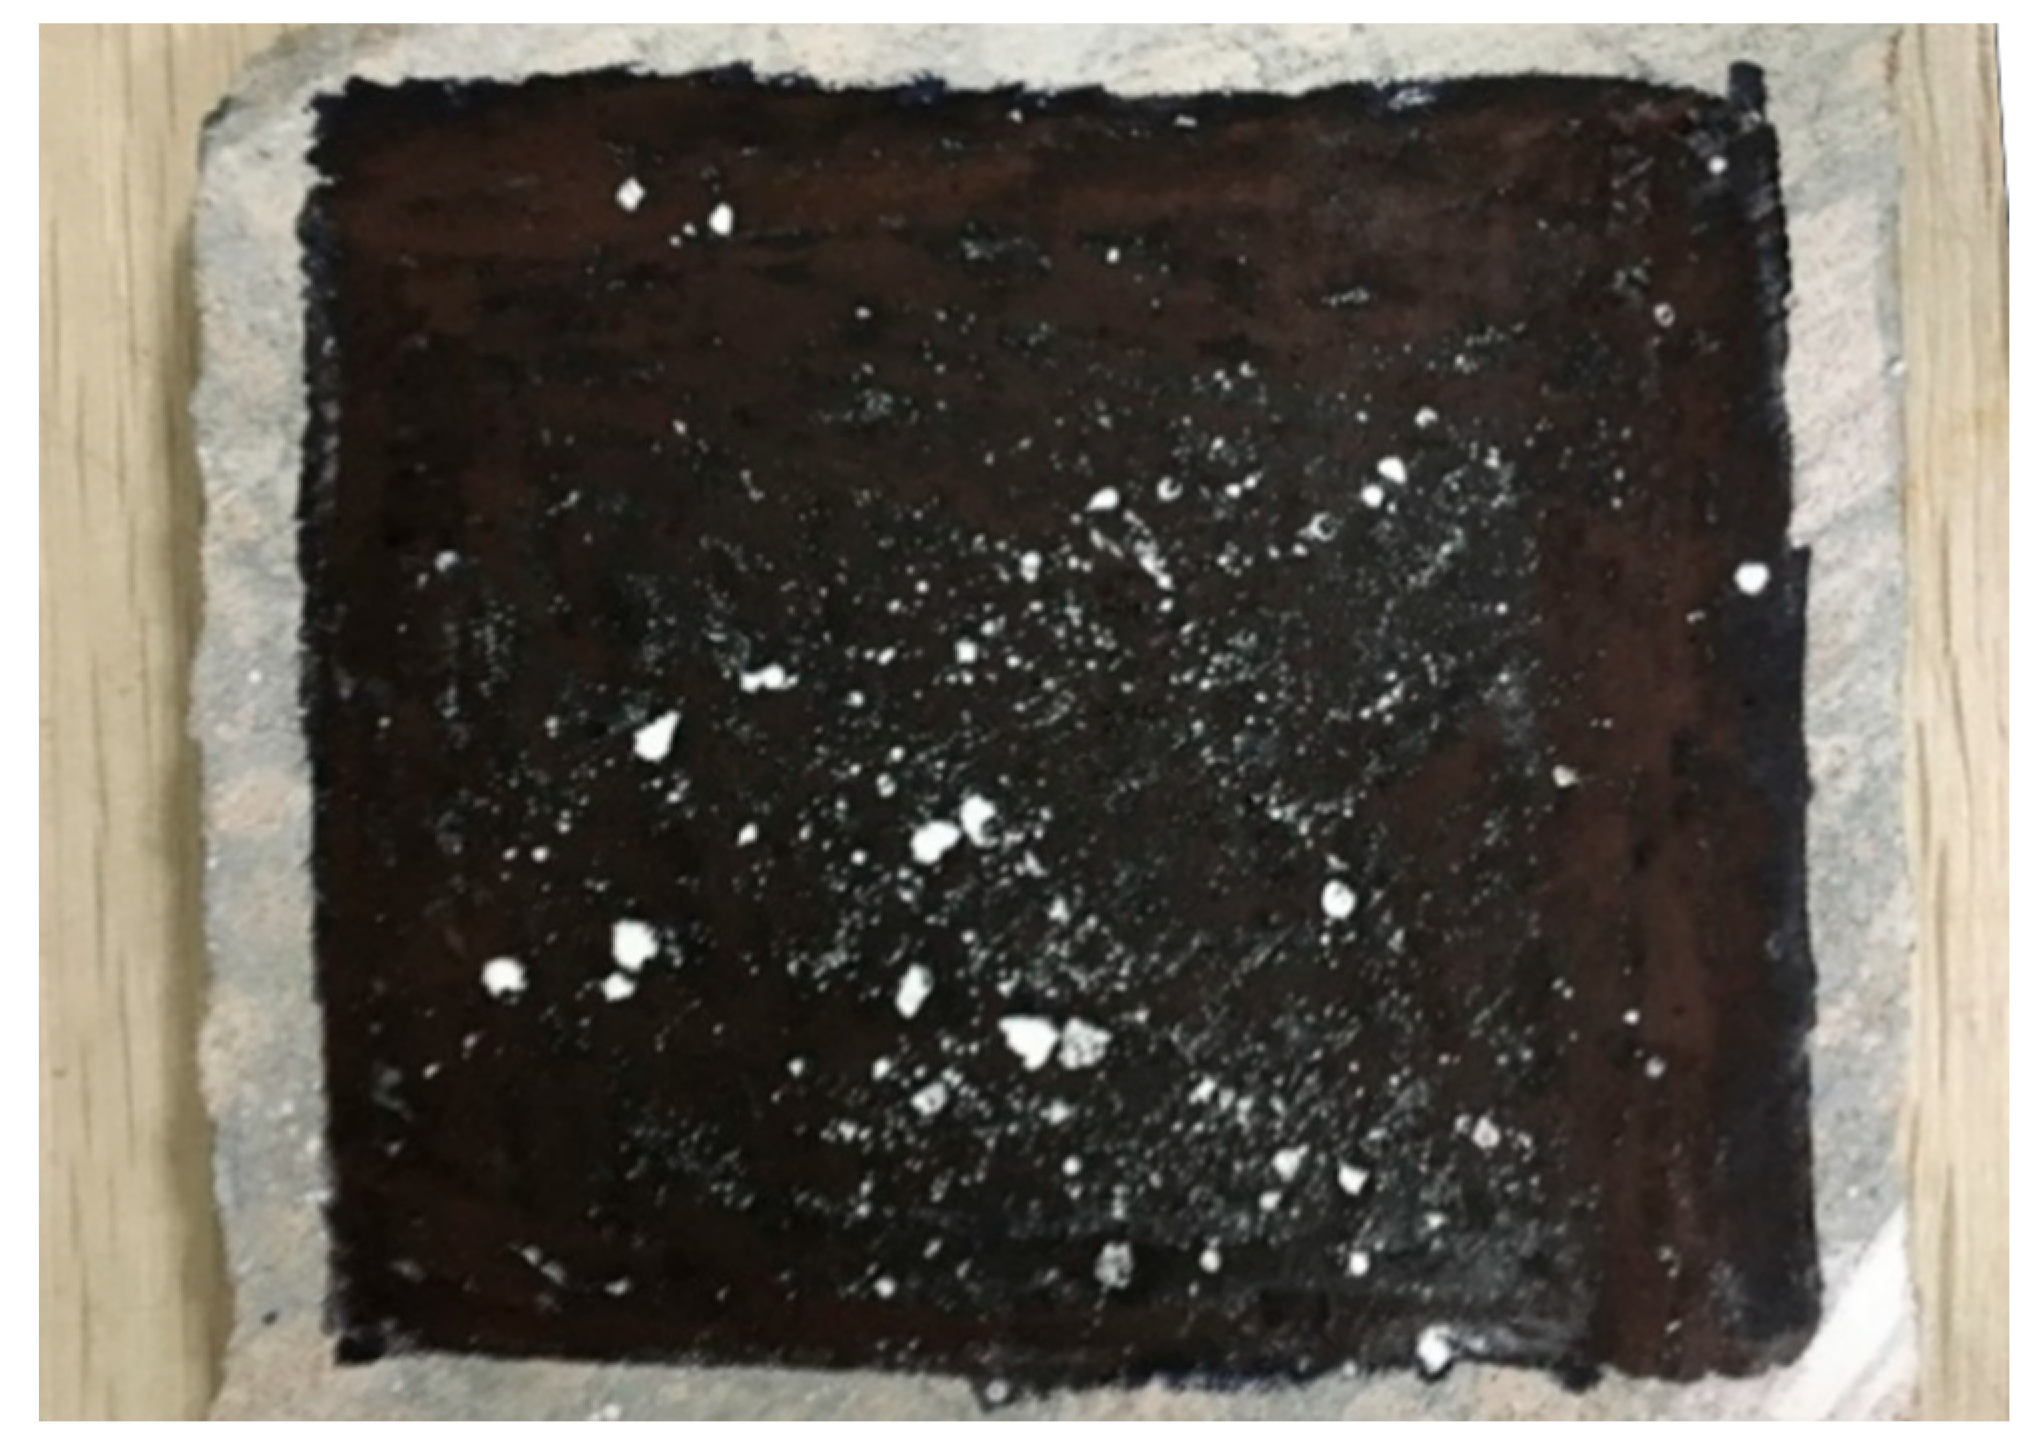
2.2. Concrete Specimen Preparation
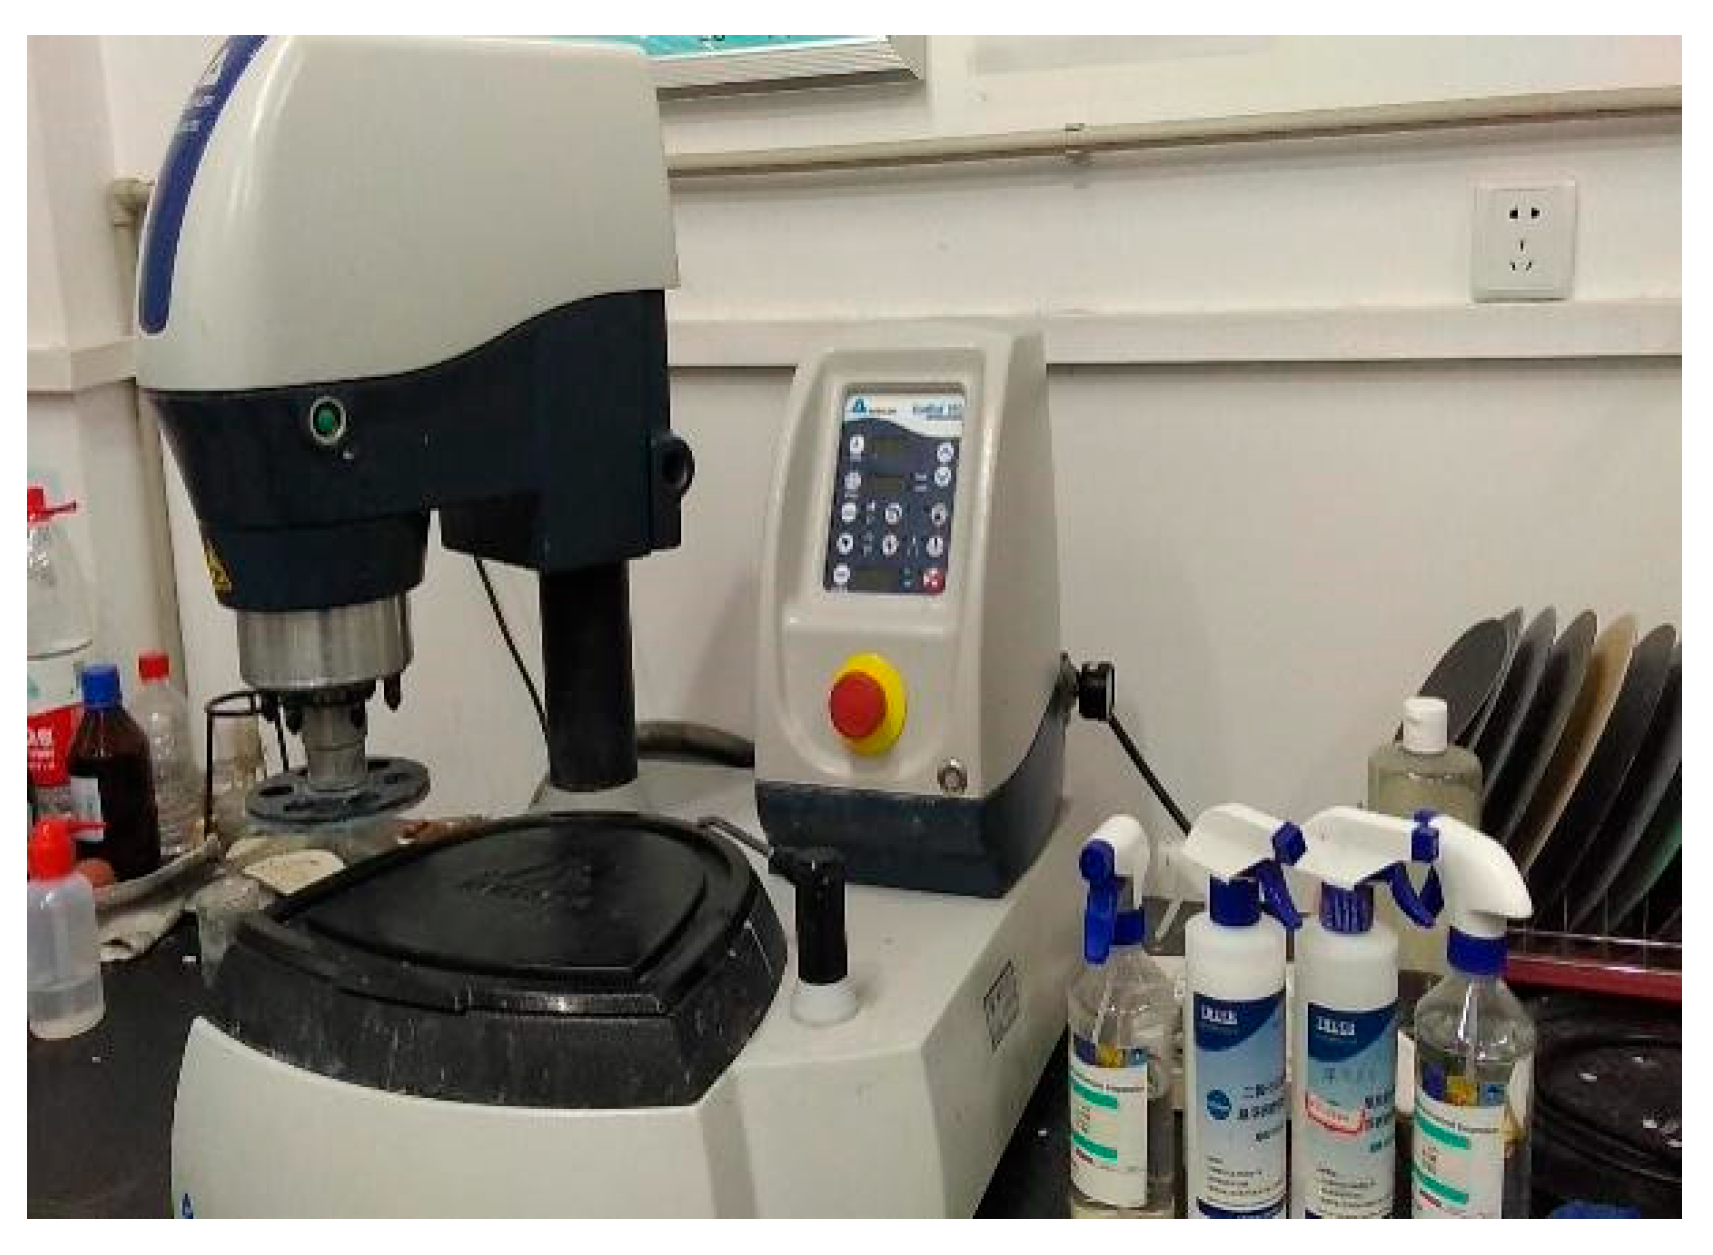
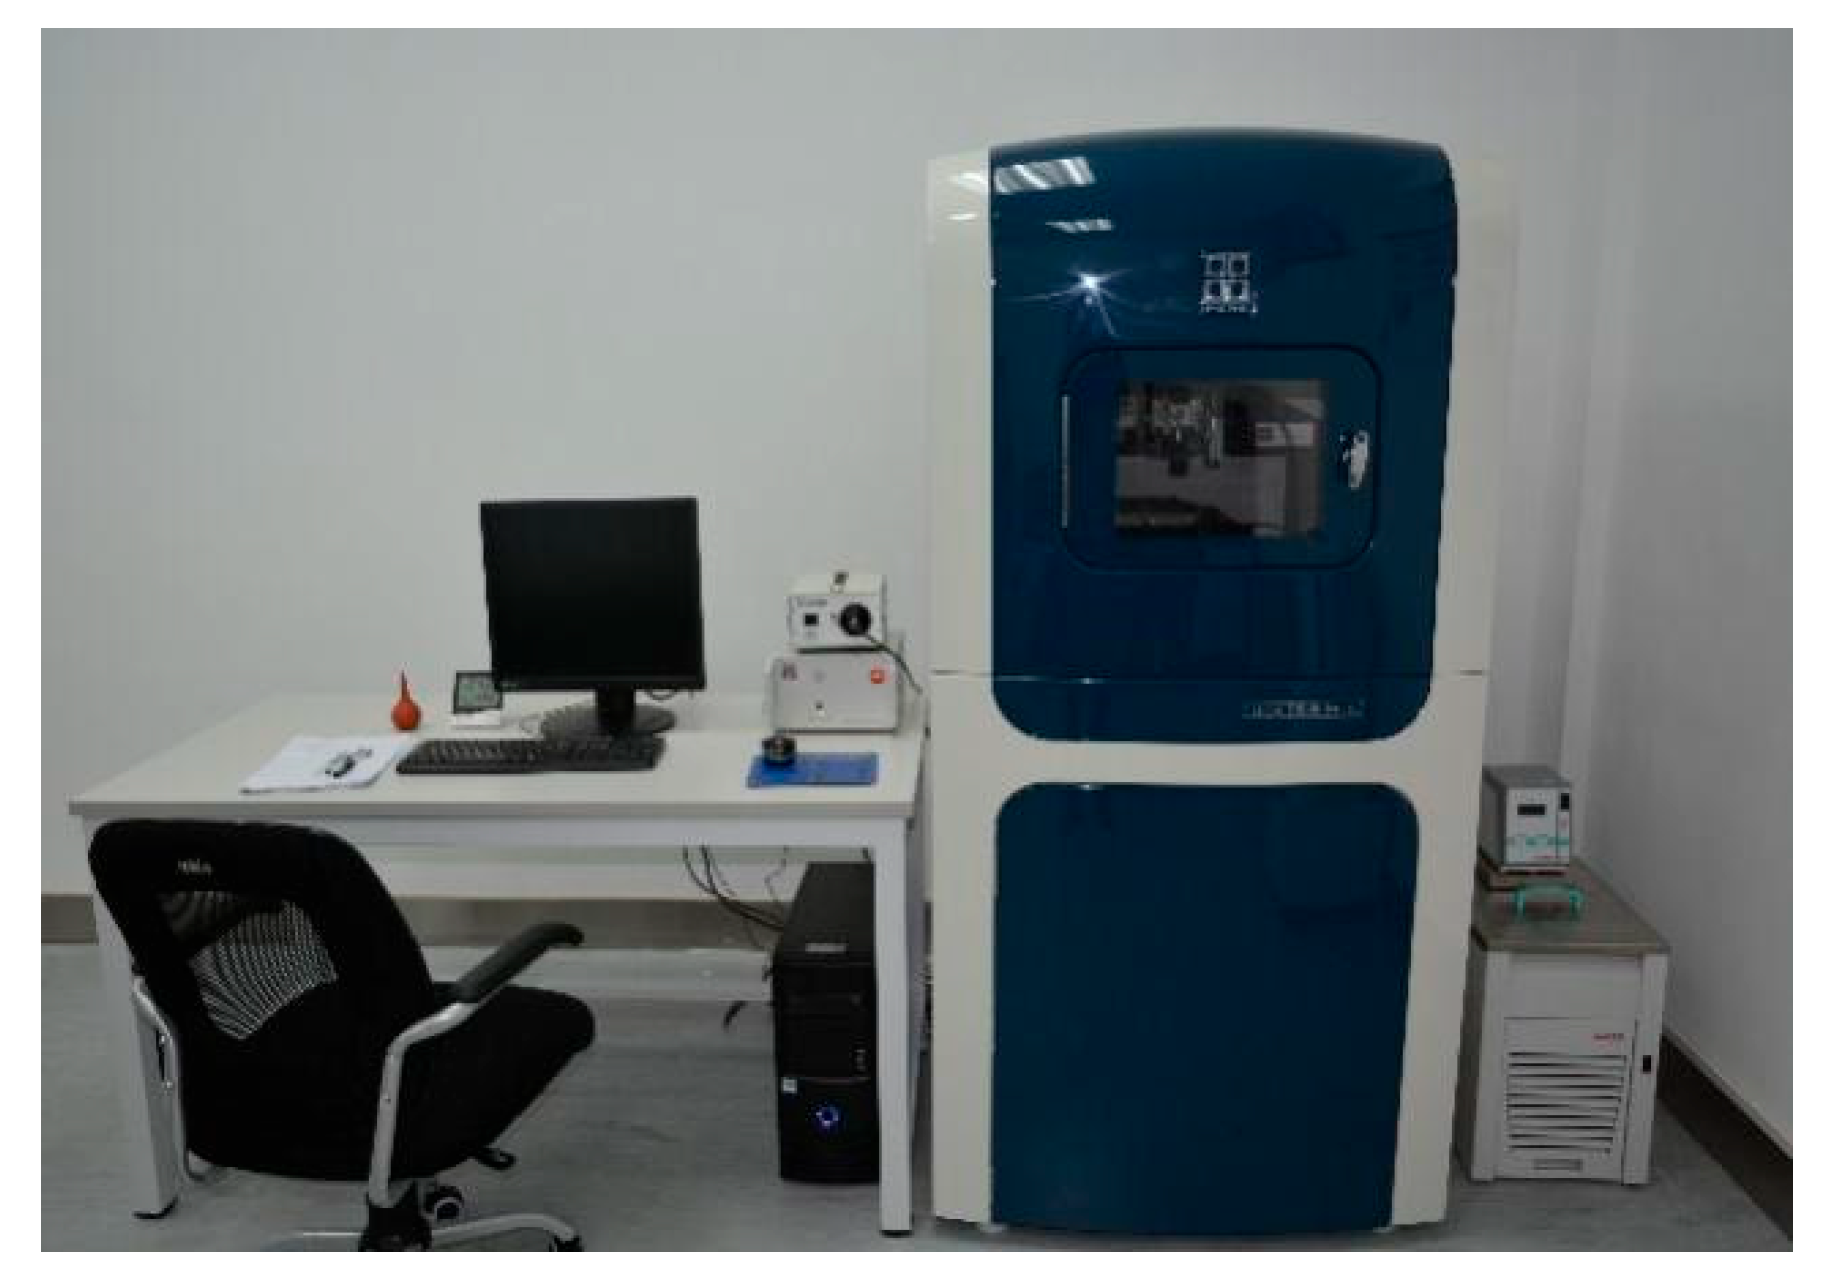
2.3. Test Equipment and Methods
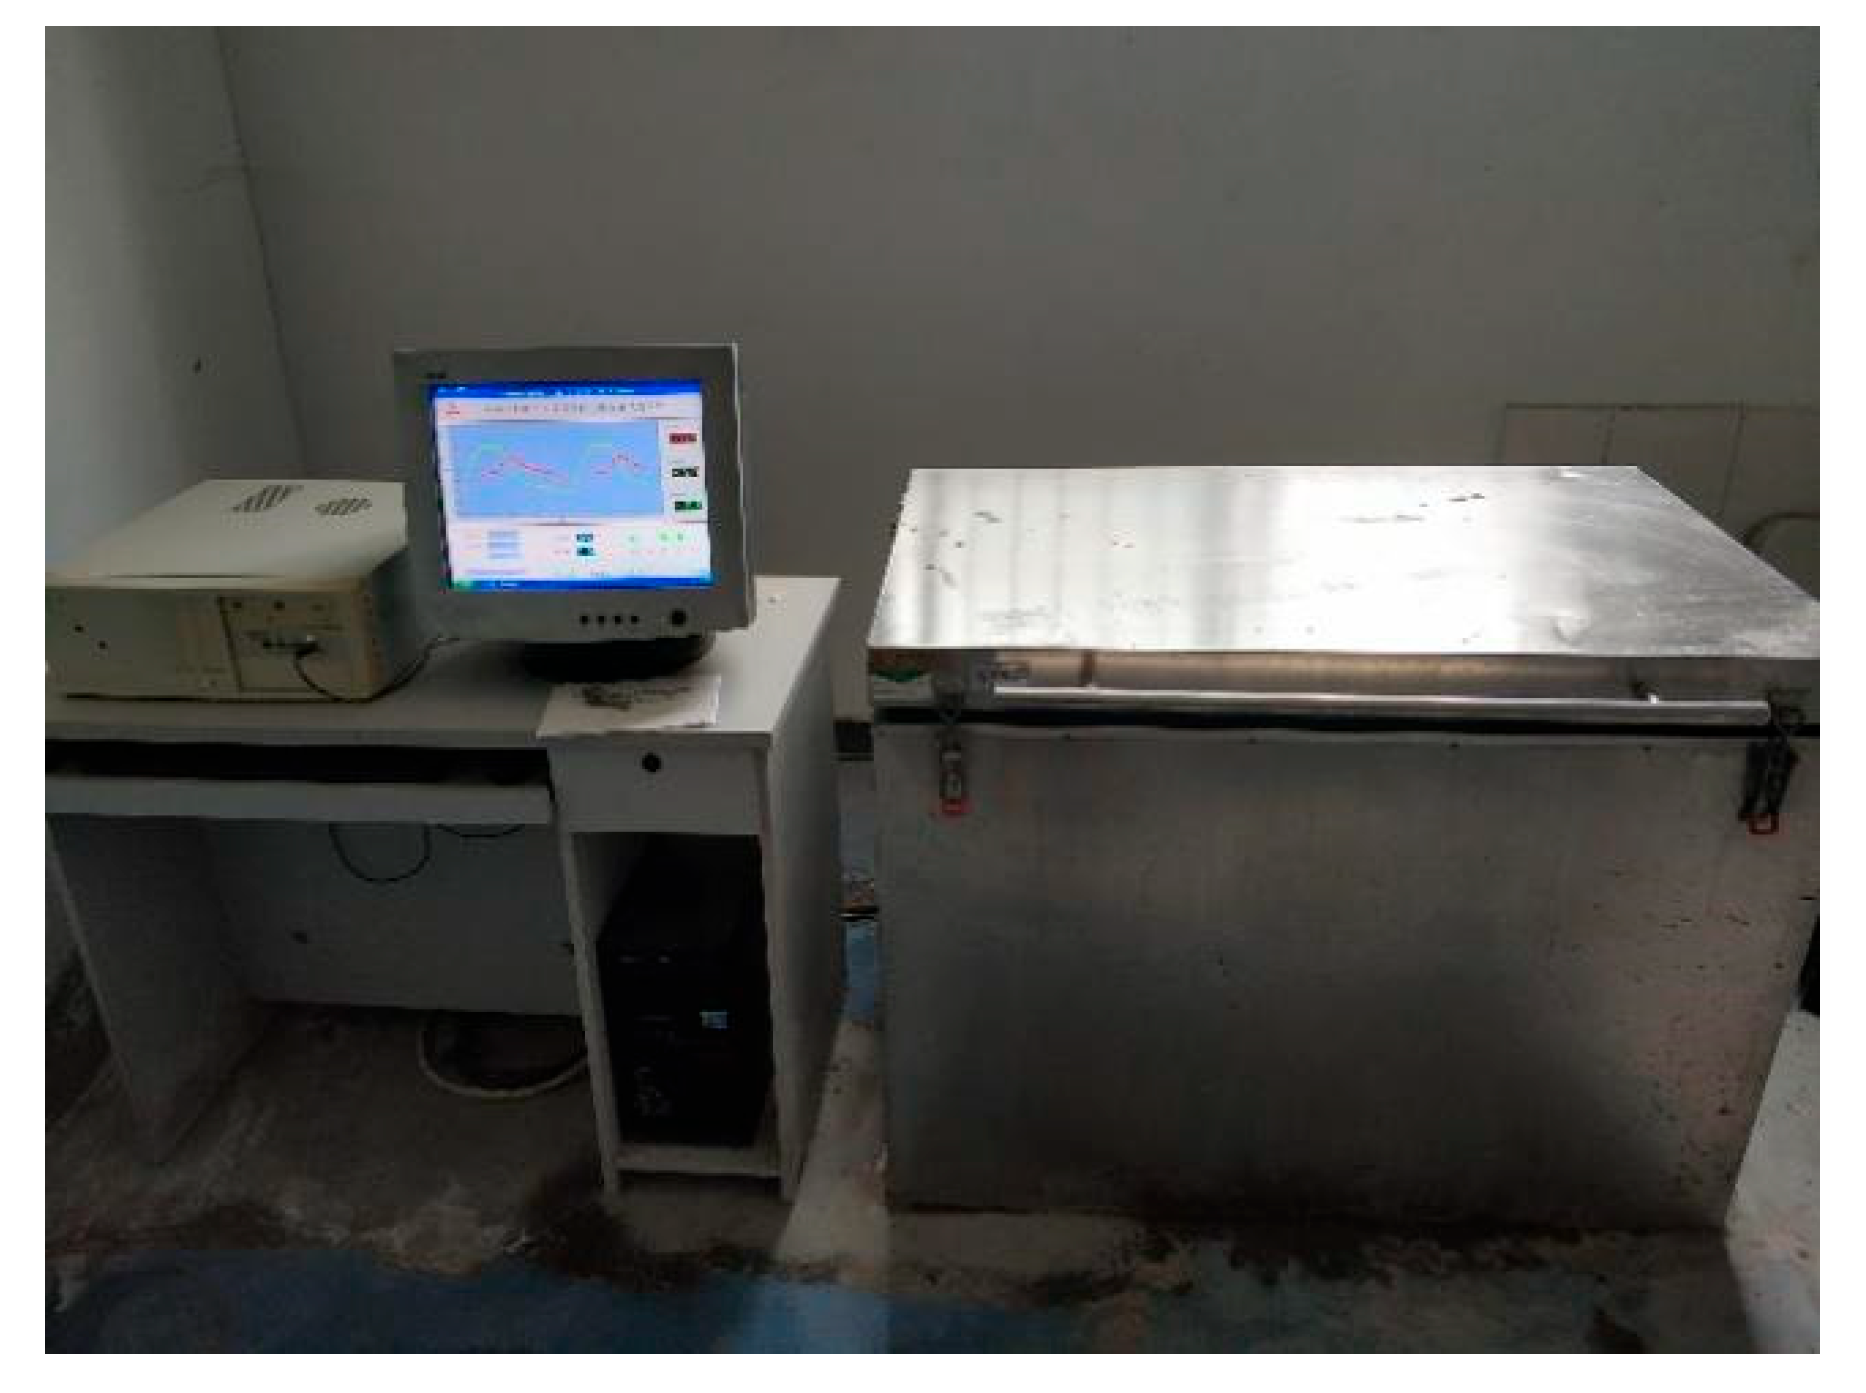
2.3.1. Freeze–Thaw Cycle
2.3.2. Pore Test
2.3.3. SEM-EDS
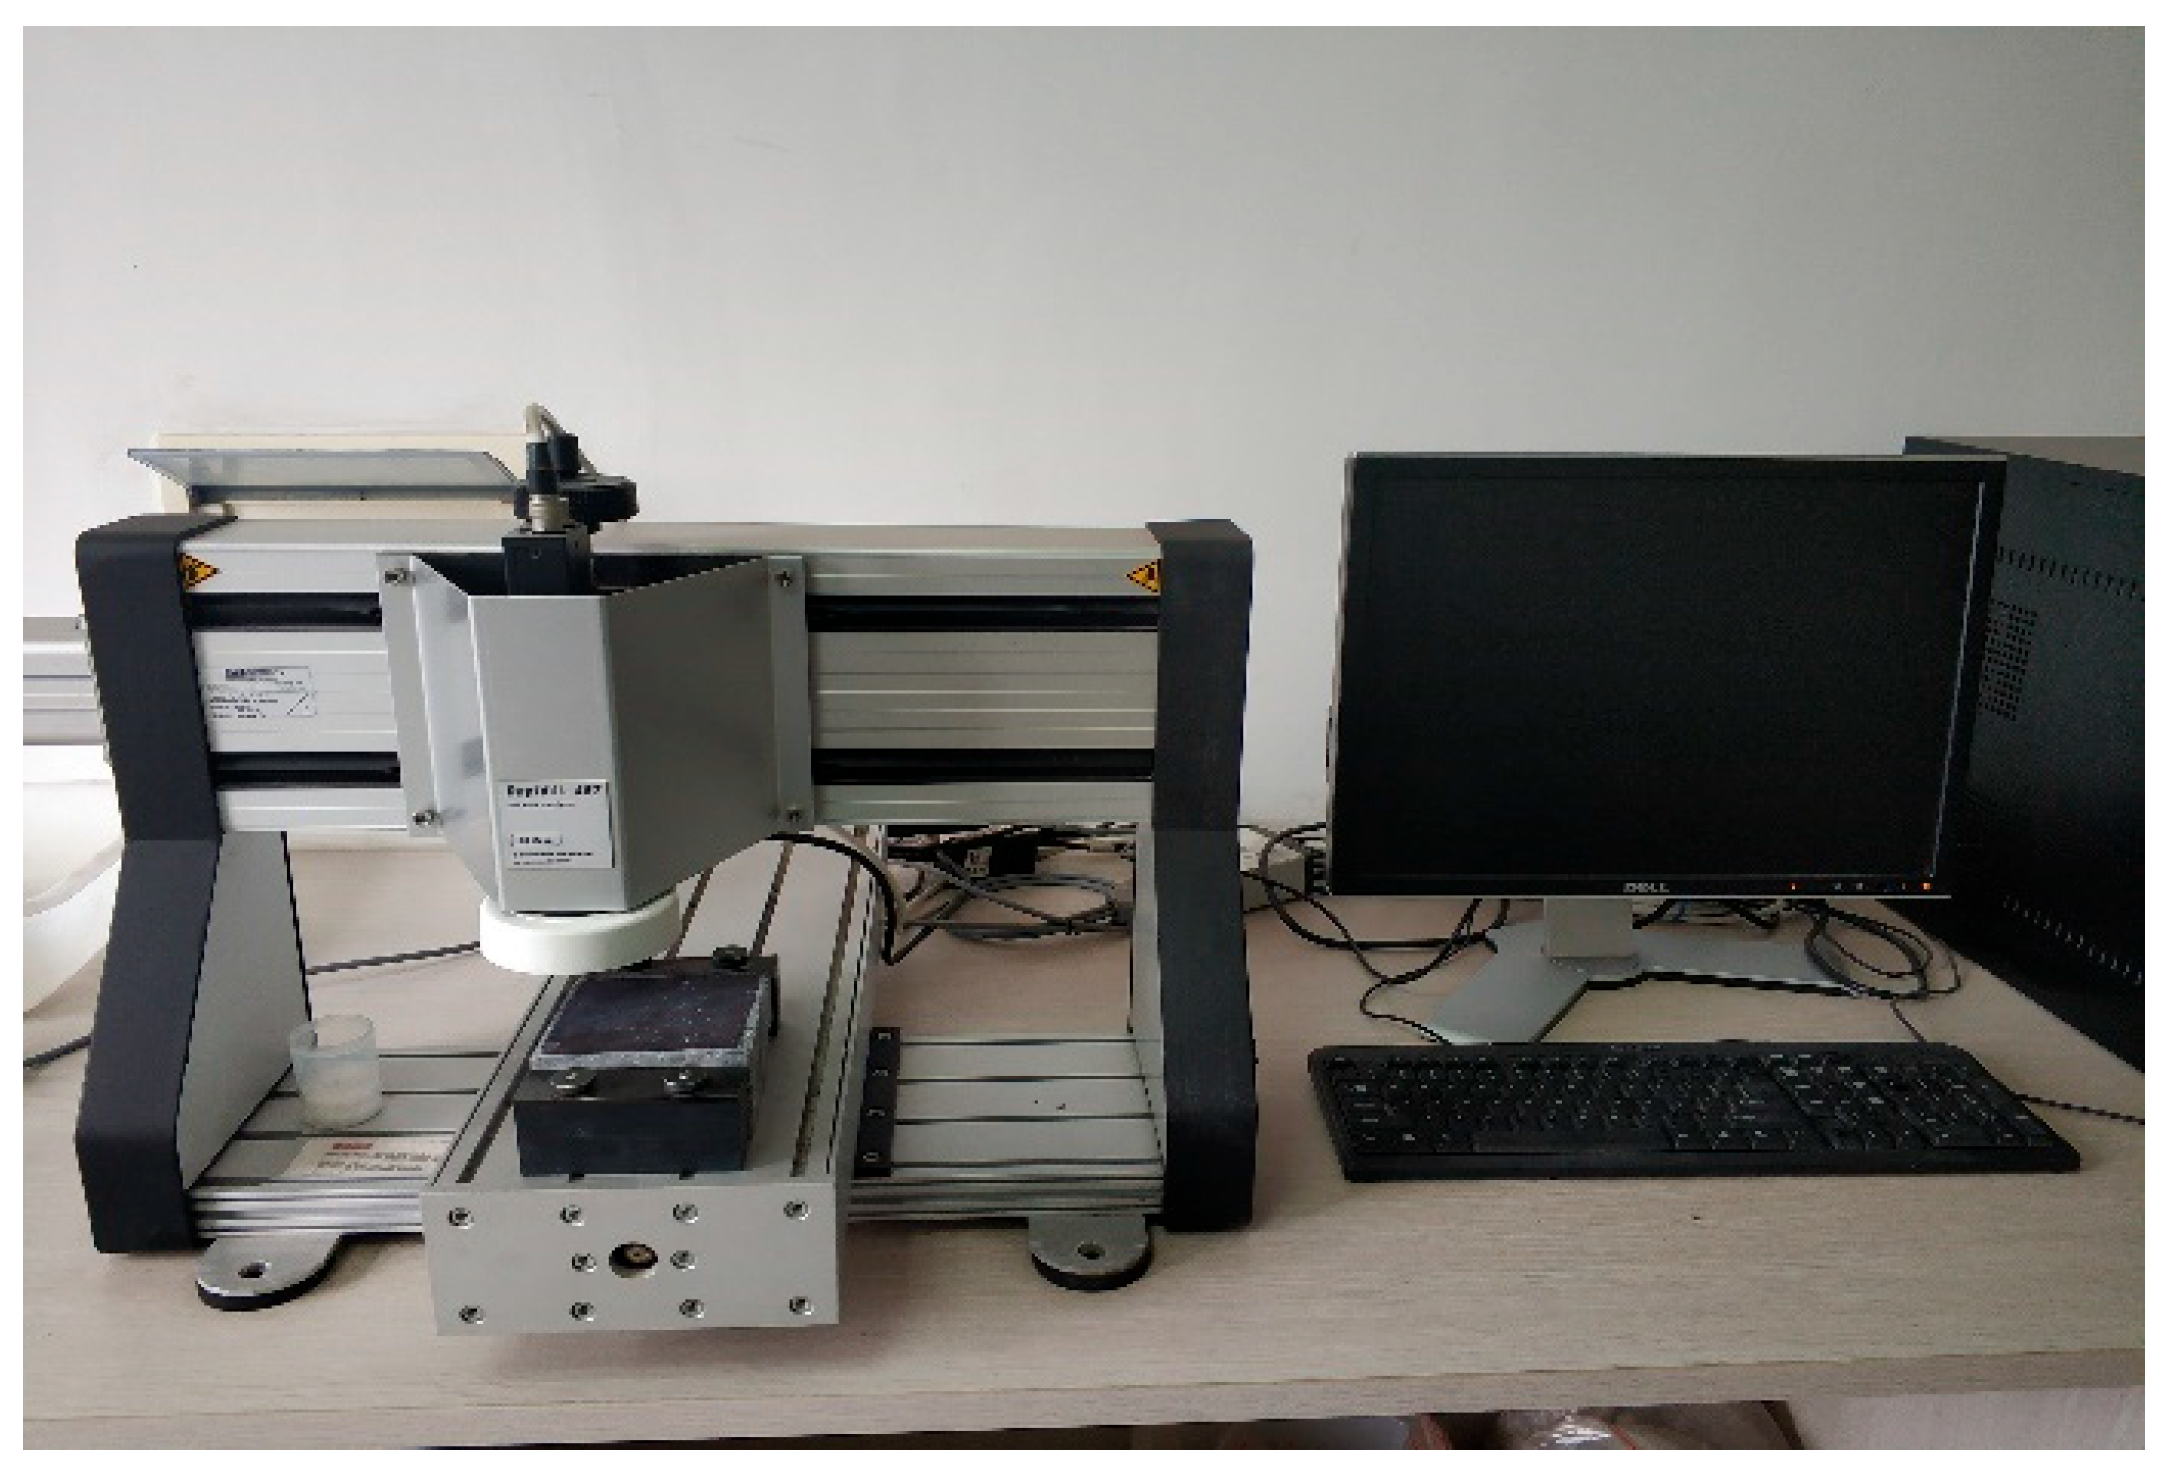
2.3.4. Nano-Indentation Test
2.4. Measurement
2.4.1. Saturated Surface-Dry Water Absorption Rate
2.4.2. Mass Loss Rate
2.4.3. Relative Dynamic Modulus
2.4.4. Linear Expansion Coefficient
2.4.5. Water Absorption Rate
2.5. Research Design
3. Results and Discussion
3.1. Properties of the Rocks
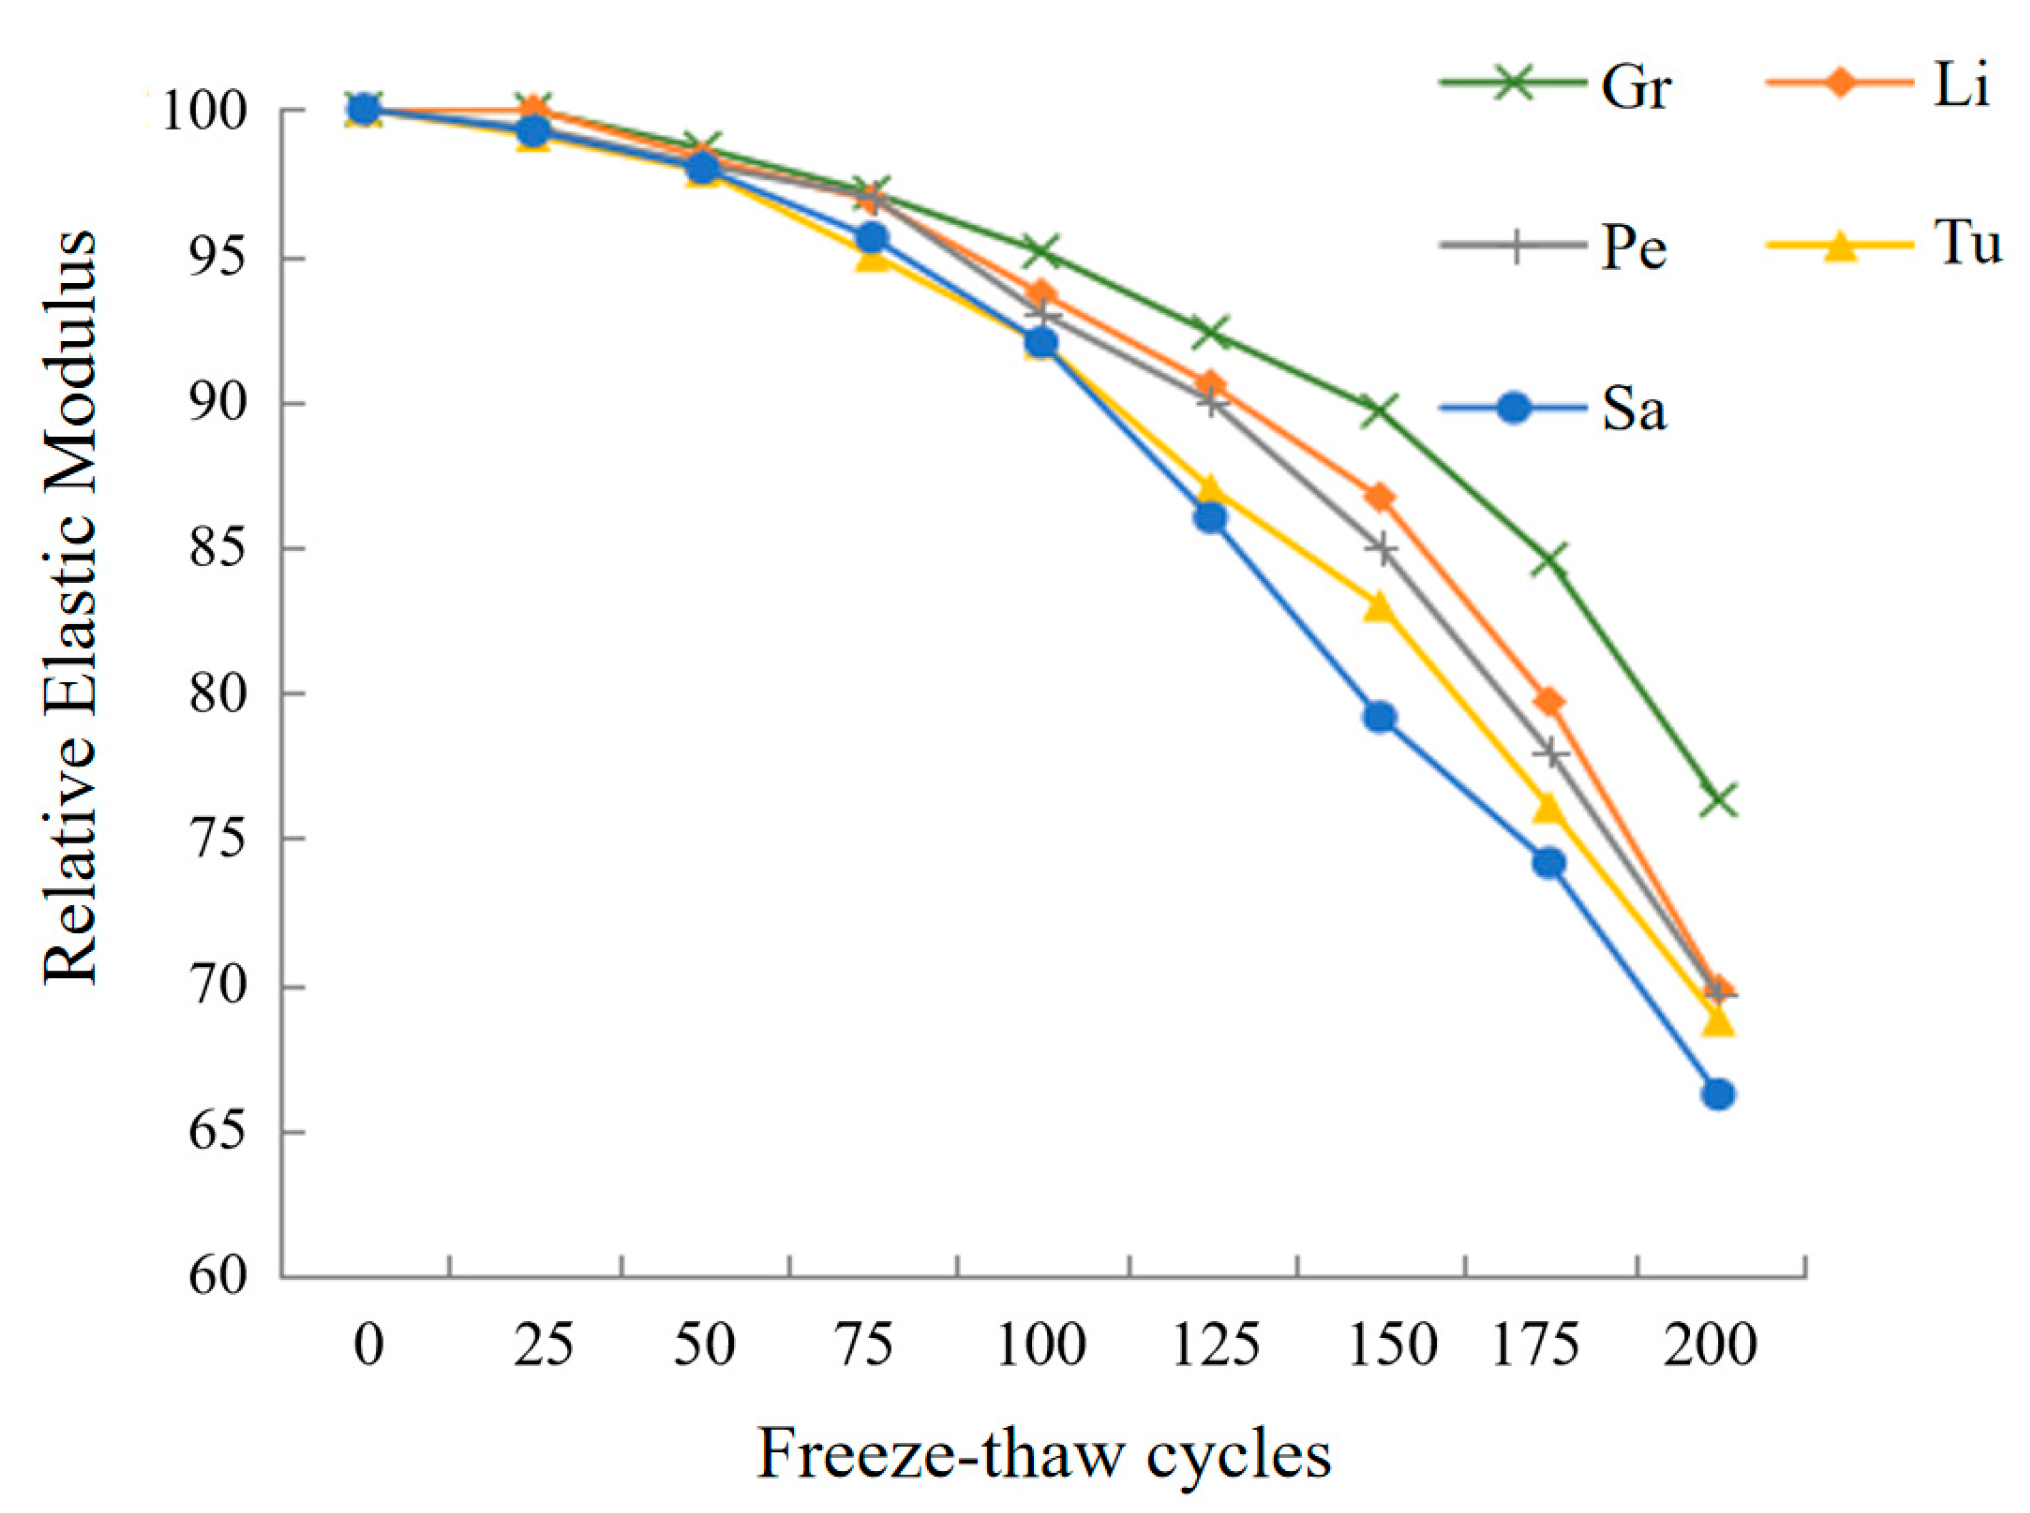
3.2. Properties of Concrete with Different Rocks
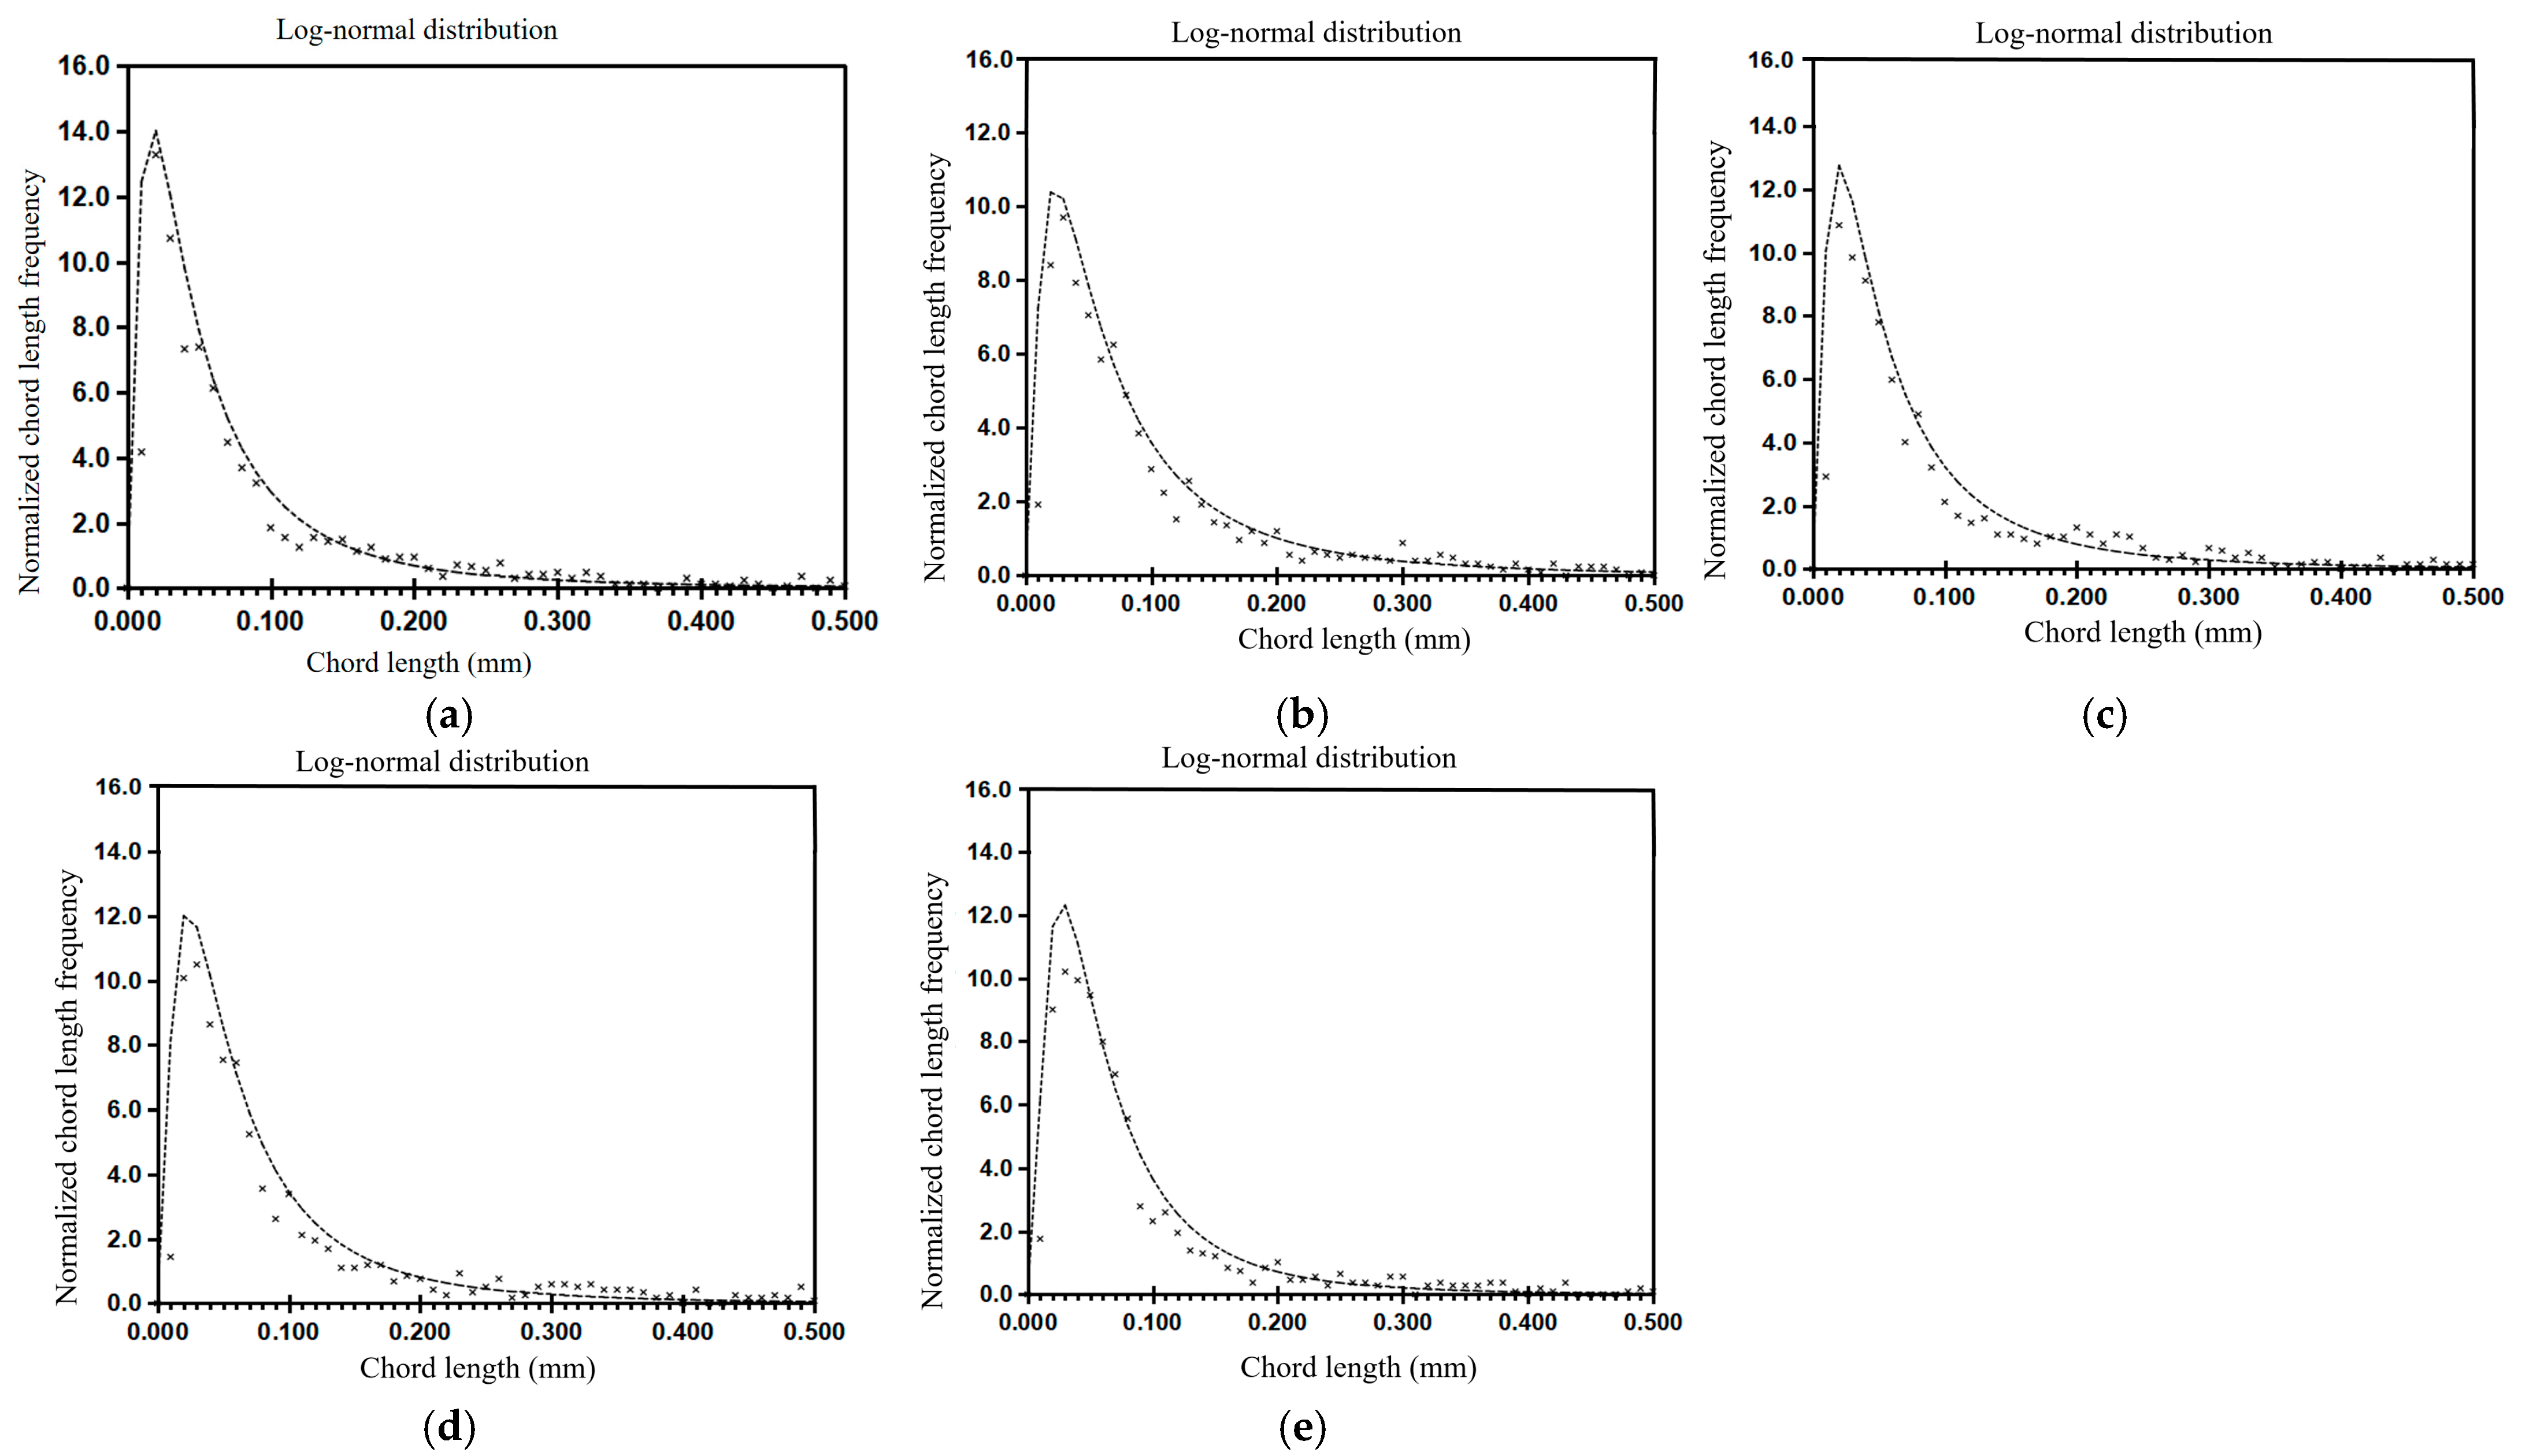
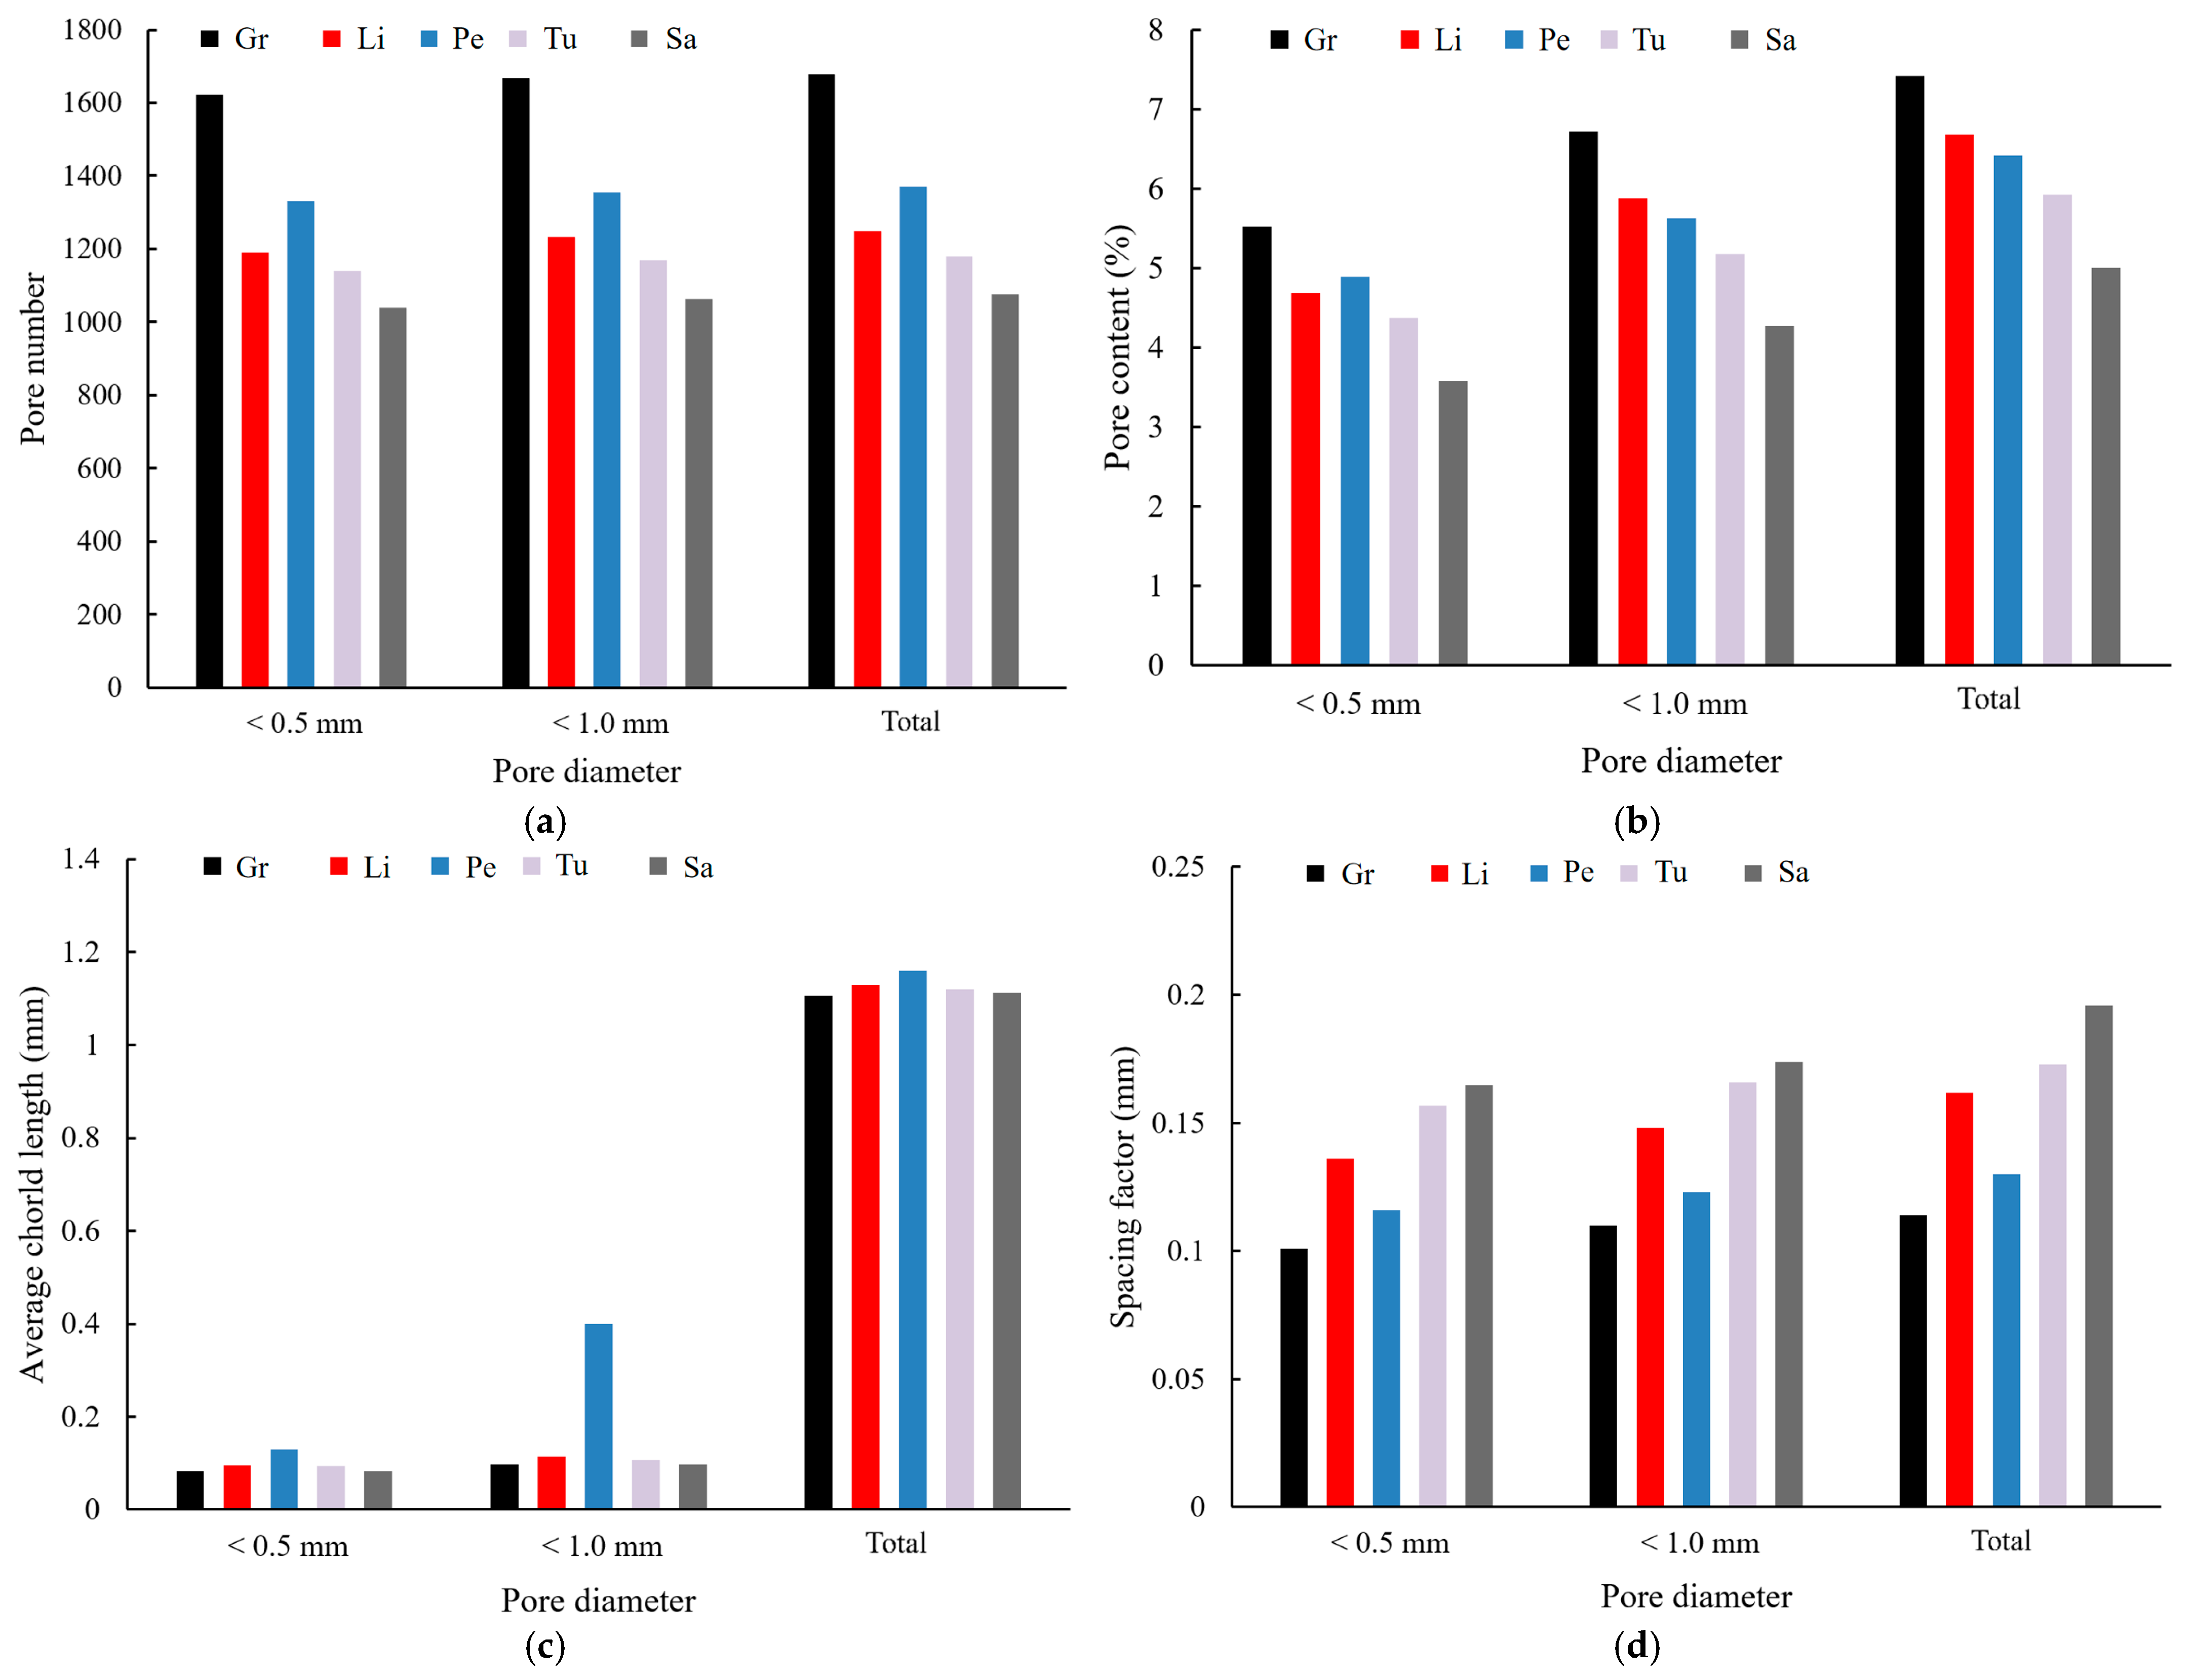
3.3. Pore Characteristics
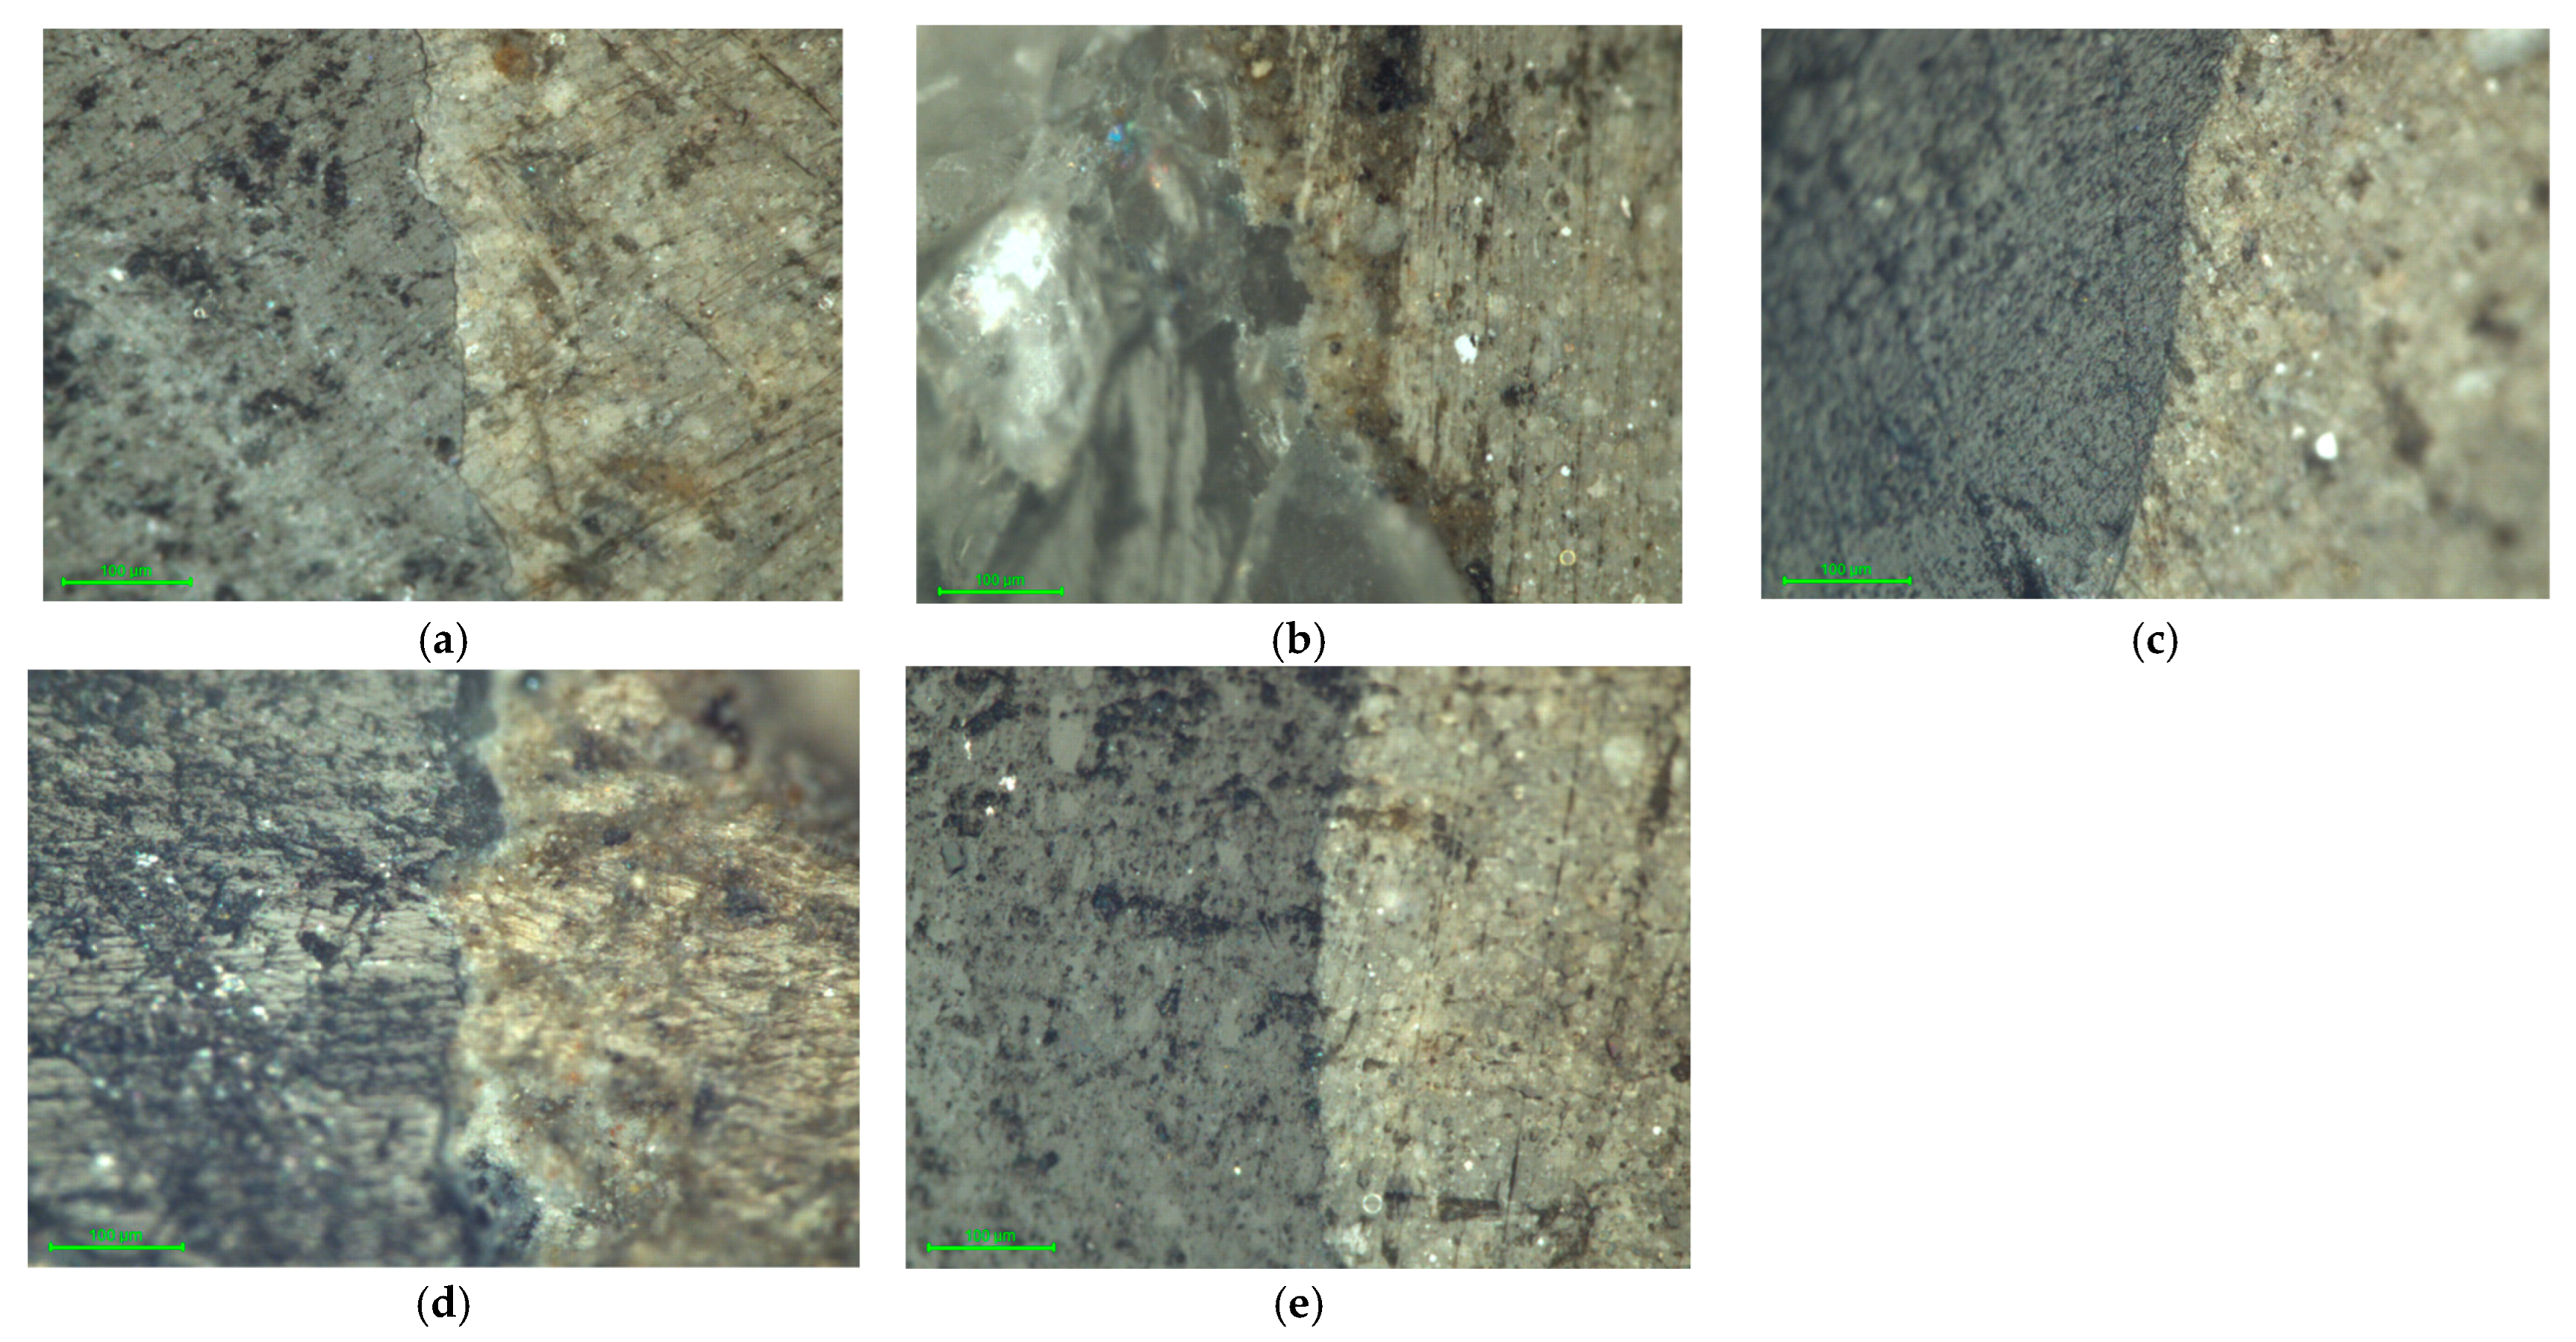
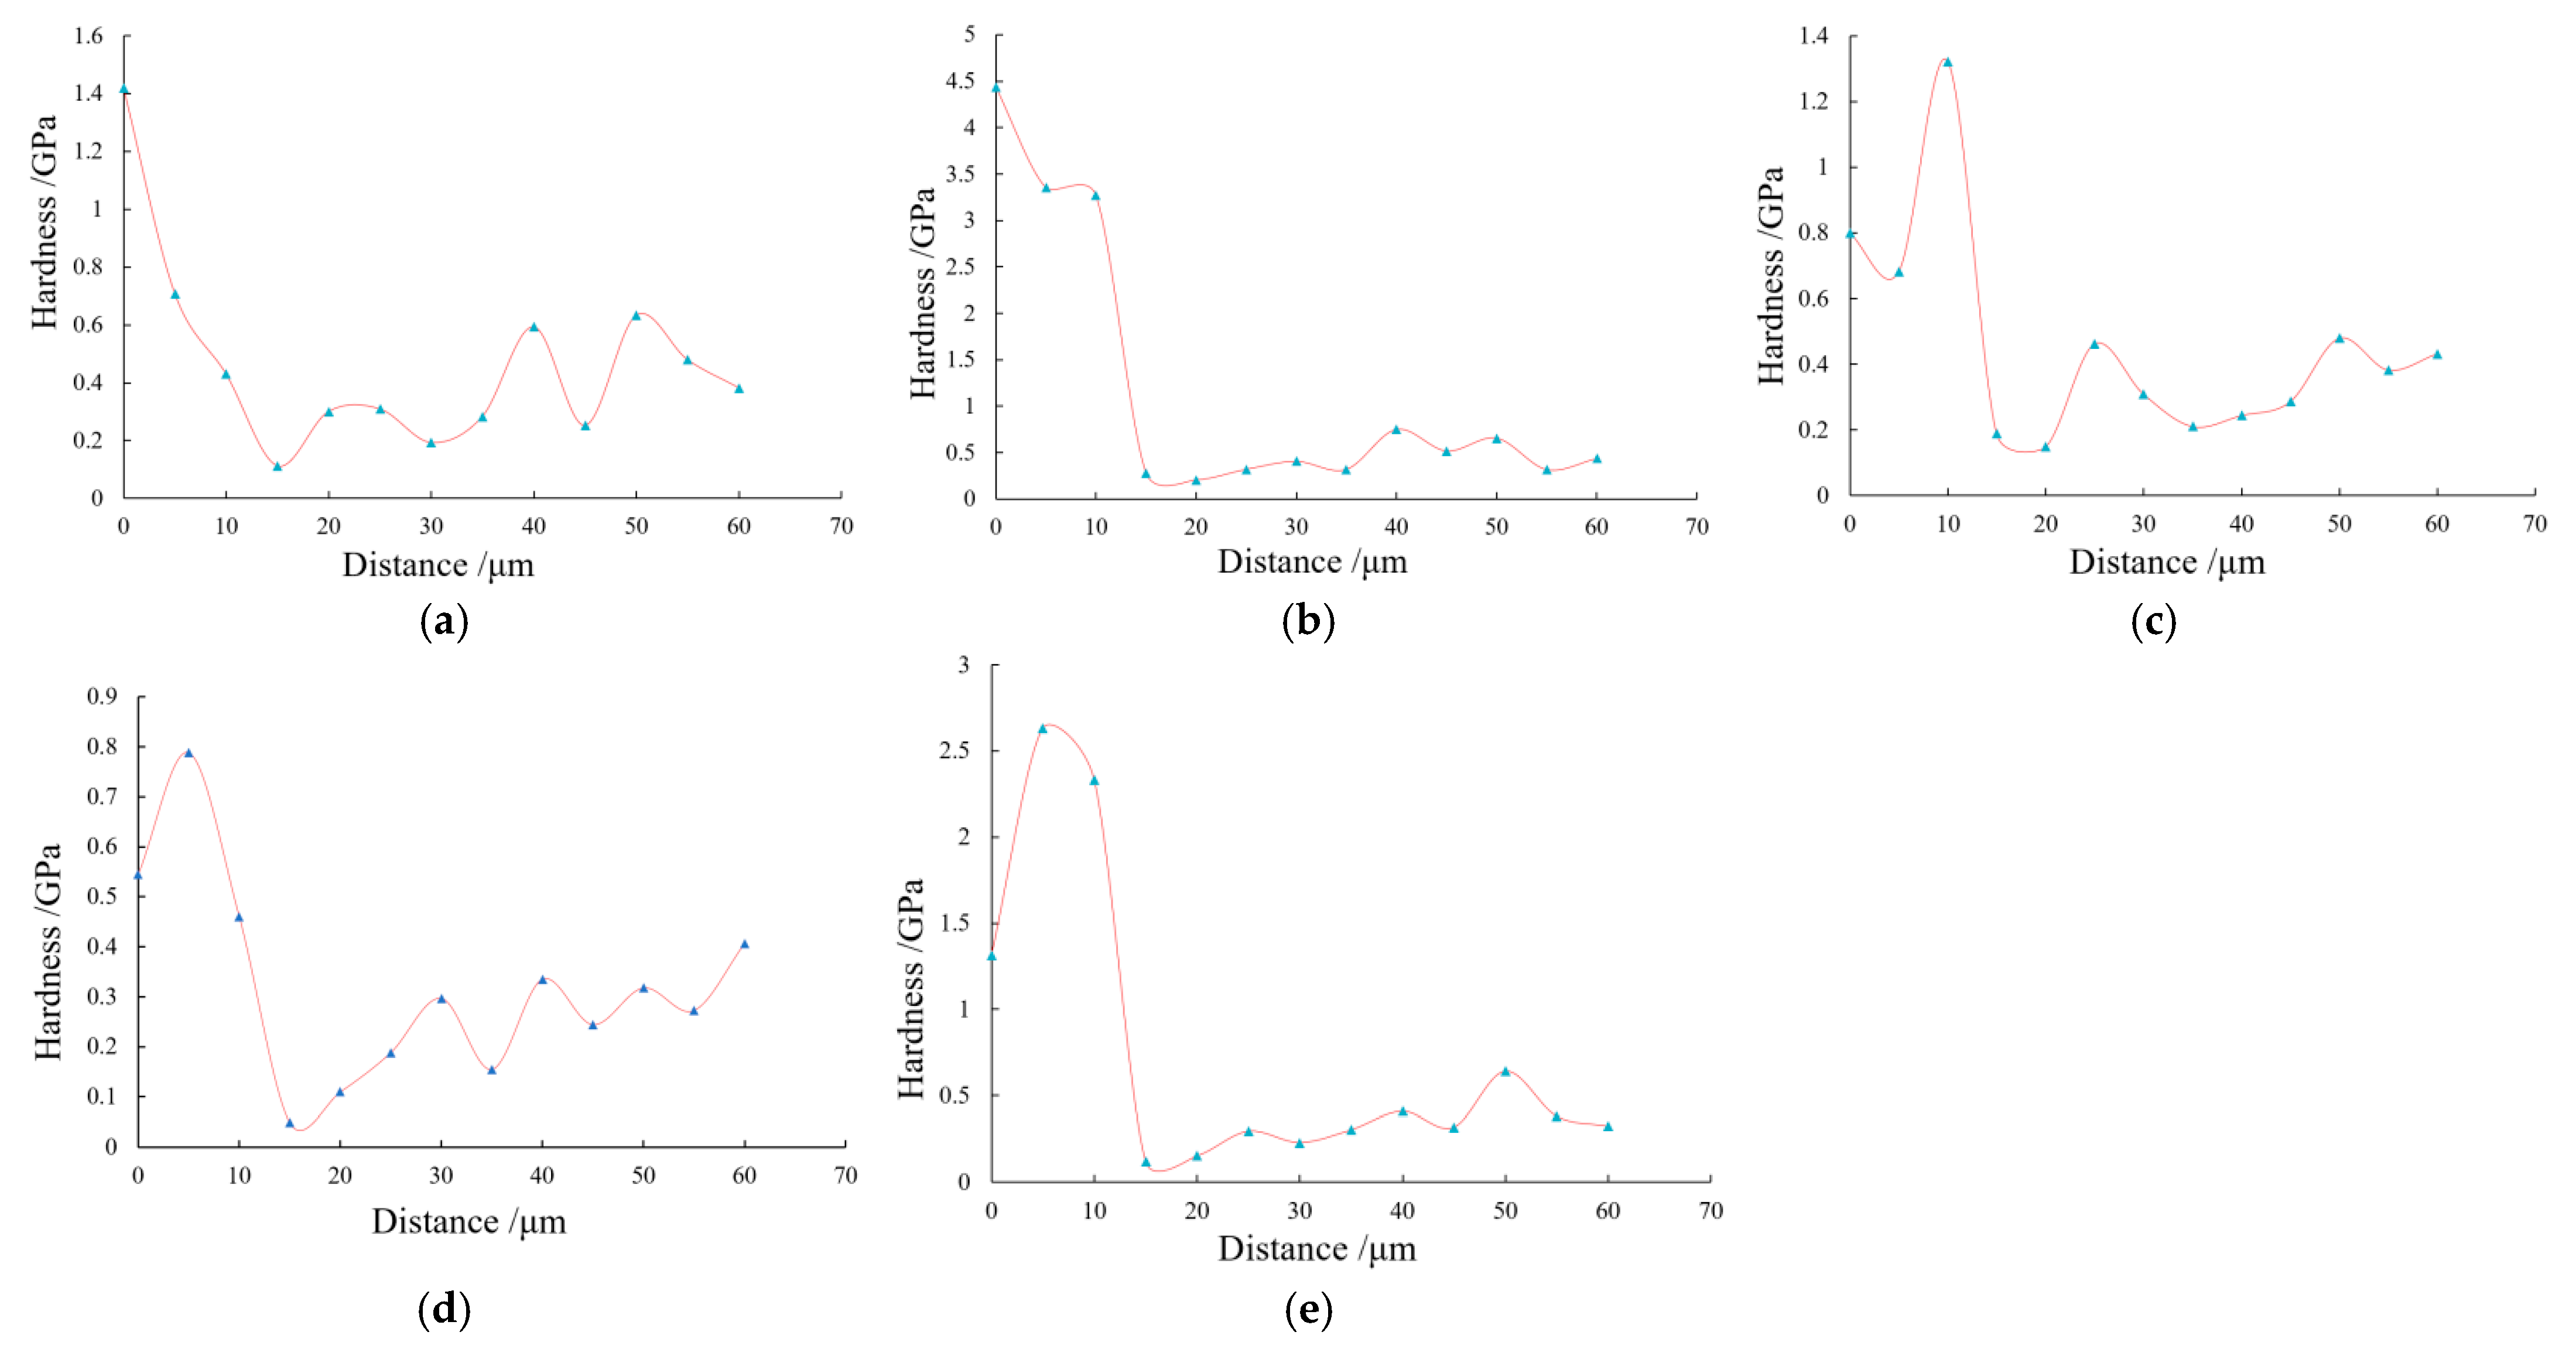
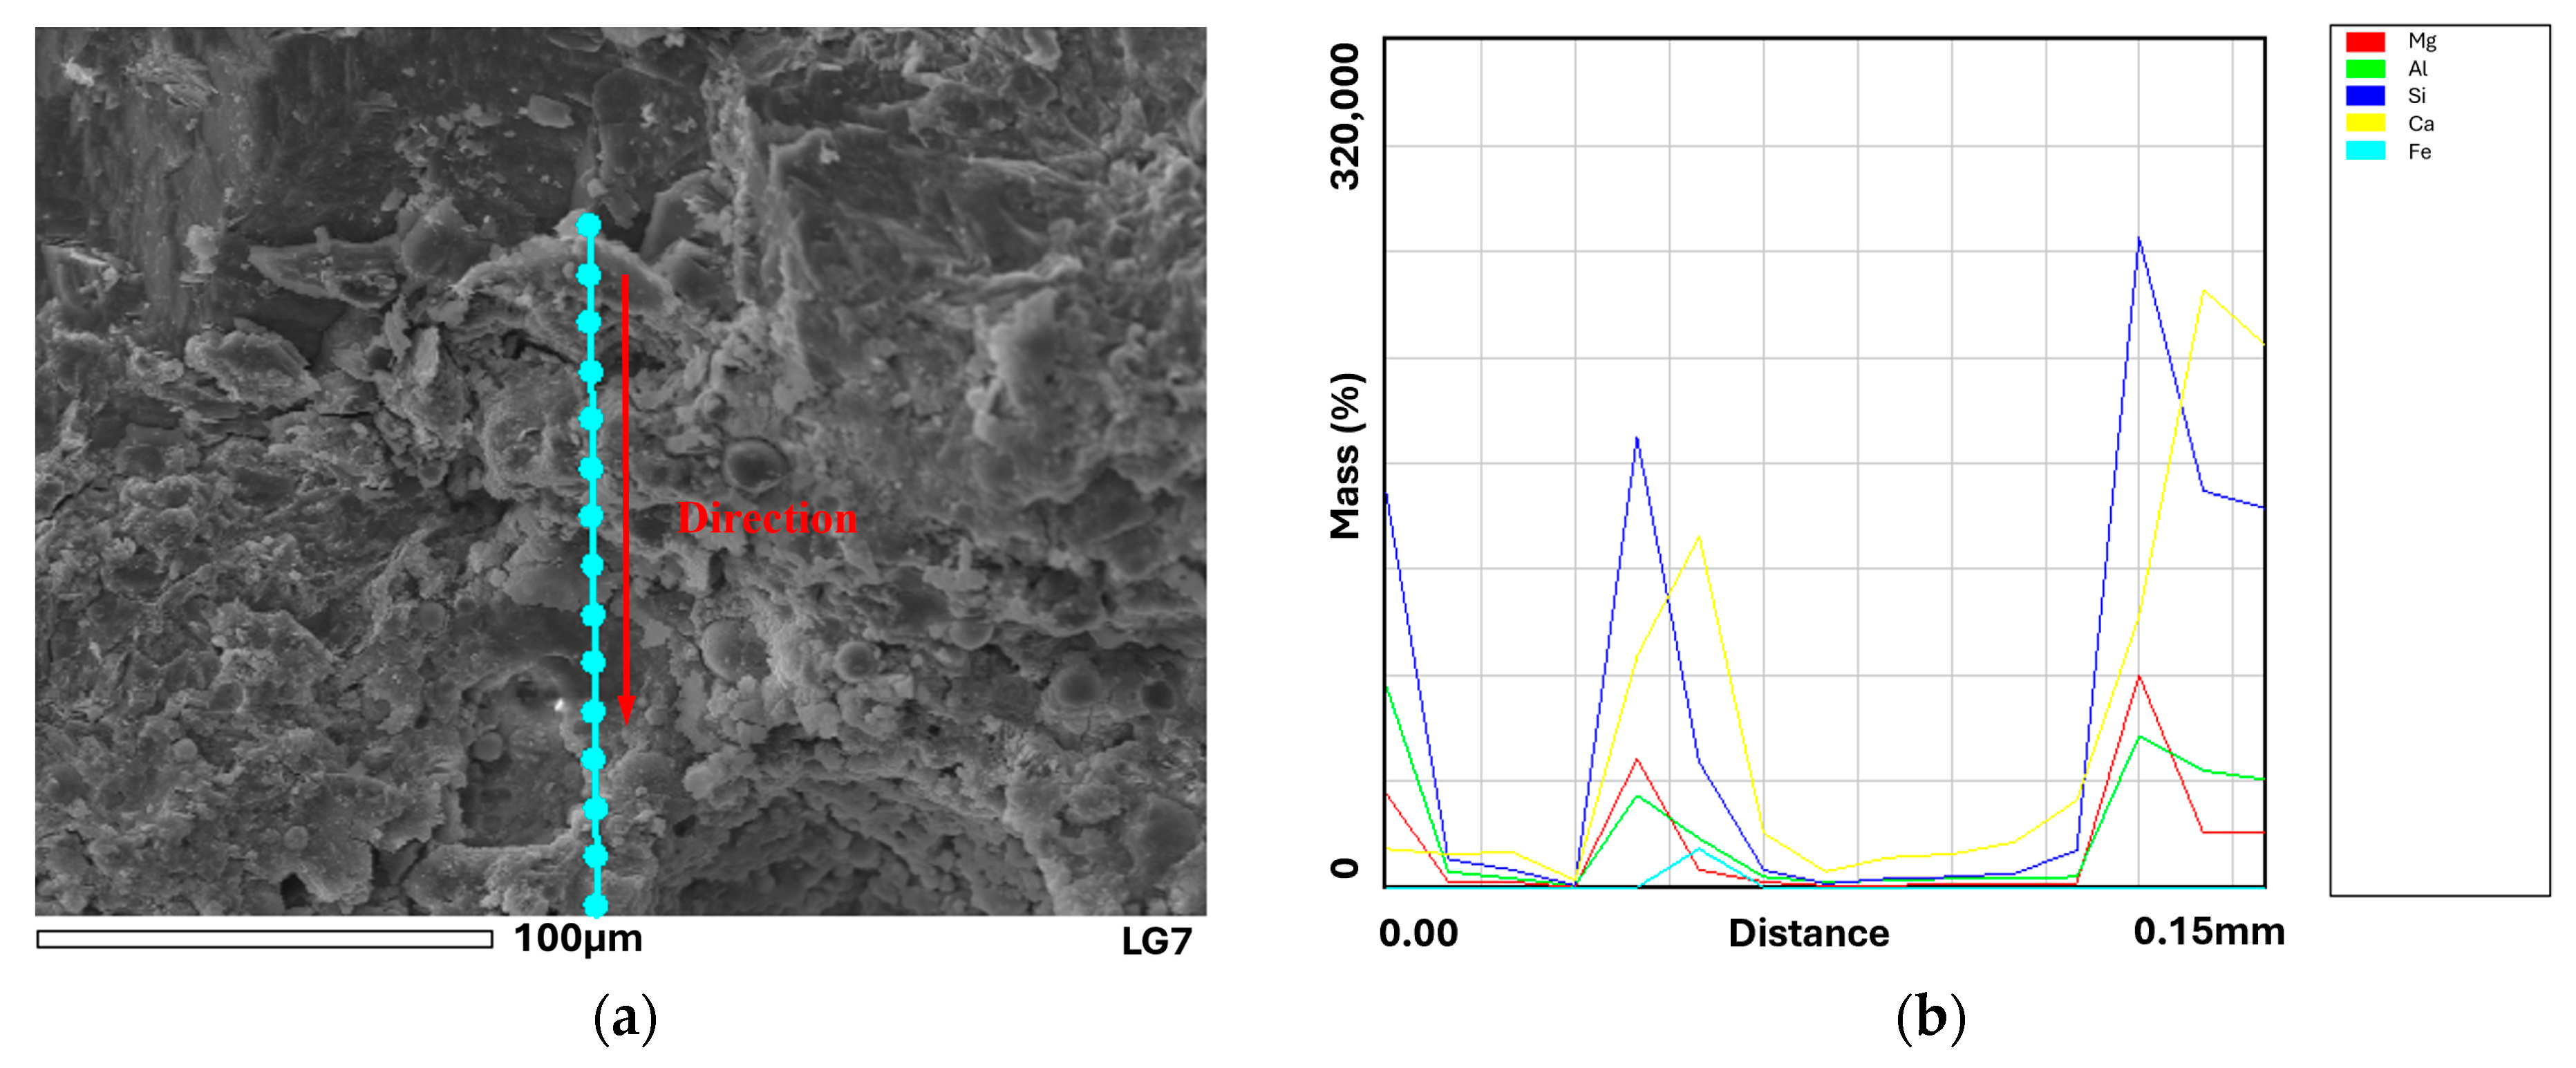
3.4. Performance of the ITZ
3.4.1. Mechanical Behaviors
3.4.2. Hydration Products Characteristics
4. Conclusions
- (1)
- Under identical conditions, the freeze–thaw resistance of hydraulic concrete specimens containing different types of aggregates followed the order of granite > limestone > pebble > tuff > sandstone. The type of aggregate parent rock had a significant impact on the freeze–thaw resistance of concrete. Specifically, sandstone exhibited the poorest freeze–thaw resistance, while granite showed superior freeze–thaw durability, making it particularly suitable for use in regions subjected to harsh freeze–thaw conditions. This highlighted the necessity for engineering designs to account for the varying freeze–thaw performance of aggregates, especially considering the inferior resistance of sandstone;
- (2)
- Sandstone, with the highest linear expansion coefficient and water absorption rate, led to the greatest mass loss and lowest relative dynamic modulus, likely due to its high porosity and moisture absorption. In contrast, limestone, with the lowest expansion coefficient, showed better freeze–thaw resistance, attributed to its denser structure and lower water absorption. For other rock types, the relationship between aggregate properties and concrete performance was less consistent, suggesting that freeze–thaw resistance was influenced not only by the rock’s physical properties but also by the internal structure of the concrete;
- (3)
- The highest pore content among the granite concrete specimens was 7.42%, while the sandstone concrete specimens exhibited the lowest pore content, at 5.01%. The ranking of pore content aligned perfectly with the ranking of the freeze–thaw resistant ability of concrete with various aggregates. Hence, utilizing the pore spacing factor for evaluating hydraulic concrete’s freeze–thaw-resistant ability proved reliable. Other factors, such as pore numbers and spacing factor, also demonstrated good alignment with the specimens’ freeze–thaw resistance;
- (4)
- A noticeable weak area existed within the ITZ between the aggregate and the cement paste. However, there was no distinct boundary between this ITZ and the cement paste. However, the performance of the ITZ did not directly correlate with the freeze–thaw-resistant ability of hydraulic concrete. At the 28-day hydration stage, the morphologies of the hydration products in both the ITZ and the paste region were fundamentally similar. However, there are variations in the quantity, size, and growth characteristics of these hydration products. In the ITZ, a noticeably lower quantity of hydration products was exhibited, and they were relatively coarser in size;
- (5)
- The internal pore structure played an important role in determining the freeze–thaw resistance of hydraulic concrete. While there were variations in the ITZ-influenced hydration product distribution, they did not significantly affect the concrete’s freeze–thaw resistance. To better understand the impact of the aggregate–cement paste ITZ on the freeze–thaw durability, further refinement of the experimental design was needed to reduce the variables and achieve more precise results.
Author Contributions
Funding
Data Availability Statement
Conflicts of Interest
References
- Li, Y.; Liu, Y.; Guo, H.; Li, Y. Investigation of the Freeze-Thaw deterioration behavior of hydraulic concrete under various curing temperatures. J. Build. Eng. 2024, 95, 110247. [Google Scholar] [CrossRef]
- Ting, M.Z.Y.; Wong, K.S.; Rahman, M.E.; Meheron, S.J. Deterioration of marine concrete exposed to wetting-drying action. J. Clean. Prod. 2021, 278, 123383. [Google Scholar] [CrossRef]
- Uthaman, S.; Vishwakarma, V. Assessment of causes and consequences of concrete deterioration and its remediation. J. Build. Eng. 2023, 79, 107790. [Google Scholar] [CrossRef]
- Mostafa, A.; Alireza, Y.; Mojtaba, K.T.; Rooholamini, H. A comprehensive review on pervious concrete. Constr. Build. Mater. 2023, 407, 133308. [Google Scholar] [CrossRef]
- Fu, X.; Zhao, G.; Wang, M.; Wang, J.; Xu, Y.; Gu, C. Comprehensive evaluation method for structural behavior of concrete dams in cold regions. Eng. Struct. 2023, 278, 115435. [Google Scholar] [CrossRef]
- Ma, K.L.; Feng, K.W.; Wang, Z.Z.; Long, G.; Xie, Y.; Li, W. Mechanical properties and crack evolution of SCC with macro-crack under freeze-thaw cycles. J. Build. Eng. 2023, 69, 102363. [Google Scholar] [CrossRef]
- Zhang, M.; Xie, F.; Han, S.Y. Durability of Concrete with Nanoparticles under the Action of Both Cl? Penetration and Freeze–Thaw Cycles. J. Cold Reg. Eng. 2024, 38, 04023024. [Google Scholar] [CrossRef]
- Liu, J.; Zhou, D.; Cheng, L.; An, S.; Guo, L.; Xue, H.; Wu, R. Analysis of damage and fracture characteristics for concrete subjected to cryogenic freeze-thaw cycles: An acoustic emission and digital image correlation study. J. Build. Eng. 2024, 94, 109841. [Google Scholar] [CrossRef]
- Wang, T.; Yang, X.; Zhang, W.; Yang, Q.; Yang, D.; Li, B.; Su, T.; Mei, X. Bond performance of recycled coarse aggregate concrete with rebar under freeze–thaw environment: A review. Nonlinear Eng. 2024, 13, 31–36. [Google Scholar] [CrossRef]
- Zou, C.Y.; Zhao, J.; Liang, F. Experimental study on stress-strain relationship of frost-resistant concrete. In Proceedings of the Eighth International Symposium on Structural Engineering for Young Exports, Xi’an, China, 20–23 August 2004; Volume 1, pp. 1038–1042. [Google Scholar]
- Vancura, M.; MacDonald, K.; Khazanovich, L. Microscopic analysis of paste and aggregate distresses in pervious concrete in a wet, hard freeze climate. Cem. Concr. Compos. 2011, 33, 1080–1085. [Google Scholar] [CrossRef]
- Hao, Y.; Hao, H. Numerical evaluation of the influence of aggregates on concrete compressive strength at high strain rate. Int. J. Prot. Struct. 2011, 2, 177–206. [Google Scholar] [CrossRef]
- Pasupathy, K.; Ramakrishnan, S.; Sanjayan, J. Enhancing the properties of foam concrete 3D printing using porous aggregates. Cem. Concr. Compos. 2022, 133, 104687. [Google Scholar] [CrossRef]
- Abdulla, N.A. Effect of recycled coarse aggregate type on concrete. J. Mater. Civ. Eng. 2016, 27, 04014273. [Google Scholar] [CrossRef]
- Alanazi, H. Effect of aggregate types on the mechanical properties of traditional concrete and geopolymer concrete. Crystals 2021, 11, 1110. [Google Scholar] [CrossRef]
- Kwan, A.; Fung, W. Packing density measurement and modeling of fine aggregate and mortar. Cem. Concr. Compos. 2009, 31, 349–357. [Google Scholar] [CrossRef]
- Liu, H.B.; Luo, G.B.; Wei, H.B.; Yu, H. Strength, permeability, and freeze-thaw durability of pervious concrete with different aggregate sizes, porosities, and water-binder ratios. Appl. Sci. 2018, 8, 1217. [Google Scholar] [CrossRef]
- Ladomerský, J.; Janotka, I.; Hroncová, E.; Najdená, I. One-year properties of concrete with partial substitution of natural aggregate by cupola foundry slag. J. Clean. Prod. 2016, 131, 739–746. [Google Scholar] [CrossRef]
- Ismail, M.K.; Hassan, A.A.A. Abrasion and impact resistance of concrete before and after exposure to freezing and thawing cycles. Constr. Build. Mater. 2019, 215, 849–861. [Google Scholar] [CrossRef]
- Yang, Y.J.; Zhu, H.Z.; Chen, D.G. Influence of the coarse aggregate size on the frost resistance in normal and polycarboxylate mixed concrete. J. Build. Eng. 2023, 76, 107031. [Google Scholar] [CrossRef]
- Lv, X.; Shen, W.; Wang, L.; Dong, Y.; Zhang, J.; Xie, Z. A comparative study on the practical utilization of iron tailings as a complete replacement of normal aggregates in dam concrete with different gradation. J. Clean. Prod. 2019, 211, 704–715. [Google Scholar] [CrossRef]
- Tarhan, Y.; Sahin, R. Effect of recycled concrete aggregate, air entraining admixture and maximum aggregate particle size of the behavior of concrete under freeze-thaw cycles. J. Green Build. 2021, 16, 217–233. [Google Scholar] [CrossRef]
- Zhang, D.S.; Mao, M.J.; Zhang, S.R.; Yang, Q. Influence of stress damage and high temperature on the freeze-thaw resistance of concrete with fly ash as fine aggregate. Constr. Build. Mater. 2019, 229, 116845. [Google Scholar] [CrossRef]
- Wu, K.R.; Chen, B.; Yao, W.; Zhang, D. Effect of coarse aggregate type on mechanical properties of high-performance concrete. Cem. Concr. Res. 2001, 31, 1421–1425. [Google Scholar] [CrossRef]
- Wang, B.; Yan, L.B.; Fu, Q.N.; Kasal, B. A comprehensive review on recycled aggregate and recycled aggregate concrete. Resour. Conserv. Recycl. 2021, 171, 105565. [Google Scholar] [CrossRef]
- Peng, X.; Liu, Y.; Wang, S.Q.; Gong, F.; Cao, W.; Zhao, Y. Improved freeze-thaw modification of recycled concrete aggregate originally from frost resistive concrete. Cem. Concr. Compos. 2023, 144, 105302. [Google Scholar] [CrossRef]
- Guo, H.; Shi, C.J.; Guan, X.M.; Zhu, J.; Ding, Y.; Ling, T.-C.; Zhang, H.; Wang, Y. Durability of recycled aggregate concrete—A review. Cem. Concr. Compos. 2018, 89, 251–259. [Google Scholar] [CrossRef]
- Zhou, S.; Wu, C.; Li, J.; Shi, Y.; Luo, M.; Guo, K. Study on the influence of fractal dimension and size effect of coarse aggregate on the frost resistance of hydraulic concrete. Constr. Build. Mater. 2024, 431, 136526. [Google Scholar] [CrossRef]
- Ondrasina, J.; Kirchner, D.; Siegesmund, S. Freeze-thaw cycles and their influence on marble deterioration: A long-term experiment. Geol. Soc. Lond. Spec. Publ. 2002, 205, 9–18. [Google Scholar] [CrossRef]
- Zhao, Y.; Liu, B.; Wang, C.; Bi, J.; Yang, Z. Study on deterioration mechanism of granite with a natural single weak surface after freeze-thaw treatment. Cold Reg. Sci. Technol. 2024, 218, 104079. [Google Scholar] [CrossRef]
- Wang, L.; Chen, X.; Zhang, W.; Tian, Y.; Xu, S. Study on Changes in Physical and Mechanical Properties and Integrity Decay of Sandstone Subjected to Freeze–Thaw Cycling. Appl. Sci. 2023, 13, 7316. [Google Scholar] [CrossRef]
- GB/T2596-2017; Chinese Standard. Fly Ash Used for Cement and Concrete. Standards Press of China: Beijing, China, 2017.
- DL/T 5144-2015; Chinese Standard. Specifications for Hydraulic Concrete Construction. National Energy Administration of China: Beijing, China, 2015.
- GB/T 1345-2005; Chinese Standard. Test Sieving Methods for Fineness of Cement. China Standards Press: Beijing, China, 2005.
- GB/T 14685-2011; Chinese Standard. Pebble and Crush Stone for Construction. China Standards Press: Beijing, China, 2011.
- SL/T 352-2020; Chinese Standard. Test Code for Hydraulic Concrete. Ministry of Water Resources of China: Beijing, China, 2020.
- Carlson, J.; Sutter, L.; Van Dam, T.; Peterson, K.R. Comparison of Flatbed Scanner and RapidAir 457 System for Determining Air Void System Parameters of Hardened Concrete. Transp. Res. Rec. J. Transp. Res. Board 2006, 1979, 54–59. [Google Scholar] [CrossRef]
- GB/T50266-2013; Chinese Standard. Standard for Test Method of Engineering Rock Mass. China Standards Press: Beijing, China, 2013.
- JGJ52-2006; Chinese Standard. Standard for Technical Requirements and Test Method of Sand and Crushed Stone (or Gravel) for Ordinary Concrete. China Architecture & Building Press: Beijing, China, 2006.
- Zhang, G.; Yin, J.; Li, S.; Sang, Z.; Xiong, Y.; Gao, T.; Hu, X. Investigation of the freeze-thaw resistance of Eco-porous concrete containing fly ash. Mater. Technol. 2018, 52, 183–188. [Google Scholar] [CrossRef]


| Chemical | SiO2 | Fe2O3 | Al2O3 | Na2O | CaO | SO3 | MgO | K2O | Cl | Loss on Ignition |
|---|---|---|---|---|---|---|---|---|---|---|
| Composition | 20.42 | 2.81 | 3.89 | 0.46 | 63.56 | 3.80 | 0.40 | 0.16 | 0.06 | 3.80 |
| Fineness * | Density (kg/m3) | Standard Consistency | Setting Time (min) | Flexural Strength (MPa) | Compressive Strength (MPa) | |||||
|---|---|---|---|---|---|---|---|---|---|---|
| Initial | Final | 3 d | 7 d | 28 d | 3 d | 7 d | 28 d | |||
| 0.5% | 3125 | 24.8% | 184 | 259 | 6.0 | 7.5 | 10.2 | 25.5 | 33.7 | 52.0 |
| Types | Saturated Surface-Dry Apparent Density | Saturated Surface-Dry Water Absorption Rate | Needle-Like Content [35] | Crushing Index |
|---|---|---|---|---|
| Gr | 2673 kg/m3 | 1.0% | 3.2% | 8.0% |
| Li | 2669 kg/m3 | 0.5% | 3.6% | 6.9% |
| Pe | 2760 kg/m3 | 0.6% | 1.8% | 2.8% |
| Tu | 2762 kg/m3 | 1.2% | 2.8% | 5.8% |
| Sa | 2725 kg/m3 | 0.6% | 8.6% | 7.6% |
| Requirements [33] | ≥2550 kg/m3 | ≤2.5% | ≤15% | ≤16% |
| Types | Water (kg/m3) | Cement (kg/m3) | Fly Ash (kg/m3) | Sand (kg/m3) | Aggregate (kg/m3) | Mixture Performance | |||
|---|---|---|---|---|---|---|---|---|---|
| 5–10 mm | 10–20 mm | 20–30 mm | Slumps (mm) | Air Content (%) | |||||
| Gr | 92 | 161 | 69 | 722 | 409 | 409 | 547 | 51 | 5.5 |
| Tu | 92 | 161 | 69 | 722 | 409 | 409 | 547 | 48 | 4.8 |
| Sa | 92 | 161 | 69 | 722 | 411 | 411 | 548 | 50 | 5.5 |
| Li | 92 | 161 | 69 | 722 | 424 | 424 | 565 | 50 | 5.5 |
| Pe | 92 | 161 | 69 | 722 | 424 | 424 | 565 | 65 | 5.5 |
| Parameters | Number | Pore Content | Average Chord Length | Spacing Factor | Specific Surface Area | Slurry-to-Air Ratio | |
|---|---|---|---|---|---|---|---|
| Gr | <0.5 mm | 1623 | 5.53% | 0.082 mm | 0.101 | 48.65 mm−1 | 5.73 |
| <1.0 mm | 1667 | 6.72% | 0.097 mm | 0.110 | 41.09 mm−1 | 4.72 | |
| Total | 1679 | 7.42% | 1.107 mm | 0.114 | 37.48 mm−1 | 4.27 | |
| Li | <0.5 mm | 1190 | 4.69% | 0.095 mm | 0.136 | 42.08 mm−1 | 6.76 |
| <1.0 mm | 1233 | 5.88% | 0.115 mm | 0.148 | 34.77 mm−1 | 5.39 | |
| Total | 1248 | 6.69% | 1.129 mm | 0.162 | 30.90 mm−1 | 4.74 | |
| Pe | <0.5 mm | 1330 | 4.90% | 0.129 mm | 0.116 | 45.03 mm−1 | 6.47 |
| <1.0 mm | 1356 | 5.63% | 0.400 mm | 0.123 | 39.90 mm−1 | 5.63 | |
| Total | 1371 | 6.43% | 1.159 mm | 0.130 | 35.35 mm−1 | 4.93 | |
| Tu | <0.5 mm | 1141 | 4.38% | 0.093 mm | 0.157 | 43.18 mm−1 | 7.24 |
| <1.0 mm | 1169 | 5.18% | 0.107 mm | 01.66 | 37.38 mm−1 | 6.12 | |
| Total | 1181 | 5.93% | 1.121 mm | 0.173 | 32.99 mm−1 | 5.35 | |
| Sa | <0.5 mm | 1040 | 3.59% | 0.083 mm | 0.165 | 48.05 mm−1 | 8.83 |
| <1.0 mm | 1064 | 4.27% | 0.097 mm | 0.174 | 41.25 mm−1 | 7.42 | |
| Total | 1077 | 5.01% | 1.112 mm | 0.196 | 35.65 mm−1 | 6.33 | |
Disclaimer/Publisher’s Note: The statements, opinions and data contained in all publications are solely those of the individual author(s) and contributor(s) and not of MDPI and/or the editor(s). MDPI and/or the editor(s) disclaim responsibility for any injury to people or property resulting from any ideas, methods, instructions or products referred to in the content. |
© 2025 by the authors. Licensee MDPI, Basel, Switzerland. This article is an open access article distributed under the terms and conditions of the Creative Commons Attribution (CC BY) license (https://creativecommons.org/licenses/by/4.0/).
Share and Cite
Zhou, S.; Wu, C.; Li, J.; Shi, Y.; Wang, Y.; Luo, M. The Impact of Coarse Aggregate Parent Rock Types on the Freeze–Thaw Performance of Concrete: A Comparative Study. Buildings 2025, 15, 977. https://doi.org/10.3390/buildings15060977
Zhou S, Wu C, Li J, Shi Y, Wang Y, Luo M. The Impact of Coarse Aggregate Parent Rock Types on the Freeze–Thaw Performance of Concrete: A Comparative Study. Buildings. 2025; 15(6):977. https://doi.org/10.3390/buildings15060977
Chicago/Turabian StyleZhou, Shihua, Cai Wu, Jiazheng Li, Yan Shi, Yuanyi Wang, and Mingxing Luo. 2025. "The Impact of Coarse Aggregate Parent Rock Types on the Freeze–Thaw Performance of Concrete: A Comparative Study" Buildings 15, no. 6: 977. https://doi.org/10.3390/buildings15060977
APA StyleZhou, S., Wu, C., Li, J., Shi, Y., Wang, Y., & Luo, M. (2025). The Impact of Coarse Aggregate Parent Rock Types on the Freeze–Thaw Performance of Concrete: A Comparative Study. Buildings, 15(6), 977. https://doi.org/10.3390/buildings15060977