Article

Elastoplastic Dynamic Analysis and Damage Evaluation of Reinforced Concrete Structures Based on Time Histories

College of Harbor and Coastal Engineering, Jimei University, Xiamen 361021, China
Buildings 2025, 15(6), 971; https://doi.org/10.3390/buildings15060971
Submission received: 20 January 2025 / Revised: 5 March 2025 / Accepted: 17 March 2025 / Published: 19 March 2025
(This article belongs to the Section Building Structures)

Abstract

:
In this study, the impact of seismic time histories (STHs) on structural damage was examined, focusing on maximum elastoplastic displacement ( δ m a x ) and cumulative hysteretic energy ( E h ). A specialized STH Damage Analysis Program (STHDAP) was developed to create a deformation energy time-history damage model, accounting for the behavior of hysteretic restoring force models under various loading and motion conditions. An elastoplastic motion equation, based on uniform stiffness and load parameters ( K ¯ P ¯ ), was formulated to calculate cumulative E h during elastoplastic time histories in a single-degree-of-freedom (SDOF) system. The computational method integrates time series and damage values ( D ( t ) ), enabling detailed analysis of structural responses, energy dissipation, and damage evaluation using seismic waves from the El Centro, Tri-treasure, and TianjinNS earthquakes. The results revealed that cumulative damage in similar structural members increased progressively with varying amplitudes and patterns, corresponding to the initial stages of ground motion. The STHDAP offers a comprehensive view of structural damage evolution in elastoplastic time histories. The deformation energy damage model facilitates the evaluation of elastoplastic damage in high-strength reinforced concrete structures under ground motion, providing valuable insights for performance-based seismic design and retrofitting strategies in structural engineering.

1. Introduction

In structural engineering, dynamic elastoplastic analyses are crucial for evaluating the seismic performance of reinforced concrete structures, requiring precision due to the complexity and volume of data. Thwin analyzed a twelve-story reinforced concrete structure under dynamic loadings, contributing significantly to understanding structural responses to seismic forces [1]. Memari et al. undertook a comprehensive assessment of a 32-story reinforced concrete framed tube building, employing dynamic time history analysis to capture the building’s behavior under seismic conditions, thus providing valuable insights into its seismic performance [2]. Boonyapinyo et al. delved into the seismic evaluations of reinforced concrete buildings, utilizing a combination of static and dynamic analyses, which proved instrumental in enhancing our understanding of structural behavior during seismic events [3]. These studies highlight the importance of developing computational methods for the dynamic analysis of reinforced concrete structures, offering valuable insights for seismic engineering practices. Nevertheless, the incorporation of time histories within elastoplastic analyses to enhance the realism of computational outputs in various structural assessment approaches for reinforced concrete structures warrants further exploration [2,3,4,5,6,7,8].
The existing literature for evaluating structural performance unfolds along three dimensions: a comprehensive appraisal of overall structural performance [9], a closer examination at the member level [10], and a detailed scrutiny of structural integrity at the member section level [11], including the intricate assessment of integration point strains and stresses. Among these dimensions, evaluation at the member level stands as an imperative facet within dynamic elastoplastic analysis. As structures traverse into the realm of elastoplastic nonlinear conditions, they accumulate damage that is inexorably linked to the passage of time. This phenomenon is quantified through the measurement of cumulative dissipated energy, a parameter denoted as E h [12]. Throughout the dynamic elastoplastic journey of a structure and interface, the influence of seismic time histories (STHs) assumes a pivotal role in steering the structure towards elastoplastic motion [13,14,15]. STHs leave an indelible imprint on two crucial structural parameters: the maximum elastoplastic displacement response, δ m a x , and the cumulative hysteretic energy, E h . Nevertheless, the temporal aspect of this influence often escapes consideration within the prevailing structural assessments that lean upon the displacement energy two-parameter damage model [16].
The research question of this study examines the impact of STHs on elastoplastic damage evaluation in reinforced concrete structures and how the deformation energy time-history damage model can improve the accuracy of damage predictions under seismic loading. This study advances dynamic elastoplastic analysis by utilizing a flat-top trilinear restoring force model with degradation considerations, incorporating STHs to explore damage evolution in quasi-static structural members. By thoroughly examining the calculation results, the study aims to identify anomalies in dynamic elastoplastic computations and establish a comprehensive STH Damage Evaluation Program (STHAP). This research introduces a groundbreaking deformation energy time-history damage model, offering a novel approach for calculating cumulative E h and maximum displacement. Employing a single-degree-of-freedom (SDOF) system, this study also extends its application to high-strength reinforced concrete structures, providing insights into structural behavior under seismic loading. The model’s innovation lies in its integration of STH for enhanced realism, bridging gaps in existing models like the Park–Ang model, and offering a more generalizable framework for evaluating elastoplastic damage without case-specific calibration. Overall, this study contributes to the state of the art by developing a novel deformation energy time-history damage model that incorporates STH for more accurate elastoplastic damage evaluation in reinforced concrete structures under seismic loading. It introduces the STH Damage Evaluation Program (STHAP), advances dynamic elastoplastic analysis with a flat-top trilinear restoring force model, and extends its application to high-strength reinforced concrete, providing a more generalizable and realistic framework for seismic damage prediction.

2. Methodology of Design Process

The schematic representation of the design process is depicted in Figure 1. Subsequent to formulating a structural damage analysis and evaluation program in accordance with the flowchart, seismic wave data are introduced into the system to scrutinize the energy expenditure associated with the structural response. The acquired data undergo comprehensive analysis and evaluation. The concept of an STH encapsulates the entirety of time elapsed from the initial input of actual seismic waves to the moment when the damage assessment (D) is conducted, taking into account two critical parameters: displacement and energy. In the event that the member’s damage value does not attain the threshold of D = 1.0 during the analysis, the total seismic time histories (STHs) are established as the temporal reference. The deformation-energy damage model is derived by combining the maximum displacement and cumulative hysteretic energy. The damage parameter D is defined as follows:
D = α u m a x u u l t + β H H u l t
The hysteretic energy H is calculated as follows:
H = i = 1 n F i Δ u i
where Fi and Δui are the force and displacement increments at the i-th step. Parameters α and β are determined from cyclic energy dissipation characteristics and quasi-static tests, ensuring consistency with real-world experimental data. This study assumes the use of a single-degree-of-freedom (SDOF) system, simplifying the complex structural behavior to a single dominant mode of vibration, which is useful for computational efficiency but may not capture the multi-degree dynamic effects present in real-world structures. It also assumes uniform stiffness and load distribution, which simplifies the analysis but may not fully reflect the complexities of varying structural components and material properties. Additionally, the model approximates seismic loading conditions as quasi-static for computational feasibility, though this neglects time-dependent effects. These assumptions are justified by the need for a simplified model to conduct initial analyses and evaluations, with the understanding that future iterations will incorporate more detailed multi-degree-of-freedom models and dynamic loading effects as experimental data become available. Parameters such as β, K1, and K2 are selected based on prior theoretical studies and serve as reasonable approximations, with plans for refinement through experimental validation in future work.

3. Formulation of Computation Scheme

3.1. Numerical Modeling Scheme

In the present study, an accurate representation of the behavior of reinforced concrete structures within the elastoplastic range of restoring force is achieved through the utilization of the Clough model featuring trilinear stiffness degradation as conceptualized in Figure 2. This figure illustrates the Clough hysteretic model, which is commonly used to represent the nonlinear behavior of structures under cyclic loading. The model is characterized by a restoring force curve that includes both elastic and plastic components. It captures the behavior of materials and structural systems during loading and unloading, with a typical pinched loop that reflects energy dissipation and stiffness degradation. The Clough model is widely applied in seismic analysis to model the hysteretic response of materials, particularly for structures subjected to repeated loading and unloading during earthquakes. The trilinear restoring force model was selected for its ability to capture stiffness degradation with increased accuracy compared to bilinear models. This model is particularly effective in representing post-yield behavior and residual stiffness in reinforced concrete structures under cyclic loading. Given the time-dependent nature of structural stiffness, the elastoplastic dynamic response is typically addressed through iterative techniques such as the average acceleration method, linear acceleration method, Newmark-β method, or Wilson-θ method. In this investigation, the linear acceleration method is employed for the analysis. The linear acceleration method was selected for this study due to its computational efficiency, fast convergence, and suitability for dynamic seismic analysis. While four iterative methods were initially considered, the linear acceleration method was preferred because it accelerates the convergence rate, making it particularly effective for large-scale dynamic problems. This method is known for its stability and robustness, especially when dealing with nonlinearities, which is crucial for reliable results in seismic performance evaluation. It also handles large systems efficiently, reducing the computational burden while maintaining accuracy, particularly when analyzing time-history problems with high-frequency dynamic behavior. Additionally, the linear acceleration method is simple to implement, striking a balance between accuracy and computational practicality. Given the study’s focus on seismic loading and structural response over time, this method was deemed most compatible with the model’s needs, ensuring effective analysis of nonlinear behavior and material damping under dynamic loading conditions. When alterations occur in the restoring force curve, adjustments are made to the parameters K and P within the expression ( Q δ ). Additionally, specific threshold values delineating distinct motion condition intervals of the restoring force curve are defined. These parameters collectively contribute to the formulation of a consistent equation governing the structural restoring force under varying motion conditions.
Further, by analyzing the test data in the PEER database [17,18,19] and using the damage model parameters [9] fitted by previous tests, the displacement energy two-parameter damage model based on STH is as follows:
D ( t ) = δ m ( t ) δ u + β E h t δ u Q y
where δ m ( t ) is the maximum displacement of the member during structural restoring force time histories 0 , t ; δ u is the ultimate deformation displacement of a member during the restoring force time history 0 , t ; Q y is the yield strength of the quasi-static column; E h t is the cumulative hysteretic energy during the structural restoring force time histories 0 , t ; β is the parameter value of the energy dissipation under cyclic loads, based on the hysteresis energy dissipation data of the author’s experimental component columns and PEER database; Q y and δ u are the calculation results of the quasi-static test; the time points δ m ( t ) and E h t at ground motion is input are calculated by STHDAP; δ m t is the maximum displacement reached by the member during the time history 0 , t ; and E h t is the cumulative hysteretic energy value of the member during the time history 0 , t . The linear acceleration method was chosen due to its computational efficiency and stability for high-frequency dynamic problems. This choice supports the study’s aim of capturing stiffness degradation, hysteretic energy dissipation, and damage progression in RC structures under seismic loads, justifying linear acceleration method without comparing alternatives. While it may introduce minor numerical damping at extreme time steps, sensitivity analysis confirms its suitability for this study’s time-history analyses.
The damage model used in the programming is an improved version of the Park–Ang damage model. The parameters δ m t and E h t are used for improvement. Considering the duration t of the earthquake motion, the calculation of damage index is transformed into the ability to calculate the damage value during each period is calculated. The parameter values are based on the component test data of columns conducted by the author in the previous stage, as well as the comprehensive analysis of 279 test data based on the PEER database and the relevant literature.
Moreover, in this study, the response to ground motion is examined using the single-degree-of-freedom (SDOF) shear model. When subjected to a foundation acceleration of x ¨ g , the SDOF column model is utilized to establish a dynamic equilibrium by reconciling the horizontal restoring force Q x , arising from its bending stiffness, with the inertial and damping forces. The governing differential equation of motion is represented as m x ¨ + c x ˙ + Q x = m x ¨ g , where m denotes the system mass, c signifies the damping coefficient, Q x characterizes the system’s restoring force, x ¨ g represents the ground motion acceleration, and x ¨ and x ˙ denote acceleration and velocity, respectively. It is noteworthy that an analysis of the actual column data from quasi-static tests reveals the absence of a conspicuous inflection point on the Q δ restoring force skeleton curve at the corresponding time of cracking. To enhance the computational efficiency of the program, a simplified trilinear model is incorporated. During the motion of the structural column’s restoring force within the SDOF system, it can be succinctly expressed as Q ( t ) = k x ( t ) , where the restoring force Q t forms a univalent function with respect to displacement x ( t ) . The spatiotemporal pattern of Q δ during elastoplastic motion necessitates in-depth analysis and determination, with the continuous variation in conditions reflected through the formulation of a law embodied in the continuous motion equation for condition points. A detailed account of the analytical process is presented in Table 1 and Table 2. For members in the quasi-static test, the uniform expression of the motion equation is as follows:
m x ¨ + c x ˙ + K ¯ x = m x ¨ g P ¯
where m is the system mass; c is the damping coefficient; x is the displacement; x ˙ is the velocity; x ¨ is the acceleration; x ¨ g is the ground motion acceleration; K ¯ is the uniform stiffness; and P ¯ is the uniform load.

3.2. Elastoplastic Dynamic Response of the Structural System

In the context of elastoplastic dynamic time-history analysis, a stepwise integration method proves instrumental in addressing the temporal evolution of structural stiffness. Within this study, the linear acceleration method is selected as the analytical approach. We assumed that x and x ˙ follow linear change; θ = 2.0 ; and the middle point of the pace length 2 t is selected through programming and calculations. When θ 1.37 , this algorithm is stable. The dynamic behavior of the structural system is characterized by a uniform equation, denoted as Equation (4), which accommodates varying motion states and serves as the basis for the analysis. Meanwhile, K ¯ and P ¯ expressions are modified at the transition time of the motion condition. The uniform stiffness K ¯ and uniform load P ¯ analysis are shown in Table 1 and Table 2. The total time history 0 , T is divided into n equal intervals, and the equation of motion at any point t k in the time history is as follows:
This method was chosen for its computational efficiency in dynamic simulations, and its limitations are discussed herein.
m x ¨ t k + c t k x ˙ t k + K ¯ t k x t k = m x ¨ g t k P ¯ t k
According to the linear acceleration method within t t k 1 , t k , x ¨ t = x ¨ t k 1 + t t k 1 t k t k 1 x ¨ t k x ¨ t k 1 , the interval t t k 1 , t k is integrated to obtain the following:
This method was chosen for its computational efficiency in dynamic simulations, and its limitations are discussed herein.
t k 1 t x ¨ t d t = t k 1 t x ¨ t k 1 d t + t k 1 t t t k 1 t k t k 1 d t x ¨ t k x ¨ t k 1
I.e.:
x ˙ t = x ˙ t k 1 + x ¨ t k 1 t t k 1 + 1 2 x ¨ t k x ¨ t k 1 t t k 1 2 t k t k 1
The interval t t k 1 , t k is reintegrated to obtain the following:
x t = x t k 1 + x ˙ t k 1 t t k 1 + 1 2 x ¨ t k 1 t t k 1 2 + 1 6 x ¨ t k x ¨ t k 1 t k t k 1 t k t k 1 3
Let t = t k ; substitute x k = x t k , x ˙ k = x ˙ t k , t = t k t k 1 , B k 1 = x ˙ k 1 + 1 2 x ¨ k 1 t , A k 1 = x k 1 + x ˙ k 1 t + 1 3 x ¨ k 1 t 2 into the equation of motion to obtain the following:
x ¨ k = 1 s k m x ¨ g k + P ¯ k + c k B k 1 + K ¯ k A k 1 x k = A k 1 + 1 6 x ¨ k t 2 , x ˙ k = B k 1 + 1 2 x ¨ k t
where x ¨ k is the acceleration when t is equal to t k ; x ¨ g k is the ground acceleration when t = t k ; x ˙ k is the velocity when t = t k , s k is x ˙ k t = t k m + t 2 c + 1 6 t 2 K ¯ when t = t k ; P ¯ k is the uniform load when t = t k ; c k is the damping coefficient when t = t k ; A k 1 is x + x ˙ t + 1 3 x ¨ t 2 when t = t k 1 ; B k 1 is x ˙ + 1 2 x ¨ t when t = t k 1 ; K ¯ k is the uniform stiffness when t = k ; t is the time interval between t k and t k 1 .
Similarly, time point t is equal to t k + 1 ; when t h e x k , x ˙ k , x ¨ k of the system at t = t k are known, the x k , x ˙ k , x ¨ k at t = t k + 1 can be inferred, and the structural response of the system at any time point t is obtained according to x ¨ g .

3.3. Energy Computation of Elastoplastic Time Histories of Structural System

Import, transform, and hysteretic dissipation are the basic characteristics of structural response under seismic ground motion, and the cyclic hysteretic dissipation of elastoplastic restoring force caused by seismic ground motion is one of the most important reasons for structural damage. Previous studies [20,21,22,23,24,25] pointed out that the absolute input energy and the relative input energy are very close in the range of medium and long structure periods, while the input energy in the absolute energy equation involves x ¨ g , and the calculation results are greatly affected by the processing methods of different seismic wave records [26]. The energy method is based on the analysis of cumulative hysteretic energy consumption of the system [12,16]. The definitions of cumulative hysteretic energy in the two energy equations are the same [27]. Therefore, the relative input equation is selected for analysis in this paper. The input energy of ground motion to the structure is called the total input energy of ground motion E I ( t ) ; part of the total input energy of ground motion is dissipated by the inelastic deformation of the structure or members, which is called hysteretic energy E H ( t ) , and part of the viscous damping dissipation of the structure is called the damping energy dissipation E D ( t ) . Hysteretic energy is an important response parameter directly related to cumulative damage.
The dynamic equation of the single-degree-of-freedom (SDOF) system is m x ¨ ( t ) + c x ˙ ( t ) + F x = m x ¨ g ( t ) , where m and c are the SDOF mass and damping coefficients; x ˙ ( t ) is the velocity response; and x ¨ t is the acceleration response. According to the equation of small displacement of the system d x within the interval t , t + t , and through integration within t , the following can be obtained:
t t + t m x ¨ d x + t t + t c x ˙ d x + t t + t F x d x = t t + t m x ¨ g d x
Substitute d x = x ˙ d t into Equation (10) to obtain:
t t + t m x ¨ x ˙ d t + t t + t c x ˙ 2 d t + t t + t F x x ˙ d t = t t + t m x ¨ g x ˙ d t
where
t t + t m x ¨ x ˙ d t = 1 2 m x ˙ 2 t + t t = E k t , which is the kinetic energy increment of SDOF within t ;
t t + t c x ˙ 2 d t = E d ( t ) , which is the increment of energy dissipated by the viscous damping of SDOF within t ; t t + t F x x ˙ d t = E f ( t ) , which is the total increment of the strain energy E c and the hysteretic energy E h dissipated by SDOF within t , i.e., E f ( t ) = E c ( t ) + E h ( t ) . When SDOF enters the inelastic stage, this item is taken as E h ;
t t + t m x ¨ g x ˙ d t = E i ( t ) , which is the increment of the total energy input to the structure by the ground motion within t .
The following can be obtained from Equation (11):
E k ( t ) + E d ( t ) + E h ( t ) = E i ( t )
As t is very small, the hysteretic energy within t k , t k + t k can be calculated by the following formula:
E h k ( t ) = 1 2 Q k + 1 + Q k · x k + 1 x k
Similarly, the cumulative hysteretic energy of the system within 0 , t i + t i can be calculated by accumulation:
E h i ( t ) = k = 1 i E h k ( t ) = k = 1 i 1 2 Q k + 1 + Q k · x k + 1 x k
where E h i is the cumulative hysteretic energy when t = t i ; E h k is the cumulative hysteretic energy increment at t = t k ; Q k + 1 is the restoring force when t k + t k ; x k + 1 is the displacement at t k + t k ; Q k is the restoring force at t k ; x k is the displacement at t k . The supplemental exposition addresses the investigation of multi-degree-of-freedom (MDOF) systems, particularly focusing on the energy method applied to elastoplastic MDOF systems. It is worth noting that there exists a limited body of research dedicated to this specific area. Elastoplastic MDOF systems exhibit a complex behavior influenced by a multitude of parameters. These parameters are intricately associated with both the distribution of structural attributes and the characteristics of ground motion. In the domain of seismic energy research concerning MDOF systems, three principal methodological approaches are prominent: firstly, seismic energy assessment predicated on a SDOF system corresponding to the first-order vibration cycle [28]; secondly, seismic energy evaluation grounded in the elastoplastic SDOF system corresponding to multi-order vibration cycles, often employing modal analysis methodologies; and thirdly, the utilization of a stepwise integration technique within dynamic time-history analyses. It is imperative to recognize that direct time-history-based calculations for seismic energy in MDOF systems are computationally intensive and present challenges in formulating a unified design theory and methodology. Presently, Methods 1 and 2 are commonly employed for MDOF analyses, wherein elastoplastic MDOF systems are simplified into equivalent SDOF systems, and the seismic input energy for MDOF systems is derived from the seismic input energy spectrum of the SDOF system. In summation, it is fundamental to underscore that SDOF energy analysis serves as the foundational prerequisite and cornerstone for a comprehensive understanding and effective analysis of MDOF systems.
It is important to note that the proposed damage model differs from the Park–Ang index by treating maximum deformation and cumulative hysteretic energy equally, without a separate weighting factor. While the Park–Ang index combines these components with predefined parameters for calibration, the proposed model directly integrates them in a simplified, normalized form, avoiding reliance on material-specific parameters. This makes the model more adaptable and practical for evaluating cumulative damage in reinforced concrete structures under seismic loading. Also, the proposed framework differs from OpenSees (v2024) by incorporating a specialized time-history program that directly integrates cumulative hysteretic energy dissipation and stiffness degradation within a single-degree-of-freedom system.
It is also pertinent to mention the proposed model focuses on integrating maximum displacement and cumulative hysteretic energy in a normalized framework that emphasizes computational efficiency and generalizability. Unlike the Park–Ang model, the current approach directly incorporates seismic time-history data, capturing cumulative damage evolution under realistic dynamic loading conditions. While different comparisons have been conducted to illustrate the advantages of this approach, a comprehensive evaluation of the Park–Ang formulation can further be explored in future studies.
It is pertinent to discuss here that the limitations of SDOF and MDOF systems become evident when analyzing the seismic performance of reinforced concrete structures. SDOF systems, though useful for simplifying complex structural behavior, often fail to accurately capture the dynamic response of real-world structures, as they reduce the motion to a single point, neglecting the influence of higher vibrational modes that are critical in more complex systems. This simplification restricts the application of SDOF models to structures with dominant modes of vibration and is less suitable for capturing localized failures or the nonlinear behavior of specific structural components. On the other hand, while MDOF systems offer a more detailed representation of structural dynamics by incorporating multiple vibrational modes, they introduce increased computational complexity and require advanced techniques for modal analysis. Additionally, MDOF models can struggle to accurately represent nonlinear behavior under seismic loading, particularly when complex interactions between modes lead to intricate damage patterns. Both SDOF and MDOF approaches, therefore, have inherent limitations in their ability to fully capture the nuances of seismic response, particularly when considering cumulative damage evolution and localized structural failures, which this study seeks to address through its more advanced analytical framework.

4. Computation Results and Analysis

4.1. Control Parameters for Time-Histories Damage Program

This study employed quasi-static test data, labeled SP01~SP10, collected during the initial phases, as control parameters for the time-history damage program. These data were then processed using the data damage energy dissipation calculation program (DECP), specifically developed for this study, to analyze the energy dissipation and damage evolution throughout the structural components. DECP is a tool developed to evaluate the energy dissipation and damage accumulation in structures during seismic events. It processes data such as displacement and hysteretic energy, calculating the progression of damage over time and aiding in the assessment of structural performance and resilience. The damping ratio assigned to the single-degree-of-freedom (SDOF) system is ξ = 0.05. The input parameter values governing the hysteretic restoring force model, specifically x y i e l d , x u , and β, are detailed in Table 3.
In the preliminary phase of the research, a series of experiments were conducted on structural columns, leading to the collection of a comprehensive dataset comprising 279 experimental data points sourced from the PEER database. Utilizing both the author’s experimental data and the PEER database, the study carefully analyzed the calculation methods and established rules for key control parameters, such as damage parameters, yield displacement, yield load, and ultimate displacement. These insights were then applied to the experimental data of 10 component columns, allowing for an in-depth assessment and application of the derived calculation methods to real-world structural scenarios. This approach not only reinforces the validity of the research but also bridges the gap between theoretical calculations and practical, experimentally validated outcomes.
In alignment with the seismic wave response spectrum envelope established during structural testing, seismic waves were meticulously chosen to closely match the design response spectrum, with a permissible deviation of ≤20%. The input sequence for the seismic waves was determined through the weighted summation of the multidirectional seismic wave response spectrum at the primary periodic point. This selection approach was rigorously validated through structural shaking table experiments to ensure its reliability. The YJK (v7) program provided specific criteria for wave selection, including the following: (i) ensuring that the difference between the average seismic influence coefficient curve derived from multiple time-history waves and the seismic influence coefficient curve used in the mode-superposition response spectrum method does not exceed 20% at the period point corresponding to the structure’s principal vibration mode; (ii) ensuring that the computed outcome results in an average bottom shear force along the primary structural direction not less than 80% of the value obtained using the mode superposition response spectrum method, with individual seismic wave input calculations ranging from ≥65% to ≤135%, and an average not exceeding 120%. The selection of seismic waves is based on multiple factors, with three specific seismic waves—EL Centro (total time history: 30 s, dt = 0.02 s), Tri-treasure (total time history: 40.02 s, dt = 0.02 s), and Tianjin NS (total time history: 19.19 s, dt = 0.01 s)—chosen for this study. Each wave is adjusted to an amplitude of 0.2 g while preserving the original total time history. This selection process is illustrated in Figure 3. These three seismic waves were selected to establish a feasible research methodology and to uncover essential research patterns. As the research progressed, additional seismic waves were incorporated, allowing for the development of new methods and conclusions.
This paper adopts control parameters such as the energy consumption factor and stiffness values for loading and unloading, which were obtained through experiments and needed to be input one by one in the program. It is a numerical simulation based on a specific constitutive relationship model. The developed program obtained a Chinese computer software copyright patent (No. 2023SR0535034). The patented software is called “Software for Elastic-plastic Dynamic Analysis of Structural Columns based on a New Damage Model”, or STH-LIN V1.0 for short (MATLAB-based computational tool specifically designed for elastoplastic time-history analysis of reinforced concrete structures).

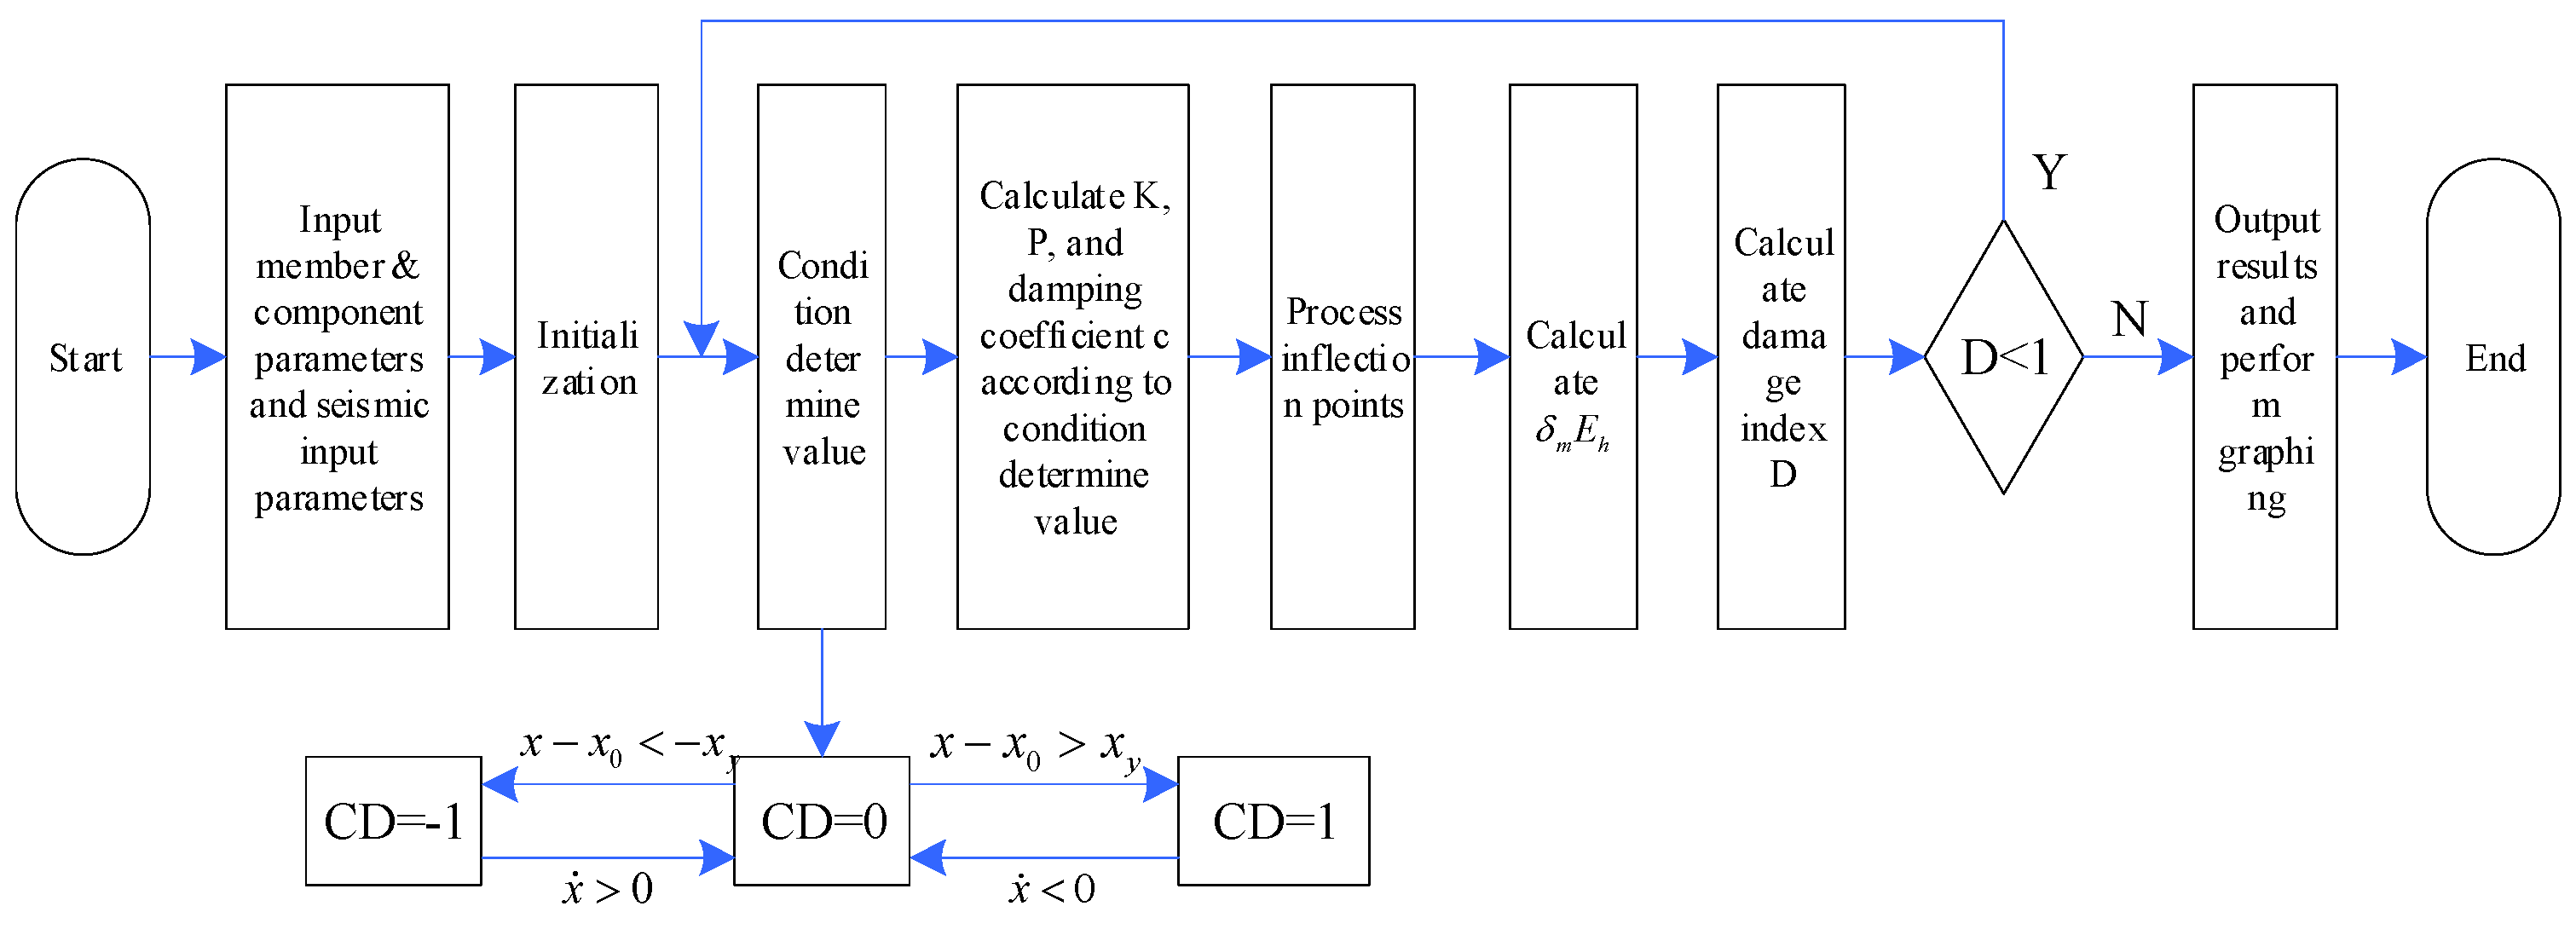
4.2. Time-Histories Damage Program

The STHDAP is employed to conduct calculations and analyses for varying specimens SP01 to SP10, particularly focused on time-history considerations with specific relevance to damage assessment. The SP01-SP10 specimens vary in material properties as indicated by the input parameters and energy dissipation characteristics. In Figure 4 and Table 4, the time-history values, computed by the STHDAP for structural members designated as SP01 to SP10, are presented. It is evident that consistent time histories are observed across various damage criteria for all members from SP01 to SP10, except for SP2, where EL Centro exhibits significantly lower values. Furthermore, Figure 5 and Table 5 depict the maximum deformation values calculated by the STHDAP for the same set of members (SP01 to SP10). These values vary according to the selected damage criteria, with EL Centro displaying the least maximum displacement in comparison to Tri-treasure and TianjinNS. When subjected to different seismic conditions, the displacement response patterns observed in this study are consistent with the displacement change distribution seen in quasi-static tests. Moreover, Figure 6 and Table 6 provide the results of damage assessments computed by the STHDAP for the aforementioned structural members (SP01 to SP10). It is notable that the damage parameters gradually increase for the same members, albeit following distinct patterns and laws. The magnitude of the amplitude and the choice of damage criteria influence these damage calculations.
The analysis of time histories and the assessment of damage evolution under varying seismic wave inputs reveal several key results. Differences in time histories among the same members under various seismic wave inputs arise from variations in amplitudes, spectral characteristics, and other contributing factors, making complete simulation challenging. Consequently, relying solely on quasi-static tests is insufficient for accurately simulating the damage evolution process. When subjected to the same seismic waves, the time histories of SP01 to SP10 members with the same seismic waves exhibit relatively close resemblances, indicating that the numerical simulation of time-history damage in this study effectively captures the inherent characteristics of time-history damage among members. Based on damage evaluation criteria, it becomes evident that the majority of each member’s time histories correspond to instances of slight and moderate damage, with the transition from severe damage to complete failure representing a small fraction of the overall time history. This observation underscores the brevity of the duration spanning from initial yielding to nonlinear conditions leading to failure, which aligns with the test results. When exposed to diverse seismic wave inputs, the cumulative damage value (D) for the same member gradually increases, albeit following distinct patterns and laws. In the initial stages, the increase in cumulative damage follows the sequence EL Centro > Tri-treasure > TianjinNS, which mirrors the varying degrees of ground motion input during the initial phase.
Figure 4 provides a calculation and analysis diagram of STHDAP for SP01 under each seismic wave input. Similar calculation and analysis diagrams can be obtained for other numbered components, due to layout limitations, they will not be reflected one by one in the main text. The detailed statistical data are shown in the following graph. Figure 4, Figure 5 and Figure 6 show a comparison of the time history, maximum displacement and damage time history calculated by STHDAP for members SP01~SP10, as highlighted by inflection points in the plot.
This study describes the duration of energy dissipation damage to components and the maximum displacement during the damage process with the duration of earthquake motion input considered, mainly focusing on column components, and numerical simulations are conducted at the element level of the components. Further research will be conducted in the future, starting from the study of column component damage and forming overall structural damage evaluation parameters through the combination of weight factors for different floors.

4.3. Discussion

The proposed approach allows for damage evaluation at both the member and global structural levels. At the member level, the deformation-energy damage model calculates the damage parameter by combining maximum displacement and cumulative hysteretic energy, offering a detailed understanding of damage progression in individual members. At the global level, overall damage is determined by aggregating the damage values of individual members using a weighted summation. The weights reflect each member’s significance based on factors like load-carrying capacity or location, ensuring that both local and overall structural damage are captured. The damage parameter also aids in predicting failure modes. A value below 0.2 indicates elastic behavior with negligible damage, while values between 0.2 and 0.6 signal moderate damage, such as cracking. Severe damage is represented by a damage parameter between 0.6 and 0.8, indicating large deformations or nearing ultimate capacity, with values above 0.8 indicating collapse, such as buckling or material failure. These thresholds are calibrated using experimental data to ensure accurate predictions. Additionally, load reversals, commonly experienced during earthquakes, increase hysteretic energy dissipation, raising the damage parameter. This effect is particularly relevant for members like beam–column joints, which undergo repeated load reversals. The model captures this by summing the hysteretic energy over the entire loading history, ensuring the damage parameter accurately reflects cumulative damage under realistic seismic conditions.
The sensitivity analysis of the quasi-static parameters reveals how much each input parameter influences the output. By calculating the normalized contribution of each parameter, it was observed that parameters such as Qyield, k1, and k2 have the most significant impact on the ultimate displacement, with contributions of 35%, 24.1%, and 20.1%, respectively. The β parameter has also a prominent influence with the contribution of 10.5%, meaning that changes in this parameter have a meaningful effect on the output. These large contributions suggest that variations in these parameters lead to the most substantial changes in the output. On the other hand, parameters like xfield and xu have relatively smaller contributions, 4.97% and 4.51%, respectively, indicating that their influence on the output is less pronounced. This analysis helps prioritize which parameters should be closely monitored or controlled to achieve desired outcomes in the system. Furthermore, results also indicate that a 10% reduction in stiffness led to a 6.4% increase in maximum displacement and a 4.1% increase in cumulative damage. Conversely, a 15% variation in energy dissipation coefficients resulted in a deviation of less than 5% in overall damage values. These findings demonstrate the robustness of the proposed model to parameter variability, underscoring its reliability for practical applications.
The proposed deformation-energy damage model effectively captures the impact of column parameters such as steel ratio, stiffness, and shear span on damage evolution. For instance, columns with higher stiffness and steel ratios exhibit delayed damage accumulation, while those with lower energy dissipation coefficients show accelerated transitions from moderate to severe damage. Additionally, the model distinguishes between damage patterns induced by far-field and near-field seismic inputs. Far-field motions lead to higher rates of cumulative hysteretic energy dissipation, whereas near-field pulses cause larger peak displacements, emphasizing the necessity of dynamic analysis for a comprehensive damage assessment. These findings underline the model’s capability to analyze structural responses under diverse conditions, providing a robust framework for performance-based seismic design.
Moreover, quasi-static cyclic tests provide valuable insights into material behavior and fundamental response mechanisms, they lack the temporal and amplitude variations inherent in seismic events. Dynamic time history analysis bridges this gap by incorporating real-time variations in load characteristics, enabling the evaluation of damage evolution under realistic conditions. This study demonstrates the superiority of dynamic analysis in capturing the progressive accumulation of hysteretic energy and stiffness degradation, which are critical for understanding the true damage potential of seismic loads.
The simplified integration of maximum displacement and cumulative hysteretic energy in the proposed model eliminates the need for calibration parameters typical of the Park–Ang model. This study highlights the effectiveness of the proposed framework under dynamic loading conditions, particularly in capturing the effects of stiffness degradation and energy dissipation. A detailed comparison with the Park–Ang formulation, considering evolution under various loading paths and structural configurations, is planned for future research to validate and further refine the current approach. The Park–Ang model, which combines maximum displacement and cumulative hysteretic energy, is widely recognized for its ability to capture structural damage, yet it relies on predefined calibration factors and weight parameters, limiting its generalizability across different structural configurations and material properties. In contrast, the proposed model does not require case-specific calibration, offering a more flexible and generalized approach to damage evaluation. The advantages of the proposed model lie in its ability to seamlessly integrate seismic time histories for enhanced realism, addressing key limitations of existing models and offering a more accurate tool for structural assessment in seismic engineering [29,30,31].

4.4. Practical Implications

The results of this study have significant implications for structural design, particularly in optimizing damping systems and retrofitting strategies. For instance, the deformation-energy model, which captures the effects of stiffness degradation and energy dissipation, can be leveraged to optimize the placement of dampers in high-strength concrete structures. By strategically placing dampers, engineers can mitigate excessive displacement and enhance the overall performance of the structure under dynamic loading conditions, such as during seismic events. Furthermore, insights from the cumulative damage evolution provide valuable guidance for retrofitting existing buildings, especially in seismic-prone regions. Understanding how energy dissipation impacts the accumulation of damage over time can inform the development of more effective retrofitting techniques aimed at extending the lifespan of buildings while minimizing the risk of structural failure. This model’s versatility allows it to be applied beyond simple structural configurations, offering a robust framework for evaluating the seismic performance of more intricate and multi-component systems. In terms of retrofitting strategies, the model provides a valuable tool for assessing the effectiveness of various modifications aimed at improving the seismic resilience of existing structures. By accurately predicting damage accumulation and energy dissipation, the model can inform decisions regarding the most efficient retrofitting interventions. Furthermore, in the context of performance-based seismic design, the model’s integration of seismic time histories allows for a more realistic and nuanced understanding of structural behavior under dynamic loading, facilitating the design of structures that meet specific performance criteria under varying levels of seismic risk. This broader applicability positions the model as a versatile tool with the potential for widespread use across diverse engineering contexts, enhancing its utility for both design and evaluation in the field of seismic engineering. It is pertinent to mention that numerical simulations, although capable of modeling various loading conditions, often struggle to reproduce the detailed material behaviors and localized damage observed in full-scale structures during seismic events. Quasi-static test data, while useful for approximating certain aspects of structural performance, may not fully replicate the time-dependent effects of seismic loading, such as the rapid accumulation of damage or the transient responses that occur during actual earthquakes. Furthermore, to address this limitation, moving forward, full-scale experimental studies simulating actual seismic events can be crucial to further validate the model’s predictions, especially under varying ground motions and complex structural configurations. By integrating experimental data into future iterations of the model, the study aims to enhance its accuracy and applicability, ensuring that the proposed deformation-energy time-history damage model can effectively predict structural responses under a wider range of seismic scenarios. Such experimental validation efforts would significantly strengthen the model’s credibility and utility in practical seismic engineering applications, ultimately bridging the gap between computational predictions and real-world structural performance.

5. Conclusions

The investigation presented in this study focuses on the pivotal role of ground motion time histories (STHs) in influencing structural damage, particularly in the transition to the elastoplastic stage. These time histories exert a direct influence on critical parameters, notably the maximum elastoplastic displacement ( δ m a x ) and the cumulative hysteretic energy ( E h ). The key findings of this research can be summarized as follows: the time histories have a direct impact on the maximum elastoplastic displacement δ m a x and the cumulative hysteretic energy E h .
The following main discussion points and conclusions are drawn through the research in this paper:
(1)
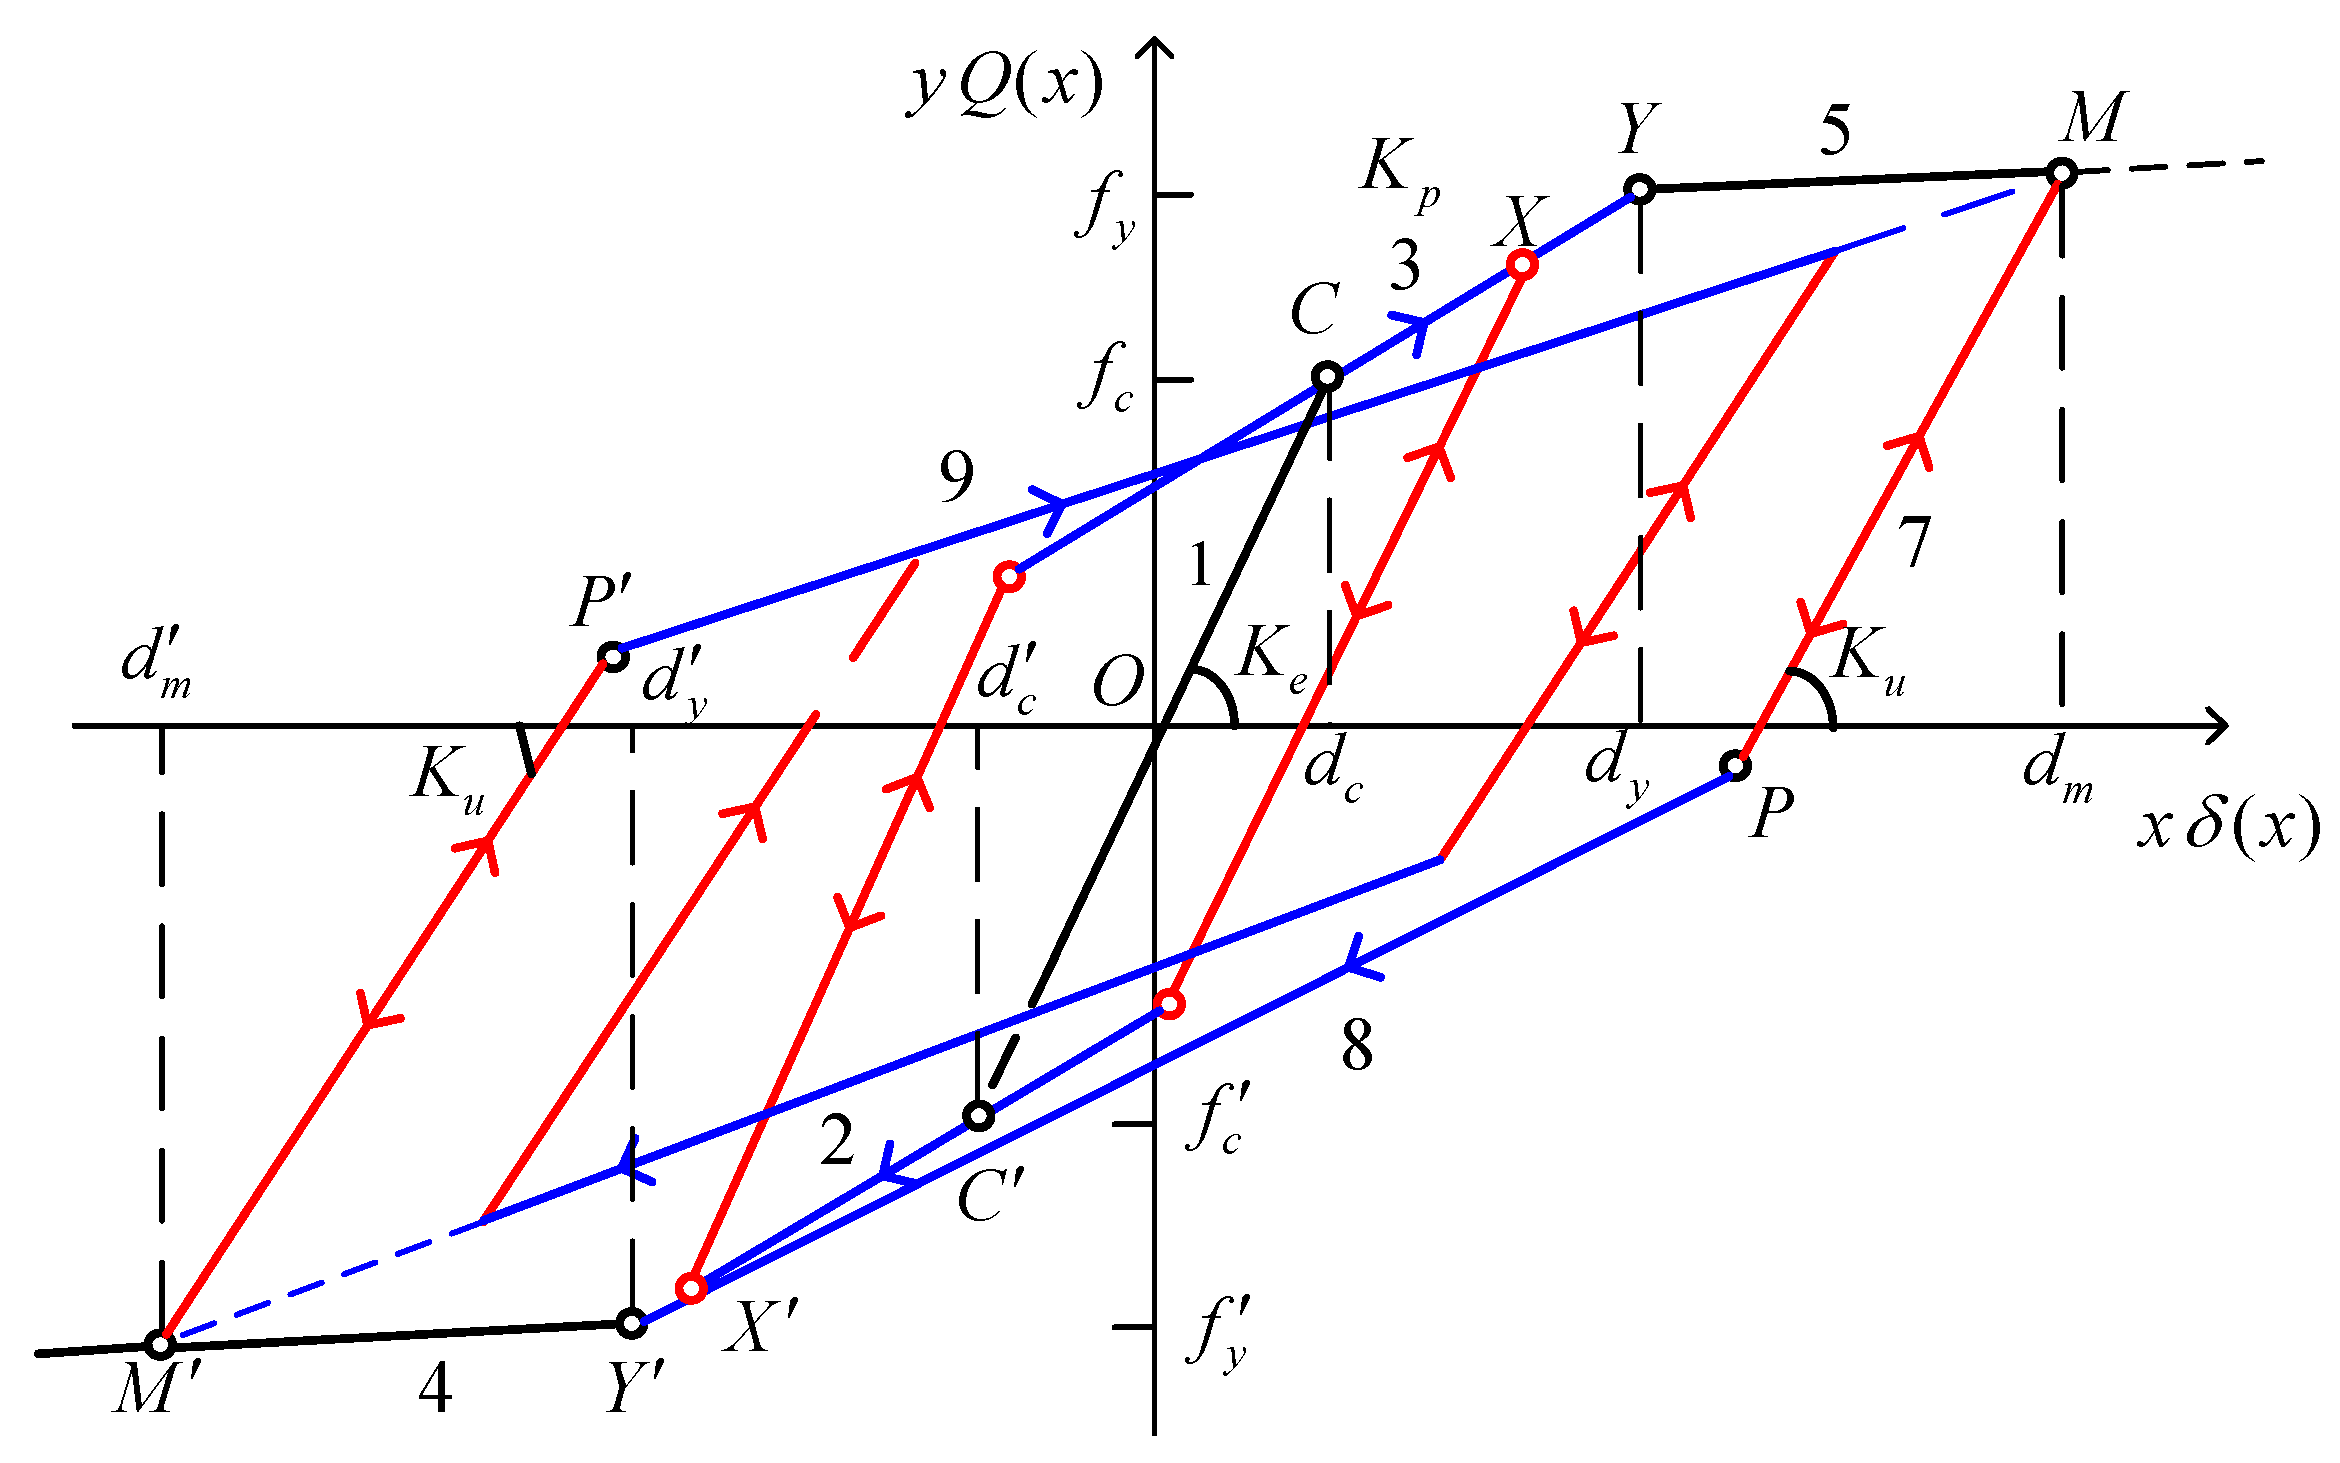
This study entails the development of an extensive STHDAP with the aim of investigating structural damage within elastoplastic time histories. The program is meticulously crafted through several key steps. Firstly, a deformation energy time-history damage model is established. This model incorporates cyclic load energy dissipation damage parameters, meticulously derived from the PEER database and quasi-static test data. Additionally, it employs a degraded trilinear restoring force model. The program further investigates the conditions governing the restoring force model, particularly under loading conditions, and analyzes the uniform formula of the restoring force model in inflection point motion conditions. Subsequently, the program formulates the elastoplastic equation of motion, encompassing the uniform formula of stiffness and load, denoted as K ¯ P ¯ . This equation facilitates the computation of the structural response of the system at any given time (t) using linear acceleration and incorporates a relative input energy equation for analytical purposes. Notably, this study culminates in the development of a computational method for calculating the cumulative dissipated energy, denoted as E h ( t ) , within the single-degree-of-freedom (SDOF) system during elastoplastic time histories. Furthermore, the study encompasses the development of a computational approach based on time history E h ( t ) and damage value D t . This method serves as a foundational framework for investigating elastoplastic energy dissipation within multi-degree-of-freedom (MDOF) systems. The resulting STHDAP offers comprehensive insights into the evolution of structural damage throughout elastoplastic time histories, making it a valuable tool for the analysis and determination of elastoplastic time-histories outcomes. Importantly, the proposed deformation-energy damage model is poised to facilitate the assessment of elastoplastic damage in high-strength reinforced concrete structures subjected to ground motion, thereby enhancing our understanding of their structural behavior under such conditions.
(2)
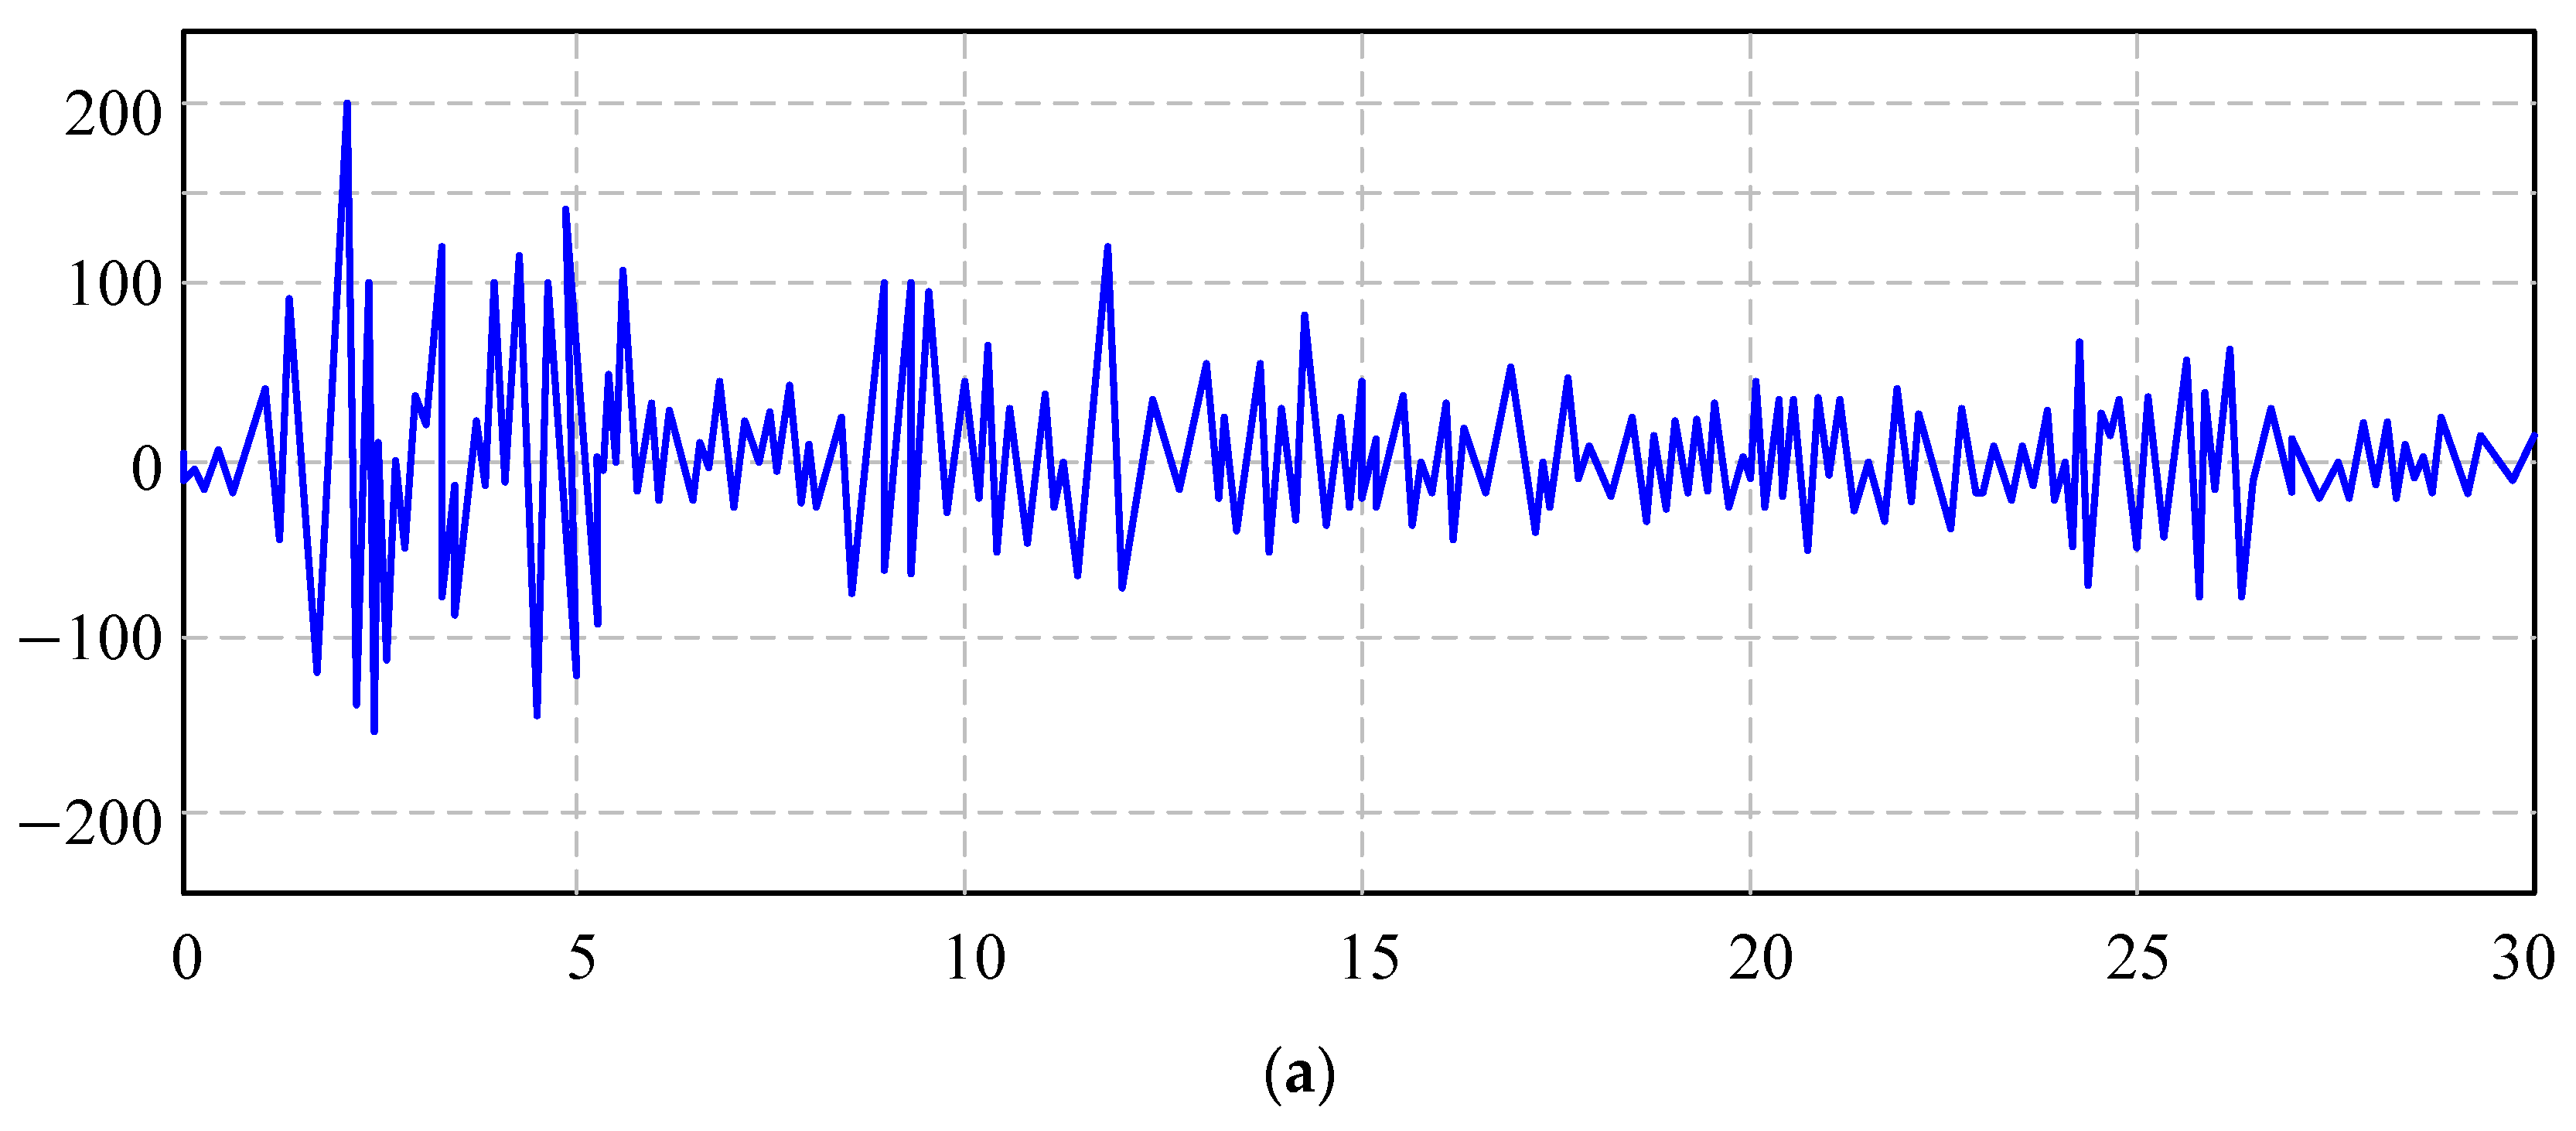
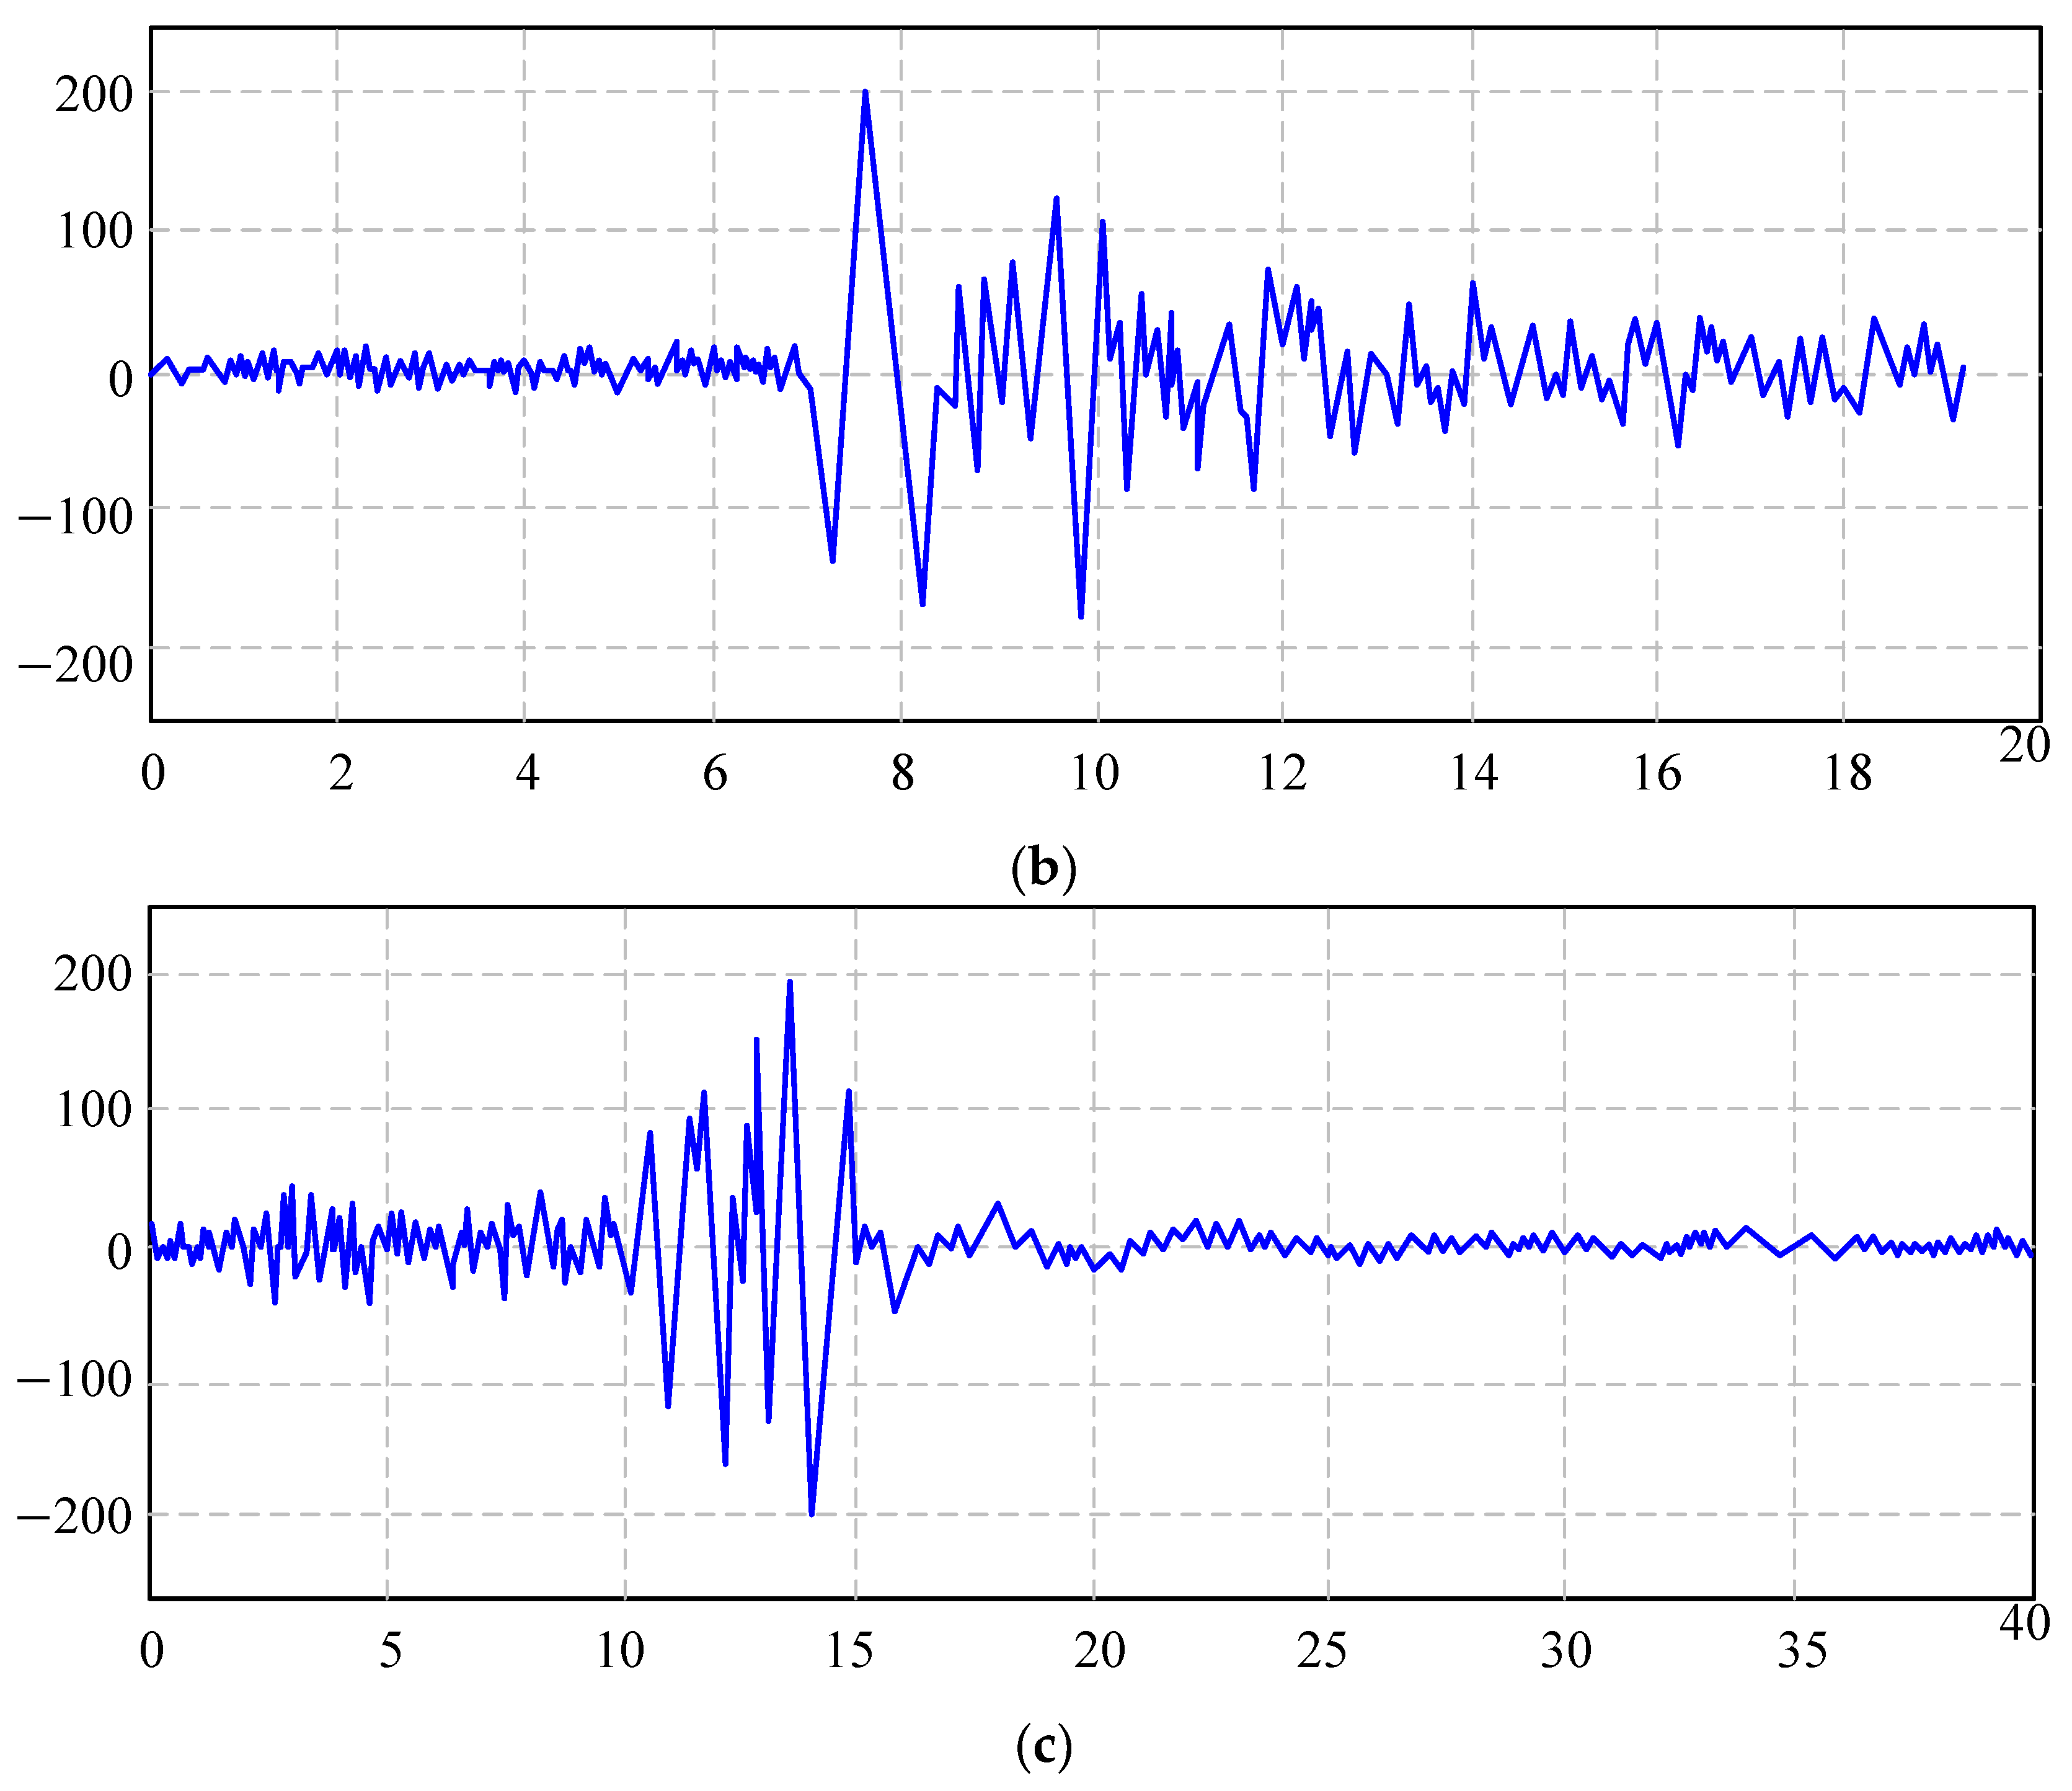
The primary governing parameters of the restoring force model are derived through the utilization of the DECP analysis program, employing data from members denoted as SP01 through SP10. Subsequently, the pertinent test parameters associated with these members are systematically integrated into the STHDAP, facilitating a comprehensive analysis and computational evaluation. To assess the structural response, El Centro, Tri-treasure, and TianjinNS seismic waves are introduced into the STHDAP, enabling the calculation and subsequent analysis of various response characteristics of the SP01 through SP10 members. These characteristics encompass displacement response, acceleration response, time-history energy consumption, and the assessment of damage incurred. The analytical findings reveal a consistent trend wherein the cumulative damage sustained by each member tends to exhibit a progressive increase. However, it is noteworthy that these increments are characterized by variations in both amplitude and underlying patterns.
(3)
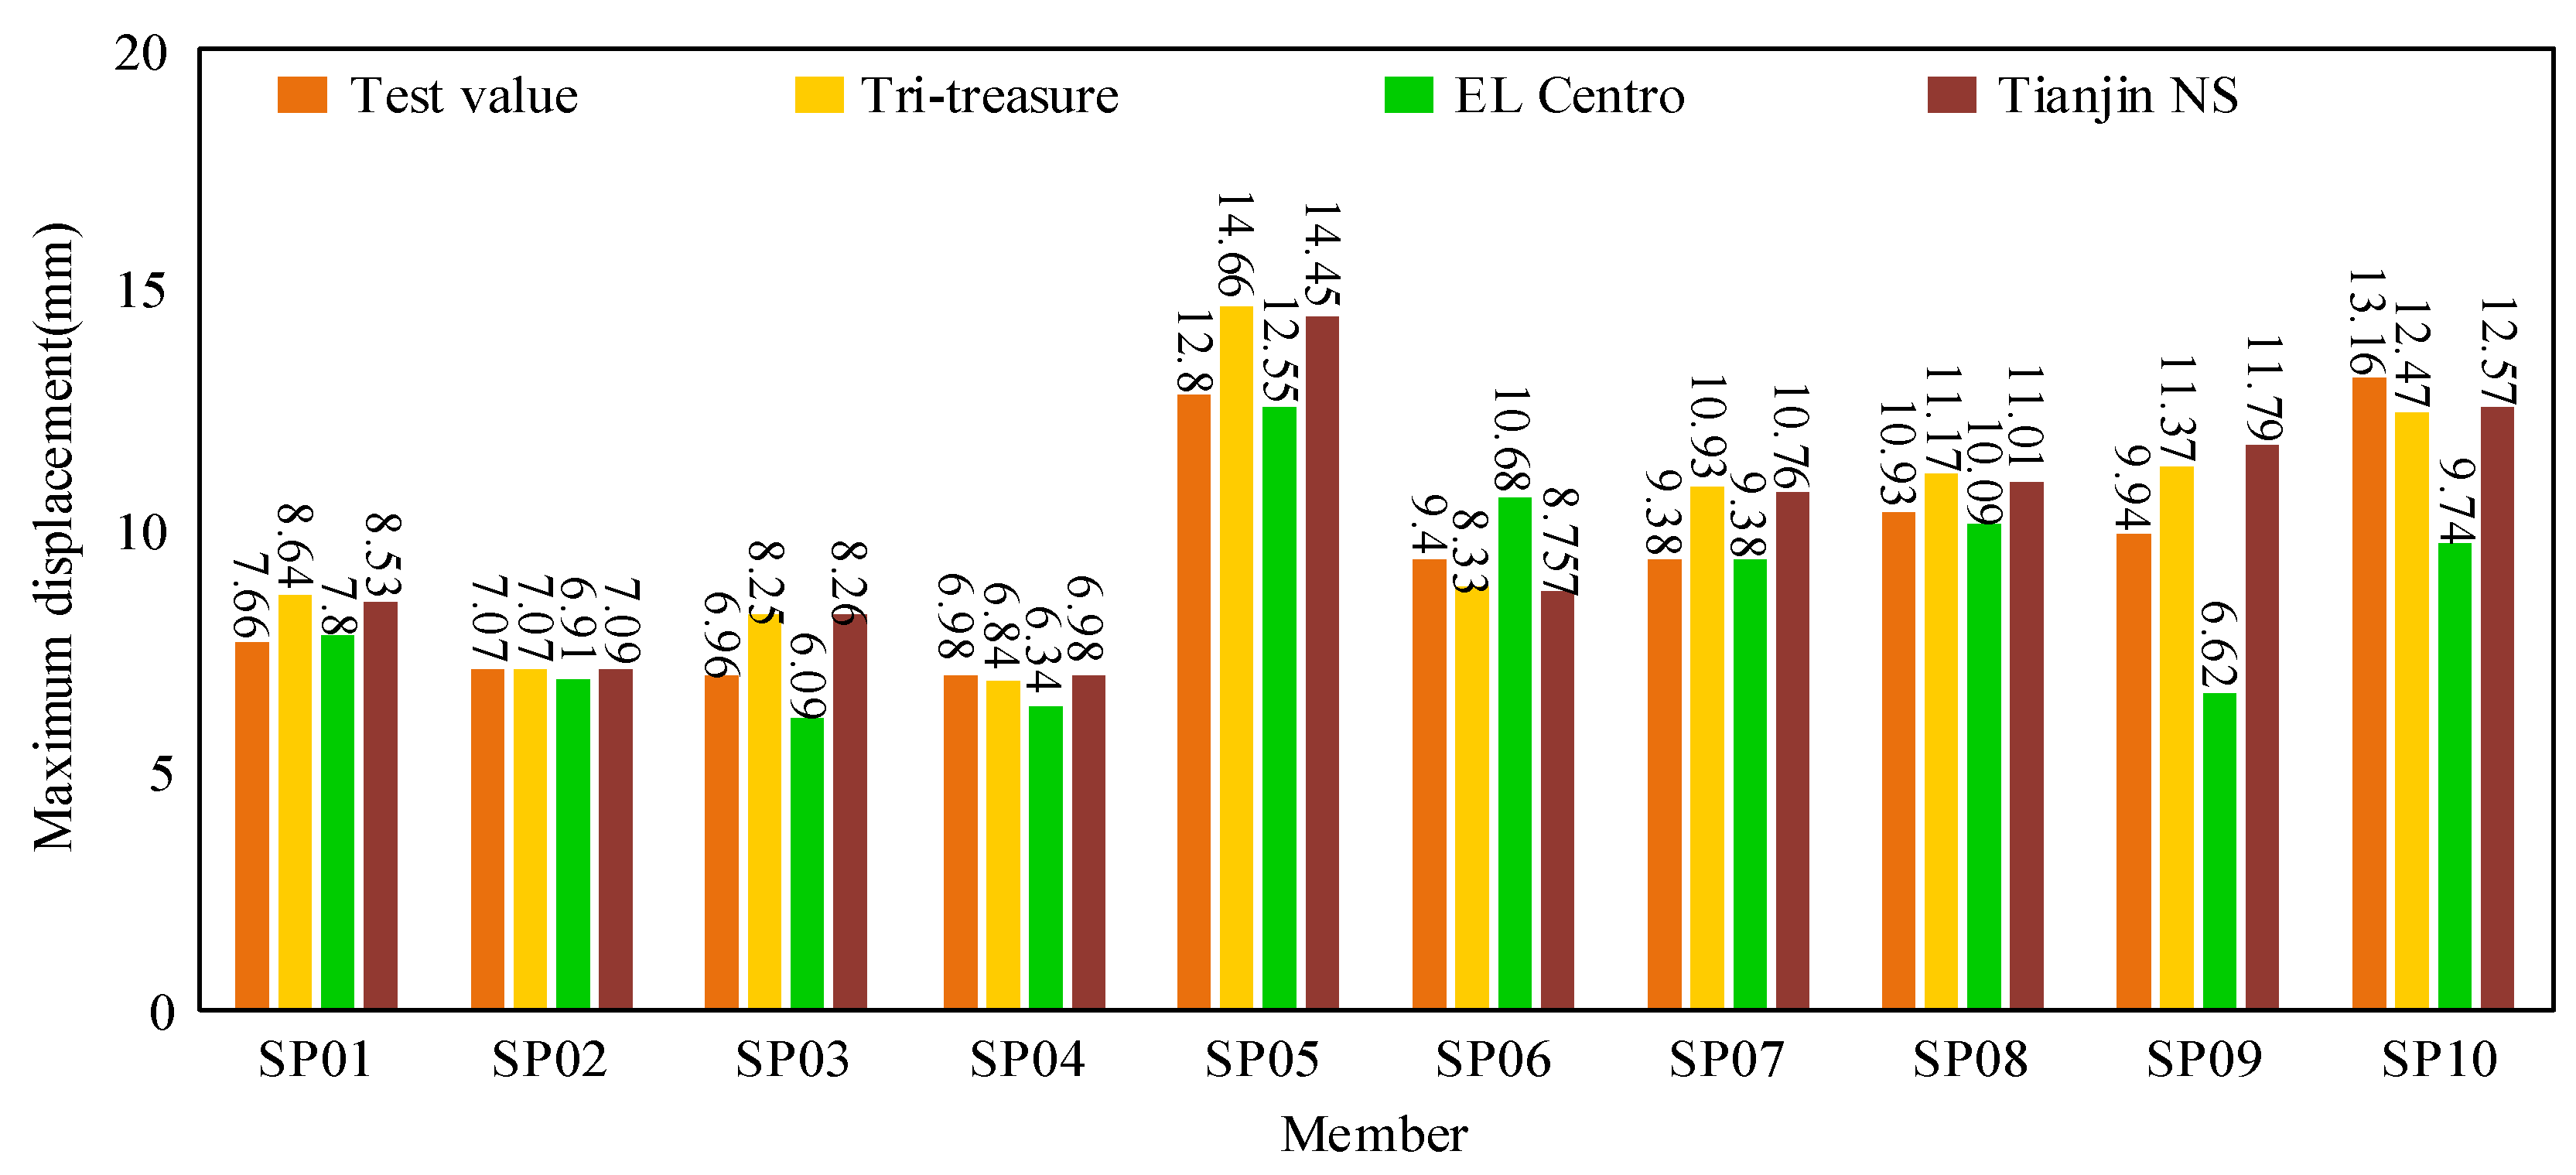
The analysis of displacement and energy dissipation reveals noteworthy insights. When subjected to varying seismic wave inputs, the displacement response patterns exhibited by the test column align with the displacement change distributions observed in quasi-static tests. However, it is imperative to acknowledge that discrepancies arise in the specific displacement values attained when the critical limit condition is reached. Consequently, qualitative descriptions of this phenomenon become challenging. This suggests that when assessing damage factors associated with members, it is imperative to consider not only the maximum deformation but also the influence of E h . It is pertinent to note that hysteretic energy exhibits variability in response to changes in the loading regimen and does not adhere to a continuous regularity, as observed in quasi-static tests.
(4)
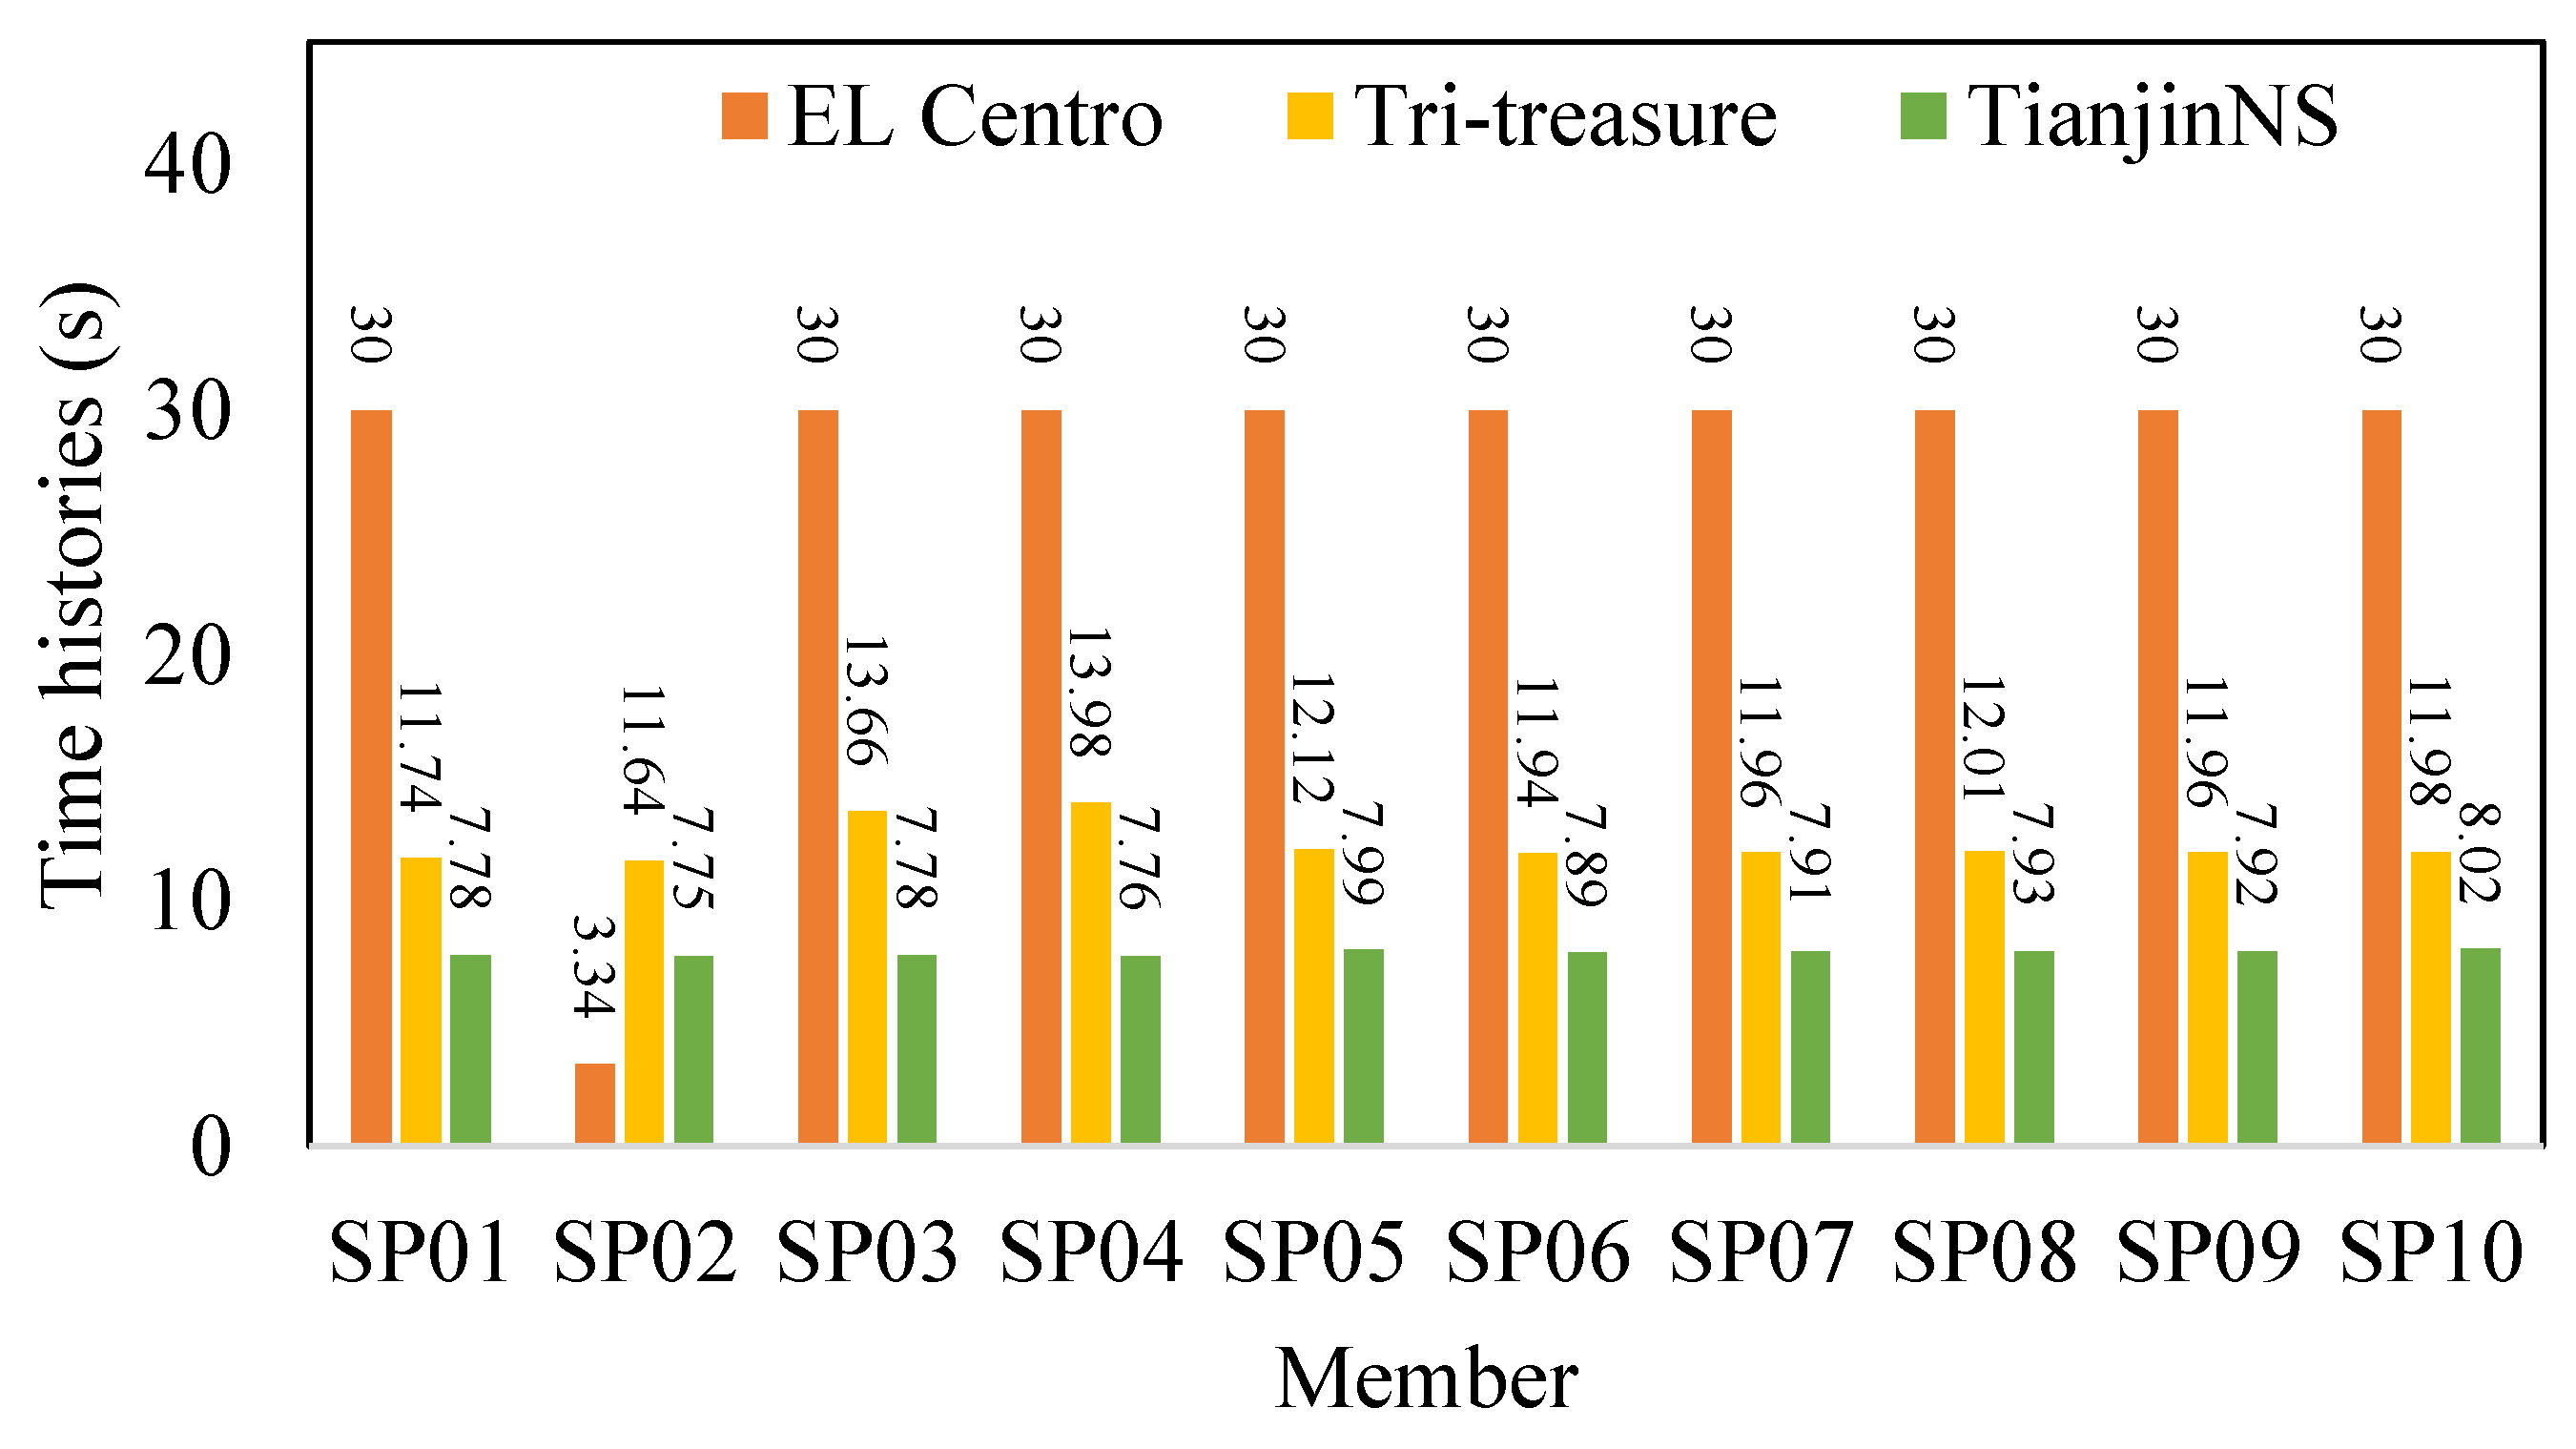
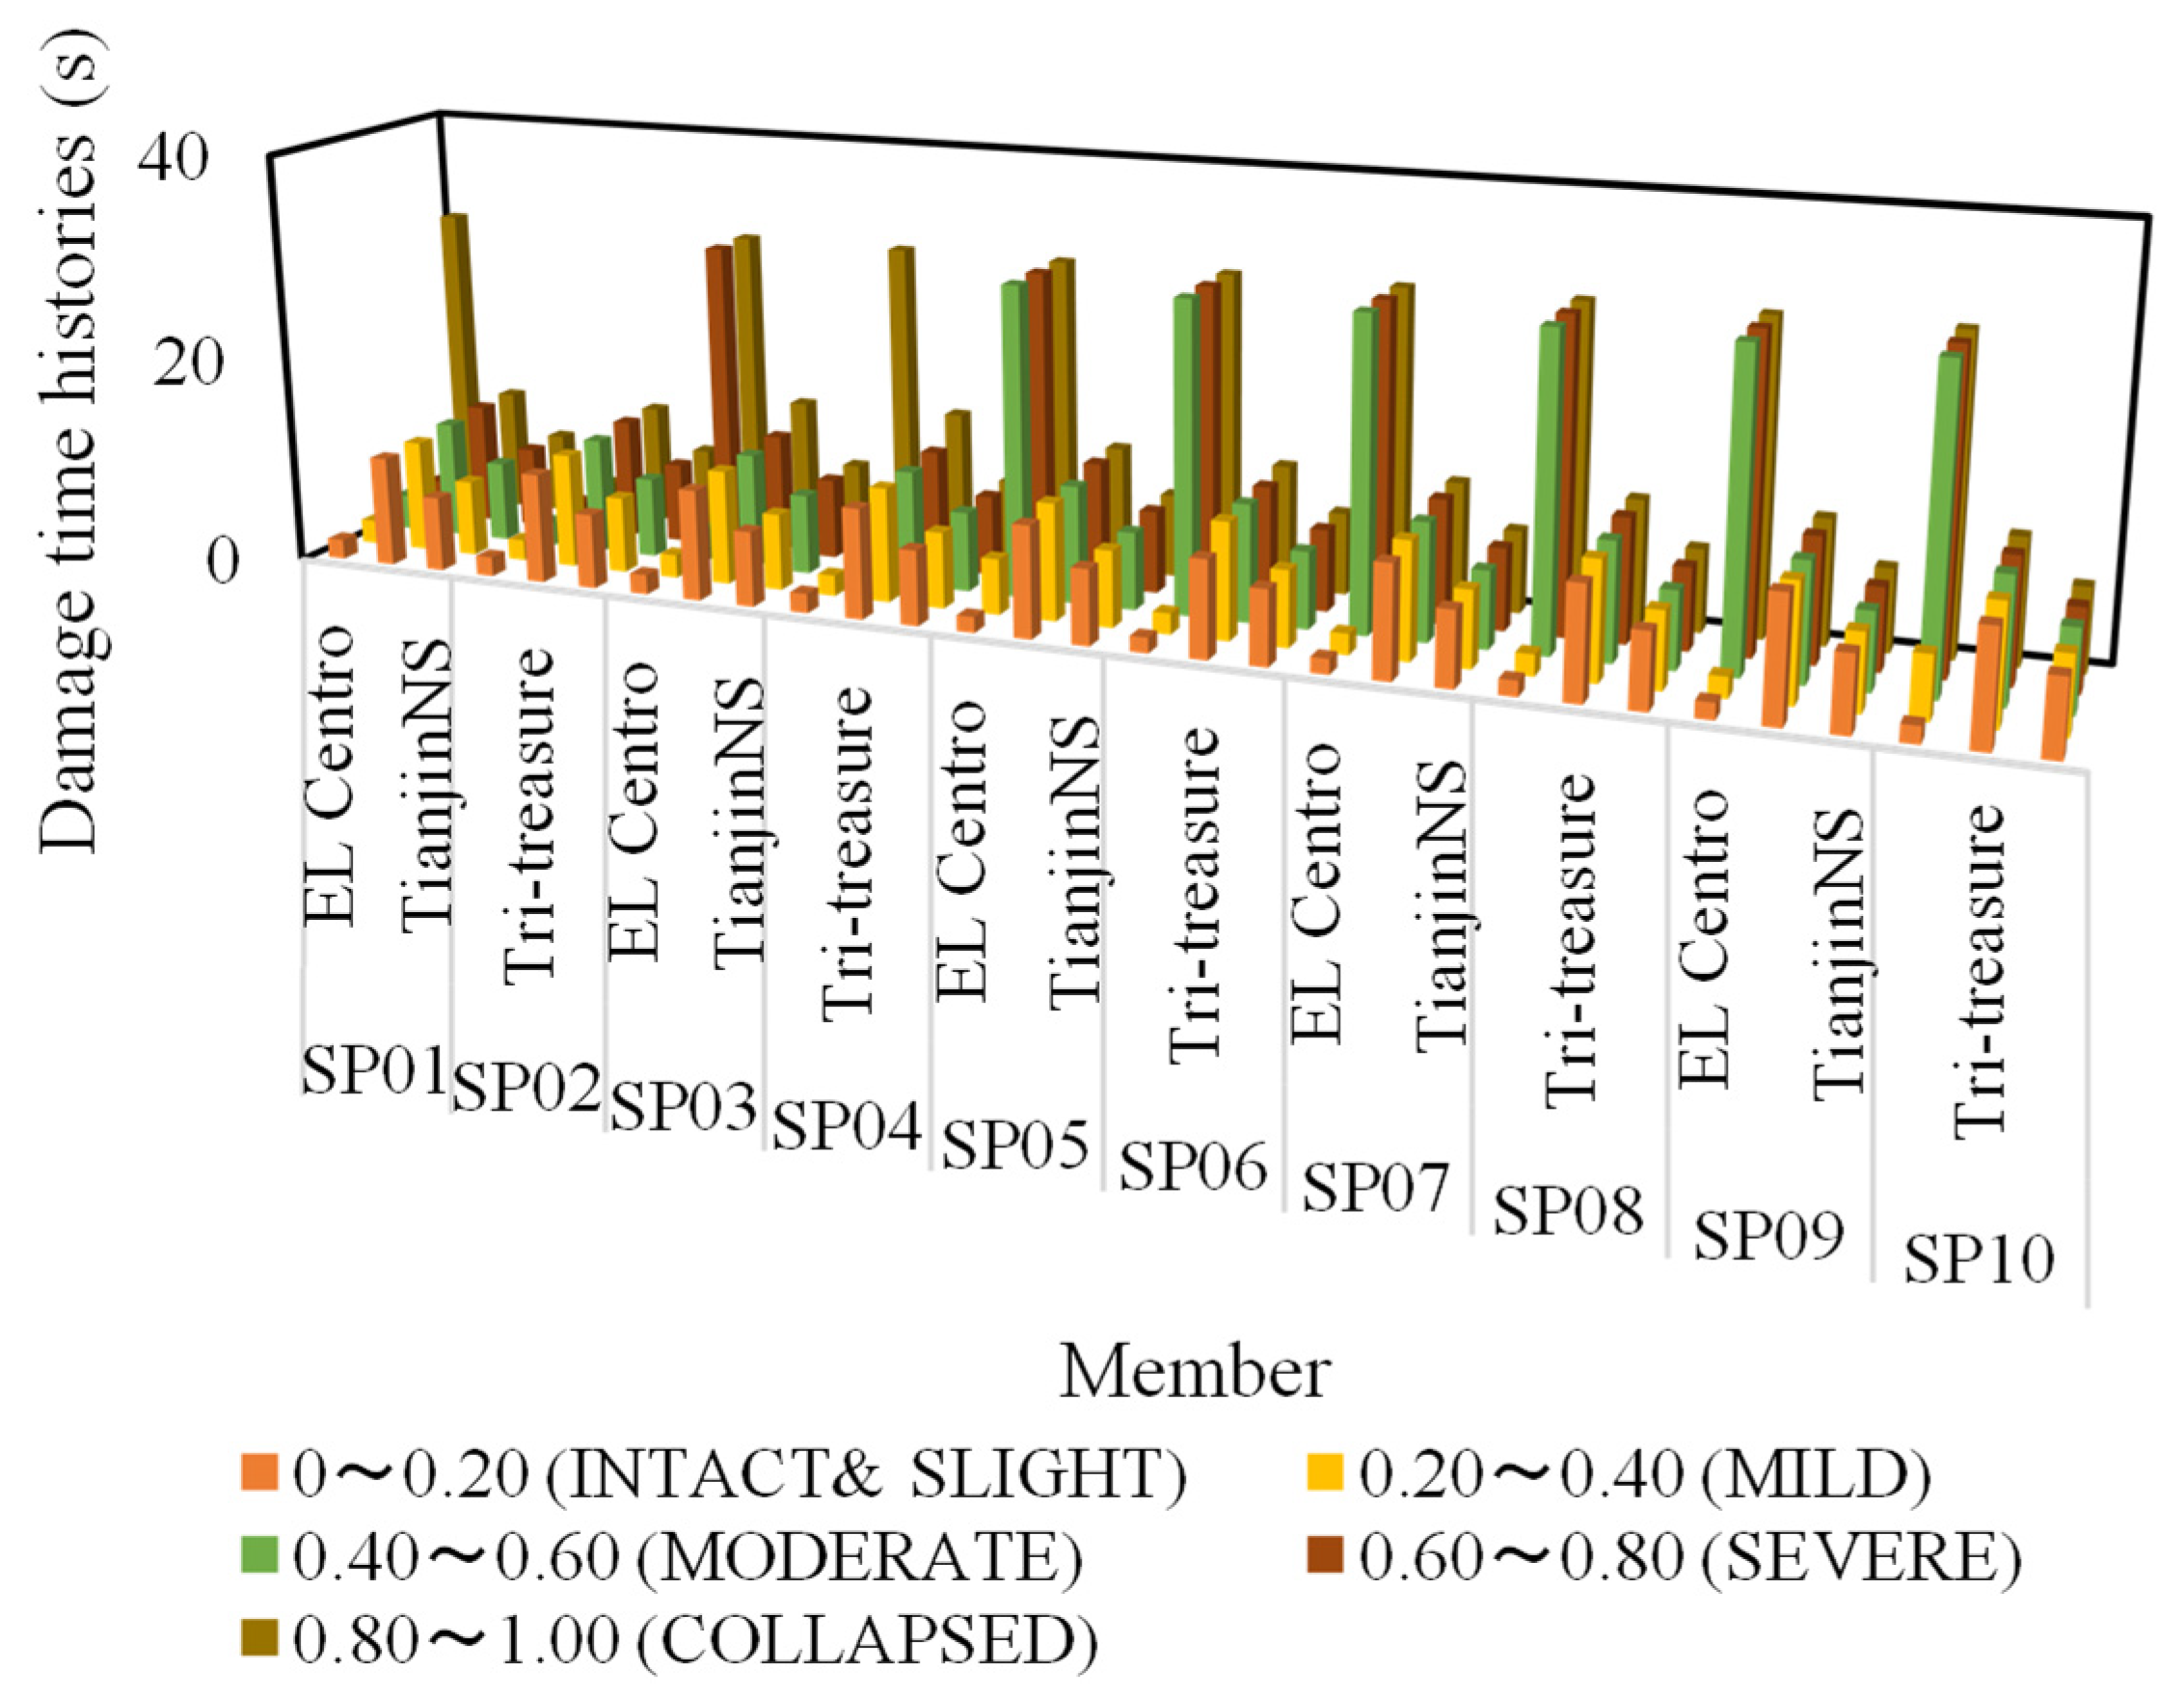
The analysis of time histories and damage evolution under varying seismic wave inputs reveals several key findings. Firstly, differences in time histories within the same member under different seismic wave inputs stem from variations in amplitudes, spectral characteristics, and other contributing factors. Consequently, relying solely on quasi-static tests proven insufficient for accurately simulating the damage evolution process. Secondly, when subjected to the same seismic waves, the time histories of SP01~SP10 members exhibit relatively close resemblance, signifying that the numerical simulation of time-history damage within this study effectively captures the inherent characteristics of time-history damage among members. Thirdly, based on damage evaluation criteria, it becomes evident that the majority of each member’s time histories correspond to instances of slight and moderate damage, with the transition from severe damage to complete failure representing a minor fraction of the overall time history. This observation underscores the brevity of the duration spanning from initial yielding to nonlinear conditions leading to failure, aligning with the outcomes of the test analyses. Finally, when exposed to diverse seismic wave inputs, the cumulative damage value (D) for the same member exhibits gradual increments, albeit following distinct patterns and amplitudes. In the initial stages, the order of increase follows the sequence EL Centro > Tri-treasure > TianjinNS, mirroring the varying degrees of ground motion excitation during the initial phase.
Although the proposed model offers valuable insights into the evaluation of seismic performance and damage accumulation, it faces limitations in fully replicating the material behaviors and localized damage observed in full-scale structures during seismic events. Numerical simulations, although versatile, may struggle to capture time-dependent effects such as rapid damage accumulation and transient responses under actual earthquake conditions. To address these limitations, future research should focus on full-scale experimental studies that simulate real seismic events, allowing for the validation of the model’s predictions under varying ground motions and complex structural configurations. Integrating experimental data into future iterations of the model will enhance its accuracy, applicability, and reliability, ultimately bridging the gap between computational simulations and real-world structural performance. These efforts will be pivotal in advancing the model’s utility for both seismic design and retrofitting strategies, contributing to more resilient infrastructure. Also, future studies could expand upon this work by incorporating a larger set of seismic records to further assess variability and robustness, with the current study and comparison with existing methods and software packages serving as a benchmark for future studies.

Funding

This work is supported by the Natural Science Foundation of Fujian Province, China (Grant No. 2019J01711), the Education & Scientific Foundation of Fujian Province of China (Grant No. JAT200257), and the Ph.D. Scientific Research Fund of Jimei University (Grant No. ZQ2017009). We are very grateful for their financial support.

Data Availability Statement

All data generated or analyzed during this study are included in this published article.

Conflicts of Interest

The author declares no conflicts of interest.

Abbreviations

Nteres
DDamage parameter
Δu_iDisplacement increment at the i-th step
FiForce at the i-th step
HCumulative hysteretic energy
mSystem mass
cDamping coefficient
uDisplacement
üAcceleration
u ˙ Velocity
KUniform stiffness
PUniform load
βParameter for cyclic energy dissipation characteristics
αParameter from quasi-static tests
TTime
D = 1.0Maximum damage threshold
SDOFSingle-degree-of-freedom system
STHSeismic time histories
STHDAPSTH Damage Analysis Program
MDOFMulti-Degree-of-Freedom
PEERPacific Earthquake Engineering Research (database)
EL CentroA seismic wave dataset used in the study
Tri-treasureAnother seismic wave dataset
Tianjin NSThird seismic wave dataset
DECPData damage energy dissipation calculation program
YJKSoftware program referenced for seismic wave selection
SPSpecimen designation used in the study (e.g., SP01-SP10)
ξDamping ratio
k1First-order stiffness slope in the restoring force model
k2Second-order stiffness slope in the restoring force model
xfieldParameter related to the analysis
xuUltimate deformation displacement
ξDamping ratio
QyieldYield load
uyieldYield displacement
THTotal seismic time histories
EkKinetic energy increment
EcEnergy dissipated by viscous damping
EHIncrement of hysteretic energy dissipation
ETTotal energy input to the structure
DECPData Damage Energy Dissipation Calculation Program
BPBack Propagation (algorithm)
STSeismic wave total duration
SPSpecimen Designation (e.g., SP01–SP10)

References

  1. Thwin, W.T. Seismic Response Evaluation of Reinforced Concrete Building with Time History Analysis. Int. J. Sci. Eng. Technol. Res. 2014, 6, 905–911. [Google Scholar]
  2. Memari, A.M.; Motlagh, A.Y.; Scanlon, A. Seismic evaluation of an existing reinforced concrete framed tube building based on inelastic dynamic analysis. Eng. Struct. 2000, 22, 621–637. [Google Scholar] [CrossRef]
  3. Boonyapinyo, V.; Choopool, N.; Warnitchai, P. Seismic performance evaluation of reinforced-concrete buildings by static pushover and nonlinear dynamic analyses. In Proceedings of the 14th World Conference on Earthquake Engineering, Beijing, China, 12–17 October 2008. [Google Scholar]
  4. Li, Y.C.; Gao, M. Dynamic Elasto-Plastic Analysis of a High-Rise Hybrid Structure. Appl. Mech. Mater. 2011, 71, 266–269. [Google Scholar] [CrossRef]
  5. Kou, X.; Li, L.; Du, X.; Zheng, X. Elastoplastic dynamic constitutive model of concrete with combined effects of temperature and strain rate. Case Stud. Constr. Mater. 2023, 18, e01905. [Google Scholar] [CrossRef]
  6. Oyguc, R.; Tonuk, G.; Oyguc, E.; Ucak, D. Damage accumulation modelling of two reinforced concrete buildings under seismic sequences. Bull. Earthq. Eng. 2023, 21, 4993–5015. [Google Scholar] [CrossRef]
  7. Zameeruddin, M.; Sangle, K.K. Review on Recent developments in the performance-based seismic design of reinforced concrete structures. Structures 2016, 6, 119–133. [Google Scholar] [CrossRef]
  8. ur Rehman, Z.; Zhang, G. Three-dimensional elasto-plastic damage model for gravelly soil-structure interface considering the shear coupling effect. Comput. Geotech. 2021, 129, 103868. [Google Scholar] [CrossRef]
  9. Feng, D.; Kolay, C.; Ricles, J.M.; Li, J. Collapse simulation of reinforced concrete frame structures. Struct. Des. Tall Spec. Build. 2016, 25, 578–601. [Google Scholar] [CrossRef]
  10. Dolsek, M. Development of computing environment for the seismic performance assessment of reinforced concrete frames by using simplified nonlinear models. Bull. Earthq. Eng. 2010, 8, 1309–1329. [Google Scholar] [CrossRef]
  11. Lin, H.B.; Tang, S.G.; Lan, C. Damage analysis and evaluation of high strength concrete frame based on deformation-energy damage model. Math. Probl. Eng. 2015, 2015, 781382. [Google Scholar] [CrossRef]
  12. Chou, C.C.; Uang, C.M. A procedure for evaluating seismic energy demand of framed structures. Earthq. Eng. Struct. Dyn. 2002, 32, 229–244. [Google Scholar] [CrossRef]
  13. Rehman, Z.U.; Zhang, G. Shear coupling effect of monotonic and cyclic behavior of the interface between steel and gravel. Can. Geotech. J. 2019, 56, 876–884. [Google Scholar] [CrossRef]
  14. Rehman, Z.U.; Zhang, G. Cyclic behavior of gravel–steel interface under varying rotational shear paths. Can. Geotech. J. 2021, 58, 305–316. [Google Scholar] [CrossRef]
  15. Rehman, Z.U.; Luo, F.; Wang, T.; Zhang, G. Large-scale test study on the three-dimensional behavior of the gravel–concrete interface of a CFR dam. Int. J. Geomech. 2020, 26, 04020046. [Google Scholar] [CrossRef]
  16. Yue, J.; Qian, J.; Beskos, D.E. A generalized multi-level seismic damage model for RC framed structures. Soil Dyn. Earthq. Eng. 2016, 80, 25–39. [Google Scholar] [CrossRef]
  17. Wang, F.; Li, H.N.; Zhang, N. A method for evaluating earthquake-induced structural damage based on displacement and hysteretic energy. Adv. Struct. Eng. 2016, 19, 1165–1176. [Google Scholar] [CrossRef]
  18. Huang, W.; Qian, J.; Zhou, Z. Seismic Damage Assessment of Steel Reinforced Concrete Members by a Modified Park-Ang Model. Eng. Struct. 2016, 15, 605–611. [Google Scholar] [CrossRef]
  19. BCUO. PEER Strong Motion Database. 2024. Available online: https://peer.berkeley.edu/peer-strong-ground-motion-databases (accessed on 1 January 2025).
  20. Abid, U.; Haider, A.; Alshameri, B.; ur Rehman, Z.; Khan, A.J.; Mahmood, N.; Hassan, S. Determination of ground motion parameters of urban centers of Balochistan province. Soil Dyn. Earthq. Eng. 2023, 175, 108221. [Google Scholar] [CrossRef]
  21. Mahmood, K.; Farooq Rehman, Z.K.; Memon, S.A. One dimensional equivalent linear ground response analysis—A case study of collapsed Margalla Tower in Islamabad during 2005 Muzaffarabad Earthquake. J. Appl. Geophys. 2016, 130, 110–117. [Google Scholar] [CrossRef]
  22. Mahmood, K.; Zamin, B.; Iqbal, S.; Rehman, Z.; Afzal, S.; Safdar, M.; Iqbal, Q.; Ali, A. Local site effect on seismic hazard of the relocated new Balakot town. Soil Dyn. Earthq. Eng. 2022, 162, 107451. [Google Scholar] [CrossRef]
  23. Uang, C.; Bertero, V.V. Evaluation of seismic energy in structures. Earthq. Eng. Struct. Dyn. 1990, 19, 77–90. [Google Scholar] [CrossRef]
  24. Chapman, M.C. On the use of elastic input energy for seismic hazard analysis. Earthq. Spectra 1999, 15, 607–635. [Google Scholar] [CrossRef]
  25. Decanini, L.D.; Mollaioli, F. Formulation of elastic earthquake input energy spectra. Earthq. Eng. Struct. Dyn. 1998, 27, 1503–1522. [Google Scholar] [CrossRef]
  26. De Domenico, D.; Ricciardi, G.; Takewaki, I. Design strategies of viscous dampers for seismic protection of building structures: A review. Soil Dyn. Earthq. Eng. 2019, 118, 144–165. [Google Scholar] [CrossRef]
  27. Symans, M.D.; Charney, F.A.; Whittaker, A.S.; Constantinou, M.C.; Kircher, C.A.; Johnson, M.W.; McNamara, R.J. Energy dissipation systems for seismic applications: Current practice and recent developments. J. Struct. Eng. 2008, 134, 3–21. [Google Scholar] [CrossRef]
  28. Cheng, G.Y.; Ye, L.P. Earthquake input energy spectrum for inelastic SDOF systems. Eng. Mech. 2008, 25, 28–039. [Google Scholar]
  29. Xiao, F.; Mao, Y.; Sun, H.; Chen, G.S.; Tian, G. Stiffness Separation Method for Reducing Calculation Time of Truss Structure Damage Identification. Struct. Control Health Monit. 2024, 2024, 5171542. [Google Scholar]
  30. Xiao, F.; Mao, Y.; Tian, G.; Chen, G.S. Partial-Model-Based Damage Identification of Long-Span Steel Truss Bridge Based on Stiffness Separation Method. Struct. Control Health Monit. 2024, 2024, 5530300. [Google Scholar]
  31. Xiao, F.; Sun, H.; Mao, Y.; Chen, G.S. Damage identification of large-scale space truss structures based on stiffness separation method. Structures 2023, 53, 109–118. [Google Scholar] [CrossRef]
Figure 1. Flowchart design of STHDAP.
Buildings 15 00971 g001
Figure 2. Clough model featuring trilinear stiffness degradation. In the figure, the blue line represents the loading phase of the hysteresis curve, and the red line represents the unloading phase.
Buildings 15 00971 g002
Figure 3. Seismic wave input used in STHDAP analysis. (a) EL Centro (total time history: 30 s, dt = 0.02 s). (b) Tri-treasure (total time history: 40.02 s, dt = 0.02 s). (c) Tianjin NS (total time history: 19.19 s, dt = 0.01 s).
Buildings 15 00971 g003aBuildings 15 00971 g003b
Figure 4. Comparison of time history calculated by STHDAP for members SP01 through SP10.
Buildings 15 00971 g004
Figure 5. Comparison of maximum displacement calculated by STHDAP for members SP01 through SP10.
Buildings 15 00971 g005
Figure 6. Comparison of the damage time history evaluations calculated by the STHDAP for members SP01 through SP10.
Buildings 15 00971 g006
Table 1. Conditions and uniform expression of hysteretic restoring force model under loading conditions.
Loading ConditionLoading Condition Description of ( Q δ )Condition Determine Value CDUniform Expression of ( Q δ )
Elastic loadingThe system is in an elastic loading condition. The slope is k 1 . When the condition point ( Q δ ) moves along this type of straight line, the condition determine value is 0.CD = 0 F = K ¯ x + P ¯
K ¯ = k 1   C D = 0 k 2   C D = ± 1
P ¯ = k 2 k 1 x 0   C D = 0 k 1 k 2 x y C D C D = ± 1
Plastic loadingPositive loadingThe system is in an elastoplastic positive loading condition. The slope of the straight line formed by joining the upper critical points is k 2 . When the condition point ( Q δ ) moves on this type of straight line, the condition determine value is 1.CD = 1
Plastic loadingNegative loadingThe system is in an elastoplastic negative loading condition. The slope of the straight line formed by joining the lower critical points is k 2 . When the condition point ( Q δ ) moves on this type of straight line, the condition determine value is −1.CD = −1
Notes: K ¯ is the uniform stiffness; P ¯ is the uniform load; C D is the condition determine value; and x 0 is the abscissa of the x axis at the midpoint of the curve. Each uniquely determined curve is determined by a unique x 0 description, and the upper and lower critical points of the curve are determined accordingly. When it changes from condition 1 or −1 to 0, x 0 is modified according to the current, and x 0 = x C D · x y ; k 1 is the first-order stiffness slope in the restoring force model, using quasi-static tests and data processing values; k 2 is the second-order stiffness slope in the restoring force model, using quasi-static tests and data processing values.
Table 2. Conditions and uniform expression of hysteretic restoring force model under motion condition at the inflection point.
Motion Condition at the Inflection PointDescription of Motion Condition at the Inflection PointAbscissa of Inflection Point x c Uniform Expression of Inflection Point x c
Elastic

plastic interval
Positive directionThe acceleration x ¨ within t is linearly varied (Wil-son-θ method), and it is assumed that x and x ˙ are linearly varied, and the linear interpolation propor-tion factor: S F = h t = x c x 0 x 1 x 0 . x c = x 0 + x y
( C D = 1 )
x c = x 0 + C D · x y
x ˙ c = x ˙ 0 + S F · x ˙ 1 x ˙ 0
x ¨ c = x ¨ 0 + S F · x ¨ 1 x ¨ 0
Negative directionThe condition determine value of the condition is: CD = −1. x c = x 0 x y
( C D = 1 )
Plastic

unloading interval
Positive directionWhen the direction of motion changes, the x ˙ value is very small, the displacement occurring within is small, and the condition point only moves slightly, so interpolation is not required.
Negative directionSame analysis as above.
Note: The S F ( S a c l e F a c t o r ) is defined as the linear interpolation scale factor; Q y is the yield strength of the member; β is the dissipated energy parameter; h is the time of approximate point spacing; t is the unit interval; x y is the initial yield deformation of the member; x d is the ultimate deformation; x 0 is the coordinate value of the initial point of the inflection point analysis; x 1 is the coordinate value of the end point of the inflection point analysis; x c is the coordinate value of inflection point C analyzed.
Table 3. Program parameters of quasi-static test members SP01~SP10.
Member No.SP01SP02SP03SP04SP05SP06SP07SP08SP09SP10
f c u , k ( M P a ) 67.167.175.970.757.357.357.357.357.357.3
λ 1.901.901.901.901.901.901.901.901.502.40
n 0.200.200.200.200.200.350.500.350.200.20
ρ l ( % ) 1.613.931.611.613.353.353.353.353.353.35
ρ w ( % ) 0.270.270.270.270.450.450.450.670.450.45
x y i e l d ( m m ) 3.112.822.852.545.895.305.315.897.276.71
x u ( m m ) 8.397.098.267.0613.259.469.8810.5210.0213.26
Q y i e l d ( k N ) 254.8266.5301.6282.7165.6191.1188.6230.1253.7240.5
β 0.0430.0490.0390.0700.0750.0900.0840.0490.0460.084
k 1 ( k N / m m ) 81.2393.91105.195.8328.1136.0435.5834.2939.2814.97
k 2 ( k N / m m ) 56.9175.7188.9696.1627.1725.0532.6929.0130.1520.63
Note: f c u , k is the average compressive strength of concrete; λ is the shear span ratio; n is the experimental axial compression ratio; ρ l is the longitudinal reinforcement ratio; ρ w is the volumetric stirrup ratio; x y i e l d is the yield displacement of the test member; x u is the ultimate displacement; Q y i e l d is the yield load; β is the energy dissipation parameter; k 1 is the first-order stiffness; k 2 is the second-order stiffness; k 1 and k 2 are obtained by processing the test data.
Table 4. Time history calculated by STHDAP for members SP01~SP10 (unit: s).
Member No.SP01SP02SP03SP04SP05SP06SP07SP08SP09SP10
EL Centro30.003.3430.0030.0030.0030.0030.0030.0030.0030.00
Tri-treasure11.7411.6413.6613.9812.1211.9411.9612.0111.9611.98
Tianjin NS7.787.757.787.767.997.897.917.937.928.02
Table 5. Maximum displacement calculated by STHDAP for members SP01~SP10 (unit: mm).
Member No.SP01SP02SP03SP04SP05SP06SP07SP08SP09SP10
Test   value   δ m a x 7.667.076.966.9812.809.409.3810.399.9413.16
EL Centro7.806.916.096.3412.5510.689.3810.096.629.74
Tri-treasure8.647.078.256.8414.668.8310.9311.1711.3712.47
Tianjin NS8.537.098.266.9814.458.75710.7611.0111.7912.57
Table 6. Damage time history evaluation calculated by STHDAP for members SP01~SP10 (unit: s).
Member
No.
Damage
Evaluation Criteria
0~0.20
(Intact and
Slight)
0.20~0.40
(Mild)
0.40~0.60
(Moderate)
0.60~0.80
(Severe)
0.80~1.00
(Collapsed)
SP01EL Centro1.902.283.343.4030.00
Tri-treasure10.6210.7811.2411.6811.74
Tianjin NS7.227.337.737.757.78
SP02EL Centro1.882.002.302.863.34
Tri-treasure10.6011.0611.1211.6011.64
Tianjin NS7.217.337.717.737.75
SP03EL Centro1.902.243.2430.0030.00
Tri-treasure10.6811.0611.1811.6413.66
Tianjin NS7.257.387.717.747.78
SP04EL Centro1.882.002.702.7630.00
Tri-treasure10.6211.0411.1211.6013.98
Tianjin NS7.227.337.697.737.76
SP05EL Centro1.525.3630.0030.0030.00
Tri-treasure10.7411.2611.3412.0612.12
Tianjin NS7.267.367.467.937.99
SP06EL Centro1.482.0230.0030.0030.00
Tri-treasure9.3611.2211.3011.4211.94
Tianjin NS7.227.327.397.867.89
SP07EL Centro1.482.0230.0030.0030.00
Tri-treasure10.8011.2411.3211.9011.96
Tianjin NS7.237.337.417.877.91
SP08EL Centro1.502.0630.0030.0030.00
Tri-treasure10.8011.3211.3411.9012.01
Tianjin NS7.247.347.427.877.93
SP09EL Centro1.582.0230.0030.0030.00
Tri-treasure11.8611.2411.3411.9011.93
Tianjin NS7.247.347.437.867.92
SP10EL Centro1.646.0230.0030.0030.00
Tri-treasure10.8811.3011.8811.9411.98
Tianjin NS7.267.387.867.898.02
Notes: The earthquake ground motions for EL Centro (total time history 30.0 s, dt = 0.02 s), Tri-treasure (total time history 40.02 s, dt = 0.02 s), and Tianjin NS (total time history 19.19 s, dt = 0.01 s) are input.
Disclaimer/Publisher’s Note: The statements, opinions and data contained in all publications are solely those of the individual author(s) and contributor(s) and not of MDPI and/or the editor(s). MDPI and/or the editor(s) disclaim responsibility for any injury to people or property resulting from any ideas, methods, instructions or products referred to in the content.

