Article

Prediction of Flexural Ultimate Capacity for Reinforced UHPC Beams Using Ensemble Learning and SHAP Method

1
School of Civil Engineering, Hunan University of Technology, Zhuzhou 412007, China
2
Research Institute of Hunan University in Chongqing, Chongqing 401135, China
3
National Key Laboratory of Bridge Safety and Resilience, College of Civil Engineering, Hunan University, Changsha 410082, China
*
Author to whom correspondence should be addressed.
Buildings 2025, 15(6), 969; https://doi.org/10.3390/buildings15060969
Submission received: 20 February 2025 / Revised: 14 March 2025 / Accepted: 17 March 2025 / Published: 19 March 2025
(This article belongs to the Special Issue Research on Structural Analysis and Design of Civil Structures)

Abstract

In this study, ensemble learning (EL) models are designed to enhance the accuracy and efficiency in predicting the flexural ultimate capacity of reinforced ultra-high-performance concrete (UHPC) beams with the aim of providing a more reliable and efficient design experience for structural applications. For model training and testing, a comprehensive database is initially established for the flexural ultimate capacity of reinforced UHPC beams, comprising 339 UHPC-based specimens with varying design parameters compiled from 56 published experimental investigations. Furthermore, multiple machine learning (ML) algorithms, including both traditional and EL models, are employed to develop optimized predictive models for the flexural ultimate capacity of reinforced UHPC specimens derived from the established database. Four statistical indicators of model performance are utilized to assess the accuracies of the prediction results with ML models used. Subsequently, a highly efficient evaluation of ML models is taken by analyzing the sensitivity of ML models to varying data subsets. Finally, a Shapley additive explanations (SHAP) method is employed to interpret several EL models, thereby substantiating their reliability and determining the extent of influence exerted by each feature on the prediction results. The present ML models predict accurately the flexural ultimate capacity Mu of reinforced UHPC beams after optimization, with EL models providing a higher level of accuracy than the traditional ML models. The present study also underscores the significant impact of the database division ratios of training-to-testing sets on the effectiveness of performance prediction for the ML models. The optimal model functionality may be accomplished by properly considering the effects of database subset distribution on the performance prediction and model stability. The CatBoost model demonstrates superior performance in terms of predictive accuracy, as evidenced by its highest R2 value and lowest RMSE, MAE, and MAPE values. This substantial improvement in performance prediction of the flexural capacity for reinforced UHPC beams is notable when compared to existing empirical methods. The CatBoost model displays a more uniform distribution of SHAP values for all parameters, suggesting a balanced decision-making process and contributing to its superior and stable model performance. The current study identifies a significant positive relationship between the increases in height and reinforcement ratio of steel rebars and the growth in normalized SHAP values. These findings contribute to a deeper understanding of the role played by each feature in the prediction of the flexural ultimate capacity of reinforced UHPC beams, thereby providing a foundation for more accurate model optimization and a more refined feature section strategy.

1. Introduction

Ultra-high-performance concrete (UHPC) emerged as a significant and innovative construction material in the mid-1990s [1,2]. Ever-increasing research on UHPC has led to its widespread application globally, particularly in the construction of bridges, infrastructures, and other critical structures [3,4,5]. Compared with conventional concrete, UHPC exhibits ultra-high compressive strength (commonly >120 MPa) and post-cracking strength (typically >5 MPa) and remarkable durability. These outstanding properties are primarily attributed to a low water-to-binder ratio (usually <0.2), a high fineness of supplementary cementitious materials, a discontinuous pore structure, and a high volume fraction of high-strength steel fibers [6,7,8]. Numerous studies have shown that it is crucial to understand the mechanical responses of UHPC under different loading conditions for further investigation into its structural performance [9], especially for UHPC with superior bending and tensile properties [10,11]. A comprehensive literature review reveals that extensive research has been conducted on the flexural behaviors of reinforced UHPC beams. This research has investigated a multitude of variables, including specimen size [12,13], compressive strength of UHPC [14,15,16], reinforcement ratios of steel rebars [6,12,17,18,19], and the shapes and volume fractions of steel fibers [6,15,16,20]. The findings of these studies have considerably advanced both the design optimization and structural application of UHPC beams [6,12,15,16,17,18,19,20,21].
However, existing research regarding the flexural performance of reinforced UHPC elements is frequently based on a limited number of specimens considering a narrow range of parameter variables. Consequently, it is time-consuming and labor-intensive, and the conclusions obtained may be overestimated or insufficient to comprehensively describe the exact influence of these parameters. Furthermore, design codes and structural standards for UHPC beams remain relatively limited [22,23], despite some analytical methods and finite element models having been presented on the basis of some simplification assumptions with certain limitations. Therefore, additional experimental and analytical investigations are required to develop an efficient and energy-saving method to predict the flexural properties of UHPC-based structural elements [13,24,25,26].
In recent years, machine learning (ML) has emerged as a powerful and versatile tool with a wide range of applications within the field of civil engineering, particularly in the context of predicting the performance of advanced building materials such as UHPC. The application of ML provides an effective and robust platform for predicting the structural response of UHPC-based elements, thereby significantly reducing the time and effort required for experimentation and modeling [27]. Numerous studies have demonstrated that ML methods have been employed to predict basic properties of UHPC such as compressive strength, flexural strength, workability, and shrinkage performance, as well as to forecast the interface bonding strength and thus develop interpretable models that optimize UHPC mix designs [28,29,30,31]. Moreover, ML techniques have been utilized to determine the structural performance of reinforced concrete or UHPC beams [30,31,32,33]. For instance, a gradient boosting regression tree (GBRT) was used by Fu and Feng [29] to forecast the residual shear strength of corroded reinforced concrete beams at different service periods. Feng et al. [32] found that the ensemble ML models outperformed traditional mechanics-based models in terms of improved prediction accuracy and reduced bias. Similarly, a variety of ML algorithms, including support vector machines (SVMs), artificial neural networks (ANN), and ensemble learning (EL) methods, have also been used to identify failure modes and predict the shear capacity of UHPC beams under combined bending and shear forces, achieving a high prediction accuracy [31,32,33].
Despite the application of ML methods in the prediction of the shear performance of UHPC beams, there is a growing interest in employing ML technologies to accurately and efficiently predict the flexural behavior of reinforced UHPC beams. However, this remains an emerging area of research, with few published studies exploring its application. Solhmirzaei et al. [33] used support vector regression (SVR) and genetic programming to predict the flexural capacity of UHPC beams with varying cross-sectional dimensions and material properties. Ergen and Katlav [34] explored the potential of deep learning (DL) models for predicting the flexural capacity of UHPC beams with and without steel fibers. Nevertheless, the effectiveness of ML models is largely contingent upon the quality of the database employed, which is frequently challenged by the selection of input variables. It is, therefore, important to expand and optimize the database of reinforced UHPC beam specimens. The employment of excessive input parameters is impractical for real-world design applications, while the inclusion of interrelated input parameters unnecessarily inflates the input features without adding a unique or distinct value to the ML model. Further, the versatility of ML algorithms has been shown to result in notable discrepancies in both the accuracy and efficiency of the performance predictions of reinforced UHPC specimens [24,28,30,31,35]. A comprehensive assessment and comparison of the accuracy and efficiency of various ML models for predicting the flexural ultimate capacity of reinforced UHPC beams is a crucial gap in the current research. Moreover, in the context of machine learning, the division of the original database into training and testing sets represents a fundamental stage in the data processing. The extent to which the training set is divided affects the performance of the ML model in terms of both the accuracy of training and its capacity to generalize to new data. The optimal division ratio of training set to testing set depends on the subset size and characteristics of the database. It is necessary to analyze the model performance on varying subsets of data to ensure an efficient evaluation of both the model and the data quality. In addition to statistical evaluations of ML techniques, an adequate discussion is required regarding the physical and structural principles governing reinforced UHPC beams. For practical engineering applications, the comparison of EL models with physical principles alongside statistical model evaluations is essential. Previous research has shown that the categorical gradient boosting (CatBoost) model has excellent predictive stability and generalization ability [36]. To evaluate the accuracy and reliability of EL methods, the CatBoost method is exemplified and compared with existing empirical methods and design standards [25,26,37,38,39]. Additionally, it could be reasonably argued that the differences between various ML algorithms can significantly affect the reliability of parameter analysis in model interpretation. Therefore, it would appear prudent to undertake further research into a comparison of different ML models. SHAP (Shapley additive explanations) offers a promising method to clarify the contributions of features to predictions and has been widely used for model interpretation [22,30,36,40]. It can be argued that the discrepancies among various ML algorithms may have a substantial impact on the reliability of parameter analysis in model interpretation. In the context of predicting the flexural ultimate capacity of reinforced UHPC beams, the application of SHAP analysis to different ML models is still an unexplored research gap. Consequently, it is advisable to undertake further research to compare different ML models. An in-depth analysis using the SHAP method should be carried out by taking account into the impact of key design parameters on performance prediction to provide valuable insights for structural design purposes. Therefore, the prediction of flexural ultimate capacity for reinforced UHPC beams using ensemble learning and SHAP methods is promising.
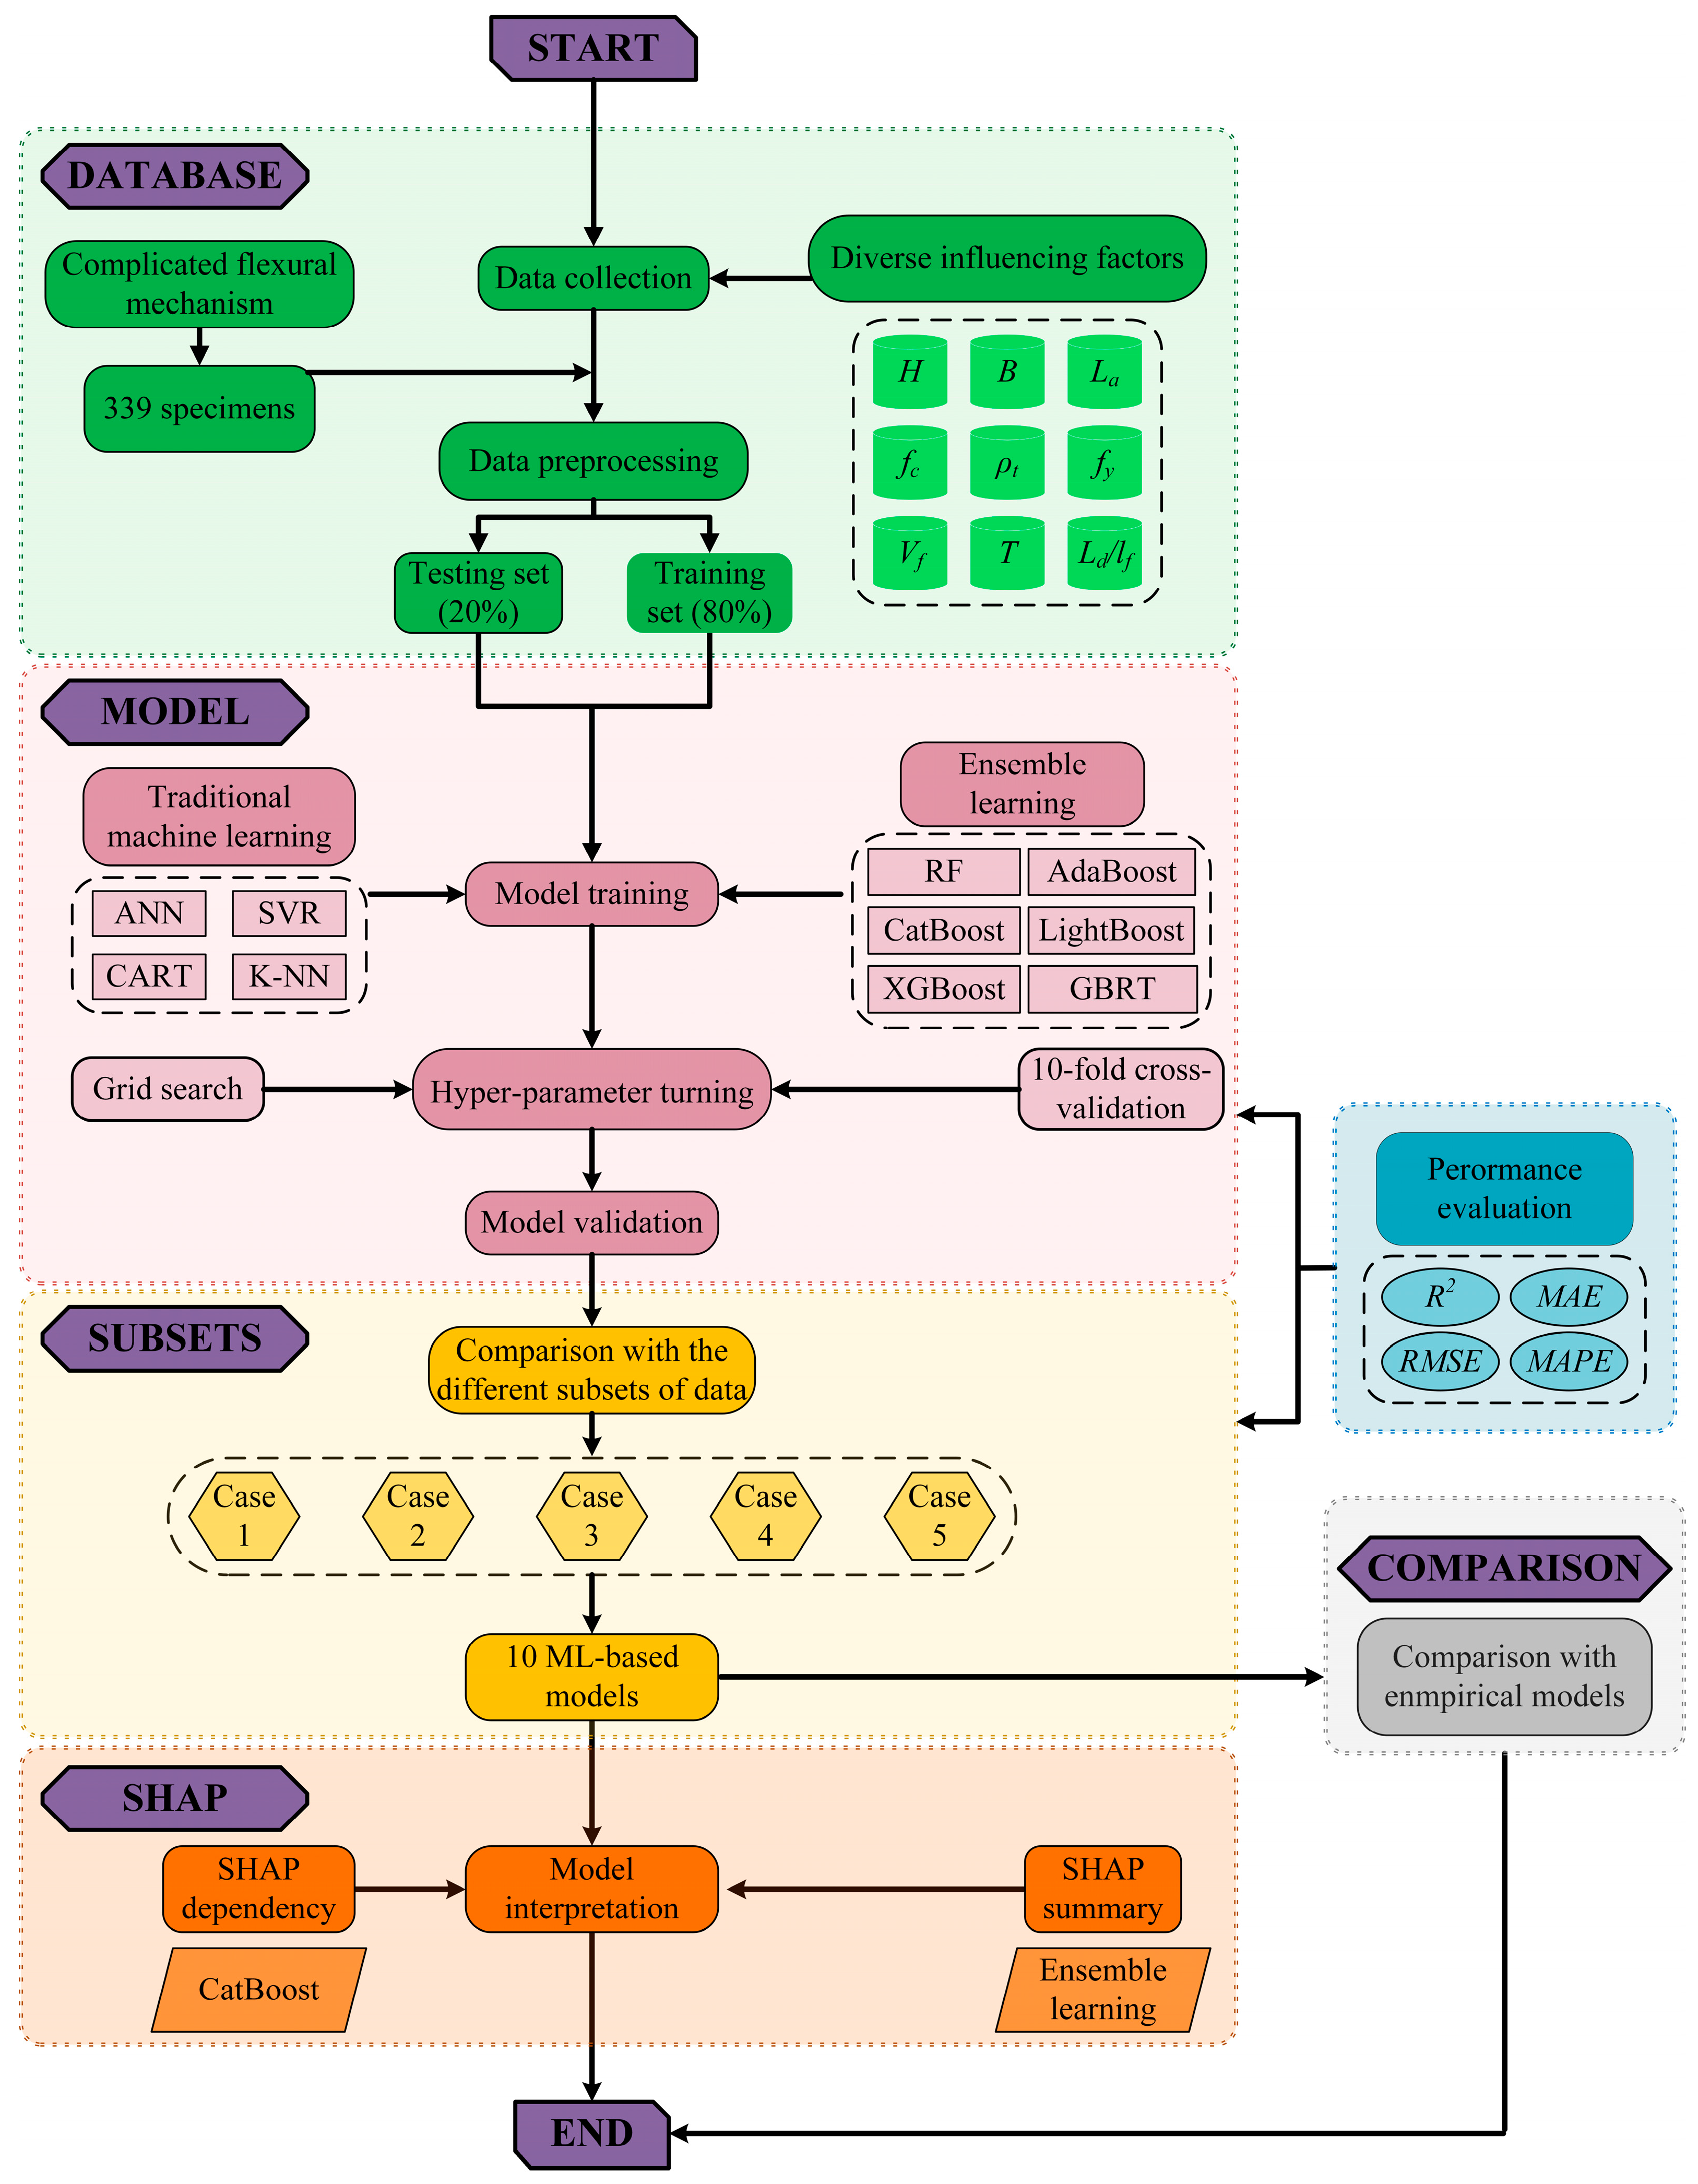
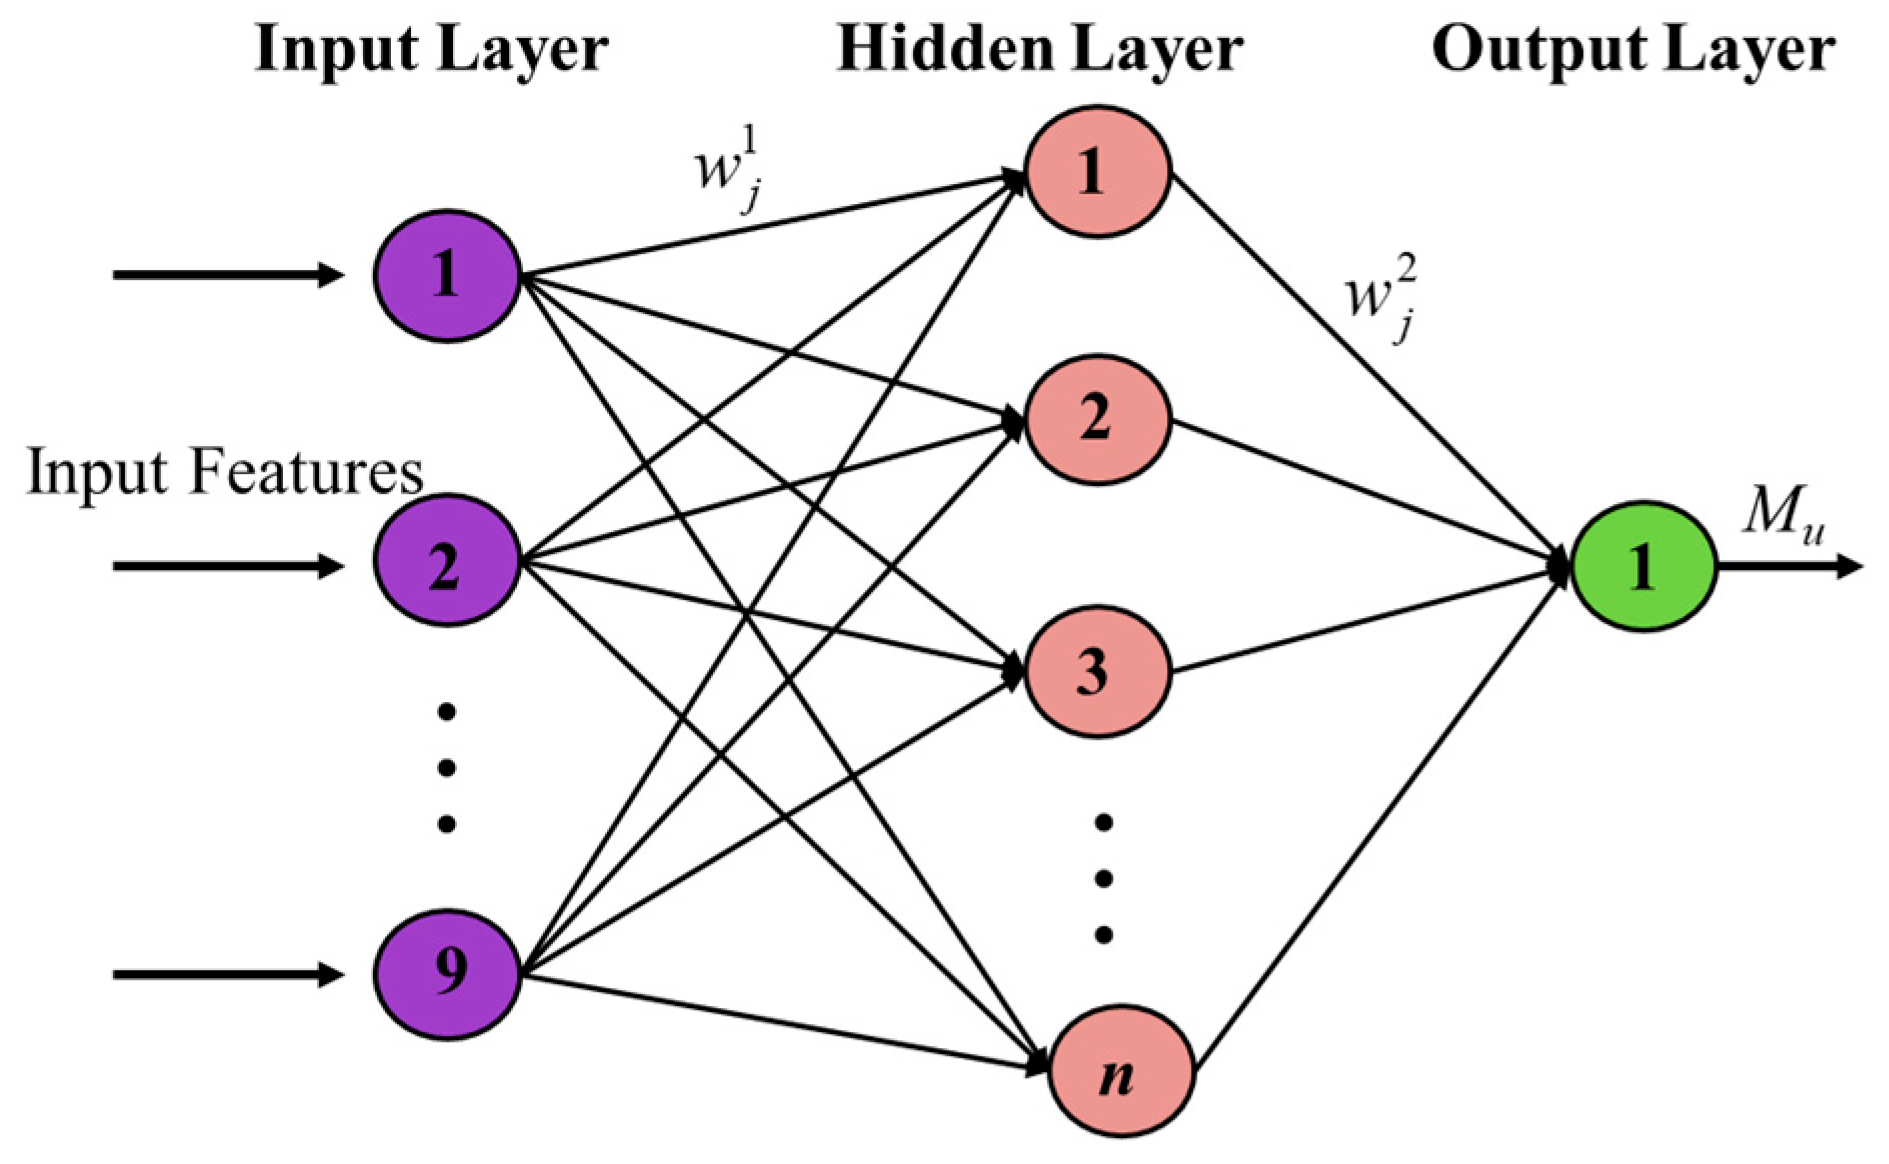
The objective of this study is to address the aforementioned limitations by expanding the available database and optimizing ML algorithms, thereby achieving greater accuracy and efficiency in predicting the flexural performance of reinforced UHPC beams and providing more reliable and efficient design recommendations for future applications. To be more specific, a comprehensive database containing data from 339 tests of reinforced UHPC beams with various design parameters is initially established. To balance model accuracy and practical implementation, a reliable and efficient approach involving nine input parameters is considered in this study. Furthermore, several ML algorithms are presented to develop optimized models for precisely predicting the flexural ultimate capacity (Mu) of reinforced UHPC specimens derived from the established database. Traditional models, including ANN, SVR, and k-nearest neighbors (K-NN), are first applied to make predictions. Additionally, ensemble learning models, such as classification and regression trees (CART), random forest (RF), adaptive boosting (AdaBoost), and gradient boosting regression trees (GBRT), are utilized for further optimization. To enhance prediction accuracy, advanced models like light gradient boosting machine (LightGBM), CatBoost, and extreme gradient boosting (XGBoost) are also employed. The performance of the ML models used is then evaluated using four statistical indicators to comprehensively assess and compare their prediction accuracies and capabilities for the flexural ultimate capacity of reinforced UHPC specimens. Subsequently, the sensitivity of ML models to varying data subsets is analyzed to ensure a highly efficient evaluation of the ML models used and the established database. Moreover, the CatBoost model is exemplified to compare the predictions with several existing empirical formulas alongside statistical evaluations for practical engineering applications. Finally, the SHAP method is employed to interpret multiple EL models, thereby substantiating their reliability and determining the extent of influence exerted by each feature on the prediction results of the flexural capacity of reinforced UHPC beams.

2. Acquisition of the Database

The establishment of a database represents a fundamental stage in the initial process of machine learning, which involves the collection, organization, and cleansing of data for model training. In the present study, by conducting a comprehensive review of the published literature, an ultimate capacity database of reinforced UHPC specimens under bending loads is developed and summarized by integrating test results from diverse experimental studies (see Table A1). The database comprises the results of measurements of 339 UHPC-related specimens with varying design parameters sourced from 56 different experimental investigations [12,13,18,19,20,21,41,42,43,44,45,46]. As previously mentioned, flexural behaviors of reinforced UHPC beams are highly dependent on the specimen geometry, the material properties of UHPC, the shape and volume fraction of steel fibers, and the amount and strength of steel rebars. In the database shown in Table A1, the height (H) and width (B) of a given cross-section and the length of the shear span (La) are considered to represent the geometrical size of the specimen. Additionally, the cylinder compressive strength of UHPC material (fc) and mechanic characteristics of blended fibers including the shape, length (Lf), diameter (df), and volume fraction (Vf) are included. Furthermore, the yielding strength (fy) and reinforcement ratio (ρt) of steel rebars are also presented. Thus a total of nine performance-sensitive parameters are incorporated as input variables into the established database, while the ultimate capacity of bending moment (Mu) is selected as the output variable. Table 1 provides detailed information on the statistical characteristic values of the parameters involved.
The presence of longitudinal tensile reinforcement in plain concrete beams has been proven to enhance the load-carrying capacity and stiffness of the structure. Accordingly, more than 95 percent of the flexural specimens in the database are equipped with longitudinal tensile reinforcement. Furthermore, the incorporation of steel fibers into the UHPC matrix also improves its tensile strength and toughness. Consequently, 94.6% of the UHPC specimens selected in the database are blended with steel fibers, and the effects of various fiber characteristic parameters on their structural performance are explored. The inclusion of versatile steel fibers is particularly advantageous for enhancing the flexural capacity of UHPC structures. Specifically, the distribution percent of steel fiber shape of UHPC specimens included in the database is as follows: 79.5% straight fibers, 2.5% hooked-end fibers, 2.8% corrugated fibers, and 9.7% hybrid fibers. It should be noted that “T” represents steel fibers with different shapes. T is encoded as numbers to make it easier for models to process the data. Using numbers instead of words helps with calculations and analysis. Each number represents a different shape of fiber: 1 denotes straight fibers, 2 denotes corrugated fibers, 3 denotes hooked-end fibers, 4 denotes hybrid fibers, and 0 denotes specimens without steel fibers. In addition, 5.4% of the specimens in the database lack steel fibers, thus providing a basis for comparison in regard to the sensitivity of steel fibers. Overall, the database comprises a substantial number of experimental parameters, which may enhance the adaptability of machine learning models for training and evaluation.
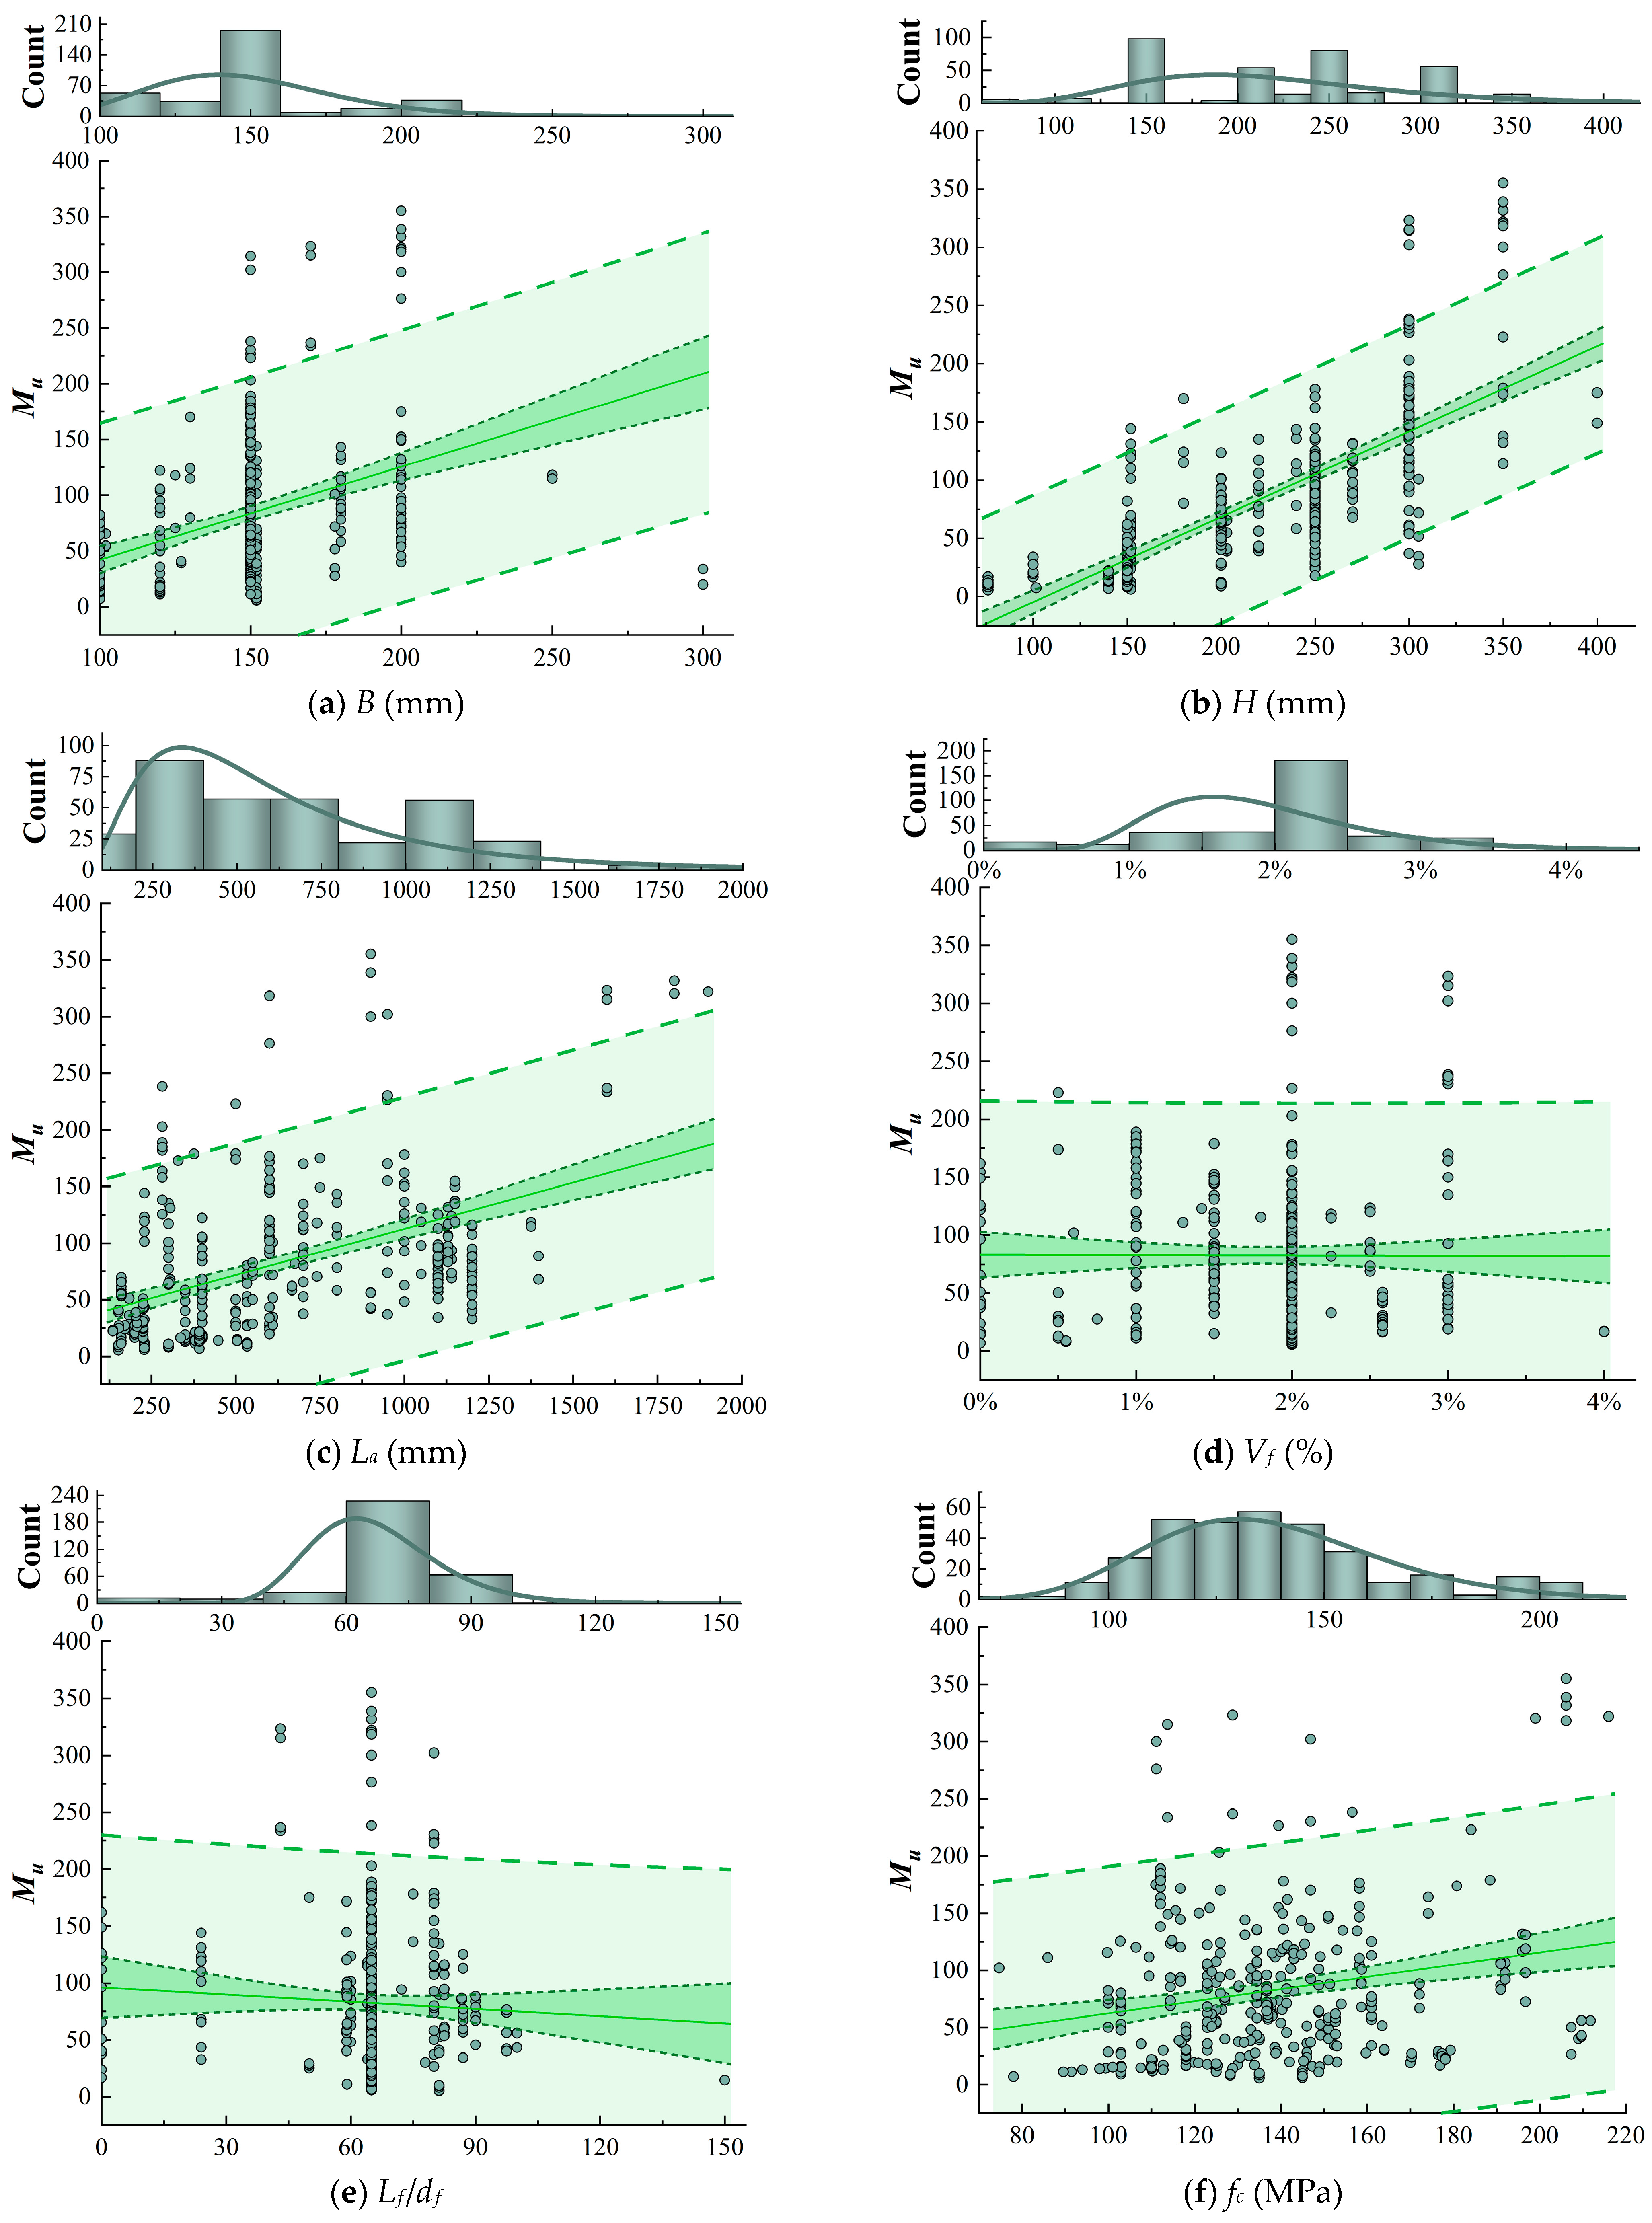
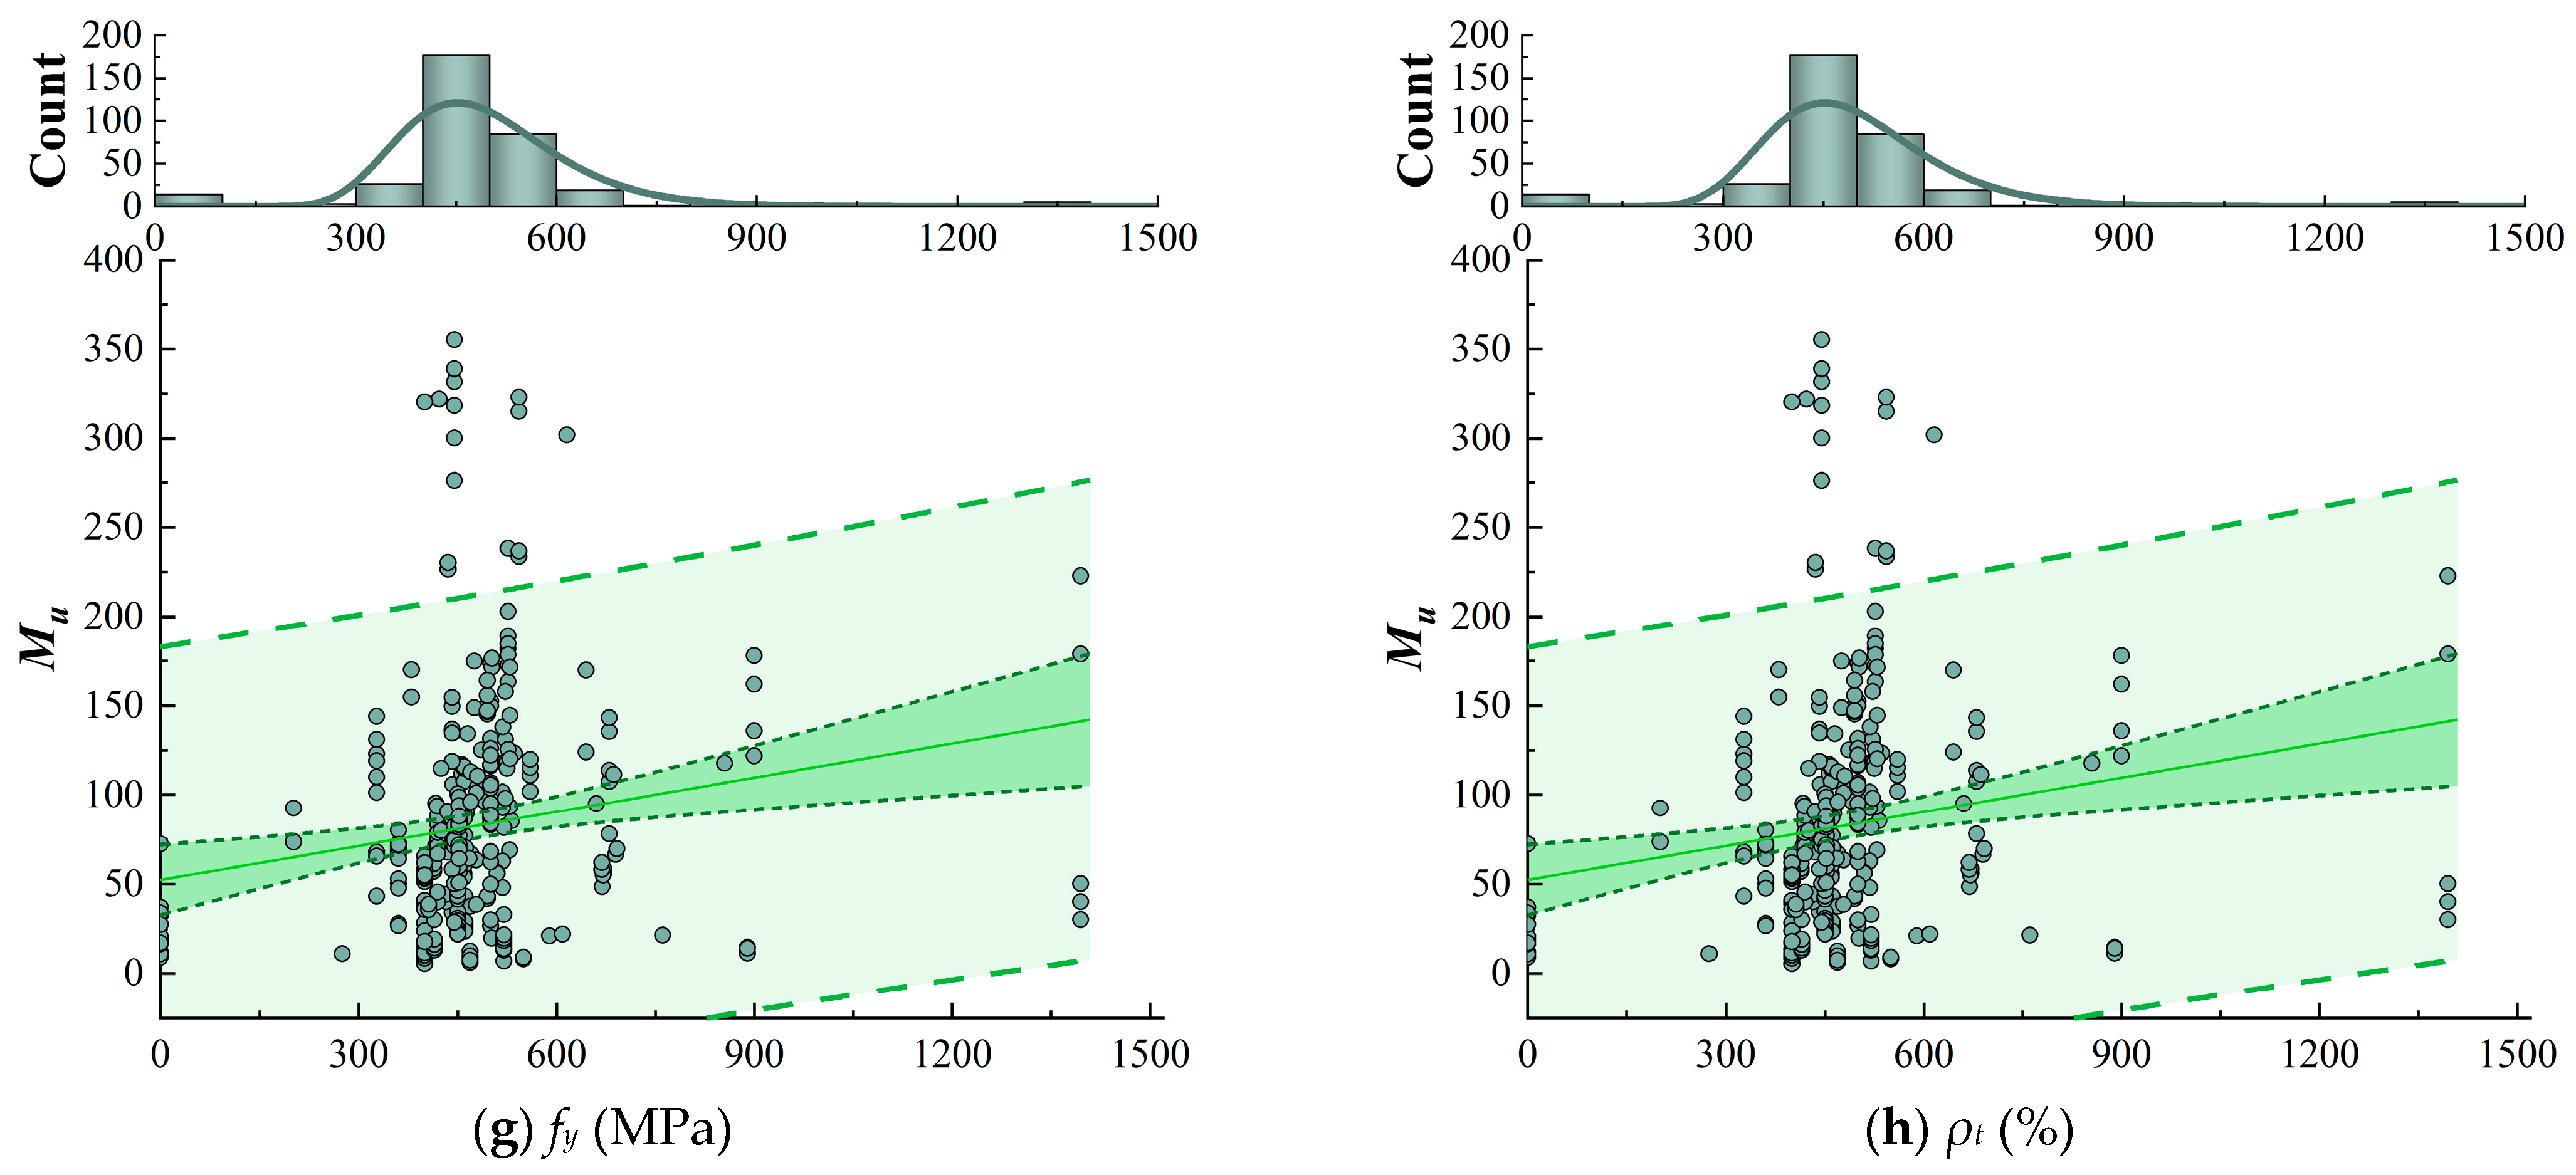
Figure 1 illustrates the frequency histograms of individual parameters, as well as the dependence between different input variables and the target output variable of the ultimate bending moment Mu. Note that the dark green shadings in the Figure 1 represent the data ranges with 95% confidence intervals, while the lighter green areas signify the data ranges with 95% prediction accuracies. It is evident that the estimation of the flexural capacity Mu for UHPC specimens is a highly intricate and challenging process. As shown in Figure 1, an increase in the value of the flexural capacity Mu is observed with growing values of H, B, La, fc, fy, and ρt. This trend is consistent with the fundamental principles of structural design and material properties. The regression curves for the parameters H and B in Figure 1 display larger slopes, indicating that these parameters exert a more pronounced influence on the flexural load-carrying capacity Mu. In contrast, the linear slopes of the regression curves for the volume fraction Vf and aspect ratio Lf/df of steel fibers are close to zero, making it challenging to assess their impact on Mu. The relatively similar shapes of steel fibers employed in the bending tests may be responsible for the phenomenon, and additional research is required to confirm this hypothesis.
The application of simple linear regression is inadequate for clarifying the inherently complex relationship between the ultimate bending moment Mu and an individual input variable. As a result, finite element analysis methods and nonlinear numerical modeling have emerged as significant developments in prediction tools for structural evaluation, providing optimization solutions to an ever-increasing number of complicated structures. The purpose of this study is to estimate the flexural load-carrying capacity Mu of reinforced UHPC specimens in the aforementioned database using several ML-based algorithms, including both traditional ML models and EL models. These methods are capable of accommodating a range of complexities, which are user-friendly to employ, and thus facilitate highly nonlinear modeling. This methodology of ML will enable the design of UHPC-based structures with reduced environmental impact and enhanced sustainability, as well as an improved accuracy and efficiency of performance prediction.

3. Machine Learning Model

3.1. General Framework

The general framework of this study is illustrated in Figure 2. Given the time-consuming and labor-intensive experimental effort of constructing UHPC beams with a great multitude of specimens designed with versatile influencing factors, machine learning models can be employed to predict the ultimate moment capacity with efficiency and accuracy. The main technical procedures undertaken in the course of this study are presented as follows:
  • First, the experimental results from studies on multiple reinforced UHPC beams are compiled into the database, the parameters of which are then utilized as input values for the subsequent stage. The database is then divided into two distinct sets for training and testing.
  • Second, 10 ML models, composed of traditional ML methods and ensemble learning models, are constructed for the analysis of the established database.
  • Third, the hyperparameters of the 10 ML models are computed and self-adjusted to enhance their prediction accuracy.
  • Fourth, the prediction accuracy and efficiency of the 10 ML models are evaluated individually and comparatively.
  • Fifth, the stability of the various ML models is investigated by dividing the database into subsets of different sizes for training and testing.
  • Further, a comparison analysis is conducted between the calculated values from several existing empirical formulas and the predicted values of the CatBoost model.
  • Lastly, a Shapley additive explanations (SHAP) analysis is employed to interpret the ML models. This allows for the identification of the dependency of each parameter on the ML model and the interactions between parameters.

3.2. Traditional Machine Learning Models

The prevailing approach to machine learning is to seek an optimal classifier to achieve maximal data separation. This methodology has the advantage of low computational complexity and broad applicability. However, there are also notable limitations. For example, it is reliant on domain-specific knowledge for feature extraction and is unable to autonomously learn higher-order features, which presents challenges with complex database structures. These limitations highlight the need for innovative approaches. The traditional ML models covered in the present investigation are outlined below.

3.2.1. Artificial Neural Network (ANN)

An artificial neural network is a computational model that emulates the structure of the human brain through the interconnection of artificial neurons. It is composed of three principal layers: an input layer, which receives data and passes it to other layers; a set of hidden layers, which processes the data; and an output layer, which produces the output of the network. This interconnected network allows complex processing, facilitating learning through the adjustment of connection weights, thereby optimizing performance [34,36,47].
The input layer is responsible for processing external data, while the hidden layers are tasked with the extraction of features through the application of non-linear transformations. The output layer generates the final predictions. The behavior of a neuron is defined by the weights (w), which are multiplied by the input data (x) to yield the weighted sum with bias (b). This weighted sum is determined by an activation function and is adjusted incrementally to yield the desired outputs for the hidden layer. For reference, the subscripts i and j denote the ith layer of the network, and jth unit in a layer, respectively. Therefore, the output for a neuron in the hidden layer is represented as follows:
h i = f j = 1 n w j i x j + b i
where h, f, w, x, and b are the output, activation function, weight, input feature, and bias, respectively. Note that the input features (x1, x2, x4, …, x9) in this paper are the aforementioned nine parameters potentially affecting the bending capacity of reinforced UHPC beams, and the target output is the ultimate bending moment of reinforced UHPC beams, Mu. The architecture of the neural network is shown graphically in Figure 3.

3.2.2. Support Vector Regression (SVR)

The support vector machine (SVM), known for its accuracy and simplicity, is a widely used algorithm that was first introduced for classification tasks by Boser [48]. SVM performs data classification by the identification of an optimal decision boundary. Support vector regression (SVR) is an extension of the primary principles of SVM to regression problems. As shown in Figure 4, SVR uses a linear regression model to seek a hyperplane that best fits the data within a decision boundary. The optimal hyperplane maximizes the number of data points within a certain margin of tolerance (ε). A prediction h(x) within ε of actual value y incurs no penalty, which promotes robustness and generalizes to unseen data [33,36,47]. The objective of the final optimization is
min w , b , ξ i ξ i * , 1 2 w 2 + C i = 1 m ξ i + ξ i *
s . t . ε + ξ i y i ( w x i + b ) ε + ξ i y i + ( w x i + b ) ξ i , ξ i 0
where w is the weight defining the separation boundary, b is the bias, and ξ is the relaxation variable; the parameter C controls the balance between maximizing the margin and minimizing classification errors. A larger C enforces stricter avoidance of misclassification, which may lead to overfitting, while a smaller C allows for more errors, potentially increasing generalization. By default, C is set to 1.0. The slack variables ξi and ξi* represent the distances from the predicted values to the upper and lower margin boundaries, respectively.

3.2.3. k-Nearest Neighbor (K-NN)

k-nearest neighbor, introduced by Fix and Hodges in 1951 [49], is a fundamental supervised learning algorithm that is used in both classification and regression tasks. K-NN is non-parametric, which means that it does not assume a specific distribution of the data and postpones learning until testing and is, therefore, often referred to as a ‘lazy’ algorithm. K-NN predicts the class or value of a data point based on the proximity of its neighboring points, typically using the Euclidean distance as the metric [36,47]. Given two points A (x1, x2, x3, …, xn) and B (y1, y2, y3, …, yn), the Euclidean distance between them is determined as follows:
d A , B = i = 1 n x i y i 2
where d (A, B) is the distance between two points; n is the number of dimensions; xi and yi are the coordinates of points A and B in the ith dimension, respectively. It is a description of the method for the computation of Euclidean distance in a multi-dimensional space. Alternative distance metrics, such as the Manhattan distance and Minkowski distance, are also applicable.
In K-NN regression, the algorithm averages the values of the nearest neighbors to produce predictions. This involves the identification of the nearest neighbors for the given sample and then the calculation of the average of their labels to determine the prediction value, as shown in Figure 5. Consider a sample Xq that is expected to predict, and Nq represents the k-nearest neighbors of Xq:
Y ^ q = 1 K i N q y i
where Y ^ q is the prediction value for the sample Xq, and yi denotes the label of the ith neighbor.

3.2.4. Classification and Regression Trees (CART)

A decision tree (DT), introduced in the 1960s, is a widely used decision-making model structured like a tree with nodes representing decision points and leaf nodes representing outcomes. As an important variant, the classification and regression tree (CART) extends the DT approach [36,47,50].
DTs work by recursively dividing the data into increasingly homogeneous subsets, and this process continues until a stopping criterion is met. In the CART algorithm, features and thresholds are selected at each node to maximize the purity or minimize the impurity, as shown in Figure 6. For regression tasks, the mean squared error (MSE) is commonly employed to measure the difference between predicted and actual values, which is defined by
M S E = 1 n i = 1 n y i y ^ i 2
where MSE signifies the mean squared error across all observations, yi is the true value, y ^ i is the predicted value, and n is the sample size. The metric of the CART algorithm is critical in evaluating the accuracy of the regression model to ensure that the decision tree not only captures the essence of the data but also makes accurate predictions.

3.3. Ensemble Learning (EL)

Ensemble learning is the combination of multiple weak learners to build a powerful predictor and is commonly used in classification, regression, and anomaly detection tasks. The two prevalent technologies of ensemble learning are bagging and boosting [51], as shown in Figure 7. Bagging (bootstrap aggregating) works in parallel, where each learner is trained independently on the bootstrap samples. The final predictions are made by aggregating all of the learners, which reduces the variance and prevents overfitting through voting or averaging [32,36,47].
Boosting, on the other hand, is sequential, where each learner is a corrector of previous errors. Learners are interdependent, and the final predictions are weighted on the basis of accuracy. Boosting reduces both bias and variance, thereby improving the performance of the EL model [52].

3.3.1. Random Forest (RF)

Random forest (RF) employs the bagging technique to construct multiple decision trees in parallel, each of which is trained on a randomly selected subset of the data and features. This randomization ensures the diversity among the trees, which enhances the robustness of the model [53].
When making predictions, RF aggregates the outputs from all trees, as shown in Figure 8. For regression tasks, this is realized by averaging the predictions, which results in more accurate and stable estimates. The random sampling of data and features helps prevent overfitting and increases generalizability. This provides a balance between variance and bias for more reliable predictions. An RF model can be written as:
R ^ x = 1 B b = 1 B T b x
where Tb(x) is a basic learner, and B is the number of basic learners.

3.3.2. Adaptive Boosting (AdaBoost)

Adaptive boosting (AdaBoost) is an important boosting algorithm known for its application of the exponential loss function. Its core idea is the sequential training of weak learners, where the data weights are adjusted after each iteration. Misclassified samples are given higher weights, which encourages the next classifier to focus on cases that are harder to predict [52]. Each iteration recalibrates the dataset and refines predictions by emphasizing the difficult sample, as shown in Figure 9. In particular, AdaBoost adjusts the weights of the dataset, thereby increasing the importance of the observations that have been misclassified in the previous iteration, while decreasing the influence of those that have been predicted correctly. AdaBoost combines weak learners ht(x) into a strong ensemble H(x) and improves performance in a variety of applications by adaptively focusing on challenging instances.
H x = t = 1 T α t h t x
α t = 1 2 log 1 e t e t
e t = i = 1 N ω t i I h t x i y i
where αt is the weight of a weak learner ht(x); et is the error rate, where a lower value leads to a higher weight and vice versa; I is the indicator function, which returns 1 if the prediction ht(xi) and the actual value yi do not match (i.e., a misclassification has occurred), and 0 if they are equal (i.e., the prediction is correct); and wti is the weight of sample t in the ith iteration. T is the total number of weak learners, and N is the total number of training samples.

3.3.3. Gradient Boosting Regression Decision Tree (GBRT)

Gradient boosting regression trees (GBRT) and AdaBoost differ mainly in their updating strategies. AdaBoost adapts sample weights, whereas GBRT updates the regression targets on the basis of the residuals from the previous rounds [54]. As illustrated in Figure 10, GBRT employs the gradient of these residuals (rm) to rebuild new weak learners and iteratively improve prediction accuracy. GBRT typically uses CARTs as weak learners, and the GBRT model can be represented as Equation (11). For regression tasks, it uses binary trees and loss functions such as mean squared error (MSE), absolute loss, and Huber’s loss. Huber’s loss compensates for MSE and absolute loss, applying absolute loss to outliers and MSE to points near the center.
r m = L o s s y , F m 1 x F m 1 x
F M x = m = 1 M T x ; Θ m

3.3.4. Extreme Gradient Boosting (XGBoost)

Extreme gradient boosting (XGBoost), introduced by Chen and Guestrin [55], is an advanced gradient-boosting algorithm. It improves upon traditional GBRT by adding a regularization term to the objective function, decreasing overfitting, and using a second-order Taylor expansion to optimize computational efficiency [55]. While XGBoost is similar to GBRT, the essential difference lies in its improved objective function, which is designed to provide faster and more accurate predictions. If K trees and n samples are given, the objective function can be expressed as
L ( θ ) = i = 1 n l ( y i , y ^ i ) + k = 1 K Ω ( f k )
Ω ( f k ) = γ T + 1 2 λ w 2
where i = 1 n l ( y i , y ^ i ) is a loss function that measures the difference between the predicted value y ^ i and the true value yi of the model; Ω(fk) is the regularization term, which is used to prevent the model from overfitting; T is the number of leaf nodes in the tree, and w is the weight of the leaf node; γ and λ are the regularization parameters; and θ is the set of model parameters.

3.3.5. Light Gradient Boosting Machine (LightGBM)

Compared to the traditional gradient boosting algorithm, the light gradient boosting machine (LightGBM) introduces several improvements [56]. First, it employs the histogram-based algorithm (HBA) to discretize continuous features into buckets, thereby reducing computational effort. Secondly, it utilizes a leaf-wise growth (LWG) strategy, which selects only the leaf node with the highest loss for splitting, unlike a traditional LWG strategy. This approach results in a more rapid reduction in error and an increase in enhanced model performance, as illustrated in Figure 11. The gain formula for the determination of the optimal splitting point is
G a i n = 1 2 G L 2 H L + λ + G R 2 H R + λ G L + G R 2 H L + H R + λ γ
where GL and GR are the gain sums of the left and right subtrees respectively; HL and HR are the second-order gradient sums of the left and right subtrees respectively; λ is the regularization parameter; and γ is the penalty term for the number of leaf nodes.

3.3.6. Categorical Gradient Boosting (CatBoost)

Categorical gradient boosting (CatBoost) was first proposed in 2017 by a search company named Yandex to better deal with categorical features [47,57,58]. CatBoost improves traditional gradient boosting algorithms in several ways, most notably by integrating an innovative algorithm that automatically converts categorical features into numerical ones. This approach is based on the estimation of target statistics by means of stochastic permutations, also known as ordered target statistics (OTS).
OTS ( x i ) = j = 1 i 1 y j i 1
where xi is the ith eigenvalue of the sample, and yj is the jth target value of the sample. CatBoost optimizes the efficiency of training by using an oblivious tree structure, in which each node at the same level is split symmetrically using the same features and points, as demonstrated in Figure 12a. This approach ensures uniformity and significantly reduces the amount of computation required. In addition, the residuals of CatBoost shown in Figure 12b are computed excluding the current sample to reduce the prediction bias, thereby increasing the accuracy of the model.

3.4. Hyper-Parameter Tuning and Modelling Evaluation

The addition of more data is a pervasive approach to refining a machine learning model, but the generation of high-quality data is often a time- and energy-consuming process. A more efficient way to improve performance and save time and resource consumption is to optimize hyperparameters [59]. Unlike parameters learned during training, hyperparameters are manually set and require careful tuning [28,34,36,60]. Grid searching is a popular method for hyperparameter optimization, which involves systematically testing combinations to find the best settings. In this study, grid search is employed to fine-tune hyperparameters for ten ML algorithms, which are informed by previous models and tailored to our database, as shown in Table 2 and Table 3.
To evaluate model performance after hyperparameter tuning, K-fold cross-validation is employed. This divides the data into K subsets, running K rounds of training and testing. The average performance across the folds gives a reliable metric, with K = 10 often providing a balance between computational efficiency and prediction accuracy. Cross-validation is critical for the evaluation of performance across different folds and for the selection of the best model [61].
To thoroughly evaluate the prediction results of the ML-based models selected in the present study, four statistical indicators of model performance are utilized hereafter. These evaluation indicators include the coefficient of determination (R2), root mean square error (RMSE), mean relative error (MRE), and mean absolute percentage error (MAPE). The definition and calculation formulas for individual statistical indicators are detailed in Table 4 below.

4. Results and Discussions

4.1. Model Performance: A Comparison Across Diverse ML Algorithms

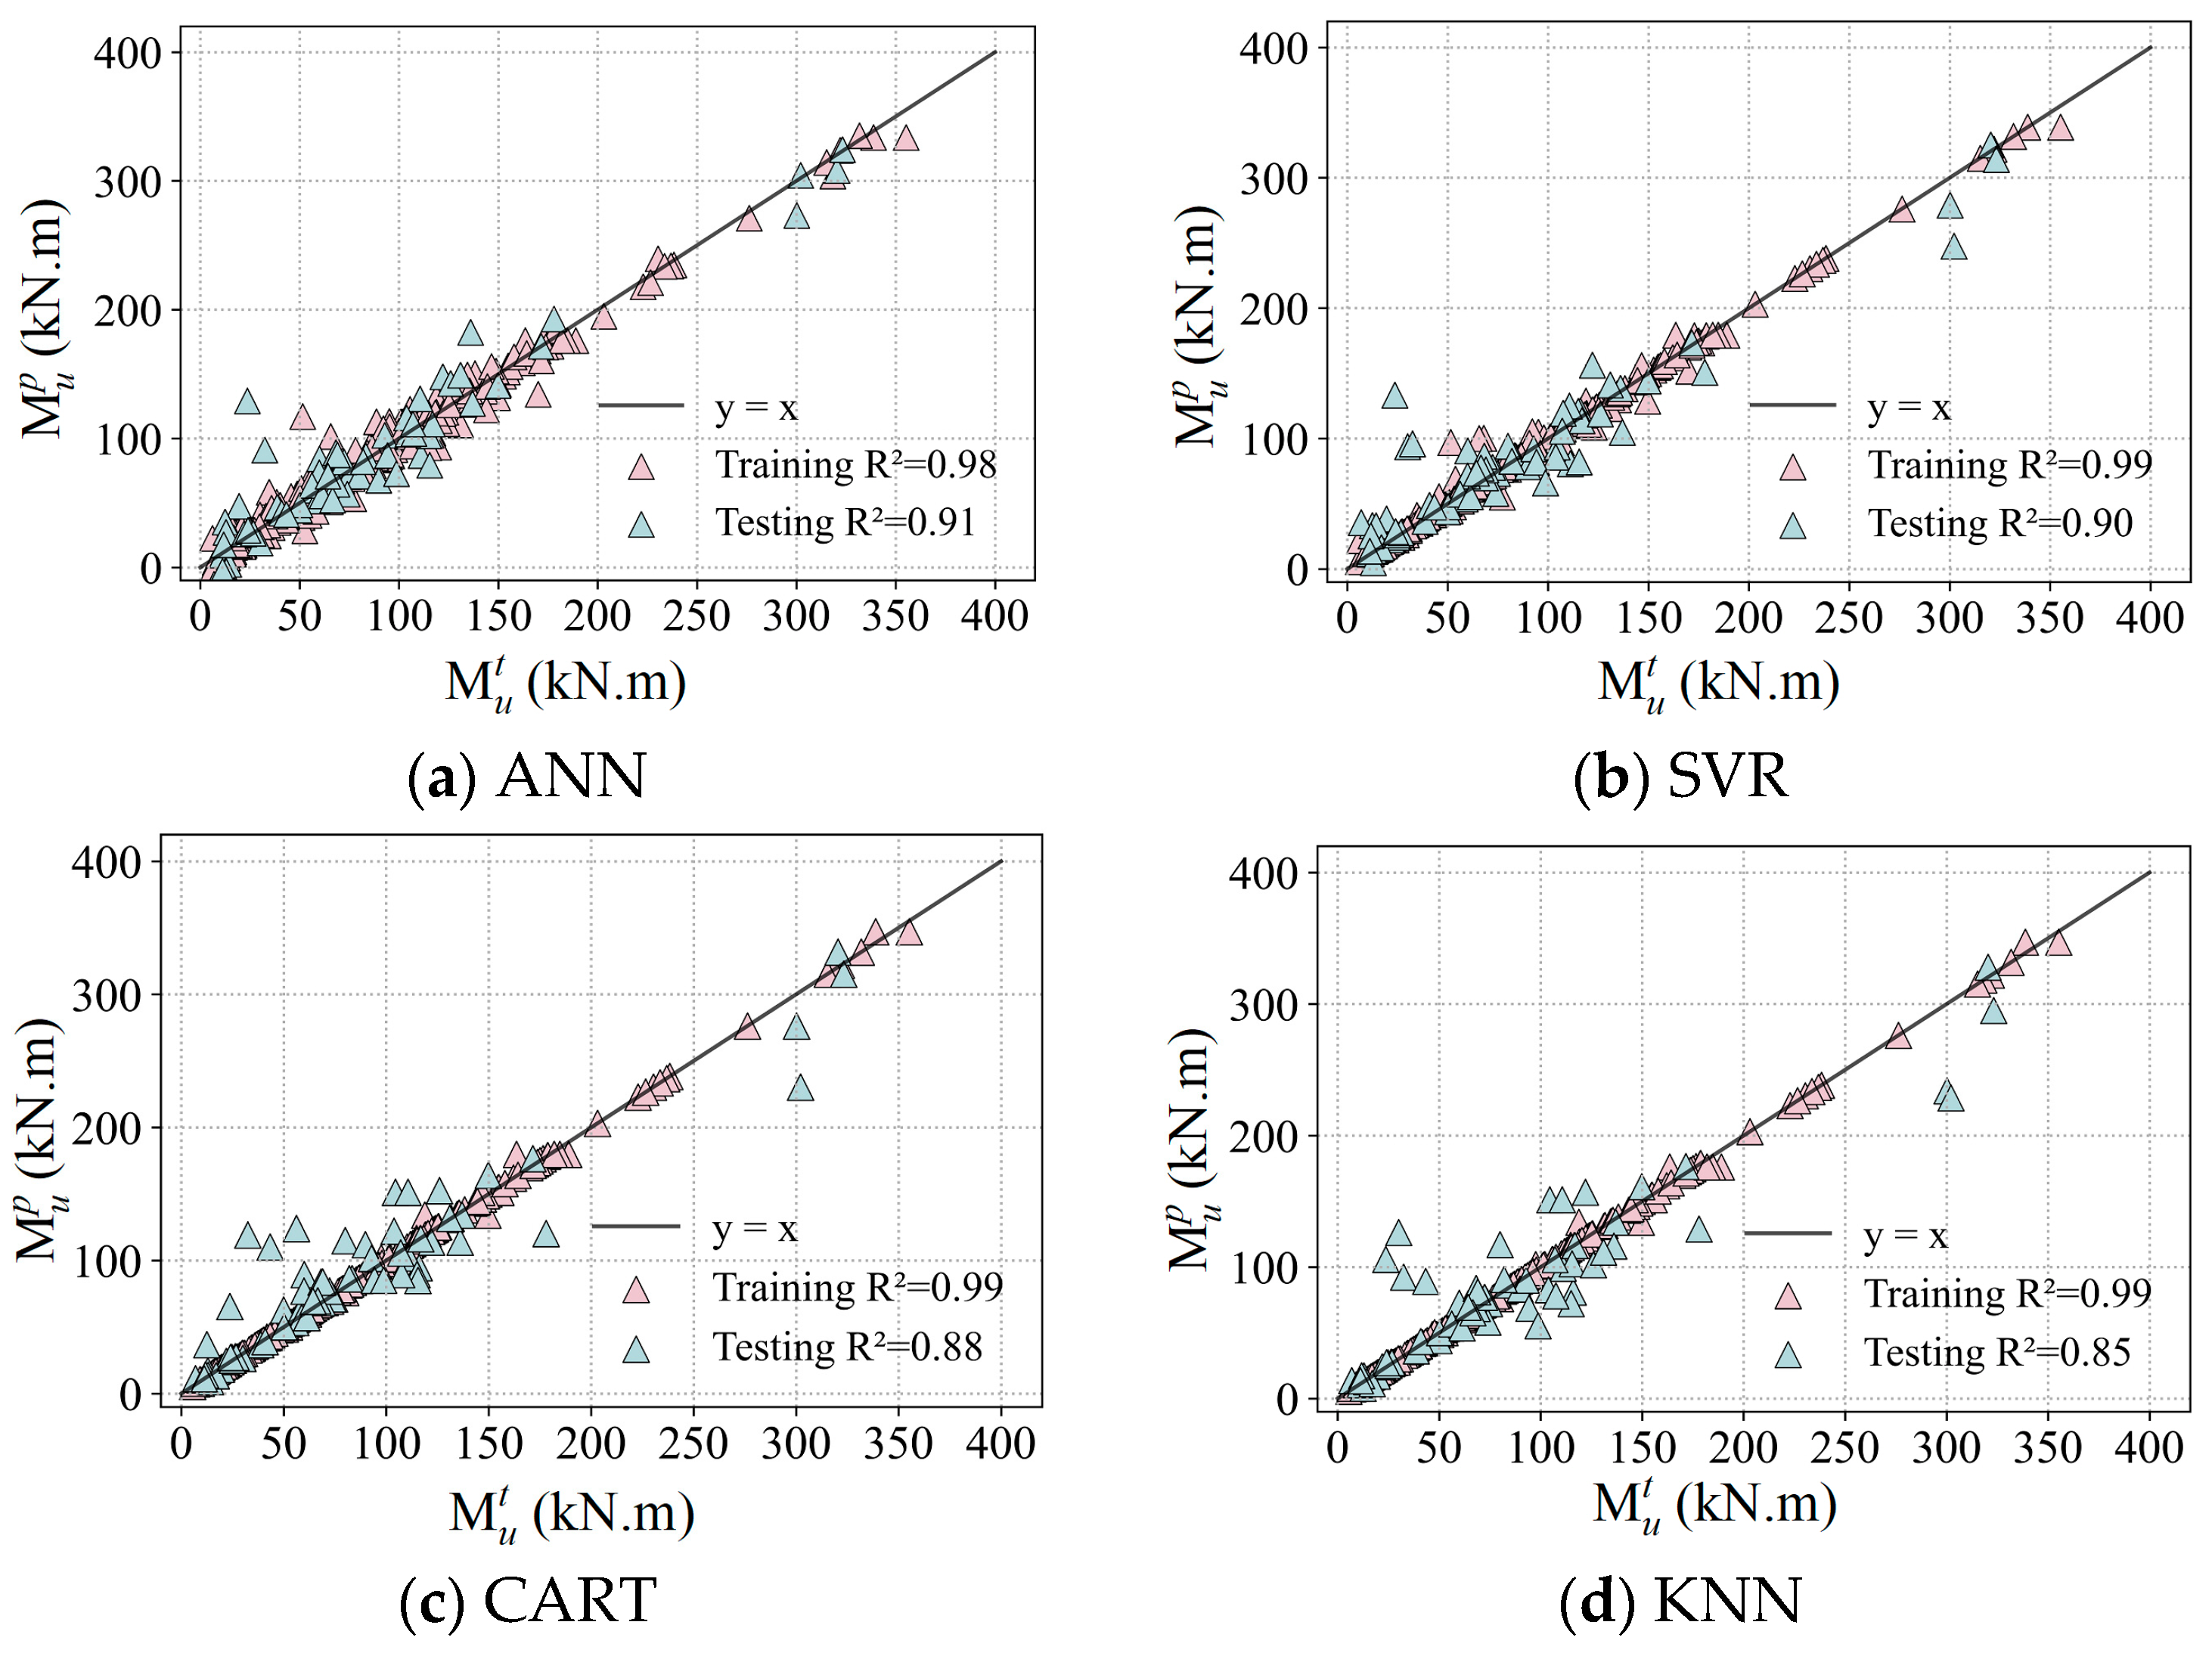
Ten different algorithms are employed to develop machine learning models based on the established database to predict the ultimate bending moment Mu of reinforced UHPC beams. The dataset was divided into 80% for the training set and 20% for the testing set.
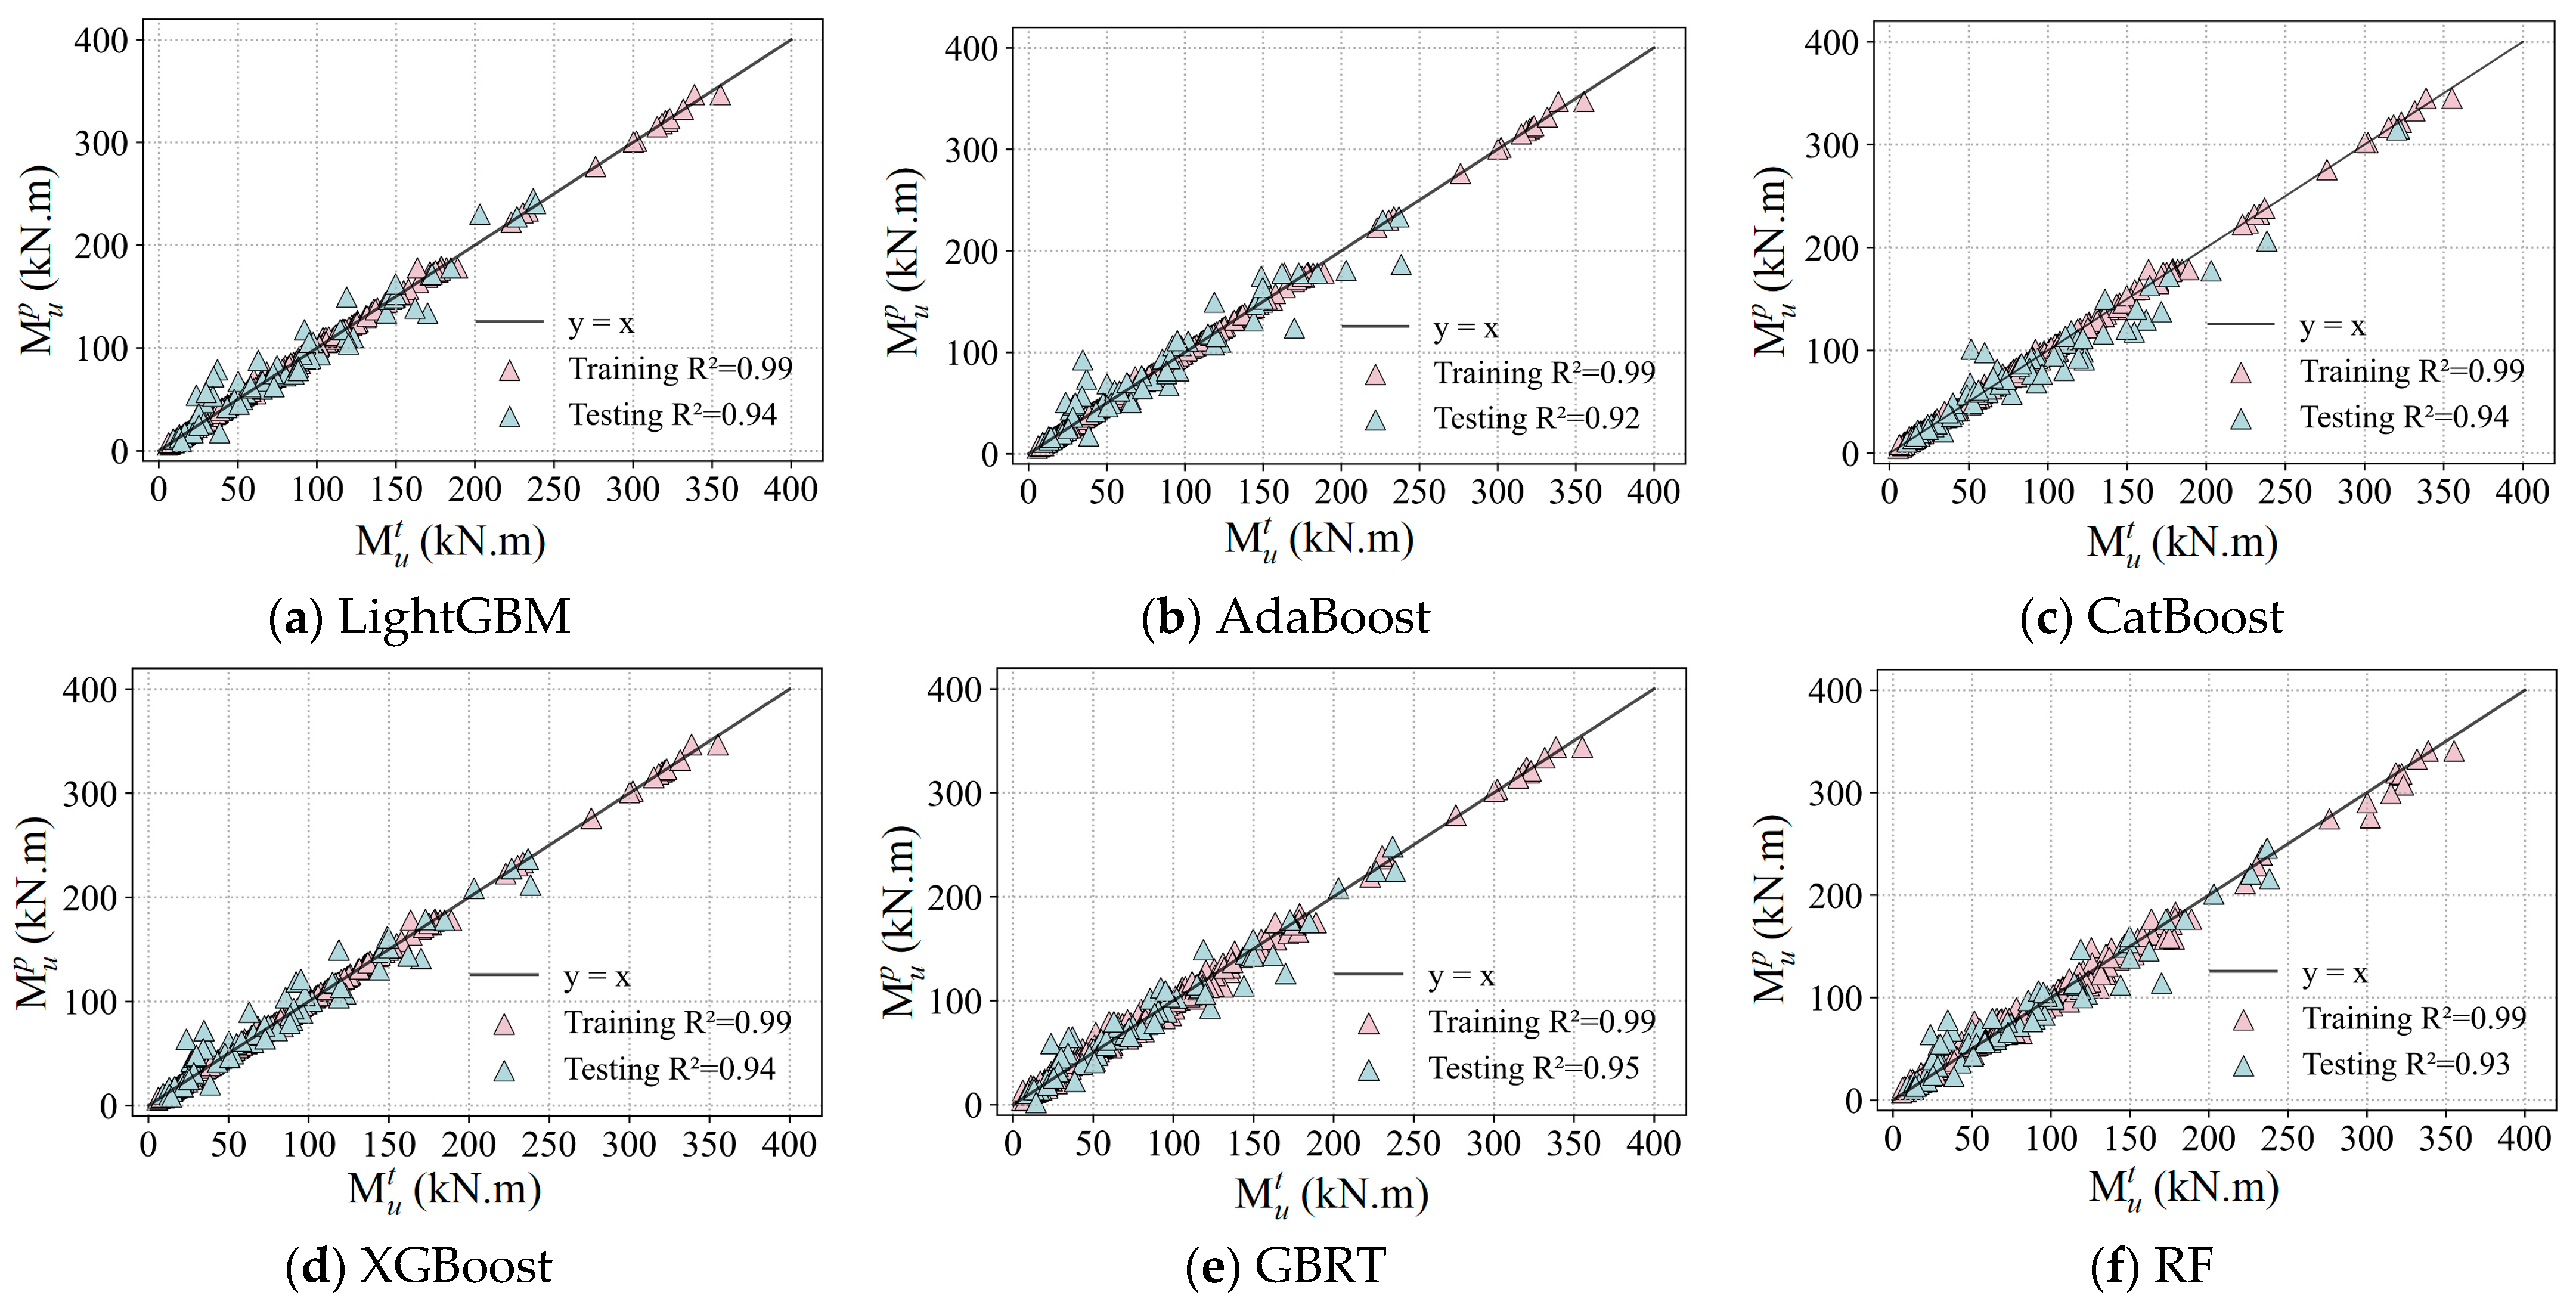
 Figure 13 and Figure 14 compare the predicted bending ultimate moments Mup from traditional ML models and ensemble learning models, respectively, with the corresponding tested results Mut from the established database. The relationships between the predicted ultimate moments and the measured values follow a linear fit with a slope of 1.0. Detailed results of this comprehensive evaluation for the bending moment capacity of reinforced UHPC specimens using various ML-based models are presented in
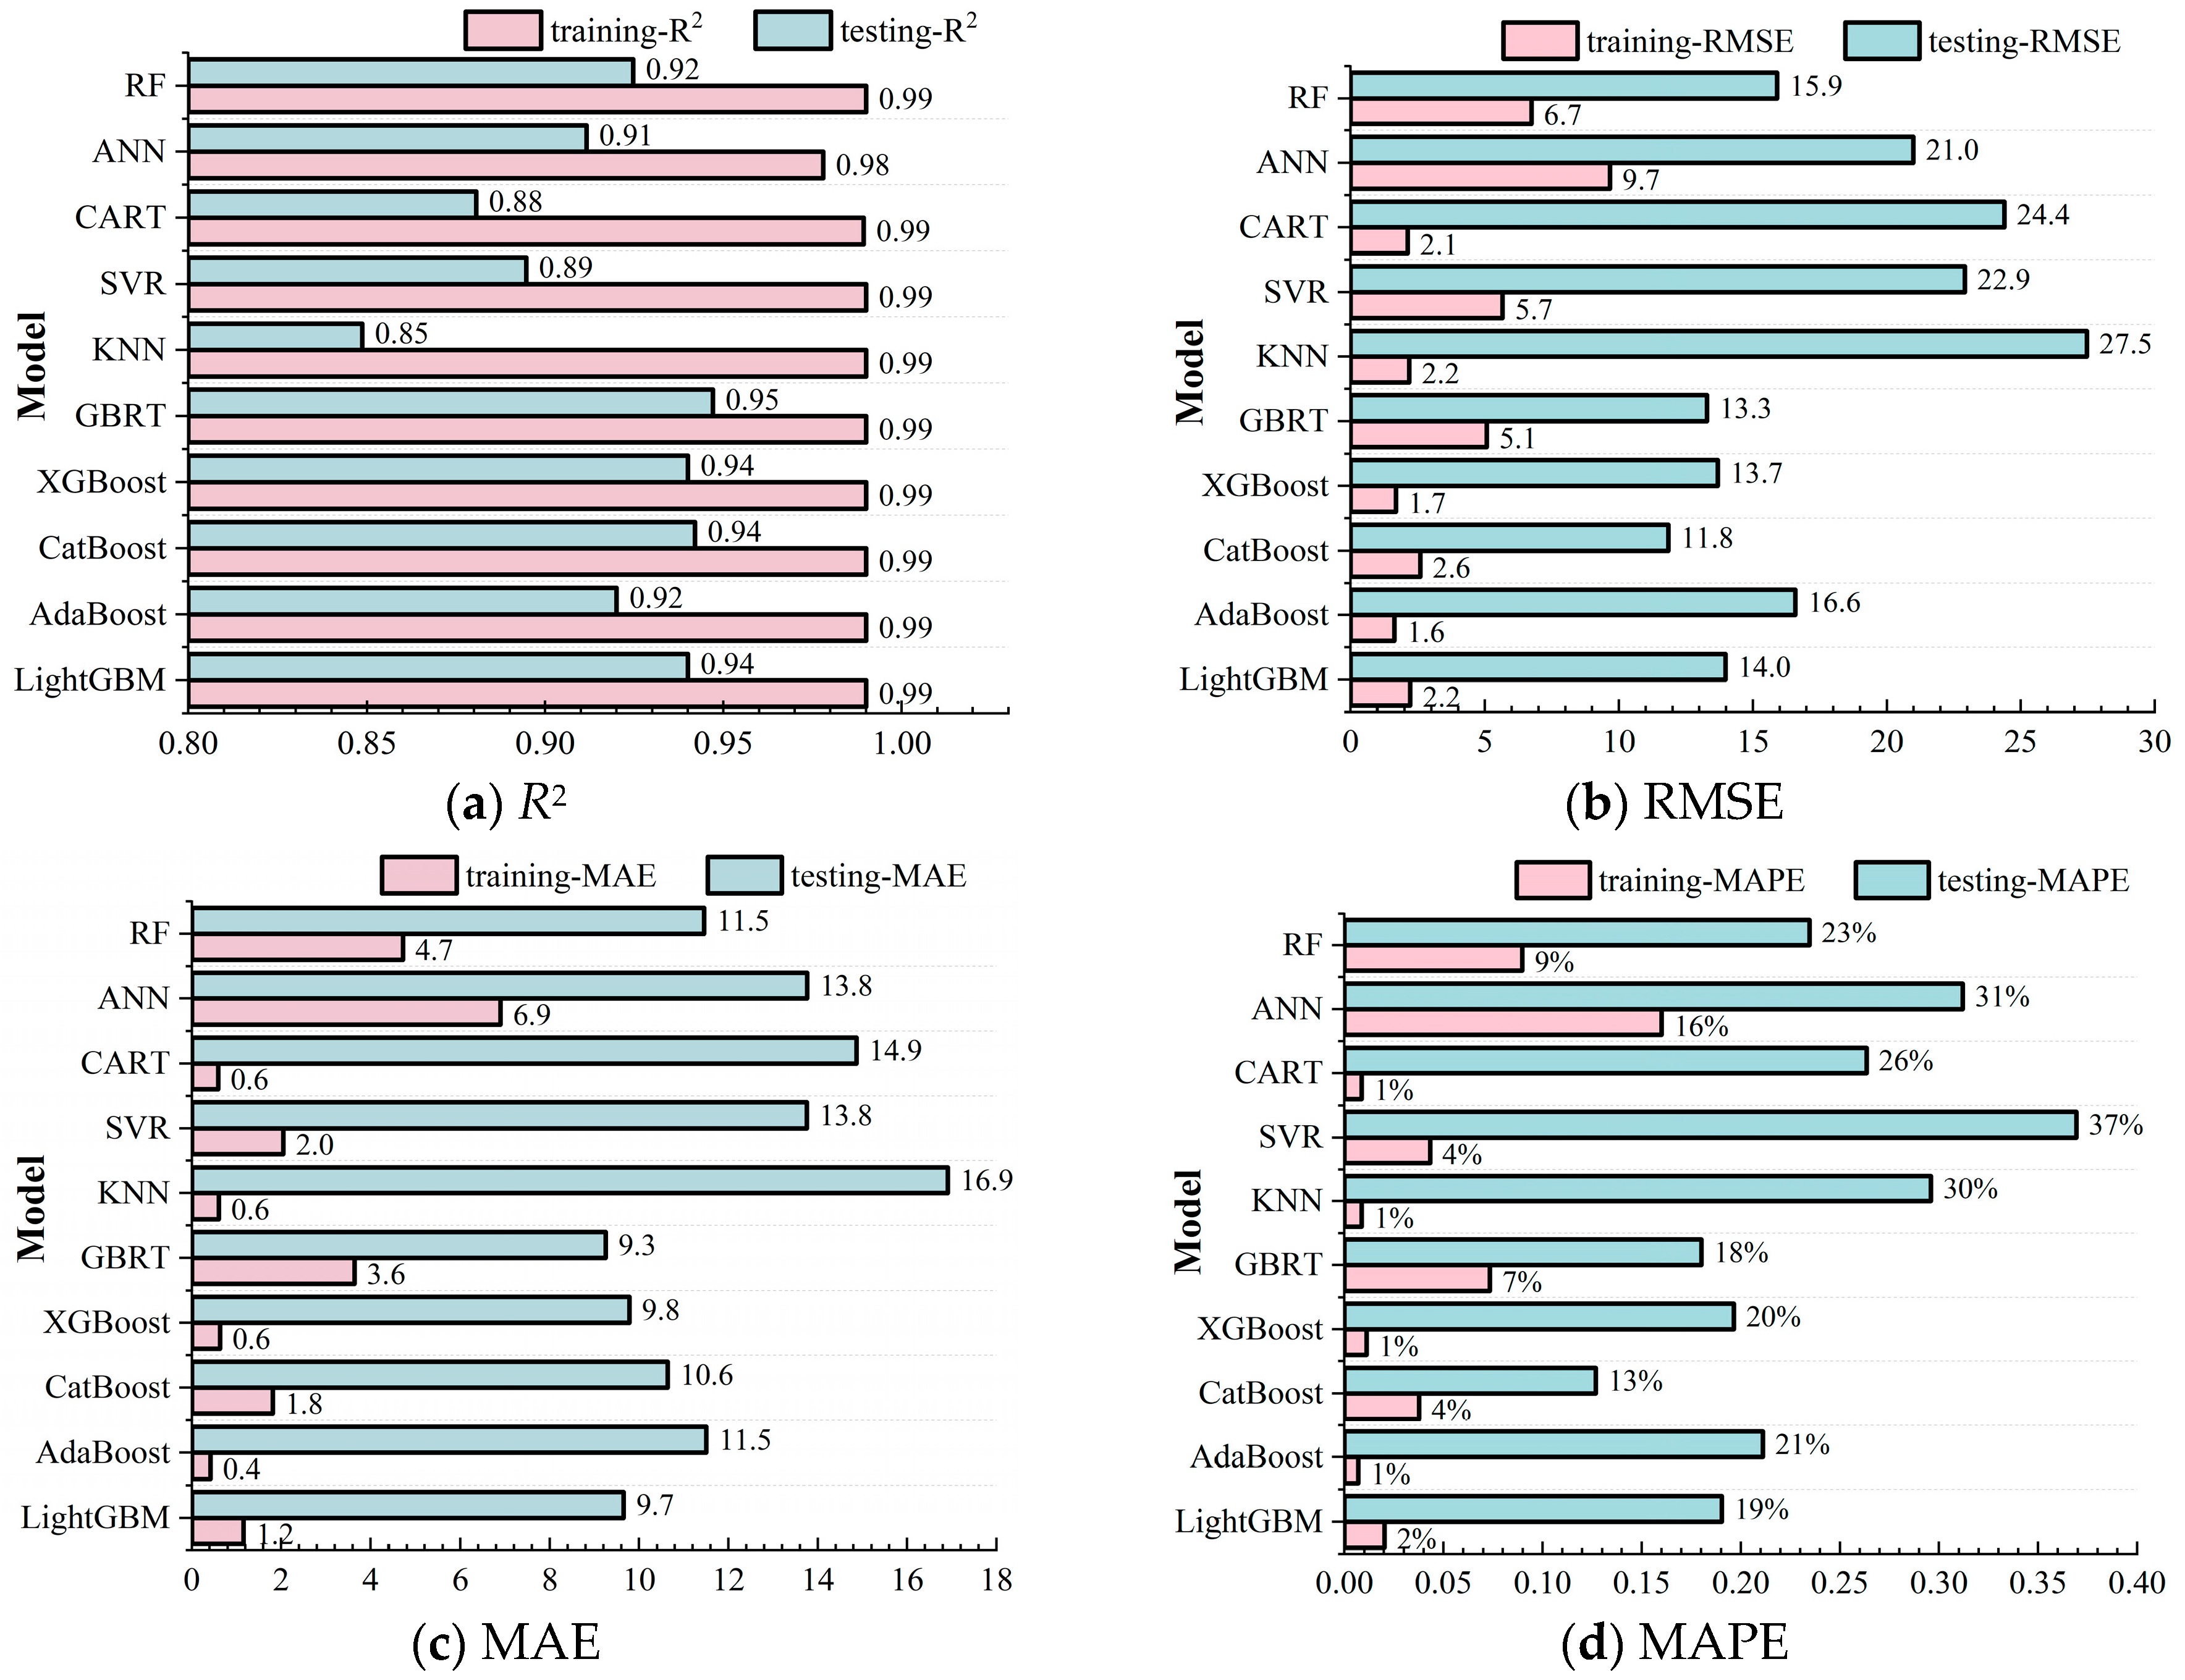
 Figure 15.
On the training set, the coefficient of determination, R2, for all ML models except ANN is greater than 0.99, highlighting their excellent fitting abilities. The ANN model still shows a commendable performance, although it has a slightly lower R2 value of 0.98. In terms of RMSE, the KNN, AdaBoost, CatBoost, and XGBoost models have relatively lower values compared to other ML models, indicating the minimized discrepancy between their predicted values and tested results, with an average error margin of approximately 2.0. This underlines their exceptional model accuracy in predicting the flexural performance of reinforced UHPC beams. In contrast, higher RMSE values of 9.7 and 6.7 were recorded for the ANN and GBRT models, respectively. Despite these higher values, the model accuracy is still within an acceptable range.
Further analysis of the MAE reveals that the KNN, AdaBoost, CatBoost, LightGBM, and XGBoost models all maintain values below 2, indicating a negligible average deviation between the predicted and measured values, and thus a high degree of prediction accuracy. Moreover, the evaluation of MAPE clearly shows that the KNN, CART, AdaBoost, and XGBoost models retain values below 1%, confirming their accurate prediction capabilities. Although the ANN model has a MAPE of 16%, indicating a reduced predictive accuracy, possibly affected by its network structure and hyperparameter settings, it nevertheless meets the fundamental predictive benchmarks.
Considering the testing set, the coefficients of determination, R2, for the LightGBM, CatBoost, XGBoost, and GBRT models are all larger than 0.94, demonstrating their exceptional prediction potentials. This outstanding performance is primarily due to the inherent advantages of ensemble learning, which includes the reduction in the bias and variance in predictions by combining multiple models, thereby enhancing their ability to generalize to new datasets. Conversely, the KNN model gives the lowest R2 value of 0.85 on the testing set. Its performance limitations may be related to its decision mechanism, which relies on nearest-neighbor voting or averaging. This may fail in the presence of high-dimensional data or uneven data distributions, where the concept of “nearest neighbor” may be somewhat indeterminate.
The KNN, ANN, SVR, CART, and AdaBoost models present relatively high values when analyzing the three evaluation indicators of RMSE, MAE, and MAPE, indicating a decrease in prediction accuracy on the testing set. The increased sensitivity of these models to the distribution of data features and the presence of noise may be responsible for this trend. In stark contrast, the GBRT and CatBoost models outperform on all three of these indicators, further underscoring the superior effectiveness of ensemble learning models in improving the accuracy of predictions. Specifically, GBRT and CatBoost derive their superiority from the construction of multiple decision trees and the synthesis of the prediction insights of each tree to reduce potential errors inherent in singular models.
To summarize, the excellent performance of ensemble learning models such as LightGBM, CatBoost, XGBoost, and GBRT on the testing set is fundamentally related to the strategy of ensemble learning with model aggregation. Those approaches effectively reduce the bias and variance while improving the generalization ability of the models. Conversely, while the KNN model presents admirable results on the training set, its modest performance on the testing set highlights the importance of considering data characteristics and the compatibility of the logic of model decisions with the given problem during model selection. Overall, the ten ML-based models evaluated are capable of accurately predicting the ultimate bending moment values, Mu, of reinforced UHPC beams, confirming the profound potential of machine learning models to address challenging structural demands.

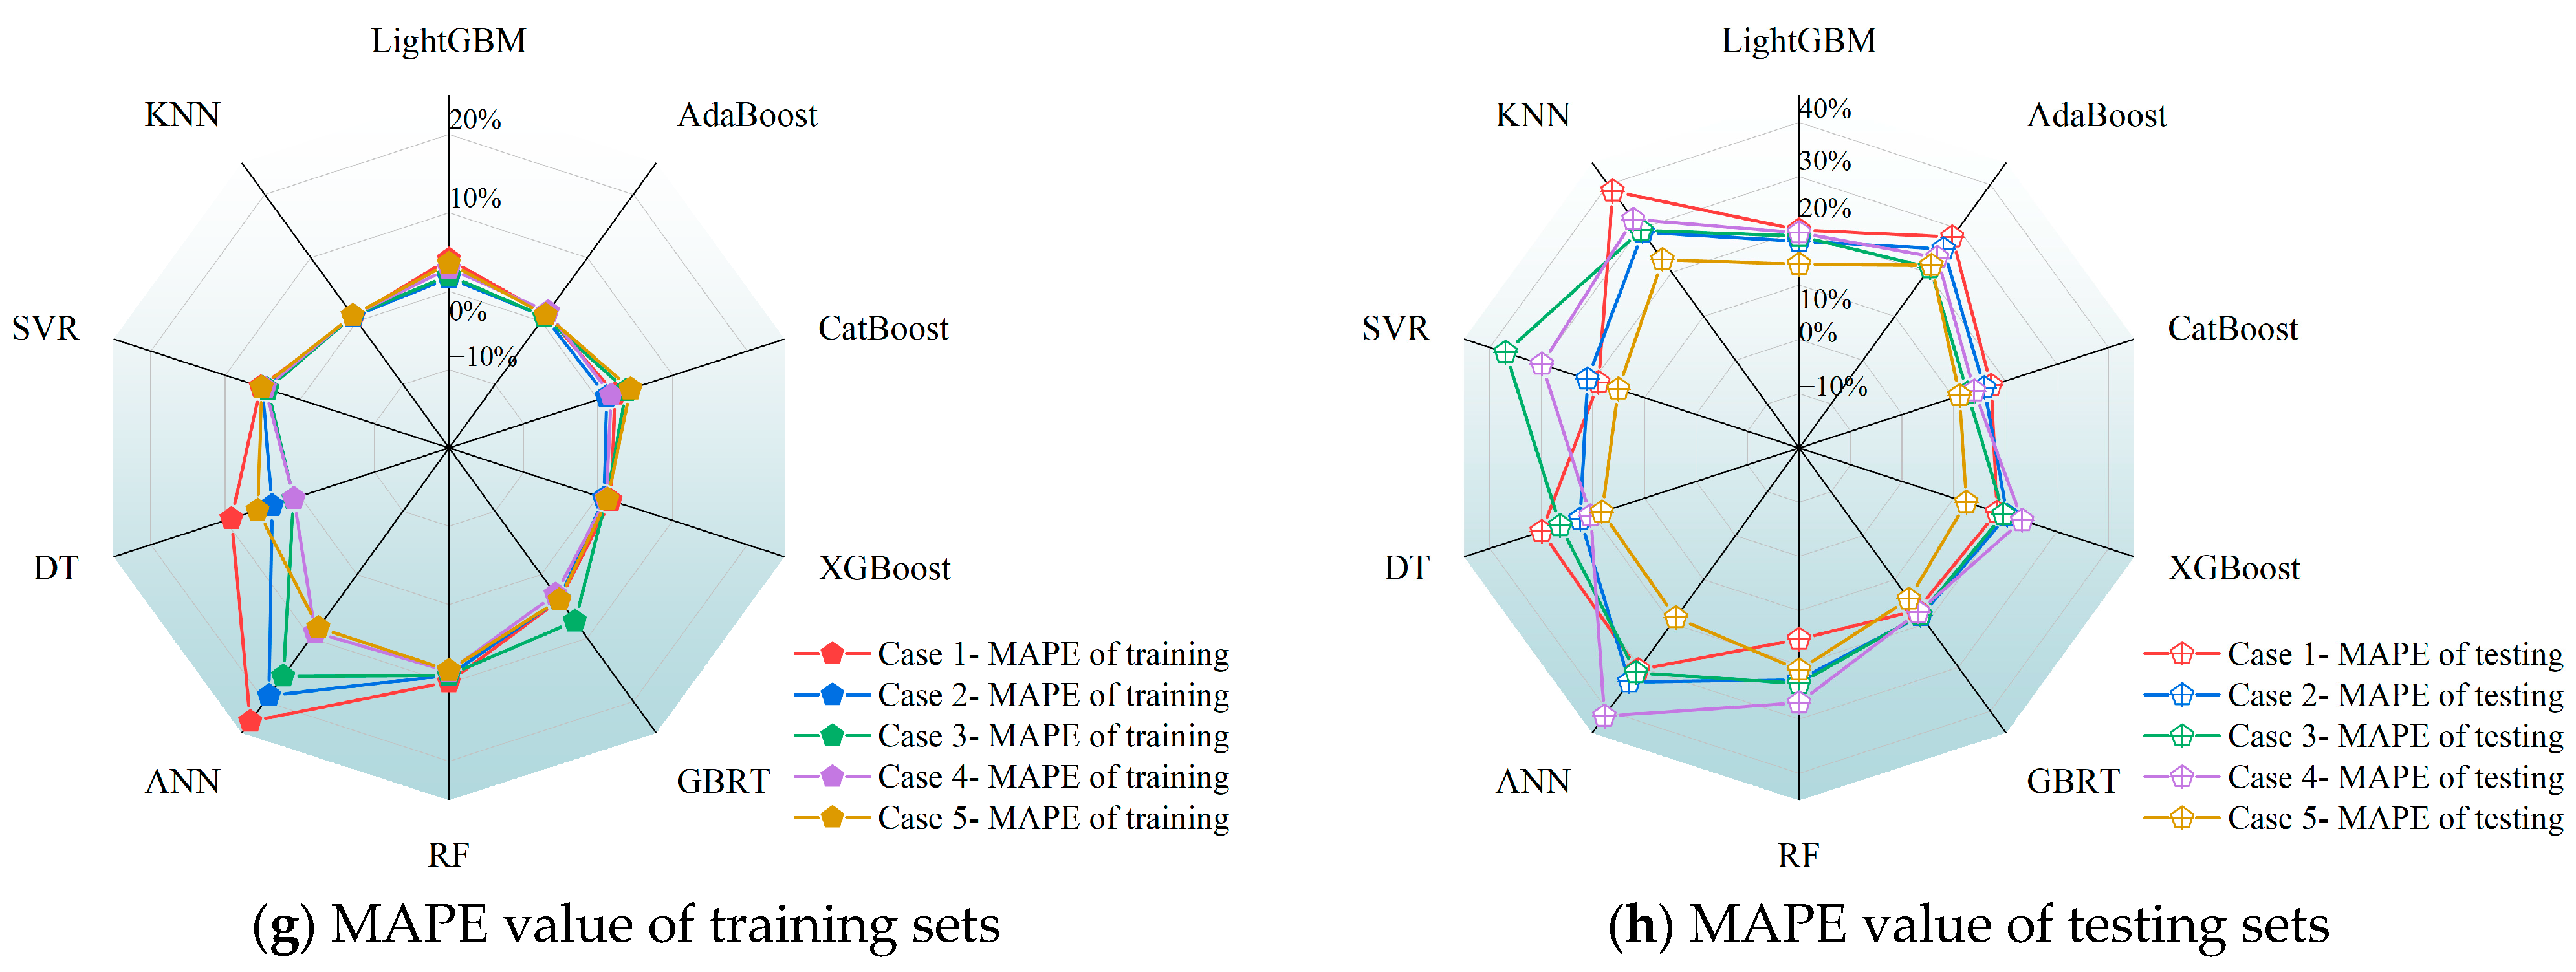
4.2. Data Subset Analysis for Model Performance and Stability

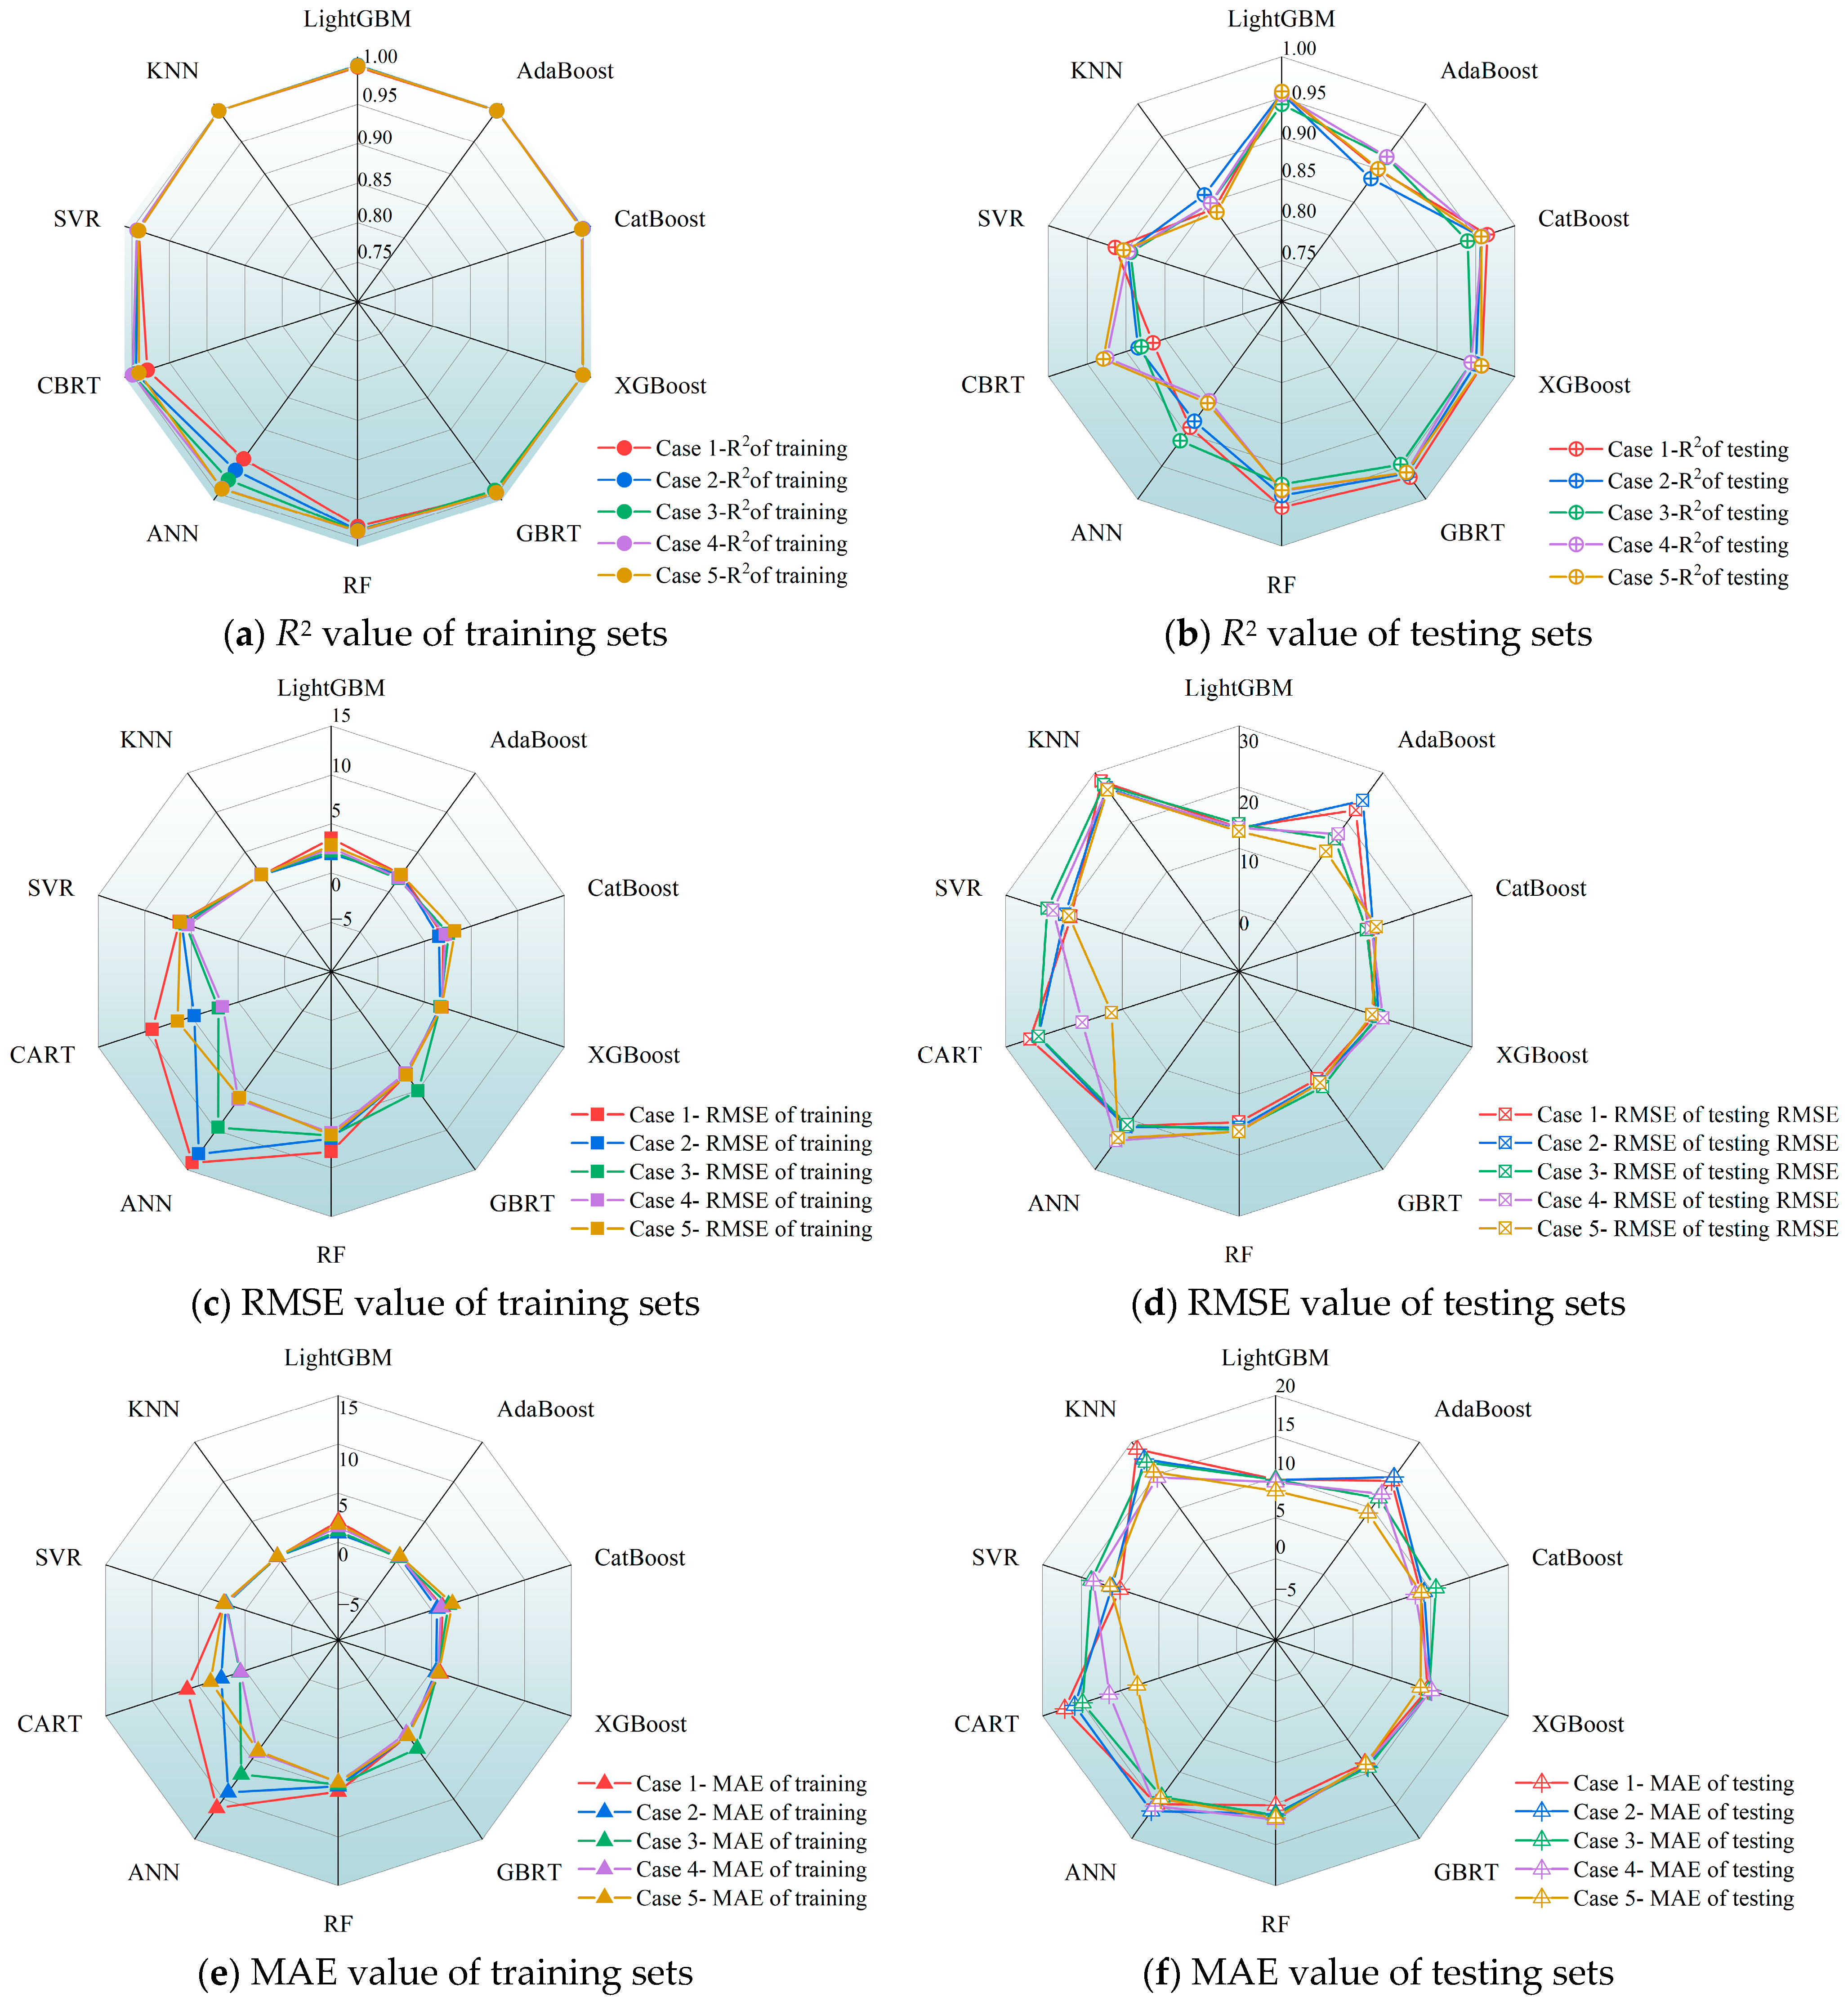
To systematically evaluate the qualities of the ML-based models and database employed, as well as to explore model stability, a methodical approach is taken by dividing the database previously established into subsets of varying sizes. This strategy makes it possible to examine model performance across a spectrum of dataset sizes, thereby providing insightful perspectives on how model performance varies with different dataset sizes. Based on findings from previous research and empirical evidence, five different cases of data subsets, as shown in Figure 16, have been identified for in-depth analysis.
Figure 17 presents a comparative analysis of model performances with various cases of data subsets. An examination of the coefficients of determination, R2, for all models, reveals that, across different cases of data subsets, the R2 values associated with the training set are predominantly greater than 0.98, while the R2 values of the testing set are generally larger than 0.90. These results underscore the overall robust performance of ML models. Nevertheless, the ensemble learning models exhibit relatively superior performance compared to their traditional ML model counterparts. Specifically, the CatBoost model achieves the highest R2 value of 0.97 on the testing set for Case 1 and reaches a maximum R2 value of 0.96 for the testing set for Case 2. For the third to fifth cases of data subsets, the R2 value of the testing sets peak at 0.94, 0.96, and 0.96 with the ensemble models of GBRT, CatBoost, and GBRT, respectively.
This analysis highlights the superior performances of ensemble learning models over traditional ML models in most cases and explains the variance in model effectiveness when dealing with data subsets of different divisions. The sustained high R2 values of ensemble learning models across a variety of data subset configurations can be attributed to their elaborate structures and algorithms, which are able to capture data correlations and patterns in a more effective way. As a result, the accuracy of predictions is improved. Furthermore, integrated models enhance the prediction accuracy by combining several weak learners or regressors. This strategy is especially beneficial when dealing with large and diverse data sets. Conversely, due to their relatively simple algorithmic structures, traditional ML models may be unable to fully represent the intricacies of data relationships, which impacts to some extent their overall performance.
To conduct a thorough evaluation of model performance, three statistical performance indicators of ML models, RMSE, MAE, and MAPE, are discussed here. When evaluating the training set, a majority of ML models show exceptional and consistent proficiency across these performance indicators. Nonetheless, the KNN models demonstrate suboptimal performance under various cases of data subsets, especially for Case 1. This can be attributed to the fact that the KNN models encounter a deficit in training sample size within the data subset division for Case 1. This leads to an overfitting of training data with details and noise, thereby decreasing their generalization abilities. Moreover, the MAE for most of the models is around 10, suggesting a mean absolute deviation of approximately 10 units between model predictions and measured results.
Having analyzed the model performance with statistical indicators, it becomes evident that CatBoost and GBRT models significantly outperform the traditional ML models. The KNN, AdaBoost, SVR, and ANN models display inferior performance in various data subset arrangements. For instance, in the Case 4 data subset, the ANN model registers a dramatically high MAPE of 41%, suggesting an insufficient prediction accuracy. This may be due to the model not being trained on a sufficiently diverse or large dataset, which may have resulted in inadequate generalization to unseen data. However, in the Case 5 data subset, the MAPE values decrease to approximately 18%, revealing a reduction in the average percentage deviation between the prediction values and measured results to about 18%. The significant variation in MAPE values highlights the pronounced differences in the adaptability of diverse models to specific data subsets. It therefore emphasizes the need to consider the sensitivity and adaptability of a model to varying data subsets during the model selection and optimization process.
An in-depth evaluation of the ensemble learning models reveals that the second case is found to be the most effective and efficient database division strategy across all of the data subset cases. To be more specific, 75% of the database is allocated to the training set, while the remaining 25% of the data serves as the testing set. In contrast, the optimal data subset configuration for traditional ML models is identified in Case 3, where the data distribution percentages of the training set and testing set are 80% and 20%, respectively. The findings underscore the considerable influence of data division ratios on model effectiveness. Further investigation reveals that among ensemble learning algorithms, the CatBoost and GBRT models present a remarkable consistency with a varying data subset configuration. In terms of traditional ML models, the CART model stands out for its stability and robustness. Notably, the CatBoost model is distinguished by its superior division strategy of data subsets, considering both model efficiency and stability of data acquisition.
The insights gained from this analysis not only reveal the subtle differences in how each model will perform under different data subset distributions but also provide critical guidance for future model selection and optimization efforts. The foregoing analysis highlights the critical importance of proper data acquisition in improving model performance. Specifically, in the context of ensemble learning models, the selection of an appropriate data subset configuration is of paramount importance for the realization of peak performance. Furthermore, the model stability plays a crucial role in determining how well it performs. Therefore, the effects of data configuration and model stability should be properly considered during the model selection and optimization phases to ensure optimal model functionality in real-world applications.

4.3. Comparison with Existing Empirical Equations

Given the increasing utilization of UHPC-based materials in civil engineering, a multitude of standards and guidelines have emerged worldwide to facilitate the design of UHPC structures [25,26,37,38]. The prevailing standards in the field, the French standard NF P 18-710 [37] and Swiss recommendation SIA 2052 [38], provide guidelines for the design of UHPC-based structures. However, these standards face limitations in terms of their practical application and accuracy precision. The French standard emphasizes strain-based failure criteria, requiring iterative calculations without explicitly defined formulas, whereas the Swiss recommendation simplifies compressive stress distribution and applies a reduction factor to tensile contributions. The existing empirical formulas are presented in Table 5, with symbol definitions available in the referenced literature. Similarly, the US design guides of ACI 544.4R-18 [26] and FHWA HIF-13-032 [25], which are based on the equilibrium and strain compatibility, fail to fully capture the nonlinear behavior of UHPC elements. The calculation model proposed by Li et al. [39] is derived from experiments and incorporates UHPC’s tensile contribution with an assumption of uniform stress distribution, thereby reducing its applicability under varying reinforcement ratios. For reference, the key formulas for these empirical methods are presented in Table 5. Despite the prevalence of existing empirical or code-based methods, numerous studies reveal that the empirical formulas provided for estimating the flexural capacity of reinforced UHPC beams frequently exhibit excessive conservatism, resulting in significant discrepancies between predicted values and experimental observations [12,
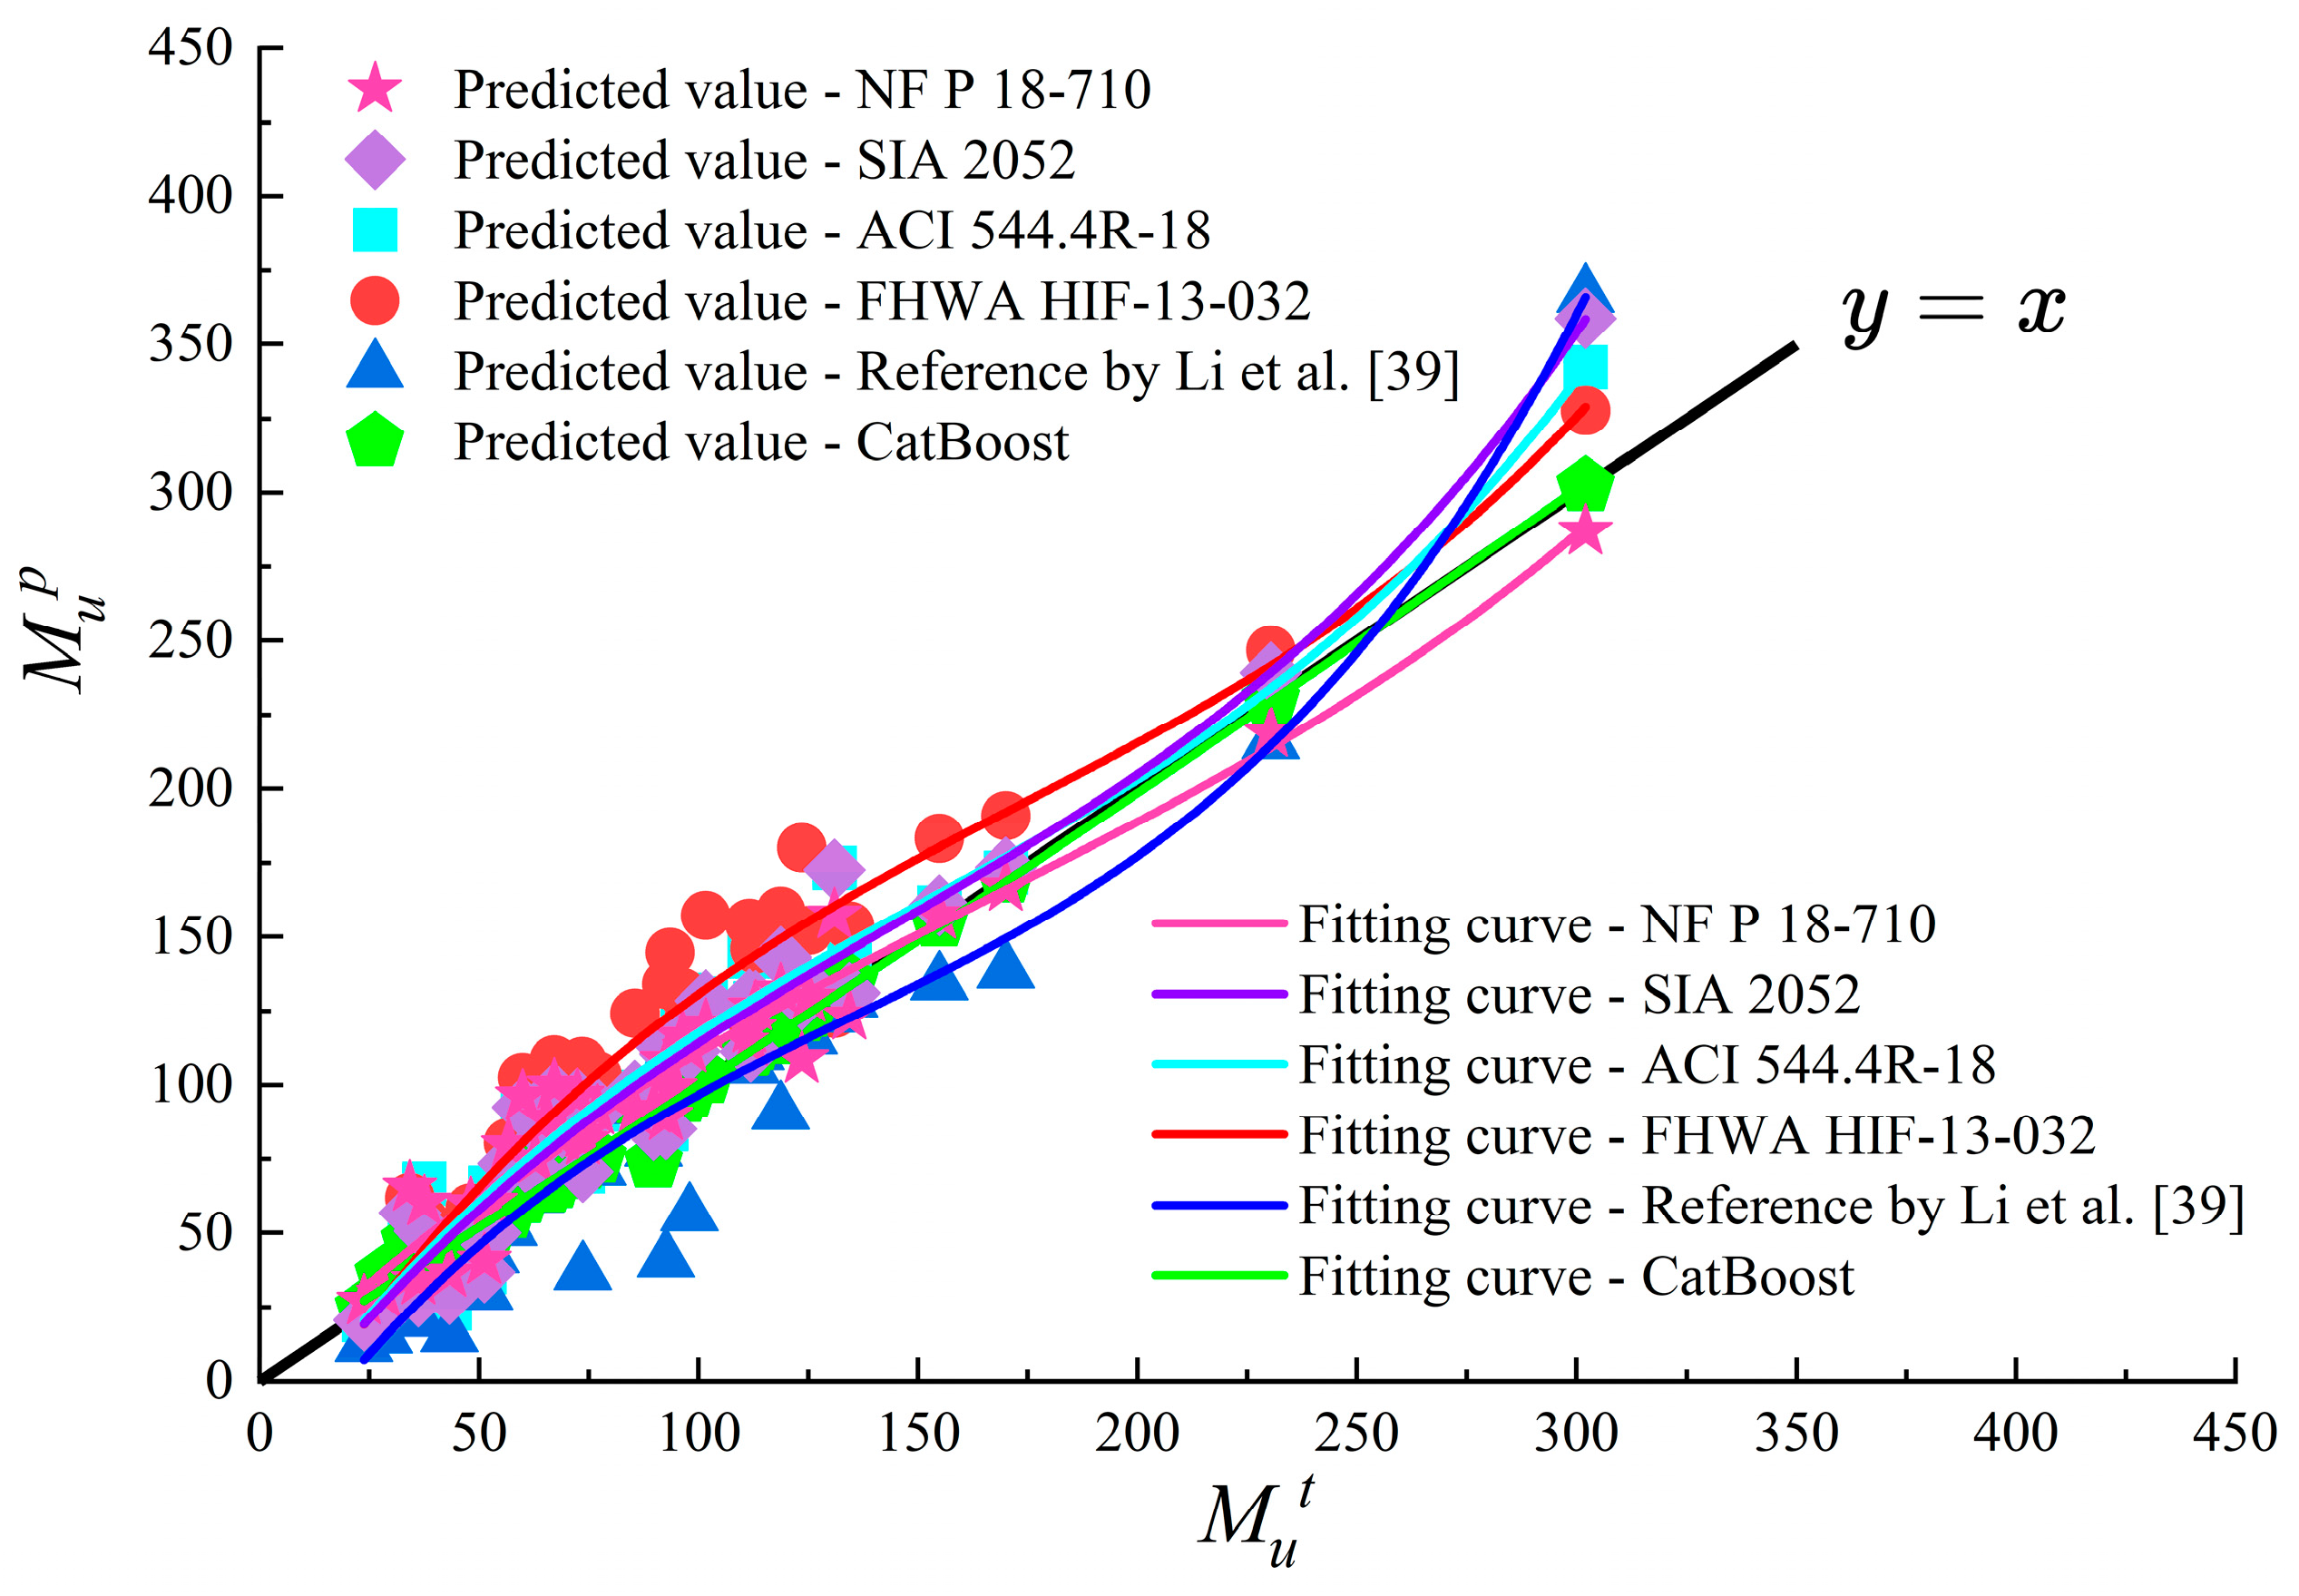
13]. This study aims to demonstrate the superior predictability of the CatBoost model by comparing its model performance with several widely recognized models based on empirical formulas.
As shown in Table 6, the comparison results reveal that the CatBoost model significantly outperforms the five representative empirical formulas in predicting the flexural capacity of UHPC beams. Empirical design models such as NF P 18-710 and SIA 2052 provide standardized approaches to the design of UHPC beams; however, they frequently rely on simplified assumptions about material behaviors, such as strain distributions or reduction factors, leading to conservative or inconsistent predictions. For instance, an examination of the calculation method proposed by Li et al. [39] reveals an average predicted-to-measured flexural capacity ratio of 0.916, thus indicating a tendency to underestimate flexural capacity in practical applications. Conversely, the CatBoost model achieves a mean predicted-to-measured flexural capacity ratio of 1.022, the closest to 1, thereby signifying a higher degree of agreement with actual values.
In terms of quantitative performance, the CatBoost model demonstrates superior performance, attaining an R2 value of 0.993. This indicates its superior predictive accuracy and fitting capability compared to the existing empirical methods. For example, the recommendation SIA 2052 and the method presented by Li et al. [39] exhibit R2 values of 0.925 and 0.851, respectively; while the FHWA method exhibits a significantly lower R2 value of 0.711. Furthermore, the CatBoost model demonstrates the lowest RMSE value of 4.396, MAE value of 2.055, and MAPE value of 3.704%, exhibiting a substantial improvement in performance compared to empirical methods such as the ACI 544 and FHWA models. These models exhibit significantly higher RMSE values of 19.929 and 28.923, respectively. These findings underscore the efficacy of the CatBoost model in minimizing prediction errors and ensuring consistent accuracy across diverse datasets.
As illustrated in Figure 18, the predicted data points with the CatBoost model are closely distributed around the baseline y = x , suggesting that the model demonstrates reliable and robust performance. The polynomial fitting curve (green) of the CatBoost model exhibits a strong alignment with the observed values and provides a reliable representation of the underlying data.
Despite its widespread use as an empirical approach, the FHWA method demonstrates significant deviations from observed values, exhibiting an RMSE of 28.923. This outcome indicates its inadequacy in accurately capturing the mechanical behavior of reinforced UHPC beams. The distribution of predictions with the FHWA method is scattered, indicating challenges in generalization that may stem from overly simplified assumptions regarding material behaviors. A comparable situation arises with the ACI 544 model, a frequently utilized model, which simplifies the tensile contribution of steel fiber reinforcement. Consequently, this leads to a substantial underestimation or overestimation of the flexural capacity of reinforced UHPC beams. The deviation of the fitting curve (cyan) from the measured data is particularly evident in this model, indicating a failure to accurately represent the data. While the NFP 18-710 model exhibits certain advancements, it is hindered by computational expense and practical limitations, rendering it unfavorable for engineering applications.
The reference model proposed by Li et al. [39] also demonstrates deviations, with data points scattering away from the ideal baseline. This suggests the presence of inconsistencies in prediction accuracy. While this model incorporates a great number of refined parameters compared to purely empirical formulas, its limitations further highlight the need for more data-driven methodologies. The SIA 2052 model, likewise, fails to achieve the same level of precision as CatBoost, thereby reinforcing the assertion that machine learning approaches offer superior predictive capabilities.
A primary benefit of the CatBoost model is its capacity to detect underlying complex nonlinear correlations between input parameters and flexural performance, a task that conventional empirical models frequently encounter challenges in accomplishing. Moreover, by capitalizing on an extensive and refined dataset, CatBoost enhances generalization, reducing the risk of overfitting while preserving predictive precision across a range of configurations for reinforced UHPC beams. The strong correlation between its predictions and the observed values indicates a high degree of suitability for structural performance predictions, particularly for applications reliant on ML techniques, such as EL models.
Overall, the CatBoost model demonstrates superior performance in terms of predictive accuracy in comparison to empirical methods. Its enhanced applicability and adaptability are particularly notable, as it is capable of incorporating complex feature interactions and producing highly reliable results, which makes it an invaluable tool for practical engineering applications. The employment of data-driven methodologies by the CatBoost model presents a promising alternative to existing empirical methods, thereby paving the way for enhanced accuracy and efficiency in the field of UHPC structural design.

5. Model Interpretation

Advanced machine learning models, such as deep learning, are often considered “black boxes” because of the complexity and nonlinear nature of the models involved, which make it difficult to interpret their decision-making processes. The lack of transparency can have a negative impact on confidence in model predictions.
While techniques such as local interpretable model-agnostic explanations (LIME) and interpretive decision trees provide a degree of interpretability, they are limited. The Shapley additive explanations (SHAP) method has the potential to address these challenges by clarifying the contribution of features to model predictions. SHAP has been widely adopted for model interpretation since it enhances transparency and credibility through consistency, local interpretability, and model independence [35,36,40,62]. The explanatory model of SHAP, g(a′), is defined as
g a = ϕ 0 + z = 1 Z ϕ z a z
where ϕ0 is the baseline value of the model, usually the average of all sample predictions; ϕz is the SHAP value of the feature z, which indicates the contribution of the feature z to the prediction; and az is a binary indicator for the feature z, indicating whether feature z is in the explanatory model.

5.1. Analysis of Feature Importance Using SHAP

In exploratory analysis of ML models, reliance on the SHAP interpretation for a single model alone may not adequately capture the delicate effects of features on predictions. This limitation arises from the varying dependencies and interactions that different models have with the same set of characteristic parameters. To gain a deeper and more accurate understanding of feature significance and its influence on predictions, it is essential to perform a SHAP analysis with multiple models.
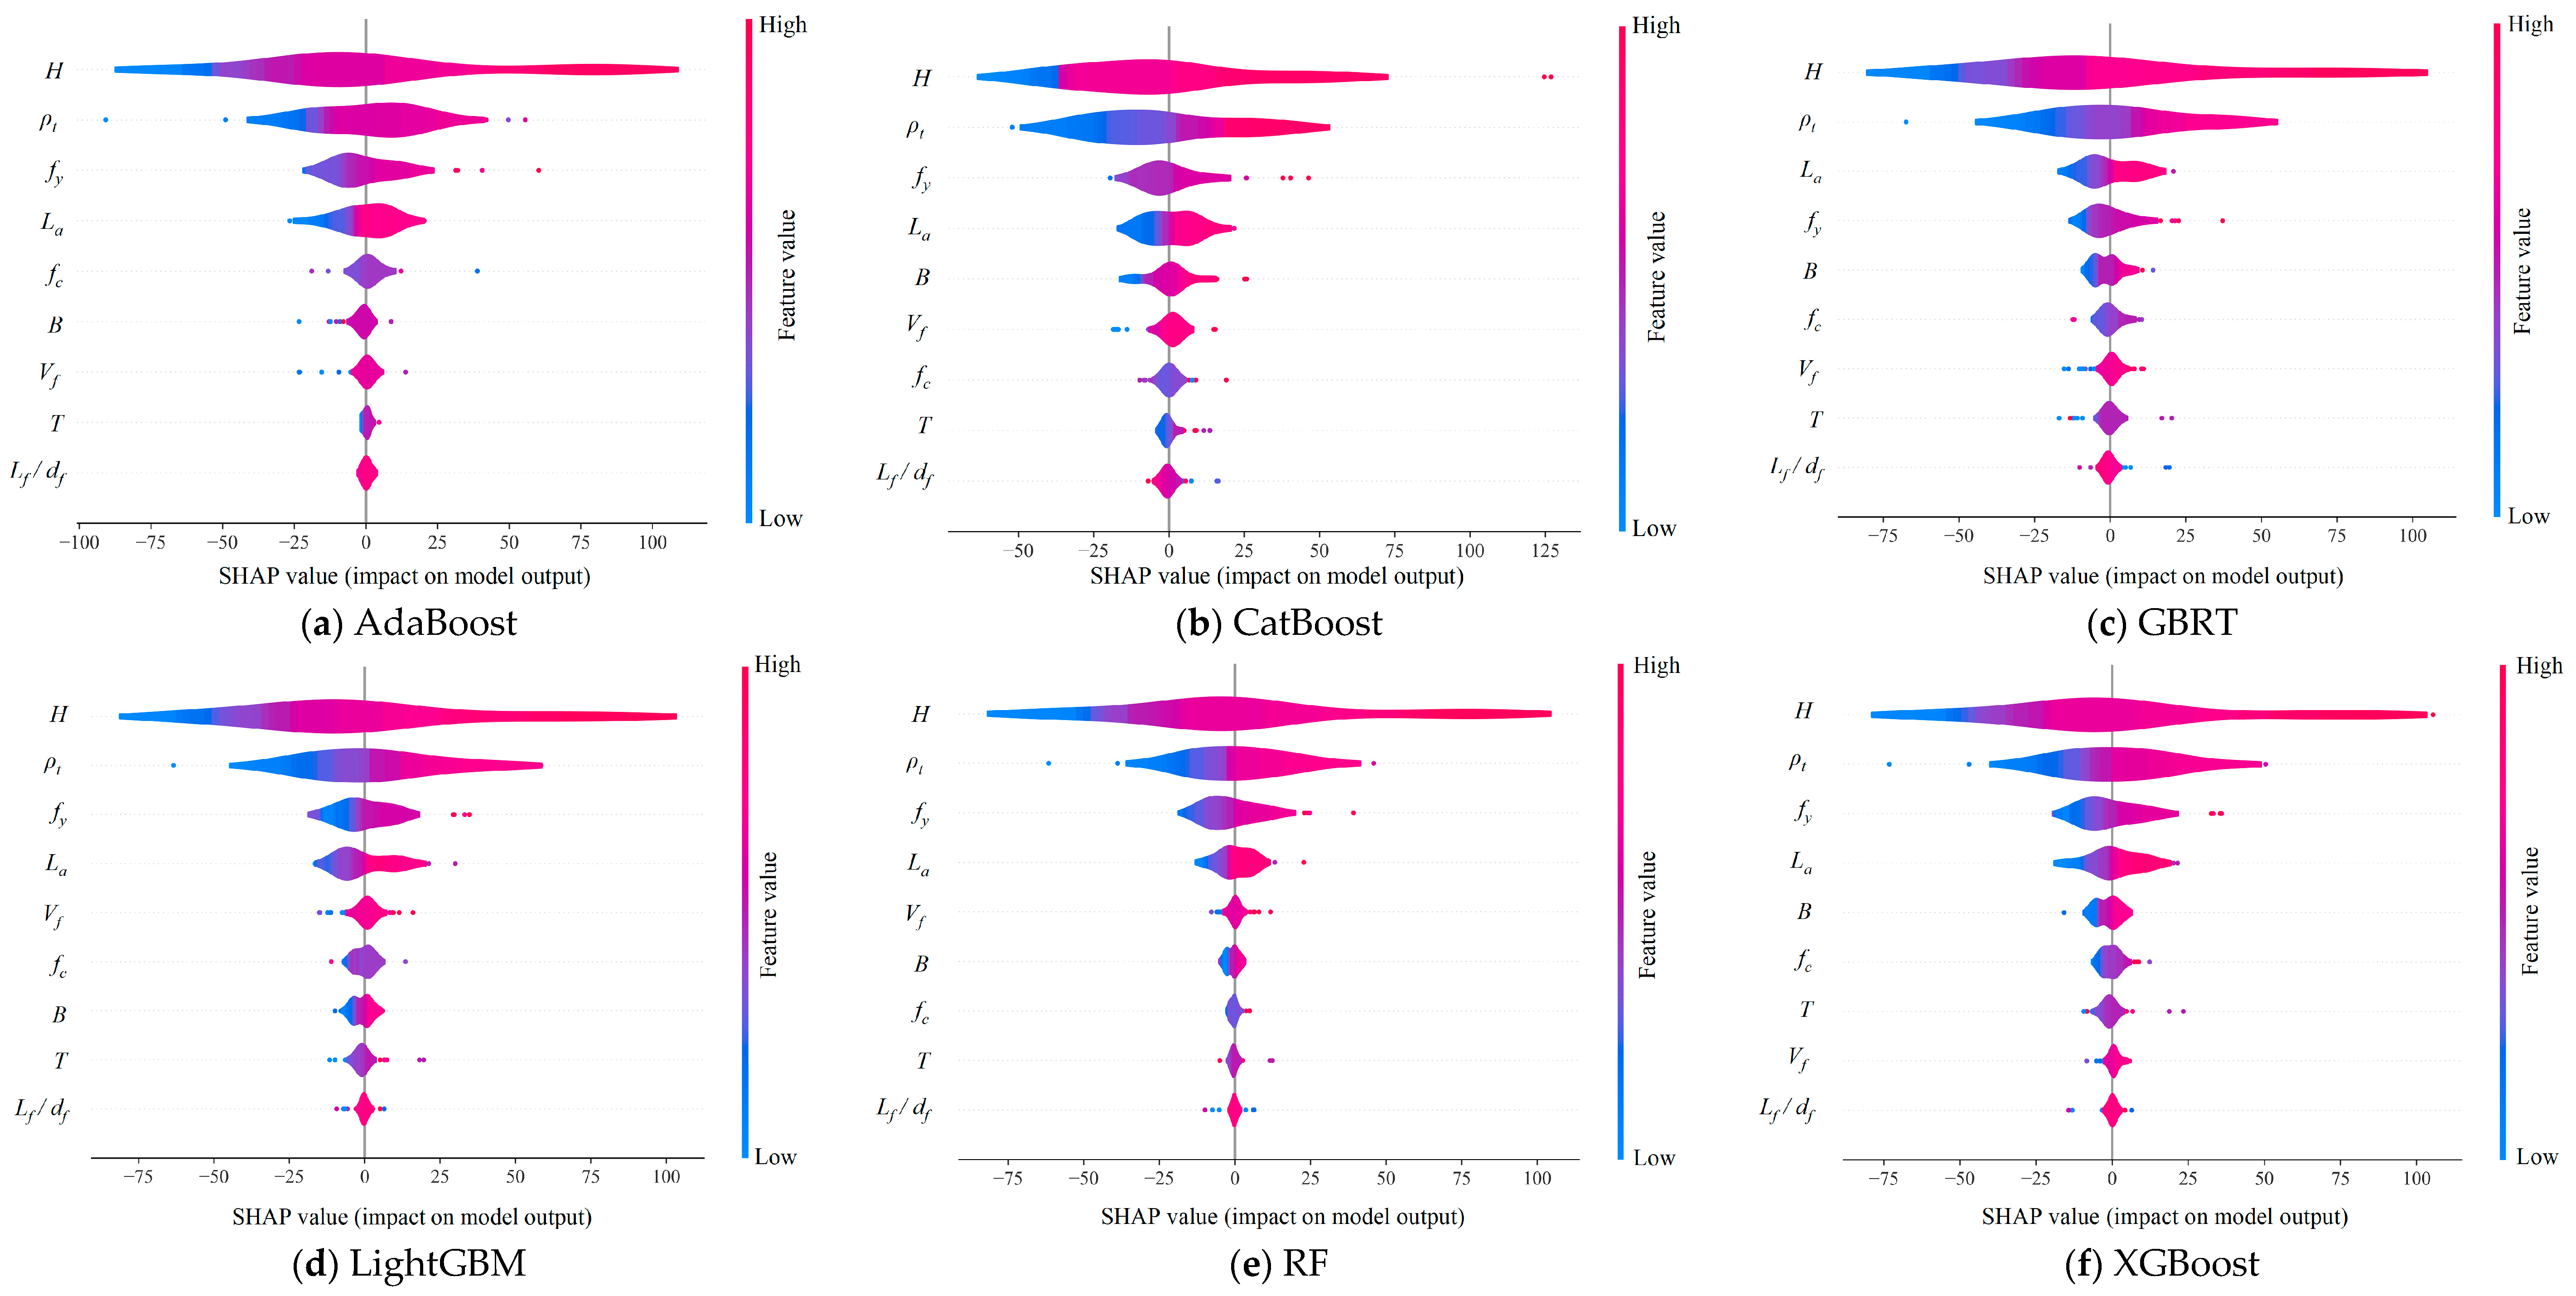
Taking advantage of the global interpretability and powerful visualization capabilities offered by SHAP, a global feature importance analysis across six ensemble learning models is conducted. To illustrate the impact and importance of each feature on model output, Figure 19 presents the SHAP values for individual ensemble learning models. In this figure, the horizontal axis displays the SHAP values, which indicates the extent to which each feature affects the prediction accuracy of the model. Meanwhile, the vertical axis enumerates the features in order of importance, with a color gradient from blue to red representing the progression from lower to higher feature values. It is evident that there are marked discrepancies in how features rank in importance and the direction in which they affect different models.
From Figure 19, the SHAP analysis for five models highlights the reinforcement ratio of longitudinal rebars, ρt, the yielding strength of reinforcement, fy, and the beam height, H, as the most important features, each of which contributes positively to the prediction results. In contrast, the GBRT model emphasizes the beam height, H, reinforcement ratio, ρt, and the length of shear span, La, as critical, demonstrating the inherent variability in feature prioritization between different models. These observations highlight the critical role of longitudinal reinforcement ratio ρt in predicting the ultimate bending moment Mu of reinforced UHPC beams, consistent with its recognized importance in the enhancement of steel rebars for reinforced concrete beams. Despite the limited tensile strength of concrete-based materials, the longitudinal reinforcements in UHPC beams overcome the limitation by providing essential tensile strength to negative bending moments. The steel reinforcement in UHPC beams effectively carries the tensile load during bending, while the lower section of the beam is longitudinally under tension.
Moreover, several features such as the beam height, H, and the beam width, B, attributes representative of the cross-sectional properties of UHPC beams, are highlighted. This emphasizes the critical role of cross-sectional characteristics in determining the flexural performance of UHPC beams. Feature B is highly significant in the CatBoost, XGBoost, and GBRT models, but it is of much less importance in the LightGBM model, where its influence is ranked remarkably lower. This discrepancy suggests that feature importance ratings vary due to the unique mechanisms that each model utilizes to process features. For the six ensemble learning models, the yielding strength of reinforcement, fy, and the length of shear span, La, show more consistency in both their importance and direction of impact. The SHAP values for these features are more concentrated, which is an indication of a more uniform influence on the prediction results. It is noteworthy that the yielding strength of reinforcement, fy, is recognized in the classical formulations, while the influence of shear span length, La, is absent in the design specifications. This discrepancy indicates that traditional empirical formulas may not fully capture the complexity associated with the prediction of the flexural capacity prediction Mu for reinforced UHPC beams.
A comparison of the results presented in Figure 19 reveals several notable conclusions. The reinforcement ratio of longitudinal rebars (ρt), the yielding strength of reinforcement (fy), and beam height (H) are consistently identified as the most influential features. The consistent importance of ρt and fy confirms their critical role in enhancing the flexural capacity of reinforced UHPC beams, particularly in resisting negative bending moments. However, variations in feature rankings across models reveal differences in how algorithms process structural parameters. For instance, GBRT attributes greater importance to shear span length (La), a feature frequently disregarded in conventional empirical formulas but recognized by machine learning models for its substantial influence. Conversely, beam width (B) is deemed crucial in CatBoost and XGBoost but is ranked less significant in LightGBM. This outcome underscores model-specific variations in feature utilization. The uniform SHAP impact of fy validates established engineering principles, while the significant influence of La suggests that traditional formulas may inadequately predict flexural behavior. These findings reinforce the advantages of data-driven models over empirical approaches, as ML models effectively identify nonlinear interactions and recognize parameters that have been overlooked. Consequently, the findings highlight the efficacy of EL models in delivering enhanced predictive reliability and interpretability. This underscores the potential for data-driven techniques in structural engineering to enhance conventional design methodologies.
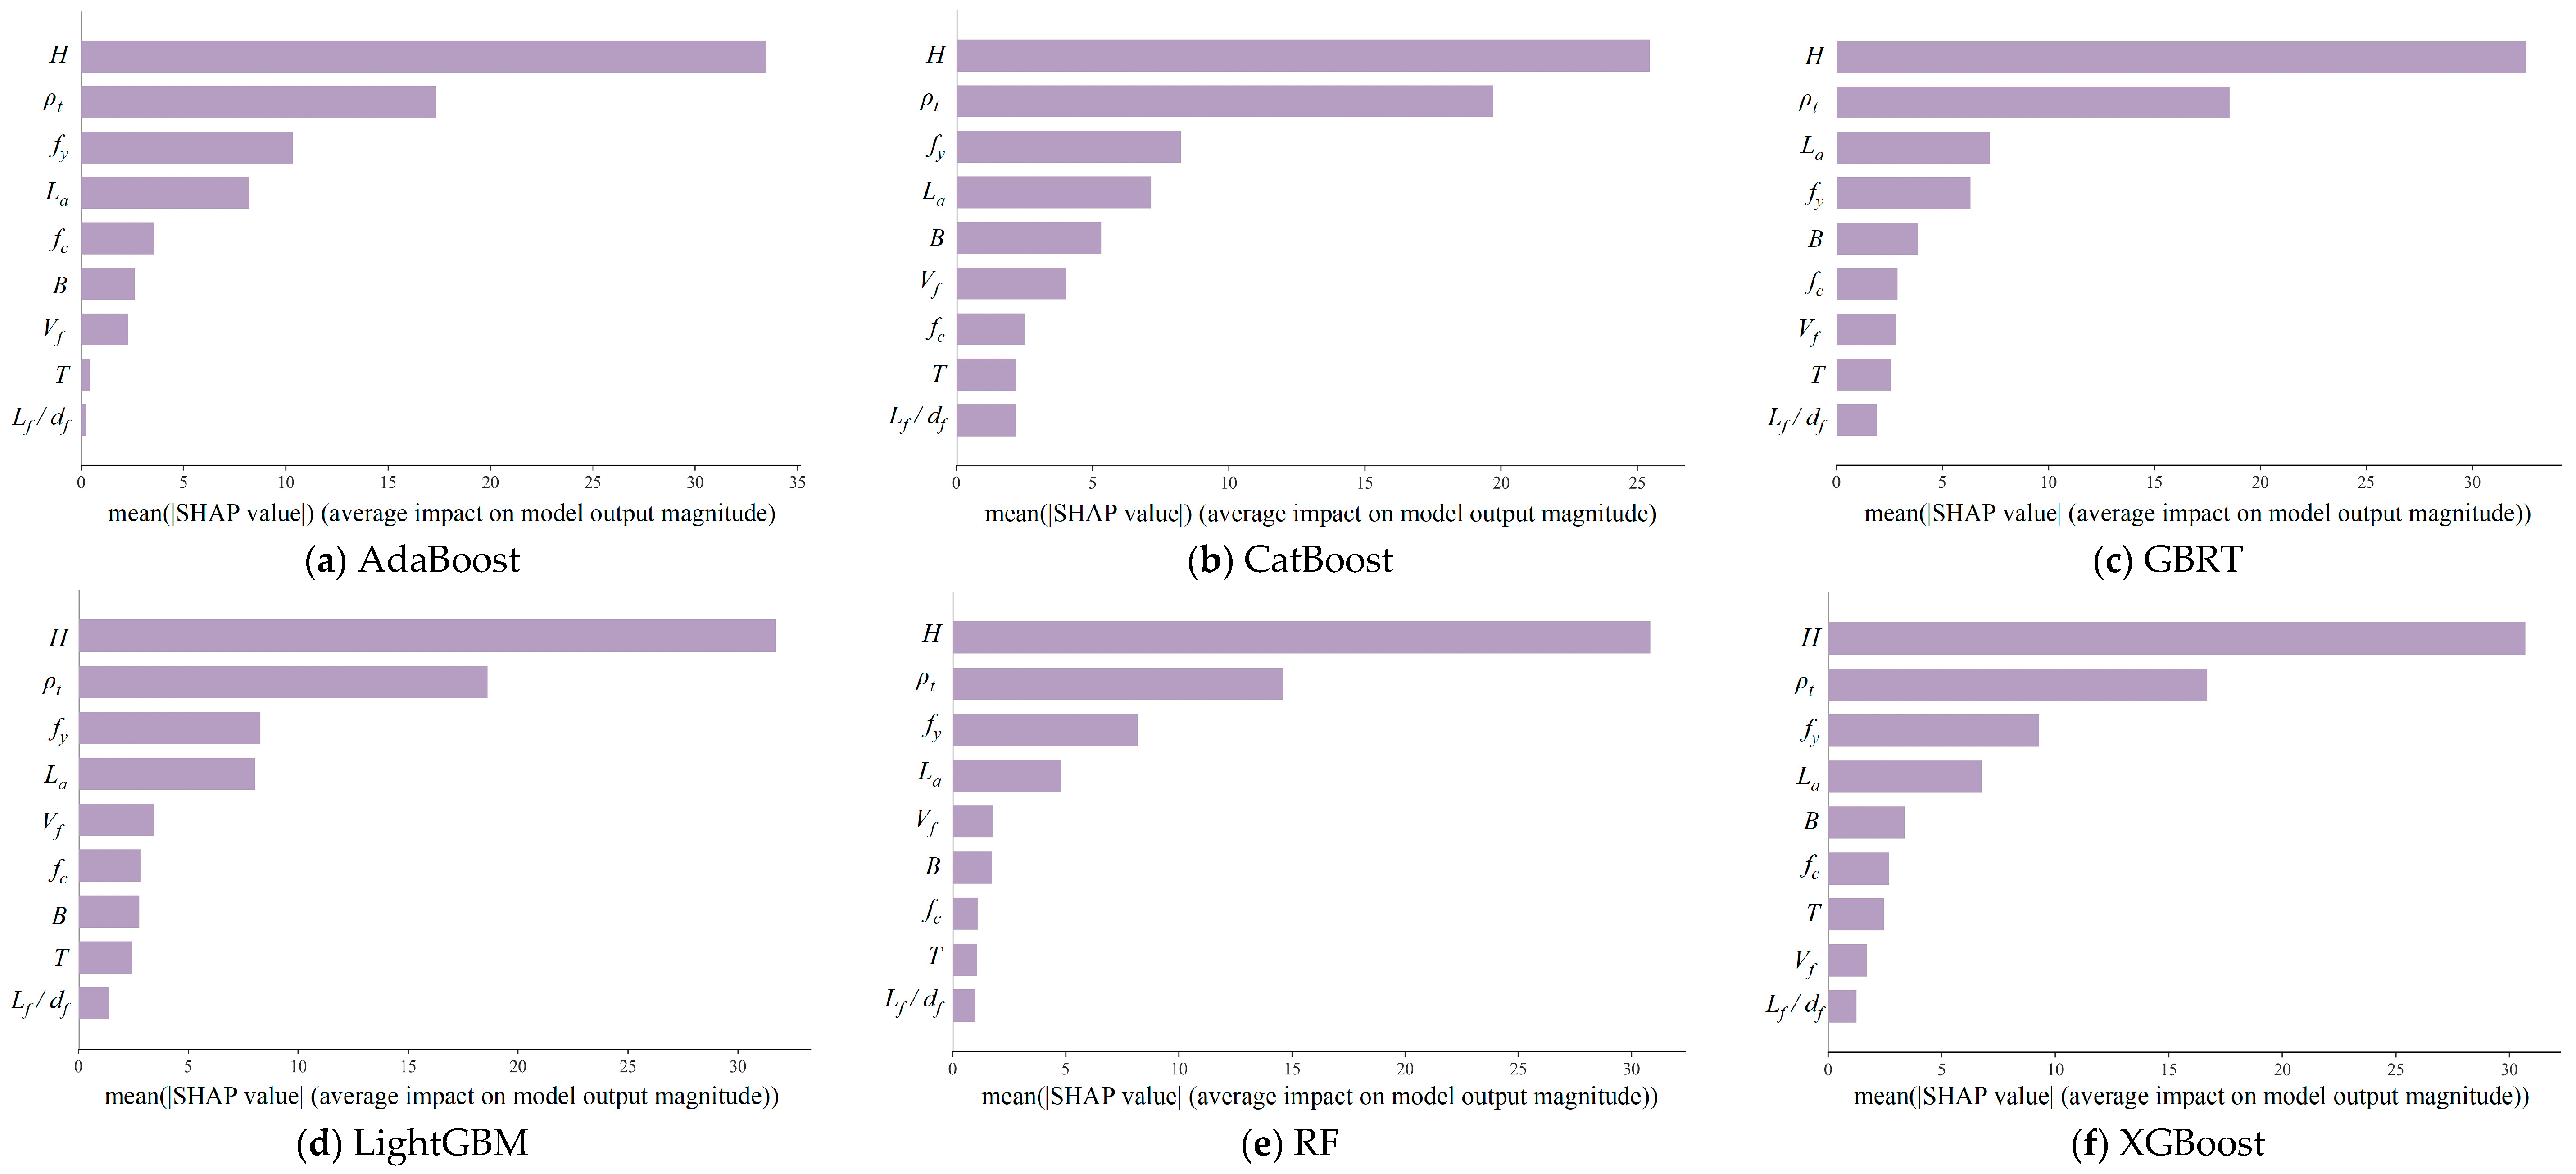
Figure 20 presents the SHAP bar plots for the six ensemble learning models, illustrating the average impact magnitude of each feature on the predictions of those models. The CatBoost model features a relatively more uniform distribution of SHAP values across all features, suggesting a balanced consideration in the decision-making process without excessive dependence on specific features. This equilibrium potentially contributes to the superior performance and stability of the model, explaining its consistent performance across various data subsets among the ten ML models analyzed. In contrast, the SHAP bar plots for other ensemble learning models reveal that some features have significantly higher SHAP values, indicating a stronger reliance on particular features, such as in the AdaBoost, RF, and XGBoost models. This dependency might result in fluctuating model performance across different data subsets.
While an interpretation of SHAP values for a single model may not fully delve into the importance and impact of features on predictions, the analysis of SHAP interpretations across multiple models provides a more comprehensive and accurate understanding of feature importance and interactions. This approach facilitates model selection, optimization, and interpretation analysis with a solid theoretical foundation and practical insights.
The purpose of key feature interpretation is to clarify the explanation of how the importance of features varies across different models and how SHAP analysis can provide deeper insights into model behavior and feature impact, thereby supporting more informed decision-making in predictive modeling.

5.2. Key Feature Interpretation

Improving the transparency and interpretability of ML models is essential for the understanding of their decision processes. To assess the influence of features in the CatBoost model, visualization techniques are applied. A uniform distribution of SHAP values across features suggests a balanced influence, which leads to a focused analysis of the top five most influential features. This approach highlights the key features that drive the predictions of the model [62]. Feature normalization, achieved by subtracting the mean and dividing by the standard deviation, is used to ensure uniform scaling, stabilize the model, and accelerate convergence.
= Χ μ σ
where X is the raw data, μ is the mean, σ is the standard deviation, and is the normalized data. The objective of this normalization process is to neutralize the scaling differences among various features, thereby enhancing the stability of the model during its training phase and allowing for faster convergence of the algorithm.
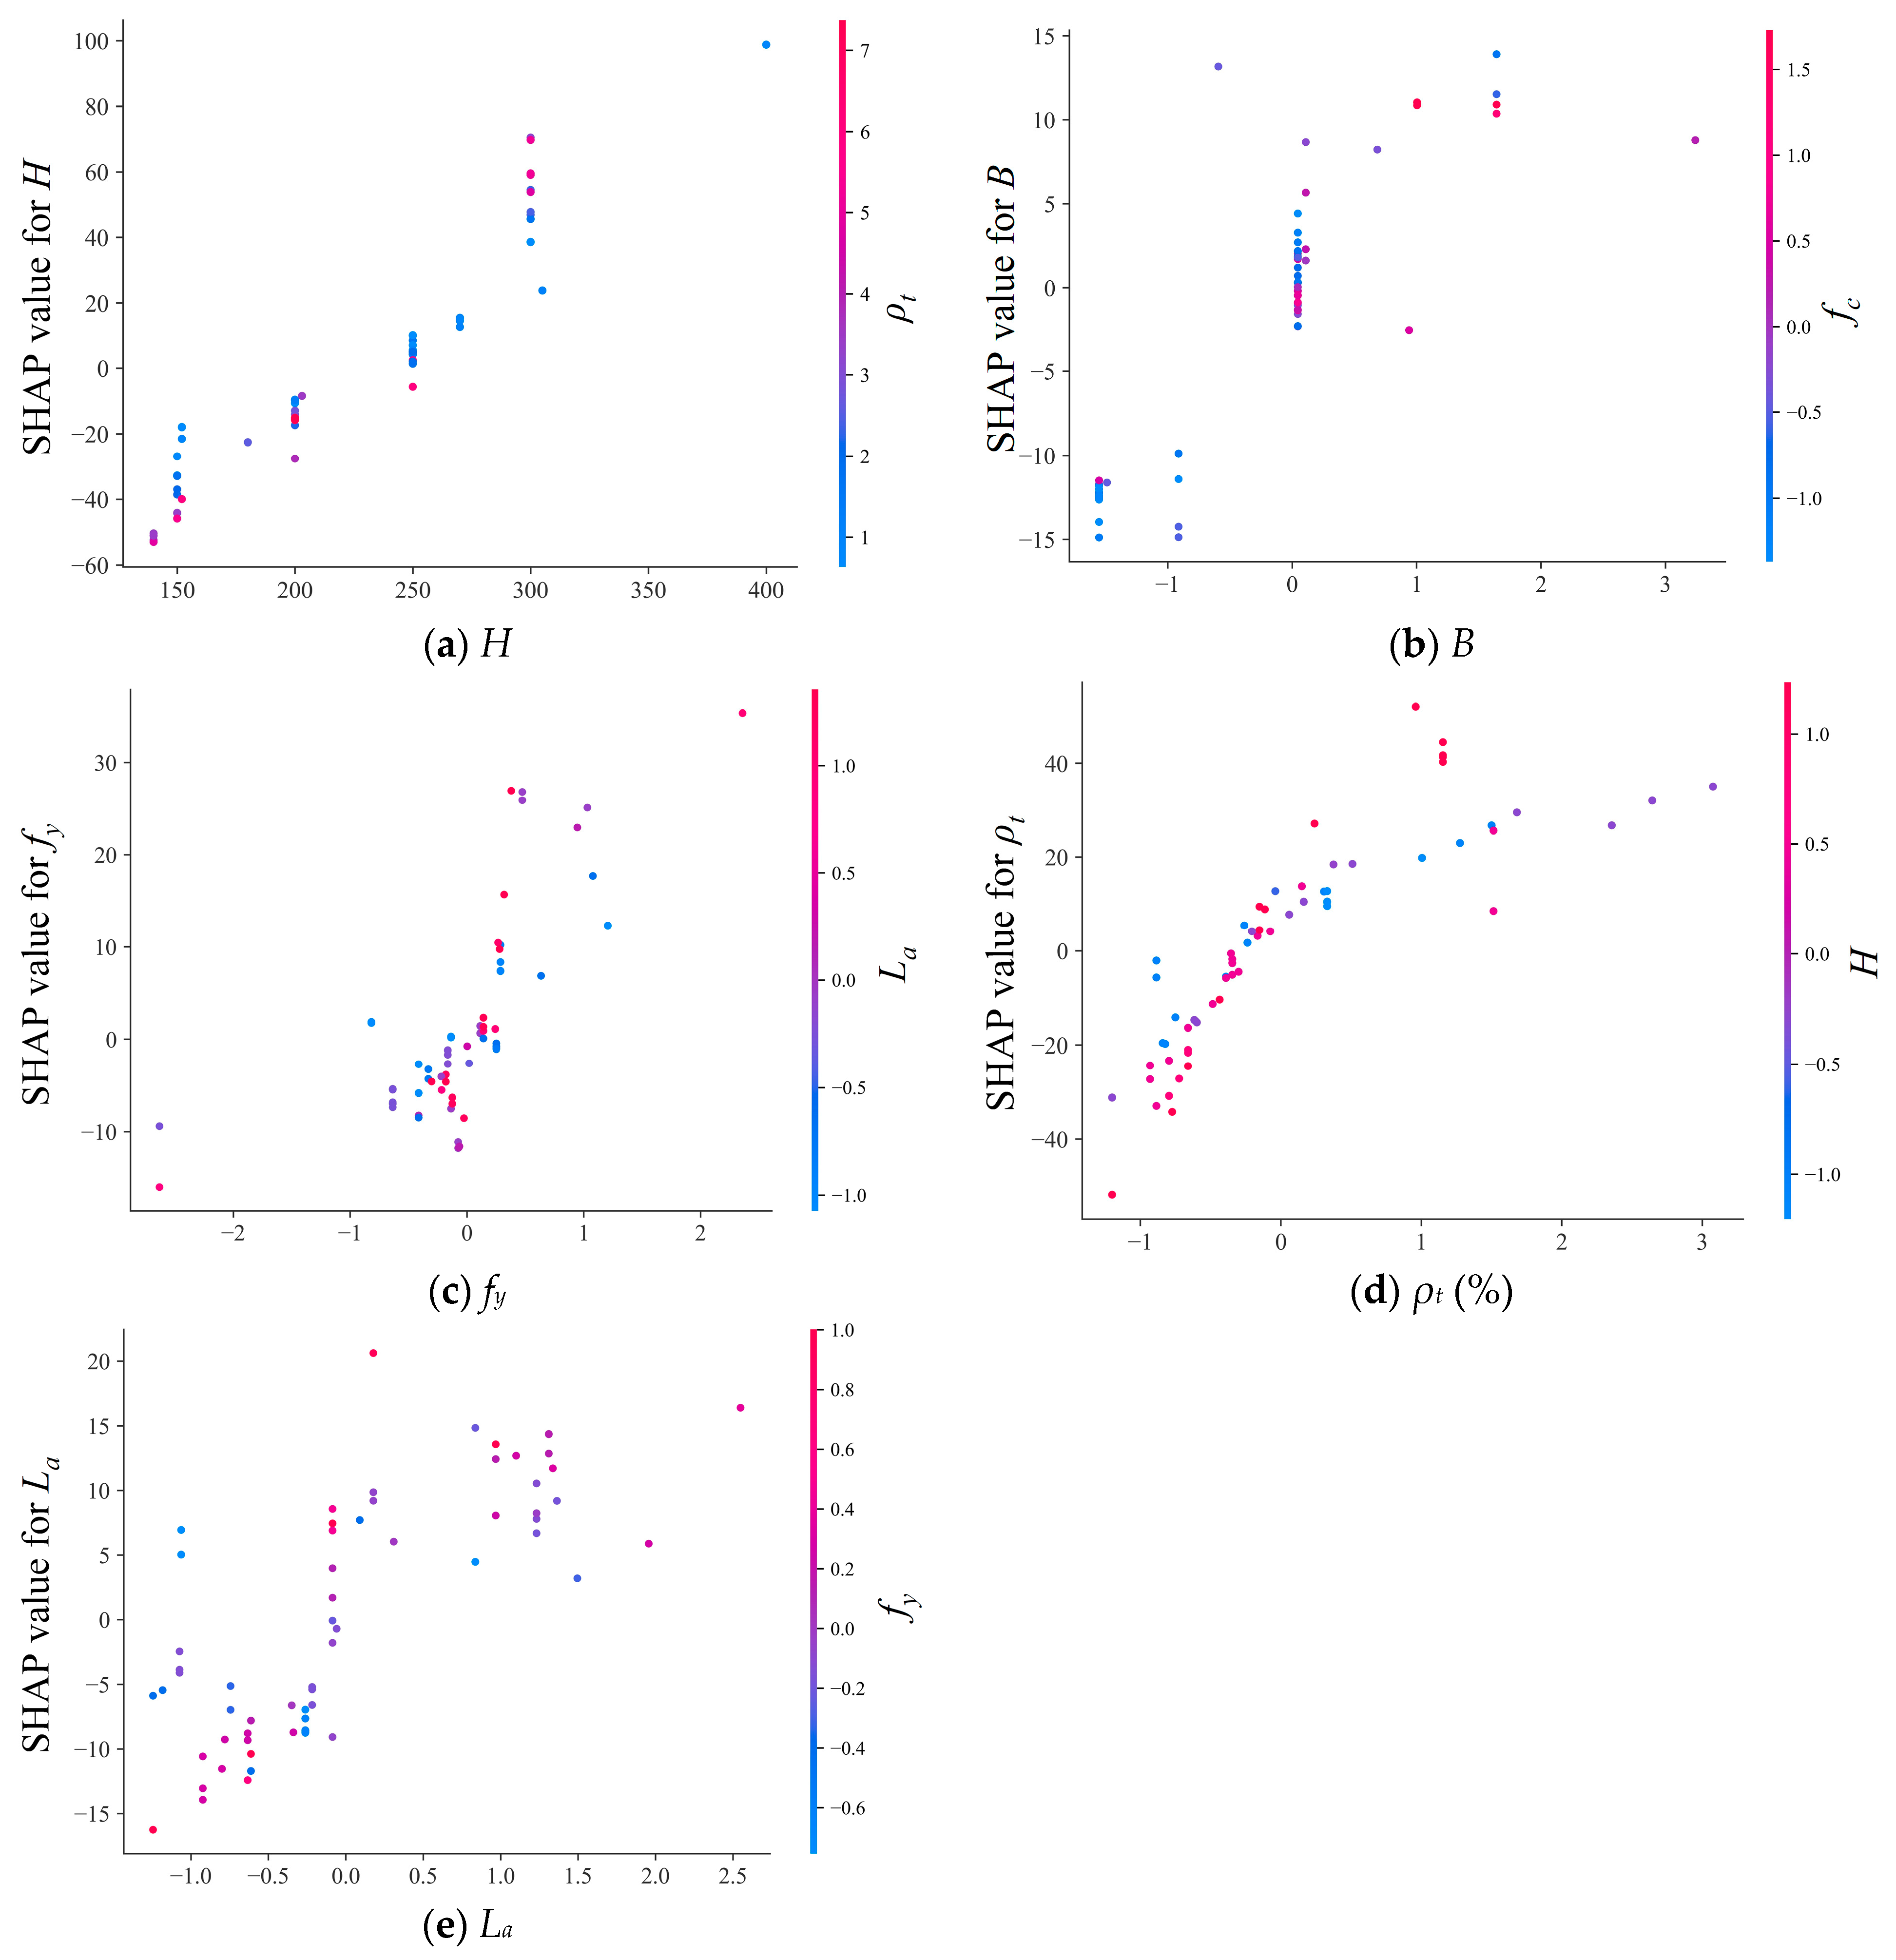
The normalized SHAP values of the CatBoost model are represented in Figure 21. The analysis of normalized SHAP value reveals a prevailing trend that increases in the eigenvalues of H, ρt, B, and La are associated with increases in the normalized SHAP values. This pattern suggests that increased eigenvalues of these features substantially increase flexural ultimate capacity Mu, as reflected in the greater SHAP values. This notable positive correlation, particularly evident for parameters of H, ρt, B, and La, highlights their considerable influence on Mu. Nevertheless, the feature fy shows a clear nonlinear relationship with flexural ultimate capacity Mu. This is attributed to the ability of the CatBoost model to capture the intricate interactions and nonlinear dynamics between the features. In the context of reinforced concrete beams, the steel reinforcement and the surrounding concrete work together to resist bending moments. The nonlinear influence of fy is partly due to the complex stress–strain behavior of concrete, in particular its tendency to crack in tension and its ultimate compressive strength limit. An observed increase in the variability of normalized SHAP values for the yielding strength of reinforcement, fy, deviating from zero, especially towards positive values, suggests a pronounced influence of reinforcement strength fy on the flexural ultimate capacity Mu in these regions. Deviating from a straightforward linear relationship, the contribution of fy in increasing the flexural ultimate capacity Mu is further evaluated by the distribution and depth of steel reinforcements within the concrete cross-section. As such, the feature of yielding strength of reinforcement, fy, especially in certain regions, deserves a more in-depth analysis.
An interesting observation from Figure 21d is the prevalence of more red dots at higher values of ρt, which suggests a simultaneous increase in H values in these areas, potentially amplifying their influence on the flexural ultimate capacity Mu. Thus, when evaluating the effect of ρt on the flexural ultimate capacity Mu, it is crucial to consider the interactions with other features. The increases in the values of La and H are significantly beneficial to the flexural ultimate capacity Mu, while the effect of fy is nonlinear and more pronounced in certain regions. Furthermore, the interaction of H with high values of ρt deserves special attention. These findings allow for a deeper understanding of how each feature contributes to Mu, thus laying a foundation for more accurate model optimization and feature engineering strategies.

6. Conclusions

A comprehensive review of existing literature is conducted to initially establish a database of flexural ultimate capacity for reinforced UHPC comprising the results of measurements of 339 UHPC-based specimens with varying design parameters from 56 different experimental investigations. Ten ML algorithms, namely ANN, SVR, K-NN, CART, RF, AdaBoost, GBRT, LightGBM, CatBoost, and XGBoost, are then employed to develop optimized models for predicting the flexural ultimate capacity Mu of reinforced UHPC specimens. Four statistical indicators of model performance are utilized to evaluate the prediction results of ML-based models presented. Moreover, the performances of ML-based models with different data subset sizes are analyzed to thoroughly assess the qualities of the models and database employed. A comparison analysis is conducted between the calculated values from the several existing empirical formulas and the predicted values of the CatBoost model. The SHAP method is finally used to interpret the ML models, validating their reliability and examining the effect of each feature on the prediction results. The following conclusions can be drawn.
  • For model training, CART, RF, XGBoost, CatBoost, AdaBoost, GBRT, and LightGBM show superior model performances, characterized by higher R2 values and lower values of RMSE, MAE, and MAPE compared to other ML-based models. The top three models for predicting the flexural ultimate capacity of reinforced UHPC beams are ranked in the order of GBRT > CatBoost > LightGBM. On the testing set, the GBRT model demonstrates the best prediction results with an R2 of 0.95, RMSE of 13.3, MAE of 9.3, and MAPE of 18%. Conversely, the ANN model is found to perform the least effectively. Overall, the developed ML models accurately predict the flexural ultimate capacity Mu of reinforced UHPC beams after optimization, with ensemble learning models typically providing a higher level of accuracy than traditional individual ML models.
  • An in-depth database subset analysis reveals that the most efficient data subset configuration for ensemble learning models is 75% for the training set and the remaining 25% for the testing set. For traditional ML-based models, the optimal data subset configuration for the data distribution percentages of the training set and testing set are 80% and 20%, respectively. This underscores the significant impact of the database division ratios of training-to-testing sets on the effectiveness of performance prediction for the ML models. Among the ensemble learning models, CatBoost and GBRT show remarkable consistencies with a varying data subset configuration, while the CatBoost model presents a distinguished performance prediction using a superior division strategy of data subsets. These insights highlight the importance of proper data acquisition in improving model performance prediction, providing crucial guidance for future model selection and optimization. The effects of database subset distribution on the performance prediction and model stability should be properly considered during the model selection and optimization process to ensure optimal model functionality in real-world applications.
  • The CatBoost model demonstrates superior performance in terms of predictive accuracy, as evidenced by its highest R2 value of 0.993, lowest RMSE value of 4.396, lowest MAE value of 2.055, and lowest MAPE value of 3.704%. This substantial improvement in performance prediction of the flexural capacity for reinforced UHPC beams is particularly notable when compared to existing empirical methods. Notably, the model’s enhanced applicability and adaptability enable it to handle complex feature interactions, leading to highly reliable results. This renders the EL model a potentially invaluable tool for practical engineering applications. The employment of data-driven methodologies by the CatBoost model presents a promising alternative to existing empirical methods, thereby paving the way for enhanced accuracy and efficiency in the field of UHPC structural design.
  • A SHAP-based feature importance analysis indicates that ρt, La, and H are the most critical features for the determination of the flexural ultimate capacity Mu of reinforced UHPC beams. This finding is consistent across ML models including RF, XGBoost, CatBoost, GBRT, AdaBoost, and LightGBM. In contrast, the aspect ratio of fiber length-to-diameter (Lf/df) is the least important characteristic. The CatBoost model displays a more uniform distribution of SHAP values for all parameters, suggesting a balanced decision-making process and contributing to its superior and stable model performance. Several ensemble learning models such as AdaBoost, RF, and XGBoost show higher SHAP values for certain features, indicating a greater dependence on those features and potentially leading to more variable performance for different subsets of the database.
  • The analysis of normalized SHAP values reveals a prevailing trend that increases in the eigenvalues of B, ρt, La, and H are associated with an increase in normalized SHAP values. This notable positive correlation highlights their substantial influence on predicting the flexural ultimate capacity Mu of reinforced UHPC beams. Nevertheless, the yield strength of longitudinal reinforcement, fy, shows a clear nonlinear relationship with ultimate capacity Mu. These findings allow for a deeper understanding of how each feature contributes to the prediction of the flexural ultimate capacity Mu of reinforced UHPC beams, thus laying a foundation for more accurate model optimization and feature engineering strategies.
The present study introduces several EL models (AdaBoost, CatBoost, GBRT, LightGBM, and XGBoost) for the prediction of the flexural capacity of reinforced UHPC beams, with a view to providing a more accurate and efficient tool for practical engineering applications. The SHAP method is employed to evaluate the impact of critical factors such as the longitudinal reinforcement ratio, yield strength, beam height, and shear span length, on the ultimate bending moment. The findings of this study could prove instrumental in empowering structural engineers to swiftly evaluate flexural capacity, optimize structural designs, minimize material consumption, enhance structural safety and efficiency, and thus foster sustainable growth for UHPC applications. In the future, there is a potential for the development of the present method into a graphical user-friendly interface (GUI), with subsequent integration with current design codes and engineering software (such as MIDAS, ABAQUS, and SAP2000). This would create an intelligent platform for structural design and evaluation, and thus further the adoption and standardization of UHPC technology.

Author Contributions

Conceptualization, methodology, funding acquisition, Z.Z.; investigation, visualization, writing—original draft, X.Z.; supervision, writing—review and editing, P.Z.; software, data curation, Z.L.; investigation, formal analysis, Y.W. All authors have read and agreed to the published version of the manuscript.

Funding

This research was funded by the Natural Science Foundation of Hunan Province, China (Grant No. 2023JJ30216), the Research Foundation of Education Department of Hunan Province, China (Grant No. 23B0576), the National Natural Science Foundation of China (Grant No. 51808212), and Natural Science Foundation of Chongqing, China (CSTB2024NSCQ-MSX1206), respectively. The authors would like to express their gratitude for this financial support.

Data Availability Statement

Data are contained within the article.

Conflicts of Interest

The authors declare no conflicts of interest.

Appendix A

Table A1. Summary of the flexural tests on UHPC beams in the literature.
YearRef.Specimen NumberDesign ParametersMoment CapacityYearRef.Specimen NumberDesign ParametersMoment Capacity Mu
2010[18]10ρt/fc83.3~131.72019[63]5Vf/fc118~154.5
2011[64]7H/Vf/fy/ρt26.6~222.92019[65]1ρt38.5
2011[66]5ρt/fy11.1~1012019[43]6ρt/Vf/fy/fc16.7~33.9
2012[67]10ρt/fy32.5~1442019[68]9ρt/Vf/T/fc/(Lf/df)40~88.3
2012[69]5ρt/fc27.6~100.82019[70]4ρt/fc233.6~323.2
2013[71]4Vf/fc23.7~29.12020[72]9ρt/Vf/fc53.8~116
2013[73]4ρt/(Lf/df)122~1782020[74]6ρt/Vf11.2~21.5
2013[75]1La320.42020[76]3Vf/fc126~152.5
2014[17]2ρt8.1~9.12020[77]4Vf/fc102~120
2015[78]4ρt/fy48.1~101.62020[79]15Vf/fy/ρt/fc/La7~22.1
2015[46]5ρt/(Lf/df)/T39.3~56.12020[80]4Vf/fc35.7~38.7
2015[81]5ρt90.6~171.62021[82]8ρt/Vf/fy/fc37.1~314.5
2016[21]4ρt72.5~1312021[83]2ρt58.1~61.9
2016[84]1ρt3222021[42]18ρt9.1~80.2
2017[85]6Vf/fc15.6~19.12021[86]12ρt16.5~50.7
2017[19]4ρt/La33~118.32021[87]6Vf/fy/T/La114~331.7
2017[88]2ρt/fy70.4~117.82021[89]10ρt/fc/La22.2~30.8
2017[90]6ρt/fc13~30.12021[91]5ρt28.6~82.5
2018[92]8ρt/fy43.3~1352021[93]13ρt/Vf/T/fc/fy50.8~98.7
2018[20]8ρt/Vf/T/(Lf/df)37.5~134.42022[6]8ρt/T34.2~125.1
2018[13]4ρt/H6.1~12.52022[94]4ρt/fy40.1~58.5
2018[45]2ρt67.8~88.42022[95]4ρt/fy44.1~62
2018[96]2Vf148.9~174.92022[41]4ρt/fy79.9~170
2018[44]14ρt/fc/fy11.4~69.82023[97]5fy/ρt69~123.5
2018[98]11ρt/Vf/fy/fc/La125.5~238.32023[15]5ρt/Vf/fy/fc104~171.5
2018[99]13ρt29.9~122.22023[16]6ρt/Vf/fc52.8~143.4
2019[12]5ρt5.6~40.92023[100]2ρt95.1~111.6
2019[101]4ρt23.8~51.22023[102]5Vf/fc/ρt110.6~176.5

References

  1. Naaman, A.E.; Wille, K. The path to ultra-high performance fiber reinforced concrete (UHP-FRC): Five decades of progress. In Proceedings of the Hipermat 2012 3rd International Symposium on UHPC and Nanotechnology for High Performance Construction Materals (HiPerMat 2012), Kassel, Germany, 7–9 March 2012; Volume 19, pp. 3–15. Available online: https://www.uni-kassel.de/ub/publizieren/kassel-university-press/katalog?h=9783862192649 (accessed on 14 March 2025).
  2. Richard, P.; Cheyrezy, M. Composition of reactive powder concretes. Cem. Concr. Res. 1995, 25, 1501–1511. [Google Scholar] [CrossRef]
  3. Russell, H.G.; Graybeal, B.A. Ultra-High Performance Concrete: A State-of-the-Art Report for the Bridge Community; Federal Highway Administration: Washington, DC, USA, 2013.
  4. Voo, Y.; Foster, S.; Voo, C. Ultrahigh-performance concrete segmental bridge technology: Toward sustainable bridge construction. Int. J. Concr. Struct. Mater. 2014, 20, 8. [Google Scholar] [CrossRef]
  5. Yoo, D.-Y.; Yoon, Y.-S. A review on structural behavior, design, and application of ultra-high-performance fiber-reinforced concrete. Int. J. Concr. Struct. Mater. 2016, 10, 125–142. [Google Scholar] [CrossRef]
  6. Qiu, M.; Hu, Y.; Shao, X.; Zhu, Y.; Li, P.; Li, X. Experimental investigation on flexural and ductile behaviors of rebar-reinforced ultra-high-performance concrete beams. Struct. Concr. 2022, 23, 1533–1554. [Google Scholar] [CrossRef]
  7. Akeed, M.H.; Qaidi, S.; Ahmed, H.U.; Faraj, R.H.; Mohammed, A.S.; Emad, W.; Tayeh, B.A.; Azevedo, A.R.G. Ultra-high-performance fiber-reinforced concrete. Part I: Developments, principles, raw materials. Case Stud. Constr. Mater. 2022, 17, e01290. [Google Scholar] [CrossRef]
  8. Du, J.; Meng, W.; Khayat, K.H.; Bao, Y.; Guo, P.; Lyu, Z.; Abu-obeidah, A.; Nassif, H.; Wang, H. New development of ultra-high-performance concrete (UHPC). Compos. Part B Eng. 2021, 224, 109220. [Google Scholar] [CrossRef]
  9. Graybeal, B.A. Compressive behavior of ultra-high-performance fiber-reinforced concrete. ACI Mater. J. 2007, 104, 2. [Google Scholar] [CrossRef]
  10. Habel, K.; Denarie, E.; Brühwiler, E. Experimental investigation of composite ultra-high-performance fiber-reinforced concrete and conventional concrete members. ACI Struct. J. 2007, 104, 93–101. [Google Scholar]
  11. Graybeal, B.A.; Baby, F. Development of direct tension test method for ultra-high-performance fiber-reinforced concrete. ACI Mater. J. 2013, 110, 177–186. [Google Scholar]
  12. Pourbaba, M.; Sadaghian, H.; Mirmiran, A. A comparative study of flexural and shear behavior of ultra-high-performance fiber-reinforced concrete beams. Adv. Struct. Eng. 2019, 22, 1727–1738. [Google Scholar] [CrossRef]
  13. Shafieifar, M.; Farzad, M.; Azizinamini, A. A comparison of existing analytical methods to predict the flexural capacity of ultra high performance concrete (UHPC) beams. Constr. Build. Mater. 2018, 172, 10–18. [Google Scholar] [CrossRef]
  14. Yang, I.H.; Joh, C.; Kim, B.-S. Structural behavior of ultra high performance concrete beams subjected to bending. Eng. Struct. 2010, 32, 3478–3487. [Google Scholar] [CrossRef]
  15. Zhang, Y.; Zhu, Y.; Qiu, J.; Hou, C.; Huang, J. Impact of reinforcing ratio and fiber volume on flexural hardening behavior of steel reinforced UHPC beams. Eng. Struct. 2023, 285, 116067. [Google Scholar] [CrossRef]
  16. Guo, Y.-Q.; Wang, J.-Y. Flexural behavior of high-strength steel bar reinforced UHPC beams with considering restrained shrinkage. Constr. Build. Mater. 2023, 409, 133802. [Google Scholar] [CrossRef]
  17. Kamal, M.M.; Safan, M.A.; Etman, Z.A.; Salama, R.A. Behavior and strength of beams cast with ultra high strength concrete containing different types of fibers. HBRC J. 2014, 10, 55–63. [Google Scholar] [CrossRef]
  18. Sun, X.; Ma, Y.; Jiang, F.; Fan, X.; Wu, H. Bending resistance mechanism of prestressed ultra-high performance concrete-reinforced concrete beam based on a full-scale experiment. Adv. Struct. Eng. 2024, 27, 1746–1761. [Google Scholar] [CrossRef]
  19. Singh, M.; Sheikh, A.H.; Mohamed Ali, M.S.; Visintin, P.; Griffith, M.C. Experimental and numerical study of the flexural behaviour of ultra-high performance fibre reinforced concrete beams. Constr. Build. Mater. 2017, 138, 12–25. [Google Scholar] [CrossRef]
  20. Hasgul, U.; Turker, K.; Birol, T.; Yavas, A. Flexural behavior of ultra-high-performance fiber reinforced concrete beams with low and high reinforcement ratios. Struct. Concr. 2018, 19, 1577–1590. [Google Scholar] [CrossRef]
  21. Yoo, D.-Y.; Banthia, N.; Yoon, Y.-S. Experimental and numerical study on flexural behavior of ultra-high-performance fiber-reinforced concrete beams with low reinforcement ratios. Can. J. Civ. Eng. 2017, 44, 18–28. [Google Scholar] [CrossRef]
  22. Katlav, M.; Turk, K.; Turgut, P. Research into effect of hybrid steel fibers on the V-shaped RC folded plate thickness. Structures 2022, 44, 665–679. [Google Scholar] [CrossRef]
  23. ACI Committee. Building Code Requirements for Structural Concrete (ACI 318-14) [and] Commentary on Building Code Requirements for Structural Concrete (ACI 318R-14); American Concrete Institute: Farmington Hills, MI, USA, 2014; ISBN 978-0-87031-930-3. [Google Scholar]
  24. Farouk, A.I.B.; Zhu, J. Prediction of interface bond strength between ultra-high-performance concrete (UHPC) and normal strength concrete (NSC) using a machine learning approach. Arab. J. Sci. Eng. 2022, 47, 5337–5363. [Google Scholar] [CrossRef]
  25. Aaleti, S.; Petersen, B.; Sritharan, S. Design Guide for Precast UHPC Waffle Deck Panel System, Including Connections; Federal Highway Administration, US Department of Transportation: Washington, DC, USA, 2013.
  26. ACI Committee 544. Design considerations for steel fiber reinforced concrete. ACI Struct. J. 1988, 85, 563–579. [Google Scholar] [CrossRef]
  27. Salehi, H.; Burgueño, R. Emerging artificial intelligence methods in structural engineering. Eng. Struct. 2018, 171, 170–189. [Google Scholar] [CrossRef]
  28. Sun, C.; Wang, K.; Liu, Q.; Wang, P.; Pan, F. Machine-learning-based comprehensive properties prediction and mixture design optimization of ultra-high-performance concrete. Sustainability 2023, 15, 15338. [Google Scholar] [CrossRef]
  29. Fu, B.; Feng, D.-C. A machine learning-based time-dependent shear strength model for corroded reinforced concrete beams. J. Build. Eng. 2021, 36, 102118. [Google Scholar] [CrossRef]
  30. Cakiroglu, C.; Aydın, Y.; Bekdaş, G.; Geem, Z.W. Interpretable predictive modelling of basalt fiber reinforced concrete splitting tensile strength using ensemble machine learning methods and SHAP. Materials 2023, 16, 4578. [Google Scholar] [CrossRef]
  31. Sun, G.; Du, M.; Shan, B.; Shi, J.; Qu, Y. Ultra-high performance concrete design method based on machine learning model and steel slag powder. Case Stud. Constr. Mater. 2022, 17, e01682. [Google Scholar] [CrossRef]
  32. Feng, D.-C.; Wang, W.-J.; Mangalathu, S.; Hu, G.; Wu, T. Implementing ensemble learning methods to predict the shear strength of RC deep beams with/without web reinforcements. Eng. Struct. 2021, 235, 111979. [Google Scholar] [CrossRef]
  33. Solhmirzaei, R.; Salehi, H.; Kodur, V. Predicting flexural capacity of ultrahigh-performance concrete beams: Machine learning–based approach. J. Struct. Eng. 2022, 148, 04022031. [Google Scholar] [CrossRef]
  34. Ergen, F.; Katlav, M. Machine and deep learning-based prediction of flexural moment capacity of ultra-high performance concrete beams with/out steel fiber. Asian J. Civ. Eng. 2024, 25, 4541–4562. [Google Scholar] [CrossRef]
  35. Xu, J.-G.; Chen, S.-Z.; Xu, W.-J.; Shen, Z.-S. Concrete-to-concrete interface shear strength prediction based on explainable extreme gradient boosting approach. Constr. Build. Mater. 2021, 308, 125088. [Google Scholar] [CrossRef]
  36. Ye, M.; Li, L.; Yoo, D.-Y.; Li, H.; Zhou, C.; Shao, X. Prediction of shear strength in UHPC beams using machine learning-based models and SHAP interpretation. Constr. Build. Mater. 2023, 408, 133752. [Google Scholar] [CrossRef]
  37. Association Francaise de Normalisation. National Addition to Eurocode 2-Design of Concrete Structures: Specific Rules for Ultra-High Performance Fibre-Reinforced Concrete (UHPFRC); Association Francaise de Normalisation: Paris, France, 2016. [Google Scholar]
  38. Epfl, M. Recommendation: Ultra-High Performance Fibre Reinforced Cement-Based Composites (UHPFRC); EPFL: Lausanne, Switzerland, 2016. [Google Scholar]
  39. Li, L. Mechanical Behavior and Design Method for Reactive Powder Concrete Beams. Ph.D. Dissertation, Harbin Institute of Technology, Harbin, China, 2010. [Google Scholar]
  40. Salih, A.; Raisi, Z.; Boscolo Galazzo, I.; Radeva, P.; Petersen, S.; Lekadir, K.; Menegaz, G. A perspective on explainable artificial intelligence methods: SHAP and LIME. Adv. Intell. Syst. 2024, 7, 2400304. [Google Scholar] [CrossRef]
  41. Gu, J.-B.; Wang, J.-Y.; Lu, W. An experimental assessment of ultra high performance concrete beam reinforced with negative Poisson’s ratio (NPR) steel rebar. Constr. Build. Mater. 2022, 327, 127042. [Google Scholar] [CrossRef]
  42. Huang, J.; He, Z.; Khan, M.B.E.; Zheng, X.; Luo, Z. Flexural behaviour and evaluation of ultra-high-performance fibre reinforced concrete beams cured at room temperature. Sci. Rep. 2021, 11, 19069. [Google Scholar] [CrossRef]
  43. Yin, H.; Shirai, K.; Teo, W. Finite element modelling to predict the flexural behaviour of ultra-high performance concrete members. Eng. Struct. 2019, 183, 741–755. [Google Scholar] [CrossRef]
  44. Pourbaba, M.; Joghataie, A.; Mirmiran, A. Shear behavior of ultra-high performance concrete. Constr. Build. Mater. 2018, 183, 554–564. [Google Scholar] [CrossRef]
  45. Kodur, V.; Solhmirzaei, R.; Agrawal, A.; Aziz, E.M.; Soroushian, P. Analysis of flexural and shear resistance of ultra high performance fiber reinforced concrete beams without stirrups. Eng. Struct. 2018, 174, 873–884. [Google Scholar] [CrossRef]
  46. Yoo, D.-Y.; Yoon, Y.-S. Structural performance of ultra-high-performance concrete beams with different steel fibers. Eng. Struct. 2015, 102, 409–423. [Google Scholar] [CrossRef]
  47. Thai, H.-T. Machine learning for structural engineering: A state-of-the-art review. Structures 2022, 38, 448–491. [Google Scholar] [CrossRef]
  48. Boser, B.E.; Guyon, I.M.; Vapnik, V.N. A training algorithm for optimal margin classifiers. In Proceedings of the Fifth Annual Workshop on Computational Learning Theory, Pittsburgh, PA, USA, 27–29 July 1992; pp. 144–152. [Google Scholar]
  49. Fix, E.; Hodges, J.L. Discriminatory Analysis. Nonparametric Discrimination: Small Sample Performance. Report A; Air University, USAF School of Aviation Medecine: Montgomery, AL, USA, 1952; Volume 193008. [Google Scholar]
  50. Breiman, L.; Friedman, J.; Olshen, R.; Storne, C. Classification and Regression Trees; Wadsworth International Group: Belmont, CA, USA, 1984. [Google Scholar]
  51. Zhou, Z.-H. Ensemble Methods: Foundations and Algorithms; CRC Press: Boca Raton, FL, USA, 2012. [Google Scholar]
  52. Freund, Y.; Schapire, R.E. A decision-theoretic generalization of on-line learning and an application to boosting. J. Comput. Syst. Sci. 1997, 55, 119–139. [Google Scholar] [CrossRef]
  53. Breiman, L. Random forests. Mach. Learn. 2001, 45, 5–32. [Google Scholar] [CrossRef]
  54. Friedman, J.H. Greedy function approximation: A gradient boosting machine. Ann. Stat. 2001, 29, 1189–1232. [Google Scholar] [CrossRef]
  55. Chen, T.; Guestrin, C. XGBoost: A scalable tree boosting system. In Proceedings of the 22nd ACM SIGKDD International Conference on Knowledge Discovery and Data Mining, San Francisco, CA, USA, 13–17 August 2016; pp. 785–794. [Google Scholar]
  56. Ke, G.; Meng, Q.; Finley, T.; Wang, T.; Chen, W.; Ma, W.; Ye, Q.; Liu, T.-Y. LightGBM: A highly efficient gradient boosting decision tree. Adv. Neural Inf. Process. Syst. 2017, 30, 3146–3154. [Google Scholar]
  57. Uddin, M.; Ye, J.; Deng, B.; Li, L.; Yu, K. Interpretable machine learning for predicting the strength of 3D printed fiber-reinforced concrete (3DP-FRC). J. Build. Eng. 2023, 72, 106648. [Google Scholar] [CrossRef]
  58. Rahman, J.; Ahmed, K.; Imtiaz Khan, N.; Islam, K.; Mangalathu, S. Data-driven shear strength prediction of steel fiber reinforced concrete beams using machine learning approach. Eng. Struct. 2021, 228, 111743. [Google Scholar] [CrossRef]
  59. Bergstra, J.; Bengio, Y. Random search for hyper-parameter optimization. J. Mach. Learn. Res. 2012, 13, 281–305. [Google Scholar]
  60. Solhmirzaei, R.; Salehi, H.; Kodur, V.; Naser, M.Z. Machine learning framework for predicting failure mode and shear capacity of ultra high performance concrete beams. Eng. Struct. 2020, 224, 111221. [Google Scholar] [CrossRef]
  61. Kohavi, R. A study of cross-validation and bootstrap for accuracy estimation and model selection. In Proceedings of the International Joint Conference on Artificial Intelligence, Montreal, QC, Canada, 20–25 August 1995; Volume 14, pp. 1137–1143. [Google Scholar]
  62. Lundberg, S.; Lee, S.-I. A unified approach to interpreting model predictions. In Proceedings of the 31st Conference on Neural Information Processing Systems (NIPS 2017), Long Beach, CA, USA, 4–9 December 2017. [Google Scholar]
  63. Chen, B.-C.; Huang, Q.-W. Study of steel fiber content influence on flexural behavior of R-UHPC beam. J. Ningxia Univ. (Nat. Sci. Ed.) 2019, 40, 130–136. [Google Scholar]
  64. Stürwald, S. Versuche zum Biegetragverhalten von UHPC mit kombinierter Bewehrung. Beton Stahlbetonbau 2011, 106, 764–772. [Google Scholar]
  65. Yavaş, A.; Hasgul, U.; Turker, K.; Birol, T. Effective fiber type investigation on the shear behavior of ultrahigh-performance fiber-reinforced concrete beams. Adv. Struct. Eng. 2019, 22, 1591–1605. [Google Scholar] [CrossRef]
  66. Wenzhong, Z.; Li, L.; Shanshan, L. Experimental research on mechanical performance of normal section of reinforced reactive powder concrete beam. J. Build. Struct. 2011, 32, 125–132. [Google Scholar]
  67. Visage, E.T.; Perera, K.; Weldon, B.D.; Jauregui, D.V.; Newtson, C.M.; Guaderrama, L. Experimental and analytical analysis of the flexural behavior of UHPC beams. In Proceedings of the Hipermat 2012 3rd International Symposium on UHPC and Nanotechnology for High Performance Construction Materals (HiPerMat 2012), Kassel, Germany, 7–9 March 2012; Volume 19, pp. 403–410. Available online: https://www.uni-kassel.de/ub/publizieren/kassel-university-press/katalog?h=9783862192649 (accessed on 14 March 2025).
  68. Yang, I.-H.; Joh, C.; Bui, T.Q. Estimating the tensile strength of ultrahigh-performance fiber-reinforced concrete beams. Adv. Mater. Sci. Eng. 2019, 2019, 5128029. [Google Scholar] [CrossRef]
  69. Wahba, K.; Marzouk, H.; Dawood, N. Structural behavior of UHPFRC beams without stirrups. In Proceedings of the Annual Conference—Canadian Society for Civil Engineering, Edmonton, Alberta, 6–9 June 2012; Volume 3, pp. 2487–2496. [Google Scholar]
  70. Liang, X.-W.; Wang, P.; Xu, M.-X.; Wang, Z.-Y.; Yu, J.; Li, L. Investigation on flexural capacity of reinforced ultrahigh performance concrete beams. Eng. Mech. 2019, 36, 110–119. [Google Scholar]
  71. Khalil, W.; Tayfur, Y. Flexural strength of fibrous ultra high performance reinforced concrete beams. ARPN J. Eng. Appl. Sci. 2013, 8, 200–214. [Google Scholar]
  72. Yang, I.-H.; Park, J.; Bui, T.Q.; Kim, K.-C.; Joh, C.; Lee, H. An experimental study on the ductility and flexural toughness of ultrahigh-performance concrete beams subjected to bending. Materials 2020, 13, 2225. [Google Scholar] [CrossRef]
  73. Randl, N.; Simon, C.; Mészöly, T. Experimental investigations on UHP (FR) C beams with high strength reinforcement. In Proceedings of the RILEM-fib-AFGC International Symposium on Ultra-High Performance Fibre-Reinforced Concrete, Marseille, France, 1–3 October 2013. [Google Scholar]
  74. Wang, J.; Qi, J.; Liu, J. Flexural analysis of UHPC beams based on a mesoscale constitutive model. J. Build. Struct. 2020, 41, 137–144. [Google Scholar] [CrossRef]
  75. Bae, B.I.; Choi, H.K.; Choi, C.S. Flexural and shear capacity evaluation of reinforced ultra-high strength concrete members with steel rebars. Key Eng. Mater. 2014, 577–578, 17–20. [Google Scholar] [CrossRef]
  76. Long, P.; Huang, L.; Qiao, H. RPC constitutive relation and ultimate flexural capacity of rectangular RPC beams. China Concr. Cem. Prod. 2020, 1, 1–6. [Google Scholar]
  77. Kareem, R.R.; Deyab, H.M. Flexural action of continuous reinforced reactive powder concrete beams. IOP Conf. Ser. Mater. Sci. Eng. 2020, 888, 012041. [Google Scholar] [CrossRef]
  78. Deng, Z.-C.; Wang, Y.-C.; Xiao, R.; Lan, M.; Chen, X. Flexural test and theoretical analysis of UHPC beams with high strength rebars. J. Basic Sci. Eng. 2015, 23, 68–78. [Google Scholar]
  79. Ridha, M.M.S.; Al-Shaarbaf, I.A.S.; Sarsam, K.F. Experimental study on shear resistance of reactive powder concrete beams without stirrups. Mech. Adv. Mater. Struct. 2020, 27, 1006–1018. [Google Scholar] [CrossRef]
  80. Xinyue, W. Research on Mechanical Properties of Reinforced Ultra-High Performance Concrete Beams. Ph.D. Thesis, Xi’an University of Architecture and Technology, Xi’an, China, 2021. [Google Scholar]
  81. Lingzhi, J.; Lai, H.; Xinke, W. Experimental study on flexural property of reactive powder concrete beams with HRB500 steel. Build. Struct. 2015, 45, 87–92. [Google Scholar]
  82. Feng, Z.; Li, C.; Yoo, D.-Y.; Pan, R.; He, J.; Ke, L. Flexural and cracking behaviors of reinforced UHPC beams with various reinforcement ratios and fiber contents. Eng. Struct. 2021, 248, 113266. [Google Scholar] [CrossRef]
  83. Gao, Y.; Zhu, W.; Luo, Y. Research on bending behavior of reinforced ultra-high performance concrete (UHPC) beams. China Concr. Cem. Prod. 2021, 7, 67–70. [Google Scholar]
  84. Bae, B.-I.; Choi, H.-K.; Choi, C.-S. Flexural strength evaluation of reinforced concrete members with ultra high performance concrete. Adv. Mater. Sci. Eng. 2016, 2016, 2815247. [Google Scholar] [CrossRef]
  85. Kahanji, C.; Ali, F.; Nadjai, A. Structural performance of ultra-high-performance fiber-reinforced concrete beams. Struct. Concr. 2017, 18, 249–258. [Google Scholar] [CrossRef]
  86. Khan, M.I.; Fares, G.; Abbas, Y.M. Behavior of non-shear-strengthened UHPC beams under flexural loading: Influence of reinforcement depth. Appl. Sci. 2021, 11, 11168. [Google Scholar] [CrossRef]
  87. Bae, B.-I.; Lee, M.-S.; Choi, C.-S.; Jung, H.-S.; Choi, H.-K. Evaluation of the ultimate strength of the ultra-high-performance fiber-reinforced concrete beams. Appl. Sci. 2021, 11, 2951. [Google Scholar] [CrossRef]
  88. Li, Y.; Guertin-Normoyle, C.; Algassem, O.; Aoude, H. Effect of ultra-high performance fibre-reinforced concrete and high-strength steel on the flexural behavior of reinforced concrete beams. In Proceedings of the RILEM-fib-International Symposium on Ultra-High Performance Fibre-Reinforced Concrete (UHPFRC 2017), Montpellier, France, 2–4 October 2017. [Google Scholar]
  89. Khan, M.I.; Fares, G.; Abbas, Y.M.; Alqahtani, F.K. Behavior of non-shear-strengthened UHPC beams under flexural loading: Influence of reinforcement percentage. Appl. Sci. 2021, 11, 11346. [Google Scholar] [CrossRef]
  90. Su, J.; Fu, Y.; Huang, Q. Experimental study and finite element analysis of flexural behavior of reinforced ultra-high performance concrete beams. J. China Foreign Highw. 2017, 37, 99–105. [Google Scholar] [CrossRef]
  91. Zhong, H.; Zheng, X.; Song, Z. Experimental study on the effect of reinforcement ratio on the flexural capacity of UHPC beams. Henan Sci. 2021, 39, 595–603. [Google Scholar] [CrossRef]
  92. Chen, S.; Zhang, R.; Jia, L.-J.; Wang, J.-Y. Flexural behaviour of rebar-reinforced ultra-high-performance concrete beams. Mag. Concr. Res. 2018, 70, 997–1015. [Google Scholar] [CrossRef]
  93. Qiu, M. Study on the Basic Performance and Calculation Theory of Reinforced UHPC Members. Ph.D. Dissertation, Hunan University, Changsha, China, 2021. [Google Scholar]
  94. Ma, H. The Calculating Method of the Crack Width of Flexural Members of UHPC Beams with Ultra-High-Strength Steel Bars. Master’s Thesis, Beijing Jiaotong University, Beijing, China, 2022. [Google Scholar]
  95. Liu, Y. Study on Flexural Behavior of Ultra High Performance Concrete Beams with HRB600 Reinforcement. Master’s Thesis, Beijing Jiaotong University, Beijing, China, 2022. [Google Scholar]
  96. Smarzewski, P. Hybrid fibres as shear reinforcement in high-performance concrete beams with and without openings. Appl. Sci. 2018, 8, 2070. [Google Scholar] [CrossRef]
  97. Wang, K.; Gao, L.; Wang, L. Comparison of methods to calculate flexural capacity of reinforced UHPC girder in Chinese, French and Swiss specifications. World Bridges 2023, 51, 7–13. [Google Scholar]
  98. Chen, B.; Wu, Q.; Huang, Q.; Ma, X.; Su, J. Experimental study on shear behavior of reinforced ultra-high performance concrete beams. J. Fuzhou Univ. (Nat. Sci. Ed.) 2018, 46, 512–517. [Google Scholar]
  99. Sun, M. Study on Flexural Behavior and Stability Performance of High-Strength Reinforced Reactive Powder Concrete Members. Ph.D. Dissertation, Beijing Jiaotong University, Beijing, China, 2018. [Google Scholar]
  100. Zhang, J.; Zhao, X.; Rong, X. Flexural experimental study and capacity of ultra high strength bar reinforced UHPC beams. Earthq. Eng. Eng. Dyn. 2023, 43, 57–66. [Google Scholar]
  101. Pourbaba, M.; Sadaghian, H.; Mirmiran, A. Flexural response of UHPFRC beams reinforced with steel rebars. Adv. Civ. Eng. Mater. 2019, 8, 411–430. [Google Scholar] [CrossRef]
  102. Hou, C. Experimental and Theoretical Study on Flexural Behavior of Ultra High Performance Concrete (UHPC) Rectangular Beams. Master’s Thesis, Hunan University, Changsha, China, 2023. [Google Scholar]
Figure 1. Dependences of the ultimate flexural capacity Mu on input variables.
Buildings 15 00969 g001aBuildings 15 00969 g001b
Figure 2. Workflow of this study.
Buildings 15 00969 g002
Figure 3. The architecture of the neural network.
Buildings 15 00969 g003
Figure 4. Graphical representations of the SVR used in this study.
Buildings 15 00969 g004
Figure 5. Graphical representations of the K-NN used in this study.
Buildings 15 00969 g005
Figure 6. Graphical representations of the CART used in this study.
Buildings 15 00969 g006
Figure 7. Two technologies for ensemble learning models.
Buildings 15 00969 g007
Figure 8. Flowchart of RF for parallel training.
Buildings 15 00969 g008
Figure 9. Graphical representation of implementation of AdaBoost with two weak learners.
Buildings 15 00969 g009
Figure 10. Illustration of the GBRT model.
Buildings 15 00969 g010
Figure 11. Tree growth methods used in LightGBM and other BAs.
Buildings 15 00969 g011
Figure 12. Symmetric oblivious trees and enhanced residual calculation of CatBoost Model.
Buildings 15 00969 g012
Figure 13. Comparison of the predicted ultimate moments Mup from the traditional machine learning models with the corresponding tested results Mut from the established database.
Buildings 15 00969 g013
Figure 14. Comparison of the predicted ultimate moment Mup from the ensemble learning models with the corresponding tested results Mut from the established database.
Buildings 15 00969 g014
Figure 15. Performance comparison of the ML-based models used.
Buildings 15 00969 g015
Figure 16. Identification of data subsets for in-depth analysis.
Buildings 15 00969 g016
Figure 17. The performance indicators of ML models are compared with the measured data from experiments with different data subsets.
Buildings 15 00969 g017aBuildings 15 00969 g017b
Figure 18. Comparison of the empirical methods and the CatBoost model.
Buildings 15 00969 g018
Figure 19. SHAP summary plots of the six ensemble learning models.
Buildings 15 00969 g019
Figure 20. Feature importance of the six ensemble learning models based on SHAP.
Buildings 15 00969 g020
Figure 21. SHAP dependency plots for 5 critical features in the CatBoost model.
Buildings 15 00969 g021
Table 1. Statistical information of the parameters chosen.
ParametersDescriptionUnitMeanMinimumMaximumStandard DeviationMedianSkewnessKurtosis
HHeight of cross-sectionmm219.657640066.112200.10−0.70
BWidth of cross-sectionmm148.8110030031.091500.752.73
ρtRatio of longitudinal reinforcement%2.68016.42.231.91.915.66
fyYield strength of longitudinal reinforcementMPa477.5701395186.094561.749.96
fcCompressive strengthMPa138.0774.721628.18134.4250.780.27
VfVolume fraction of steel fiber%1.81040.722−0.691.02
Lf/dfAspect ratio of steel fiber64.30015017.9765−1.466.05
LaShear span lengthmm627.721351900377.48533.30.71−0.28
MuUltimate bending momentkN·m82.905.6355267.0368.181.663.42
Table 2. Hyperparameter tuning of traditional machine learning models.
ML ModelHyperparameterOptimized ValueRangeML ModelHyperparameterOptimized ValueRange
ANNHidden_layer_sizes(80)(10)~(150)SVRC15001000~1500
max_iter10,0000~15,000gamma0.150.001~1
activationrelu{‘relu’, ‘tanh’}kernelrbf{‘linear’, ‘rbf’, ‘poly’}
learning_rateadaptive{‘constant’, ‘adaptive’}K-NNleaf_size2010~50
alpha0.10.0001~0.01n_neighbors21~20
CARTmin_samples_leaf11~8weightsdistance{‘uniform’, ‘distance’}
min_samples_split21~8
Note: ‘relu’ means using the rectified linear unit activation function; ‘tanh’ means using the hyperbolic tangent activation function; ‘constant’ means keeping a fixed learning rate; ‘adaptive’ means automatically adjusting the learning rate based on the training process; ‘linear’ means using a linear kernel; ‘rbf’ means using the radial basis function kernel; ‘poly’ means using a polynomial kernel; ‘uniform’ means assigning equal weights to neighbors; and ‘distance’ means dynamically adjusting the weights based on the distance of neighbors.
Table 3. Hyperparameter tuning of ensemble learning models.
ML ModelHyperparameterOptimized ValueRangeML ModelHyperparameterOptimized ValueRange
LightGBMlearning_rate0.10.001~0.1GBRTlearning_rate0.10.05~0.2
min_child_samples55~20min_samples_leaf21~4
n_estimators400100~400min_samples_split102~10
num_leaves155~20n_estimators300100~300
learning_rate0.10.001~0.1AdaBoostlearning_rate0.010.01~0.1
RFmin_samples_leaf11~3losssquare{‘linear’, ‘square’, ‘exponential’}
min_samples_split22~10n_estimators600100~600
n_estimators300100~500CatBoostdepth44~8
XGBoostlearning_rate0.10.1~0.2iterations1000500~1500
min_child_weight11~3l2_leaf_reg0.10.1~1.0
n_estimators300200~400learning_rate0.10.01~0.1
Note: ‘linear’ refers to a linear loss function; ‘square’ refers to a squared loss function; and ‘exponential’ refers to an exponential loss function.
Table 4. Formulas and definitions of statistical indicators used in this study.
Evaluation IndicatorEquationNote
R2 R 2 = 1 i ˙ = 1 N Y ^ a , i Y p , i 2 i ˙ = 1 N Y ^ a , i Y ¯ m , i 2 The R2 value ranges from 0 to 1, with values closer to 1 indicating better model performance.
RMSE R M S E = 1 n i = 1 N Y ^ a , i Y p , i 2 RMSE measures the difference between observed and predicted values. Lower RMSE values, closer to zero, indicate higher model accuracy in predictions.
MAE M A E = 1 n i = 1 N Y ^ a , i Y p , i MAE, conversely, measures the average magnitude of errors without considering their direction, with lower MAE signifying higher model accuracy.
MAPE M A P E = 1 n i = 1 N Y ^ a , i Y p , i Y ^ a , i × 100 % MAPE expresses the error as a percentage, offering a relative measure of prediction accuracy. Lower MAPE values indicate more precise predictions.
Table 5. Calculation formulas of flexural capacity of reinforced UHPC-based beams.
Empirical EquationsFormula Expression
Swiss Recommendation SIA 2052 [38] 1 2 f c b x c = 0.9 f t b h x c + A s f s M u = 1 2 f c b x c h 0 1 3 x c 0.9 f t b h x c 1 2 × 0.9 h x c a s
ACI 544.4R-18 [26] M u = A s f y d a 2 + f t b h e h + e a 2 c = A s f y + f t h f t ε f + 0.003 0.003 + 0.85 β 1 f c e = ε f + 0.003 0.003 c a = β 1 c σ f s = 2 τ f l f d f σ f y ε f = σ f s E f s
FHWA HIF-13-032 [25] M u = f t u b h c 3 h c 6 + ρ s f y b h d c 3 c = ρ s f y + f t u f t u + 0.0035 E U H P C c h c E U H P C = 4200 f c M P a
Reference [39] 0.9 f c b x = 0.25 f t b h x c 0.77 + A s f y M u = 0.9 f c b x h 0 x 2 0.25 f t b h x c 0.77 0.5 h x c 0.77 a s
Table 6. Prediction performance of empirical methods and the CatBoost model.
Models M u p / M u t Quantitative Performance
MinMaxMeanR2RMSEMAEMAPE
NF P 18-7100.7961.9111.1460.91415.72412.87118.606%
SIA 20520.6801.6651.1210.87918.67414.78719.190%
ACI 544.4R-180.5651.7811.1560.86319.92916.57422.557%
FHWA HIF-13-0320.7751.8091.2570.71128.92324.25129.534%
Reference [39]0.3581.2440.9160.85120.78115.47119.309%
CatBoost0.8231.3821.0220.9934.3962.0553.704%
Disclaimer/Publisher’s Note: The statements, opinions and data contained in all publications are solely those of the individual author(s) and contributor(s) and not of MDPI and/or the editor(s). MDPI and/or the editor(s) disclaim responsibility for any injury to people or property resulting from any ideas, methods, instructions or products referred to in the content.

