Article

Pricing Decisions for Recycled Building Materials with Misrepresentation of Information from Social Exchange Theory

College of Architecture and Urban-Rural Planning, Sichuan Agricultural University, Chengdu 611830, China
*
Author to whom correspondence should be addressed.
Buildings 2025, 15(6), 967; https://doi.org/10.3390/buildings15060967
Submission received: 13 January 2025 / Revised: 16 March 2025 / Accepted: 17 March 2025 / Published: 19 March 2025
(This article belongs to the Section Construction Management, and Computers & Digitization)

Abstract

Recycled building materials offer an effective economic solution to the environmental issues caused by construction and demolition waste (CDW). However, they also create opportunities for information misrepresentation by remanufacturers. Despite the significance of this issue, existing research has largely overlooked the impact of such misrepresentation on the pricing decisions for recycled building materials. The study aims to reveal how information misrepresentation influences pricing in the context of recycled building materials. This paper develops a supply chain model for the resource utilization of construction waste, consisting of both a remanufacturer of recycled building materials and a traditional building material manufacturer. The model evaluates the effects of information misrepresentation by the remanufacturer on pricing decisions. The main findings are as follows: (1) The impact of misrepresentation of information on manufacturers depends on government subsidies and the remanufacturing process misrepresentation factor. When the government adopts a low subsidy policy, as the remanufacturing process misrepresentation factor increases, manufacturers’ profits are U shaped. When the government adopts a high subsidy policy, manufacturers’ profits are positively related to the remanufacturing process misrepresentation factor. (2) When government subsidies exceed a certain threshold, there is a negative impact on remanufacturers, who tend to reduce the level of misrepresentation in their remanufacturing processes. This study not only broadens the research on information misrepresentation through the lens of social exchange theory but also provides valuable insights for government policy decisions, particularly in regulating misrepresentation behaviors by remanufacturers under various scenarios.

1. Introduction

The construction industry is generally inefficient in its use of resources globally. The generation of large amounts of construction and demolition waste (CDW) and greenhouse gas emissions has serious negative impacts on the environment [1]. The United Nations Environment Programme stated at the 27th United Nations Climate Change Conference that the building sector accounts for more than 34% of global energy consumption [2]. In addition, 36% of the solid waste generated annually in the European Union is CDW [3]. Caterpillar emphasized the importance of remanufacturing for environmental stewardship, energy conservation, and the promotion of a circular economy during its participation in the China International Import Expo 2021. Compared with traditional manufacturing, remanufacturing not only recycles CDW but also reduces energy consumption by 60% [4] to realize the resourcefulness of CDW. In addition, the concept of a circular economy has spread in the industrial ecology literature and practice [5]. The circular economy emphasizes the sustainability of the construction industry through the use of fewer raw materials, the reuse, and recycling of materials, etc. [6]. An increasing number of companies are implementing closed-loop supply chain management, and the pricing of green remanufactured products is becoming a key decision for supply chain companies [7]. This shows that the pricing decisions of building materials companies have a profound effect on the construction business management supply chain.
Fortunately, some developed countries emphasize the recycling of resources, which effectively mitigates the negative impact of CDW on the environment. For example, in the Netherlands and Japan, the annual recycling rate of CDW can reach nearly 95% [8]. To prevent environmental pollution, many countries and local governments have introduced corresponding policies and regulations. In the United States, Japan, Germany, and other countries with mature remanufacturing industries, builders are mandatorily required to dispose of CDW; otherwise, they will be subject to financial penalties [9]. However, there is a lack of environmental awareness in most developing countries. For example, in Tehran, the capital of Iran, only 26% of CDW was recycled between 2011 and 2017 [10]. The average recycling rate in China is only approximately 5% [11]. Most of the remaining CDW that is not recycled is disposed in landfills [12]. Some also opt for incineration or illegal dumping due to a lack of landfill capacity, resulting in further damage to the environment [13]. The United Kingdom government improved CDW management for building professionals in the United Kingdom and beyond, with landfill taxes [14]. This policy not only clarifies that polluters pay for waste management but also encourages the reuse and recycling of materials [15]. The Guangzhou Municipal Government in China has introduced two forms of subsidies for the recycling of CDW [16]: (1) a CDW disposal subsidy of RMB 2 per tonne on the basis of the actual amount of CDW used for recycling construction materials; (2) a monthly subsidy of RMB 3 per square meter for the production sites of enterprises eligible for the subsidy in combination with the scale of production. Stimulated by government policies such as remanufacturing subsidies, many companies have invested in the operation and management of remanufacturing supply chains to reduce costs [17]. Avoiding the negative environmental impacts of CDW is challenging, although national policies and regulations provide opportunities for construction material recyclers and remanufacturers to protect the environment by engaging in CDW recycling. This is because the complexity of the remanufacturing process makes it difficult for government regulators to monitor it in a timely and effective manner, and remanufacturers may misrepresent information on the basis of maximizing their own interests [18]. When a remanufacturer misrepresents information to the outside world, the firms with which it exchanges information deviate from the optimal pricing decision because of false information, affecting the efficiency of the supply chain. For example, American plastic lumber sells plastic lumber products to construction contractors, falsely claiming that its products are made almost entirely from recycled materials. This behavior leads construction contractors to perceive their recycled building materials as having greater environmental value, leading to higher purchase prices and affecting the market price of plastic wood products. Interestingly, many researchers have conducted studies and reported that governments can adjust the rate of subsidies and thus influence the decision-making behavior of stakeholders in the supply chain [19]. Therefore, on the basis of the current problems faced by the construction industry, this paper focuses on the impact of government subsidies and the misrepresentation of information behaviors on supply chain decisions related to CDW resource utilization to develop remanufacturing.
On the basis of social exchange theory, this paper takes the remanufacturing subsidy policy as the background, considers the uncertainty of manufacturers in the remanufacturing process, and constructs a game model consisting of manufacturers and remanufacturers. To reveal the influence mechanism of misrepresentation of information on the pricing decision of recycled building material products, the impact of misrepresentation of information on the supply chain of resource utilization of building waste should also be studied. This paper answers the following two questions: (1) How does misrepresentation of information by remanufacturers affect pricing decisions for building materials products and recycled building materials products, as well as companies’ profits, compared with a symmetric information situation? (2) In the context of information asymmetry, how can remanufacturing subsidy policies regulate the negative impacts of misrepresentation of information by remanufacturers on the supply chain of building waste resource utilization or provide incentives for remanufacturers to exchange truthful information?
Therefore, the innovations of this paper are organized as follows. (1) Social exchange theory is introduced to consider the impact of remanufacturers’ misrepresentation of information on building waste resourcing supply chains on the basis of remanufacturing subsidy policies. (2) The remanufacturing subsidy policy is incorporated into the game model as a regulatory factor. It is innovatively proposed that the government can regulate the negative impacts of misrepresentation of remanufactured information on the resource utilization of building waste through subsidies to remanufacturers.

2. Literature Review

This paper aims to solve the CDW management problem from the perspective of closed-loop supply chain operations. The pricing decisions in the supply chain of CDW resource utilization should be studied on the basis of the misrepresentation of recycled building material manufacturers and government subsidies. Therefore, this paper reviews the relevant literature in terms of four aspects: CDW management, misrepresentation of information, social exchange theory, and supply chain pricing decisions, as shown in Table 1.

2.1. CDW Management

CDW is a mixture of residual materials generated during building construction, renovation, and demolition activities [20]. It has many adverse effects on the environment, economy, and society. How to strengthen CDW management and mitigate the significant pressures that CDW places on the sustainable development of cities and regions has become an urgent issue [21].
CDW management is influenced not only by companies and the public but also by government intervention. Specifically, from a company perspective, construction company leaders can establish a monitoring and feedback mechanism and a performance appraisal system to strengthen the systematic management of the CDW recycling program. It also motivates employees and encourages them to be more proactive in recycling CDWs when companies begin to take environmental measures [22]. From the public’s perspective, researchers have explored the green value cocreation behaviors of remanufacturers, construction companies, and the public when adopting CDW recycled building materials. A previous study revealed that increasing the public’s willingness to cocreate green value can lead other CDW management project stakeholders to participate in green value cocreation [23]. From the government’s perspective, some researchers have constructed government noncompensation and compensation models and found that compensation policies can promote recycling and remanufacturing performance and social welfare in CDW-managed projects [24]. To improve CDW management, some researchers have developed a two-step methodology for the quantitative and managerial analysis of CDWs and applied it to a case study in Cantabria, a region in northern Spain [25]. Researchers have also analyzed the best policies for governments to implement under different scenarios on the basis of the remanufacturing capacity of CDW recycling units [26].
However, existing studies have neglected the impact of private information possessed by firms in the supply chain on CDW management decisions. This is not conducive to enterprises responding to market changes and optimizing resource allocation.

2.2. Misrepresentation of Information

Information is one of the main determinants of companies’ competitiveness [27]. The more private information a firm has, the better it is for making economic decisions. For example, manufacturers provide information on product inventory, production costs, and product quality [28]. Information can be obtained from remanufacturers about the remanufacturing process level, recycling costs, etc.
However, the inherent complexity of recycling and remanufacturing activities increases the amount of private information between companies and increases the uncertainty that affects mutual trust between companies. In the case of information asymmetry, each enterprise acts in its interest, and some enterprises refuse to share information about their products with other members of the supply chain, thus misrepresenting or concealing private information [29]. For example, Mitsubishi Electric Corporation, one of the representative companies of Made in Japan, was exposed for long-term falsification of inspection data in 2021. This behavior affects the economic decisions of other companies and raises conflicts with the overall goals of the supply chain. Many studies have shown that there is asymmetric cost information between suppliers and manufacturers about manufacturers’ remanufacturing process innovations (PIRs), which can be detrimental to supplier profitability [30] and hinder the efficiency of companies in the remanufacturing supply chain [31]. However, some researchers have reported that digital twin processes can more accurately optimize the process of transportation and remanufacturing procurement. This approach is helpful for solving the problem of misrepresentation of information [31]. However, only by relying on the current stage of digital twin processes, simple information transmission can be carried out. It is not yet possible to realize information sharing among managers. On this basis, to reduce damage to the supply chain caused by information misrepresentation behavior, researchers have explored optimal decisions on the basis of the information misrepresentation behavior of remanufacturing outsourcers. Under the outsourcing of remanufacturing collected by the manufacturer, third-party remanufacturers tend to misrepresent information on remanufacturing production costs. It benefits both the manufacturer and the remanufacturer and otherwise benefits only the remanufacturer [32]. All of the above studies explore the impact of companies’ misrepresentation of information on recycling and remanufacturing activities under information asymmetry. The main focus is the misrepresentation of cost information in the production process of outsourcing remanufacturing.
However, all of the above studies consider the quality of recycled products to be consistent. Few studies have considered the impact of the misrepresentation of information based on government subsidies and the heterogeneity of recycled products on the remanufacturing supply chain in independent remanufacturing activities.

2.3. Social Exchange Theory

Social exchange theory is one of the most influential theories in the social sciences, and its usefulness is a typical social transaction that has implications for various fields [33]. The study concluded that resources in social exchange can be categorized as information, status, commodities, love, money, and services. The value of the outcome of social exchange depends on the subjective feelings of the parties concerned [34]. These resources can be referred to as the benefits or rewards that a person seeks in social exchange. The person will become involved in and maintain exchange relationships with others with the expectation of receiving rewards [35]. The actions of the first actor are called initiating actions and are categorized into positive and negative actions [36]. Positive proactive actions include justice and organizational support, and negative actions may include uncivil behavior and abusive supervision [33].
Although many studies on social exchange relationships exist, most of them have been based on the employer–employee relationship. Few studies have extended it to company-to-company social exchanges. Remanufacturers and manufacturers of building materials inevitably exchange private information with each other for the sake of completeness in their decision-making. Both are competitive relationships centered on the acquisition of benefits [37]. The act of exchanging information can often be subject to misrepresentation or concealment. Unsuspecting companies will be victimized by responding to the negative actions of malicious individuals or companies [38]. This results in its impact on product pricing decisions, which in turn affects the overall profitability of the remanufacturing supply chain. Therefore, further research on the misrepresentation of information by recycled building material manufacturers and building material manufacturers on the basis of social exchange theory will play an important role in the development of CDW resource utilization supply chains.

2.4. Supply Chain Pricing Decisions

The impact of pricing decisions on the profit level of supply chain members and how to achieve a fair or incentive-based coordination strategy has been a hot research topic [39]. Researchers have explored the preferences of supply chain members in pricing strategies and the mechanisms that influence them from several perspectives. In the case of independent decision-making, manufacturers and retailers with higher market potential prefer consistent wholesale prices, whereas retailers with lower market potential prefer inconsistent wholesale prices [39]. The equilibrium strategies of supply chain members are significantly affected by retailers’ fair attention behavior [40]. From a government policy perspective, some researchers have included government subsidies as an influential factor in supply chain pricing decisions. They explored and compared optimal pricing strategies with and without government-provided green investment subsidies to maximize the overall profitability of the supply chain [41]. From the perspective of consumer behavior, some researchers have studied the impact of the consumer free-riding problem on the optimal pricing strategy and optimal service level of a dual-channel supply chain under different decision-making models. The study revealed that the profits of all supply chain members decreased with an increase in the consumer free-rider coefficient [42]. In addition, consumer green preferences, channel preferences, green investments, and competition provide incentives for supply chain pricing decisions and performances [43]. Other researchers have studied pricing strategies and profit sharing in supply chains under different decision-making models from the perspective of asymmetric power. They reported that the gross profit of a supply chain under decentralized decision-making is always lower than that under centralized decision-making [44].
Unfortunately, most existing studies do not fully consider the impact of the misrepresentation of information on pricing decisions. In fact, the veracity of the information available to the firm directly affects the accuracy of the pricing strategy.

3. Methodology

3.1. Research Method

This paper applies the Stackelberg game methodology. The Stackelberg game is also known as the Stackelberg oligarchic competition model and leader–follower model, which can embody the master–slave hierarchical structure [45]. Although remanufactured products function almost as well as new products do, average and environmentally conscious consumers value the latter more than the former [46]. This means that remanufactured products tend to be weaker than new products. This fits exactly with the fact that the leader is more powerful than the other participants in the Stackelberg game. He could predict the reactions of the followers and obtain the best strategy on the basis of the information. Moreover, the leader–follower model emphasized in the Stackelberg game is appropriate for studying the information asymmetry relationships between manufacturers and remanufacturers. Other game models, such as evolutionary game models, are more focused on continuous time state changes and are not applicable to optimal decision making. Other examples include regression modeling, structural equation modeling, etc., which fail to portray the master–child sequence in information misrepresentation and the optimal choice of pricing decisions. Therefore, it is appropriate to use the Stackelberg game to research pricing decisions for recycled building material products while considering the misrepresentation of information.

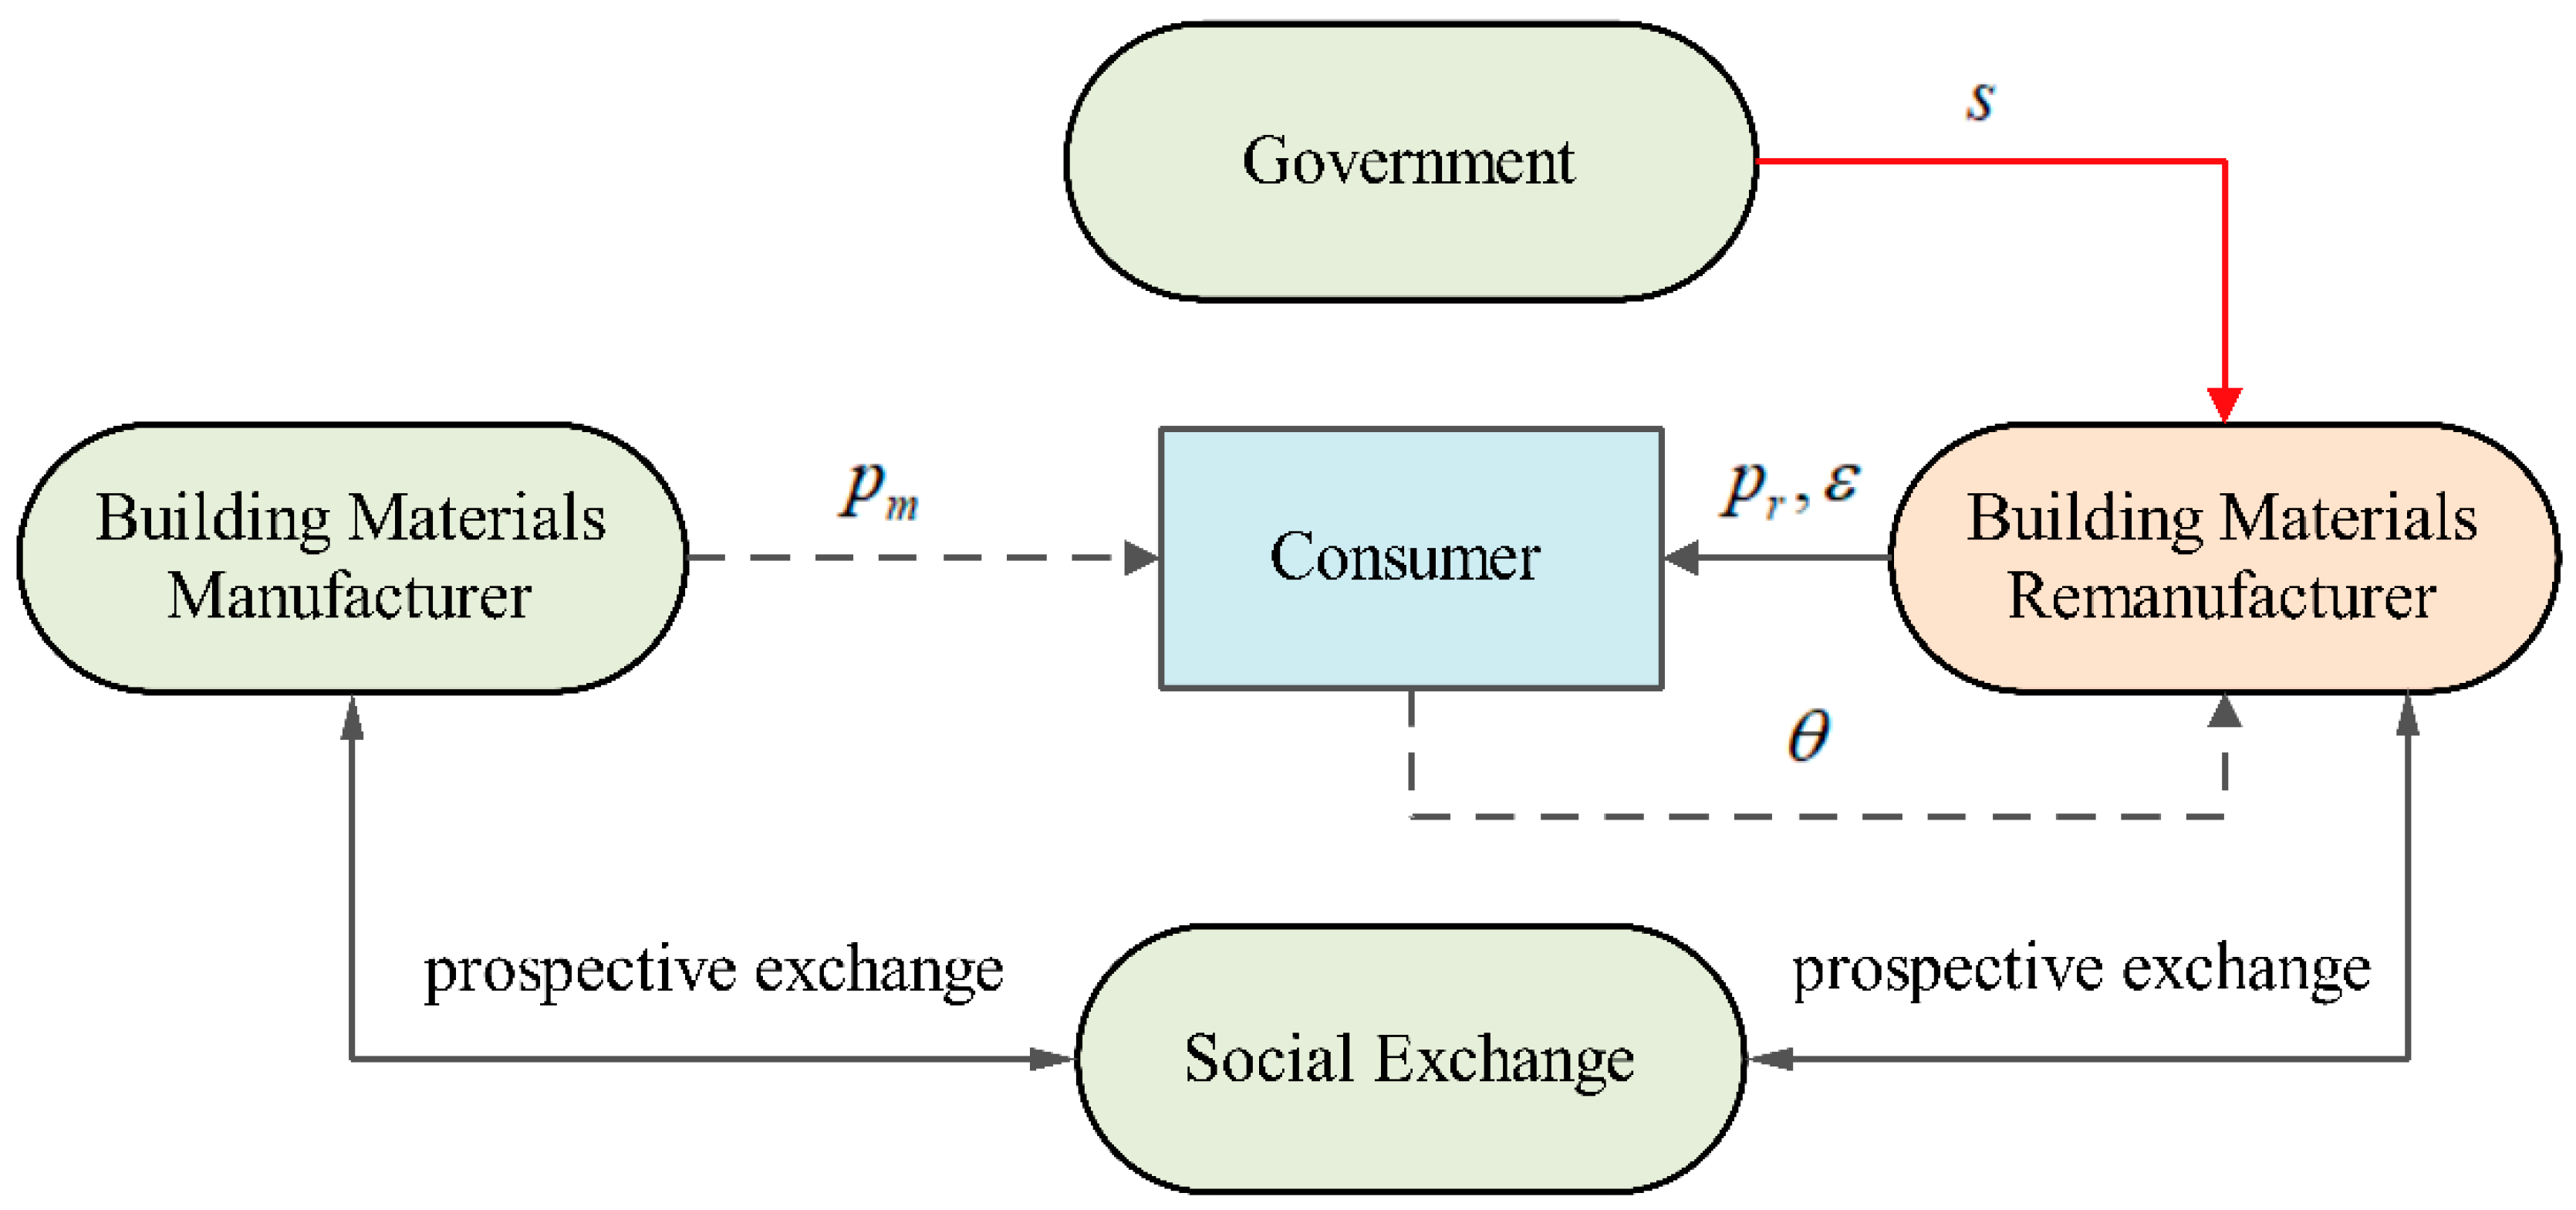
3.2. Model Descriptions

This paper constructed a Stackelberg gaming system consisting of a building materials manufacturer, a recycled building material remanufacturer. In this case, the manufacturer uses raw materials to produce building material products at market price p m . Moreover, remanufacturers use CDW to produce recycled building products through a remanufacturing process at a market price of p r . The government has introduced remanufacturing subsidy policies to regulate the market. Therefore, this paper assumes that the cost of remanufacturing subsidies per unit of product is s . Owing to the complexity of the remanufacturing process, it is difficult for manufacturers and consumers to know the true remanufacturing process level. The remanufacturers have an incentive to misrepresent the information to gain more profit, and the misrepresentation factor is assumed to be ε . The formed game model is shown in Figure 1.
The parameters of this paper are shown in Table 2.

3.3. Assumptions

Assumption 1.
In reference to [49], it is assumed that the cost of remanufactured products is lower than the cost of building material products, i.e., C m > C r .
Assumption 2.
In the actual building materials market, the demand for recycled building materials and new products jointly depends on the consumer’s perception of value and the price difference between the two products. The greater the price difference between recycled building materials and new products, the more likely consumers are to purchase recycled building materials. The closer consumers’ perceived value of recycled building materials and new products is, the more likely they are to purchase recycled building materials. Customers’ willingness to pay for recycled building materials is heterogeneous, with a random variable distributed on ( 0 , Q ) . In addition, in reference to the customer net utility function and Pareto-efficient solution [52], assume that the demand function for building materials is q m = Q p m p r 1 θ and that the demand function for recycled building materials is q r = θ p m p r θ 1 θ , where 0 < θ < 1 .
Assumption 3.
In reference to [48], define the level of effort of a remanufacturing company that invests in employee training, bonus incentives, and thus recycling quality as recycling effort e . The cost of input recovery efforts is l e 2 2 .
Assumption 4.
The recycling effort improves the quality of recycling, assuming that the initial recycling quality in the case of no recycling effort is q 0 . The quality of the recycling effort is q = q o + β e , where 0 < β < 1 .
Assumption 5.
The higher the quality of recycling, the lower the cost of building waste processing into recycled building materials. Moreover, the cost of recycled building material products is also affected by the level of the remanufacturing process. The higher the remanufacturing process level, the lower the cost. Therefore, the cost of recycled building material products for the cost of building material products is assumed to be C m , and the recycling of the quality of q 0 and remanufacturing process level δ is used to obtain the cost of recycled building material products for C r = C m δ q 0 + β e .
Assumption 6.
Assume that the remanufacturing process level of the information released by the remanufacturer to the outside world is δ . In the case of misrepresentation of the information, the actual remanufacturing process level is ε δ . Here, ε is the remanufacturing process misrepresentation factor, so ε > 0 . When ε < 1 , the remanufacturer misrepresents its remanufacturing process level up; when ε > 1 , the remanufacturer misrepresents its remanufacturing process level down. In the real world, the level of remanufacturing process can be comprehensively measured by indicators such as the quality of remanufactured products, the complexity of the remanufacturing process, the reduction of waste emissions from remanufacturing, and the cost saving rate. The misrepresentation factor, on the other hand, is the ratio of the remanufacturing process level actually investigated through these indicators to the remanufacturing process level advertised by the company to the public.

3.4. Modeling and Solving

In this section, two separate models are constructed on the basis of whether the remanufacturer misrepresents information. The manufacturer, as the leader of the Stackelberg game, first determines the selling price of building material products, p m . On this basis, the remanufacturer determines the selling price, p r , of the reclaimed building materials and the misrepresentation factor ε .

3.4.1. Information Symmetry (NL)

The profit function of the manufacturer is shown in Equation (1).
π m N L = ( p m C m ) q m
The profit function of the manufacturer is shown in Equation (2).
π r N L = ( p r ( C m δ ( q 0 + β e ) ) + s ) q r l e 2 2
To prove the existence of optimal solutions for p m and p r , find the second-order partial derivatives of π m N L and π r N L with respect to p m and p r , respectively, i.e., 2 π m N L p m 2 = 2 θ 1 θ < 0 , 2 π r N L p r 2 = 2 1 θ θ < 0 , so that there are optimal solutions for p m and p r , respectively. Following the Stackelberg game order, the paper uses inverse induction to first find an equilibrium solution for π r T L , and the result is shown in Equation (3).
p r N L = 1 2 s β δ e + C m + θ p m δ q 0
Let a = ( 2 Q θ + 4 + θ C m ) ( 1 θ ) . The model is solved by applying inverse induction, and the results are shown in Equations (4)–(7).
p m N L = s + 2 Q ( 1 + θ ) + β δ e + ( 3 + θ ) C m + δ q 0 2 ( 2 + θ )
p r N L = ( s + β δ e + δ q 0 ) ( 4 + θ ) 2 Q ( 1 + θ ) θ + ( 4 + θ θ 2 ) C m 4 ( 2 + θ )
q m N L = s + ( 2 Q C m ) ( 1 + θ ) + δ ( β e + q 0 ) 4 ( 1 + θ )
q r N L = ( 4 3 θ ) ( β δ e + δ q 0 + s ) + a 4 ( 2 + θ ) ( 1 + θ ) θ
Proof. 
Since there are optimal solutions for p m and p r , q m = Q p m p r 1 θ and q r = θ p m p r θ 1 θ are substituted in Assumption 2 for Equations (1) and (2). Let π r N L p r = 0 and π m N L p m = 0 ; then, we can solve for the optimal prices p m N L and p r N L . Substitute them into q m = Q p m p r 1 θ and q r = θ p m p r θ 1 θ to obtain q m N L and q r N L as q m N L = s + ( 2 Q C m ) ( 1 + θ ) + δ ( β e + q 0 ) 4 ( 1 + θ ) , q r N L = ( 4 3 θ ) ( β δ e + δ q 0 + s ) + a 4 ( 2 + θ ) ( 1 + θ ) θ . □
Substituting Equations (4)–(7) into Equations (1) and (2) yields the maximum profit:
π m N L = ( ( C m 2 Q ) ( 1 θ ) + s + δ ( q 0 + β ω ) ) 2 8 ( 2 3 θ + θ 2 )
π r N L = 4 + 3 θ δ e β + δ q 0 + s + 1 + θ 4 + θ C m + 2 Q θ 2 2 + θ 2 1 θ θ 1 2 l e 2 .

3.4.2. Misrepresentation of Information (TL)

The profit function for the manufacturer is shown in Equation (10).
π m T L = ( p m C m ) q m
The misrepresented profit function for the remanufacturer is shown in Equation (11).
π r T L = ( p r ( C m δ ( q 0 + β e ) ) + s ) q r l e 2 2
The real profit function for the remanufacturer is shown in Equation (12).
π r T L = ( p r ( C m ε δ ( q 0 + β e ) ) + s ) q r l e 2 2
To prove the existence of optimal solutions for p m and p r , find the second-order partial derivatives of π m T L and π r T L with respect to p m and p r , respectively, i.e., 2 π m T L p m 2 = 2 θ 1 θ < 0 and 2 π r T L p r 2 = 2 1 θ θ < 0 , so that there are optimal solutions for p m and p r .
For profit maximization, the remanufacturer makes decisions on the basis of real profits. According to the Stackelberg game order, inverse induction is used to first find an equilibrium solution for π r T L , and the results are shown in Equation (13).
p r T L = 1 2 s β δ ε e + C m + θ p m δ ε q 0
Replacing Equation (3) with Equation (13), similarly solve for the equilibrium solution of π m T L .
The model is solved via inverse induction, and the final results are shown in Equations (14)–(17). Here, a = 4 + θ C m + 2 Q θ .
p m T L = s + 2 Q ( 1 + θ ) + ( 3 + θ ) C m + δ ε ( q 0 + β e ) 2 ( 2 + θ )
p r T L = ( s + β δ ε e + δ ε q 0 ) ( 4 + θ ) 2 Q ( 1 + θ ) θ + ( 4 + θ θ 2 ) C m 4 ( 2 θ )
q m T L = s + ( 2 Q C m ) ( 1 + θ ) + δ ( β e + q 0 ) 4 ( 1 + θ )
q r T L = ( β δ ε e + s + δ ε q 0 ) ( 4 3 θ ) + ( 1 θ ) a 4 ( 2 + θ ) ( 1 + θ )
Proof. 
Since there are optimal solutions for p m and p r , we substitute q m = Q p m p r 1 θ and q r = θ p m p r θ 1 θ in Assumption 2 for Equations (10) and (12). Let π r T L p r = 0 and π m T L p m = 0 ; then, we can solve for the optimal prices p m T L and p r T L . Substituting them into q m = Q p m p r 1 θ and q r = θ p m p r θ 1 θ yields q m T L and q r T L . □
Substituting Equations (14)–(17) into Equations (10) and (12) yields the maximum profit:
π m T L = 2 Q + s + 2 Q θ + β δ ε e + C m θ C m + δ ε q 0 2 8 2 3 θ + θ 2
π r T L = δ ε β e + s + q 0 4 + 3 θ a δ β e + q 0 4 ε + 4 θ 8 ε θ a s 4 3 θ 16 2 + θ 2 1 θ θ l e 2 2 .

4. Model Analysis

Proposition 1.
For the sales price p m of a building material product and the sales price p r of a recycled building material, if 0 < ε < 1 , p r N L < p r T L and p m N L < p m T L , and if ε > 1 , p r N L > p r T L and p m N L > p m T L .
Proposition 1 shows that, for the price of a building product and a recycled building material, the price of the product is higher than the price of the product when the information is symmetric and when the manufacturer of the recycled building material misrepresents the level of the remanufacturing process. In other cases, the price of the product is lower than the price of the product when the information is symmetric. This is because when the remanufacturer misrepresents the remanufacturing process level upward, consumers will perceive a narrowing of the value gap between recycled building products and building products and tend to favor reclaimed building material products to a certain extent. On this basis, remanufacturers usually set high prices to increase their revenue in case of misrepresentation.
Proposition 2.
When 0 < δ < 2 1 + θ 2 Q C m β e + q 0 , if 0 < s < ( 2 Q C m ) ( 1 θ ) β δ e δ q 0 , in the 0 < ε < 1 or ε > 2 s + ( 2 Q C m ) 1 θ δ β e + q 0 1 condition, π m N L < π m T L ; in the 1 < ε < 2 s + ( 2 Q C m ) 1 θ δ β e + q 0 1 condition, π m N L > π m T L .
If ( 2 Q C m ) ( 1 θ ) δ ( β e + q 0 ) < s < ( 2 Q C m ) ( 1 θ ) 1 2 δ ( β e + q 0 ) , in the 0 < ε < 2 s + ( 2 Q C m ) 1 θ δ β e + q 0 1 or ε > 1 condition, π m N L < π m T L ; in the 2 s + ( 2 Q C m ) 1 θ δ β e + q 0 1 < ε < 1 condition, π m N L > π m T L .
If s > ( 2 Q C m ) ( 1 θ ) 1 2 δ ( β e + q 0 ) , in the 0 < ε < 1 condition, π m N L > π m T L ; in the ε > 1 condition, π m N L < π m T L ; when δ > 2 1 θ 2 Q C m β e + q 0 , in the 0 < ε < 1 condition, π m N L > π m T L ; and in the ε > 1 condition, π m N L < π m T L .
Proposition 2 shows that if the government’s subsidy is lower than ( 2 Q C m ) ( 1 θ ) β δ e δ q 0 and the remanufacturer’s remanufacturing process is lower than 2 1 θ 2 Q C m β e + q 0 , the remanufacturer’s misrepresentation will reduce the manufacturer’s profitability only if the remanufacturer’s misrepresentation factor is ( 1 , 2 s + ( 2 Q C m ) 1 θ δ β e + q 0 1 ) . In other cases, the remanufacturer’s misrepresentation is beneficial to the manufacturer’s profits. If the government’s subsidy s meets ( 2 Q C m ) ( 1 θ ) δ ( β e + q 0 ) < s < ( 2 Q C m ) ( 1 θ ) 1 2 δ ( β e + q 0 ) , the misrepresentation factor at ( 2 s + ( 2 Q C m ) 1 θ δ β e + q 0 1 , 1 ) will also reduce the profitability of the manufacturer. If the subsidy set by the government is higher than ( 2 Q C m ) ( 1 θ ) 1 2 δ ( β e + q 0 ) or if the remanufacturing process of the remanufacturer is higher than 2 1 θ 2 Q C m β e + q 0 , the remanufacturer misrepresenting the level of the remanufacturing process upward will reduce the profit of the manufacturer.
Proposition 3.
When δ > 2 1 θ θ 2 Q θ + 4 + θ C m 4 3 θ 2 β e + q 0 , if 0 < s < ( 2 Q θ 4 + θ C m ) 1 + θ + ( β e + q 0 ) 4 3 θ δ 4 + 3 θ , in the ε > ( 8 θ + 6 θ 2 ) s + 4 Q ( θ 3 θ 2 ) + ( 16 24 θ + 9 θ 2 ) ( β e + q 0 ) δ + ( 8 θ 10 θ 2 + 2 θ 3 ) C m δ 16 16 θ + 3 θ 2 β e + q 0 or 0 < ε < 1 condition, π r N L > π r T L ; in the 1 < ε < ( 8 θ + 6 θ 2 ) s + 4 Q ( θ 3 θ 2 ) + ( 16 24 θ + 9 θ 2 ) ( β e + q 0 ) δ + ( 8 θ 10 θ 2 + 2 θ 3 ) C m δ 16 16 θ + 3 θ 2 β e + q 0 condition, π r N L < π r T L .
If
4 θ C m 2 Q θ 1 + θ + δ β e + q 0 4 3 θ 4 + 3 θ < s < 4 Q θ 2 + 2 4 + θ θ C m 1 + θ + δ β + q 0 4 3 θ 2 e 2 θ 4 + 3 θ ,
in the 0 < ε < ( 8 θ + 6 θ 2 ) s + 4 Q ( θ 3 θ 2 ) + ( 16 24 θ + 9 θ 2 ) ( β e + q 0 ) δ + ( 8 θ 10 θ 2 + 2 θ 3 ) C m δ ( 16 16 θ + 3 θ 2 ) ( β e + q o ) or ε > 1 condition, π r N L > π r T L ; in the ( 8 θ + 6 θ 2 ) s + 4 Q ( θ 3 θ 2 ) + ( 16 24 θ + 9 θ 2 ) ( β e + q 0 ) δ + ( 8 θ 10 θ 2 + 2 θ 3 ) C m δ 16 16 θ + 3 θ 2 β e + q 0 < ε < 1 condition, π r N L < π r T L ; if s > ( 4 Q θ 2 + 2 4 + θ θ C m ) 1 + θ + δ ( β + q 0 ) 4 3 θ 2 e 2 θ 4 + 3 θ , in the 0 < ε < 1 condition, π r N L < π r T L ; in the ε > 1 condition, π r N L > π r T L ; when 0 < δ < 2 1 θ θ 2 Q θ + 4 + θ C m 4 3 θ 2 β e + q 0 , in the 0 < ε < 1 condition, π r N L < π r T L ; and in the ε > 1 condition, π r N L > π r T L .
Proposition 3 shows that if the remanufacturer’s remanufacturing process level is higher than δ 1 and the government’s subsidy is lower than s 1 , the remanufacturer’s misrepresentation does not harm the remanufacturer’s profits if the misrepresentation factor is set at ( 1 , ε 1 ) . In contrast, if the subsidy set by the government is higher than s 1 or if the remanufacturing process level of the remanufacturer is lower than δ 1 , the remanufacturer’s misrepresentation of the remanufacturing process level upward will lead to an increase in the profit of the remanufacturer, whereas the misrepresentation of the remanufacturing process level downward will lead to a decrease in the profit of the building materials manufacturer. In this case,
δ 1 = 2 1 θ θ 2 Q θ + 4 + θ C m 4 3 θ 2 β e + q 0 , s 1 = ( 2 Q θ 4 + θ C m ) 1 + θ + ( β δ e + δ q 0 ) 4 3 θ 4 + 3 θ ,
ε 1 = ( 8 θ + 6 θ 2 ) s + 4 Q ( θ 3 θ 2 ) + ( 16 24 θ + 9 θ 2 ) ( β e + q 0 ) δ + ( 8 θ 10 θ 2 + 2 θ 3 ) C m δ 16 16 θ + 3 θ 2 β e + q 0 .
Proposition 4.
For the profit π m T L of a manufacturer, when 0 < s < 1 θ 2 Q C m , if 0 < ε < s + 1 + θ ( C m 2 Q ) δ β e + q 0 , π m T L is negatively correlated with respect to ε , if 0 < ε < s + 1 + θ ( C m 2 Q ) δ β e + q 0 , π m T L is positively correlated with respect to ε ; when s > 1 θ 2 Q C m , π m T L is positively correlated with respect to ε .
Proposition 4 suggests that the misreporting of information by remanufacturers is beneficial to the profitability of manufacturers when the subsidy set by the government is greater than 1 θ 2 Q C m . In all other cases, misrepresentation is beneficial to the manufacturer’s profits only if the misrepresentation factor is greater than s + 1 + θ ( C m 2 Q ) δ β e + q 0 .
Proposition 5.
For the profits of the remanufacturer π r T L ,
  • when 0 < δ < 1 θ θ 2 Q θ + 4 + θ C m 2 2 + θ 4 + 3 θ β e + q 0 , π r T L is negatively correlated with respect to ε ;
  • when δ > 1 θ θ 2 Q θ + 4 + θ C m 2 2 + θ 4 + 3 θ β e + q 0 , if 0 < s < ( 2 Q θ + 4 + θ C m ) 1 θ 4 + 3 θ + 2 δ 2 θ ( e β + q 0 ) θ , under 0 < ε < θ 2 Q θ + 4 + θ C m 1 + θ + s 4 + 3 θ + 2 δ 2 + θ 4 + 3 θ β e + q 0 δ 4 + 3 θ β e + q 0 4 + θ , π r T L is positively correlated with respect to ε ;
  • under ε > θ 2 Q θ + 4 + θ C m 1 + θ + s 4 + 3 θ + 2 δ 2 + θ 4 + 3 θ β e + q 0 δ 4 + 3 θ β e + q 0 4 + θ , π r T L is negatively correlated with respect to ε ;
  • and if s > ( 2 Q θ + 4 + θ C m ) 1 θ 4 + 3 θ + 2 δ 2 θ ( e β + q 0 ) θ , then π r T L is negatively correlated with respect to ε .
Proposition 5 shows that when the remanufacturer’s remanufacturing process is below δ 2 , the remanufacturer’s profit is negatively related to the misrepresentation factor. When the remanufacturer’s remanufacturing process level is greater than δ 2 , the remanufacturer’s misrepresentation will lead to the remanufacturer’s profit increasing and then decreasing if the subsidy set by the government is lower than s 2 . In contrast, if the government subsidy is higher than s 2 , misrepresenting upward is beneficial to the remanufacturer’s profits, and misrepresenting downward will cause the remanufacturer’s profits to be impaired. Here,
s 2 = ( 2 Q θ + ( 4 + θ ) C m ) ( 1 θ ) 4 + 3 θ + 2 δ ( 2 θ ) ( e β + q 0 ) θ ,   δ 2 = ( 1 θ ) θ ( 2 Q θ + ( 4 + θ ) C m ) 2 ( 2 + θ ) ( 4 + 3 θ ) ( β e + q 0 ) .
Please see Appendix A for the proof of the propositional part.

5. Numerical Simulation and Discussion

This section explores the effects of misrepresentation of the information factor ε on the price ( p m , p r ) and profit ( π m , π r ) of building material products and recycled building materials. Global Industry Analysts, an American consulting firm, conducted a survey on the global market for construction materials. The results of the survey show that the global construction material market demand is approximately 400 billion dollars in 2022. For the purpose of numerical simulation, we set Q = 4 . Numerical simulation is carried out via MATLAB 2022b, and in accordance with the methods of Zhang et al. [50] and Ding and Zhu [53], the basic parameters θ = 0.8 , β = 0.02 , e = 1 , C m = 1.5 , q 0 = 0.6 , and l = 1 are set up.

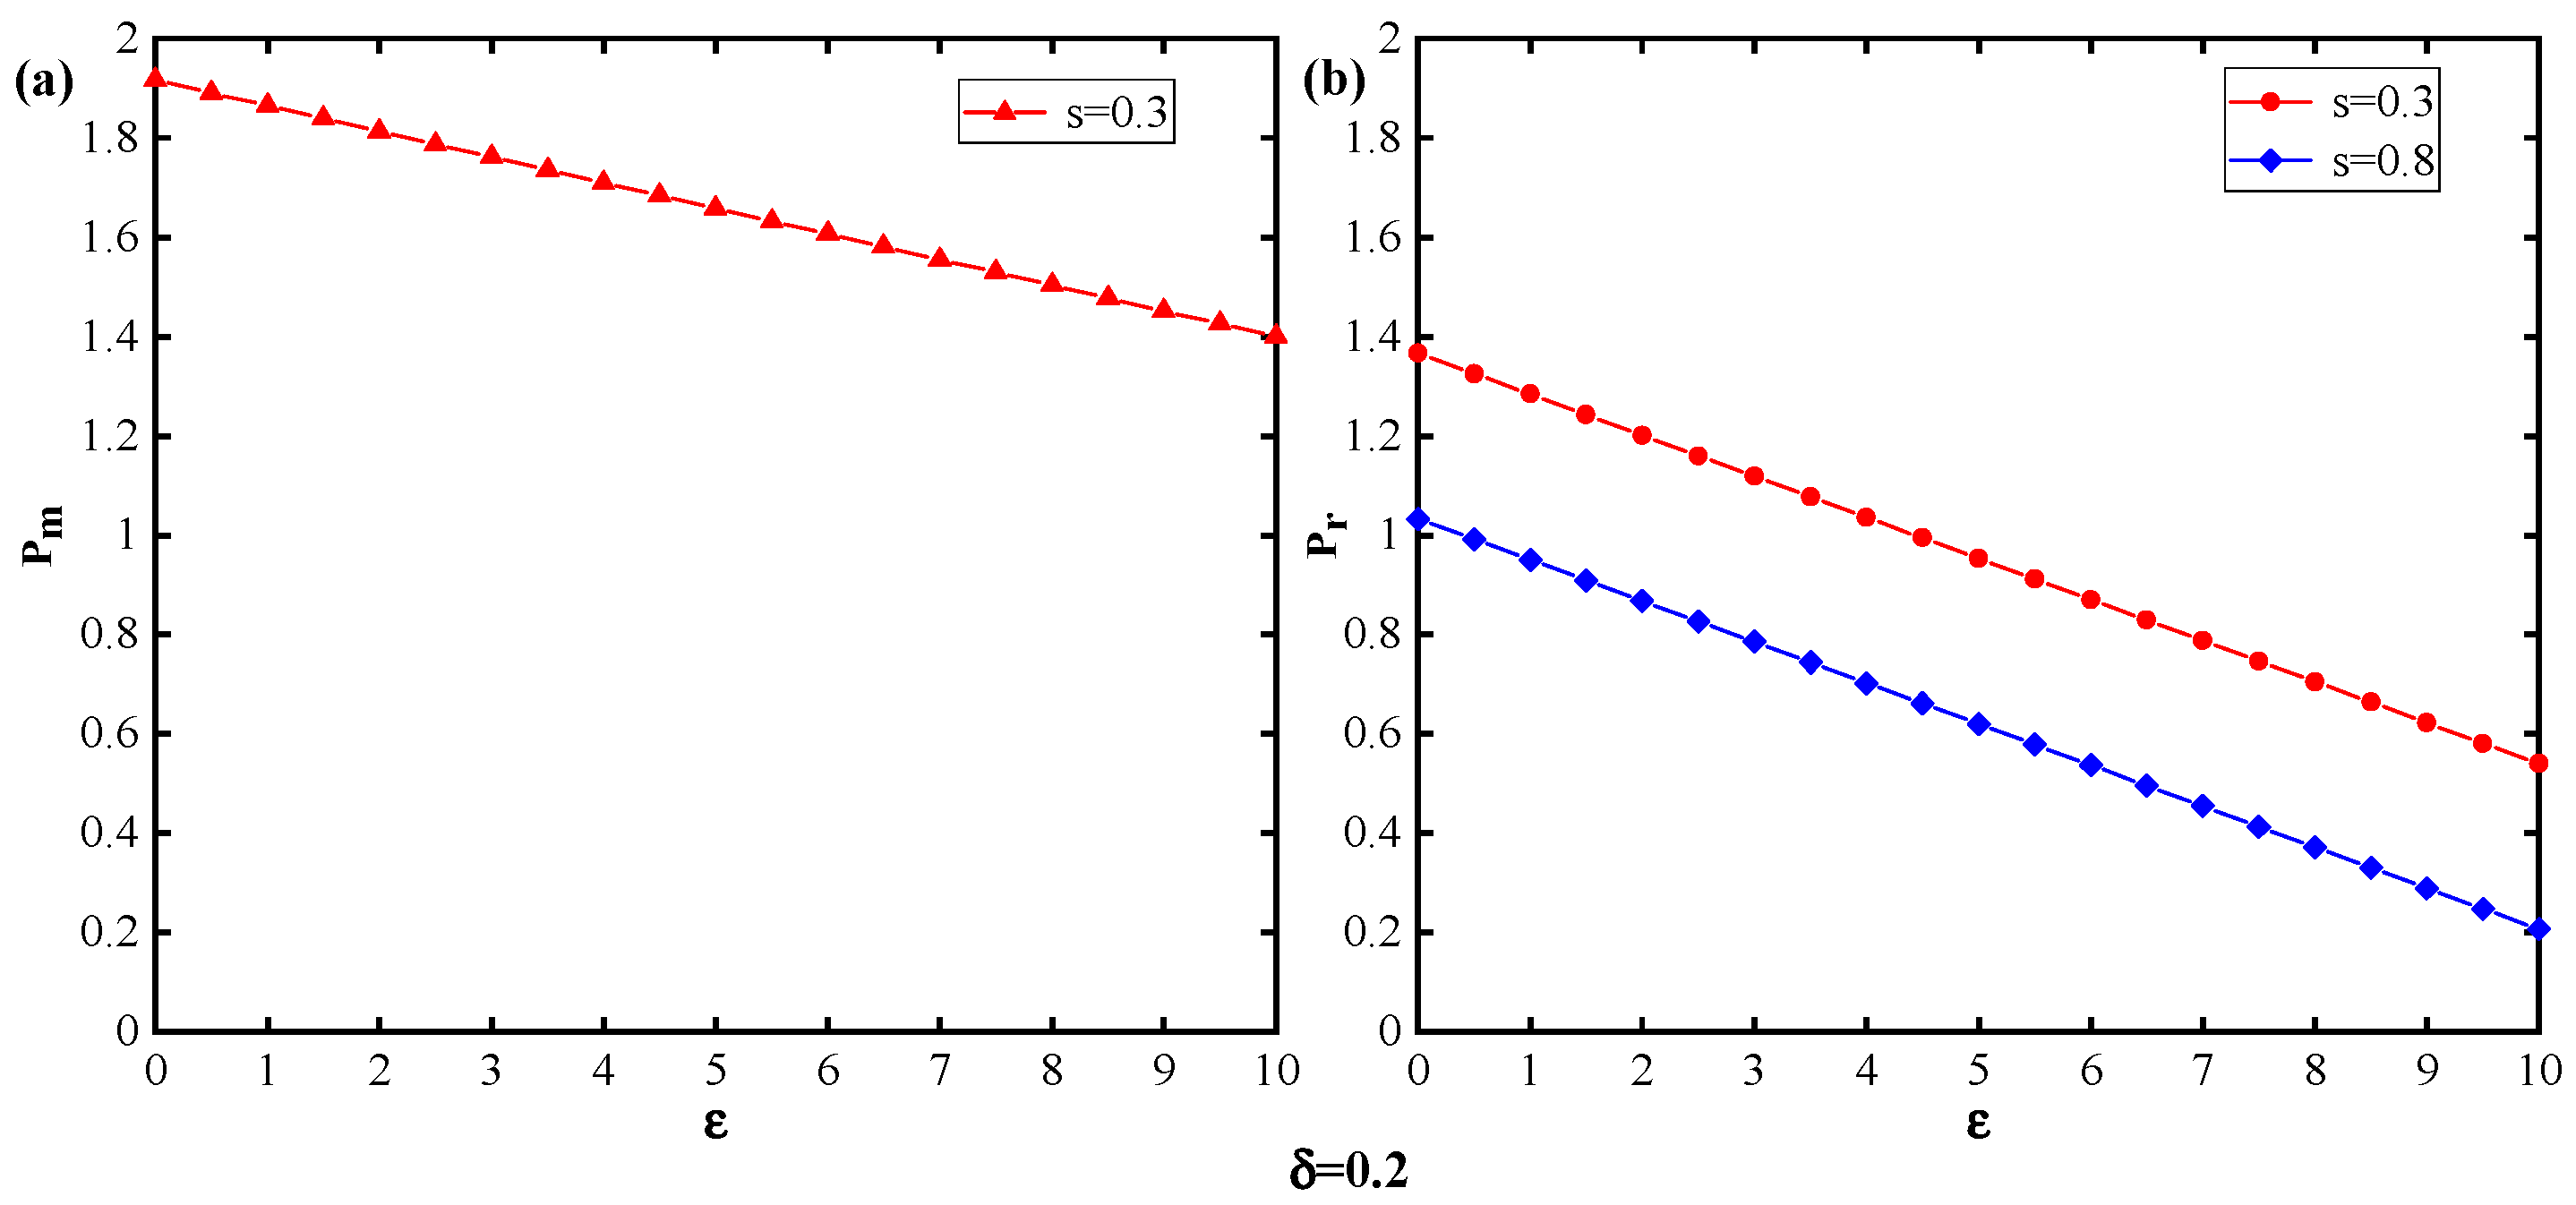
5.1. Impact on the Prices of Building Products and Recycled Building Materials

In addition to the basic parameters mentioned above, referring to [54,55], this section additionally sets up two scenarios of s = 0.3 and s = 0.8, and the results are shown in Figure 2.
Figure 2a,b show that for building material products and recycled building material products, the price decreases as the misrepresentation factor increases. This is because the higher the misrepresentation factor, the higher the actual process level of the remanufacturer and the lower its cost per unit of recycled building materials produced. Remanufacturers can expand consumer markets with lower prices, and manufacturers will also decrease prices to maintain their own market competitiveness. When a remanufacturer sells recycled building materials at a low price that does not correspond to the level of the remanufacturing process it presents, it can also reflect, to some extent, that it may misrepresent information. This is in line with the current situation of utilizing recycled materials in the international construction industry. An increase in the subsidies reduces the price of recycled building materials. Moreover, the government’s subsidy contributes to the normal operation of construction waste resource utilization.
The above results are slightly different from those of He et al. [56], who argue that government subsidies increase the price of remanufactured products when cost factors are taken into account. This paper, on the other hand, argues that government subsidies reduce the price of remanufactured products. The difference between the two is that this paper studies government subsidies to remanufacturers, whereas He et al. study government subsidies to retailers for selling remanufactured products.

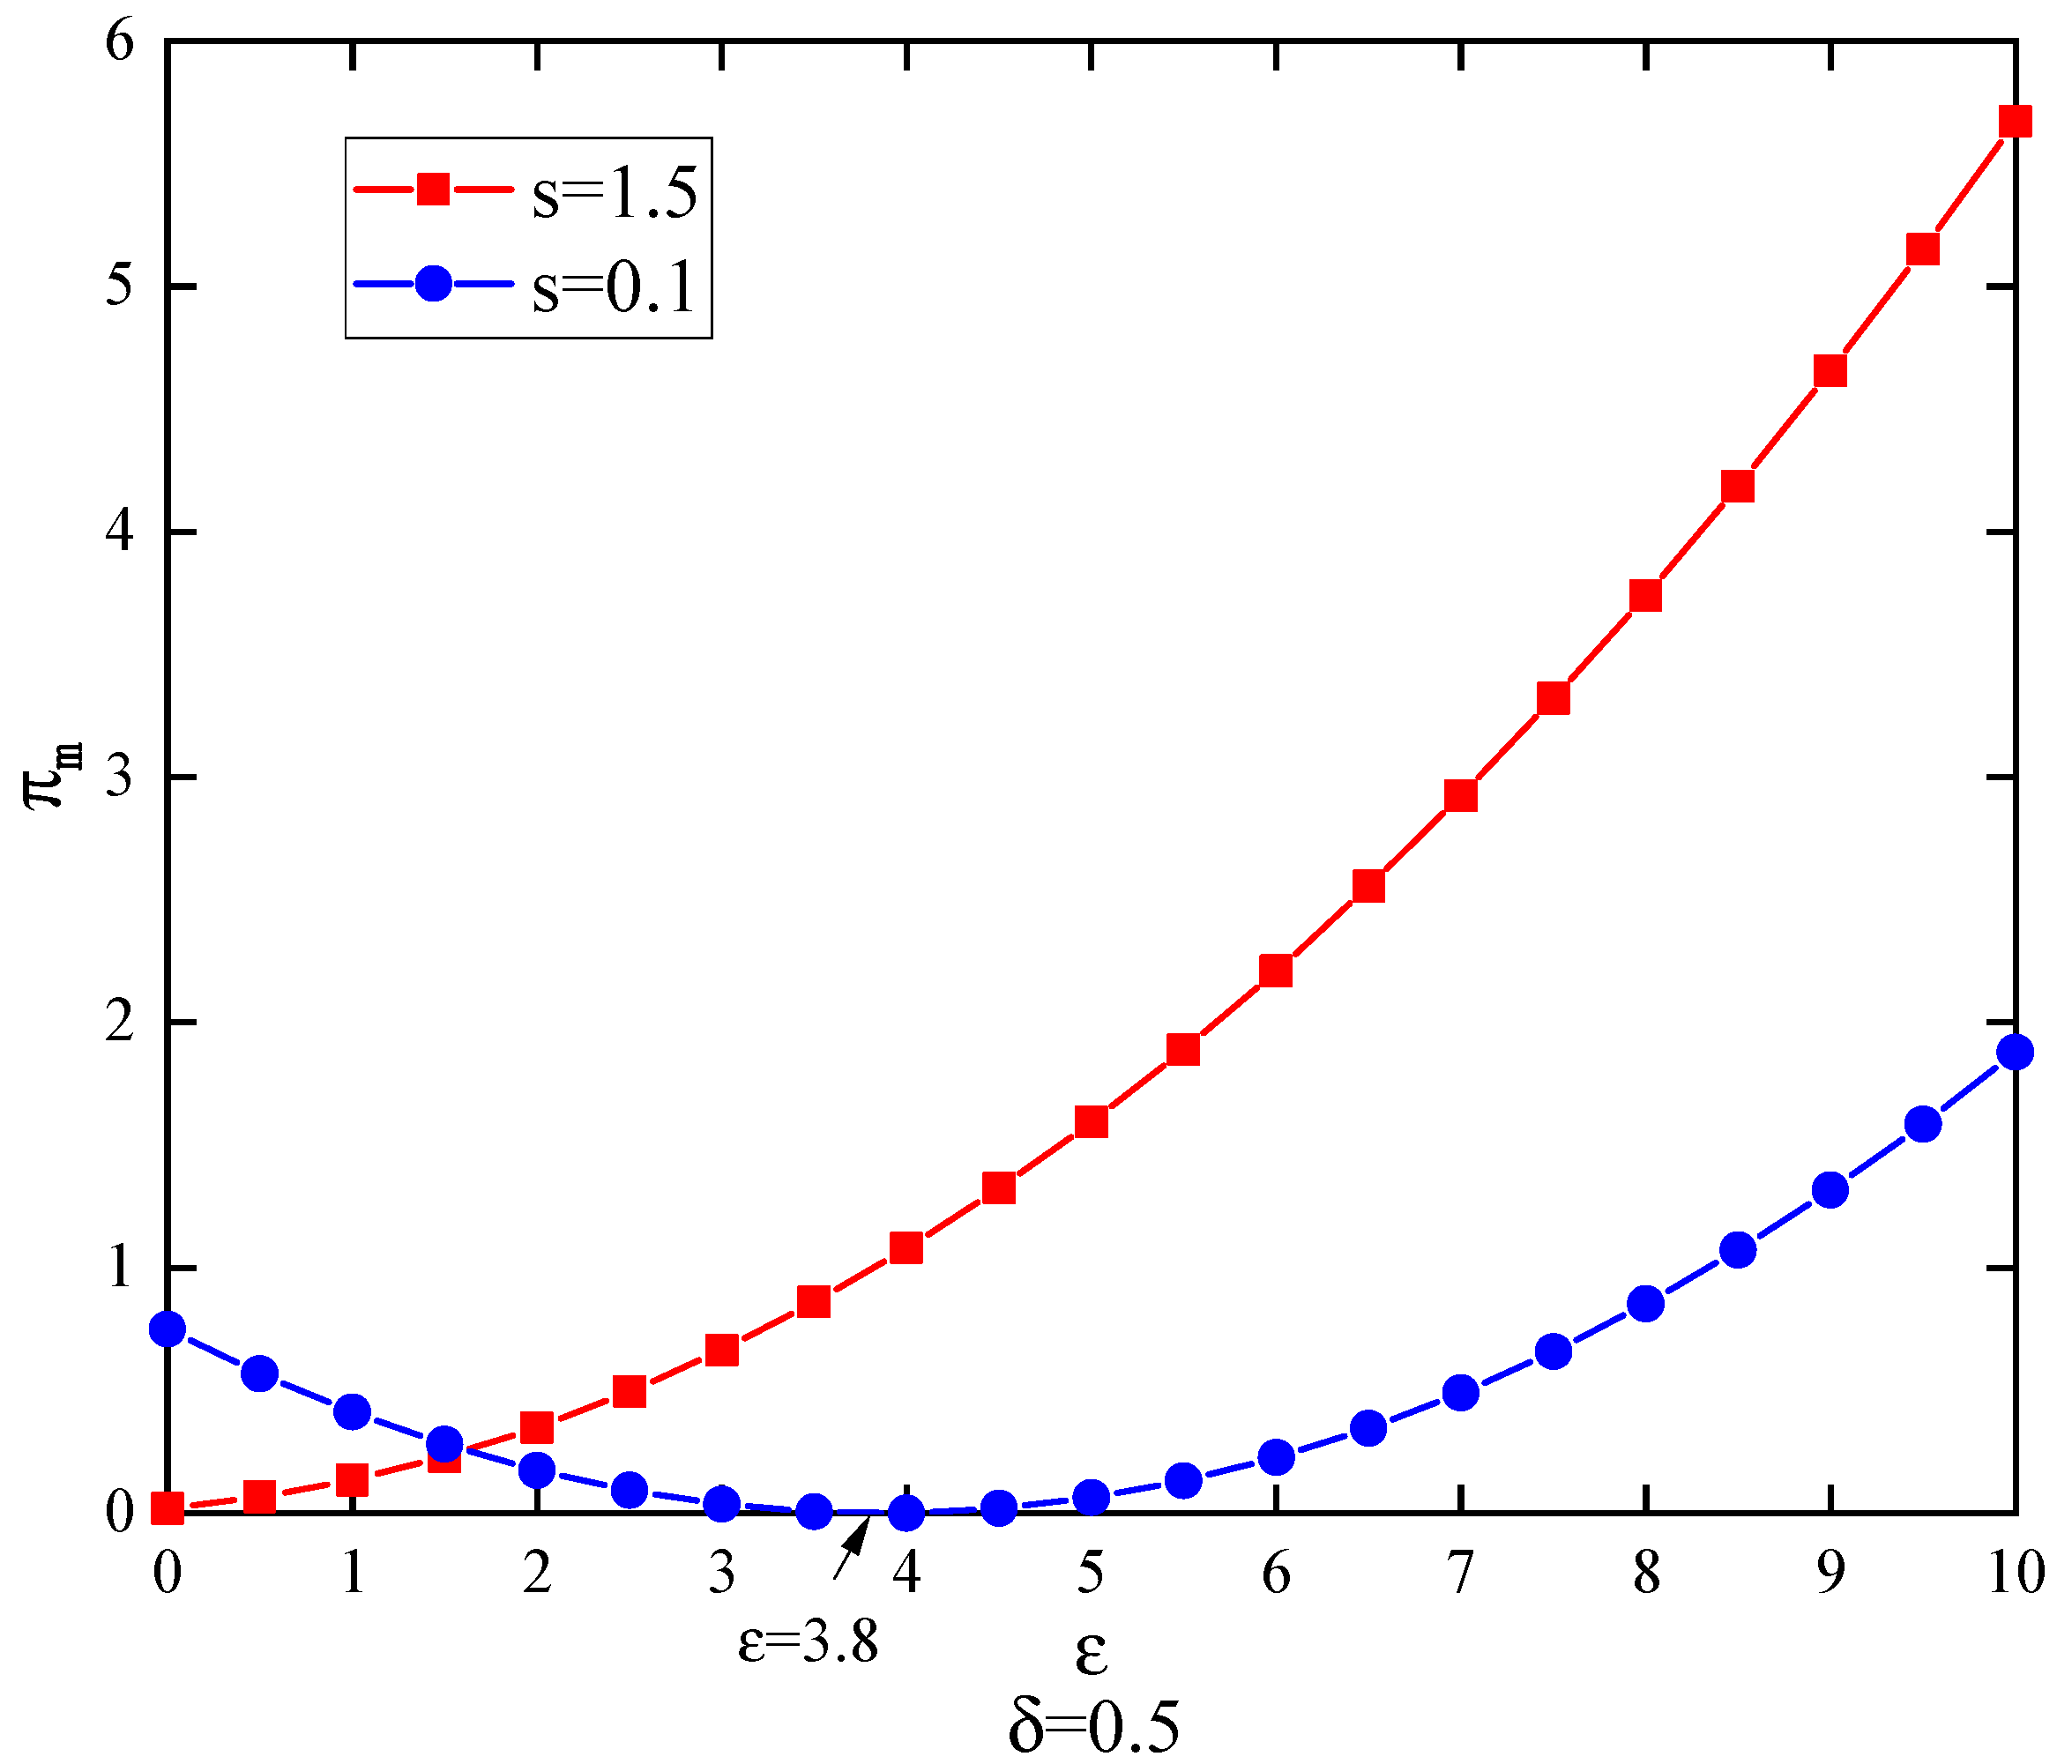
5.2. Impact on Manufacturers’ Profits

In addition to the basic parameters, referring to He et al. [54] and Zhang [57], this section additionally sets up two scenarios of s = 0.1 and s = 1.5, and the results are shown in Figure 3.
Figure 3 shows that, for manufacturers, when the government sets a low subsidy, with the increase in the misrepresentation factor, the manufacturer’s profit first decreases and then increases, and the extreme value point is ε = 3.8 . This is because when the misrepresentation factor increases within a small range, consumers are less skeptical of misrepresentation. Recycled building material products encroach on the market for building material products because of their low prices, reducing manufacturers’ profits. As the misrepresentation factor increases, consumer skepticism about misrepresentation can be an effective disincentive for recycled building products, and manufacturers’ profits can rebound [18]. When the government sets a high subsidy, the manufacturer’s profit is positively correlated with the misrepresentation factor. This shows that the government can set reasonable remanufacturing subsidies to regulate the remanufacturer’s misrepresentation of the impact of the manufacturer’s profit.
The above conclusions are slightly different from those of Wan et al. [58], who suggest that when the reliability of remanufacturing information increases (i.e., when the remanufacturer misreporting coefficient decreases), the manufacturer’s revenue decreases. However, when the subsidy set by the government is low, when the misreporting coefficient is less than a certain threshold, a decrease in the misreporting coefficient leads to an increase in the manufacturer’s revenue. The difference between the two is that Wan et al.’s study does not consider the effect of remanufacturing subsidies on manufacturers’ profits. In fact, the impact of remanufacturing subsidies on manufacturers cannot be ignored.

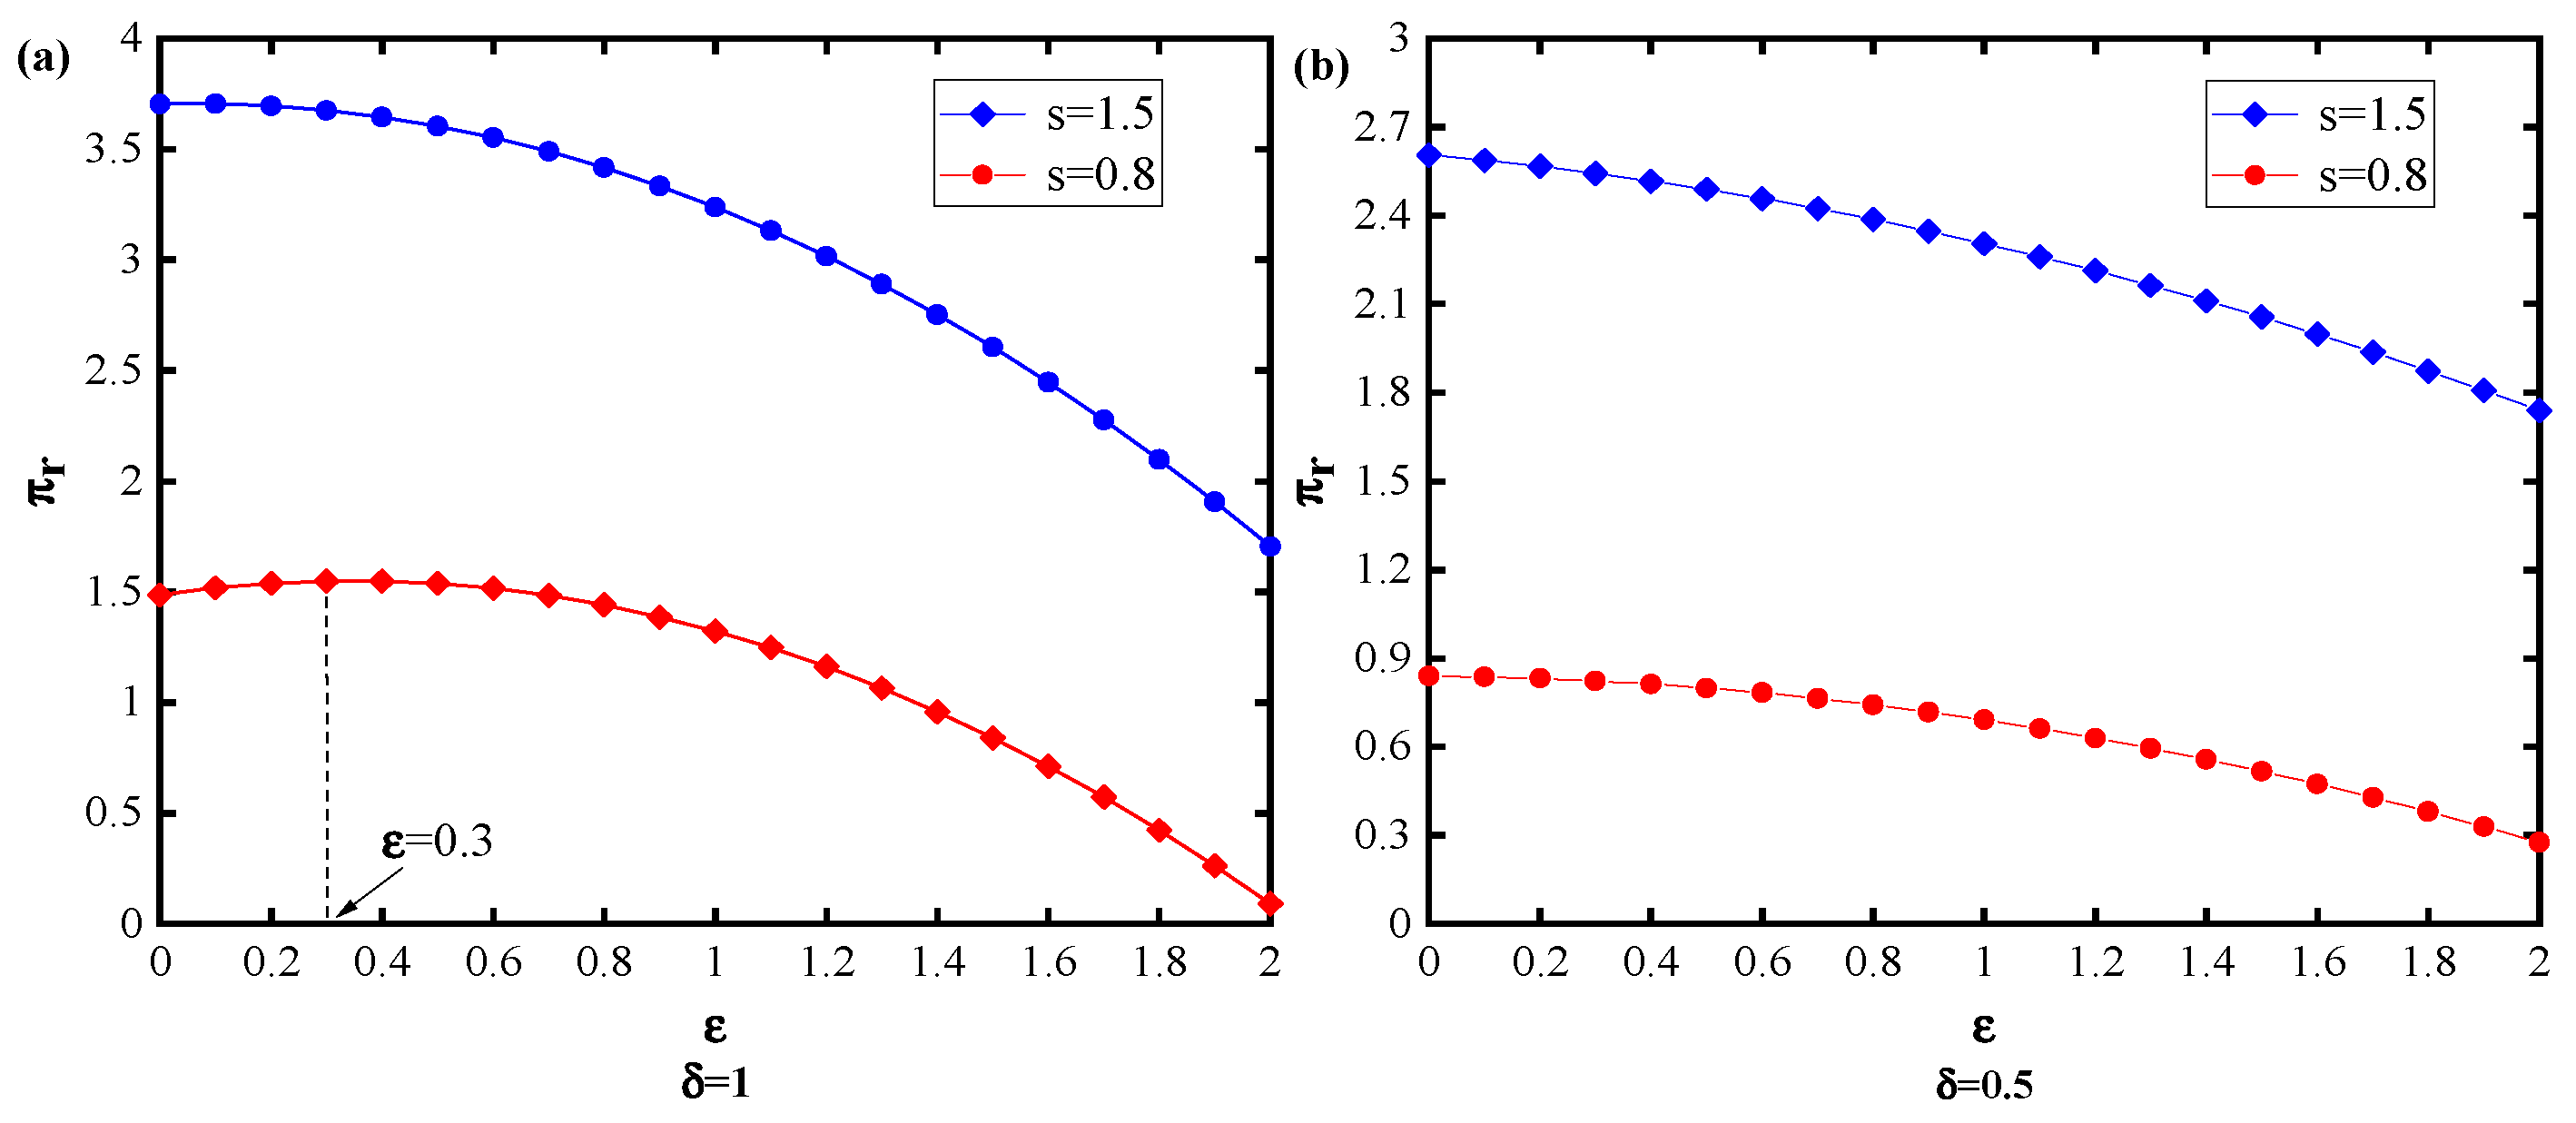
5.3. Impact on Remanufacturers’ Profits

In addition to the basic parameters, referring to the studies of Zhu et al. [55] and Zhang et al. [57], this section additionally sets up two scenarios of s = 0.8 and s = 1.5, and the results are shown in Figure 4.
Figure 4a shows that only when the remanufacturer has a high level of remanufacturing process and the government sets a low subsidy does the remanufacturer’s profit increase and then decrease with the misrepresentation factor, reaching the maximum value of the profit at time ε = 0.3 . However, the process of increase is not obvious. At this time, if the government sets a high subsidy, the profit of the remanufacturer is negatively correlated with the misrepresentation factor. This shows that the government can reduce remanufacturers’ misrepresentation of information by setting up a reasonable remanufacturing subsidy policy.
Figure 4b shows that when the remanufacturer’s remanufacturing process level is low, the remanufacturer’s profit is always negatively correlated with the misrepresentation factor, regardless of the subsidy set by the government. However, this does not mean that remanufacturers with a low level of remanufacturing processes benefit less from subsidies and are also affected by the misrepresentation factor. Even if the misrepresentation factor is the same, the higher the level of the remanufacturing process presented by the remanufacturer, the greater the difference from the actual level of the process. This is more likely to raise consumer suspicion and thus inhibit its development. Moreover, combining Figure 4a,b shows that the higher the subsidy set by the government, the more favorable it is to the profit of the remanufacturer. Thus, the government can incentivize the production of recycled manufacturers by setting reasonable remanufacturing subsidies.
These conclusions differ slightly from the findings of Ding et al. [17], which suggest that as the degree of misreporting increases, the profits of remanufacturers tend to increase. In contrast, this paper argues that in most cases, the profits of recycled manufacturers are declining. The difference between the two is that the study of Ding et al. is based on the perspective of media disclosure and consumer skepticism, whereas this paper is based on the perspective of government remanufacturing subsidies. Additionally, Ding et al. consider the misrepresentation of the degree of greenwashing by remanufacturers, whereas this paper considers the misrepresentation of the remanufacturing process level by remanufacturers.

5.4. Sensitivity Analysis

In addition to the basic parameters, refer to the studies of He et al. [54] and Zhang et al. [57]. In addition to expert opinions, this section also sets up the cases for s = 0.1, s = 1.3, and s = 1.5, and the results are shown in Figure 5.
Figure 5a shows the effect of market size Q on the profits of manufacturers and remanufacturers. As Q increases, the profit of the remanufacturer gradually increases, and the profit of the manufacturer decreases first, increases, and then reaches a very low value at Q = 4 . It is easy to understand that when the market size is small, manufacturers and remanufacturers are in competition, and remanufacturers have a certain advantage by virtue of their low prices and green advantages. When the market size is large, there will be cooperation between manufacturers and remanufacturers to realize profits with the same tendency to develop.
Figure 5b shows the effect of the recycling effort e of construction waste on manufacturers’ profits. The manufacturer’s profit decreases gradually with the increasing e only when the subsidy and misrepresentation factors are low. Figure 5c shows the effect of the recycling effort e of construction waste on the remanufacturer’s profit. When the misrepresentation factor is low, the manufacturer’s profit gradually decreases with the increasing e . When the misrepresentation factor is high, the manufacturer’s profit first increases and then decreases with the increasing e , but the increase is not significant. Combining Figure 5b,c, it can be seen that the government sets high subsidies to mitigate the negative impact of remanufacturers’ misrepresentation on manufacturers’ profits.
Figure 5d shows the effect of the ratio θ of consumers’ perceived value of recycled building materials to that of new products on the profits of manufacturers. The figure shows that only when the government sets a low subsidy and the misrepresentation factor is less than 0.86, the manufacturer’s profit does gradually decrease with the increasing θ . In other cases, the manufacturer’s profit first decreases and then increases. Figure 5e shows the effect of the ratio θ of consumers’ perceived value of recycled building materials to new products on the profit of remanufacturers. The figure shows that when the government sets the subsidy to 1.3, the profit of the remanufacturer increases with the increasing θ . In other cases, if the government sets the subsidy to 1.5, the profit of the remanufacturer decreases and then increases with the increasing θ , but the decrease is not obvious.

6. Conclusions and Implications

6.1. Conclusions

To reveal the influence mechanism of misrepresentation on the pricing decision of recycled building materials, this paper constructs a supply chain model composed of manufacturers and recycled manufacturers on the basis of social exchange theory. From this research, the following conclusions can be drawn:
(1) When the remanufacturing process level of the remanufacturer is low and the government adopts a low-subsidy policy, the remanufacturer’s misrepresentation of information will lead to a reduction in the profit of the building materials’ manufacturer only if the downward misrepresentation of the remanufacturing process level and the misrepresentation factor are below the threshold. If the government subsidy is within a certain range, only if the misrepresentation factor exceeds the threshold, the misrepresentation of the recycled building materials manufacturer will lead to a decrease in the profit of the manufacturer. Notably, when the government takes low subsidies, the profit of manufacturers and the misrepresentation factor follow a U-shaped trend. With the increase in subsidies, the profit extreme point of manufacturers shifted to the left. This means that in the case of high subsidies, the misrepresentation of the remanufacturer’s information can be transformed into a favorable factor for the profit of the manufacturers. At this time, misrepresentation of the information is also conducive to the profit of the remanufacturing manufacturers, and the benefits of the supply chain are maximized.
(2) When the remanufacturers themselves have a high level of remanufacturing, if the government adopts a low subsidy to control the misrepresentation factor within a reasonable range, it will be conducive to the profitability of the remanufacturers. In contrast, if the government sets high subsidies or the remanufacturer’s remanufacturing process level is low, the remanufacturer’s upward misrepresentation of the remanufacturing process level will lead to an increase in the profit of the remanufacturer, and the upward misrepresentation of the remanufacturing process level will lead to a decrease in the profit of the building materials manufacturer. When the remanufacturer’s remanufacturing process level is low, the remanufacturer’s profit is negatively related to the misrepresentation factor. When the remanufacturer’s remanufacturing process level is high, the profit of the remanufacturer is affected by both the misrepresentation factor and the government subsidy. If the government sets a low subsidy, the remanufacturer’s profit has an inverted U-shaped trend with the misrepresentation factor. In contrast, if the subsidy set by the government exceeds the threshold, the profit of remanufacturers is negatively related to the misrepresentation factor.

6.2. Implications

The management takeaways from this paper are as follows:
(1) Manufacturers and remanufacturers should fully consider the misrepresentation factor and flexibly determine the sales price of new and recycled building materials according to the actual situation. Misrepresentation of information does not necessarily improve their interests, and “extreme misrepresentation” not only harms their interests but also hinders the development of a circular economy. Therefore, the media can pay more attention to and report on the disclosure of misrepresentation. The government also needs to introduce relevant punitive policies and establish a reporting mechanism to prevent the occurrence of misrepresentation.
(2) The government should consider the remanufacturing process level and the impact of misrepresentation of information when formulating remanufacturing subsidies. When the remanufacturing process level of remanufacturers is low, the government should set low remanufacturing subsidies. Turning misrepresentation of information by remanufacturers into an enabling factor for manufacturers. To achieve a mutually profitable situation between the manufacturers and remanufacturers. When the remanufacturer’s remanufacturing process level is high, only changing the remanufacturing subsidy policy has been unable to prevent the remanufacturer from misrepresenting information on the profitability of manufacturers. Therefore, the government needs other interventions to reduce the negative impact of remanufacturers’ misrepresentation of information on manufacturers. For example, the government can subsidize a portion of remanufacturing to manufacturers or incentivize truthful information to ensure the overall profitability of the supply chain of building waste utilization and maintain its normal operation.

6.3. Limitations

Like many studies, this paper has several limitations. Although this paper considers the misrepresentation of the information behavior of remanufacturers, it ignores the impact of manufacturers’ behavior on supply chain decisions. However, building material manufacturers may also engage in misrepresentation of information behavior when they engage in information exchange among actual companies. Therefore, future research could incorporate scenarios where both building material manufacturers and recycled building material manufacturers have bilateral misrepresentation in the game model.

Author Contributions

Methodology, validation, formal analysis, investigation, resources, data curation, writing—original draft, writing—review and editing, and visualization, L.Z.; conceptualization, methodology, writing—original draft, supervision, and project administration, X.L.; data curation, writing—review and editing, Z.D., Y.W., J.P. and H.Z. All authors have read and agreed to the published version of the manuscript.

Funding

This research was funded by the National Natural Science Foundation of China (Grant Number 72204178), the Sichuan Science and Technology Program, the Natural Science Foundation of Sichuan, China (Grant Number 2023NSFSC1053), and the National College Students Innovation and Entrepreneurship Training Plan (Grant Number 202410626004).

Data Availability Statement

Data are contained within the article.

Conflicts of Interest

The authors declare that they have no conflicts of interest.

Appendix A

Proof of Proposition 1.
The difference between the price of recycled building material products in the NL model and the price of recycled building material products in the TL model is p r N L p r T L = δ 1 + ε 4 θ β e + q 0 4 2 θ . Since 0 < θ < 1 , 2 θ > 0 , 4 θ > 0 , when 0 < ε < 1 , p r N L < p r T L . When ε > 1 , p r N L > p r T L . For the same reason, p m N L p m T L = δ 1 + ε β e + q 0 2 2 θ , when 0 < ε < 1 , p m N L < p m T L , and when ε > 1 , p m N L > p m T L . □
Proof of Proposition 2.
The difference between the profit of the building materials manufacturer in the NL model and the profit of the building materials manufacturer in the TL model is π m N L π m T L = δ 1 ε β e + q 0 2 s + 4 Q 1 + θ + β δ 1 + ε e 2 1 + θ C m + δ 1 + ε q 0 8 2 θ 1 θ . Let δ 1 ε β ω + q 0 2 s + 4 Q 1 + θ + β δ 1 + ε e 2 1 + θ C m + δ 1 + ε q 0 = 0 , and solve for ε 1 = 2 s + ( 2 Q C m ) 1 θ δ β e + q 0 1 or ε 2 = 1 . Let 2 s + ( 2 Q C m ) 1 θ δ β e + q 0 1 = 0 , and solve for s 1 = ( 2 Q C m ) ( 1 θ ) 1 2 δ ( β e + q 0 ) . Let ( 2 Q C m ) ( 1 θ ) 1 2 δ ( β e + q 0 ) = 0 , and solve for δ = 2 1 + θ 2 Q C m β e + q 0 . Let ε 1 ε 2 = 0 , and solve for s 2 = ( 2 Q C m ) ( 1 θ ) β δ e δ q 0 , s 1 > s 2 . Combined with monotonicity, the analysis leads to the following:
When 0 < δ < 2 1 + θ 2 Q C m β e + q 0 , if 0 < s < ( 2 Q C m ) ( 1 θ ) β δ e δ q 0 , in the 0 < ε < 1 or ε > 2 s + ( 2 Q C m ) 1 θ δ β e + q 0 1 condition, π m N L < π m T L ; in the 1 < ε < 2 s + ( 2 Q C m ) 1 θ δ β e + q 0 1 condition, π m N L > π m T L ; if ( 2 Q C m ) ( 1 θ ) δ ( β e + q 0 ) < s < ( 2 Q C m ) ( 1 θ ) 1 2 δ ( β e + q 0 ) , in the 0 < ε < 2 s + ( 2 Q C m ) 1 θ δ β e + q 0 1 or ε > 1 condition, π m N L < π m T L ; in the 2 s + ( 2 Q C m ) 1 θ δ β e + q 0 1 < ε < 1 condition, π m N L > π m T L ; if s > ( 2 Q C m ) ( 1 θ ) 1 2 δ ( β e + q 0 ) , in the 0 < ε < 1 condition, π m N L > π m T L ; in the ε > 1 condition, π m N L < π m T L ; when δ > 2 1 θ 2 Q C m β e + q 0 , in the 0 < ε < 1 condition, π m N L > π m T L ; and in the ε > 1 condition, π m N L < π m T L . □
Proof of Proposition 3.
The proof of Proposition 3 follows the same steps as the proof of Proposition 2. The equations used in the calculations are too long, so we do not present them here. □
Proof of Proposition 4.
The profit of the building materials manufacturer in the TL model is as follows:
π m T L = 2 Q + s + 2 Q θ + β δ ε e + C m θ C m + δ ε q 0 2 8 2 3 θ + θ 2 . Let π m T L ε = 0 , and solve for ε = s + 1 + θ ( C m 2 Q ) δ β e + q 0 . Let s + 1 + θ ( C m 2 Q ) = 0 , and solve for s = 1 θ 2 Q C m . Combined with monotonicity, the analysis leads to the following:
When 0 < s < 1 θ 2 Q C m , if 0 < ε < s + 1 + θ ( C m 2 Q ) δ β e + q 0 , π m T L is negatively correlated with respect to ε , if 0 < ε < s + 1 + θ ( C m 2 Q ) δ β e + q 0 , π m T L is positively correlated with respect to ε ; when s > 1 θ 2 Q C m , π m T L is positively correlated with respect to ε . □
Proof of Proposition 5.
The proof of Proposition 5 follows the same steps as the proof of Proposition 4. The equations used in the calculations are too long, so we do not present them here. □

References

  1. Shooshtarian, S.; Maqsood, T.; Caldera, S.; Ryley, T. Transformation towards a circular economy in the Australian construction and demolition waste management system. Sustain. Prod. Consum. 2022, 30, 89–106. [Google Scholar] [CrossRef]
  2. Li, X.; Li, J.; Shen, Q. Infection mechanism of greenwashing behavior of construction material enterprises under multi-agent interaction. Dev. Built Environ. 2024, 17, 100321. [Google Scholar] [CrossRef]
  3. Moschen-Schimek, J.; Kasper, T.; Huber-Humer, M. Critical review of the recovery rates of construction and demo-lition waste in the European Union—An analysis of influencing factors in selected EU countries. Waste Manag. 2023, 167, 150–164. [Google Scholar] [CrossRef] [PubMed]
  4. Zhao, J.; Wang, C.; Xu, L. Decision for pricing, service, and recycling of closed-loop supply chains considering different remanufacturing roles and technology authorizations. Comput. Ind. Eng. 2019, 132, 59–73. [Google Scholar] [CrossRef]
  5. Nasir, M.H.A.; Genovese, A.; Acquaye, A.A.; Koh, S.; Yamoah, F. Comparing linear and circular supply chains: A case study from the construction industry. Int. J. Prod. Econ. 2016, 183, 443–457. [Google Scholar] [CrossRef]
  6. Hjaltadóttir, R.E.; Hild, P. Circular Economy in the building industry European policy and local practices. Eur. Plan. Stud. 2021, 29, 2226–2251. [Google Scholar] [CrossRef]
  7. Han, Y.; Zheng, H.; Huang, Y.; Li, X. Considering consumers’ green preferences and government subsidies in the decision making of the construction and demolition waste recycling supply chain: A Stackelberg Game approach. Buildings 2022, 12, 832. [Google Scholar] [CrossRef]
  8. Zheng, L.; Wu, H.; Zhang, H.; Duan, H.; Wang, J.; Jiang, W.; Dong, B.; Liu, G.; Zuo, J.; Song, Q. Characterizing the generation and flows of construction and demolition waste in China. Constr. Build. Mater. 2017, 136, 405–413. [Google Scholar] [CrossRef]
  9. Liu, J.; Gong, E.; Wang, X. Economic benefits of construction waste recycling enterprises under tax incentive policies. Environ. Sci. Pollut. Res. 2021, 29, 12574–12588. [Google Scholar] [CrossRef]
  10. Asgari, A.; Ghorbanian, T.; Yousefi, N.; Dadashzadeh, D.; Khalili, F.; Bagheri, A.; Raei, M.; Mahvi, A.H. Quality and quantity of construction and demolition waste in Tehran. J. Environ. Health Sci. Eng. 2017, 15, 14. [Google Scholar] [CrossRef]
  11. Huang, B.; Wang, X.; Kua, H.; Geng, Y.; Bleischwitz, R.; Ren, J. Construction and demolition waste management in China through the 3R principle. Resour. Conserv. Recycl. 2018, 129, 36–44. [Google Scholar] [CrossRef]
  12. Ortiz, O.; Pasqualino, J.; Castells, F. Environmental performance of construction waste: Comparing three scenarios from a case study in Catalonia, Spain. Waste Manag. 2010, 30, 646–654. [Google Scholar] [CrossRef]
  13. Yang, H.; Xia, J.; Thompson, J.R.; Flower, R.J. Urban construction and demolition waste and landfill failure in Shenzhen, China. Waste Manag. 2017, 63, 393–396. [Google Scholar] [CrossRef]
  14. Ajayi, S.O.; Oyedele, L.O.; Bilal, M.; Akinade, O.O.; Alaka, H.A.; Owolabi, H.A.; Kadiri, K.O. Waste effectiveness of the construction industry: Understanding the impediments and requisites for improvements. Resour. Conserv. Recycl. 2015, 102, 101–112. [Google Scholar] [CrossRef]
  15. Ajayi, S.O.; Oyedele, L.O. Policy imperatives for diverting construction waste from landfill: Experts’ recommendations for UK policy expansion. J. Clean. Prod. 2017, 147, 57–65. [Google Scholar] [CrossRef]
  16. Guangzhou City Management Committee (CMC); Guangzhou City Housing and Urban and Rural Construction Committee (GCHURCC); Guangzhou City Bureau of Finance (GCBF). The Tentative Management Measures for Financial Subsidies of Guangzhou City Construction Waste Comprehensive Utilization. 2015. Available online: https://www.gz.gov.cn/gfxwj/sbmgfxwj/gzscsglhzhzfj/content/post_5486460.html (accessed on 15 March 2025).
  17. Han, X.-H.; Xue, S.-J. Cooperation mechanism analysis for closed-loop supply chain under asymmetric information. Comput. Integr. Manuf. Syst. 2008, 14, 731–743. Available online: https://en.cnki.com.cn/Article_en/CJFDTOTAL-JSJJ200804016.htm (accessed on 15 March 2025).
  18. Li, X.; Ding, Z. Decision-making mechanisms of greenwashing behaviors of building materials manufacturers: A media disclosure and consumer skepticism perspective. Environ. Technol. Innov. 2024, 35, 103705. [Google Scholar] [CrossRef]
  19. Zhao, J.; Sun, N. Government subsidies-based profits distribution pattern analysis in closed-loop supply chain using game theory. Neural Comput. Appl. 2019, 32, 1715–1724. [Google Scholar] [CrossRef]
  20. Shen, L.Y.; Tam, V.W.Y.; Tam, C.M.; Drew, D. Mapping approach for examining waste management on construction sites. J. Constr. Eng. Manag. 2004, 130, 472–481. [Google Scholar] [CrossRef]
  21. Ding, Z.; Wang, Y.; Zou, P.X. An agent based environmental impact assessment of building demolition waste management: Conventional versus green management. J. Clean. Prod. 2016, 133, 1136–1153. [Google Scholar] [CrossRef]
  22. Gao, P.; Liu, S.; Zeng, L.; Peng, J.; Wang, Y.; Zhang, H.; Li, X. Leader and employee behavioral decision-making in construction and demolition waste recycling projects under psychological contract theory. Buildings 2024, 14, 2519. [Google Scholar] [CrossRef]
  23. Yi, B.; Zou, Y.; Chen, W.; Li, Z.; He, Y.; Jin, Z.; Zhang, H.; Li, X. Coevolution mechanism of remanufacturer–construction enterprise–public in construction and demolition waste resource utilization projects under green value co-creation. Buildings 2024, 14, 2214. [Google Scholar] [CrossRef]
  24. Liu, Y.; Hao, J.; Li, C.; Li, Y.; Zhou, C.; Zheng, H.; Xu, S.; Chen, W.; Li, X. How can construction and demolition waste recycling public–private partnership projects performance compensate during the operation period? A two-stage perspective of recycling and remanufacturing. Systems 2023, 11, 170. [Google Scholar] [CrossRef]
  25. Coronado, M.; Dosal, E.; Coz, A.; Viguri, J.R.; Andrés, A. Estimation of construction and demolition waste (C&DW) generation and multicriteria analysis of C&DW management alternatives: A case study in Spain. Waste Biomass Valorization 2011, 2, 209–225. [Google Scholar] [CrossRef]
  26. Li, D.; Peng, Y.; Guo, C.; Tan, R. Pricing strategy of construction and demolition waste considering retailer fairness concerns under a governmental regulation environment. Int. J. Environ. Res. Public Health 2019, 16, 3896. [Google Scholar] [CrossRef]
  27. Xu, W.; Zhang, Z.; Gong, D. Cooperative supply chain management under asymmetric information. J. Appl. Res. Technol. 2014, 12, 182–191. [Google Scholar] [CrossRef]
  28. Cachon, G.P.; Lariviere, M.A. Contracting to assure supply: How to share demand forecasts in a supply chain. Manag. Sci. 2001, 47, 629–646. [Google Scholar] [CrossRef]
  29. Wu, K.; Liu, M.; Xu, M. Misreporting strategies and coordination with supplier’s carbon emission reduction investment under different market powers. J. Syst. Manag. 2020, 29, 782. [Google Scholar]
  30. Zhao, S.; Mao, R. Contract design for a closed-loop supply chain considering information asymmetry of remanufacturing process innovation. Kybernetes 2023, 53, 3019–3040. [Google Scholar] [CrossRef]
  31. Chen, Z.; Huang, L. Digital twins for information-sharing in remanufacturing supply chain: A review. Energy 2021, 220, 119712. [Google Scholar] [CrossRef]
  32. Zhao, Y.; Zhou, H.; Wang, Y. Outsourcing remanufacturing and collecting strategies analysis with information asymmetry. Comput. Ind. Eng. 2021, 160, 107561. [Google Scholar] [CrossRef]
  33. Ahmad, R.; Nawaz, M.R.; Ishaq, M.I.; Khan, M.M.; Ashraf, H.A. Social exchange theory: Systematic review and future directions. Front. Psychol. 2023, 13, 1015921. [Google Scholar] [CrossRef]
  34. Foa, U.G.; Foa, E.B. Societal Structures of the Mind; Charles C Thomas: Springfield, IL, USA, 1974. [Google Scholar]
  35. Cook, K.S.; Cheshire, C.; Rice, E.R.W.; Nakagawa, S. Social exchange theory. In Handbooks of Sociology and Social Research; Springer: Dordrecht, The Netherlands, 2013; pp. 61–88. [Google Scholar] [CrossRef]
  36. Cropanzano, R.; Anthony, E.L.; Daniels, S.R.; Hall, A.V. Social exchange theory: A critical review with theoretical remedies. Acad. Manag. Ann. 2017, 11, 479–516. [Google Scholar] [CrossRef]
  37. Cropanzano, R.; Mitchell, M.S. Social exchange theory: An interdisciplinary review. J. Manag. 2005, 31, 874–900. [Google Scholar] [CrossRef]
  38. Church, M.; Thambusamy, R.; Nemati, H. User misrepresentation in online social networks: How competition and altruism impact online disclosure behaviours. Behav. Inf. Technol. 2019, 39, 1320–1340. [Google Scholar] [CrossRef]
  39. Li, P.; Rao, C.; Goh, M.; Yang, Z. Pricing strategies and profit coordination under a double echelon green supply chain. J. Clean. Prod. 2020, 278, 123694. [Google Scholar] [CrossRef]
  40. Chen, J.; Zhou, Y.; Zhong, Y. A pricing/ordering model for a dyadic supply chain with buyback guarantee financing and fairness concerns. Int. J. Prod. Res. 2017, 55, 5287–5304. [Google Scholar] [CrossRef]
  41. Barman, A.; De, P.K.; Chakraborty, A.K.; Lim, C.P.; Das, R. Optimal pricing policy in a three-layer dual-channel supply chain under government subsidy in green manufacturing. Math. Comput. Simul. 2022, 204, 401–429. [Google Scholar] [CrossRef]
  42. Zhang, X.; Xu, Y.; Chen, X.; Liang, J. Pricing decision models of manufacturer-led dual-channel supply chain with free-rider problem. Sustainability 2023, 15, 4087. [Google Scholar] [CrossRef]
  43. Wang, S.; Liu, L.; Wen, J.; Wang, G. Product pricing and green decision-making considering consumers’ multiple preferences under chain-to-chain competition. Kybernetes 2022, 53, 152–187. [Google Scholar] [CrossRef]
  44. Guo, H.; Liu, Z.; Hu, B.; Lin, H.; Shi, L.; Meng, C. Pricing and coordination mechanism of supply chain considering product recycling under asymmetric power. Math. Probl. Eng. 2021, 2021, 5579655. [Google Scholar] [CrossRef]
  45. Meng, Q.; Li, M.; Liu, W.; Li, Z.; Zhang, J. Pricing policies of dual-channel green supply chain: Considering government subsidies and consumers’ dual preferences. Sustain. Prod. Consum. 2021, 26, 1021–1030. [Google Scholar] [CrossRef]
  46. Zhang, Y.; Zhang, W. Optimal pricing and greening decisions in a supply chain when considering market segmentation. Ann. Oper. Res. 2022, 324, 93–130. [Google Scholar] [CrossRef]
  47. Peng, J.; Zou, Y.; Zhang, H.; Zeng, L.; Wang, Y.; Li, X. Pricing decision-making considering ambiguity tolerance in consumers: Evidence from recycled building material enterprises. Systems 2025, 13, 98. [Google Scholar] [CrossRef]
  48. Savaskan, R.C.; Bhattacharya, S.; Van Wassenhove, L.N. Closed-loop supply chain models with product remanufacturing. Manag. Sci. 2004, 50, 239–252. [Google Scholar] [CrossRef]
  49. Maiti, T.; Giri, B. A closed loop supply chain under retail price and product quality dependent demand. J. Manuf. Syst. 2015, 37, 624–637. [Google Scholar] [CrossRef]
  50. Zhang, H.; Chen, W.; Peng, J.; Wang, Y.; Zeng, L.; Gao, P.; Zhu, X.; Li, X. Pricing decisions in construction and demolition waste recycling supply chains under carbon tax scenarios. Systems 2024, 12, 35. [Google Scholar] [CrossRef]
  51. Zhao, L.; Chang, J.; Du, J. Dynamics analysis on competition between manufacturing and remanufacturing in context of government subsidies. Chaos Solitons Fractals/Chaos Solitons Fractals 2019, 121, 119–128. [Google Scholar] [CrossRef]
  52. Doerner, K.; Focke, A.; Gutjahr, W.J. Multicriteria tour planning for mobile healthcare facilities in a developing country. Eur. J. Oper. Res. 2007, 179, 1078–1096. [Google Scholar] [CrossRef]
  53. Ding, B.; Zhu, Y. Impact of information misreporting on decision-making of remanufacturing closed-loop supply chain. J. Shandong Univ. (Nat. Sci.) 2023, 58, 84–100. Available online: https://link.cnki.net/urlid/37.1389.N.20230516.1709.014 (accessed on 15 March 2025).
  54. He, P.; He, Y.; Xu, H. Channel structure and pricing in a dual-channel closed-loop supply chain with government subsidy. Int. J. Prod. Econ. 2019, 213, 108–123. [Google Scholar] [CrossRef]
  55. Zhu, X.; Ren, M.; Chu, W.; Chiong, R. Remanufacturing subsidy or carbon regulation? An alternative toward sustainable production. J. Clean. Prod. 2019, 239, 117988. [Google Scholar] [CrossRef]
  56. He, Z.; Zhang, T.; Yang, X. A study on the pricing decision of remanufacturing products considering government subsidies in a carbon trading environment. Math. Probl. Eng. 2022, 2022, 1849404. [Google Scholar] [CrossRef]
  57. Zhang, L.; Zhang, Z. Complex effects of cooperative behavior on authorized remanufacturing supply chain decisions under subsidies. PLoS ONE 2023, 18, e0291940. [Google Scholar] [CrossRef]
  58. Wan, X.; Yang, D.; Wang, T.; Deveci, M. Closed-loop supply chain decision considering information reliability and security: Should the supply chain adopt federated learning decision support systems? Ann. Oper. Res. 2023. [Google Scholar] [CrossRef]
Figure 1. Game model.
Buildings 15 00967 g001
Figure 2. Impact on the prices of building products and recycled building materials: (a) s = 0.3; (b) s = 0.3 and 0.8.
Buildings 15 00967 g002
Figure 3. Impact on the profits of manufacturers for s = 0.1 and s = 1.5.
Buildings 15 00967 g003
Figure 4. Impact on the profits of remanufacturers at (a) δ = 1.0 and (b) 0.5.
Buildings 15 00967 g004
Figure 5. Impacts of the key parameters e , θ , and Q on the profitability of manufacturers and remanufacturers. In particular, subfigure (a) represents the effect of market size on the profits of manufacturers and remanufacturers. Subfigures (b,c) represent the effect of the recycling effort of construction waste on manufacturers’ profits and remanufacturers’ profits. Subfigures (d,e) represent the effect of the ratio of consumers’ perceived value of recycled building materials to new products on the profit of manufacturers and remanufacturers.
Buildings 15 00967 g005
Table 1. Research related to CDW management, misrepresentation of information, social exchange theory, and supply chain pricing decisions.
Research TopicsDimensionsSources
CDW managementImportance of CDW management[20,21]
CDW management is influenced by business, the public, and government[22,23,24]
Developed and applied a two-step methodology for CDW quantification and management analysis[25]
Analyze the best government policies based on the remanufacturing capacity of CDW recycling units[26]
Misrepresentation of informationInformation is one of the main factors determining the competitiveness of enterprises[27,28]
Firms misrepresenting or withholding information based on their own profits[29]
Information asymmetry undermines supply chain profitability and efficiency[30,31]
Digital twin technology facilitates the problem of misrepresentation of information[31]
Optimal decision making based on remanufacturing outsourcers’ misrepresentation of information[32]
Social exchange theoryThe usefulness of social exchange theory is a typical social transaction[33]
The value of the results of social exchanges depends on the subjective feelings of the parties concerned[34]
The party exchanges with others under the expectation of receiving a return[35]
There are positive and negative behaviors in social exchange[36,37,38]
Supply chain pricing decisionsImpact of pricing decisions on profit and coordination strategies of supply chain members[39]
Preferences of supply chain members in pricing strategies[39,40]
Influence mechanisms of supply chain members in pricing strategies[41,42,43,44]
Table 2. Parameter settings.
ParameterDescriptionUnitSource Papers
p m Unit market price of building material productsUSD/t[47]
p r Unit market price of recycled building material productsUSD/t[47]
e Recycling efforts1[48]
C m Unit cost of building productsUSD/t[49]
C r Unit cost of recycled building material productsUSD/t[49]
q m Market demand for building productst[50]
q r Market demand for recycled building productst[50]
l Recovery effort cost factor1[48]
β Recovery effort elasticity coefficient1[22]
q 0 Initial recovery mass when no recovery effort is invested1[26]
δ Remanufacturing process level1[24]
ε Remanufacturing process misrepresentation factor ( ε > 0 )1[17]
s Amount of government subsidy for unit remanufactured products ( s > 0 )USD/t[51]
Q Total market sizehundred billion dollars[24]
θ Ratio of consumer perceived value of recycled building materials to new products ( 0 < θ < 1 )1[47]
Disclaimer/Publisher’s Note: The statements, opinions and data contained in all publications are solely those of the individual author(s) and contributor(s) and not of MDPI and/or the editor(s). MDPI and/or the editor(s) disclaim responsibility for any injury to people or property resulting from any ideas, methods, instructions or products referred to in the content.

