Article

An Intervention Study of Employee Safety Behavior in Nuclear Power Plants Under Construction Based on the SEM-SD Model

1
Zhangzhou Project Department, China Nuclear Power Engineering Co., Ltd., Zhangzhou 363306, China
2
College of Safety and Environmental Engineering, Shandong University of Science and Technology, Qingdao 266590, China
*
Authors to whom correspondence should be addressed.
Buildings 2025, 15(6), 954; https://doi.org/10.3390/buildings15060954
Submission received: 13 February 2025 / Revised: 26 February 2025 / Accepted: 10 March 2025 / Published: 18 March 2025

Abstract

Employee behavior is a key factor affecting the safe construction of nuclear power plants and is directly related to whether construction work can be carried out smoothly. However, employee behaviors are difficult to quantify, which brings significant challenges to safety management and control. To this end, this paper constructs an SEM-SD model to explore in depth the intrinsic relationship between burnout, unsafe behaviors, and safety climate, and simulates and analyzes the dynamic evolution process of these factors. Based on the analysis results, this paper proposes a joint intervention strategy system for burnout and unsafe behaviors of employees in nuclear power plants under construction. In addition, this paper designs and develops an intervention system to effectively deal with burnout and unsafe behaviors. The research results not only clarify the system of intervention methods for the safety behavior of employees in nuclear power plants under construction, but also provide a theoretical basis and practical reference for the management and control of employees’ unsafe behaviors, thus providing strong support for the safe construction of nuclear power plant projects.

1. Introduction

1.1. Research Background

In industrial accidents, human unsafe behavior is one of the main causes of such accidents [1], with a proportion as high as 80–90%, and the same is true during the construction process of nuclear power plants. Nuclear energy has become one of the main contributors to the world’s energy structure. Among the 33 countries operating nuclear reactors, the share of nuclear energy is about 10%. Due to the development of safe and advanced nuclear power plant technologies, many countries are planning to consider nuclear energy [2]. The working environment of nuclear power plants under construction is extremely complex. When employees operate various pieces of large-scale mechanical equipment, they face risks of collision and crushing. The occurrence of accidents not only threatens the personal safety of construction personnel, but also causes property losses [3]. Research shows that more than 90% of nuclear power accidents are caused by human errors [4]. The safe behavior of employees can avoid engineering quality problems caused by accidents. The effective management of employees’ safety behaviors helps to ensure construction progress. More importantly, the safety issues of nuclear power plants are related to the security and stability of society. Studying the safety behaviors of employees and improving the safety of nuclear power plant construction can enhance society’s confidence in nuclear energy. This helps nuclear energy to develop continuously and healthily in the energy field, provides society with a clean and stable energy supply, and, at the same time, avoids social unrest caused by nuclear accidents.
It is very necessary to identify and correct unsafe behaviors that may lead to accidents in advance by studying the safety behaviors of employees. Conducting research on the safety behaviors of employees in nuclear power plants under construction is a key factor in accident prevention. Newaz M. T. used the methods of systematic review and key content analysis to summarize the current knowledge status of safety behavior technology [5]. At the same time, the construction of nuclear power plants is strictly regulated by the laws and regulations of various governments. By analyzing the behavior patterns of employees at work and identifying safe and unsafe behaviors, targeted safety training can be provided for employees, thereby ensuring the life and health of employees. Identifying the risk evolution characteristics and paths of employees’ unsafe behaviors has always been a challenge for safety management [6,7].
Workers’ unsafe behaviors are the most direct cause of safety accidents in nuclear power plants. The main research direction for strengthening the safe production of nuclear power plants is to focus on human factors, such as controlling workers’ unsafe behaviors. Research on unsafe behaviors has always been the focus of scholars at home and abroad. On construction sites, most of the subjects of unsafe behaviors are front-line construction workers. Haslam R.A. analyzed 100 safety accidents in the construction field and concluded that the proportion of accidents directly caused by workers or work teams is as high as 70% [8]. In the early 1970s, Heinrich first put forward the Heinrich chain accident model, which pointed out that the main causes leading to accidents are human unsafe behaviors and unsafe states of objects [9]. Professor James Reason of the University of Manchester put forward the Reason model in his book “Human Error”, which states that accidents occur following the law of “decision-making errors, poor management, forming the direct premise of unsafe behaviors, generating unsafe behaviors, and failure of the defense system” [10]. Diaz and Cabrera et al. believe that the safety environment is the employees’ perception of working conditions and will affect employees’ safety behaviors [11]. Fogarty and Shaw (2010) verified the positive impact of safety climate on employees’ safety behaviors from the perspective of social psychology [12]. In terms of individual factors, Geller S. et al. believe that imperfect personality traits are very likely to cause unsafe behaviors and, thus, lead to safety accidents [13]. Verschuur W.L. [14], Choudhry R.M. [15], and Aksorn T. [16] put forward the impact of individual differences on unsafe behaviors from the perspectives of individual psychological and physiological or physical conditions, personal experiences, etc. In 2013, Fu Gui et al., from China University of Mining and Technology (Beijing), conducted in-depth research and sublimation on the accident causation theory based on the existing accident causation chains and constructed the “2–4” model of behavioral safety, dividing the causes of accidents into two aspects: organizational behaviors and individual behaviors [17,18,19,20,21]. In summary, research on construction workers’ unsafe behaviors mainly focuses on the individual level, which mainly includes the causes, influencing factors, and formation mechanisms of unsafe behaviors.
Job burnout is a stress-related phenomenon that poses a significant threat to the health and performance of organizations and employees. Due to the lack of comprehensive tools that take into account the stressors in the work system, the intervention measures to improve the potential for job burnout are limited [22]. Through a critical analysis of the research and practice on job burnout, the nature, influencing factors, and coping methods of job burnout were explored, which is helpful for in-depth research on how employee burnout leads to unsafe behaviors and how to conduct effective interventions [23,24,25,26]. In order to study the relationships among employees’ job burnout, self-efficacy, and safety performance, the method was adopted to construct a functional model of miners’ job burnout and safety performance under the moderating effect of self-efficacy [27,28].
The development potential of digital data and their infrastructure has created new opportunities for economic growth. SAR (Structural Autoregression), SEM (Structural Equation Modeling), and SAC (Spatial Autocorrelation) were used to show the short-term negative effects and long-term positive effects of the digital data economy on economic growth, which were confirmed through the calculation of marginal effects [29,30,31,32,33,34]. Karaz, M. expressed the causal structures that might lead to MD (Modeling Discrepancy) in construction projects through Causal Loop Diagrams (CLD), evaluated 25 strategies for solving MD using Structural Equation Modeling (SEM) in LPS (Lean Production System) and BIM (Building Information Modeling) strategies. Subsequently, based on the basic causal loop diagrams and the mathematical relationships among variables, a System Dynamics Model (SDM) was formulated to study the LPS-BIM strategies for MD decisions in construction projects, and this model was applied to three projects to conduct simulations for four LPS-BIM scenarios [35]. Wang Yadong et al., in order to explore the development trend of intelligent construction technology in the construction field, constructed a System Dynamics Model for the application and development of BIM (Building Information Modeling) and the new generation of information technology in the construction industry based on System Dynamics (SD) theory and Structural Equation Model (SEM). They used Vensim DSS to explore the relationships between the SD model and six subsystems, and carried out dynamic simulation and sensitivity analysis [36].

1.2. Research Methodology

SEM (Structural Equation Modeling) methodology aims to identify the key influences and path relationships between job burnout and unsafe behaviors. Data sources are questionnaires, behavioral records, and environmental data. Questionnaires use standardized scales to collect employee-related data; behavioral records are collected through smart devices; and environmental data are monitored by sensors. AMOS(2024) or SmartPLS(9.2) software was used to construct the model, quantify the path coefficients, and identify critical paths and moderating variables.
The SD (System Dynamics) method was used to model the dynamic changes in burnout and unsafe behaviors and predict the effects of interventions. SEM results were transformed into SD model variables; feedback loops were designed and simulated with Vensim(9.2) or AnyLogic(8.8.6) software to model different intervention strategies. Outputs include trend predictions for the next 3–6 months and cost-effectiveness assessments of interventions.
Based on the results of the SEM-SD model analysis, a burnout and unsafe behavior intervention system is designed and developed. The system functions cover real-time data collection, risk warning, and personalized intervention suggestions. For technical implementation, questionnaires, sensor data, and environmental data are integrated into a unified platform, machine learning algorithms are used to identify high-risk employee groups, and a visual dashboard is developed to facilitate real-time monitoring and decision making by managers in order to enhance job safety and employee well-being. In addition to the use of SEM and SD models, advanced 3D visualization techniques and sensitivity analysis methods were introduced in this study. Through the 3D visualization technology, we can visualize the change trend of employees’ burnout and unsafe behaviors under simulated intervention strategies. The sensitivity analysis method, on the other hand, is used to assess the degree of impact of different intervention strategies on different groups of employees so as to determine the optimal intervention program.

2. The Index System of Behavior from the Perspective of Job Burnout

2.1. Model Construction

2.1.1. Job Burnout and Unsafe Behaviors

The Affective Events Theory points out that employees’ experiences at work can induce both positive and negative emotional experiences in individuals. Various emotional responses of individuals, on the one hand, directly guide individuals’ behaviors, and, on the other hand, indirectly guide individuals’ behaviors through the influence on their attitudes, that is, emotion-driven behaviors and attitude-driven behaviors. Therefore, emotional exhaustion, on the one hand, prompts employees to engage in unsafe behaviors, and, on the other hand, indirectly leads to the occurrence of unsafe behaviors through depersonalization. Job burnout is one of the psychological causes for behaviors. If the occurrence of job burnout can be controlled in a timely manner and psychological factors are adjusted, unsafe behaviors may be prevented.
Advanced predictive algorithms can be combined with advanced predictive algorithm dynamics when anticipating unsafe behaviors. Neural networks (especially Convolutional Neural Networks, CNNs, and Recurrent Neural Networks, RNNs) are effective in capturing complex relationships and patterns due to their powerful modeling capabilities. CNNs are suitable for spatial data (e.g., images or videos) and can be used to analyze behavioral gestures or environmental scenarios, while RNNs (e.g., LSTMs) excel in processing time-series data and are capable of modeling behavioral dynamics and long-term dependencies. By training these networks, the system can learn the characteristics of unsafe behaviors from multiple sources of data and predict potential risks in real time. Combined with real-time data stream processing and dynamic feedback mechanisms, neural networks can continuously optimize the prediction accuracy and provide strong support for risk warning and decision making.

2.1.2. Theoretical Assumptions

The overall objective of this study is to establish and test models for exploring the behavioral safety among employees in nuclear power plants under construction. This paper will evaluate the direct impacts of work pressure and work ability on job burnout among samples of employees in nuclear power plants under construction. Several models of the pressure–job burnout relationship suggest that job burnout is the result or emotional response of an individual being exposed to long-term work pressure. Therefore, the following assumptions are made: The relationship between work pressure and job burnout depends on the composition of the work system, which is mainly measured by the safety climate. The safety climate is defined as employees’ perception of the organization’s safety measures. The safety climate is a measure of the organization’s current situation, which depends on time and place and is relatively unstable as the situation changes. It may be related to both job burnout and work pressure. The theoretical modeling framework is shown in Figure 1.
H1. 
Work pressure has a positive impact on job burnout.
H2. 
There is a negative correlation between work pressure and safety climate.
H3. 
There is a negative correlation between job burnout and safety climate.
H4. 
Job burnout has a positive impact on unsafe behaviors.
H5. 
There is a negative correlation between safety climate and unsafe behaviors.
H6. 
There is a negative correlation between work pressure and unsafe behaviors.
H7. 
Safety climate has a moderating effect on work pressure and job burnout.
H8. 
Safety climate has a moderating effect on job burnout and unsafe behaviors.

2.2. Scale Design and Data Sources

2.2.1. Scale Design

The preliminary questionnaire includes four constructs: unsafe behaviors, job burnout, work pressure, and safety climate. To ensure that the questions can truly represent actual practices and conditions and determine how the content applies to the current situation of nuclear power plants under construction in China, after the verification of the content by five experts and officials who have at least 10 years of experience and are involved in nuclear power safety and the handling of construction projects, the degree of agreement was reached. This aspect depends on tacit knowledge and cognition, which will particularly affect the appropriateness of the final determination of the questionnaire. Through the design of ordered categorical variables based on the Likert scale, the SEM-SD (Structural Equation Modeling–System Dynamics) model has achieved a quantitative description of the intervention process of job burnout and unsafe behaviors with the safety climate as the core. Table 1 illustrates the four main variable categories, each containing several sub-variables under each category to describe employees’ safety awareness, stress, burnout, and unsafe behaviors in the work environment. The specific connotations of the indicators are shown in Table 1.
The reliability and validity of the questionnaire are shown in Table 2 and Table 3. The factor reliability corresponding to each factor is greater than 0.7, indicating that the questionnaire has good reliability.
Table 3 demonstrates the number of measures for the different dimensions and their Cronbach’s alpha coefficients for assessing internal consistency. SC had the highest reliability (0.931), indicating that the instrument was very reliable; stress, CY, and EX had good reliabilities (0.819–0.822); and UB and RPA had acceptable reliabilities (0.728–0.789), but were relatively low and may need to be optimized. Overall, the scales have high reliability in measuring employees’ security awareness, stress, burnout, and insecure behavior, and are suitable for use in research and practice.

2.2.2. Data Sources

In the questionnaire survey, 820 employees at all levels were surveyed and analyzed. After excluding incomplete and redundant answers, a total of 634 valid questionnaires were received. The response rate was 77%. The size of the valid population is shown in Table 4.

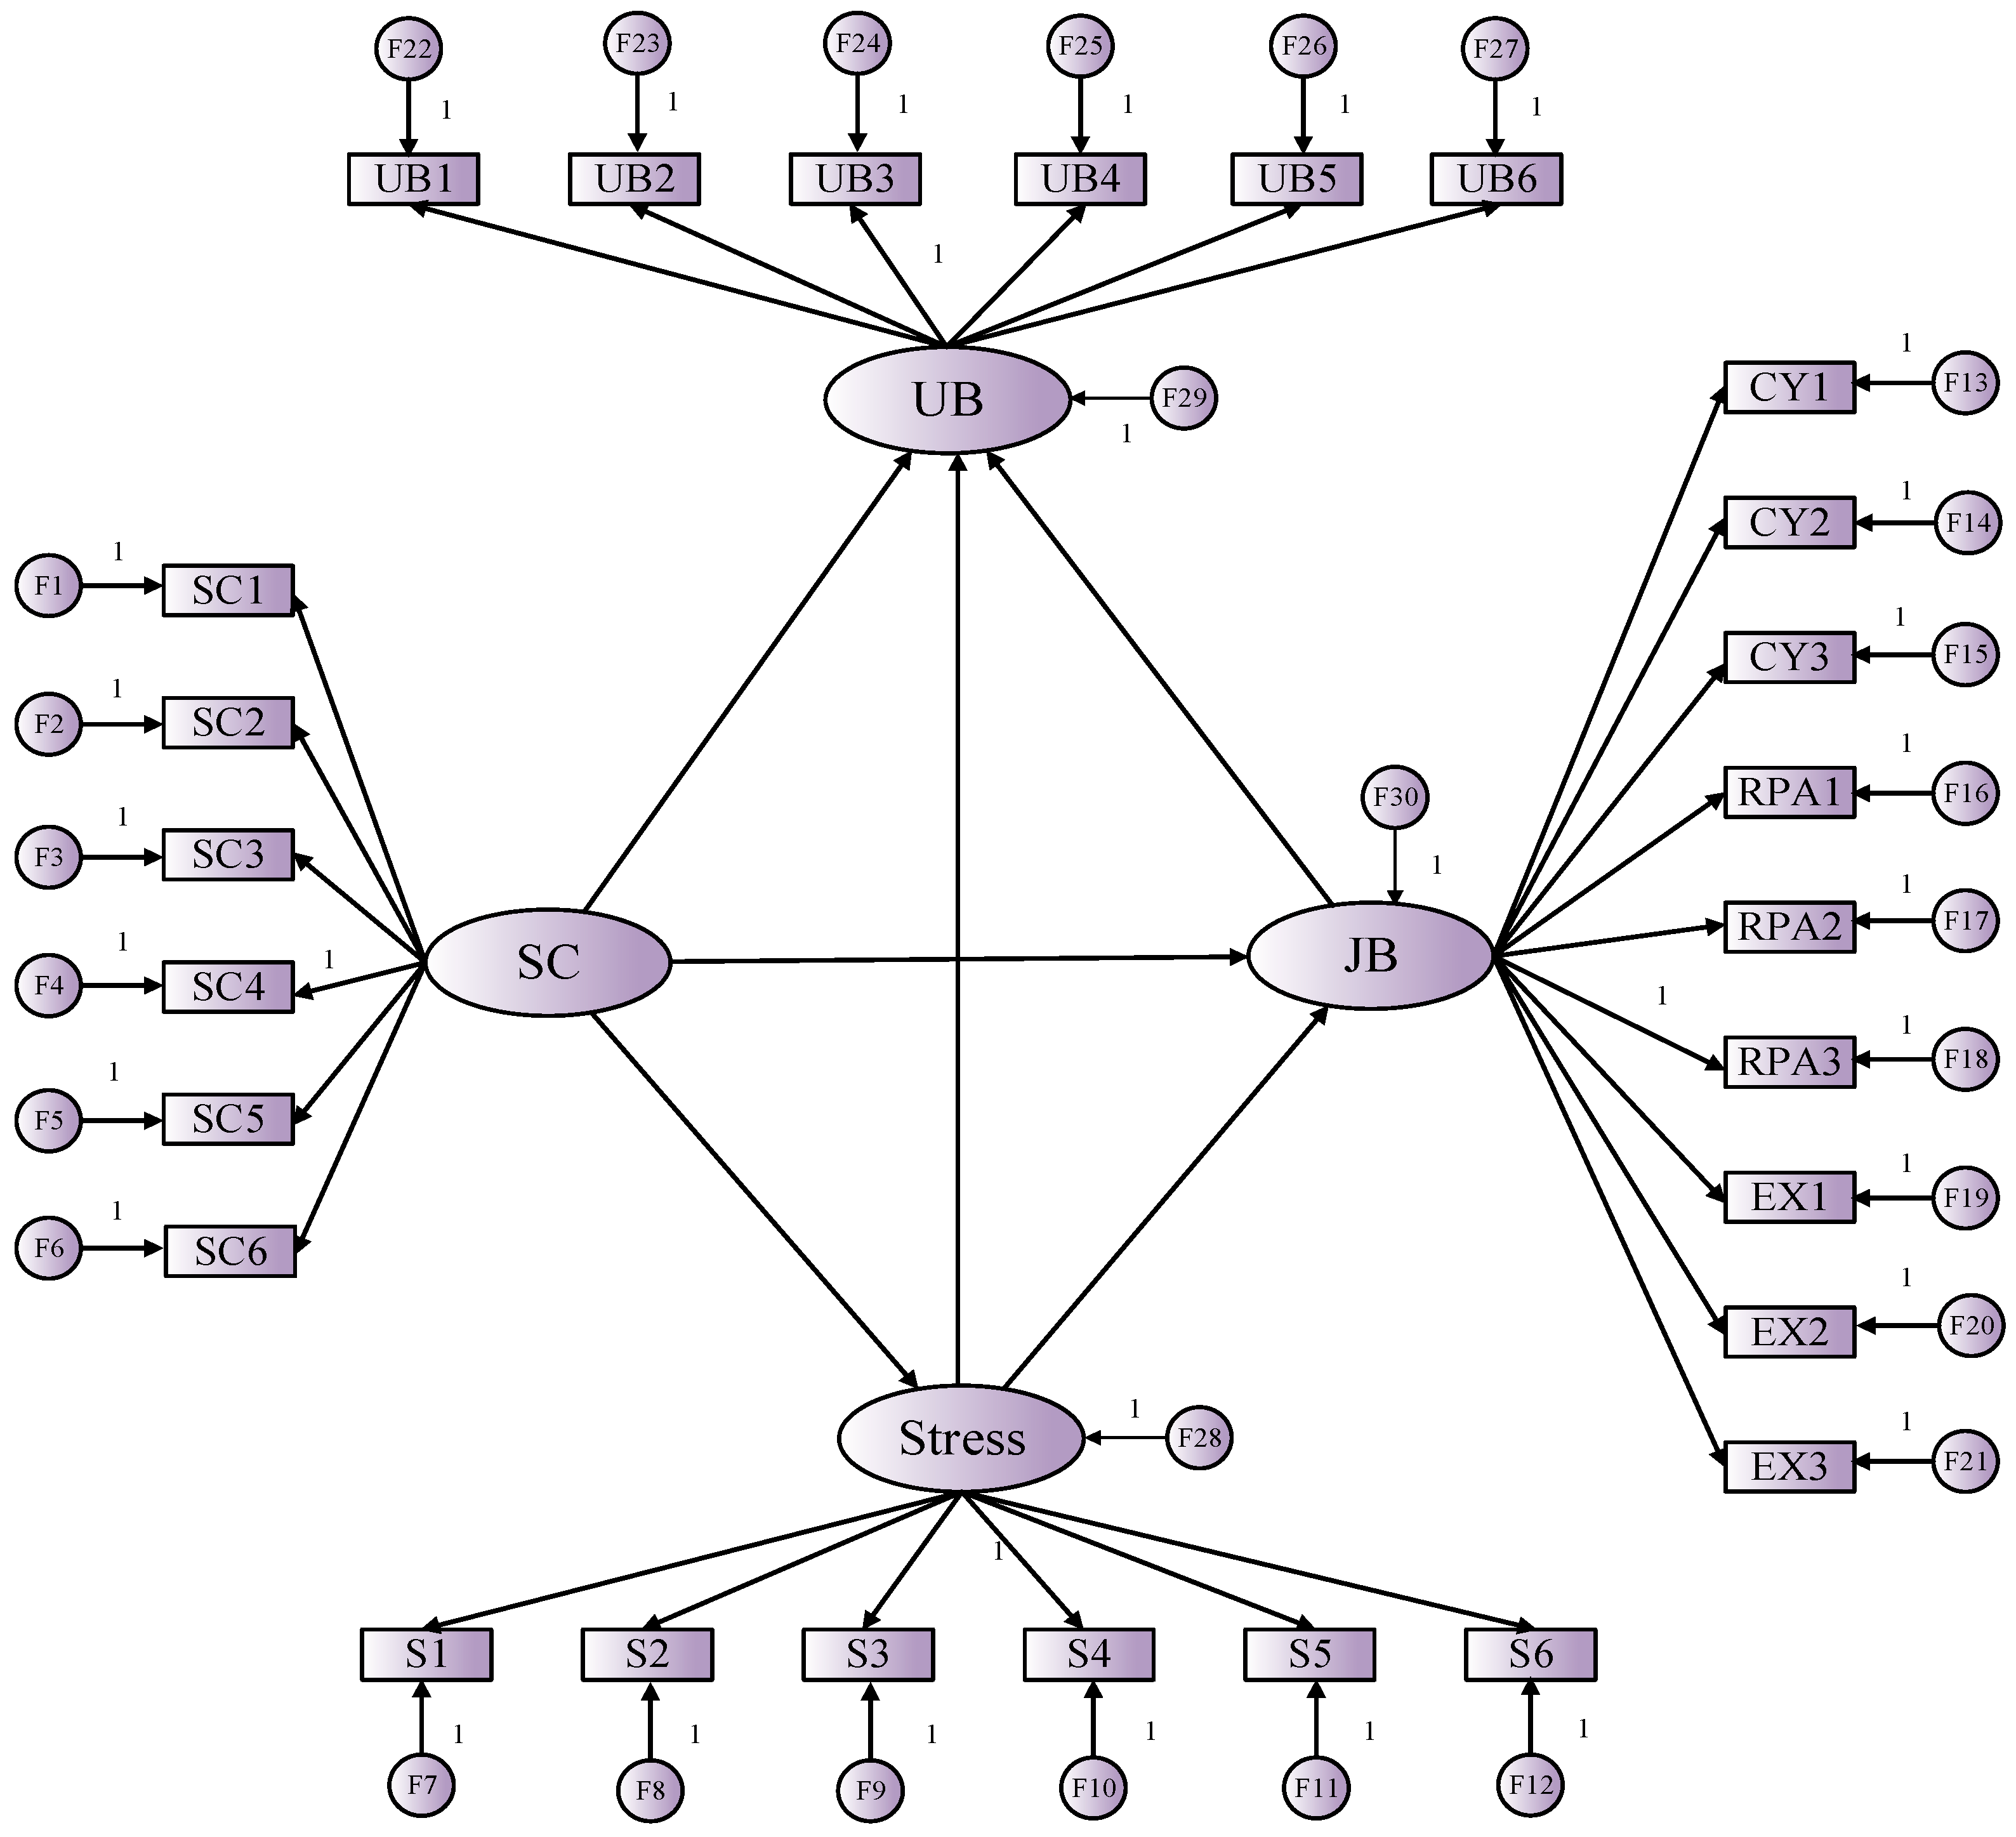
3. Construction of the SEM Model

The Structural Equation Model (SEM) belongs to the category of multivariate advanced statistics and is a widely applicable confirmatory factor analysis method. The results of the model operation show that the estimated values of the standardized path coefficients among variables did not exceed 1, and the variance-estimated values of the coefficient of the variation of the error terms were not negative, indicating that the initial model met the methodological conditions. As shown in Figure 2, the causal relationships in the model of “Intervention of Job Burnout and Unsafe Behaviors with Safety Climate as the Core” constructed in this paper are represented by “one-way arrows” (latent variables pointing to observed variables). In the model, “F1–F25” represent the residuals of the observed variables, and “F26–F28” represent the errors of the structural equation model.
The CMIN/DF value in Table 5 is 1.219, which represents the degree of explanation of the data to the model and meets the range requirements. The value of GFI (Goodness-of-Fit Index) is 0.868, which is close to 1 and meets the requirements, indicating that the model’s degree of explanation for the sample data is large enough. The value of AGFI (Adjusted Goodness-of-Fit Index) is 0.844, representing the goodness-of-fit index after considering the complexity of the model. The value of NFI (Normed Fit Index) is 0.92, representing the ratio of the chi-square value of the model to that of the independent model. This value is close to 1 and meets the requirements. The CFI (Comparative Fit Index) refers to the comparative fit index and is 0.877, indicating that the differences in non-centrality between the hypothesized model and the independent model are relatively small and meet the requirements. RMSEA (Root Mean Square Error of Approximation) refers to the approximate root mean square error and is 0.029, which is much smaller than 0.05, indicating a good model fit.

3.1. Analysis and Hypothesis Test of the Effect of Safety Climate and Job Burnout on Unsafe Behavior

The path coefficients after model modification are shown in Table 6. The path relationships, path coefficients, and their significance levels between the variables are shown. The path coefficient indicates the strength of influence between the variables, and the p-value indicates that these relationships are statistically significant. Safety climate is a key factor in reducing job stress, burnout, and unsafe behaviors, while job stress and burnout significantly increase the risk of unsafe behaviors.
Based on the path coefficients in the modified Table 6, the test results of hypotheses H1–H6 are obtained, as shown in Table 7. The results of the research hypotheses and their tests show that all hypotheses were supported. So, safety climate is a key factor in reducing job stress, burnout, and unsafe behaviors, while job stress and burnout significantly increase the risk of unsafe behaviors. The results of the study support the importance of safety climate in improving the work environment.

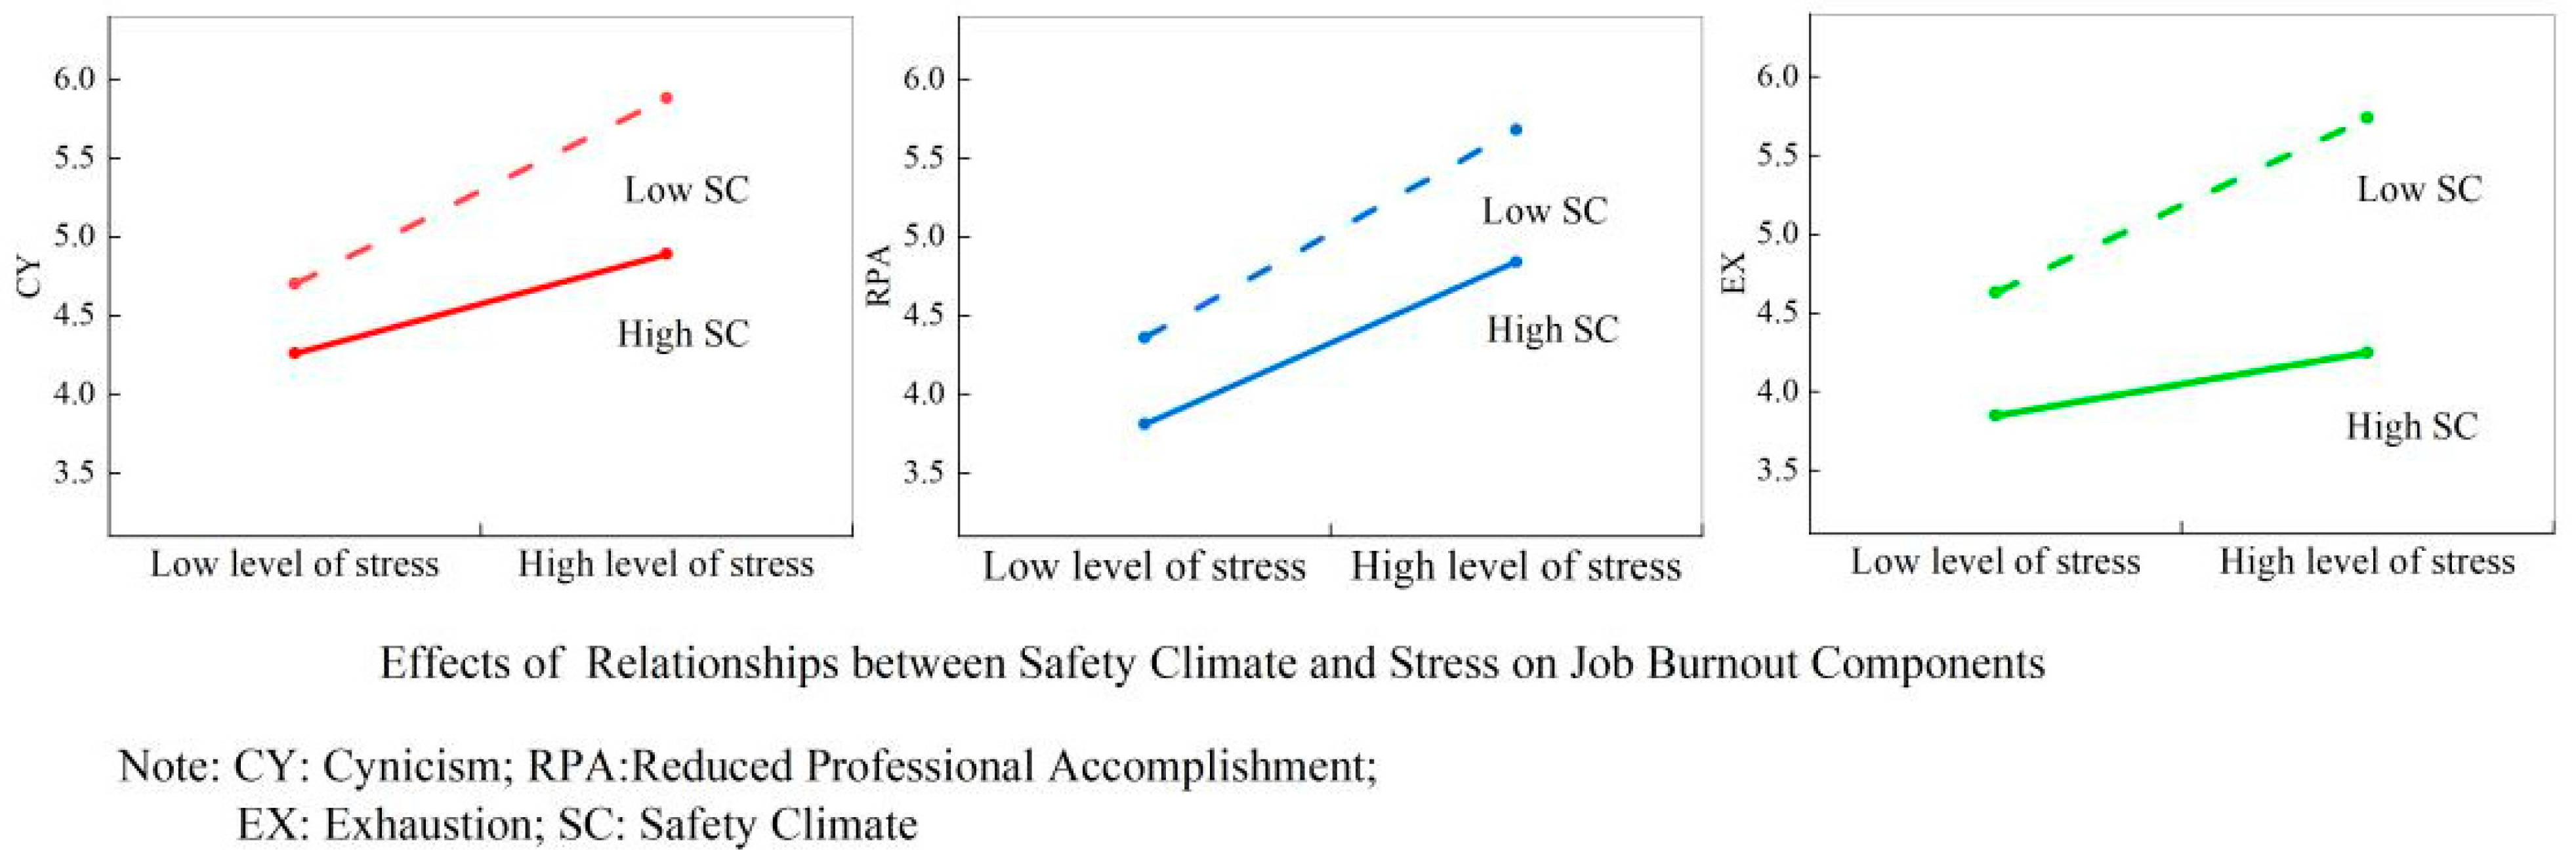
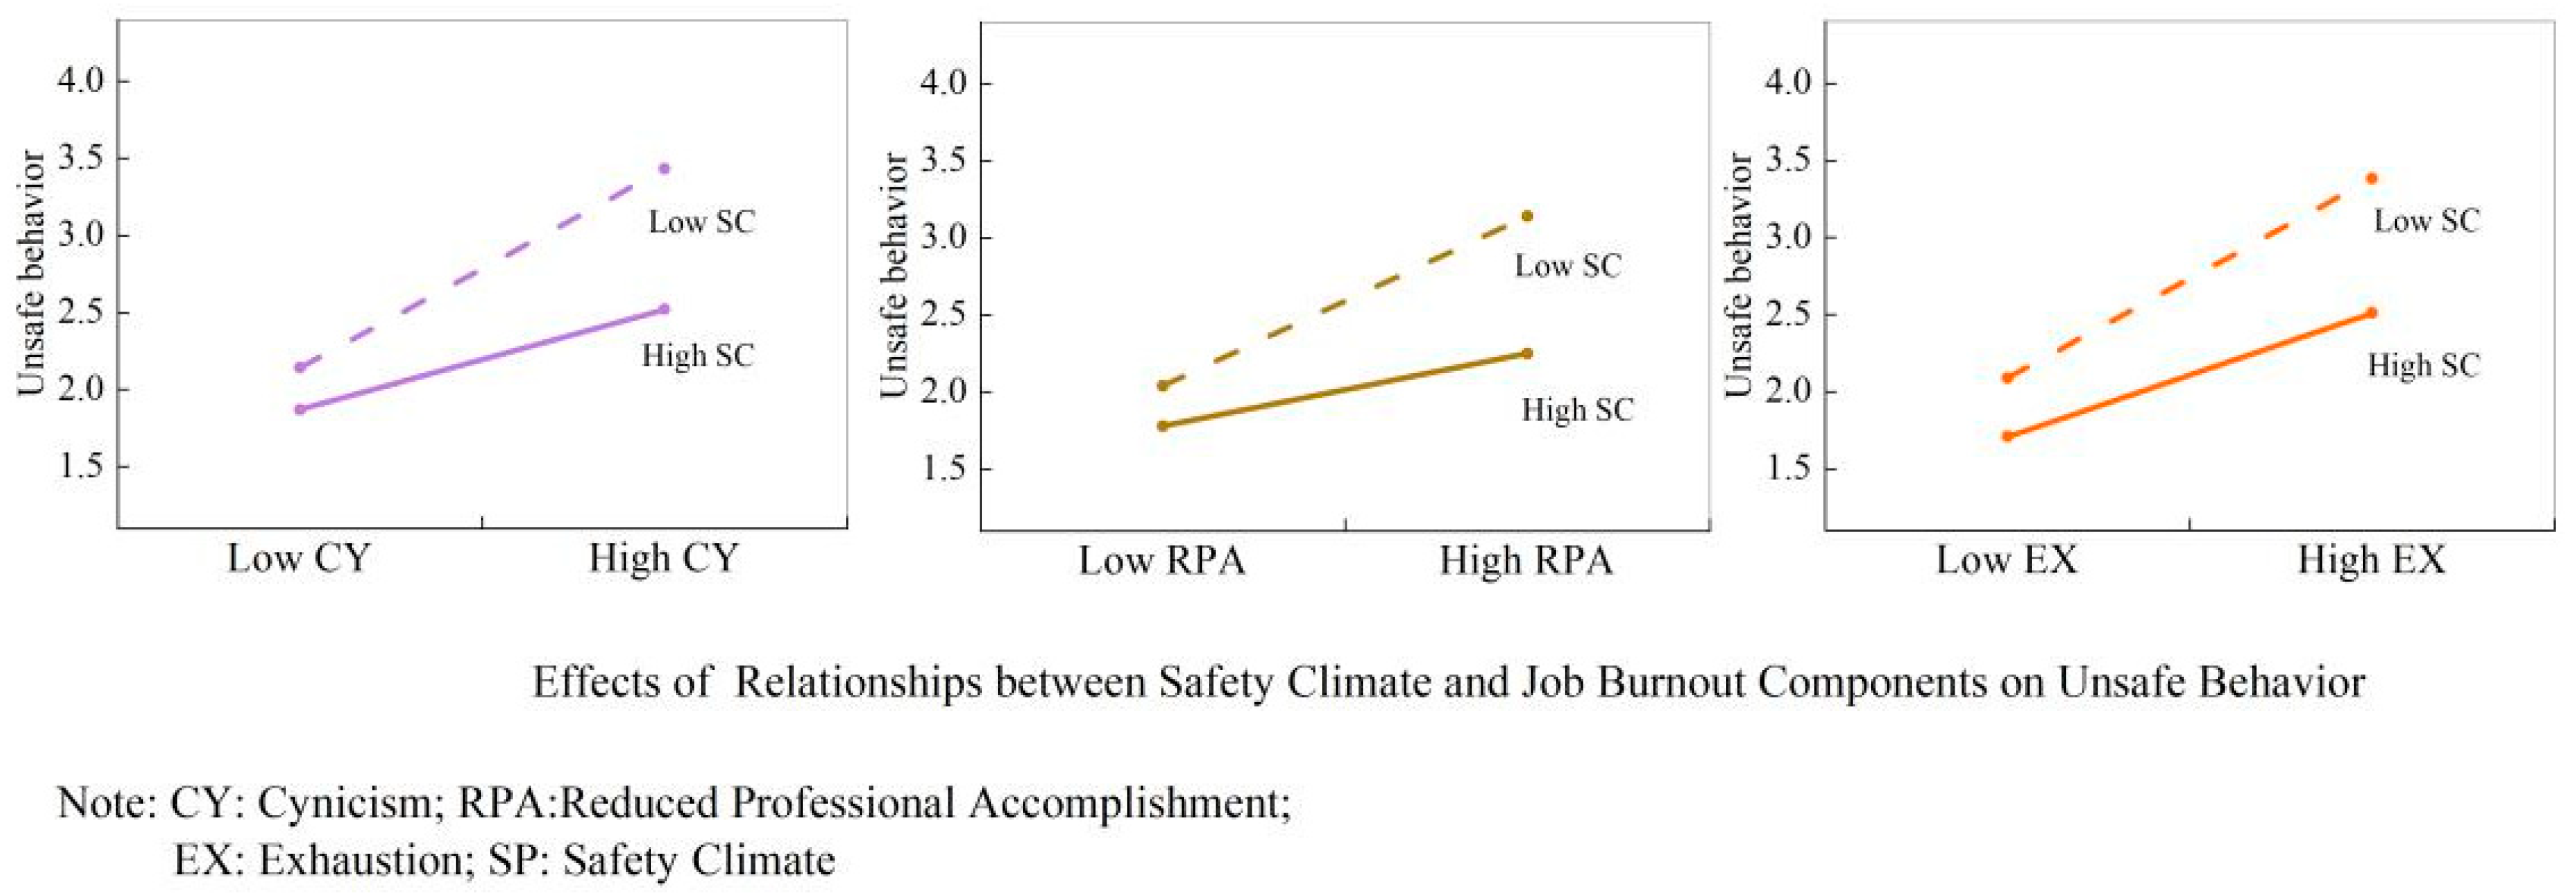
3.2. Moderating Role of Safety Climate

Hypotheses 7 and 8 predict that the relationships among employees’ work pressure, job burnout, and unsafe behaviors are moderated by the safety climate. To demonstrate the moderating role played by the safety climate, the slopes representing the moderating effect of the safety climate on the relationships between the three dimensions of job burnout and pressure are depicted in Figure 3. As shown in the figure, employees with a high level of safety climate and a low level of pressure reported a low level of job burnout. Meanwhile, employees with a high level of pressure who experienced a low level of safety climate also had a relatively high level of job burnout.
In addition, Figure 4 reveals the slopes of the moderating effect of safety climate on the relationships between the three dimensions of job burnout and unsafe behaviors. Therefore, Hypotheses 7 and 8 are supported.
However, there are still some differences between these two moderating effects. By comparing the slopes in Figure 3 and Figure 4, it can be seen that, for the same level of safety climate, in terms of the increase in the levels of job burnout and unsafe behaviors, the upward trend of the slopes related to the level of unsafe behaviors is smaller, which indicates that the safety climate has a more obvious moderating effect between job burnout and unsafe behaviors. Safety climate can effectively reduce the impacts caused by job burnout, such as workers’ work achievements, production status, absenteeism, and turnover, etc.

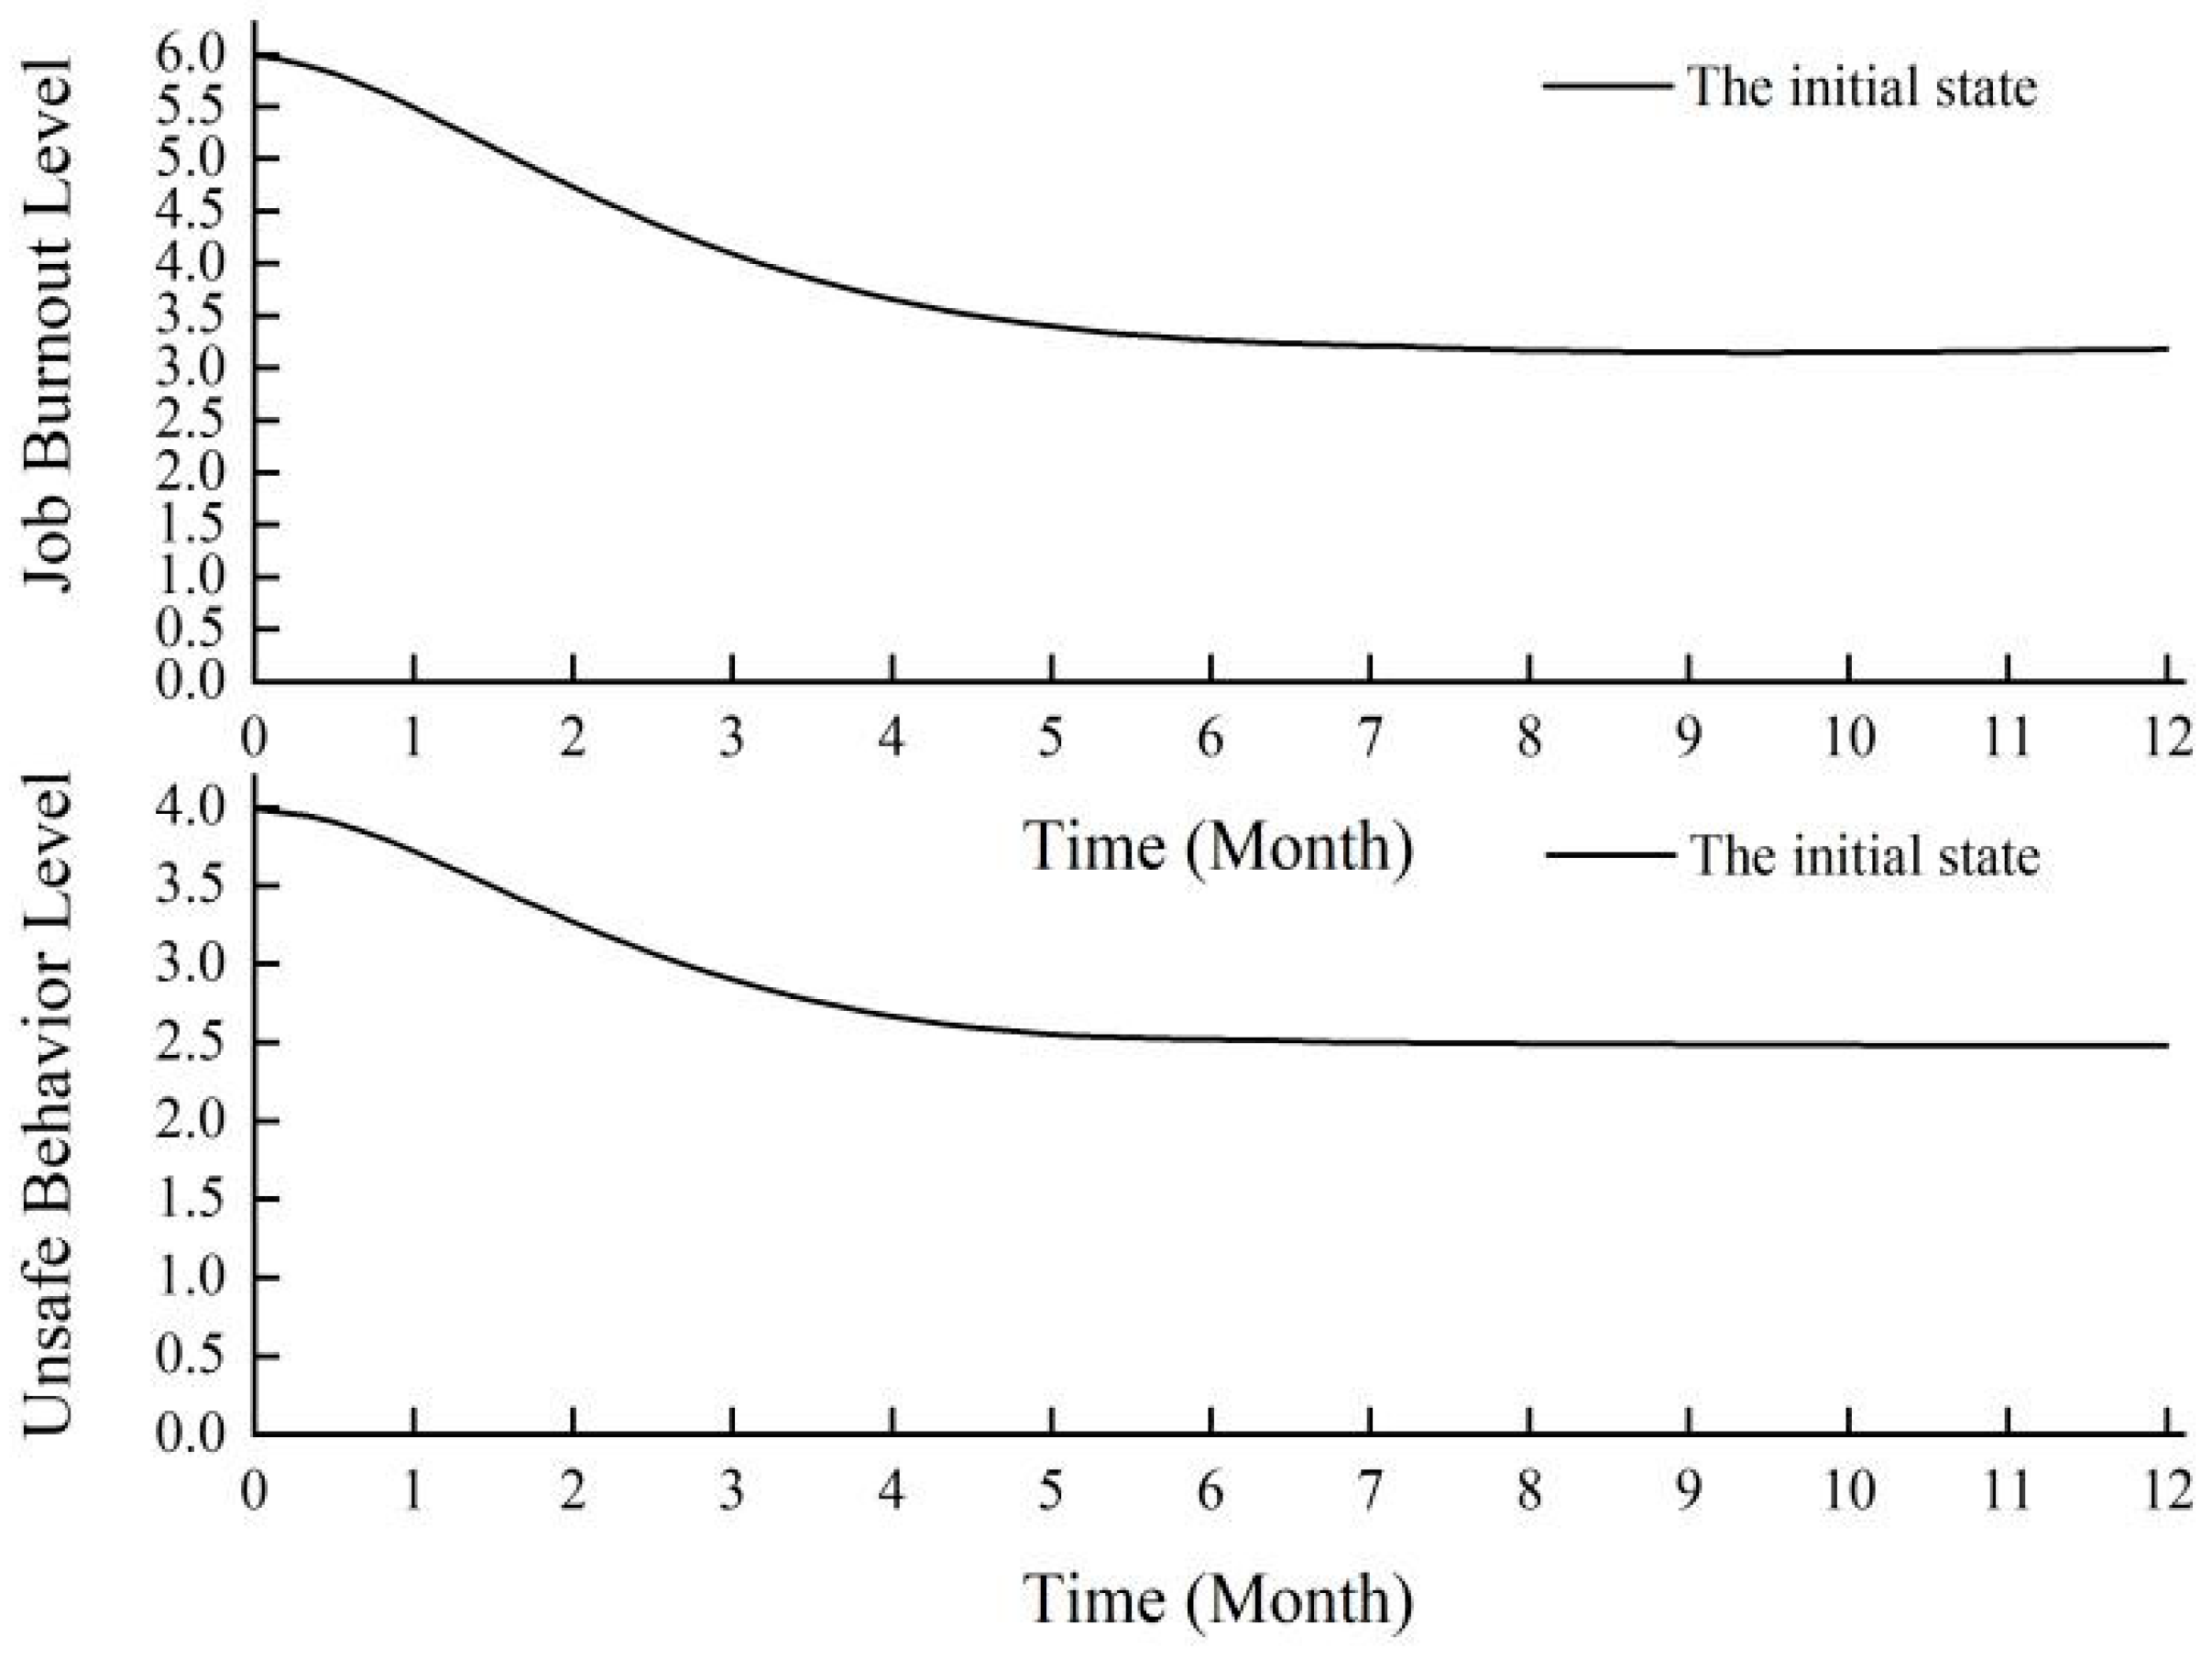
4. Analysis of Intervention Strategies for Job Burnout Among Employees in Nuclear Power Plants Under Construction Based on the System Dynamics (SD) Model

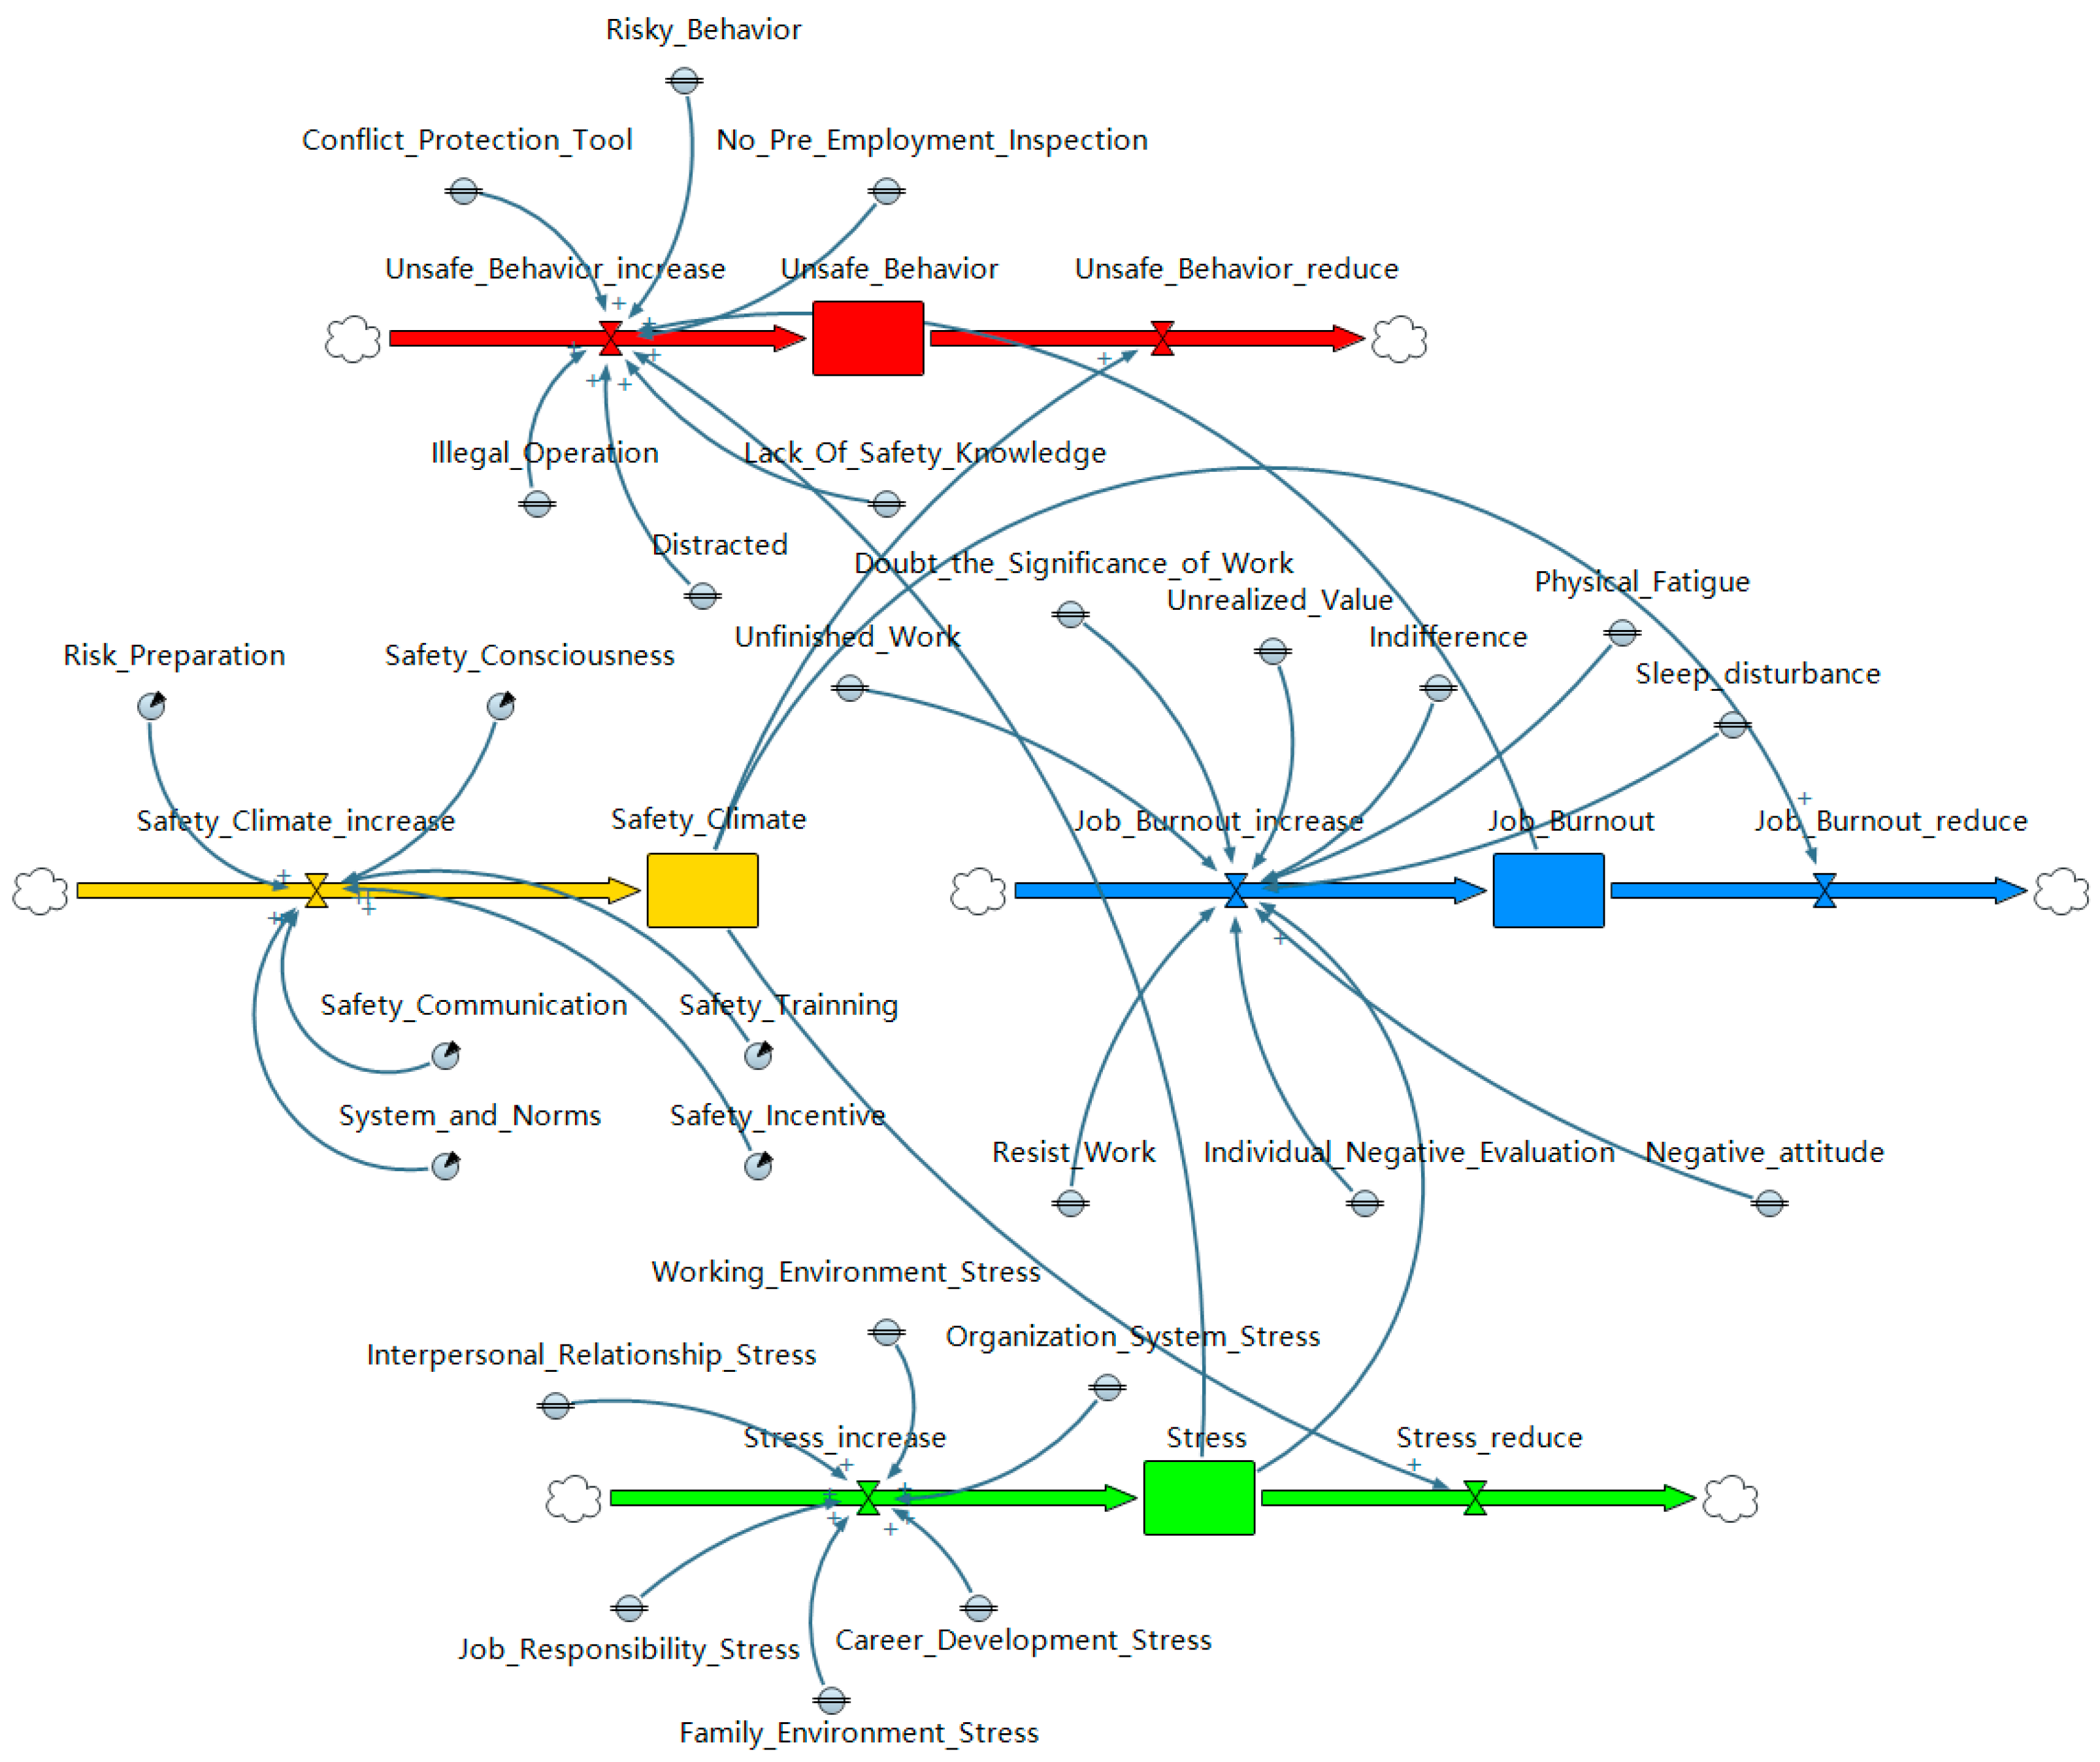
4.1. Construction of the SD (System Dynamics) Model

Although the Structural Equation Model (SEM) diagram can well reflect the relationships between various factors influencing employees’ job burnout and unsafe behaviors and the intervention strategies with safety climate as the core, it cannot reflect the internal operating mechanism of the intervention system. Therefore, in order to better explore the deep relationships among intervention systems such as the safety communication intervention system, the safety supervision intervention system, and the safety incentive intervention system, this paper introduces state variables, rate variables, and so on to construct a System Dynamics Model for the job burnout of high-risk miners.
(1) Determine the variable types for the construction of the SD model.
Based on the indicator selection of the Structural Equation Model (SEM) and combined with the attributes in the System Dynamics (SD) Model, they are divided into state variables, rate variables, auxiliary variables, and parameters. Table 8 lists the detailed division results. Specifically, state variables will change over time and can ultimately determine the state of the system. Rate variables reflect the input or output speed of state variables; auxiliary variables are intermediate variables used to describe the information transmission and conversion between state variables and rate variables (Table 8). The value of this constant will not change over time.
(2) Construct an intervention model of job burnout.
Based on the path coefficients of the Structural Equation Model (SEM), the mathematical relationships among the variable sets of the System Dynamics (SD) Model were determined, as shown in the Table 8. The SD model for intervening in the generation and impact of job burnout among employees in nuclear power plants under construction was established using AnyLogic(8.8.6), as illustrated in Figure 5.
(3) Determine the values of the model.
In order to simulate the implementation effect of the intervention measures, the initial value of the job burnout level is set to 6 (the highest value), and the initial value of the unsafe behavior is set to 4 (the highest value). For the initial values of other variables in the System Dynamics Model, as well as those of the safety climate and pressure, the path coefficients of the structural equation model are utilized. Meanwhile, the mean values are calculated by SPSS(29), and then the errors of the structural equation are added to them to serve as constants, as shown in Table 9. The initial value of the intervention strategy with the safety climate as the core is set to 0, that is, no intervention strategy is adopted under the initial state.

4.2. Construction of the Model Equation

Based on the actual meanings of state variables, rate variables, and auxiliary variables, and in accordance with the stock-flow diagram in Figure 5, the connections among various factors in the model are abstracted into mathematical formulas. Since most of the variables in this model are qualitative variables, to ensure the rigor and logic of the model, all the variables in this model are subjected to dimensionless processing.
d U B _ I n c r e s e ( t ) = a 1 U B 1 + a 2 U B 2 + a 3 U B 3 + a 4 U B 4 + a 5 U B 5 + a 6 U B 6 + b J B + c 1 S T
d U B _ Reduce ( t ) = e 1 S C
U B = d U B _ Increase ( t ) d U B _ Reduce ( t )
d J B _ I n c r e s e ( t ) = d 1 C Y 1 + d 2 C Y 2 + d 3 C Y 3 + d 4 E X 1 + d 5 E X 2 + d 6 E X 3 + d 7 R P A 1 + d 8 R P A 2 + d 9 R P A 3 + c 2 S T
d J B _ Reduce ( t ) = e 2 S C
J B = d J B _ Increase ( t ) d J B _ Reduce ( t )
d S C _ I n c r e s e ( t ) = f 1 S C 1 + f 2 S C 2 + f 3 S C 3 + f 4 S C 4 + f 5 S C 5 + f 6 S C 6
S C = d S C _ Increase ( t )
d S T _ I n c r e s e ( t ) = g 1 S T 1 + g 2 S T 2 + g 3 S T 3 + g 4 S T 4 + g 5 S T 5 + g 6 S T 6
d S T _ Reduce ( t ) = e 3 S C
S T = d S T _ Increase ( t ) d S T _ Reduce ( t )
Based on the above equations, a1a6, c1c2, d1d8, f1f6, g1g6, and e1e3 are coefficients; UB1UB6, CY1CY3, EX1EX3, RPA1RPA3, and ST1ST6 are all constants; and SC1SC4 are parameters.

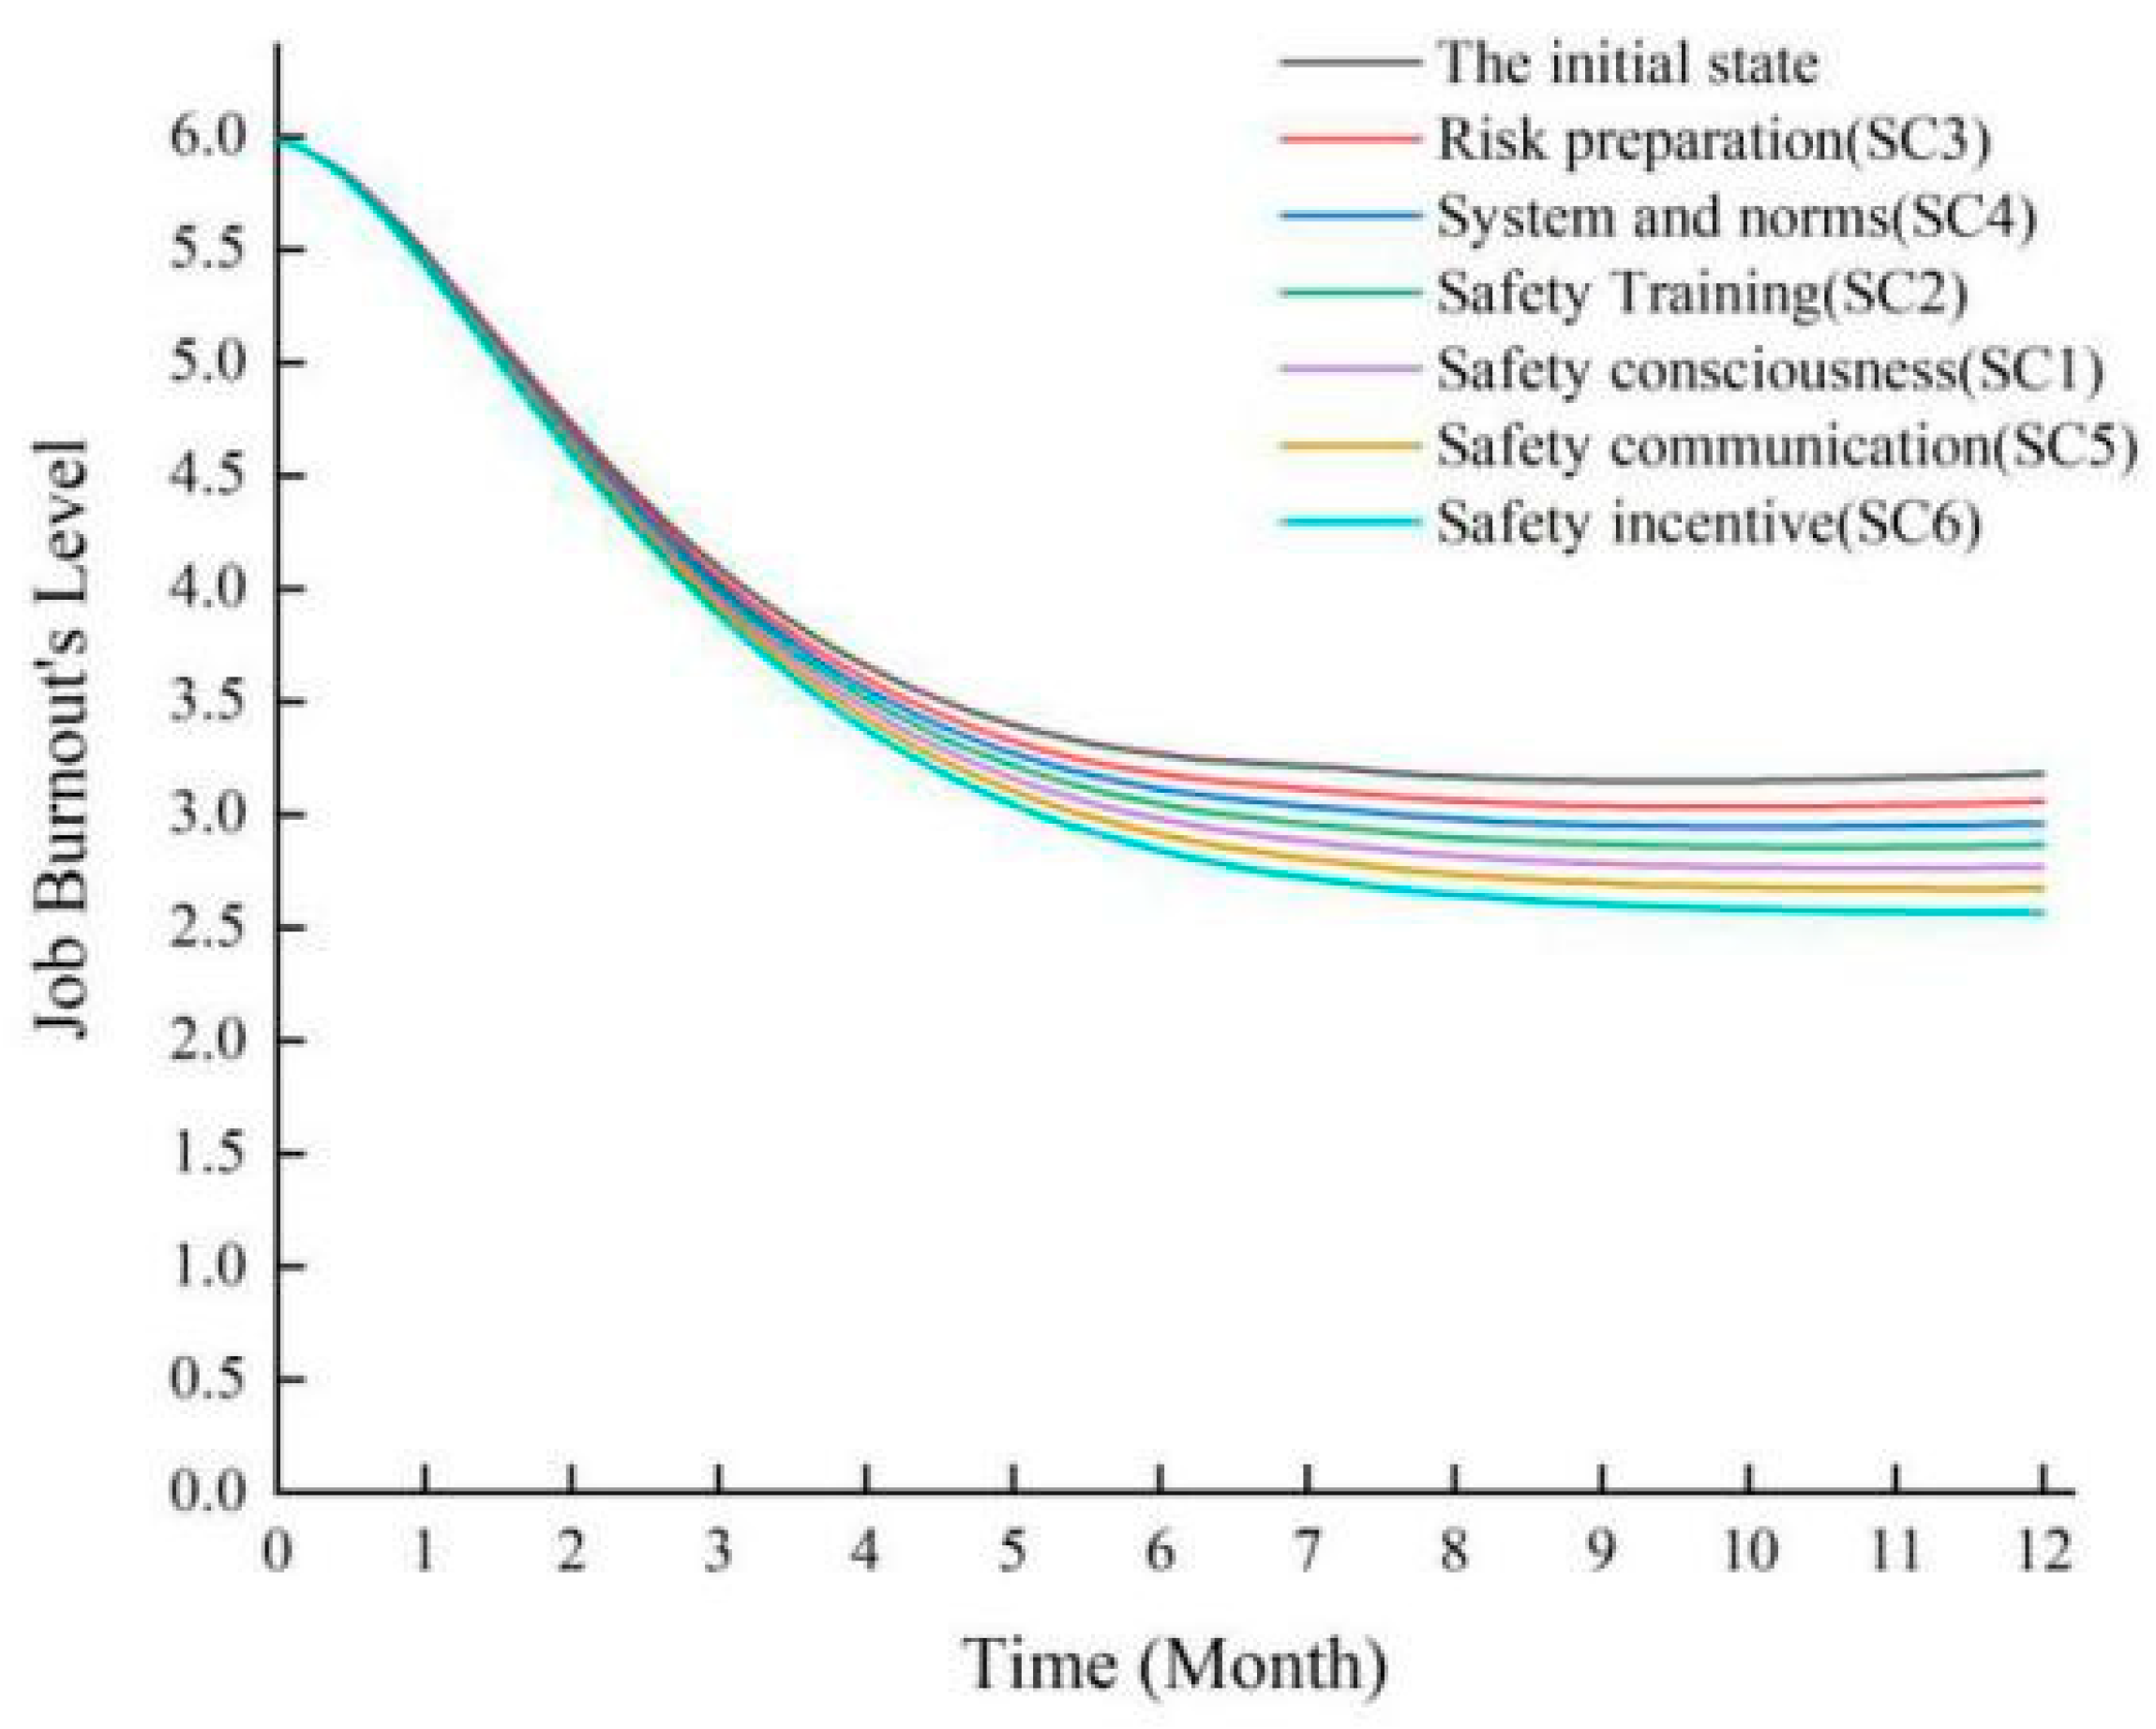
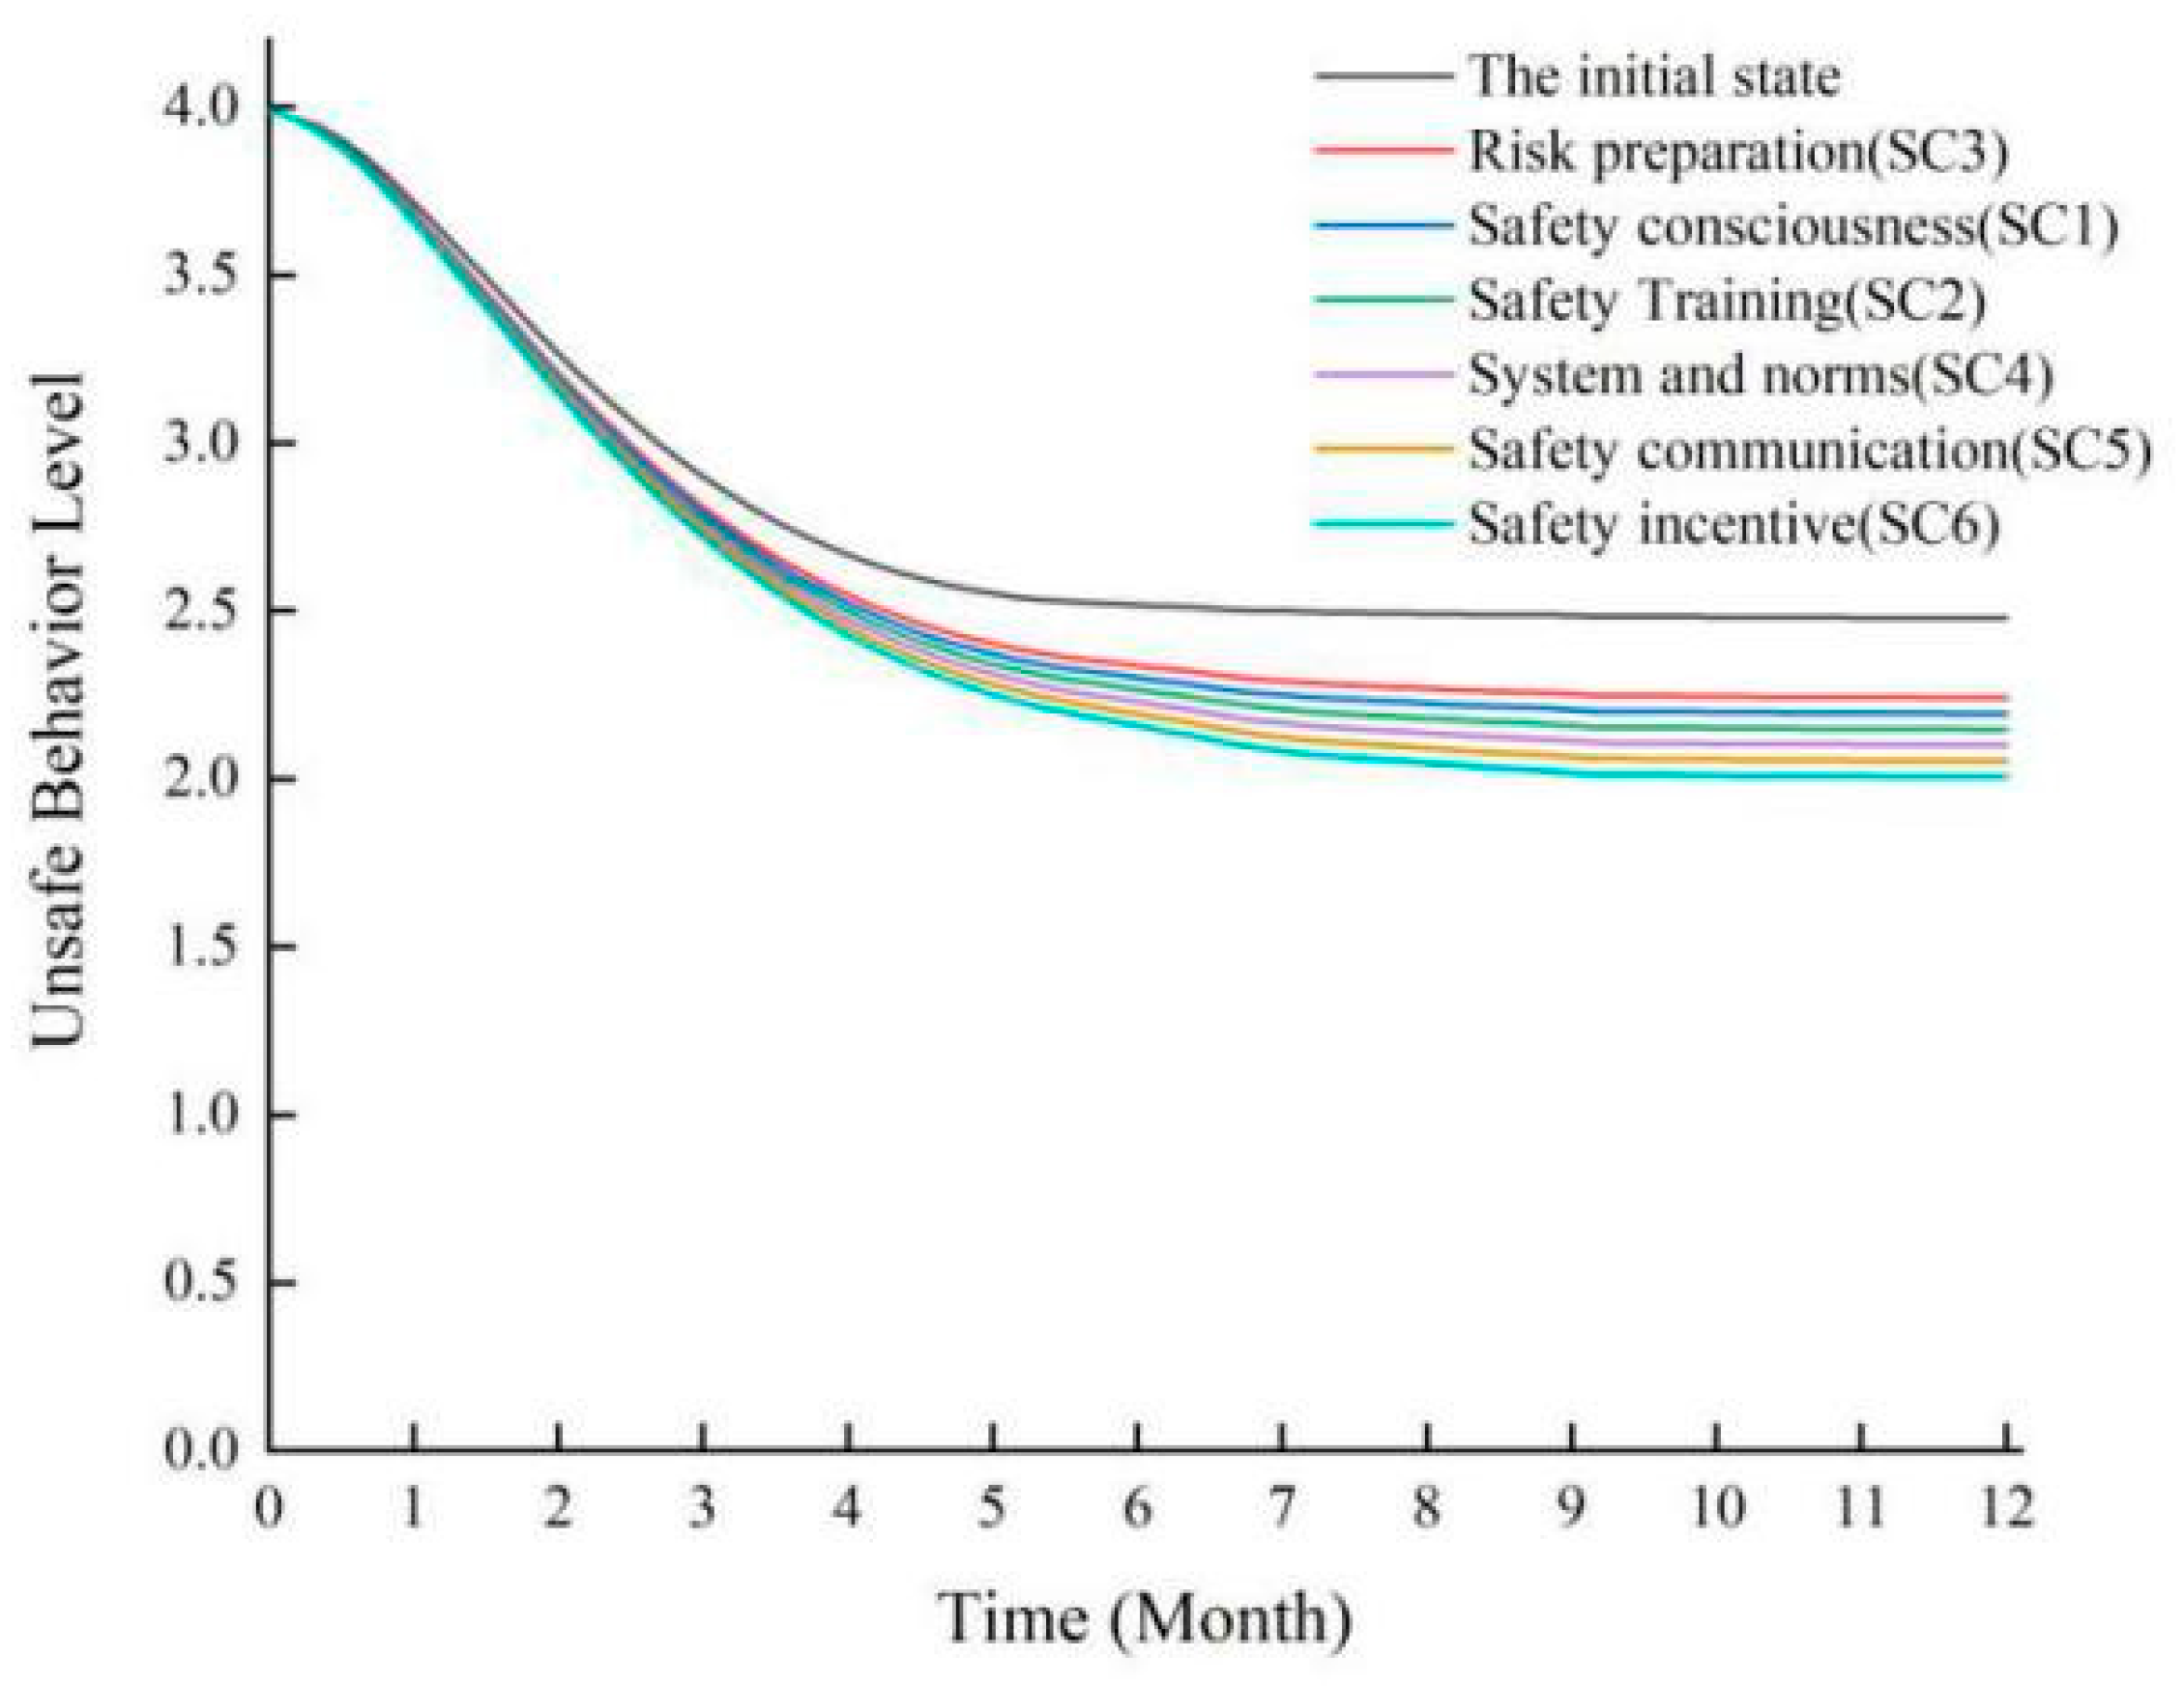
4.3. Simulate Intervention Strategies

In this paper, the simulation time is set to 12 months, and the simulation step length is set to 1 month.
(1) Initial Simulation of Employees’ Job Burnout and Unsafe Behaviors
Under the initial state, the model in Figure 5 was simulated, and the simulation results are shown in Figure 6.
It can be seen from Figure 6 that, from the initial state, in the first month, the downward trend of the job burnout level was relatively stable. From the first month to the fourth month, it changed more rapidly, showing an exponential decline on the whole. From the fourth month to the seventh month, the downward trend gradually slowed down. Finally, the downward trend became stable after the seventh month. The level of unsafe behaviors also changed accordingly. Eventually, the job burnout level remained at around 3.29, and the level of unsafe behaviors remained at around 2.49. This is similar to the mean values of the job burnout level and unsafe behaviors obtained from the questionnaire, indicating that the simulation effect of the model is basically consistent with the actual situation. Based on the above analysis, under the existing safety conditions, the levels of employees’ job burnout and unsafe behaviors decline and finally remain at relatively high levels.
(2) Simulation of the Job Burnout Status of Employees in Nuclear Power Plants Under Construction under Multiple Intervention Strategies
In this paper, the intervention strategies were simulated by changing the parameter values. Based on the simulation results in the initial state, the initial value of the intervention strategy with the safety climate as the core was increased to simulate the impact of job burnout under different intervention strategies on unsafe behaviors, as shown in Figure 7 and Figure 8.
Figure 7 shows the simulation results of the job burnout level after adopting the intervention strategy with the safety climate as the core. According to the impact relationship from large to small, the safety climate intervention strategies can be divided into risk preparation, system and norms, safety training, safety consciousness, safe communication, and safety incentive.
Figure 8 shows the simulation results of the level of unsafe behaviors after adopting the intervention strategy with the safety climate as the core. According to the impact relationship from large to small, the safety climate intervention strategies can be divided into risk preparation, safety consciousness, safety training, system and norms, safe communication, and safety incentive.
It can be seen from Figure 7 and Figure 8 that the simulation results, after adopting the intervention strategies, are consistent with the simulation trend in the initial state, indicating that the model is relatively stable. After implementing different intervention strategies, the levels of job burnout and unsafe behaviors among employees in nuclear power plants under construction both decreased, which shows that the intervention strategies played a certain role in the pre-control of the generation and impact of employees’ job burnout. Meanwhile, by analyzing the specific data in Figure 8 and Figure 9, it can be observed that the degree of decrease in the level of employees’ unsafe behaviors is more obvious than that of job burnout. This indicates that the safety climate has a better intervention effect on the impact of job burnout, which is also consistent with the conclusion mentioned above. However, both the job burnout level and the unsafe behavior level decreased to a certain extent, suggesting that adopting a single intervention strategy cannot effectively reduce the job burnout and unsafe behaviors of employees in nuclear power plants under construction. In actual production, enterprises usually take various measures to implement control. Therefore, this study combines intervention strategies and conducts in-depth research on their impacts on employees’ job burnout and unsafe behaviors.
(3) Simulation of the Job Burnout Status Under the Joint Intervention Strategy
Joint intervention refers to the extensive use of various intervention measures throughout the entire process of the occurrence of unsafe behaviors to prevent and control them, and, finally, to achieve the goal of effectively preventing and controlling unsafe behaviors. In the actual safe construction of nuclear power plants, different safety issues will be faced at different construction stages, and different intervention strategies for unsafe behaviors will be emphasized. Based on the analysis, joint intervention measures combining safe communication and safety incentive with one of risk preparation, safety consciousness, safety training, and system and norms were determined, and relevant simulations were carried out based on the established SD model. According to the results, the optimal plan was selected. The simulation results are shown in Figure 9 and Figure 10.
It can be seen from Figure 9 that, after adopting the joint intervention strategy, the level of employees’ job burnout decreased significantly, indicating that the joint intervention method had a remarkable impact on controlling the job burnout of employees in nuclear power plants under construction. According to the descending order of the effects, the combined intervention strategies can be ranked as SC6 + SC5 + SC1, SC6 + SC5 + SC3, SC6 + SC5 + SC4, SC6 + SC5 + SC2.
Figure 10 shows the simulation results of the level of unsafe behaviors after adopting the joint intervention strategy. According to the impact relationship from large to small, the combined intervention strategies can be ranked as SC6 + SC5 + SC1, SC6 + SC5 + SC3, SC6 + SC5 + SC4, SC6 + SC5 + SC2.
It can be seen from Figure 9 and Figure 10 that, although SC6 + SC5 + SC2 and SC6 + SC5 + SC4 perform equally in terms of intervening in job burnout, SC6 + SC5 + SC2 has a better performance in intervening in unsafe behaviors. Therefore, the joint intervention measures for employees’ job burnout and unsafe behaviors with SC6 + SC5 + SC2 as the main focus were determined. Nuclear power plants under construction should formulate standardized and strictly implemented safety incentive policies to enhance the enthusiasm of employees. Then, the channels for safety communication should be broadened, and the enterprise’s safety training and education should be strengthened to improve the working quality and living environment of individual workers. And, finally, a good safety climate should be created, which can enable enterprise employees to better participate in safe production activities and realize their personal values.
In addition, as shown in Figure 9 and Figure 10, although job burnout and unsafe behaviors have decreased significantly, the levels have not yet been completely close to zero. Therefore, when aiming to completely eliminate the job burnout and unsafe behaviors of employees in nuclear power plants under construction, more reasonable and clear combinations of intervention strategies should be formulated.

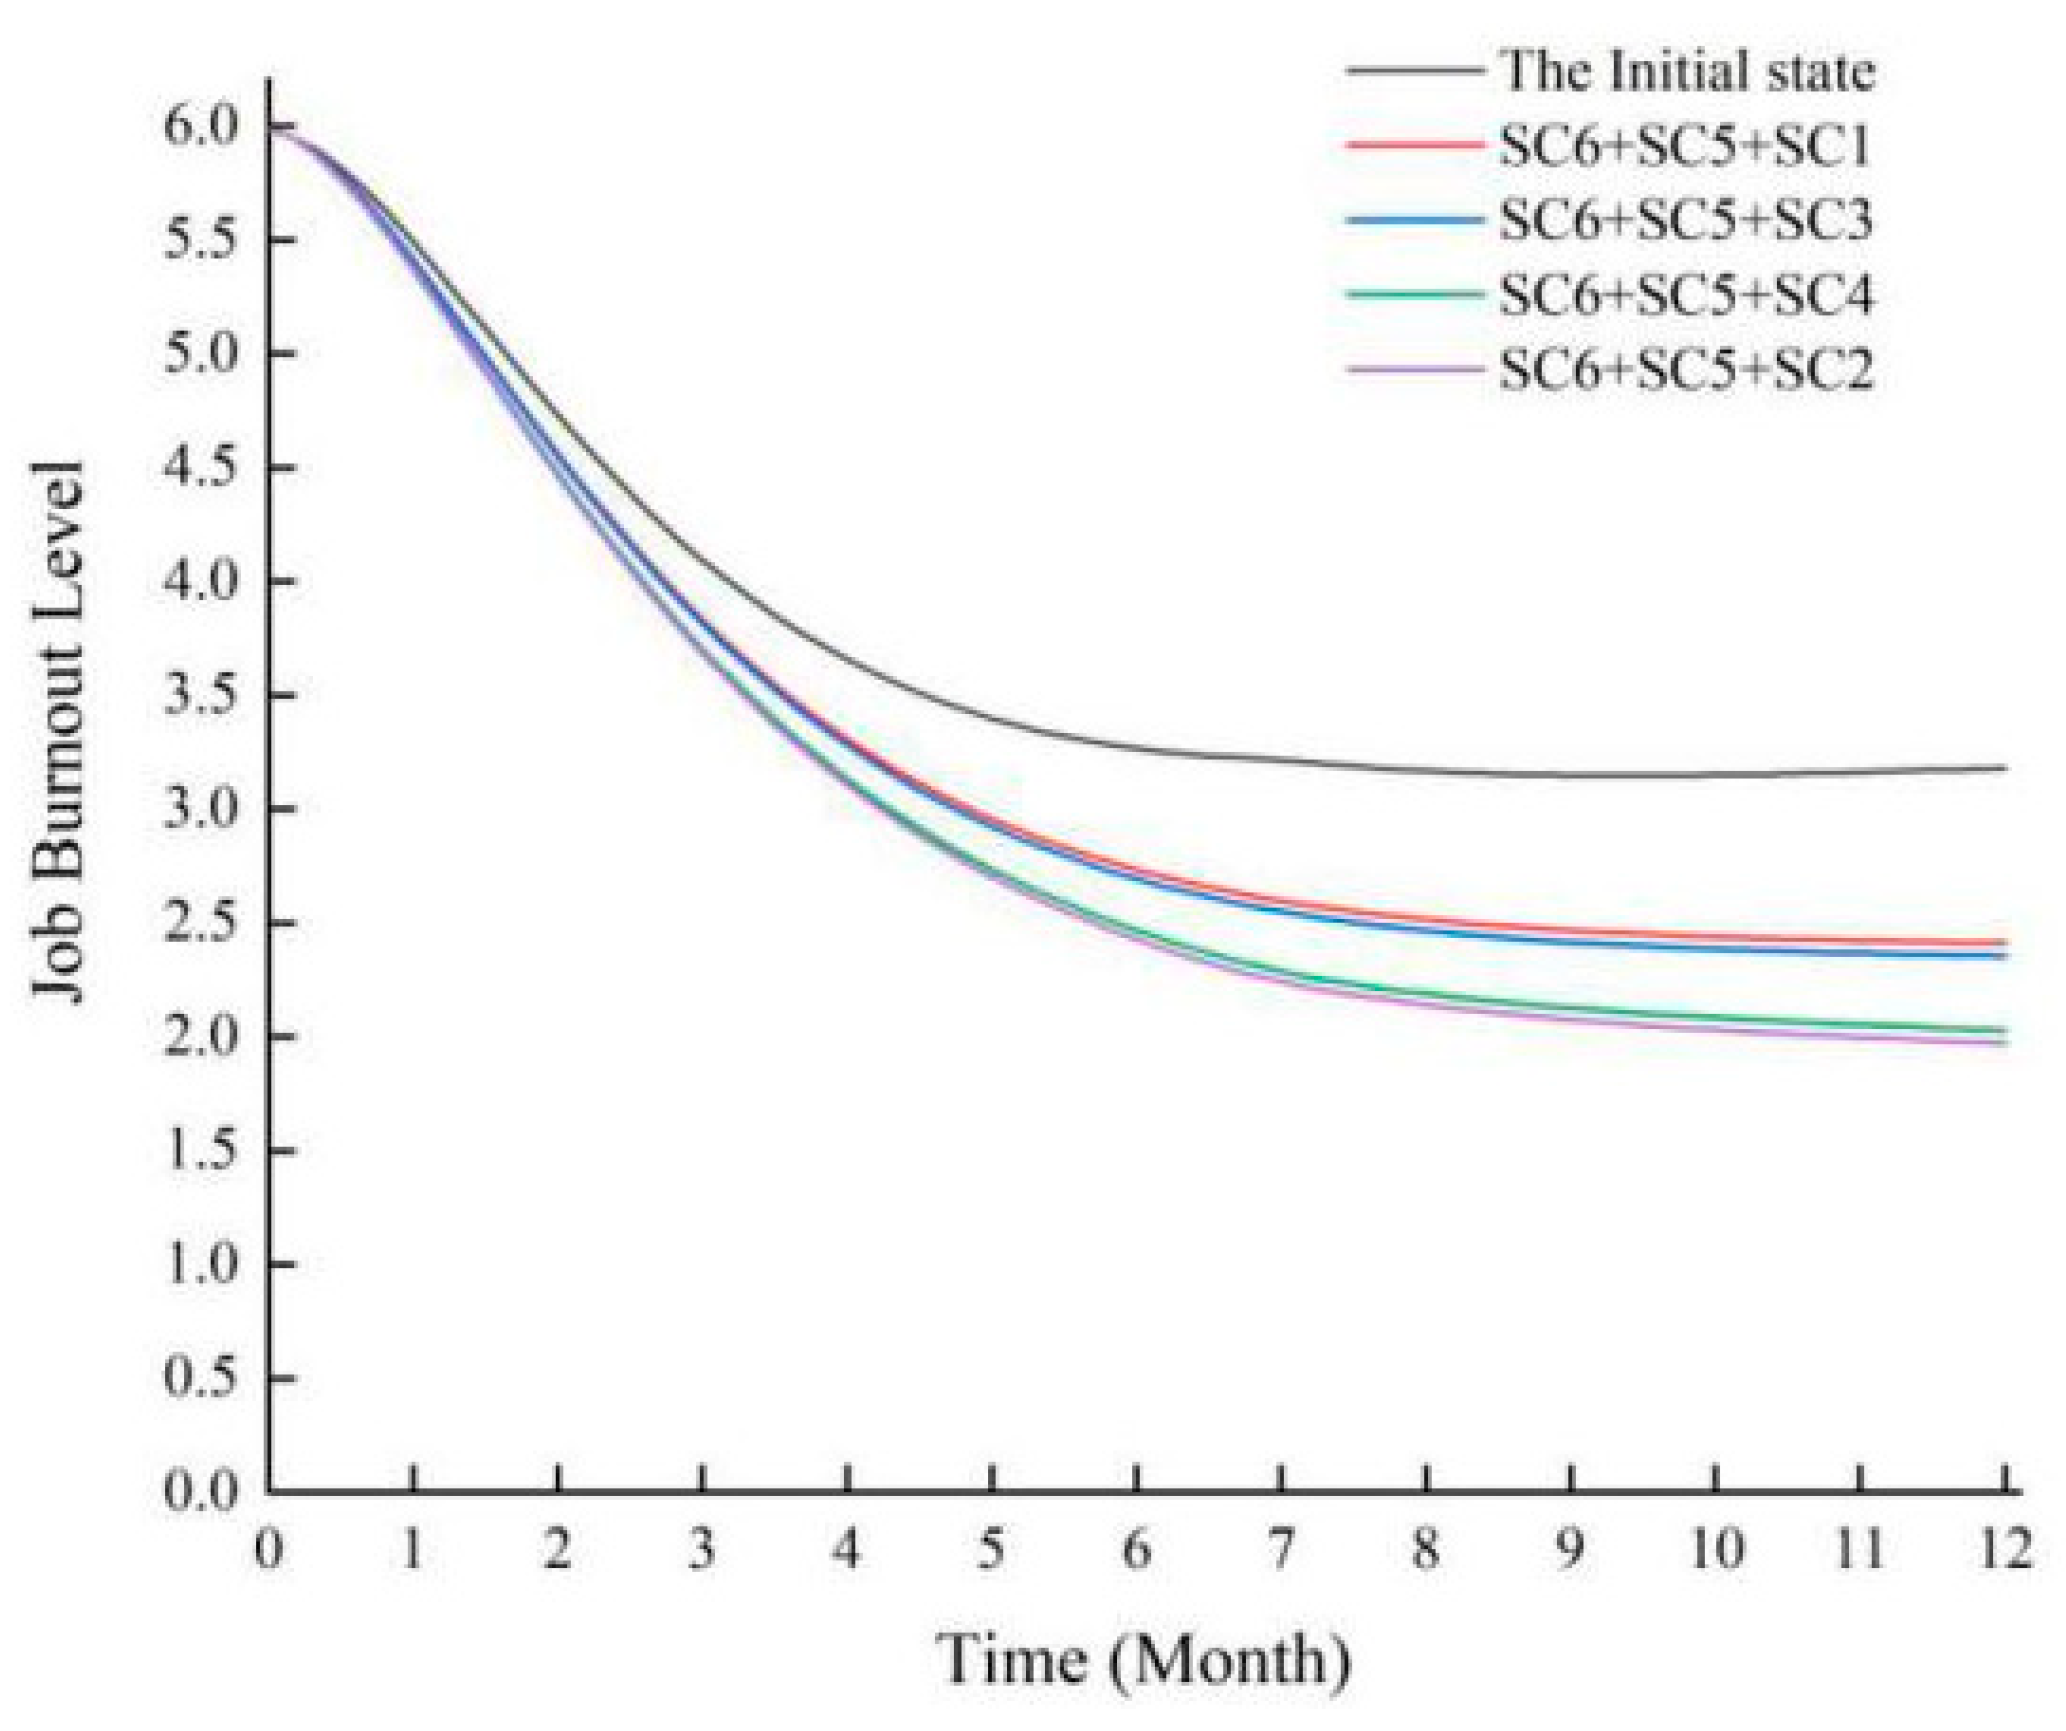
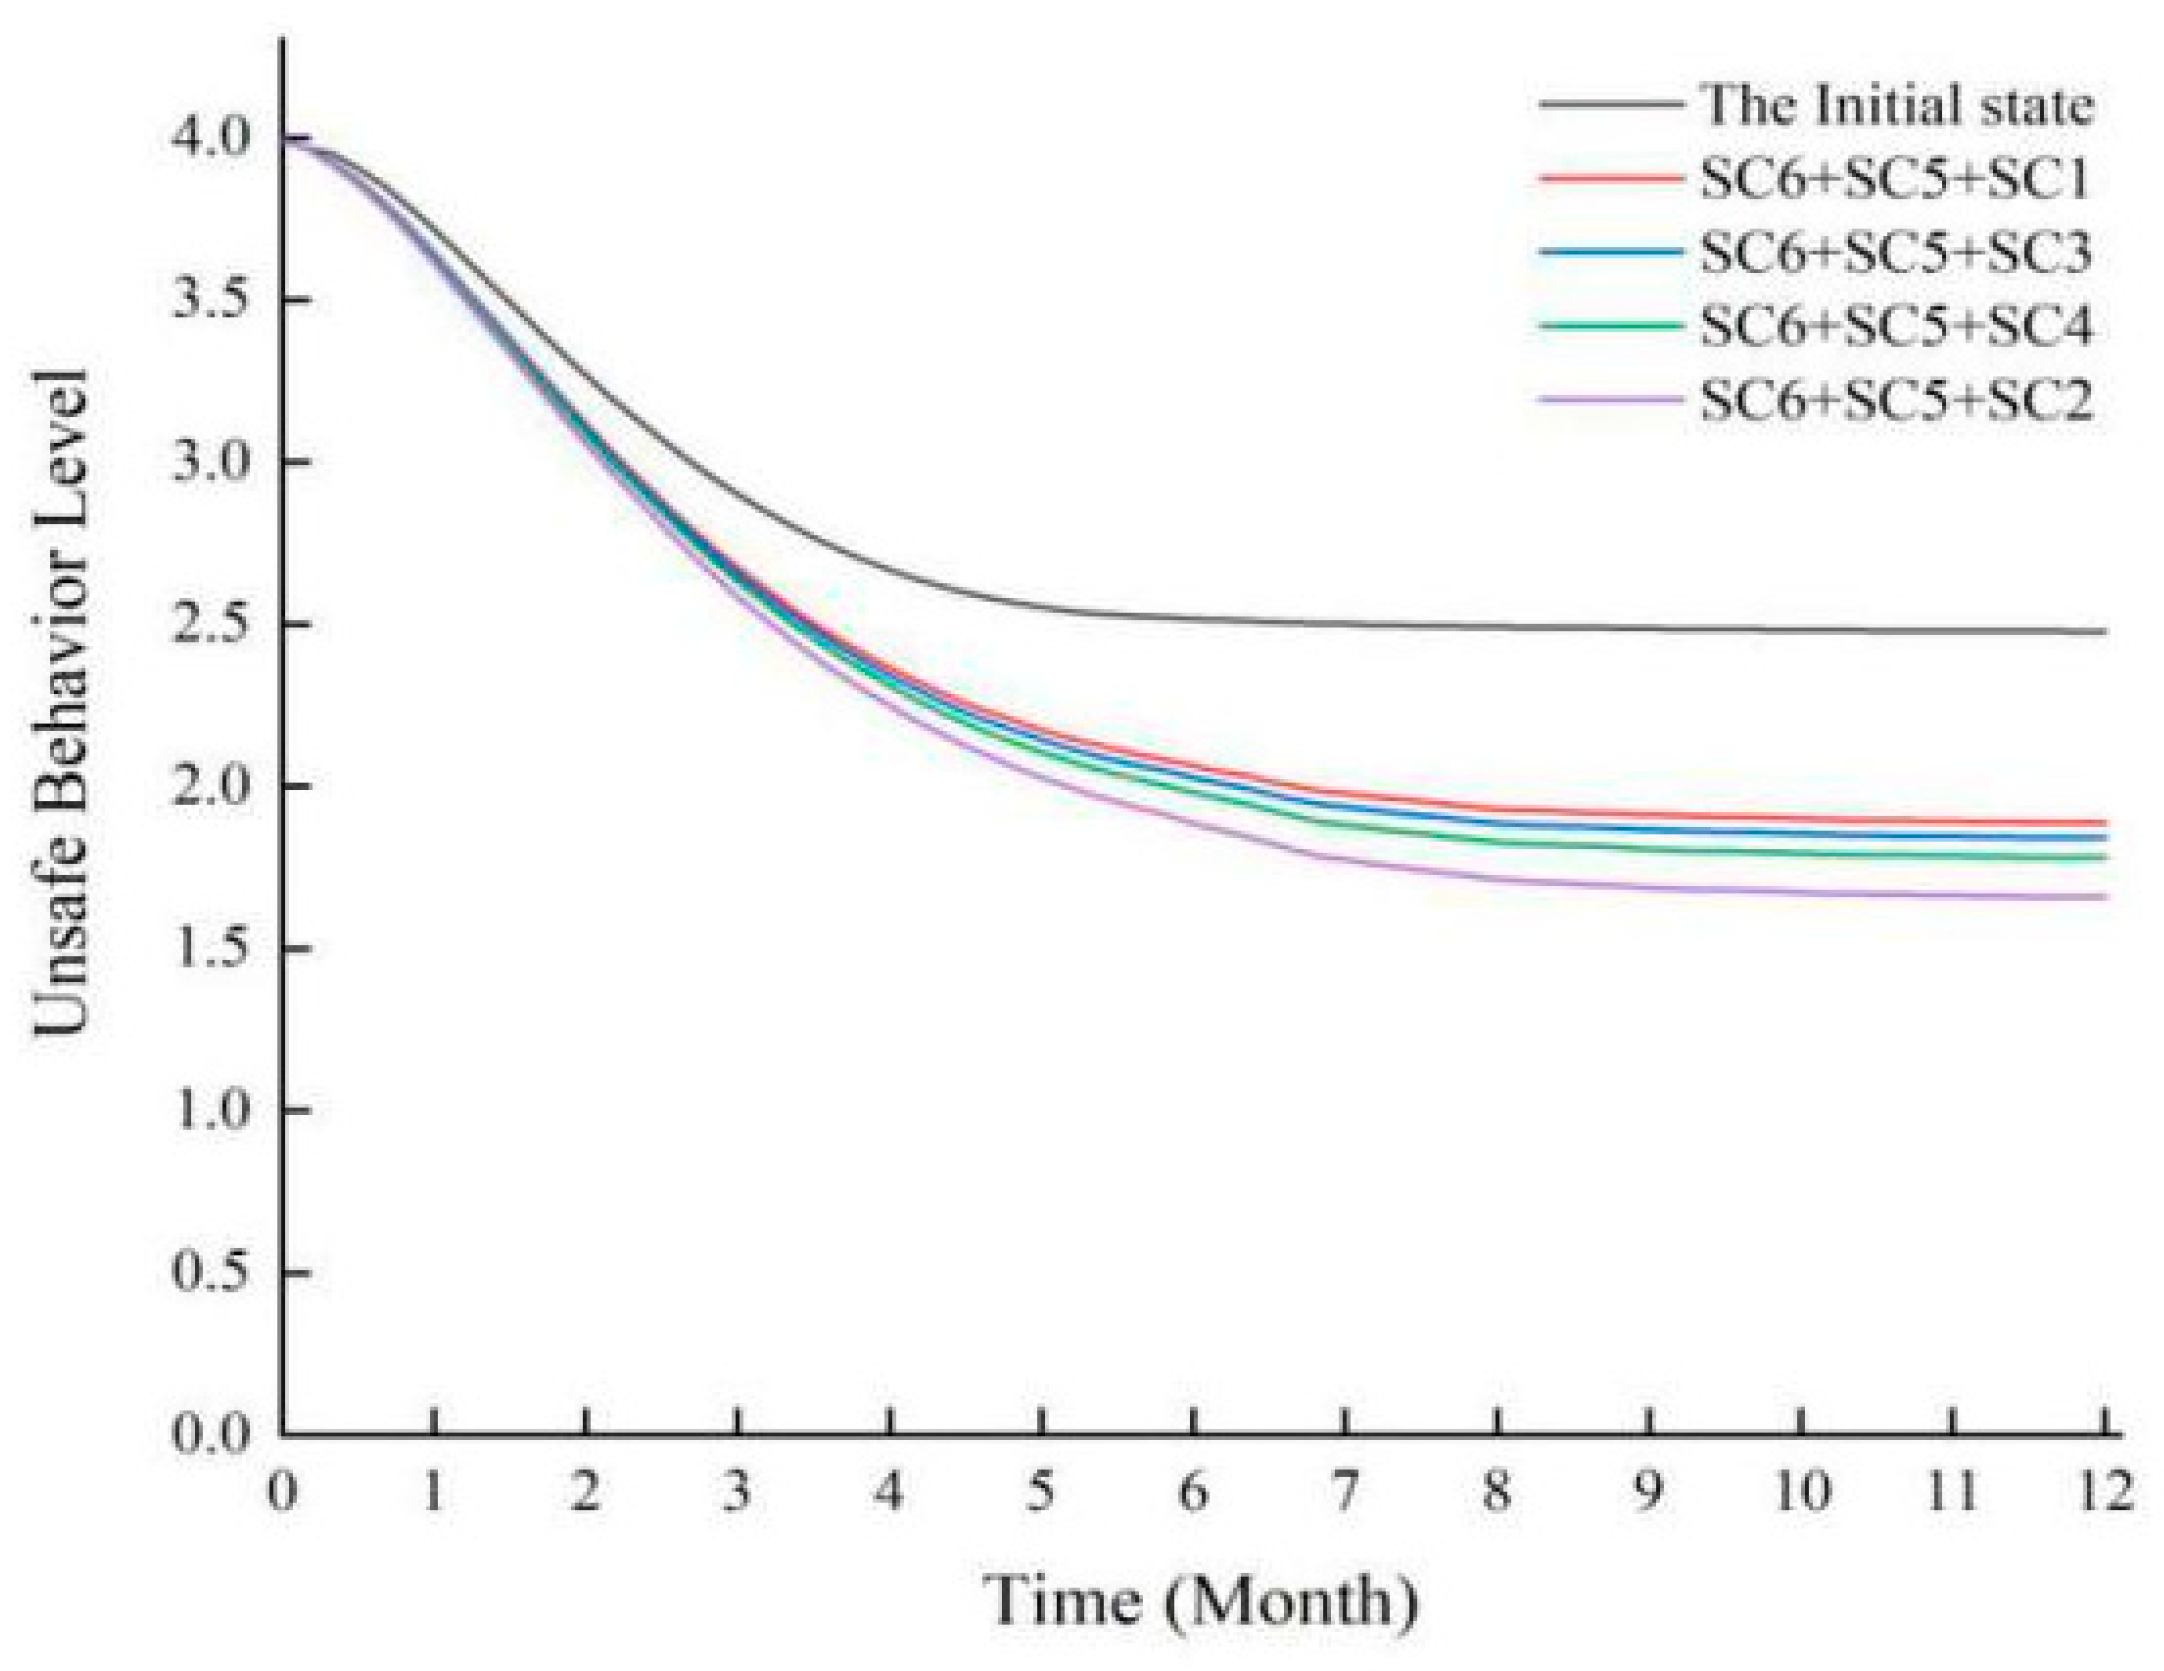
4.4. Discussion of the Joint Intervention Strategy

Based on previous studies on job burnout, this paper further studies the intervention strategies for unsafe behaviors. According to the intervention model of job burnout and the level of unsafe behaviors based on SEM-SD, a set of control strategies is proposed from the three aspects of safe communication, safety incentive, and safety training, as shown in Table 10. Safety communication emphasizes a two-way interaction between leaders and employees, and pays attention to employees’ physical and mental health. Safety training focuses on knowledge popularization and psychological adjustment to help employees master safety operation and emergency response skills. Safety incentives motivate employees to actively participate in safety management through a system of rewards and punishments and career development opportunities. Together, these strategies build a comprehensive safety management system designed to reduce unsafe behaviors and enhance workplace safety.
A sensitivity analysis was also conducted to assess the extent to which different intervention strategies affect different groups of employees. The results found that, for young employees, increasing rest time and providing family support had a significant effect on reducing burnout and unsafe behaviors, while, for older employees, enhancing safety training and establishing safety incentives were more effective. These results provide an important basis for developing targeted intervention strategies.

4.5. Development and Application of the Job Burnout and Unsafe Behavior Intervention System

(I)
Development of Burnout and Unsafe Behavior Intervention System
Based on the above control strategies and specific implementation details, an application software matching the job burnout and unsafe behavior intervention control system was developed to execute various tasks related to safety training and education, safety incentive systems, and safety communication. Its design process is shown in Figure 11.
This system realizes all the functions required for the intervention in employees’ job burnout and unsafe behaviors. Each function is provided by the corresponding module. Some pages on the APP side are shown in Figure 12. It contains pages such as “Safety Education and Training”, “Mental Knowledge”, “Works Display”, etc. The “Safety Education and Training” page focuses on conveying key information on safety issues to users and enhancing their safety awareness and skills. The “Safety Education and Training” page focuses on conveying key information about safety issues to users and enhancing their safety awareness and skills. The “Psychology Knowledge” page provides users with knowledge and resources related to psychology. The “Showcase” page displays instructions for using various tools and equipment.
(II)
Application of Burnout and Unsafe Behavior Intervention System
1. Practical application cases
The intervention system was applied in a nuclear power plant construction project, which was implemented as follows.
(1) Data collection: Employees’ workload, psychological state, and environmental data are collected through questionnaires and sensors.
(2) Model building: Key factors such as work pressure, family support, and safety culture were identified using SEM, and the effects of different interventions were simulated through SD.
(3) Interventions:
① Reduce work pressure: optimize scheduling and increase rest time.
② Enhance family support: provide a family day and psychological counseling.
③Enhance safety culture: strengthen training and establish safety incentives.
(4) Effectiveness assessment: After the implementation of systematic intervention initiatives, employee burnout was significantly alleviated, work enthusiasm rebounded significantly, and unsafe behaviors such as irregular operations were sharply reduced. The safety performance of the project was significantly improved, the accident rate was significantly reduced, and the production operation became more stable and orderly.
2. Effectiveness analysis
The effectiveness of this intervention system is reflected in the following.
(1) Comprehensiveness: Combining SEM and SD, it comprehensively analyzes problems and designs interventions.
(2) Predictive: Predicting risks and taking measures in advance through SD simulation.
(3) Individualized: Provide customized interventions based on individual differences.
(4) Sustainability: Continuous evaluation and optimization to ensure continued effectiveness.
3. Practical application conclusions
The SEM-SD-model-based intervention system integrates structural equation modeling (SEM) and System Dynamics (SD) to scientifically identify the key factors of burnout and unsafe behaviors in nuclear power plant construction projects and dynamically simulate the effects of intervention strategies. Through real-time data collection, accurate modeling, and simulation, it provides decision-making support for managers, reduces emotional exhaustion, improves risk perception, and reduces unsafe behaviors. Practice shows that the system can improve safety performance, reduce accident rates, and optimize employee psychology, and is applicable to nuclear power plants and other high-risk industries with a bright future.
(III)
SEM-SD model
  • Comparison with other modeling techniques
Table 11 below shows each modeling type and their characteristics.
Table 12 below shows each modeling type and their applicable scenarios.
Table 13 below shows the various modeling types and their strengths and limitations.
SEM-SD models are suitable for scenarios requiring explicit causality and dynamic feedback, with low data volume requirements but high computational complexity. CNNs are suitable for processing high-dimensional data (e.g., images, videos), requiring a large amount of data and computational resources, but with poor interpretability. The integrated learning model is suitable for prediction tasks of structured data, with strong overfitting resistance but limited interpretability. Therefore, in this thesis, the SEM-SD model is chosen to analyze the burnout, unsafe behaviors, and safe production climate among the workers of nuclear power plants under construction, and a joint intervention strategy is established.
2.
Potential applications of similar models in other high-risk industries
(1) Fire safety
In the field of fire safety, application scenarios include fire risk assessment, which analyzes the impact of building structure and other factors on fire risk; emergency response optimization, which simulates the spread of fire to optimize evacuation and rescue strategies; and equipment maintenance strategy, which evaluates the impact of the maintenance frequency of firefighting equipment on system reliability. The advantage of the model is that it can capture the dynamic fire spread process, clarify the key drivers of fire risk, and support the development of prevention and emergency response strategies.
(2) Aviation
In the field of aviation, the application scenarios include flight safety analysis, identifying key factors affecting flight safety; maintenance plan optimization, simulating the aging process of aircraft components to optimize the maintenance plan; and accident investigation, analyzing the causes of accidents and proposing improvement measures through modeling. The advantages of the model are that it can model the dynamic behavior of complex systems, support causal analysis and risk assessment, and help optimize resource allocation and decision making.
(3) Structural Health Monitoring
In terms of structural health monitoring, the application scenarios cover building health assessment, which analyzes the impact of structural aging and environmental loads on building safety; bridge monitoring, which simulates the impact of traffic loads and material fatigue on the bridge structure; and early warning system, which predicts the risk of structural failures and provides timely warnings through dynamic modeling. The modeling advantage is that it can capture the dynamic process of structural aging and failure, support long-term monitoring and prediction, and help formulate maintenance and reinforcement strategies.

5. Conclusions

5.1. Results and Contributions

This study explores the relationship between job burnout, unsafe behavior, and safety climate by constructing the SEM-SD model, which has significant novelty and contribution in both theory and method.
First, this study focuses on the high-risk environment of nuclear power plant construction, which breaks through the limitations of general work scenarios and explores the relationship between job burnout, unsafe behaviors, and safety climate, which is of practical significance. Safety climate was introduced as a moderating variable, and its mechanism of action was analyzed in depth. Second, the SEM and SD models are innovatively integrated to realize the complementarity between static and dynamic analysis. A multi-dimensional indicator system of individual, organization, and environment is constructed to comprehensively reflect the complex relationship and enhance the scientificity and reliability of the study. Theoretically, it enriches the research on job burnout, unsafe behaviors, and safety climate, providing new perspectives and methods to reveal the impact of job burnout on unsafe behaviors and the moderating role of safety climate in nuclear power plant projects. In practice, it provides scientific tools for nuclear power plant managers to identify and assess risks, develop intervention strategies, and improve safety performance, and the results can be extended to high-risk industries such as the chemical industry and aerospace industry to provide a reference for safety management.
By introducing advanced three-dimensional visualization techniques and sensitivity analysis methods, this study not only intuitively demonstrated the complex relationship between burnout, unsafe behaviors, and safety climate, but also successfully assessed the degree of impact of different intervention strategies on different employee groups. The introduction of these methods not only enriched the research content of the paper, but also provided strong support for the development and optimization of targeted intervention strategies. Future research can further explore the application of more visualization techniques and sensitivity analysis methods in the field of safety management.

5.2. Limitations

1. Data and model limitations: The research data mainly come from specific nuclear power plant projects, which are not representative enough and are susceptible to subjective bias; although the SEM-SD model combines the advantages of the two, the variable selection is incomplete and the integration is technically difficult, resulting in the limited explanatory power of the model and simulation accuracy.
2. Challenges of application and promotion: The findings of the study are affected by the industry specificity and cultural background, so the generalizability is limited; the high cost of real-time monitoring data collection and the complex maintenance of the SEM-SD model put forward high requirements for practical application, which limits its extensive promotion in different industries and regions.
This paper conducts an in-depth and systematic exploration of the complex interrelationships among job burnout, employee behavior safety, and safety climate. This study validates the moderating role of safety climate in the emergence of job burnout and its impact on work performance, and reveals the crucial role of safety climate as a mediating variable.
In addition, this study has established an SD model for job burnout and behavioral safety, which is capable of dynamically simulating and predicting the effects of intervention measures. Facing the dual challenges of job burnout and behavioral safety research, this paper innovatively proposes a joint intervention strategy, aiming to effectively alleviate job burnout and reduce the occurrence of unsafe behaviors through multi-dimensional and multi-level measures.
Finally, this study translated the theoretical achievements into practical applications and successfully developed an intervention system for job burnout and unsafe behaviors in nuclear power plants under construction. The system has been effectively applied in the actual work of nuclear power plants and has achieved remarkable intervention effects. Future research directions can explore the application of convolutional deep learning models (CNNs) to predict and mitigate unsafe behaviors. By extracting spatial and temporal features from behavioral data through CNNs and combining them with real-time monitoring and dynamic feedback mechanisms, unsafe behaviors can be more accurately identified and predicted, and targeted interventions can be designed. This interdisciplinary application is expected to significantly enhance the intelligence of behavioral safety management and provide new solutions for safety and security in high-risk industries.

Author Contributions

Conceptualization, W.Y.; Methodology, J.G.; Software, W.Y. and X.S.; Formal analysis, J.G. and K.Y.; Resources, J.G.; Data curation, X.S. and Y.Z.; Writing—original draft, W.Y., X.S., K.Y. and Y.Z. All authors have read and agreed to the published version of the manuscript.

Funding

This research received no external funding.

Data Availability Statement

The original contributions presented in this study are included in the article. Further inquiries can be directed to the corresponding authors.

Conflicts of Interest

Authors Jianzhan Gao, Weibo Yang and Xueqiang Shan were employed by the company China Nuclear Power Engineering Co., Ltd. The remaining authors declare that the research was conducted in the absence of any commercial or financial relationships that could be construed as a potential conflict of interest.

References

  1. Meng, Q.; Zhu, J.; Li, Z.; Chong, H.Y. Clarifying Unsafe Behaviors of Construction Workers through a Complex Network of Unsafe Behavior Chains. J. Constr. Eng. Manag. 2024, 150, 04024164. [Google Scholar] [CrossRef]
  2. Alsafi, O.; Alhamdi, A.; Alsanea, A.; Alsultan, M.; Alzahrani, S.; Shams, A.; Al-Athel, K.; Siddiqui, O. Safety, Security, and Design Consideration of Nuclear Power Plants in the Kingdom of Saudi Arabia. Arab. J. Sci. Eng. 2024, 50, 3505–3518. [Google Scholar] [CrossRef]
  3. Chen, Y.; Ma, C.; Long, Y. Simulation Study of the Propagation of Underground-Construction Worker Unsafe Behavior. SAGE Open 2023, 13, 1–12. [Google Scholar] [CrossRef]
  4. Kariuki, S.G.; Lwe, K. Integrating human factors into process hazard analysis. Reliab. Eng. Syst. Saf. 2007, 92, 1764–1773. [Google Scholar] [CrossRef]
  5. Newaz, M.T.; Ershadi, M.; Jefferies, M.; Davis, P. A critical review of the feasibility of emerging technologies for improving safety behavior on construction sites. J. Saf. Res. 2024, 89, 269–287. [Google Scholar] [CrossRef]
  6. Jia, Q.; Fu, G.; Xie, X.; Hu, S.; Wang, Y.; Lyu, Q. Study on the reliability of accident analysis results: Taking two groups of four accident analysis references with the 24Model as samples. Proc. Inst. Mech. Eng. Part O J. Risk Reliab. 2024, 238, 172–192. [Google Scholar] [CrossRef]
  7. Lan, H.; Ma, X. Risk Evolution Analysis of Seafarers’ Unsafe Acts in Maritime Accidents Based on Directed Weighted CN. Appl. Sci. 2024, 14, 2595. [Google Scholar] [CrossRef]
  8. Haslam, R.A. Contributing factors in construction accidents. Appl. Ergon. 2005, 36, 401–415. [Google Scholar] [CrossRef]
  9. Heinrich, H.W. Industrial Accident Prevention; McGraw-Hill: New York, NY, USA, 1979. [Google Scholar]
  10. Reason, J. Human Error; Cambridge University Press: Cambridge, UK, 1990. [Google Scholar]
  11. Diaz, R.I.; Cabrera, D.D. Safety climate and attitude as evaluation measures of organization safety. Accid. Anal. Prev. 1997, 29, 643–650. [Google Scholar] [CrossRef]
  12. Fogarty, G.J.; Shaw, A. Safety climate and theory of planned behavior; Towards the prediction of unsafe behavior. Accid. Anal. Prev. 2010, 42, 1455–1459. [Google Scholar] [CrossRef]
  13. Geller, S. The fitting solution to respiratory hazards. Psychol. Saf. 2004, 6, 12–14. [Google Scholar]
  14. Verschuur, W.L.; Hurts, K. Modeling safe and unsafe driving behaviour. Accid. Anal. Prev. 2008, 40, 644–656. [Google Scholar] [CrossRef] [PubMed]
  15. Choudhry, R.M.; Fang, D. Why operatives engage in unsafe work behavior: Investigating factors on construction sites. Saf. Sci. 2008, 46, 566–584. [Google Scholar] [CrossRef]
  16. Aksorn, T.; Hadikusumo, B.H.W. The unsafe acts and the decision-to-err factors of Thai construction workers. J. Constr. Dev. Ctries. 2007, 12, 1–25. [Google Scholar]
  17. Fu, G.; Yang, C.; Yin, W. The expanded version of the “2–4” model of behavior-based safety. J. China Coal Soc. 2014, 39, 94–99. [Google Scholar]
  18. Ye, G.; Chen, M.; Wang, H. Research on the revised TPB model of construction workers’ unsafe behavior intention. China Saf. Sci. J. 2015, 25, 145–151. [Google Scholar]
  19. Cai, Q. Research on User Electricity Consumption Behavior Analysis Method Based on Load Data Pre-Processing. Master’s Thesis, Nanjing University of Posts and Telecommunications, Nanjing, China, 2022. [Google Scholar] [CrossRef]
  20. Huang, L.; Li, D.; Zhuo, J. Research on Behavior Analysis and Recognition during the Substation Infrastructure Construction Period Based on the YOLOv5 Model. Electr. Power Surv. Des. 2024, 64–68+92. [Google Scholar] [CrossRef]
  21. Zhang, L.; Sun, J.; Dong, J. Theoretical Discussion on Group Behavior of Tunnel Workers’ Safety Management. Ind. Saf. Environ. Prot. 2019, 45, 75–79. [Google Scholar]
  22. Zare, R.; Kazemi, R.; Choobineh, A.; Cousins, R.; Smith, A.; Mokarami, H. Development of a work systems stress questionnaire to predict job burnout: A mixed methods study based on a macroergonomics approach. Heliyon 2024, 10, e40226. [Google Scholar] [CrossRef]
  23. Sarah, O. The burnout companion to study and practice: A critical analysis. Ergonomics 2021, 64, 1507. [Google Scholar]
  24. Chang, X.; Yang, L.; Shi, W. Research on Job Burnout in Work Safety from the Perspective of Positive Psychology. J. Jilin Jianzhu Univ. 2016, 33, 108–111. [Google Scholar]
  25. Wang, Z.; Yang, H. Research on the Job Burnout of Communist Youth League Cadres in Hainan Higher Vocational Colleges from the Perspective of Public Management. Mod. Bus. Trade Ind. 2024, 45, 126–128. [Google Scholar] [CrossRef]
  26. Zhang, S.; Zuo, W.; Li, J. Analysis of the Impact of Work Stress on Job Burnout among Medical Staff in Township Health Centers in Shuozhou City in 2022. J. Prev. Med. Inf. 2024, 40, 1523–1529. [Google Scholar] [CrossRef]
  27. Xu, T.; Li, J. Influence Mechanism Model of Miners’ Job Burnout and Safety Performance. Min. Saf. Environ. Prot. 2018, 45, 112–116. [Google Scholar]
  28. Zhou, J.; Hu, F.; Xing, Y.; Gao, R. Influence of Work Stress and Job Burnout on Unsafe Behaviors of Construction Workers. China Saf. Sci. J. 2022, 32, 14–22. [Google Scholar] [CrossRef]
  29. Varlamova, J.; Kadochnikova, E. Modeling the Spatial Effects of Digital Data Economy on Regional Economic Growth: SAR, SEM and SAC Models. Mathematics 2023, 11, 3516. [Google Scholar] [CrossRef]
  30. Ibrahim, A.N.H.; Borhan, M.N.; Mat Yazid, M.R.; Hassan, S.A.; Arham, A.F.; Hashim, S. Modelling of Passenger Satisfaction and Reuse Intention with Monorail Services in Kuala Lumpur, Malaysia: A Hybrid SEM-ANN Approach. Mathematics 2023, 11, 3361. [Google Scholar] [CrossRef]
  31. Chen, T.G.; Yin, X.H.; Peng, L.J.; Rong, J.T.; Yang, J.J.; Cong, G.D. Monitoring and Recognizing Enterprise Public Opinion from High-Risk Users Based on User Portrait and Random Forest Algorithm. Axioms 2021, 10, 106. [Google Scholar] [CrossRef]
  32. Omwenga, V.O.; Madhumati, V.; Vinay, K.; Srikanta, S.; Bhat, N. Mathematical Modelling of Combined Intervention Strategies for the Management and Control of Plasma Glucose of a Diabetes Mellitus Patient: A System Dynamic Modelling Approach. Mathematics 2023, 11, 306. [Google Scholar] [CrossRef]
  33. Li, P.L.; Che, L.N.; Wan, L.H.; Fei, L.G. A Multimoora-Based Risk Evaluation Approach for CCUS Projects by Utilizing D Numbers Theory. Axioms 2022, 11, 204. [Google Scholar] [CrossRef]
  34. Liu, Y.; Zhang, L.; Hu, Y.; Wang, Z. Evolutionary Game Analysis of China–Laos Electric Power Cooperation. Sustainability 2024, 16, 10560. [Google Scholar] [CrossRef]
  35. Karaz, M.; Teixeira, J.M.C.; Amaral, T.G.d. Mitigating Making-Do Practices Using the Last Planner System and BIM: A System Dynamic Analysis. Buildings 2024, 14, 2314. [Google Scholar] [CrossRef]
  36. Wang, Y.; Zhao, J.; Gao, N.; Shen, F. A Dynamic Evaluation Method for the Development of Intelligent Construction Technology in the Construction Field Based on Structural Equation Model–System Dynamics Model. Buildings 2024, 14, 417. [Google Scholar] [CrossRef]
Figure 1. Theoretical model framework.
Buildings 15 00954 g001
Figure 2. Mechanism model of job burnout, unsafe behavior, and safety atmosphere.
Buildings 15 00954 g002
Figure 3. The moderating effect of safety climate between various dimensions of job burnout and stress.
Buildings 15 00954 g003
Figure 4. The moderating effect of safety climate between various dimensions of job burnout and unsafe behaviors.
Buildings 15 00954 g004
Figure 5. SD model behaviors.
Buildings 15 00954 g005
Figure 6. The unsafe behavior and job burnout in the initial state.
Buildings 15 00954 g006
Figure 7. The job burnout level.
Buildings 15 00954 g007
Figure 8. The level of unsafe behaviors.
Buildings 15 00954 g008
Figure 9. Employee burnout level.
Buildings 15 00954 g009
Figure 10. Unsafe behavior level.
Buildings 15 00954 g010
Figure 11. Design flow chart of the control system for job burnout and unsafe behavior intervention.
Buildings 15 00954 g011
Figure 12. APP system page map.
Buildings 15 00954 g012
Table 1. Description of the main variables.
Variable TypeVariable NameVariable Content
SCSafety consciousness (SC1)It is an employee’s mental state of alertness or attention to factors that may cause harm to themselves or pose potential dangers to the surrounding environment during work activities.
Safety training (SC2)For enterprises, personnel without safety education and training are not allowed to engage in production work for their posts.
Risk preparation (SC3)Enterprises create a safe workplace for smooth production.
System and norms (SC4)Enterprises have formulated a series of rules, regulations, and operating procedures to protect the safe production and the legitimate rights and interests of employees.
Safety communication (SC5)Enterprises share their work experience and opinions through safety seminars or team meetings, thereby improving work collaboration between employees.
Safety incentive (SC6)It means that employees provide material rewards, praise, and honors for achieving the safety goals or tasks set by the company.
StressWorking environment stress (S1)A common problem faced by workers is that the working environment is rather harsh compared to other industries.
Job responsibility stress (S2)The work pressure of the staff in each position is mainly composed of the production and safety responsibilities of their jobs.
Interpersonal relationship stress (S3)Enterprises work in a special nature, with three shifts all year round, hard work, long working hours, and lack of daily communication.
Career development stress (S4)Workers do not have enough time to continue their advanced studies in terms of career development. There are often missed good opportunities for promotion due to insufficient academic qualifications.
Family environment stress (S5)The daily working hours of workers are more than ten hours, and the time to rest and take care of their families is not guaranteed.
Organization system stress (S6)Pressure from the rationality of related institutions and incentives.
BurnoutResist work (CY1)Doubt the significance of work.
Individual negative evaluation (CY2)I do not care if I contribute to my work.
Negative attitude (CY3)Since I started this job, I have become less and less concerned about the job.
Sleep disturbance (EX1)When I get up in the morning and have to face the work of the day, I feel very tired.
Physical fatigue (EX2)I feel exhausted when I get off work.
Indifference (EX3)My current job prevents me from dealing with emotional problems well.
Work efficiency (RPA1)In my opinion, I am not good at my job.
Unfinished work (RPA2)My workload is too large, which causes me to work overtime often.
Unrealized value (RPA3)I do not think I can contribute much to the development of enterprises.
Unsafe behaviorRisky behavior (UB1)I will risk entering dangerous places.
Distracted (UB2)I will be distracted at work.
No pre-employment inspection (UB3)I will not inspect the facility before work.
Conflict protection tool (UB4)I will not wear safety protection equipment.
Illegal operation (UB5)I will not perform safety production work in accordance with formal operating procedures.
Lack of safety knowledge (UB6)I do not recognize the safety signs and warnings.
Table 2. KMO and Bartlett test parameters for the questionnaire.
Kaiser–Meyer–Olkin measure of sampling adequacy0.716
Bartlett’s sphericity
test
Approximate chi-square2341.814
df946
Sig.0.000
Table 3. Number of items and Cronbach Number corresponding to different dimensions.
DimensionNumber of ItemsCronbach Number
SC60.931
Stress50.822
UB50.728
CY30.819
RPA30.789
EX30.819
Table 4. Demographic scale.
Demographic VariableFrequencyPercentage (%)Cumulative Percentage (%)
GenderMale51380.980.9
Female12119.1100
Age25 and under1141818
26–3519831.249.2
36–4525239.889
45 and above7011100
Education backgroundJunior high school and below8813.913.9
Secondary school or high school32150.664.5
Undergraduate19831.295.7
Master degree or above274.3100
Length of service5 years and below18929.829.8
6–10 years26842.372.1
11–15 years10716.989
15 years and above7011100
Type of workTechnical personnel21333.633.6
Management personnel24338.371.9
Operating personnel17828.1100
Table 5. Measurements of the adaptability of the model.
Fitting IndexCMIN/DFGFIAGFINFIRFICFIRMSEA
SEM model1.2190.8680.8440.920.910.8770.029
standard value<3>0.8>0.8>0.8>0.8>0.8<0.05
Table 6. Path coefficients of the modified model. (“***” is usually a symbolic notation used to indicate a level of statistical significance, with “***” indicating that the relationship or difference between variables is highly statistically significant at a very high level of confidence (usually p < 0.001)).
PathPath Coefficientp-Value
Safety climateWork pressure−0.222***
Safety climateJob burnout−0.355***
Safety climateUnsafe behavior−0.567***
Work pressureJob burnout0.455***
Work pressureUnsafe behavior0.248***
Job burnoutUnsafe behavior0.480***
Table 7. Hypothesis result testing table.
Hypothesis NumberHypothesis DescriptionTest Result
H1Work pressure has a positive impact on job burnout.support
H2There is a negative correlation between work pressure and safety climate.support
H3There is a negative correlation between job burnout and safety climate.support
H4Job burnout has a positive impact on unsafe behaviors.support
H5There is a negative correlation between safety climate and unsafe behaviors.support
H6There is a negative correlation between work pressure and unsafe behaviors.support
Table 8. Variable set in SD simulation on job burnout.
Variable TypeVariable Name
State variablesUnsafe behavior level, job burnout level, safety climate level, stress level
Rate variablesThe increment of unsafe behavior, the increment of job burnout, the increment of stress, the increment of safety climate, the reduction in unsafe behavior, the reduction in job burnout, the reduction in stress
Auxiliary variablesWorking environment stress, job responsibility stress, interpersonal relationship stress, career development stress, family environment stress, organization system stress, resist work, individual negative evaluation, negative attitude, sleep disturbance, physical fatigue, indifference, work efficiency, unfinished work
Unrealized value, risky behavior, distracted, no pre-employment inspection, conflict protection tool, illegal operation, lack of safety knowledge
ParameterSafety consciousness, safety training, risk preparation, system and norms, safe communication, safety incentive
Table 9. Coefficients and values of auxiliary variables.
Variable NameCoefficientConstant
Working environment stress (S1)0.8762.34
Job responsibility stress (S2)0.6742.32
Interpersonal relationship stress (S3)0.7432.55
Career development stress (S4)0.8572.27
Family environment stress (S5)0.8212.13
Organization system stress (S6)0.7842.82
Resist work (CY1)0.8233.35
Individual negative evaluation (CY2)0.8653.76
Negative attitude (CY3)0.7633.43
Sleep disturbance (EX1)0.7713.84
Physical fatigue (EX2)0.6943.88
Indifference (EX3)0.7573.58
Work efficiency (RPA1)0.8453.23
Unfinished work (RPA2)0.8853.11
Unrealized value (RPA3)0.7833.01
Risky behavior (UB1)0.8862.35
Distracted (UB2)0.8422.31
No pre-employment inspection (UB3)0.7932.63
Conflict protection tool (UB4)0.7732.61
Illegal operation (UB5)0.7552.53
Lack of safety knowledge (UB6)0.8122.58
Table 10. The set of control strategies.
StrategiesDetailed Contents
Safe communication1. Leaders should pay sufficient attention to every employee and strengthen safety communication with employees.
2. Employees should also participate in safety communication regularly. Let multiple people gather together to share their accident experiences, work experiences, and safety-related suggestions.
3. Video conferences, chat groups, and regular team meetings can all increase the frequency of communication.
4. Regarding the physiological manifestations of employees’ job burnout, encourage miners to care about each other. Once physiological manifestations occur, other employees should help with adjustments in a timely manner or directly arrange for rest days to avoid safety problems caused by job burnout.
Safety training1. Safety training should not only popularize safety awareness and safe operations in work, but also add content on effectively regulating their mental health so as to curb unsafe behaviors that may lead to safety accidents.
2. Help employees understand the rights they possess and the obligations they need to fulfill.
3. Help employees become familiar with the safety rules and regulations and safe operating procedures formulated by the enterprise.
4. Let employees master the safe operating procedures of their own positions, the protective measures against occupational diseases, and some emergency response measures in case of emergency accidents.
Safety incentive1. Establish a fair and reasonable reward and punishment system.
2. Set up a sound safety performance appraisal system.
3. Conduct regular safety assessments and give rewards according to the reward system.
4. Provide opportunities for job promotion and skill improvement.
Table 11. Model types and characteristics.
CharacteristicsSEM-SDConvolutional Neural Network (CNN)Ensemble Learning Model
Model TypeA dynamic system model based on equations and feedback loopsA deep learning model focusing on spatial feature extractionA combination of multiple base models (such as Random Forest, Gradient Boosting Tree)
Core IdeaDescribes the causal relationships and dynamic feedback among variablesExtracts local features through convolutional layers, suitable for processing grid data (such as images)Improves prediction performance by combining multiple weak learners
Data RequirementsRequires clear variable relationships and theoretical assumptionsRequires a large amount of labeled dataRequires a moderate amount of data, suitable for structured data
InterpretabilityHigh, with clear causal relationshipsLow, a black-box modelModerate, depending on the base model (e.g., decision trees have relatively high interpretability)
Computational ComplexityModerate, suitable for small-to-medium-sized systemsHigh, requiring a large amount of computational resourcesModerate, depending on the base model and the ensemble method
Table 12. Applicable scenarios.
ScenariosSEM-SDConvolutional Neural Network (CNN)Ensemble Learning Model
Causal Relationship AnalysisVery suitable, capable of clarifying the causal relationships and dynamic feedback among variablesNot suitable, lacking causal reasoning abilityPartially suitable, can indirectly infer causal relationships through feature importance analysis
Time Series ForecastingSuitable, capable of modeling the long-term behavior of dynamic systemsSuitable, especially when combined with RNN or LSTMSuitable, especially for tree-based models (such as XGBoost, LightGBM)
Image/Video ProcessingNot suitableVery suitable, proficient in processing grid data such as images and videosNot suitable
High-Dimensional Data ProcessingNot suitableSuitable, capable of automatically extracting featuresSuitable, especially for tree-based models
Small Sample DataSuitable, relying on theoretical assumptions rather than a large amount of dataNot suitable, requiring a large amount of dataPartially suitable, depending on the base model
Table 13. Advantages and limitations.
DimensionsSEM-SDConvolutional Neural Network (CNN)Ensemble Learning Model
Advantages- Clear causal relationships
- Suitable for dynamic system modeling
- Low requirements for the amount of data
- Automatic feature extraction
- Suitable for high-dimensional data (such as images)
- Excellent performance
- Strong prediction performance
- Good ability to resist overfitting
- Suitable for structured data
Limitations- Strong dependence on theoretical assumptions
- Not suitable for high-dimensional data
- Computational complexity increases with the scale of the system
- Requires a large amount of data
- Poor interpretability
- High consumption of computational resources
- Limited interpretability (except for decision trees)
- Limited ability to model non-linear relationships
Disclaimer/Publisher’s Note: The statements, opinions and data contained in all publications are solely those of the individual author(s) and contributor(s) and not of MDPI and/or the editor(s). MDPI and/or the editor(s) disclaim responsibility for any injury to people or property resulting from any ideas, methods, instructions or products referred to in the content.

