Article

Carbon Footprint Evaluation and Reduction Strategies for a Residential Building in Romania: A Case Study

by
Alexandru Mihai Bulmez
1,*,
George Dragomir
1,
Sorin Ionuț Bolocan
1,
Alin Ionuț Brezeanu
1,
Mariana Fratu
1,
Nicolae Fani Iordan
1,
Norbert Gocz
1 and
Răzvan Calotă
2
1
Faculty of Civil Engineering (UNITBV), Transilvania University of Brașov, 500152 Brașov, Romania
2
Faculty of Building Services, Technical University of Civil Engineering of Bucharest (UTCB), 021414 Bucharest, Romania
*
Author to whom correspondence should be addressed.
Buildings 2025, 15(6), 938; https://doi.org/10.3390/buildings15060938
Submission received: 14 February 2025 / Revised: 7 March 2025 / Accepted: 15 March 2025 / Published: 16 March 2025
(This article belongs to the Topic Decarbonising the Building Industry)

Abstract

:
Single-family residential buildings represent the highest share of building sector in Romania. Their operation emits the most CO2 into Earth’s atmosphere, as most of them are not energy efficient. A life cycle assessment is performed for a case study building, built in 2019 in Romania, establishing its carbon footprint. For this building CO2 emissions are 177.55 tCO2 for the construction stage, 76.19 tCO2 for the operation stage, 3.55 tCO2 for the demolition stage, and a total of 129.76 tCO2 after reducing with the carbon sequestration from vegetation 127.53 tCO2. The main purpose of this study is to analyse the carbon footprint for a typical single-family Romanian household, with an emphasis on the operational stage. The study compares the results and extrapolates them to all single-family residential buildings in Romania regarding CO2 emissions, with an emphasis on the operational stage. The results illustrate a considerable reduction in CO2 emissions from old, high energy consumption buildings to new, low energy consumption buildings. The highest operational stage emissions for old buildings in Romania are 962.94 tCO2 for firewood heating and 573.69 tCO2 for gas boiler heating, as those buildings are not insulated and don’t use a heat pump. Additionally, considering the use of photovoltaic panels for the entire lifespan, the CO2 emissions for the operational stage decrease for the case study building from 76.18 tCO2 to 19.90 tCO2. Moreover, using a heat pump detriments firewood or gas boilers, decreasing CO2 emissions for the operational stage by up to 34% and 26%, respectively. Due to the higher cost of electrical energy compared to natural gas in Romania, gas boilers are more cost-effective than heat pumps. Because of this, and the higher implementation costs, the tendency is towards natural gas. This will in turn result in an increase of CO2 emission for the entire life cycle of the building by approximate 32% for new buildings and 86% for old, high-energy-consumption buildings.

1. Introduction

Climate change phenomena are on the rise and their impact on the environment and society is also increasingly growing [1]. This is mainly related to global warming, which has intensified considerably in recent decades. The increase in mean annual temperature is mainly driven by rising greenhouse gas emissions (GHG), particularly carbon dioxide (CO2).
The building sector plays a significant role in global energy consumption and GHG emissions. According to a recent report by the International Energy Agency (IEA), buildings account for 37% of global energy consumption [2], taking the embodied cradle-to-grave emissions into account [3]. Of these, 27% are attributed to the operating activities of buildings, and 10% come from the production of building materials [4].
In order to limit the effects of global warming, future ambitious targets have been set globally to reduce mean annual temperatures and reduce GHG emissions. A key milestone in this respect is the Paris Agreement, signed by 195 countries at the COP21 Conference in 2015, which aims to keep the global temperature rise below 1.5 °C. The main objective of this agreement is to prevent the effects of climate change from getting worse. To achieve it, a 7.6% annual reduction of GHG emissions by 2030 should be done [5]. Moreover, the Paris Agreement specifies climate neutrality by 2050, committing the signatory states to achieving a balance between greenhouse gas emissions and their absorption by natural or technological methods by the middle of the century.
In addition to the Paris Agreement, several complementary measures have been globally adopted to support the achievement of the targets set and to reduce GHG emissions. In the European Union, the European Climate Law, part of the European Green Deal (Green Deal), sets climate neutrality targets for 2050 and GHG emissions reductions of 55% by 2030 compared to 1990 levels, which Romania also adheres to. In addition, the European Union adopted the “Fit for 55”, which includes policies to increase energy efficiency and expand the share of renewable energy, by 2030. Today, renewable energy sources constitute at least 40% of the EU’s total energy consumption. These include solar, wind, biomass, and hydropower.
In Romania, in 2023, a long-term strategy, named “Implementing the national energy and climate plan and developing the long-term strategy of Romania”, was adopted. This is a key strategic document to achieve the national climate neutrality target by 2050. This strategy is part of Romania’s commitments to the European Green Pact (Green Deal) and is perfectly consistent with the goals of the Paris Agreement.
In the United States of America, in 2021, the Infrastructure Investment and Jobs Act [6] was adopted. It includes important measures to reduce greenhouse gas (GHG) emissions. These include incentives to promote electric vehicles, support renewable energies and develop clean energy infrastructure. The act also provides for significant research and development investments for innovative carbon capture technologies and advanced energy solutions. In the same year, another key step occurred: the US returned to the Paris Agreement, reaffirming the country’s commitment to fighting climate change.
China, the world’s largest CO2 emitter, has adopted strict regulations to reduce GHG emissions. Key objectives include:
  • Commitment to becoming carbon neutral by 2060;
  • Commitment to reducing CO2 emissions per unit of GDP by 65% by 2030 compared to 2005 levels.
Other Asian economies, such as Japan and South Korea, have introduced regulations and commitments to achieving carbon neutrality by 2050, setting clear targets for GHG emissions reductions by 2030.
In conclusion, in the European Union, the United States, and Asia, key legislative measures have been implemented to reduce GHG emissions. These regulations play a crucial role in fighting climate change and in achieving international goals. Although the approaches vary according to the specific economic and political context of each region, all these measures reflect global commitments to reduce greenhouse gas emissions and promote a sustainable future.
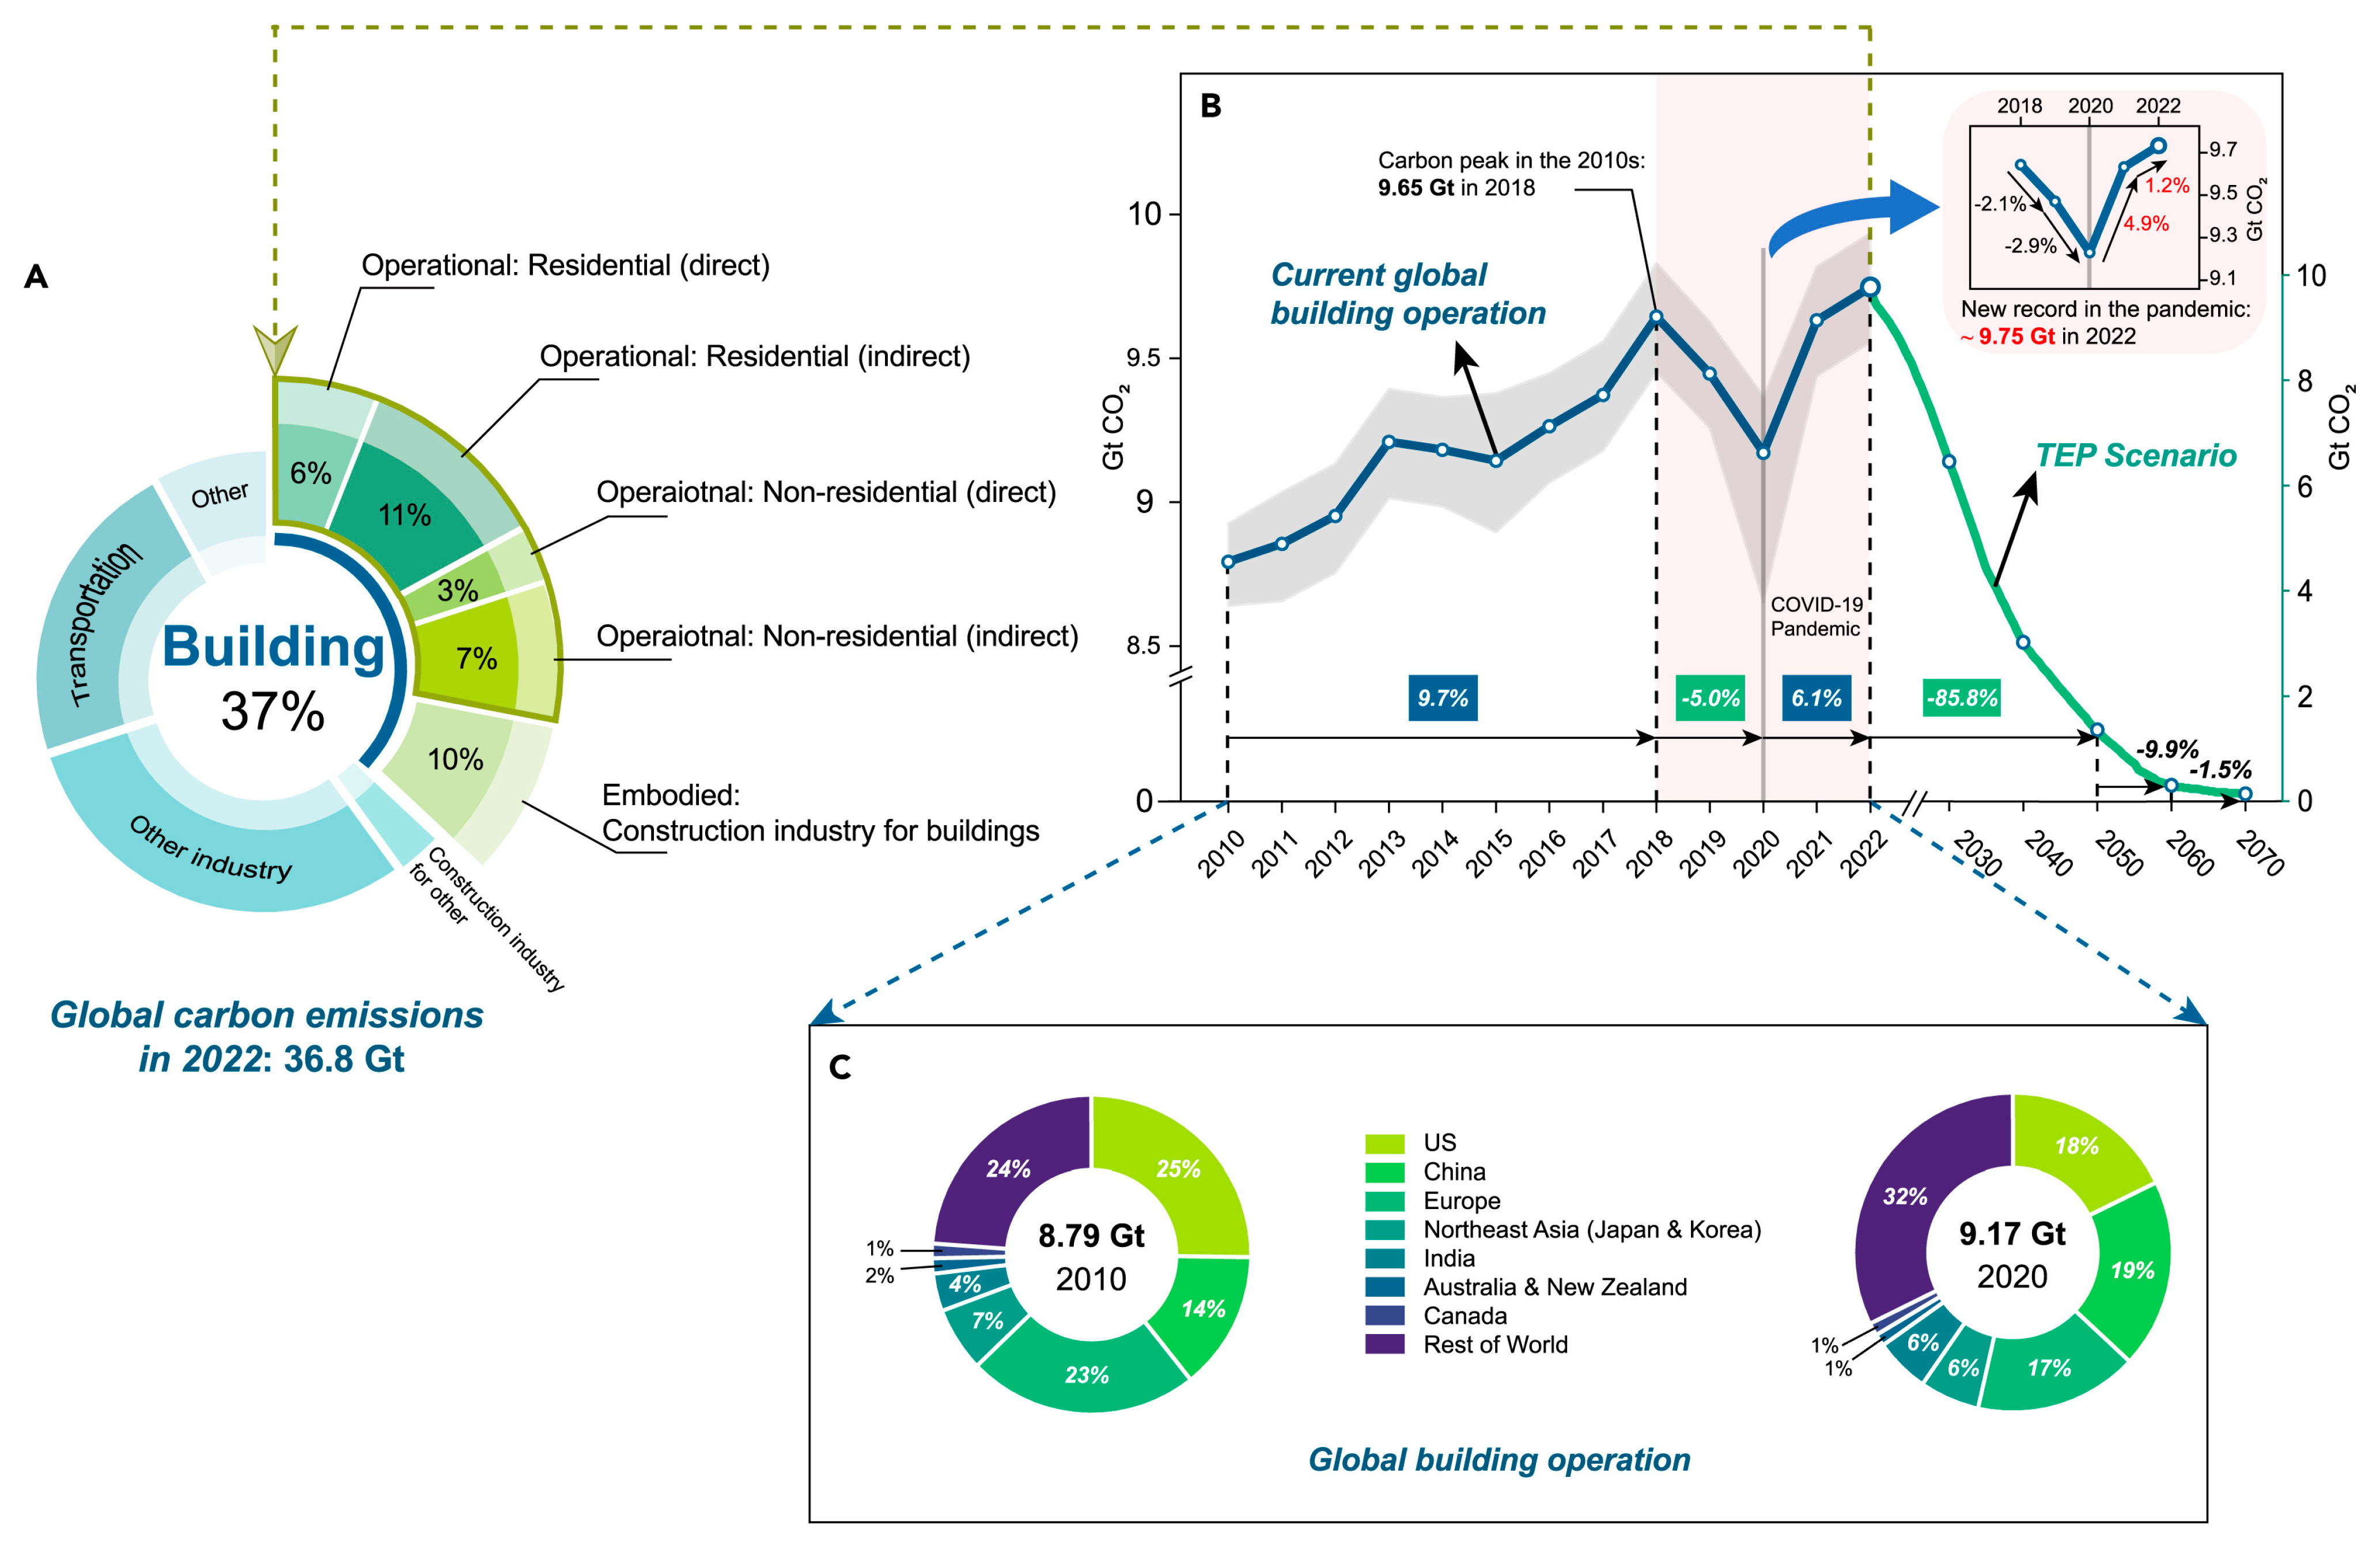
Figure 1 [7] presents global collected data from Global Building Emissions [8], representing the total global energy-related CO2 emissions. According to these data, globally in 2022, the building sector was one of the three major carbon emitting sectors (along with transportation [9] and industry [10]), adding up to around 14 Gt (Figure 1A) of the total energy-associated global CO2 emissions (36 Gt). These carbon emissions from the operation of buildings, called operational carbon, reached a record level of almost 10 Gt (Figure 1B) [7]. Between 2000 and 2022, carbon emissions per usable area gradually decreased, reducing carbon intensity in global building operations by more than 1.5% per year. Although decarbonization efforts in emerging economies are progressing, they have proven to be less effective than those in developed economies (Figure 1C).
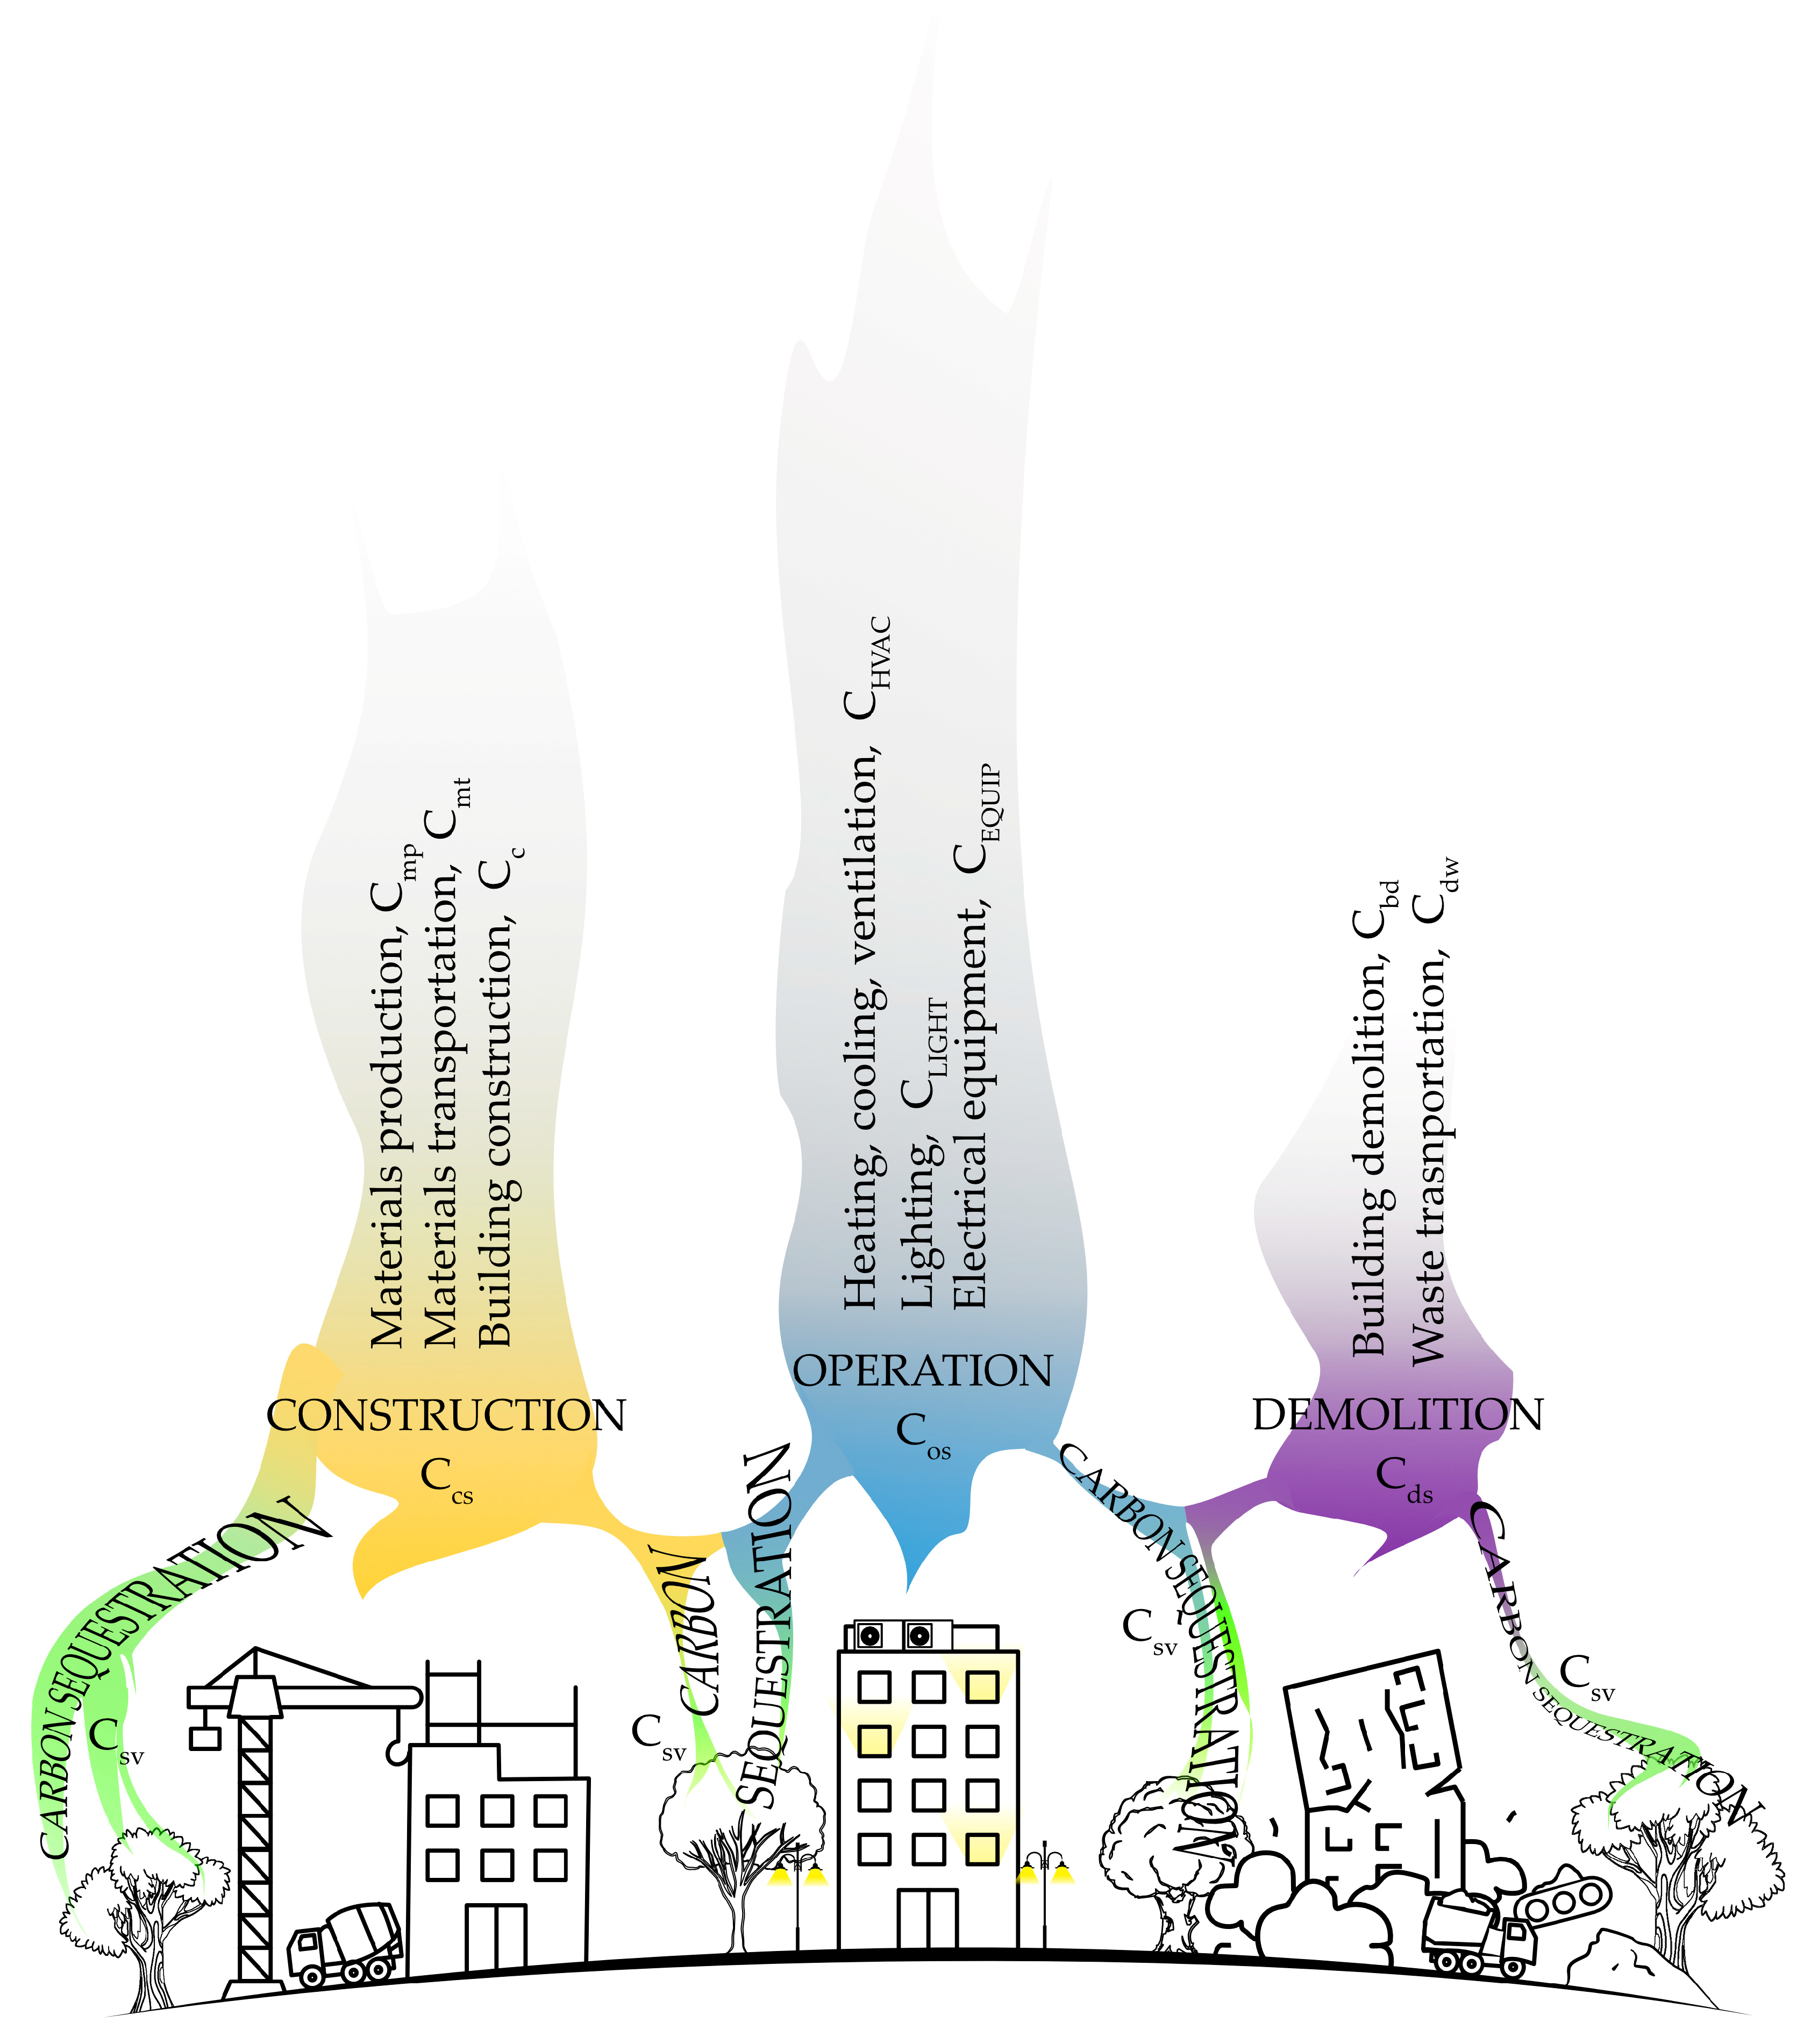
During the lifespan of the building several stages can be identified such as preconstruction, construction, operation, maintenance, and demolition [11]. In all these stages, buildings emit GHG in different quantities [12,13,14]. The operational GHG emissions of a building are considered to be higher than its incorporated emissions [15], so an important role in reducing them is decreasing energy consumption and the use of renewable energy sources such as heat pumps systems [16], solar assisted heat pump systems [17], photovoltaics [18], multi-purpose envelope like a Trombe Wall [19], etc.
The challenge to decrease GHG emissions according to targets set within the Paris Agreement is two-fold:
-
Reducing emissions associated with the energy demands during the operational phase of buildings, for which several different technologies already exist and are increasingly applied [20,21,22,23,24];
-
Lowering so-called embodied GHG emissions, associated with the manufacturing, maintenance and end-of-life of building materials, which are found to be a hidden major issue for effective decarbonisation of the built environment [4,25].
The main challenges that Romania specifically faces in the process of complying with the EU directives are firstly to modernise the electrical energy infrastructure inside the country and thus reducing the electricity cost. This will ensure an increased desire by the people to use efficient energy sources like heat pumps. Secondly, although the Romanian government has policies in place for installing photovoltaic panels and use of renewable sources with heat pumps for close to 10 years now [26], the acquisition and instalment costs are still high for a common Romanian citizen. These combined result in efficient single-family residential buildings being available only for a minority of the population.
This research main objective is to analyse the carbon footprint for a typical single-family residential building in Romania. The study also aims to analyse the life cycle of single-family residential buildings, with an emphasis on the operational stage. The assessment is based on the data registered on a case study building and extrapolated for typical single-family residential buildings in Romania, encompassing new buildings as well as older existing buildings. Overall, this research paper aims to address the following questions:
-
How are the building stages shares distributed for single-family residential buildings in Romania?
-
What impact the energy efficiency measures (such as envelope insulation, heat pumps and photovoltaics) have for single-family residential buildings on the operational stage CO2 emissions?
-
What can be improved for the existing single-family residential buildings in Romania according to the period when they were built?

2. Residential Buildings Sector in Romania

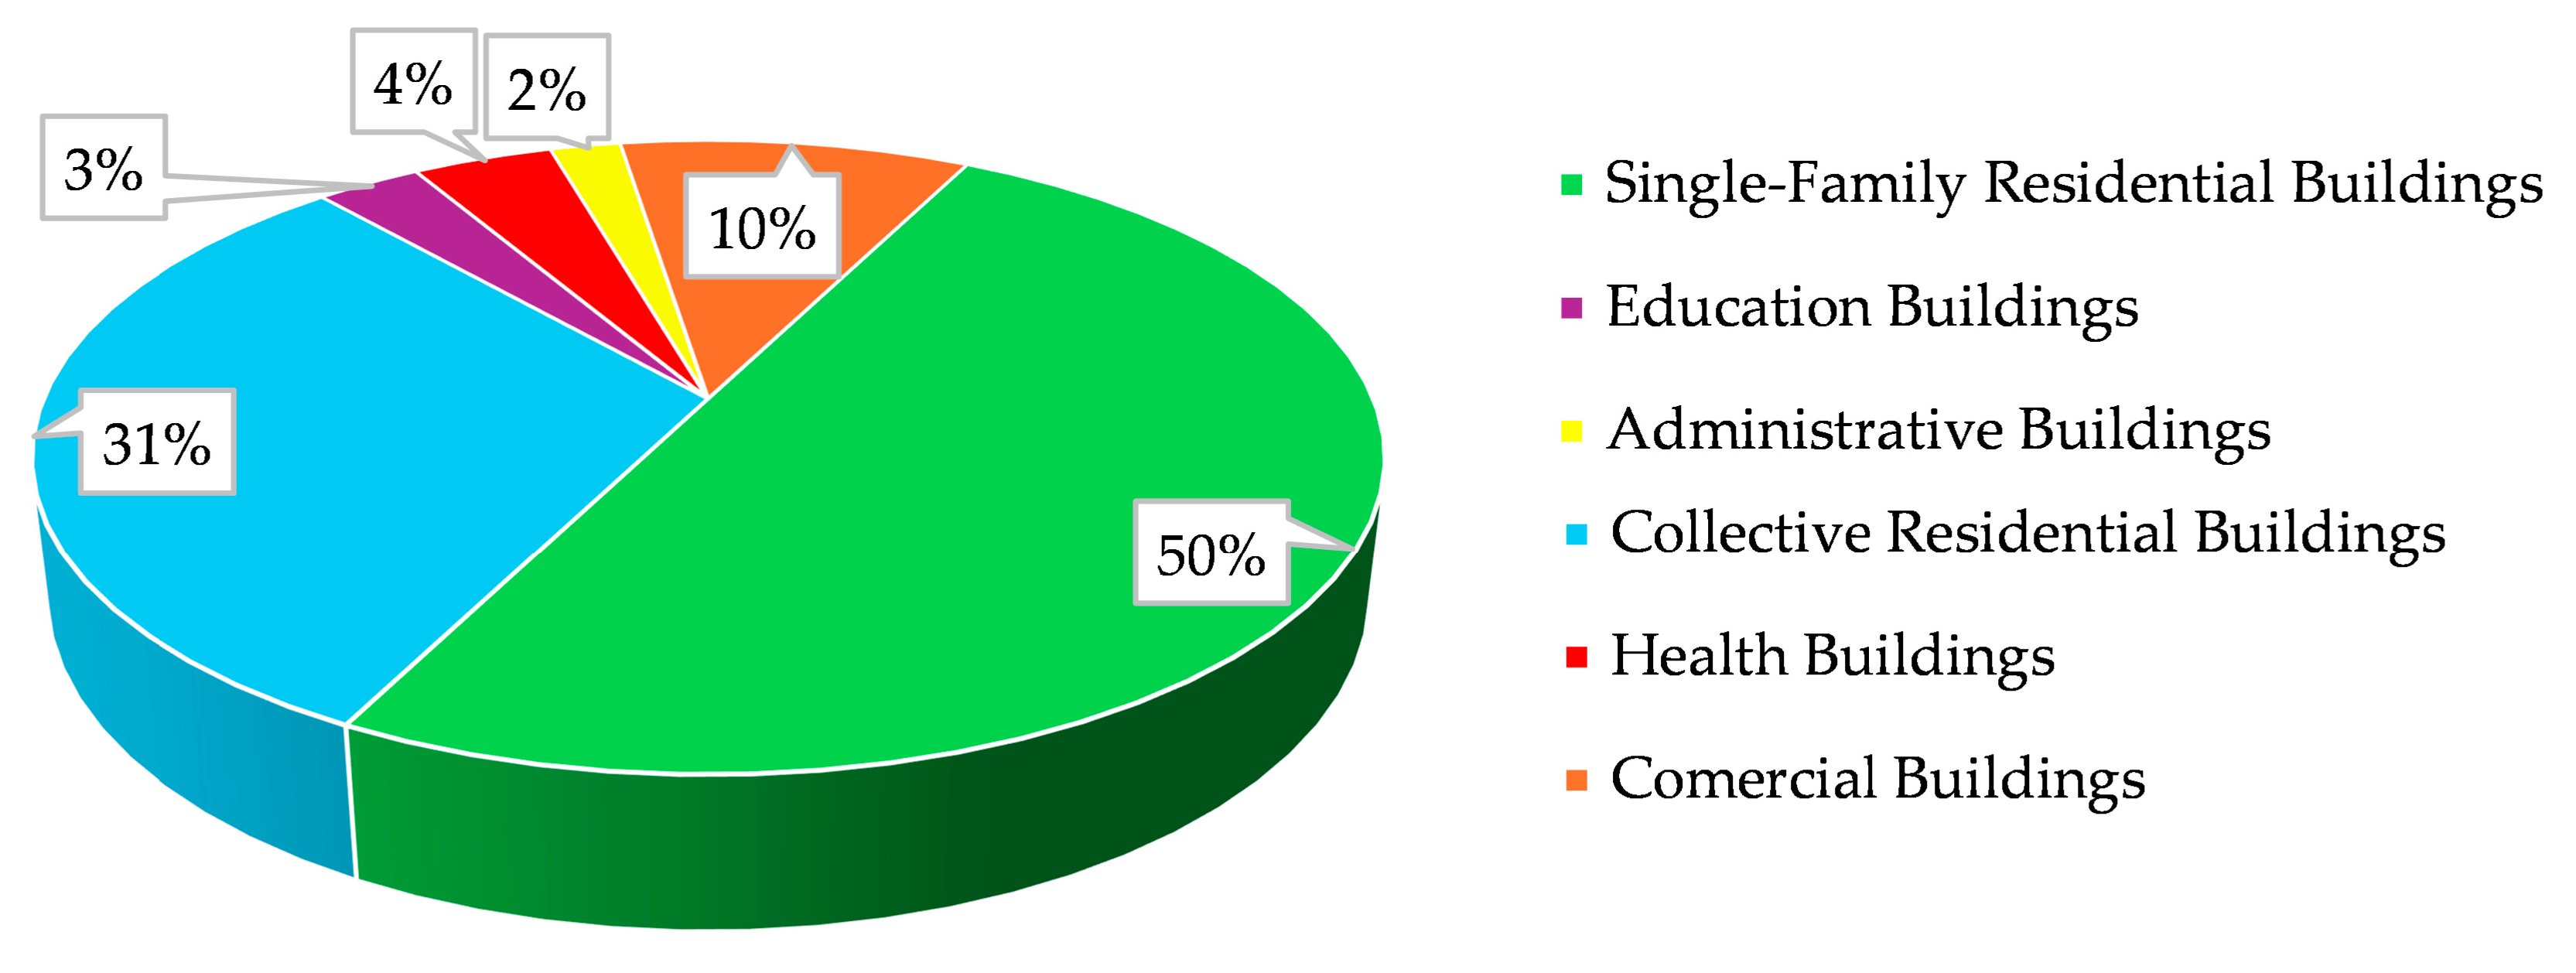
The building sector consists of approximately 5.6 million buildings, covering a total heated useful area [27]. The largest share is represented by residential buildings, which account for approximately 90% of the entire building sector, adding up to 582 million m2, as seen in Figure 2.
Nationwide, the total energy consumption for buildings is approximately 9.52 Mtoe, with over 81% consumed by residential buildings and the remaining 19% by other types of buildings, as seen in Figure 3. Because of this, it can be considered that the building sector is the one with the highest potential to make significant reductions in energy consumption and GHG emissions reduction through thermal rehabilitation and using renewable energy sources.
At the end of 2023, the housing stock in Romania included 9,722,223 homes, with a total liveable area of 474,517,092 m2. Of these, 58% were in urban areas, representing 55% of the country’s habitable area, while the rest were in rural areas.
In recent years, there has been a slow growth in housing stock in Romania. New-build houses annually have a small share, approximately 0.7%, of the total existing ones, and the data are presented in Table 1. The replacement of old buildings is performed at a very slow pace, the percentage of demolished houses annually being only 0.06% of the total existing ones.
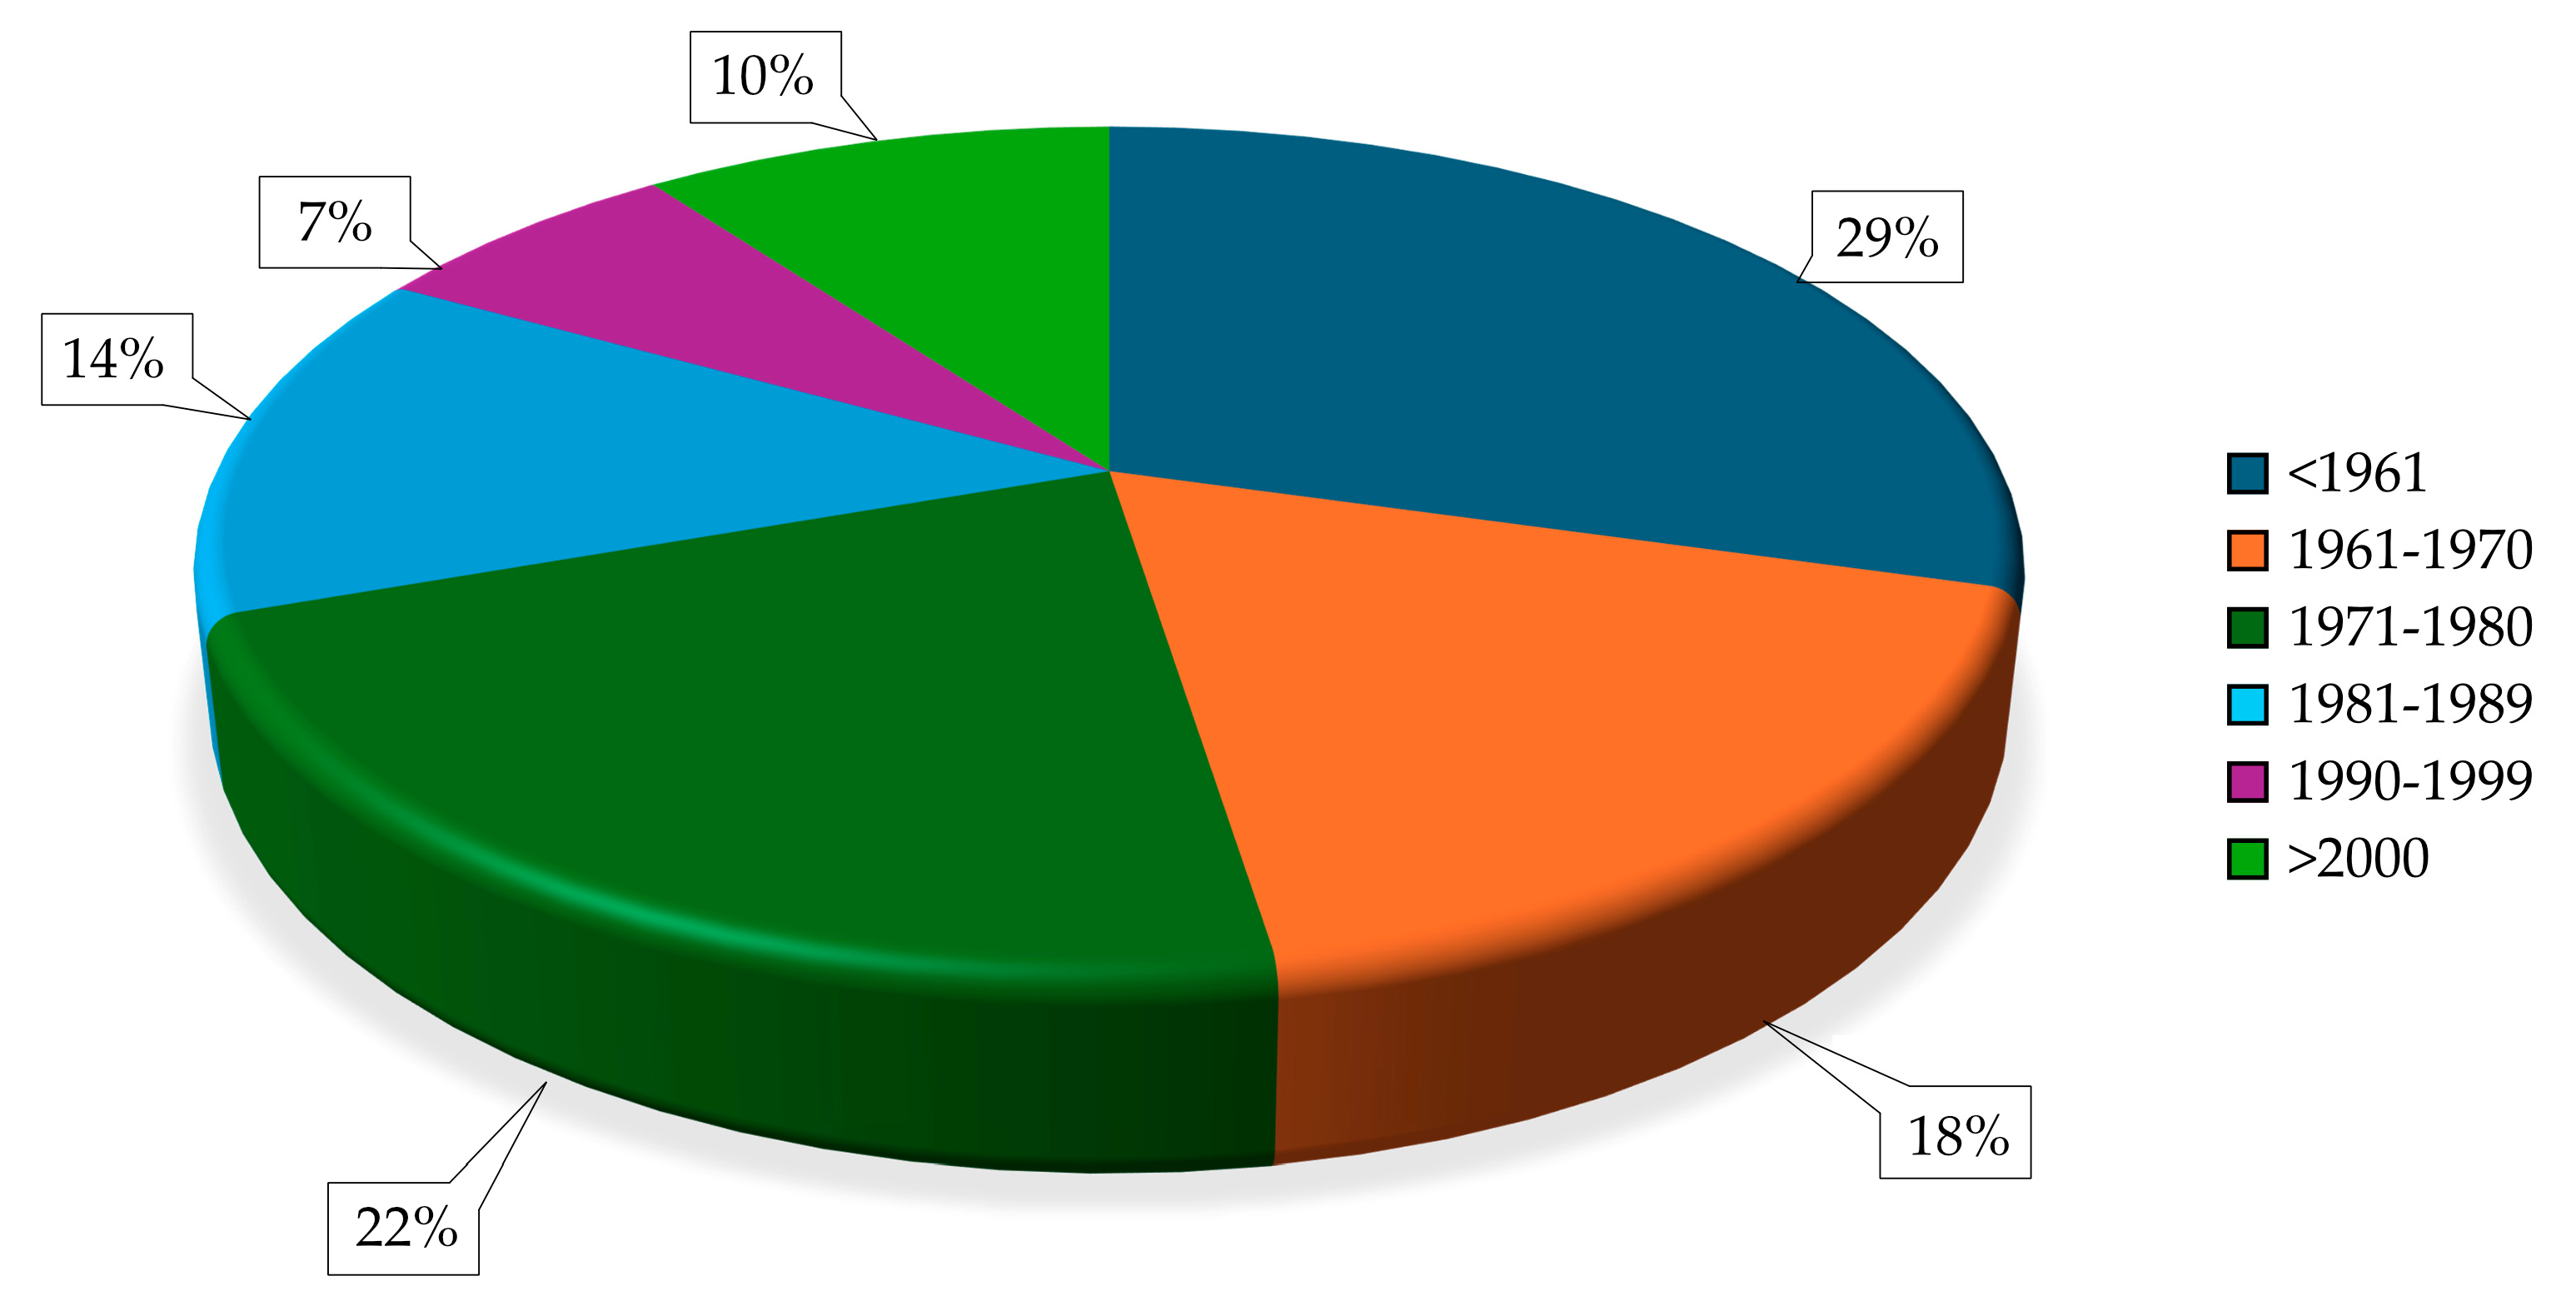
A defining aspect of the housing stock is that about 98% of existing houses are privately owned. This makes it difficult to rehabilitate them on a large scale without adequate awareness of the owners regarding the advantages brought by modernization. Additionally, about 47% of houses were built before 1970, and over 83% of them date back to 1989, as presented in Figure 4.
The residential buildings built before 1989 are distinguished by a low level of energy performance, having an energy consumption between 150 and 400 kWh/m2 year. Thermal energy is the dominant component of total energy consumption in the residential sector, reaching values of up to 55% for collective residential buildings and up to 80% for single-family residential buildings [29].
A real improvement in the energy performance of residential buildings was achieved after 2000, when the energy consumption decreased below 200 kWh/m2 year. Energy-efficient buildings are those constructed after the implementation of the methodology for calculating the energy performance of buildings, indicative Mc 001-2022 [30] and have an energy consumption of less than 80 (kWh/m2 year, presented in Table 2.
This housing stock structure underlines the importance of modernizing and energy efficiency of existing buildings to reduce energy consumption and increase sustainability in the Romanian construction sector. Due to the fact that 58% of the building sector in Romania represents single-family houses and that 50% of the primary energy consumption is used for the operation of residential single-family buildings, this study undergoes a life cycle assessment (LCA) for single-family buildings. For this, a case study building was analysed, and multiple solutions for decreasing CO2 emissions are investigated.

3. Materials and Methods

3.1. Case Study Building

The case study building was constructed in 2019, before the nZEB methodology for calculation of energy performance of a building was approved in Romania (Mc001/2022) [30], but measured to ensure that lower energy requirements were implemented. The structure of concrete and bricks was insulated with 15 cm of mineral rockwool (Figure 5), the ground slab was insulated with 8 cm of extruded polystyrene. The sling roof was covered with tiles and is insulated with 30 cm of mineral rockwool as well. In addition, three-layer glass windows with solar protection and inert gas were used to reduce the heat transfer and maintain a comfortable indoor climate throughout the year. In Table 3, the U-value is presented. The building plinth, foundation walls, terrace and exterior stairs were thermally insulated with 10 cm and 5 cm of extruded polystyrene respectively, for eliminating the thermal bridges with the surrounding ground.
The case study building considered in this paper represents an existing single family residential building with the gross floor area of approximate 160 m2, on two levels, ground floor, and attic. This building is representative for a common building type in the region of Brașov, and it is also equipped with renewable energy sources systems. The building is located in a typical suburban residential area near Brasov, Romania at approximatively 45°37′ N and 25°28′ E. The orientation is S-E 25°. Figure 6 presents the ground floor and attic plans and the aerial 3D view extracted from the design stage of the building.
The heating load is covered with a ground source heat pump, NIBE F1255-6R, which also covers the domestic hot water with a 180 L built-in boiler. The heat pump collects a proportion of the ground’s stored solar energy by means of a horizontal collector that is buried in the ground approximatively 2 m deep. There are 4 circuits of PE Ø40 mm PN10, presented in Figure 7, with a total length of approximatively 360 m, each one arranged in a non-uniform closed single loop. The pipes are connected to a manifold in the basement, under the terrace, and from there to the technical room.
The F1255-6R heat pump is equipped with an inverter-controlled compressor and variable speed circulation pumps and it offers a thermal output of max 6 kW. This model is designed to ensure high efficiency in heating, with a coefficient of performance (COP) between 4.5 and 5.0 at 35 °C for water heating. The NIBE F1255-6R (Figure 8) can also provide passive cooling, depending on system configuration. Using refrigerant R-407C, which is efficient and has a low environmental impact, this heat pump helps to reduce carbon emissions and energy costs. Its advanced features include quiet operation, precise temperature control and the ability to integrate renewable energy solutions. As a backup, it has integrated an electrical heater of 0.5–6.5 kW that automatically starts as necessary.
Underfloor heating is presented in Figure 9. It was selected as an efficient and comfortable heating solution that ensures even heat distribution throughout the building. This system uses hot water heat pipes (Rehau PE-Xa Ø16 mm) mounted under the floor to radiate heat directly into the living space, eliminating cold areas and creating a uniform indoor environment. The underfloor heating system installed in combination with the NIBE F1255 heat pump optimizes performance and energy efficiency as it operates at lower operating temperatures, which contributes to substantial energy savings. Its installation not only improves thermal comfort but also maximizes the useful space of the dwelling, eliminating the need for traditional radiators and contributing to significant energy savings. Distribution is made through two manifolds, one for each floor, and five circuits on each floor. The two bathrooms and two entrances are equipped with radiators on each of the rooms, connected on separate circuits but on the same thermal agent temperature range.
The use of renewable energy sources in the building for various applications such as water heating, heating/cooling and electricity generation is a defining feature for nZEB aspiring buildings. The main objectives of the deployment of renewable energy technologies are to reduce the use of fossil fuels and reduce CO2 emissions. Thus, a photovoltaic system of 6 kWh (Figure 10) composed of 16 panels Canadian Solar of 380 Wp and 1 inventor of 6 kW triphasic was mounted, which reduced the overall electricity intake from the national grid by almost 50%, from the total energy consumption of the building.
A 3D energy model was developed in Revit in the early design phase of the construction for quantities assessment and energy performance calculations, presented in Figure 11. This ensured an exact quantities assessment for the construction phase, reducing the costs and increasing the construction efficiency.
Table 4 presents the construction quantities extracted from the Revit model. These quantities were used in the construction stage and the difference between the Revit obtained quantities and the real quantities used in construction was insignificant. The energy consumption (Table 5) and energy production (Table 6) have been registered since the building was constructed in 2019, but the first year-round data are from 2020. The data were registered with a smart energy meter installed at the connection to the electrical grid, measuring both in and out electricity, together with the data acquisition system of the heat pump. The thermal performance was evaluated numerically at first and afterwards verified with the results from data acquisition systems. The PV panels were installed in 15 August 2022 and the electrical energy production has been registered since then. PV panels are used to supply electrical energy for HVAC, lighting and electrical equipment. However, the heat pump is only used for heating purposes. As presented in Table 5 and Table 6, in the months from May to August, the heat pump is mostly off, only heating domestic hot water. This overlaps with the period in which the PV panels produce the most energy. The surplus is sold back to the national electrical grid.
Figure 12 presents the registered data from Table 5 and Table 6 in yearly amounts. The negative values represent the energy consumption, and the positive values represent the energy production for the case study building. The thermal energy produced by the heat pump varies strictly depending on the mildness of each winter season, as it is only used for heating and not for cooling.
This particular building was chosen to be the case study building, firstly because its size represents the size of a typical Romanian single-family residential building and secondly because it checked the necessary level of equipment to be able to acquire concrete data regarding the operational stage, such as:
-
Newly built in 2019;
-
High degree of envelope insulation;
-
Equipped with a heat pump;
-
Equipped with photovoltaic panels;
-
Access to lifetime data regarding energy consumption and production.
The nZEB standard requirements in the EU are set in place by the Energy Performance of Buildings Directive [3]. Romania is characterised by continental climate, for which the nZEB recommended benchmarks [32] for single-family residential buildings are:
-
20–40 kWh/m2 year primary energy use with on-site renewable excluded;
-
50–70 kWh/m2 year primary energy use with on-site renewable included.
The case study building energy consumption resulted from registered data is approximately 31.25 kWh/m2 year. Moreover, this building is in compliance with the Romanian nZEB minimum requirements, as in the 2019 Law 372/2005, updated in 2020 [33]. This law introduced for the first time the need to have at least 30% of the total primary energy consumption used from renewable energy sources. In 2024, Law 238 [34] updated the article, clarifying that from the total of 30% primary energy from renewable energy sources, only 10% must be realised at the building location, while the rest of 20% can be produced by the electrical energy distributor which must provide a certificate for it. Nevertheless, the Romanian Government needs to implement more policies for low-carbon technologies subsidies [26]. The case study building has complied from the beginning the necessary 30%, as follows:
-
2020—48% of the primary energy consumption from renewables;
-
2021—52% of the primary energy consumption from renewables;
-
2022—86% of the primary energy consumption from renewables;
-
2023—147% of the primary energy consumption from renewables;
-
2024—190% of the primary energy consumption from renewables.
After the installation of PV panels, the building produced more energy that it consumed, but not in the period when it needed it for consumption. During winter, the PV panels only produced between 10–20% of their total capacity and during the summer most of the electricity produced was sold into the electricity grid, as the heat pump is not used for cooling.

3.2. Life Cycle CO2 Emissions Mathematical Model

The mathematical model used for the calculation of the CO2 emissions has been described in the “2006 IPCC national greenhouse gas inventory categories” in [35], used in earlier research as well [36]. The life cycle CO2 emissions are separated into three categories, representing the building construction stage, the building operational stage, and the building demolition stage. Each category can be divided into multiple operations that contribute to the total CO2 emissions in the atmosphere, as presented in Figure 13.
Therefore, the equation used for the calculation of the CO2 emissions during the building life cycle is:
C =   C cs + C os + C ds C sv
where C represents the total emissions during the building life cycle; Ccs represents the total emissions during the building construction stage; Cos represents the total emissions during the building’s operation stage; Cds represents the total emissions during the building demolition stage; and Csv represents the total carbon sequestration from the vegetation surrounding the building inside its own property.
During the entire construction stage, building materials are produced from raw materials, transported, and used during the actual building construction. The equation used to calculate the construction stage CO2 emissions is:
C cs = C mp + C mt + C c
where Cmp represents the total emissions from the building materials production; Cmt represents the total emissions from the building materials transportation; and Cc represents the total emissions from the building construction.
The CO2 emissions from building material production, Cmp, are calculated for each of the materials used for the building construction with the following equation:
C mp = Q mp , i × CEF mp , i
where Qmp,i represents the quantity of each “i-th” material used for the construction, in [t] and CEFmp,i, represents the carbon emissions factor for each “i-th” material in [tCO2/t]. The carbon emissions factors in Table 7, are collected from the existing literature [37].
The CO2 emissions from the building materials transport, Cmt, is calculated for each of the materials used for the building construction that are being transported by any means of transport. In Romania the main transportation type represents diesel or gasoline trucks with the following equation:
C mt = Q mt , i × CEF mt , i × d i
where Qmt,i represents the quantity of each “i-th” material transported in t, and CEFmt,i, represents the carbon emissions factor for each “i-th” material, which has the value of 1.68 × 10⁴ tCO2/km for land transportation [38] and di, the transportation distance in km.
The CO2 emissions from the actual construction itself, Cc, is calculated, summing the emissions from all the processes occurring during construction with the equation:
C c = C cee + C cle + C cit
where Ccee represents the total CO2 emissions generated from the electrical energy usage; Ccle represents the emissions generated from excavation and landscape on building site and Ccit represents the transportation from the building site, horizontal or vertical, from the equipment needed for the construction itself. The following equations are used:
C cee =   A gf   ×   E c   ×   CEF ee
C cle = V le   ×   CEF le
C cit = Q cit   ×   CEF cit   ×   d
where the detailed information for the parameters in Equations (6)–(8) are presented in Table 8.
Table 7. Emission factor for building materials from the existing literature [37,39].
No.MaterialEmission FactorUnit
1Concrete0.242tCO2/t
2Brick0.200tCO2/t
3Cement0.894tCO2/t
4Limestone1.200tCO2/t
5Mortar0.792tCO2/t
6Gravel0.002tCO2/t
7Stone2.330tCO2/t
8Steel2.208tCO2/t
9Ceramic tiles1.400tCO2/t
10Paint0.890tCO2/t
11Glass1.400tCO2/t
12Wood0.200tCO2/t
13Organic materials17.070tCO2/t
14Aluminium1.407tCO2/t
15Copper1.010tCO2/t
16Photovoltaic panels80.113 [39]kg CO2/kW
The operation stage of the building represents the longest period in which CO2 is emitted into the atmosphere, which is considered to be 50 years according to the existing literature [36]. The equation used to calculate the operation stage’s CO2 emissions is:
C os = C HVAC + C LIGHT + C EQUIP × n = EE HVAC + EE LIGHT + EE EQUIP   ×   CEF ee   ×   n
where CHVAC and EEHVAC represent the total emissions and the total electrical energy consumption for heating, cooling, ventilation and air conditioning; CLIGHT and EELIGHT represent the total emissions and the total electrical energy consumption for artificial lighting; CEQUIP and EEEQUIP represent the total emissions and the total electrical energy consumption for everything other than lighting that uses electricity; and n represents the building’s lifespan’s duration.
The demolition stage of the building represents the amount of CO2 emissions during the building’s life cycle’s end. The equation used to calculate the demolition stage’s CO2 emissions is:
C ds = C bd + C dw
where Cbd represents the total emissions from the building demolition process, generated from the machinery used to take down the building in [t] and Cdw represents the total emissions from the demolition waste transportation in [t].
The emissions from the demolition process itself are calculated with the equation:
C bd =   A gf × CEF de × CEF ee
where CEFde represents the emission factor for the required energy for demolition machinery in (kWh/m2); Agf and CEFee represents the gross floor area and electrical energy emission factor that were previously described.
The emissions from the demolition waste transportation are calculated with the equation:
C dw = Q mt , i × CEF dt × d i
where Qmt,i represents the quantity of the transported materials that were used being the same as the quantity of the construction materials in t; CEFdt represents the emissions from the demolition waste transportation in t/t×km and di the transportation distance.
The landscape around the building has an important role in the CO2 emissions for the building’s life cycle due to the carbon sequestration from the surrounding vegetation, Csv. The equation used for its calculation is:
C sv = CR b × AI b × A p × n × 44 12
where CRb represents the carbon ration of ground biomass, with a value of 0.47 tcarbon/tdry biomass; AIb represents the annual increase in ground biomass, with a value of 8 (tdry biomass/acres × years); Ap represents the total green area of the building property; n represents the lifespan period of the building.

4. Results

4.1. Life Cycle Analysis for the Case Study Single Family Residential Building

Carbon footprint represents the mark that the GHG emissions leave on Earth’s atmosphere. To assess the impact, a life cycle analysis (LCA) is performed, obtaining an overall perspective for the three main stages a building can be in: construction, operation, and demolition [40]. The LCA of this study is based on the mathematical model presented in Section 3.2, used for the case study building presented in Section 3.1. Table 9 presents the results obtaining from the mathematical model according to which the materials production sub-stage has the highest calculated value of CO2 emissions. This is mainly because the building situates in the A+ Romanian energy class (that requires under 67 W/m2 × year energy consumption).
Figure 14 presents the results with better visualization. The CO2 emissions for HVAC represent approximately a quarter of the total amount, just below the construction materials production percentage. Of the 7.26% that encompasses all the other sub-stages, the highest generation of CO2 emissions over the full life cycle is represented by the building’s electrical equipment usage.
Although the results show that most of the improvements should be made in the material production sub-stage, this case study building is not a perfect representation of the single-family residential buildings that are being built today in Romania. Most of them, even if they do have as good of a thermal insulation degree as the case study building, are not using heat pumps or photovoltaic panels to help mitigate the negative impact the building will have on Earth’s atmosphere over its entire lifespan. Due to the high investment cost for such systems, the average Romanian family will choose a gas boiler over a heat pump and no photovoltaics. However, photovoltaic panels have been changing in recent years due to government policies that subsidize approximately EUR 4000 for each individual system that is installed. Even so, many more government policies should be set into motion for reaching the goals set by the Romanian Energy Strategy [26].
The electrical energy conversion factor for the GHG emissions in Romania is 0.278 kg CO2/kWh [41], according to the latest data published by the Romanian Government. This value represents the average of the individual values based on the fuel used for electrical energy production. In 2024, electrical energy production is almost evenly split between hydro (28%), natural gas (20%), nuclear (21%), coal (14%), wind (12%), solar (4%), and biomass (1%) according to the Romanian electrical energy transport entity “C.N.T.E.E. Transelectrica S.A.” data [42].

4.1.1. Construction Stage

This stage is the highest CO2 emissions generator for the case study building. Almost all the emissions are solely generated by the materials production sub-stage as materials transport and building construction generated less than 2% each from the total of 177.55 [tCO2], as presented in Figure 15.
The CO2 emissions factors used for material production are presented in Table 7 and are from the existing literature. The average distance used for materials transportation resulted close to 50 km therefore this value was chosen as the distance of materials transportation to the construction site. For the building construction sub-stage, a total of 10,069 kWh/m2 of buildings GFA was consumed and registered with the construction site energy meter. Additionally, a total of 742 cubic meters of soil was excavated and landscaped by the end of the building construction. A total of 167.08 tons of material have been maneuvered on the building site, with an estimated accumulated distance of 5 km.

4.1.2. Operation Stage

The second-highest CO2 emissions generator was the operational stage. The total emissions from the operational stage were 76.19 tCO2, with HVAC representing 86% of the total, as presented in Figure 16. The period for the operational stage was considered to be 50 years. From the registered energies, the yearly average value for HVAC is 5 MWh/year, that for lighting is 0.25 MWh/year, and that for electrical equipment is 0.5 MWh/year.
The energy consumption for HVAC for the case study building with a total GFA of 160 m2 is 31.25 kWh/m2 year, which places the building between A+ and passive house energy consumption, the latter requiring less than 15 kWh/m2 year.

4.1.3. Demolition Stage

The demolition stage is the lowest CO2 emissions generator by far. Out of the total emissions for the entire lifespan of the building, it represents only 1.38%, with actual building demolition generating more than double than the waste transportation as presented in Figure 17. The total quantity of transported materials was considered the total quantity of the construction materials. Moreover, the distance between the demolition site to the waste disposal area was considered 15 km, representing the distance from where the construction is now for the case study building.
The demolition stage CO2 emissions results can suffer major values fluctuation based on either the transportation distance or the diesel fuel consumption for the demolition machines. Doubling or tripling the distance for transportation only increases the value by 30% and 60%, respectively. However, the demolition share of the total CO2 emissions is less than 2% for the CSB, and the overall increase is insignificant.
Moreover, the demolition stage calculations that are performed in multiple concluding studies are made as the building is demolished today. In reality, the exact CO2 emissions factors involved, the diesel fuel consumption, and the necessary transportation distance for building demolition in 50 or 100 years are unknown and involve a high degree of uncertainty.
The carbon sequestration from the vegetation was also calculated for the case study building for the 50-year lifespan considered. The approximate vegetation area belonging to the case study building on its property is 750 m2. Benefitting from this generous outdoor area, the resulting CO2 sequestrated by the vegetation is 127.52 tCO2. Considering that the total CO2 emissions representing the carbon footprint of the case study building is 257.29 tCO2, the carbon sequestration can absorb 49.5% of it. This result marks the importance of a green outdoor area for the single-family residential building and how a well-planned neighbourhood can improve the carbon footprint of the buildings. Figure 18 illustrates how the carbon sequestration will reduce the total carbon footprint of the case study building to 129.76 tCO2, representing only 50.5% of the total.
Carbon sequestration from vegetation a relative new approach for calculating carbon footprint, especially in urban areas. Although CO2 emissions from the irrigation for urban areas create a conflict with carbon sequestration from vegetation [43], green areas and green roofs started to emerge worldwide in important urban areas. Nevertheless, studies where carbon sequestration is taken into consideration for the carbon footprint are already researched, such as in [36], as a relatively new research idea for mitigating the CO2 emissions during the entire building lifespan. Green roof carbon sequestration seems promising, as studies show that they have implications for reducing buildings’ energy demand as well, as the envelope needs to be optimized [44]. In rural and suburban areas, carbon sequestration from vegetation can be much more useful, as there is plenty of available green area when considering the building’s carbon footprint.

4.2. The Evolution of Carbon Footprint over Time for Single-Family Residential Buildings in Romania

Historically, in Romania, building with energy efficiency in mind is quite a recent phenomenon. Even since its EU adherence in 2007, Romania pledged to fulfil the Energy Performance Building Directive (EPBD) [26], and the general mindset of the people was unhinged for many years. Since 1990, residential buildings in Romania have started to improve, firstly by increasing the thermal insulation degree of the building envelope and afterwards by using renewable sources technologies such as heat pumps and photovoltaic panels. Moreover, the CO2 emissions factor for electricity production has improved over time. Today its value is less than half of the 2007 value of 0.566 kgCO2/kWh [45]. The emissions factors from electrical energy generation in Romania and other representative countries in the world are presented in Table 10 for the past 5 years.
Energy consumption for heating for single-family residential buildings has decreased considerably according to data from the Ministry of Development in Romania that were presented in Table 2 in Section 2. Without the use of a heat pump, the residential buildings in Romania are either heated by either gas or firewood boilers. Therefore, the carbon footprint can be calculated for the operational stage for an earlier period of time, varying the energy consumption for heating and using the CO2 emissions factors for natural gas, 0.205 kg CO2/kWh, and for firewood, 0.39 kg CO2/kWh [41].
This study’s aim is to also analyse the CO2 emissions from the operational stage of the building and its evolution over time in Romania for single-family residential buildings. Therefore, the base of the analyse represents the case study building. Figure 19 presents the results for the HVAC operational sub-stage over the years in Romania, with the average heating consumption for a typical single-family residential building (Table 2). The impact of the implementation of European Union measures is visible, as in less than 20 years, the carbon footprint dropped 4 to 5 times for HVAC operational sub-stage, mainly from increasing the thermal insulation degree.
The highest decrease has been for single-family residential buildings that are heated with natural gas. Since 1989 to 2023 the CO2 emissions dropped from 574 tCO2 to 114 tCO2, meaning 5 times less. For the firewood, the decrease was only 4.4 times less, but the overall amount was higher, with the emissions decreasing from 963 tCO2 to 218 tCO2.
With the resulted data for the case study building, the life cycle CO2 emissions can be analysed by using the operational stage emissions form the past years averages presented in Figure 19. The resulted data are presented in Figure 20. For the case study building, the CO2 emissions share for the operational stage is only 29.61%. For passive house energy consumption for HVAC requirements, this share decreases to 18.73%.
However, when compared to the shares for firewood and natural gas for a typical building in 1989, it is clear that energy consumption for the operational stage has improved. Up until 2000, the operational stage share for firewood was above 80%, and that for natural gas above 70%. For the entire period of 2000–2023, the decrease was negligible, with only 3–6% decrease. The highest decrease is recorded for buildings built since 2023, where the operational stage share is less than the construction stage shares for natural gas and close to it for firewood. With the decrease in the operational stage’s share of CO2 emissions for single family residential buildings, the emphasis on the construction stage shares of CO2 emissions becomes more important. For a further decrease in the carbon footprint, the materials production must be improved.

4.3. Carbon Footprint Potential Reduction Analysis for Operational Stage

4.3.1. Building Insulation Degree

Considering the results presented in Figure 19 and Figure 20, there is potential to decrease the CO2 emissions and as an end goal the carbon footprint for existing single family residential buildings in Romania. The most practical method for this is to decrease the CO2 emissions for the operational stage of the building life cycle. Romanian Energy Classes for Buildings classifies buildings from G to A+ in accordance with the energy used for HVAC [30]. With the data available from the Romanian Calculation Methodology for the energy performance of buildings, the potential for reducing the energy consumption is presented in Table 11. The results indicate that for older existing buildings that reside in Class C or higher, the building is required to be insulated with a minimum of 15 cm of insulation for its energy consumption to decrease to A+ class value. Class B buildings are already insulated with 5 cm of thermal insulation, and those need an additional 10 cm to reach Class A+ values as well.
Figure 21 illustrates how increasing the thermal insulation degree of the building envelope will result in energy consumption reduction for HVAC to reach Class A+. This in turn will lower the CO2 emissions for the life cycle of the building to values close to the case study building values. For buildings before 2000, an energy reduction for HVAC of approximately 70% is required to reach Class A+, and this reduces to a quarter share of the total CO2 emissions for the operational stage (according to the case study results). For buildings after 2000 but before 2023, an energy reduction for HVAC of approximate 60% is required.
Buildings that are built in earlier times before 1960 (Table 2) fit into lower energy Classes, from C to G, and all of them not only require thermal insulation but an overall renovation, as most of them have hydro insulation issues, time wear issues, or structural issues from previous earthquakes or other calamities. As far as reducing the energy consumption for the operational stage for those buildings, thermally insulating with at least 15 cm of insulation will decrease their consumption according to Figure 21.

4.3.2. Heat Pumps

The use of renewable energy sources is an important factor in reducing the CO2 emissions for the entire life cycle of the building. Figure 22 presents the results using the energy consumption from Energetic Classes B, A, and A+; the case study building; and a fictitious passive house.
Consequently, for each one of the Classes, the CO2 emissions in the entire operational stage of 50 years have been calculated for three different energy sources: firewood, natural gas and a heat pump. The CO2 emissions for a Class B building even using a heat pump are almost 200 tCO2 for the operational stage, highlighting the thermal insulation importance. Moreover, due to the close values of the emissions factor for heat pump and natural gas in Romania, the difference between the natural gas and heat pump narrows down as the building tends towards passive house thermal insulation level.
The CO2 emissions reduction from using a heat pump in the detriment of a firewood boiler is approximately 65% and in the detriment of a natural gas boiler is 26%. Of course, this will vary depending on the real coefficient of performance of the heat pump, which is lower if the renewable energy source is air than if it is the ground source, as in this case-study-analysed building.

4.3.3. Photovoltaic Panels

Heating and cooling with a heat pump provides another possibility for the CO2 emissions reduction from using electrical energy produced by photovoltaic panels instead of grid electricity. For the case study building, the total electrical energy produced in 2023 was 7.37 MWh and for 2024 was 7.83 MWh. This electrical energy can be used for the heat pump, for the lighting and for the electrical equipment. As the case study building only uses the heat pump for heating, the electrical energy that the photovoltaic (PV) panels produce in the months of May to August has no use in the HVAC operational sub-stage. Considering that when the heat pump is turned on, the PV panels only supply the heat pump, the period for which the PV panels supply the lighting and electrical equipment is limited. This covers approximately a third of their yearly consumption (for when the heat pump is off). Figure 23 presents the results for the case study building operational stage when also considering the photovoltaic panels’ electricity production. As the HVAC consumption in operation is the highest for the life cycle of the building, the highest reduction in CO2 emissions is also for that sub-stage, with a reduction of approximately 80%. The entire operational stage CO2 emissions for the case study building resulted to 76.18 tCO2 as presented in Section 4.1. The operational stage CO2 emissions when using electrical energy from the photovoltaic panels for the entire lifespan of the building decreases to 19.90 tCO2, a reduction of 73.87%.
The CO2 emissions from the PV panels manufacture have been calculated in the construction stage. For the total installed power of 7 kW, the manufacture produces 0.563 tCO2. Considering their life expectancy of 20–25 years [39], for the 50-year lifespan of the building, they will need to be replaced 3 times. This will sum the CO2 emissions to 1.689 tCO2. Moreover, for the recycling of the solar panels, 230 kgCO2 are emitted for each 1 m2 of solar panel [47]. In this case, for one recycling, a total of 6.256 tCO2 is emitted, and for all 3 systems, a total of 18.76 is emitted. In the end, this equals to 20.457 tCO2 for the solar panels’ manufacturing and recycling for the entire lifespan of the building. Subtracting this from the total reduction of the operational stage, the reduction of CO2 emissions will decrease from 76.18 to 40.35 tCO2, by approximately 47%.

4.4. Economic Analysis

A life cycle assessment regarding CO2 emissions and discussing potential reduction methods also needs to take into consideration the economic impact. Therefore, for the main three stages of the building lifespan, the cost can be calculated for the case study building. The total construction cost, including the land acquisition for the case study building added up to EUR 137,630, the individual components cost being detailed in Table 12. The highest cost share is represented by the building structure and architecture, 61%, followed by the building services share of 24%, while the remaining percent represents the land, utility, and design for the construction to be possible.
Today in Romania, the electrical energy cost has different values based on the amount of electrical energy that the customer absorbs [26]:
  • 0.68 RON/kWh for maximum 100 kWh/month;
  • 0.80 RON/kWh for maximum 255 kWh/month;
  • 1.30 RON/kWh for more than 255 kWh/month.
For the case study building, the cost for the electrical energy is 0.8 RON/kWh (Romanian leu currency), which is approximately 0.16 EUR/kWh. Although the heat pump consumption was more than 255 kWh/month for the case study building, the amount absorbed from the national grid was less due to electrical energy produced by the PV panels. The natural gas energy cost is 0.31 RON/kWh, which is approximately 0.06 EUR/kWh, meaning 2.6 times less than the median electrical energy cost. Compared to 1.3 RON/kWh, which is approximately 0.26 EUR/kWh, the natural gas cost is 4.19 times less. This is a common practical barrier in Romania regarding the use of heat pumps because if the COP of the heat pump is less than 4.19 (if there are no PV panels) or less than 2.6 times (if there are PV panels installed), it will be cheaper to heat with natural gas instead.
Nevertheless, electricity cost is quite volatile even today. The Romanian Government set a cap on the prices in 2022 because of high variation in prices due to the ongoing Romanian border war. This cap on the energy prices is estimated to be removed this year, 2025, and the prices are expected to rise again. In the long run, if the electricity market stabilises and the infrastructure modernises, as is planned in the Romanian Energy Strategy [48], there is a high possibility that heat pumps will be much more attractive with lower electricity prices. Moreover, electrical energy produced by PV panels can be stored in solar batteries. This can presumably improve the use of electricity on demand. Today, in Romania, people tend to use PV panels systems without solar batteries due to the fact that their acquisition cost is high and their lifetime is between 5–10 years, meaning another acquisition is required afterwards.
Considering the above, an analysis was performed, using the minimum energy requirement from Energetic Classes B, A, and A+ together with the case study building and a passive house, with the results being illustrated in Figure 24. The compared cases also included heating with a gas boiler versus a heat pump for the Energetic Classes B, A, and A+. For this, the construction cost differed by up to 13% for Class B, with natural gas having the highest construction cost from removing the heat pump system and insulation. The highest construction cost was for the passive house, requiring the highest thermal insulation degree. Furthermore, the demolition cost of the building was calculated with an average cost in Romania today of 150 EUR/m2 of GFA. Finally, the operational stage cost was calculated for a 50-year lifespan, using the costs for electrical energy and natural gas that are available today in Romania, not taking into consideration the changes that will occur in 50 years period.
The highest operational stage share of cost is represented by Class B heated with a heat pump due to its low thermal insulation degree and high electricity cost. As the building energetic class increases, the operational stage shares start to decrease. Although a better thermal insulation degree will translate to less energy needed for a heat pump to function, for Class A+, it is still better to use a gas boiler instead. The heat pump is more efficient than natural gas for a 50-year operational stage when the building insulation degree closes up to a passive house standard. For these calculations, the average COP of 4 was used, representing the case study building average COP.

5. Discussion

This study results provide promising insight regarding improvements for reducing the carbon footprint for the single-family residential buildings in Romania. The total carbon footprint resulted in 129.76 tCO2 when taking carbon sequestration from vegetation into consideration. Omitting the carbon sequestration, the total carbon footprint result is 257.29 tCO2. The carbon footprint for these two distinct situations, relative to square meter and year, are 16.22 kgCO2/m2 year when considering carbon sequestration and 32.16 kgCO2/m2 year when omitting the carbon sequestration from vegetation.
Over time, carbon footprint has been the focus of multiple studies for both residential and non-residential buildings. Comparing the results of this study to results from conclusive studies provides a better understanding of the carbon footprint for single-family residential buildings all over the world. The comparison is presented in Table 13.
According to the single-family residential building’s studies presented in Table 13, the average carbon footprint is 32.49 kgCO2/m2 year. This can arguably be considered a close value to a worldwide average. For the CSB, if carbon sequestration is not considered, then the result is close to the world average. If the carbon sequestration is indeed considered, then the value halves.
For the calculations made in this study, because of the 50-year lifespan of the building and the uncertainty in this period the following assumptions were made:
-
The CO2 emissions factors were used with the current values as of today;
-
The energy prices used are the current prices as of today;
-
The photovoltaic panels degradation was taken into account, considering them being changed 4 times in this lifespan;
-
The green area for which carbon sequestration was calculated for remained the same for the entire 50 years.

6. Conclusions

This study aims to establish a direct link between operational stage of a building life cycle and the CO2 emissions that the building will emit for the entire lifespan, for the single-family residential buildings in Romania. Consequently, the construction and demolition stages were considered while analysing a case study building built in 2019, in Romania. The case study building is energy efficient, residing between a Romanian Energetic Class A+ and a passive house standard.
Furthermore, the case study building was used to create plausible other cases for single-family residential buildings in Romania, focusing on a wide array:
  • From older than 1989 buildings to new after 2023 buildings;
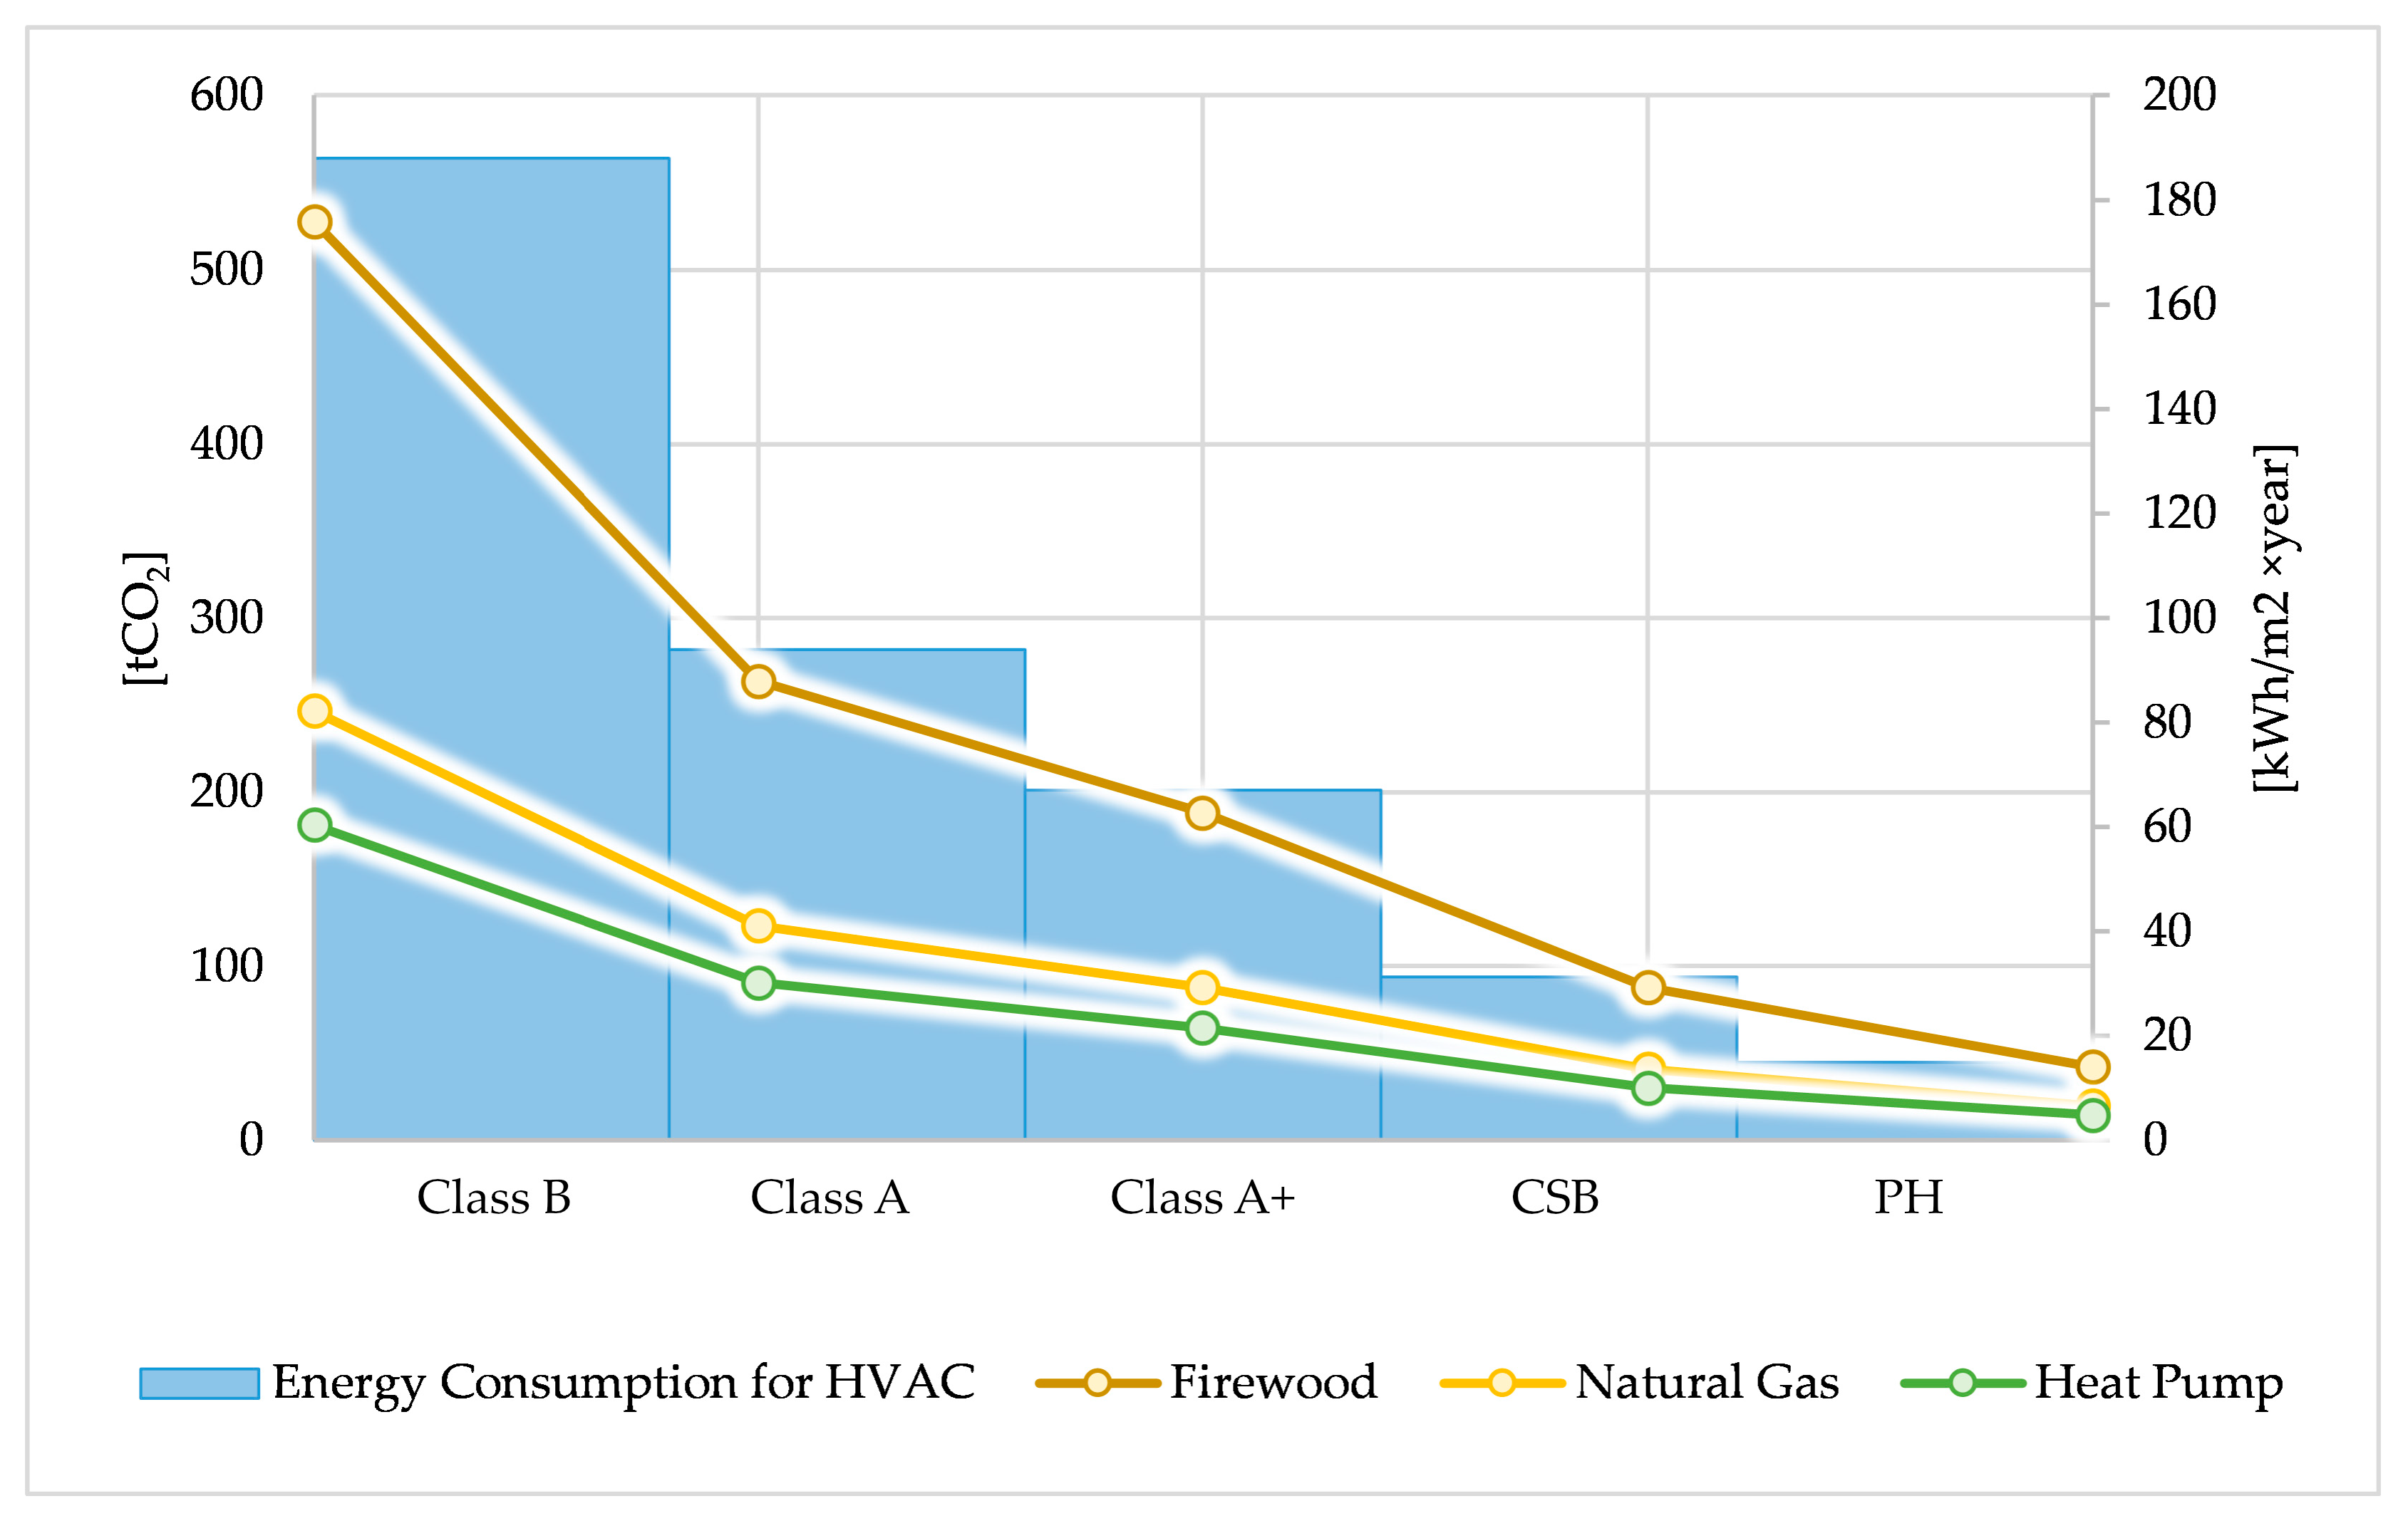
  • From high energy consumption buildings (Class B: 257 kWh/m2 year) to low energy consumption buildings (passive house: <15 kWh/m2 year), including the case study building;
  • For not using renewable energy sources with equipment such as heat pump or photovoltaic panels and for the cases of renewable energy usage.
This provided a meaningful insight over the current situation of single-family residential buildings in Romania, regarding the energy consumption and carbon footprint for the entire lifespan of a building, with an emphasis on the operational stage. The most important observation being that as buildings in Romania started to be more energy efficient, their construction cost increased but their CO2 emissions over the entire lifespan decreased considerably.
Moreover, after analysing the economical aspect of building with energy efficiency in mind, the results showed that because of the high electrical energy cost compared with the natural gas cost in Romania, if the building is not reaching a thermal insulation degree higher than what is required for Energetic Class A+, the operational stage cost in time will be less using a gas boiler instead of a heat pump, which in return will emit much more CO2 into the atmosphere in the long run.
Therefore, the main conclusions of this case study with an extrapolated building life cycle analysis are:
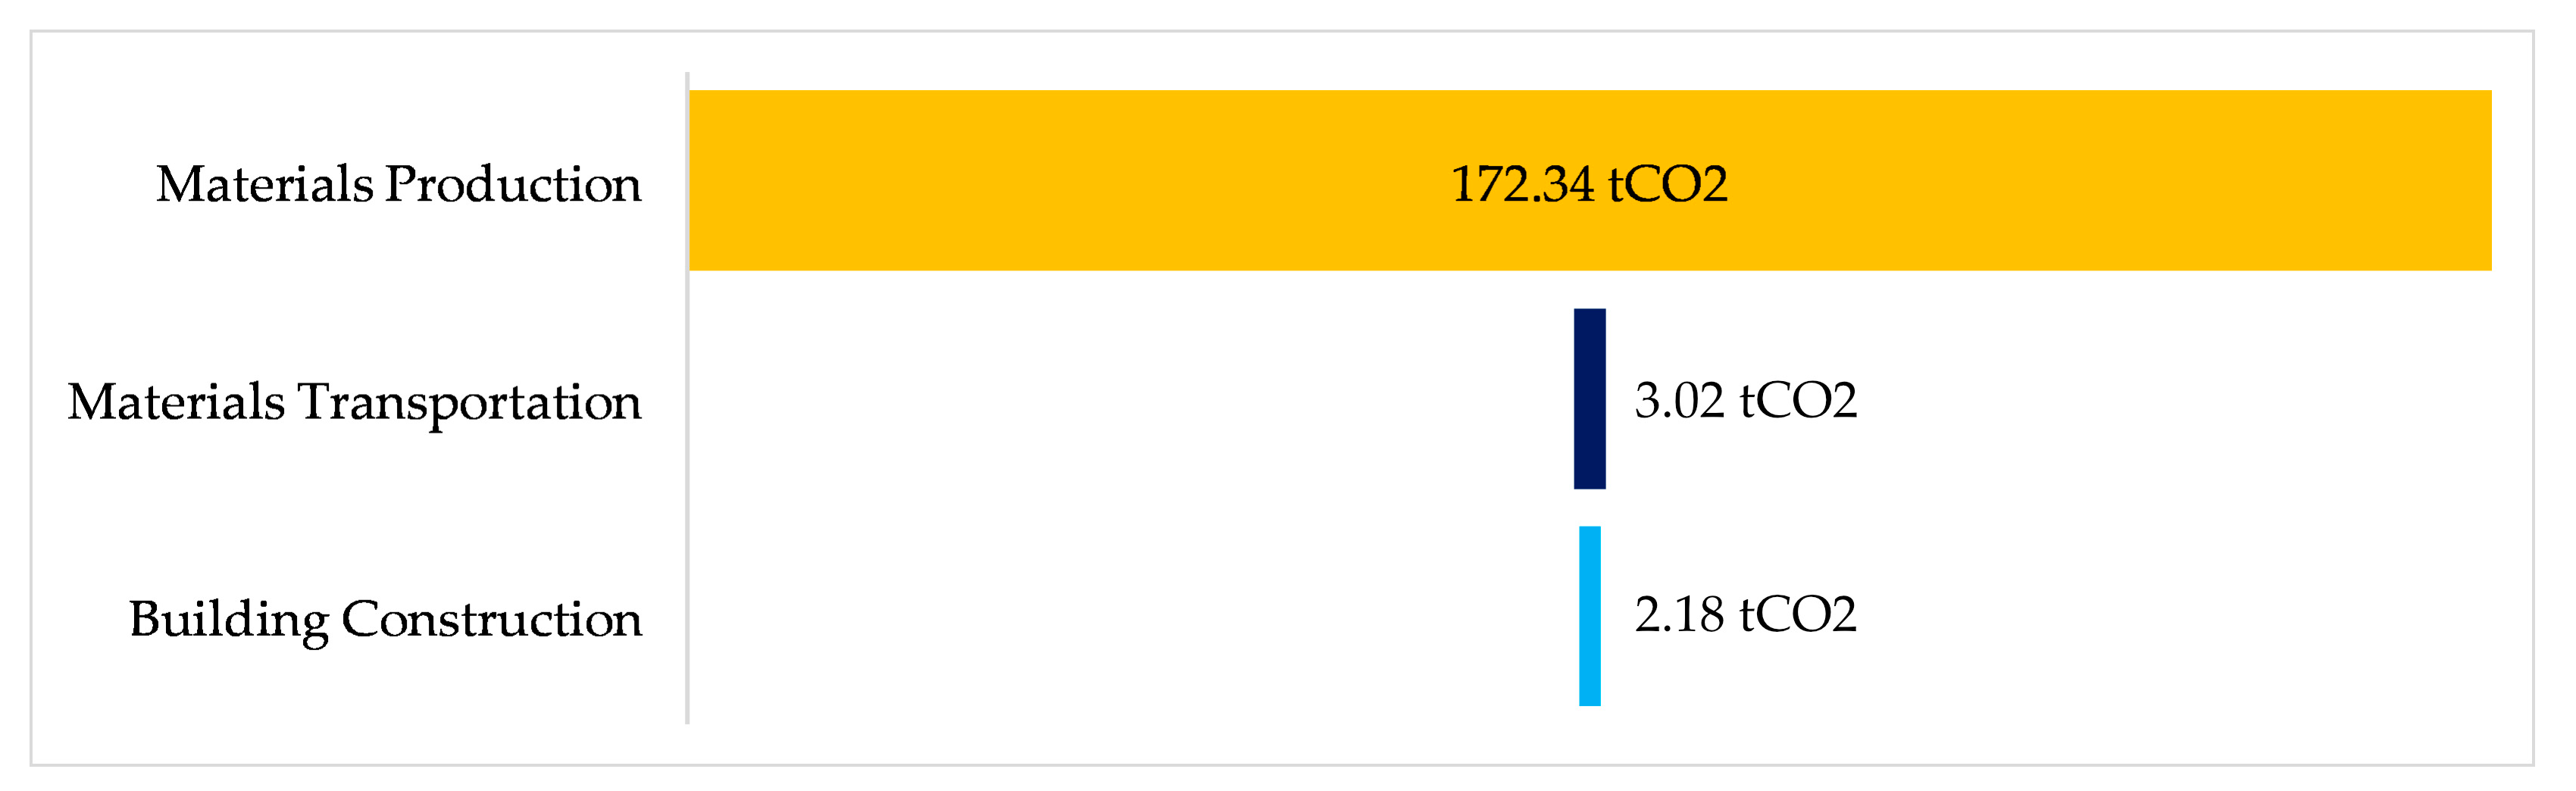
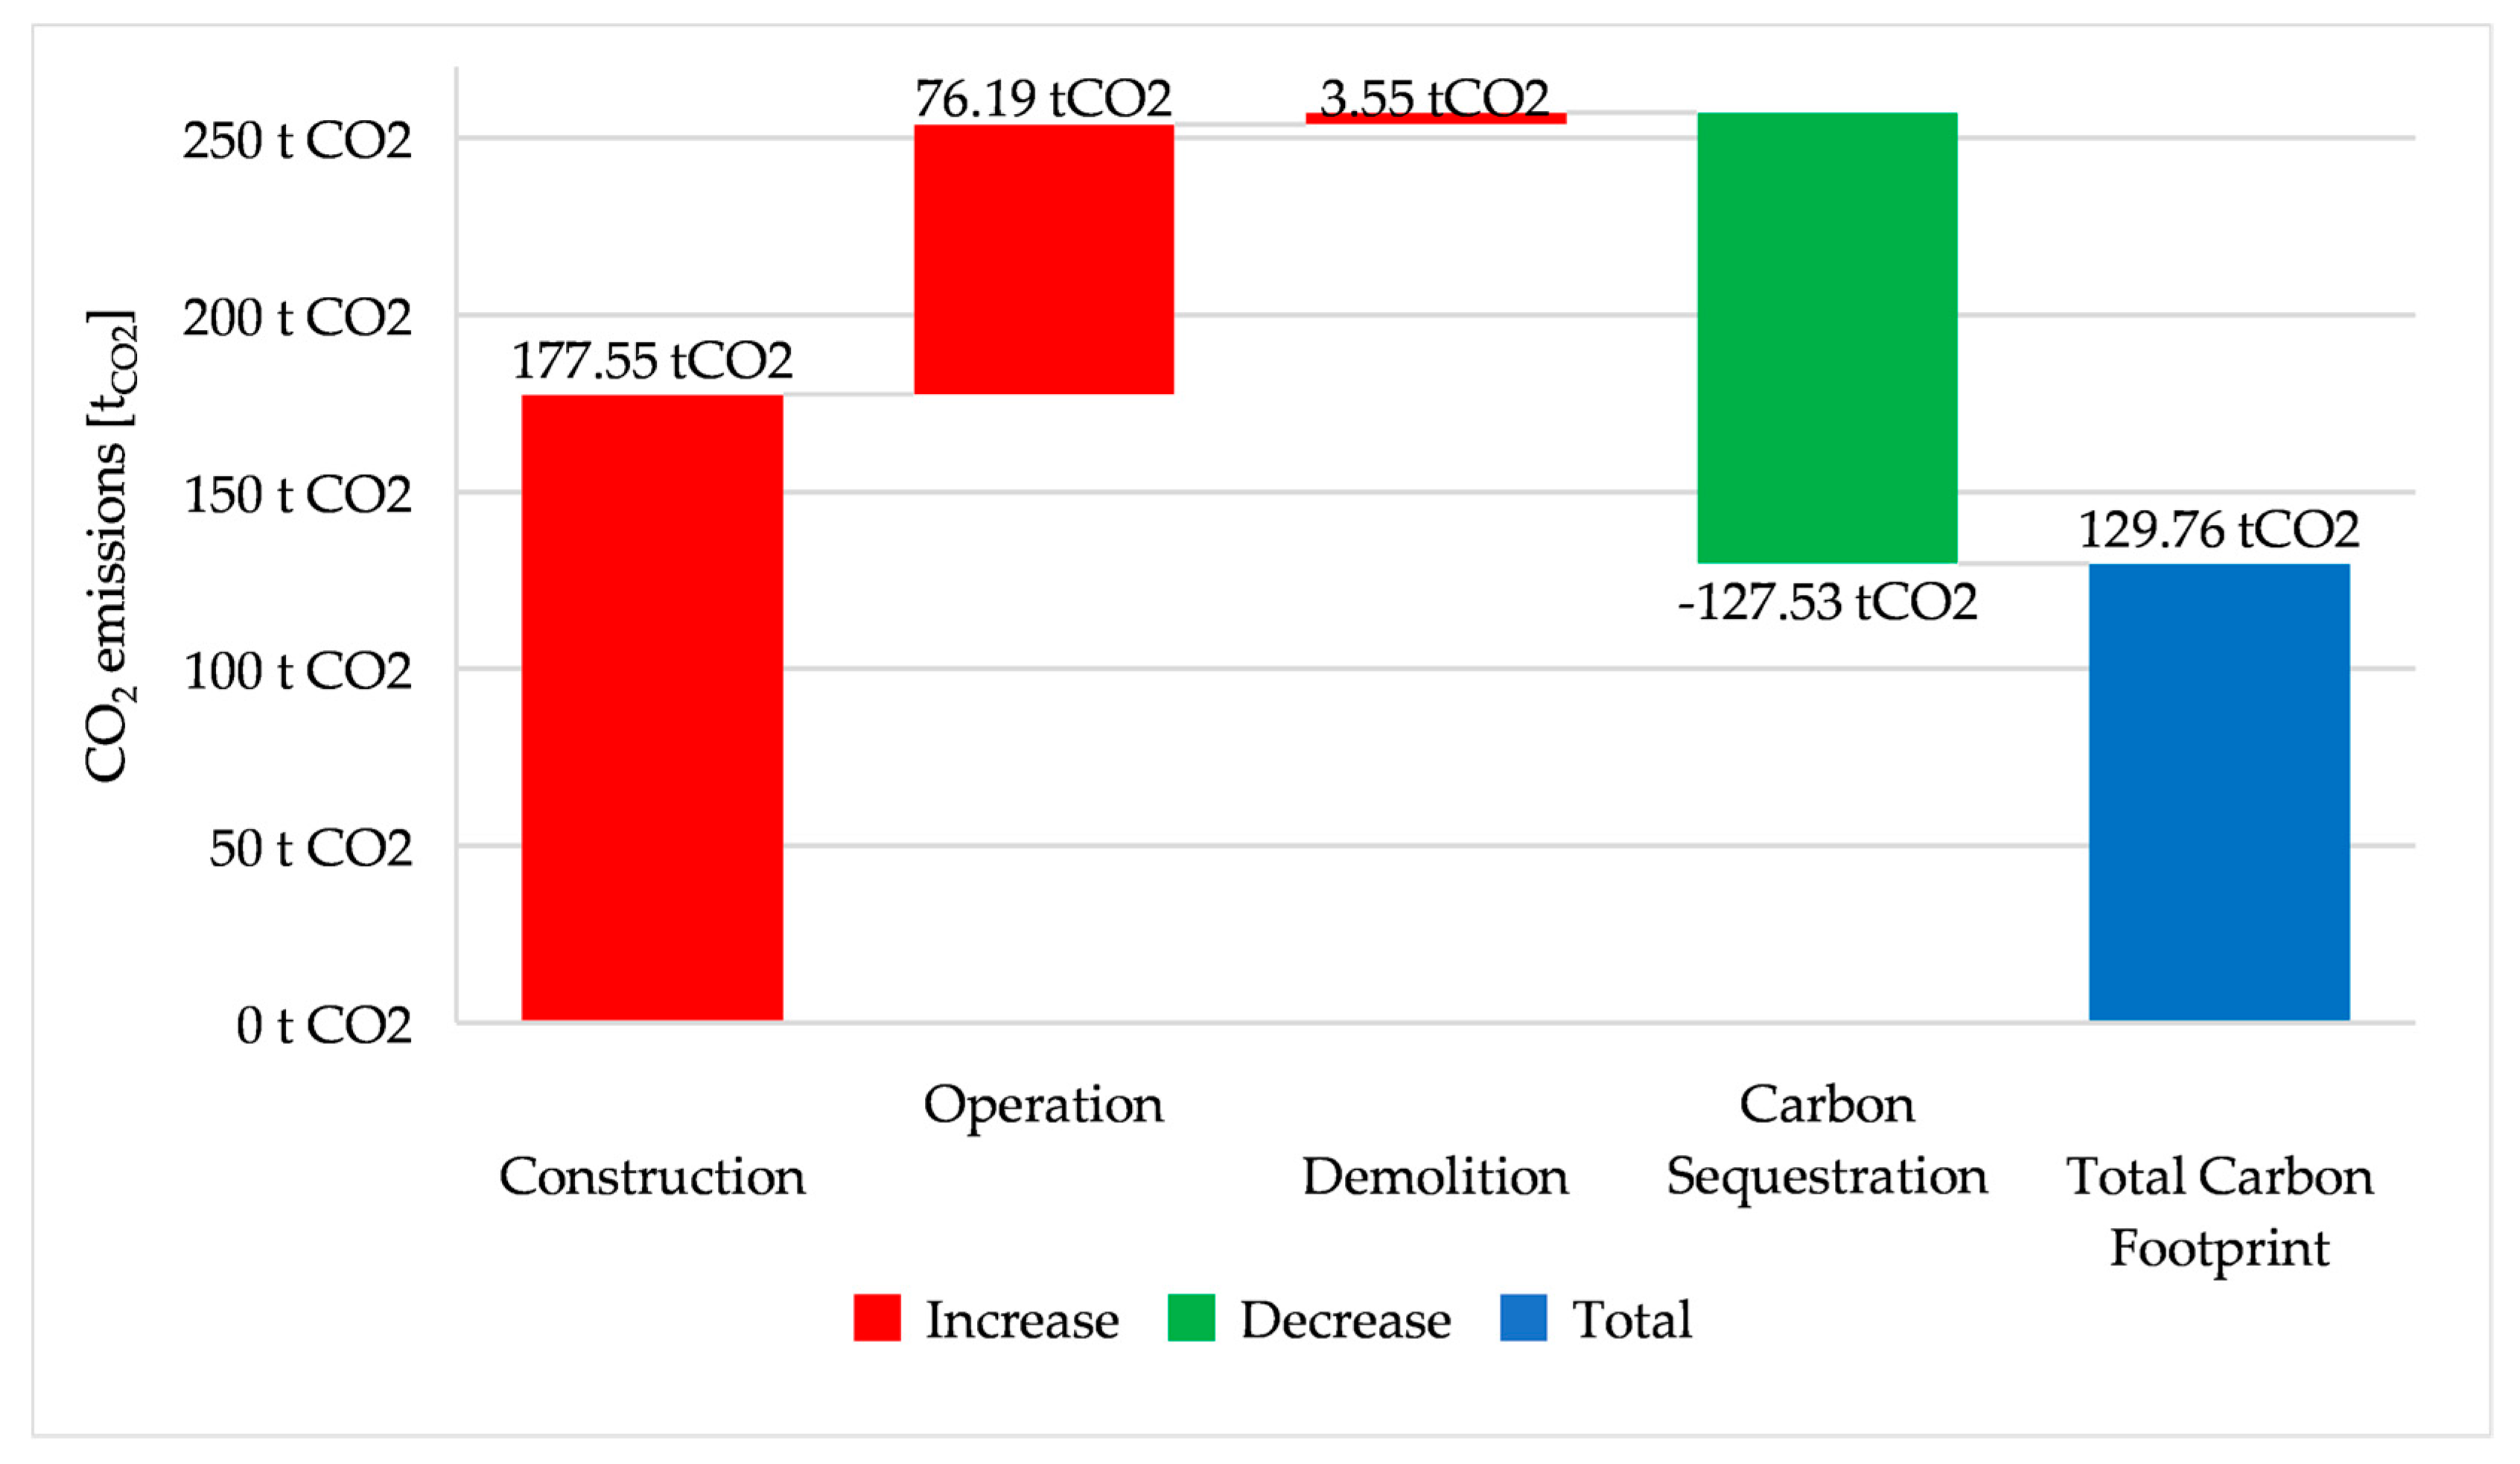
  • For the case study building, the total CO2 emissions for the entire life cycle was 257.29 tCO2;
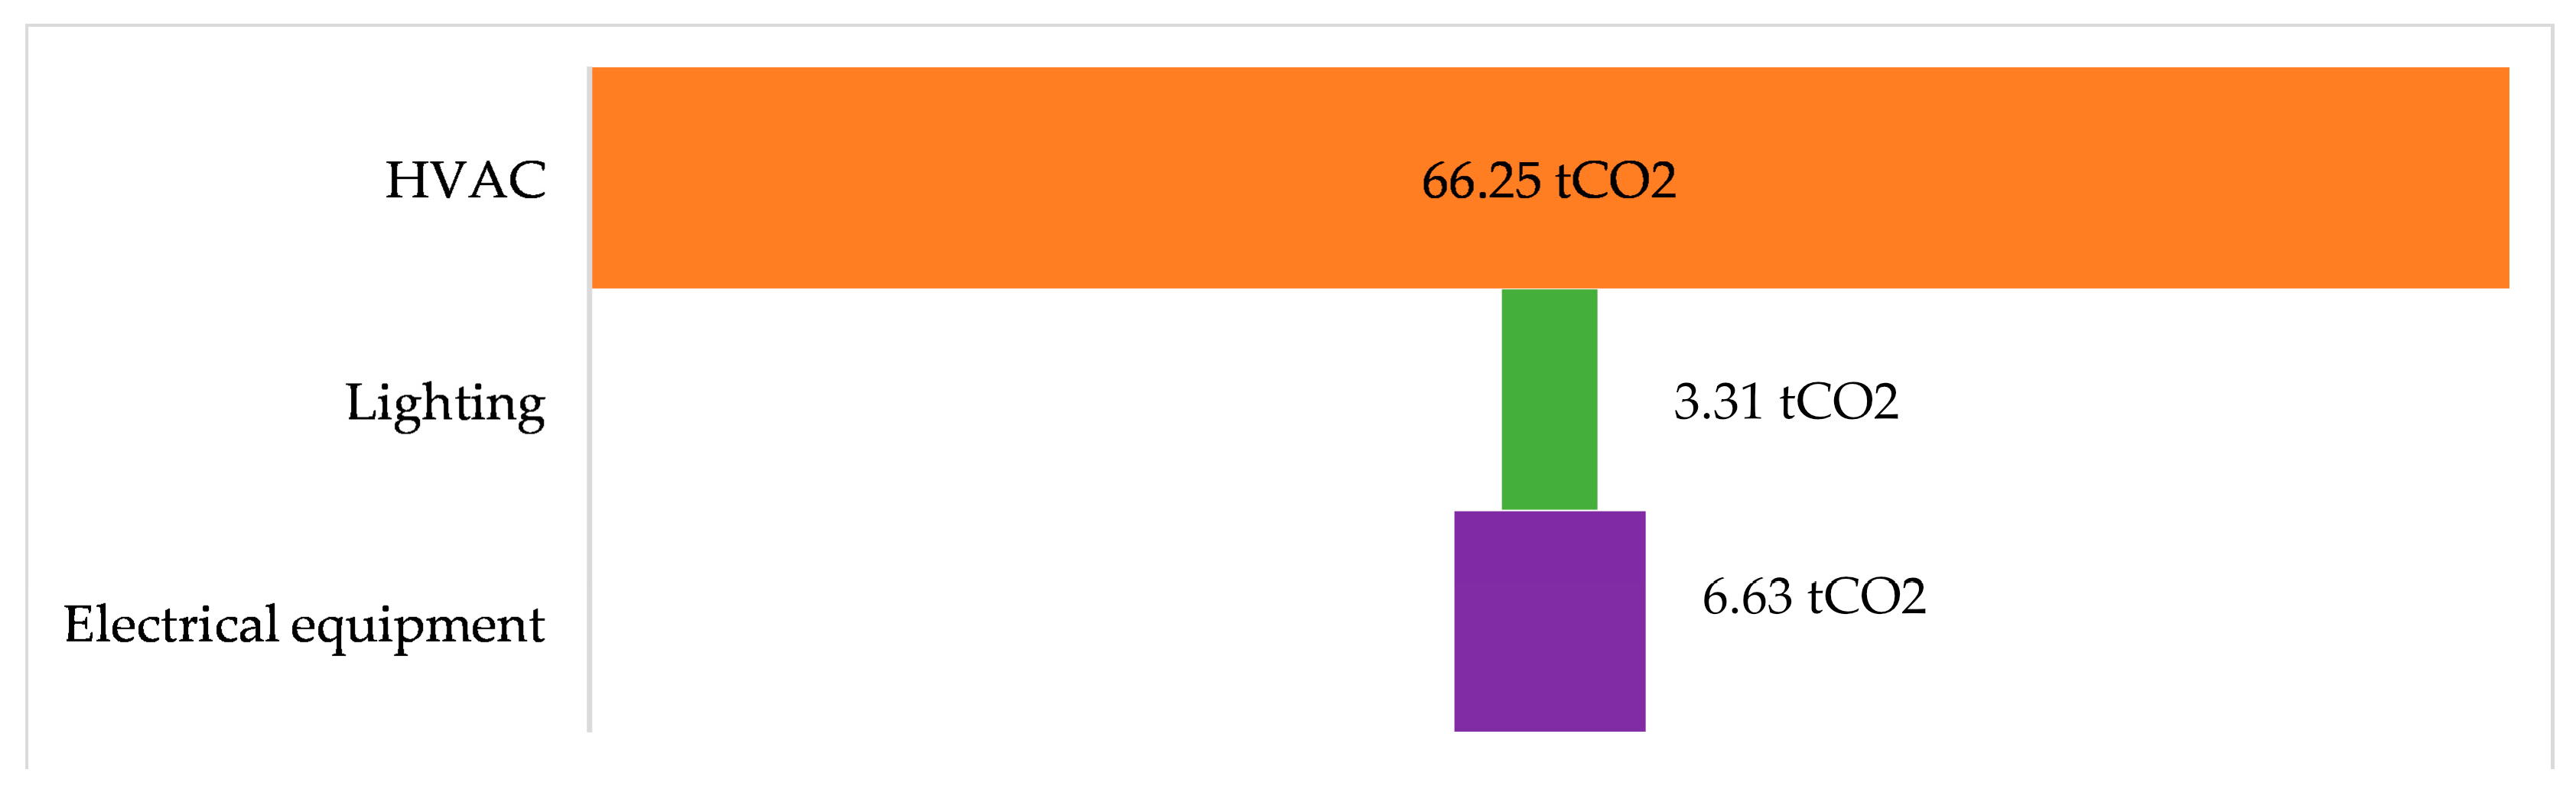
  • For the case study building, the highest CO2 emissions represent the construction stage with 66.99%, while the HVAC share is 25.75%;
  • For the case study building, the carbon sequestration from vegetation absorbs 127.53 tCO2, lowering the total carbon footprint to 129.76 tCO2, meaning 50% less;
  • Compared to the case study building, a building constructed before 1989 will mostly reside in Energetic Classes C to G and will emit 12.67 times more CO2 when heated with firewood and 7.55 times more when heated with natural gas for the operational HVAC sub-stage;
  • Compared to the case study building, a passive house will emit 1.8 times less CO2 for the operational HVAC sub-stage;
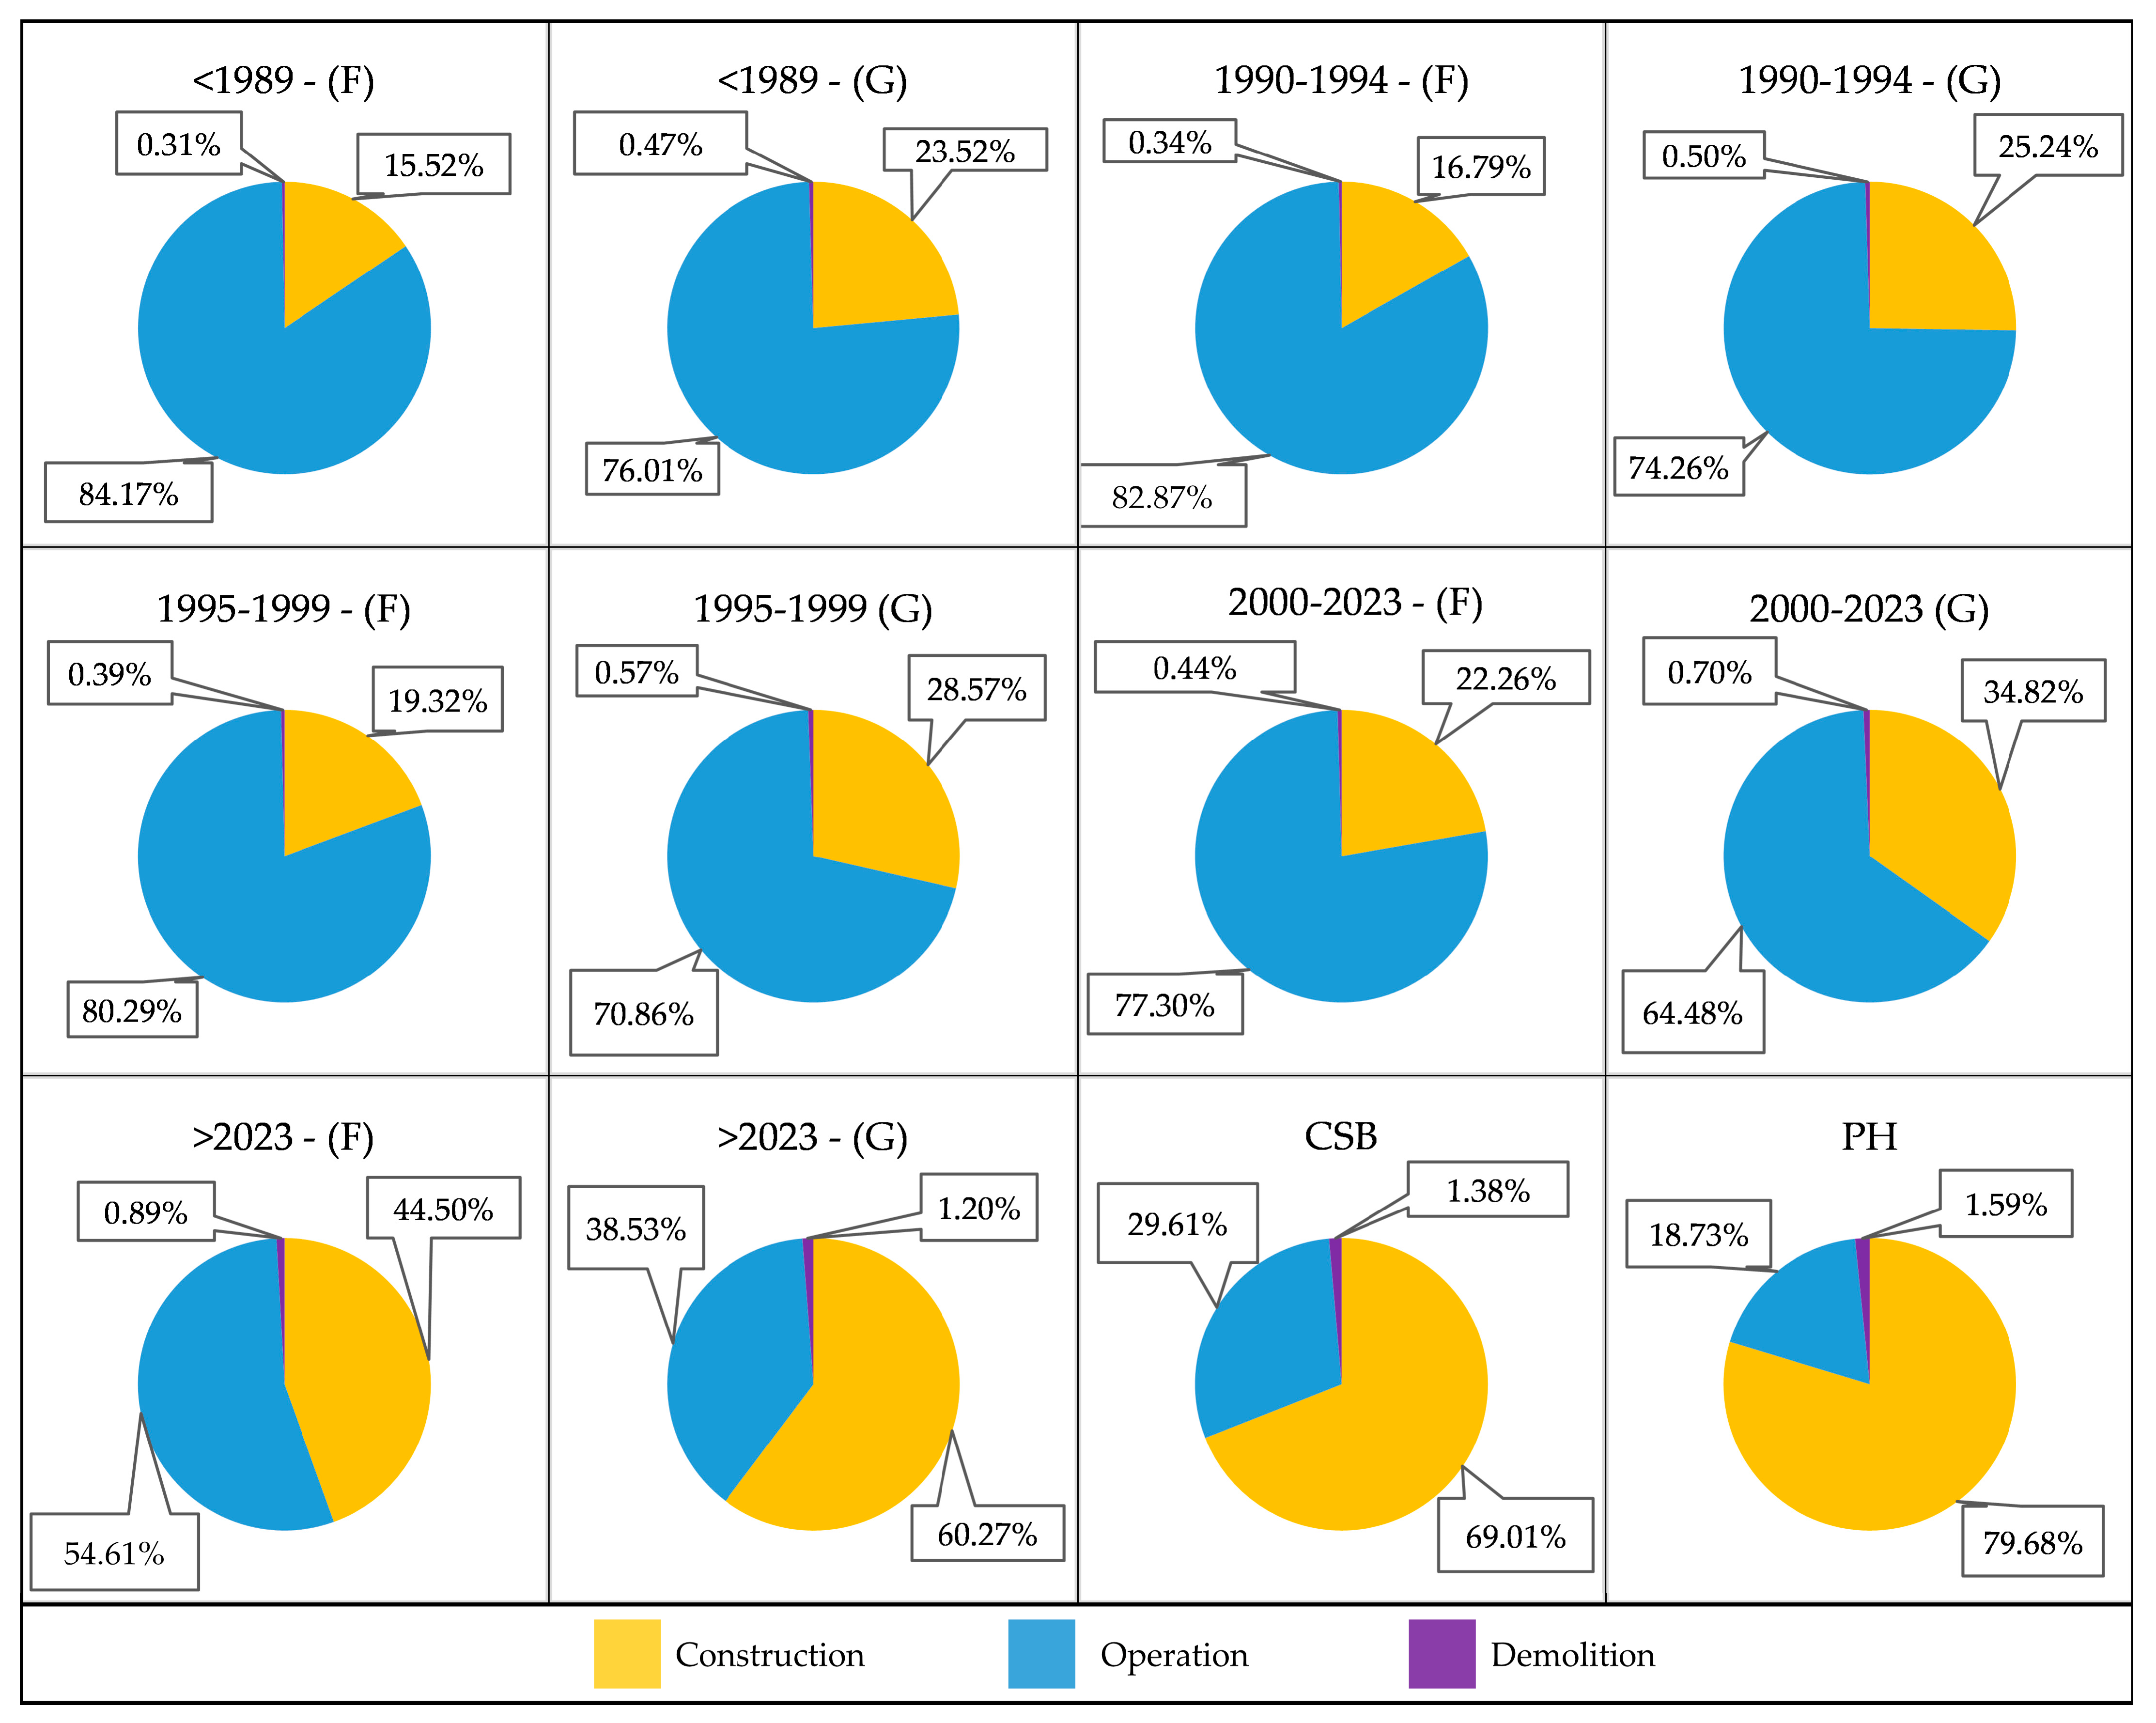
  • For the total life cycle of the building, the operational stage share for the case study building is 29.61%, while for a building heated with firewood built before 1989, the share is 84.17%, and that for natural gas is 76.01%;
  • In order to achieve Class A+ energy consumption, the buildings need to be insulated with at least 15 cm of thermal insulation;
  • Using a heat pump in the detriment of a firewood boiler will decrease the HVAC sub-stage CO2 emissions by 34%, while using it in the detriment of a natural gas boiler will decrease the CO2 emissions by 26%;
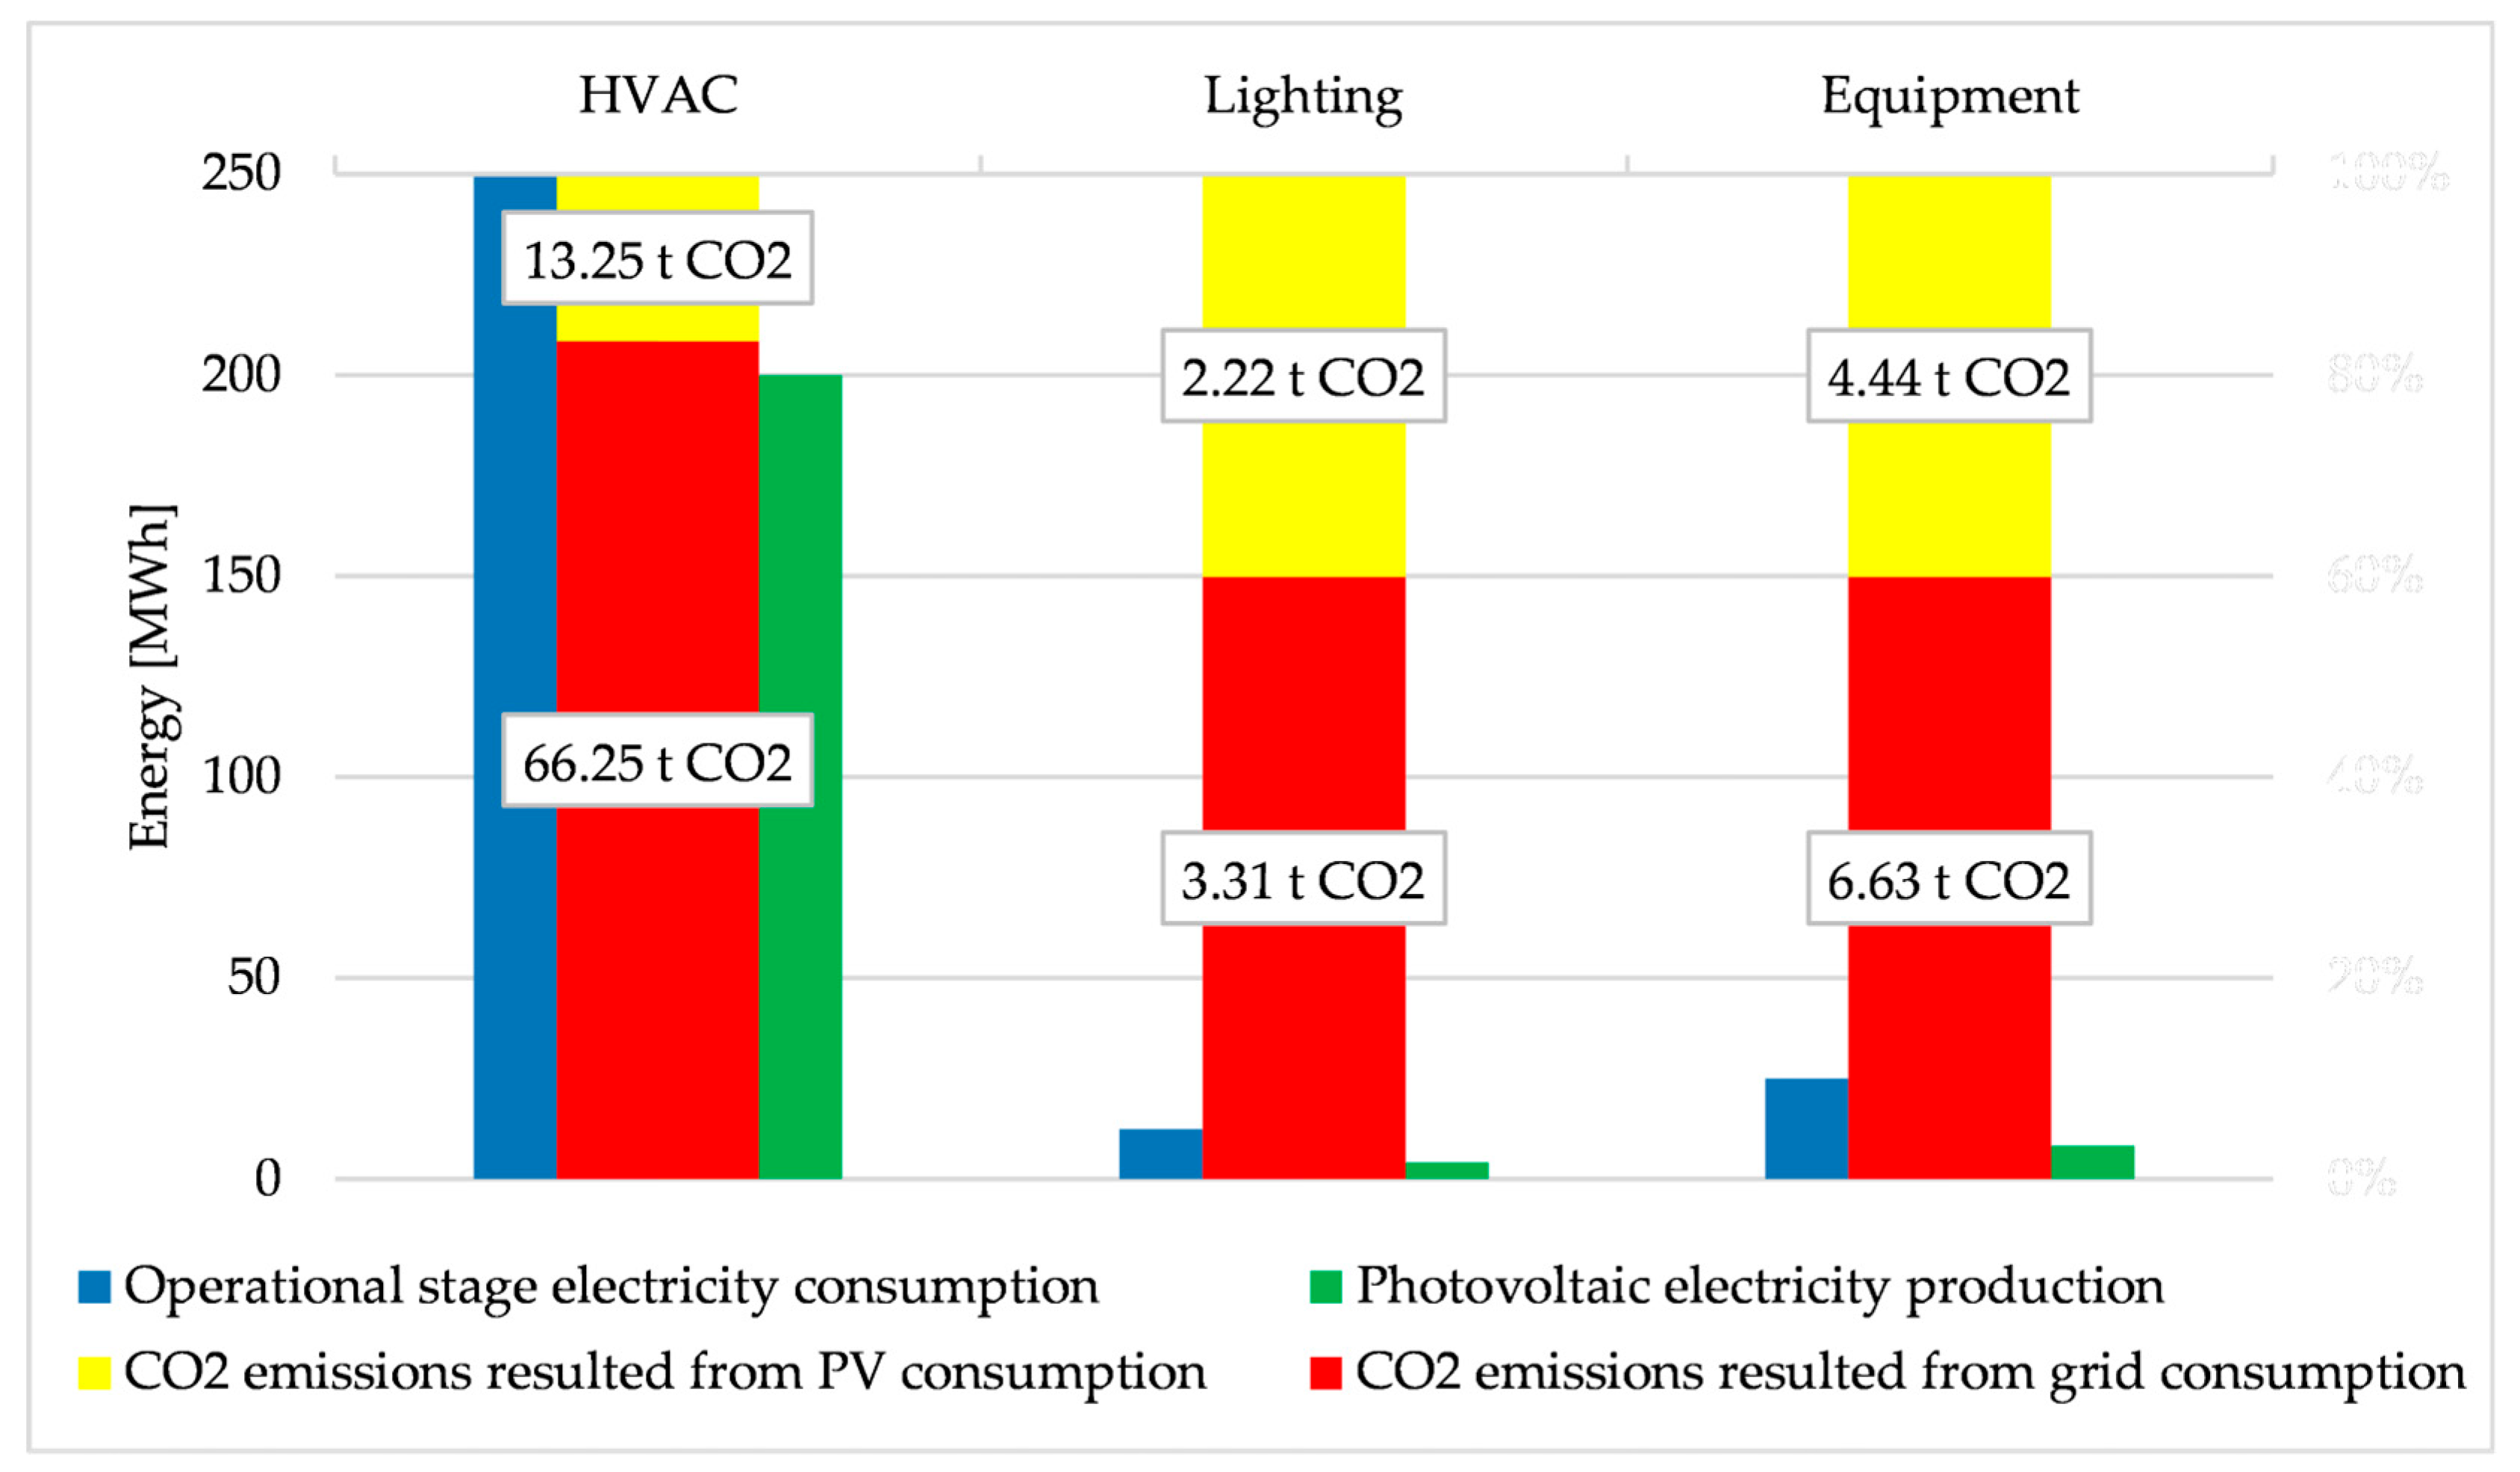
  • Using photovoltaic panels to produce electrical energy for the heat pump will reduce the CO2 emissions by 80% for HVAC sub stage and 73.8% for the entire operational stage for the current electricity cost in Romania;
  • The operational stage cost share for the case study building is 20%, with 68% representing the construction stage and 12% the demolition stage;
  • For a Class B building, heated with natural gas the operational stage cost share is 38%, while for heating with a heat pump, the cost share is 41%;
  • For a passive house, the cost share for the operational stage is 10% and the construction stage share is 77%, the rest representing demolition.
This study results are important to be taken seriously when designing single-family residential buildings. The fine line between implementation cost and CO2 emissions in the entire building life cycle needs careful and thoughtful assessment for each individual building, including creating green vegetation areas to combat the building’s carbon footprint.
Future research should focus on improving the embodied carbon footprint due to the fact that after decreasing the operational carbon footprint, the construction share increases to approximately 65% according to the case study building results. Furthermore, research for other building sub-sectors should be the focus in order to analyse potential measures to be taken to decrease their operational carbon footprint as well.

Author Contributions

Conceptualization, G.D., A.M.B. and S.I.B.; methodology, G.D. and R.C.; software, A.I.B., S.I.B., and N.F.I.; validation, G.D. and R.C.; formal analysis, A.M.B. and G.D.; investigation, N.G. and N.F.I.; resources, S.I.B.; data curation, A.M.B. and G.D.; writing—original draft preparation, A.M.B.; writing—review and editing, R.C.; visualization, A.M.B. and S.I.B.; supervision, G.D. and M.F.; project administration, A.M.B. and G.D. All authors have read and agreed to the published version of the manuscript.

Funding

This research received no external funding.

Data Availability Statement

The data presented in this study are available on request from the corresponding author. The data are not publicly available due to privacy issues.

Conflicts of Interest

The authors declare no conflicts of interest.

References

  1. Vuțoiu, B.G.; Tăbăcaru, M.B.; Beșchea, G.A.; Câmpean, Ș.I.; Bulmez, A.M.; Năstase, G. Seven continents. One sky. Front. Clim. 2024, 6, 1470281. [Google Scholar] [CrossRef]
  2. UN Environment programme. 2021 Global Status Report For Buildings and Construction Towards a Zero-Emissions, Efficient and Resilient Buildings and Construction Sector. 2021. Available online: www.globalabc.org (accessed on 14 January 2025).
  3. Efficient Buildings Europe. Energy Performance of Buildings Directive (EPBD). 2024. Available online: https://efficientbuildings.eu/wp-content/uploads/2024/10/Efficient-Buildings-Europe-Implementation-Guide-2024_online-1.pdf (accessed on 17 January 2025).
  4. Maierhofer, D.; Röck, M.; Saade, M.R.M.; Hoxha, E.; Passer, A. Critical life cycle assessment of the innovative passive nZEB building concept “be 2226” in view of net-zero carbon targets. Build. Environ. 2022, 223, 109476. [Google Scholar] [CrossRef]
  5. Dragomir, G.; Boian, I. Specific conditions for an optimal operation of air-water heat pumps. Rev. Romana Ing. Civila Rom. J. Civ. Eng. 2022, 13, 126–137. [Google Scholar] [CrossRef]
  6. USA Government. Infrastructure Investment and Jobs Act. Available online: https://www.congress.gov/bill/117th-congress/house-bill/3684 (accessed on 21 January 2025).
  7. Ma, M.; Zhou, N.; Feng, W.; Yan, J. Challenges and opportunities in the global net-zero building sector. Cell Rep. Sustain. 2024, 1, 100154. [Google Scholar] [CrossRef]
  8. GLOBE. Global Building Emissions Database. Available online: https://globe2060.org/ (accessed on 21 January 2025).
  9. Yuan, H.; Ma, M.; Zhou, N.; Xie, H.; Ma, Z.; Xiang, X.; Ma, X. Battery electric vehicle charging in China: Energy demand and emissions trends in the 2020s. Appl. Energy 2024, 365, 123153. [Google Scholar] [CrossRef]
  10. Pauliuk, S.; Heeren, N.; Berrill, P.; Fishman, T.; Nistad, A.; Tu, Q.; Wolfram, P.; Hertwich, E.G. Global scenarios of resource and emission savings from material efficiency in residential buildings and cars. Nat. Commun. 2021, 12, 5097. [Google Scholar] [CrossRef]
  11. Bhyan, P.; Shrivastava, B.; Kumar, N. Allocating weightage to sustainability criteria’s for performance assessment of group housing developments: Using fuzzy analytic hierarchy process. J. Build. Eng. 2023, 65, 105684. [Google Scholar] [CrossRef]
  12. Häkkinen, T.; Kuittinen, M.; Ruuska, A.; Jung, N. Reducing embodied carbon during the design process of buildings. J. Build. Eng. 2015, 4, 1–13. [Google Scholar] [CrossRef]
  13. Wuni, I.Y.; Shen, G.Q.P.; Osei-Kyei, R. Scientometric review of global research trends on green buildings in construction journals from 1992 to 2018. Energy Build. 2019, 190, 69–85. [Google Scholar] [CrossRef]
  14. Falana, J.; Osei-Kyei, R.; Tam, V.W. Towards achieving a net zero carbon building: A review of key stakeholders and their roles in net zero carbon building whole life cycle. J. Build. Eng. 2024, 82, 108223. [Google Scholar] [CrossRef]
  15. Ibn-Mohammed, T.; Greenough, R.; Taylor, S.; Ozawa-Meida, L.; Acquaye, A. Operational vs. embodied emissions in buildings—A review of current trends. Energy Build. 2013, 66, 232–245. [Google Scholar] [CrossRef]
  16. Bulmez, A.M.; Ciofoaia, V.; Năstase, G.; Dragomir, G.; Brezeanu, A.I.; Şerban, A. An experimental work on the performance of a solar-assisted ground-coupled heat pump using a horizontal ground heat exchanger. Renew. Energy 2022, 183, 849–865. [Google Scholar] [CrossRef]
  17. Bulmez, A.M.; Ciofoaia, V.; Năstase, G.; Dragomir, G.; Brezeanu, A.-I.; Iordan, N.-F.; Bolocan, S.-I.; Fratu, M.; Pleșcan, C.; Cazacu, C.E.; et al. Numerical Investigation on Auxiliary Heat Sources for Horizontal Ground Heat Exchangers. Buildings 2022, 12, 1259. [Google Scholar] [CrossRef]
  18. Năstase, G.; Șerban, A.; Dragomir, G.; Brezeanu, A.I.; Bucur, I. Photovoltaic development in Romania. Reviewing what has been done. Renew. Sustain. Energy Rev. 2018, 94, 523–535. [Google Scholar] [CrossRef]
  19. Bulmez, A.M.; Brezeanu, A.I.; Dragomir, G.; Fratu, M.; Iordan, N.F.; Bolocan, S.I.; Rozorea, L.; Popa, E.C.; Năstase, G. CFD Analysis for a New Trombe Wall Concept. Buildings 2024, 14, 579. [Google Scholar] [CrossRef]
  20. Gao, Y.; Dong, J.; Isabella, O.; Santbergen, R.; Tan, H.; Zeman, M.; Zhang, G. Modeling and analyses of energy performances of photovoltaic greenhouses with sun-tracking functionality. Appl. Energy 2019, 233–234, 424–442. [Google Scholar] [CrossRef]
  21. Hoxha, E.; Jusselme, T. On the necessity of improving the environmental impacts of furniture and appliances in net-zero energy buildings. Sci. Total Environ. 2017, 596–597, 405–416. [Google Scholar] [CrossRef]
  22. Monteiro, H.; Fernández, J.E.; Freire, F. Comparative life-cycle energy analysis of a new and an existing house: The significance of occupant’s habits, building systems and embodied energy. Sustain. Cities Soc. 2016, 26, 507–518. [Google Scholar] [CrossRef]
  23. Shen, P.; Braham, W.; Yi, Y. The feasibility and importance of considering climate change impacts in building retrofit analysis. Appl. Energy 2019, 233–234, 254–270. [Google Scholar] [CrossRef]
  24. Shoubi, M.V.; Shoubi, M.V.; Bagchi, A.; Barough, A.S. Reducing the operational energy demand in buildings using building information modeling tools and sustainability approaches. Ain Shams Eng. J. 2015, 6, 41–55. [Google Scholar] [CrossRef]
  25. Röck, M.; Saade, M.R.M.; Balouktsi, M.; Rasmussen, F.N.; Birgisdottir, H.; Frischknecht, R.; Habert, G.; Lützkendorf, T.; Passer, A. Embodied GHG emissions of buildings—The hidden challenge for effective climate change mitigation. Appl. Energy 2020, 258, 114107. [Google Scholar] [CrossRef]
  26. Bulmez, A.M.; Brezeanu, A.I.; Dragomir, G.; Talabă, O.M.; Năstase, G. An Analysis of Romania’s Energy Strategy: Perspectives and Developments since 2020. Climate 2024, 12, 101. [Google Scholar] [CrossRef]
  27. MDLPA—Romanian Ministry of Development. Strategia Naţională de Renovare pe Termen Lung Pentru Sprijinirea Renovării Parcului Național de Clădiri Rezidențiale și Nerezidențiale, Atât Publice Cât și Private și Transformarea sa Treptată Într-un Parc Imobiliar cu un Nivel Ridicat de Eficiență Energetică și Decarbonat Până în 2050. 2020. Available online: https://www.mdlpa.ro/uploads/articole/attachments/5fdc71d266180591652964.docx (accessed on 24 January 2025).
  28. Institutul Național de Statistică/Romanian National Statistics Institute. Romanian Housing Stock. Available online: https://insse.ro/cms/ro/tags/fondul-de-locuinte (accessed on 24 January 2025).
  29. Dragomir, G.; Brezeanu, A.I.; Iordan, N.; Ferenc, D.; Boian, I. The way from gas boilers to heat pumps. Rev. Romana Ing. Civila/Rom. J. Civ. Eng. 2024, 15, 7–16. [Google Scholar] [CrossRef]
  30. MDLPA—Romanian Ministry of Development. Metodologie de Calcul al Performanței Energetice a Clădirilor, Indicativ Mc 001-2022/Calculation Methodology of the Energy Performance of Buildings, Indicator Mc 001-2022. 2022. Available online: https://aaecr.ro/wp-content/uploads/2023/01/Mc-001-2022-Metodologie-calcul-performanta-energetica-cladiri.pdf (accessed on 27 January 2025).
  31. MDLPA—Romanian Ministry of Development. Analiza Diagnostic Privind Stadiul Actual Existent în România Pentru Atingerea Nivelurilor Nzeb în Renovarea Fondului Construit Existent și în Construirea Clădirilor Noi. 2024. Available online: https://www.mdlpa.ro/uploads/articole/attachments/64d0e8f0f2213216455587.pdf (accessed on 27 January 2025).
  32. Maduta, C.; D’Agostino, D.; Tsemekidi-Tzeiranaki, S.; Castellazzi, L. From Nearly Zero-Energy Buildings (NZEBs) to Zero-Emission Buildings (ZEBs): Current status and future perspectives. Energy Build. 2025, 328, 115133. [Google Scholar] [CrossRef]
  33. Parliament of Romania. Romanian Law 372/2005 Updated in 2020. Available online: https://isc.gov.ro/files/2024/Legislatie/legea-nr-372-2005-privind-performanta-energetica-a-cladirilor.pdf (accessed on 29 January 2025).
  34. Parliament of Romania. Romanian Law 238/2024. Available online: https://isc.gov.ro/files/2024/Legislatie/legea-nr-238-2024-pentru-modificarea-si-completarea-legii-nr-372-2005-privind-performanta-energetica-a-cladirilor.pdf (accessed on 30 January 2025).
  35. Simon, E.; Leandro, B.; Miwa, K.; Ngara, T.; Tanabe, K. 2006 IPCC Guidelines for National Greenhouse Gas Inventories; Institute for Global Environmental Strategies (IGES), Hayama, Japan. 2006. Available online: https://www.ipcc.ch/report/2006-ipcc-guidelines-for-national-greenhouse-gas-inventories/ (accessed on 30 January 2025).
  36. Peng, C. Calculation of a building’s life cycle carbon emissions based on Ecotect and building information modeling. J. Clean. Prod. 2016, 112, 453–465. [Google Scholar] [CrossRef]
  37. Yan, Y. Research of Energy Consumption and CO2 Emission of Buildings in Zhejiang Province Based on Life Cycle Assessment; Zhejiang University: Hangzhou, China, 2011. [Google Scholar]
  38. Zhang, X.; Shen, L.; Zhang, L. Life cycle assessment of the air emissions during building construction process: A case study in Hong Kong. Renew. Sustain. Energy Rev. 2013, 17, 160–169. [Google Scholar] [CrossRef]
  39. Nagaraja, M.R.; Biswas, W.K.; Selvan, C.P. Advancements and challenges in solar photovoltaic technologies: Enhancing technical performance for sustainable clean energy—A review. Sol. Energy Adv. 2025, 5, 100084. [Google Scholar] [CrossRef]
  40. Norouzi, M.; Haddad, A.N.; Jiménez, L.; Hoseinzadeh, S.; Boer, D. Carbon footprint of low-energy buildings in the United Kingdom: Effects of mitigating technological pathways and decarbonization strategies. Sci. Total Environ. 2023, 882, 163490. [Google Scholar] [CrossRef]
  41. Romanian Government. Factorii de Conversie în Emisii de Gaze cu Efect de Seră (CO2 Echivalent)/Conversion Factors for GHG Emissions (CO2 Equivalent). Available online: https://lege5.ro/Gratuit/ha4demjwgu3q/factorii-de-conversie-in-emisii-de-gaze-cu-efect-de-sera-co-2-echivalent-ghid-anexa-nr-4-la-ghid-factori-de-conversie?dp=gqytcnztga3dimi (accessed on 3 February 2025).
  42. CNTEE Transelectrica SA. Productia si Consumul de Energie Electrica in Romania, pe Tipuri de Producatori/Electricity Production and Consumption in Romania, by Types of Producers. Available online: https://www.sistemulenergetic.ro/ (accessed on 3 February 2025).
  43. Qu, Y.; Shi, Y.; Wu, X.; Zhu, M.; Zhu, P.; Zhang, X.; Le, S.; Ren, Y.; Pan, J.; Wang, Y. Enhancing the carbon sequestration potential of urban green space: A water–energy–carbon fluxes perspective. Urban For. Urban Green. 2025, 104, 128652. [Google Scholar] [CrossRef]
  44. Dong, X.; He, B.J. A Standardized Assessment Framework for Green Roof Decarbonization: A Review of Embodied Carbon, Carbon Sequestration, Bioenergy Supply, and Operational Carbon Scenarios. Renew. Sustain. Energy Rev. 2023, 182, 113376. [Google Scholar] [CrossRef]
  45. ANRE—Romanian National Energy Agency. Date Statistice Aferente Energiei Electrice Produse în Anul 2007/Statistical Data Relating to Electrical Energy Produced in 2007; ANRE: Bucharest, Romania, 2007. [Google Scholar]
  46. Carbon Database Initiative. International Electricity Factors. Available online: https://www.carbondi.com/#electricity-factors/ (accessed on 5 February 2025).
  47. Domínguez, A.; Geyer, R. Photovoltaic waste assessment in Mexico. Resour. Conserv. Recycl. 2017, 127, 29–41. [Google Scholar] [CrossRef]
  48. Ministry of Energy. Romanian Energy Strategy 2022–2030, with an Outlok to 2050. 2022. Available online: https://energie.gov.ro/wp-content/uploads/2022/08/Strategia-2030_DGJRI_AM_12.08.2022_MU_Clean_25.08.2022-1.pdf (accessed on 6 March 2025).
  49. Petrovic, B.; Myhren, J.A.; Zhang, X.; Wallhagen, M.; Eriksson, O. Life cycle assessment of building materials for a single-family house in Sweden. Energy Procedia 2019, 158, 3547–3552. [Google Scholar] [CrossRef]
  50. Keoleian, G.A.; Blanchard, S.; Reppe, P. Life-cycle energy, costs, and strategies for improving a single-family house. J. Ind. Ecol. 2000, 4, 135–156. [Google Scholar] [CrossRef]
  51. Monteiro, H.; Freire, F. Life-cycle assessment of a house with alternative exterior walls: Comparison of three impact assessment methods. Energy Build. 2012, 47, 572–583. [Google Scholar] [CrossRef]
  52. Perkins, A.; Hamnett, S.; Pullen, S.; Zito, R.; Trebilcock, D. Transport, Housing and Urban Form: The Life Cycle Energy Consumption and Emissions of City Centre Apartments Compared with Suburban Dwellings. Urban Policy Res. 2009, 27, 377–396. [Google Scholar] [CrossRef]
  53. Asif, M.; Muneer, T.; Kelley, R. Life cycle assessment: A case study of a dwelling home in Scotland. Build. Environ. 2007, 42, 1391–1394. [Google Scholar] [CrossRef]
  54. Bastos, J.; Batterman, S.A.; Freire, F. Life-cycle energy and greenhouse gas analysis of three building types in a residential area in Lisbon. Energy Build. 2014, 69, 344–353. [Google Scholar] [CrossRef]
  55. Citherlet, S.; Defaux, T. Energy and environmental comparison of three variants of a family house during its whole life span. Build. Environ. 2007, 42, 591–598. [Google Scholar] [CrossRef]
  56. Pal, S.K.; Takano, A.; Alanne, K.; Siren, K. A life cycle approach to optimizing carbon footprint and costs of a residential building. Build. Environ. 2017, 123, 146–162. [Google Scholar] [CrossRef]
  57. Motuziene, V.; Rogoža, A.; Lapinskiene, V.; Vilutiene, T. Construction solutions for energy efficient single-family house based on its life cycle multi-criteria analysis: A case study. J. Clean. Prod. 2016, 112, 532–541. [Google Scholar] [CrossRef]
  58. Marceau, M.L.; Gajda, J.; Vangeem, M.G.; Nisbet, M.A. Partial Environmental Life Cycle Inventory of an Insulating Concrete Form House Compared to a Wood Frame House; Portland Cement Association: Washington, DC, USA, 2002. [Google Scholar]
  59. Lippke, B.; Wilson, J.; Perez-Garcia, J.; Bowyer, J.; Meil, J. CORRIM: Life-cycle environmental performance of renewable building materials. For. Prod. J. 2004, 54, 8–19. [Google Scholar]
  60. Ortiz-Rodríguez, O.; Castells, F.; Sonnemann, G. Life cycle assessment of two dwellings: One in Spain, a developed country, and one in Colombia, a country under development. Sci. Total Environ. 2010, 408, 2435–2443. [Google Scholar] [CrossRef] [PubMed]
  61. Bribián, I.Z.; Usón, A.A.; Scarpellini, S. Life cycle assessment in buildings: State-of-the-art and simplified LCA methodology as a complement for building certification. Build. Environ. 2009, 44, 2510–2520. [Google Scholar] [CrossRef]
  62. Estokova, A.; Vilcekova, S.; Porhincak, M. Analyzing Embodied Energy, Global Warming and Acidification Potentials of Materials in Residential Buildings. Procedia Eng. 2017, 180, 1675–1683. [Google Scholar] [CrossRef]
  63. Atmaca, A.; Atmaca, N. Life cycle energy (LCEA) and carbon dioxide emissions (LCCO2A) assessment of two residential buildings in Gaziantep, Turkey. Energy Build. 2015, 102, 417–431. [Google Scholar] [CrossRef]
  64. Deng, W.; Prasad, D.; Osmond, P.; Li, F.T. Quantifying Life Cycle Energy and Carbon Footprints of China’s Residential Small District. Available online: http://meridian.allenpress.com/jgb/article-pdf/6/4/96/1768516/jgb_6_4_96.pdf (accessed on 6 February 2025).
  65. Cuéllar-Franca, R.M.; Azapagic, A. Environmental impacts of the UK residential sector: Life cycle assessment of houses. Build. Environ. 2012, 54, 86–99. [Google Scholar] [CrossRef]
  66. Iyer-Raniga, U.; Wong, J.P.C. Evaluation of whole life cycle assessment for heritage buildings in Australia. Build. Environ. 2012, 47, 138–149. [Google Scholar] [CrossRef]
Figure 1. Global carbon distribution and trends for the buildings sector: (A) share of the overall energy consumption of the buildings sector and corresponding CO2 emissions in 2022; (B) potential changes in operational CO2 emissions from the buildings sector, 20102070; (C) the contribution of leading economies (for example, the US, China, and Europe) to global CO2 emissions in the buildings sector in 2010 and 2020 [7].
Buildings 15 00938 g001
Figure 2. Buildings sector in Romania and its sub-sector shares [27].
Buildings 15 00938 g002
Figure 3. Final energy consumption by buildings sub-sectors [27].
Buildings 15 00938 g003
Figure 4. The residential building stock shares according to the construction period [27].
Buildings 15 00938 g004
Figure 5. Photographs of the mineral wool insulation of the case study building during the construction stage in 2019: (a) south-east; (b) south-west.
Buildings 15 00938 g005
Figure 6. The case study building: (a) southwest 3D view; (b) southeast 3D view; (c) ground floor 2D layout; (d) attic 2D layout.
Buildings 15 00938 g006
Figure 7. The horizontal ground heat exchanger distribution from the basement of the case study building: (a) the site plan representing the 4 ground closed loop piles and the distance between them and the building; (b) a photograph from the building construction stage, in 2019, with the trenches dug for the closed loop pipes placement and the entrance towards the technical room in the basement for heat pump connection.
Buildings 15 00938 g007
Figure 8. NIBE F1255: (a) heat pump: (b) automation panel; (c) domestic hot water boiler.
Buildings 15 00938 g008
Figure 9. Underfloor heating placement during the construction stage for the case study building: (a) bedroom 1C; (b) bedroom M.
Buildings 15 00938 g009
Figure 10. Photovoltaic panels for the case study building: (a) roof close-up after instalment; (b) building view during instalment.
Buildings 15 00938 g010
Figure 11. The case study building Revit model used for quantities assessment and thermal loads pre-calculations.
Buildings 15 00938 g011
Figure 12. Yearly energy consumption and production for the case study building: A, total electrical energy consumption; B, electrical energy used by the heat pump for heating; C, thermal energy output from the heat pump; D, electrical energy output from the photovoltaic panels.
Buildings 15 00938 g012
Figure 13. The CO2 emissions block diagram for the building life cycle.
Buildings 15 00938 g013
Figure 14. The CO2 emissions for each life cycle sub-stage for the case study building in percentages.
Buildings 15 00938 g014
Figure 15. The CO2 emissions for the construction stage split into sub-stages.
Buildings 15 00938 g015
Figure 16. The CO2 emissions for the operation stage split into sub-stages.
Buildings 15 00938 g016
Figure 17. The CO2 emissions for the demolition stage split into sub-stages.
Buildings 15 00938 g017
Figure 18. The CO2 emissions for each of the building stages with the carbon sequestration from the vegetation outdoor area and the total carbon footprint of the case study building.
Buildings 15 00938 g018
Figure 19. The CO2 emissions for the HVAC operational sub-stage, from 1989 onwards, for heating with firewood (F) or natural gas (G) and for the case study building (CSB) and passive house (PH).
Buildings 15 00938 g019
Figure 20. The CO2 emissions shares for the construction, operation, and demolition stages from 1989 onwards for heating with firewood (F) or natural gas (G) and for the case study building (CSB) and passive house (PH).
Buildings 15 00938 g020
Figure 21. The insulation thickness required in concordance with the energy reduction required to reach Class A+ of energy performance for older existing buildings.
Buildings 15 00938 g021
Figure 22. The CO2 emissions reduction for the HVAC operational sub-stage by using a heat pump to the detriment of gas or firewood boilers for different energy performance classes for single-family residential buildings in Romania.
Buildings 15 00938 g022
Figure 23. The CO2 emissions reduction for the operational stage by using a heat pump and photovoltaic panels for the case study building.
Buildings 15 00938 g023
Figure 24. The cost shares for construction, operation, and demolition stages for Energetic Classes B, A, and A+ for heating with electricity (E) or natural gas (G) and for the case study building (CSB) and passive house (PH).
Buildings 15 00938 g024
Table 1. Housing stock in Romania for 2019–2023 [28].
YearNew Built HousesRepurposed HousesRedesignated HousesDemolished HousesExisting Houses
202370,95757557344219,722,223
202273,33884987556559,655,685
202171,40565968853049,587,153
202067,816100793145449,587,153
201967,4881027106958009,587,153
Table 2. Energy performance characteristic of residential buildings [31].
YearVertical TransmittanceHorizontal TransmittanceEnergy Consumption
U (W/m2 K)U (W/m2 K)(kWh/m2 year)
<19601.40–2.000.90–1.80150–400
1961–19801.35–1.900.90–1.80150–400
1981–19891.25–1.600.90–1.80150–400
1990–19941.10–1.500.90–1.80150–350
1995–19990.80–1.500.90–1.80140–280
2000–20230.70–1.500.90–1.80120–230
>20230.250.2040–80
Table 3. Case study building envelope thermal characteristics.
No.Building ComponentThermal Transmittance UUnit
1Exterior wall0.17 *W/m2 K
2Roof0.13 *W/m2 K
3Ground slab0.27 *W/m2 K
4Windows and exterior doors0.99 **W/m2 K
* Thermal transmittance calculated according to [30]. ** Thermal transmittance from product data sheets.
Table 4. Building materials quantities for the case study residential building.
No.MaterialQuantityUnit
1Concrete192.960t
2Brick95.745t
3Cement1.600t
4Limestone4.500t
5Mortar14.400t
6Gravel18.600t
7Stone14.500t
8Steel4.980t
9Ceramic tiles1.121t
10Paint300kg
11Glass2.025t
12Wood7.000t
13Organic materials2.180t
14Aluminium100kg
15Copper25kg
16Photovoltaic panels16pieces
Table 5. Monthly electrical energy consumption for 2020–2024 for the case study residential building.
Month20202021202220232024
A *B **A *B **A *B **A *B **A *B **
January8506001188938800550590360828568
February550300550300433183644404520265
March400150450200500250541321525285
April30050300150320170454314340190
May25001800279033203320
June20002530222024903070
July15001480151024302630
August36003690240024902110
September4001503511012904028040340140
October45020045020036411433590430200
November800550850600485235635370589349
December1000750900650640390799459735505
* Total electrical energy consumption in kWh; ** electrical energy used by the heat pump for heating in kWh.
Table 6. Monthly energy production from the HP and PV panels for 2020–2024 for the case study residential building.
Month20202021202220232024
C *D **C *D **C *D **C *D **C *D **
January2400-3752-2200-14402782272301
February1200-1200-732-16162551060470
March600-800-1000-12846711140655
April200-600-680-1256586760855
May0-0-0-08510895
June0-0-0-07920971
July0-0-0-09210933
August0-0-025309250871
September600-404-160609160855560723
October800-800-456669360694800658
November2200-2400-94033414802841396357
December3000-2600-156030618362592020143
* Thermal energy output from the heat pump in kWh; ** electrical energy output from the photovoltaic panels in kWh.
Table 8. Parameters for the construction itself, Cc, from the existing literature [38].
ParameterDescriptionValueUnitEquation
AgfGross floor area-m2(6)
EeElectrical energy consumption for construction-kWh/ m2
CEFeeEmission factor for electrical energy in Romania0.265tCO2/MWh
VleVolume of excavated and landscaped earth -m3(7)
CEFleEmission factor for excavation and landscape2.15kg CO2/m3
QcitQuantity of transported material in site-t(8)
CEFcitEmission factor for in site transportation0.190tCO2/km
dHorizontally or vertically transported distance-km
Table 9. CO2 emissions for each life cycle sub-stage for the case study building.
No.Life Cycle StageLife Cycle Sub-StageValuePercentUnit
1ConstructionMaterials Production172.3466.99%tCO2
2Materials Transportation3.021.17%tCO2
3Building Construction2.180.85%tCO2
4OperationHVAC66.2525.75%tCO2
5Lighting3.311.29%tCO2
6Electrical Equipment6.632.58%tCO2
7DemolitionBuilding Demolition2.510.98%tCO2
8Waste Transportation1.030.40%tCO2
Table 10. CO2 emissions factors from electrical energy generation in Romania and other countries worldwide for the last 5 years (2019–2024) according to Carbon Database Initiative [46].
YearGrid Electricity Emissions FactorsUnit
RomaniaGermanyUKUSAChina
20240.2780.3790.2070.3740.660kgCO2/kWh
20230.2700.3580.2070.3880.676kgCO2/kWh
20220.2600.3250.1930.3770.692kgCO2/kWh
20210.3090.3570.2120.4010.703kgCO2/kWh
20200.3250.4110.2330.4240.715kgCO2/kWh
20190.3370.4150.2550.4220.697kgCO2/kWh
Table 11. Insulation required for reducing the energy consumption of existing buildings in lower-energetic classes.
YearEnergy Consumption for HVACEnergy Performance ClassEnergy Consumption Reduction Required to Reach:Existing Insulation
Thickness
Required Insulation Thickness
Class BClass AClass A+
kWh/m2×yearMWh/yearClasskWh/m2×yearcmcm
<198927544C87181208115
1990–199425040C62156183215
1995–199921033.6C22116143315
2000–202317528B-81108510
>2023609.6A+---150
CSB *31.255A+---150
PH **152.4A+---200
* Case study building; ** passive house.
Table 12. Cost detailed for the construction stage of the building, from 2019.
No.ChapterDescriptionValueUnit
1LandLand acquisition14,000EUR
2UtilityServices connections700EUR
3DesignRequired studies600EUR
4Authority approvals1800EUR
5Project2200EUR
6Structure and ArchitectureExcavation *5800EUR
7Structure and envelope20,500EUR
8Roof, porch, garage7800EUR
9Plastering6700EUR
10Walls finish3400EUR
11Envelope insulation8500EUR
12Windows and doors7800EUR
13Bathroom tiles and furniture8230EUR
14Kitchen tiles and furniture4500EUR
15Landscape vegetation2500EUR
16Landscape pavements3200EUR
17Property Fence5500EUR
18Building ServicesSanitary and plumbing4000EUR
19Electrical6900EUR
20HVAC13,500EUR
21Photovoltaic panels9500EUR
* Including trenches for heat pump horizontal ground heat exchanger.
Table 13. Worldwide carbon footprint results for single-family residential buildings.
Ref.CountryGross Floor AreaLifespanCarbon Footprint
(m2)(Years)(kgCO2/m2 Year)
[49]Sweden1801002
[50]USA228504.1
[51]Portugal1325013
[52]Australia2276013.5
[53]Scotland1405016
[54]Portugal2607516
CSB *Romania1605016.22
[55]Switzerland2265018.5
[56]Japan2605024.8
[57]Lithuania8110028.6
[58]USA20310032
CSB **Romania1605032.16
[59]USA191.57532.2
[60]Columbia1405032.7
[61]Spain2224835
[62]Slovakia16810036.2
[63]Turkey8145039
[64]China1165063.3
[65]UK1305069.9
[66]Australia245100124.7
* Case study building results considering carbon sequestration from vegetation. ** Case study building results without carbon sequestration from vegetation.
Disclaimer/Publisher’s Note: The statements, opinions and data contained in all publications are solely those of the individual author(s) and contributor(s) and not of MDPI and/or the editor(s). MDPI and/or the editor(s) disclaim responsibility for any injury to people or property resulting from any ideas, methods, instructions or products referred to in the content.

