Article

Spatiotemporal Dynamics and Influencing Factors of Wood Consumption in China’s Construction Industry

1
School of Civil & Architecture Engineering, Xi’an Technological University, Xi’an 710021, China
2
School of Natural Resources and Surveying, Nanning Normal University, Nanning 530001, China
*
Author to whom correspondence should be addressed.
Buildings 2025, 15(6), 917; https://doi.org/10.3390/buildings15060917
Submission received: 21 February 2025 / Revised: 12 March 2025 / Accepted: 12 March 2025 / Published: 14 March 2025
(This article belongs to the Section Building Materials, and Repair & Renovation)

Abstract

Wood is a natural and high-quality material for green and low-carbon buildings, and it is increasingly winning the favor of architects and consumers against the background of “dual carbon”. Exploring the current characteristics and trends of wood consumption in the construction industry (WCCI) and identifying its influencing factors are of great value for the scientific management of WCCI and the improvement of the comprehensive utilization efficiency of wood in the construction industry. In this study, the Boston Consulting Group Matrix and Geodetector were used in combination for empirical analysis of WCCI in China from 2000 to 2021. It is found that the changes in WCCI in China present a diversified trend with significant regional differences. The WCCI market at the provincial scale in China is divided into star, lost, potential, and marginal spaces. WCCI in China has very complex influencing factors and their mechanisms of action, and the interaction of its factor pairs is manifested as bifactor enhancement and nonlinear enhancement. This study provides a great application value for rational planning of wood resource utilization and pushing buildings into a low-carbon and green future, and it inspires the government to pay more attention to the design of spatial policies rather than industry policies and more attention to the design of policy combinations rather than individual policies. In addition, in the management of WCCI under the background of ecological civilization, it is necessary to escape the set pattern of the wood industry and force more use of wood in buildings in the design of constraint policies for non-wood building materials (such as glass, aluminum, steel, cement, and other high-carbon and energy-intensive building materials).

1. Introduction

1.1. Research Background

Against the backdrop of the global response to climate change and moving towards the goal of “dual-carbon”, the construction industry, a major consumer of energy and resources and a heavy producer of carbon emissions, is facing unprecedented pressure for transformation [1]. Unlike traditional building materials such as steel and cement, wood enjoys unique advantages in reducing carbon emissions and resource consumption and is becoming a preferred choice for the development of green and low-carbon buildings [2,3]. And with the improvement of living standards, people put forward higher quality requirements for the living environment, more in pursuit of green, healthy, and natural living space. The natural texture, excellent thermal insulation performance, and ability to regulate indoor humidity of wood perfectly meet this need, making it more widely used in the construction market [4]. As a green and low-carbon building material, wood has remarkable characteristics in multiple aspects, meeting people’s needs for a green, healthy, and natural living space. In terms of environmental protection, wood is a building material that can sequester and store carbon and is biodegradable. From a performance perspective, it is an insulating, sound-proofing, and supportive building material with excellent strength and toughness. In the realm of aesthetics and health, wood is a natural building material with a beautiful natural texture and is beneficial to human health. Wood is an ancient yet modern building material, and it is making a comeback as a natural choice for new buildings with the goal of enhancing sustainability.
According to the Food and Agriculture Organization of the United Nations, global wood consumption in the construction industry has been relatively stable over the past few decades but with significant regional variations, and its annual consumption accounts for about 30–40% of the total consumption of wood. In developed countries such as the United States and Canada, due to their architectural styles and traditions, the use of wood in construction is more extensive, with its consumption accounting for about 50% and still increasing [5,6]. In developing countries, the demand for wood in the construction industry is growing rapidly as urbanization and industrialization accelerate. Overall, given the widespread use of wood in the construction industry, a deep understanding of the data, current characteristics, and influencing factors of wood consumption in construction is of great significance for the rational planning of wood resource utilization and promoting the low-carbon and green transformation of buildings.

1.2. Literature Review

There are three research interests for this topic. The first is in the environmental footprint analysis of wood consumption in the construction industry, focusing on the possible environmental benefits of using wood as an alternative for energy- and resource-intensive materials such as cement, glass, and steel in the construction industry [7,8]. Scholars evaluate the carbon reduction effect [9,10], environmental footprint, or environmental benefits [11,12] created by the use of wood in buildings from a full life cycle perspective. The second is to investigate the attitudes of different interest groups towards the use of wood in construction, including experts [13,14], architects [15], residents (consumers) [16], suppliers, and developers [17]. Scholars analyze their perceptions, acceptance, and reasons for wood architecture and try to make sense of the barriers and opportunities in the use of wood in construction [18,19]. The third is to explore the strategies and methods of wood building design in the new era [20]. To rule out the risk of uncertainty, architects have proposed a series of new adaptive design strategies for modern buildings. For example, Xu [21] found that building façade acceptance is highest when the wood coverage is 65%, and 35–50% wood coverage is the optimal solution for building façade design in China when considering the dual goal constraints of wood conservation and high acceptance. In a questionnaire survey, Ratnasingam [22] identified a specific preference of Malaysian architects for architectural design with wood and wood products—wood is more often used in non-structural rather than structural building components.
For research methods, most scholars currently perform studies by qualitative analysis, including case studies, questionnaires, and semi-structured interviews. Quantitative studies are still scarce, and they are mainly concentrated in the areas of wood consumption prediction and carbon footprint assessment of wood consumption [23]. For example, Blasco [24] discussed the key factors affecting wood selection in material parameter design for green public procurement in the analysis of five public procurement cases by Finnish municipal authorities. Aaltonen analyzed the views of non-wood participants (i.e., managers and executives of construction firms in the areas of procurement and project planning) on the use of wood in construction by semi-structured interview [25]. Loucanová analyzed the main reasons for Czechoslovakian customers to choose wood as an alternative to silicate building materials and their consumption perceptions using the Kano model [26]. Notably, in the digital era, the implementation technology of Industry 4.0 elements in the field of wood building design has also attracted the attention of scholars [27], and a methodology based on building information modeling (BIM) for the digital transformation of the wood building supply chain has been proposed [28,29].
For research scales, most scholars focus on case studies of buildings, analyzing the wood consumption characteristics and environmental benefits of buildings through tracking research or simulation estimation of one or more buildings. It should be noted that studies at regional and national scales have emerged. For example, Cordier [30] quantified the characteristics of wood consumption in residential buildings in Quebec and its potential environmental impact. While such large-scale studies have important inspirational value for spatial policy design, they are still facing significant challenges due to the difficulty in obtaining and predicting wood consumption data at the regional scale and are therefore marginalized [31].

1.3. Research Gaps and Questions

In general, scholars have conducted in-depth research on the application and consumption of wood in the construction industry, design solutions, environmental effects, and other fields using a variety of methods at multiple scales and presented constructive research findings. However, there are also significant limitations in existing research. For example, firstly, the current lack of accurate and systematic data support from industry and academia on the consumption of wood in the construction industry has resulted in a continued paucity of papers using quantitative research methods, which mismatches the real-world needs for evidence-based policymaking. Secondly, the current research is mainly a micro-analysis at the building scale from the perspective of consumers, architects, suppliers, and other stakeholders, while macro-analysis at the regional scale from the perspective of government administrators is still scarce, with many factors affecting wood consumption not explored yet in depth. It not only constrains the efficient and sustainable use of wood in the construction sector, but also does not match the real needs of management policies and spatial policy design.
This paper attempts to provide a basis for government administrators to develop policies related to wood substitution, green building, and low-carbon building by quantitatively analyzing the quantity of wood consumed in the construction industry and its influencing factors in different provinces and regions, based on China as the study area. This study mainly addresses the following two issues: The first is to analyze the quantity and changing characteristics of wood consumption in the construction industry in different provinces of China using spatial econometric models based on officially released statistical data. The second is to analyze the impact of different factors on wood consumption in the construction industry using the Geodetector model based on indicators selected from a variety of perspectives, including economic and social development needs, wood supply capacity and potential, technological advances, and substitution effects of other building materials.

2. Materials and Methods

2.1. Study Area

The study area covers 31 provincial-level administrative regions in China, with Hong Kong, Macao, and Taiwan excluded due to incomplete data. With the rapid and high-quality development of the economy and society, China will have an increasing demand for wood, leading to a growing contradiction between wood supply and demand. Currently, as the world’s largest consumer of wood, China has a high degree of external dependence on wood consumption, leading to increasingly severe wood safety issues. The consumption of wood nationwide is mainly in the fields of construction, furniture manufacturing, and papermaking, with construction consuming more than 50% for a long time. In addition, China’s long-standing cultural and historical tradition of applying wood to the construction of buildings has put its wooden buildings in an important position in the architectural types around the world, which are known as “solidified poems and three-dimensional paintings” for their unique modeling art. Therefore, wood consumption in the construction industry in China is typical in the world, and the empirical research conclusions on China will provide an important reference for wood consumption management in the construction industry in other countries and regions.

2.2. Research Methods

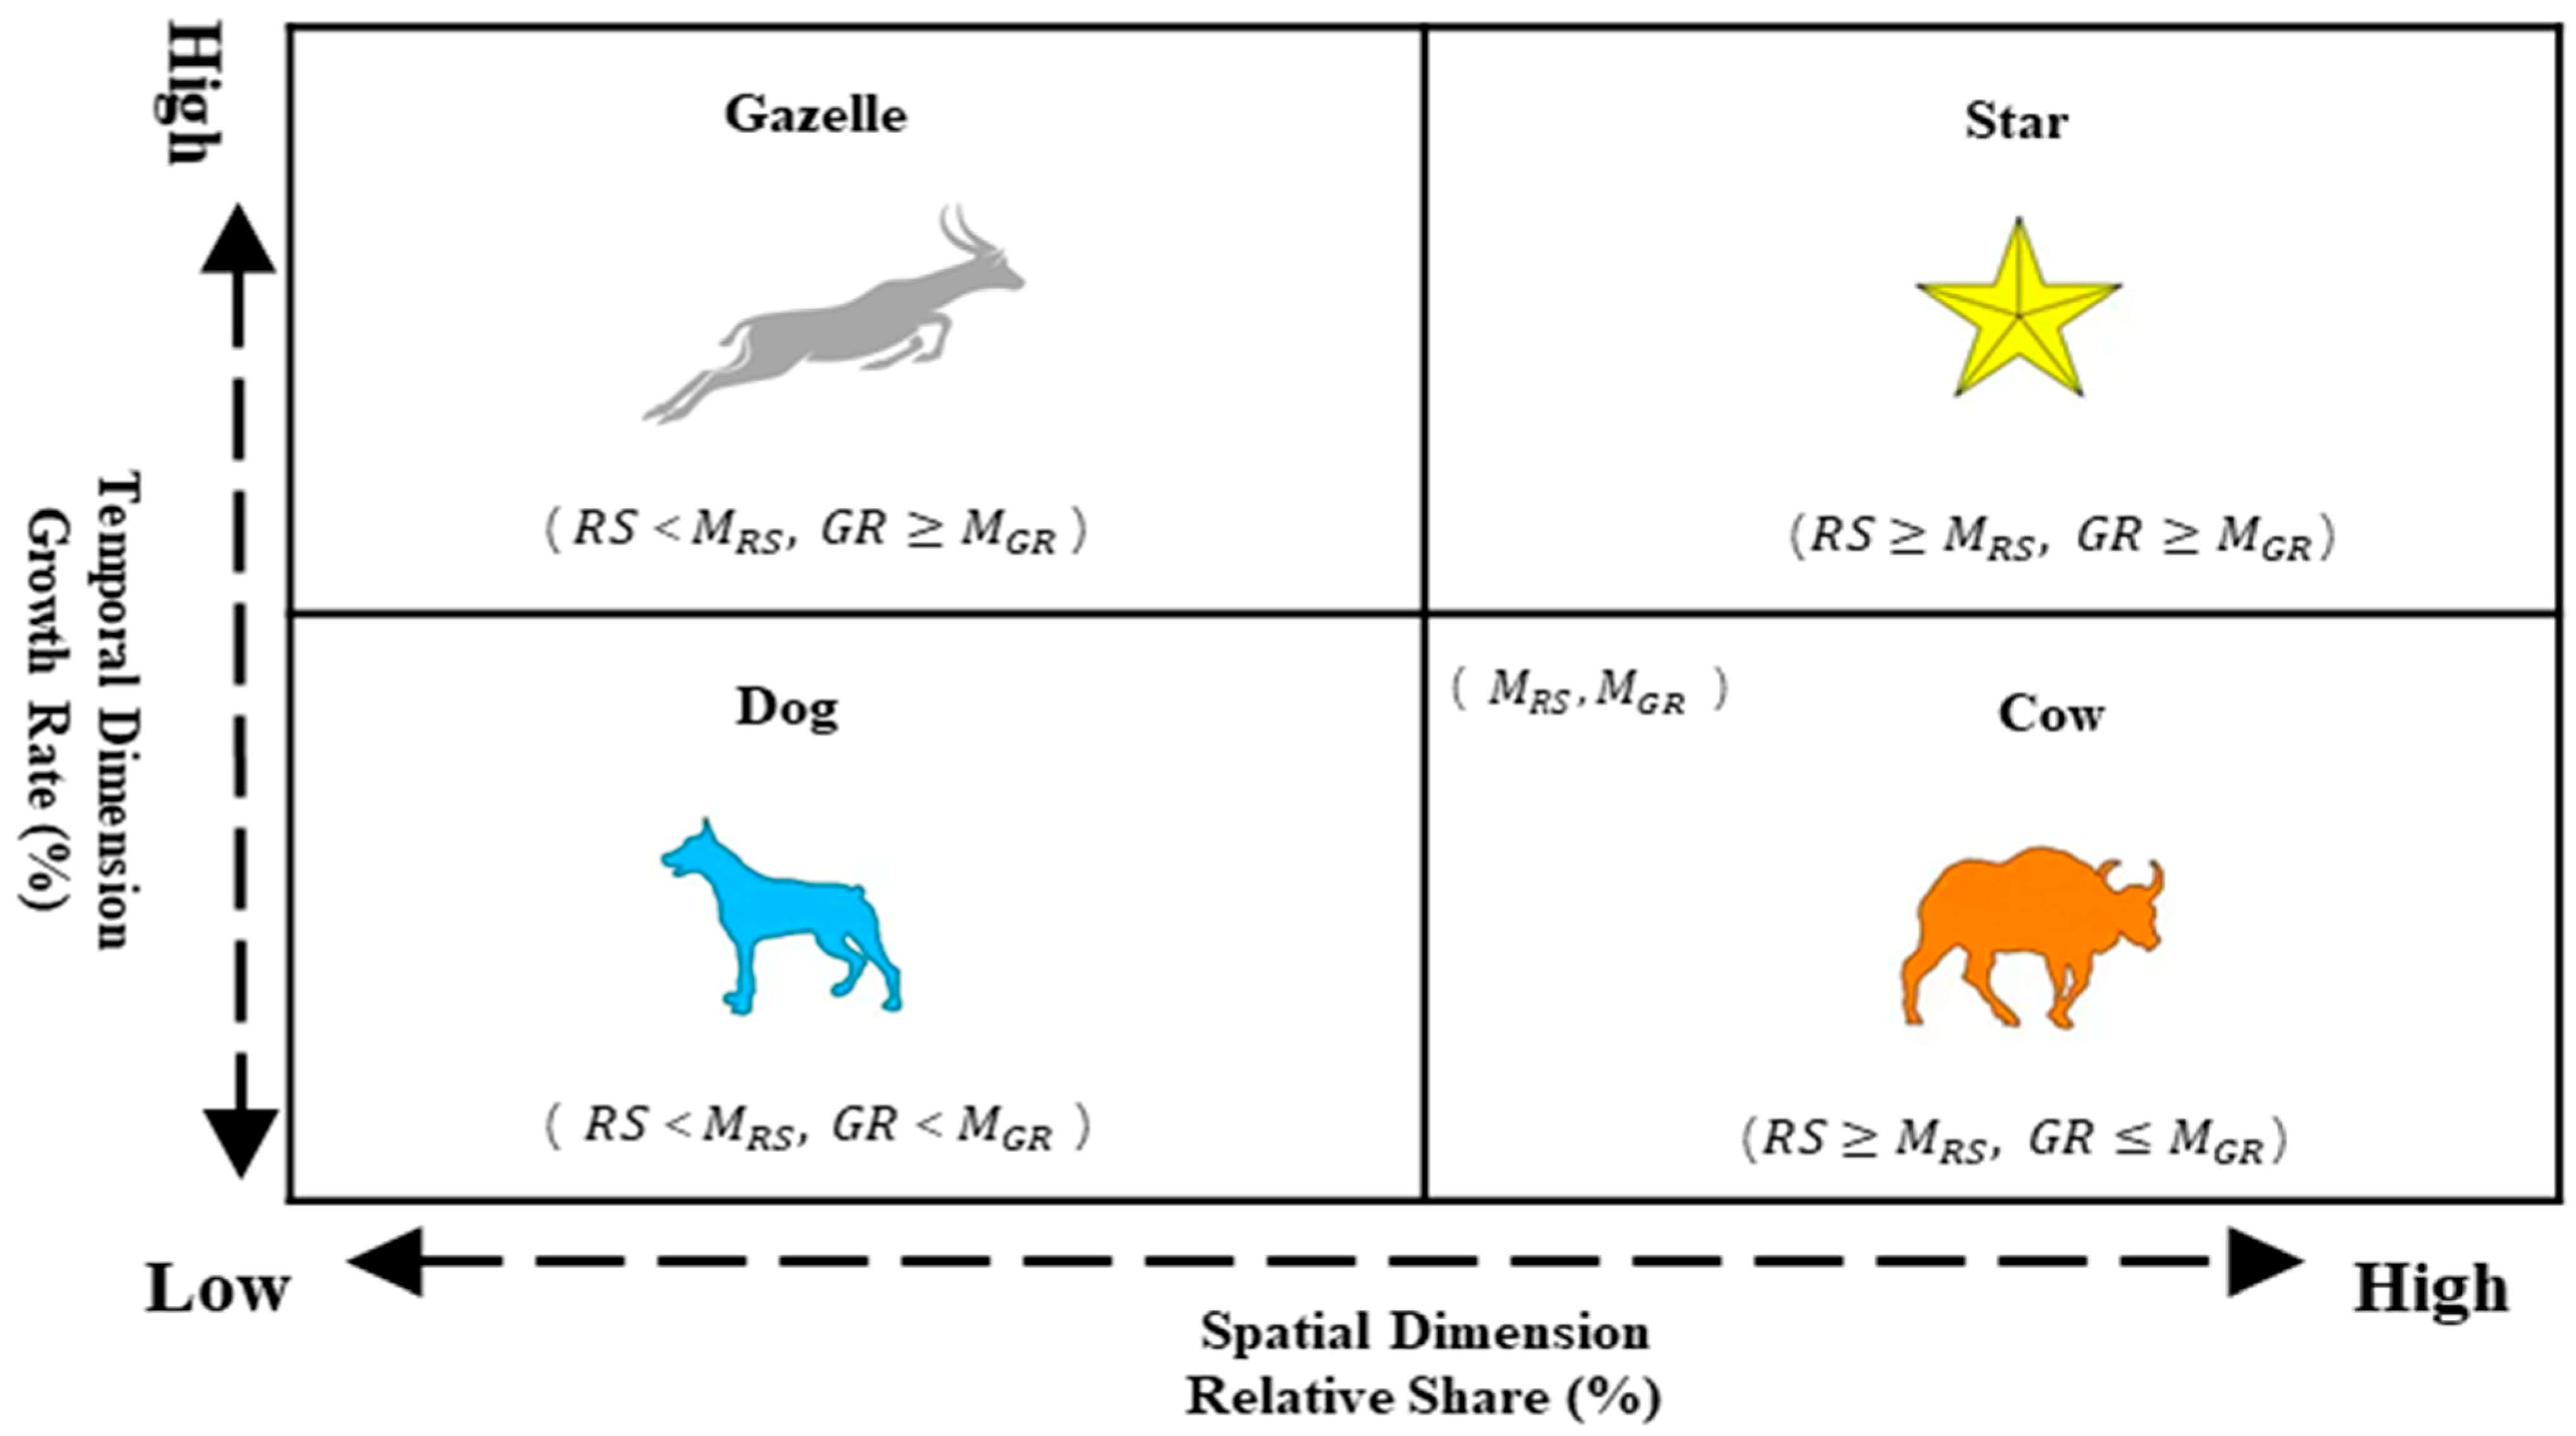
2.2.1. Boston Consulting Group Matrix (BCGM)
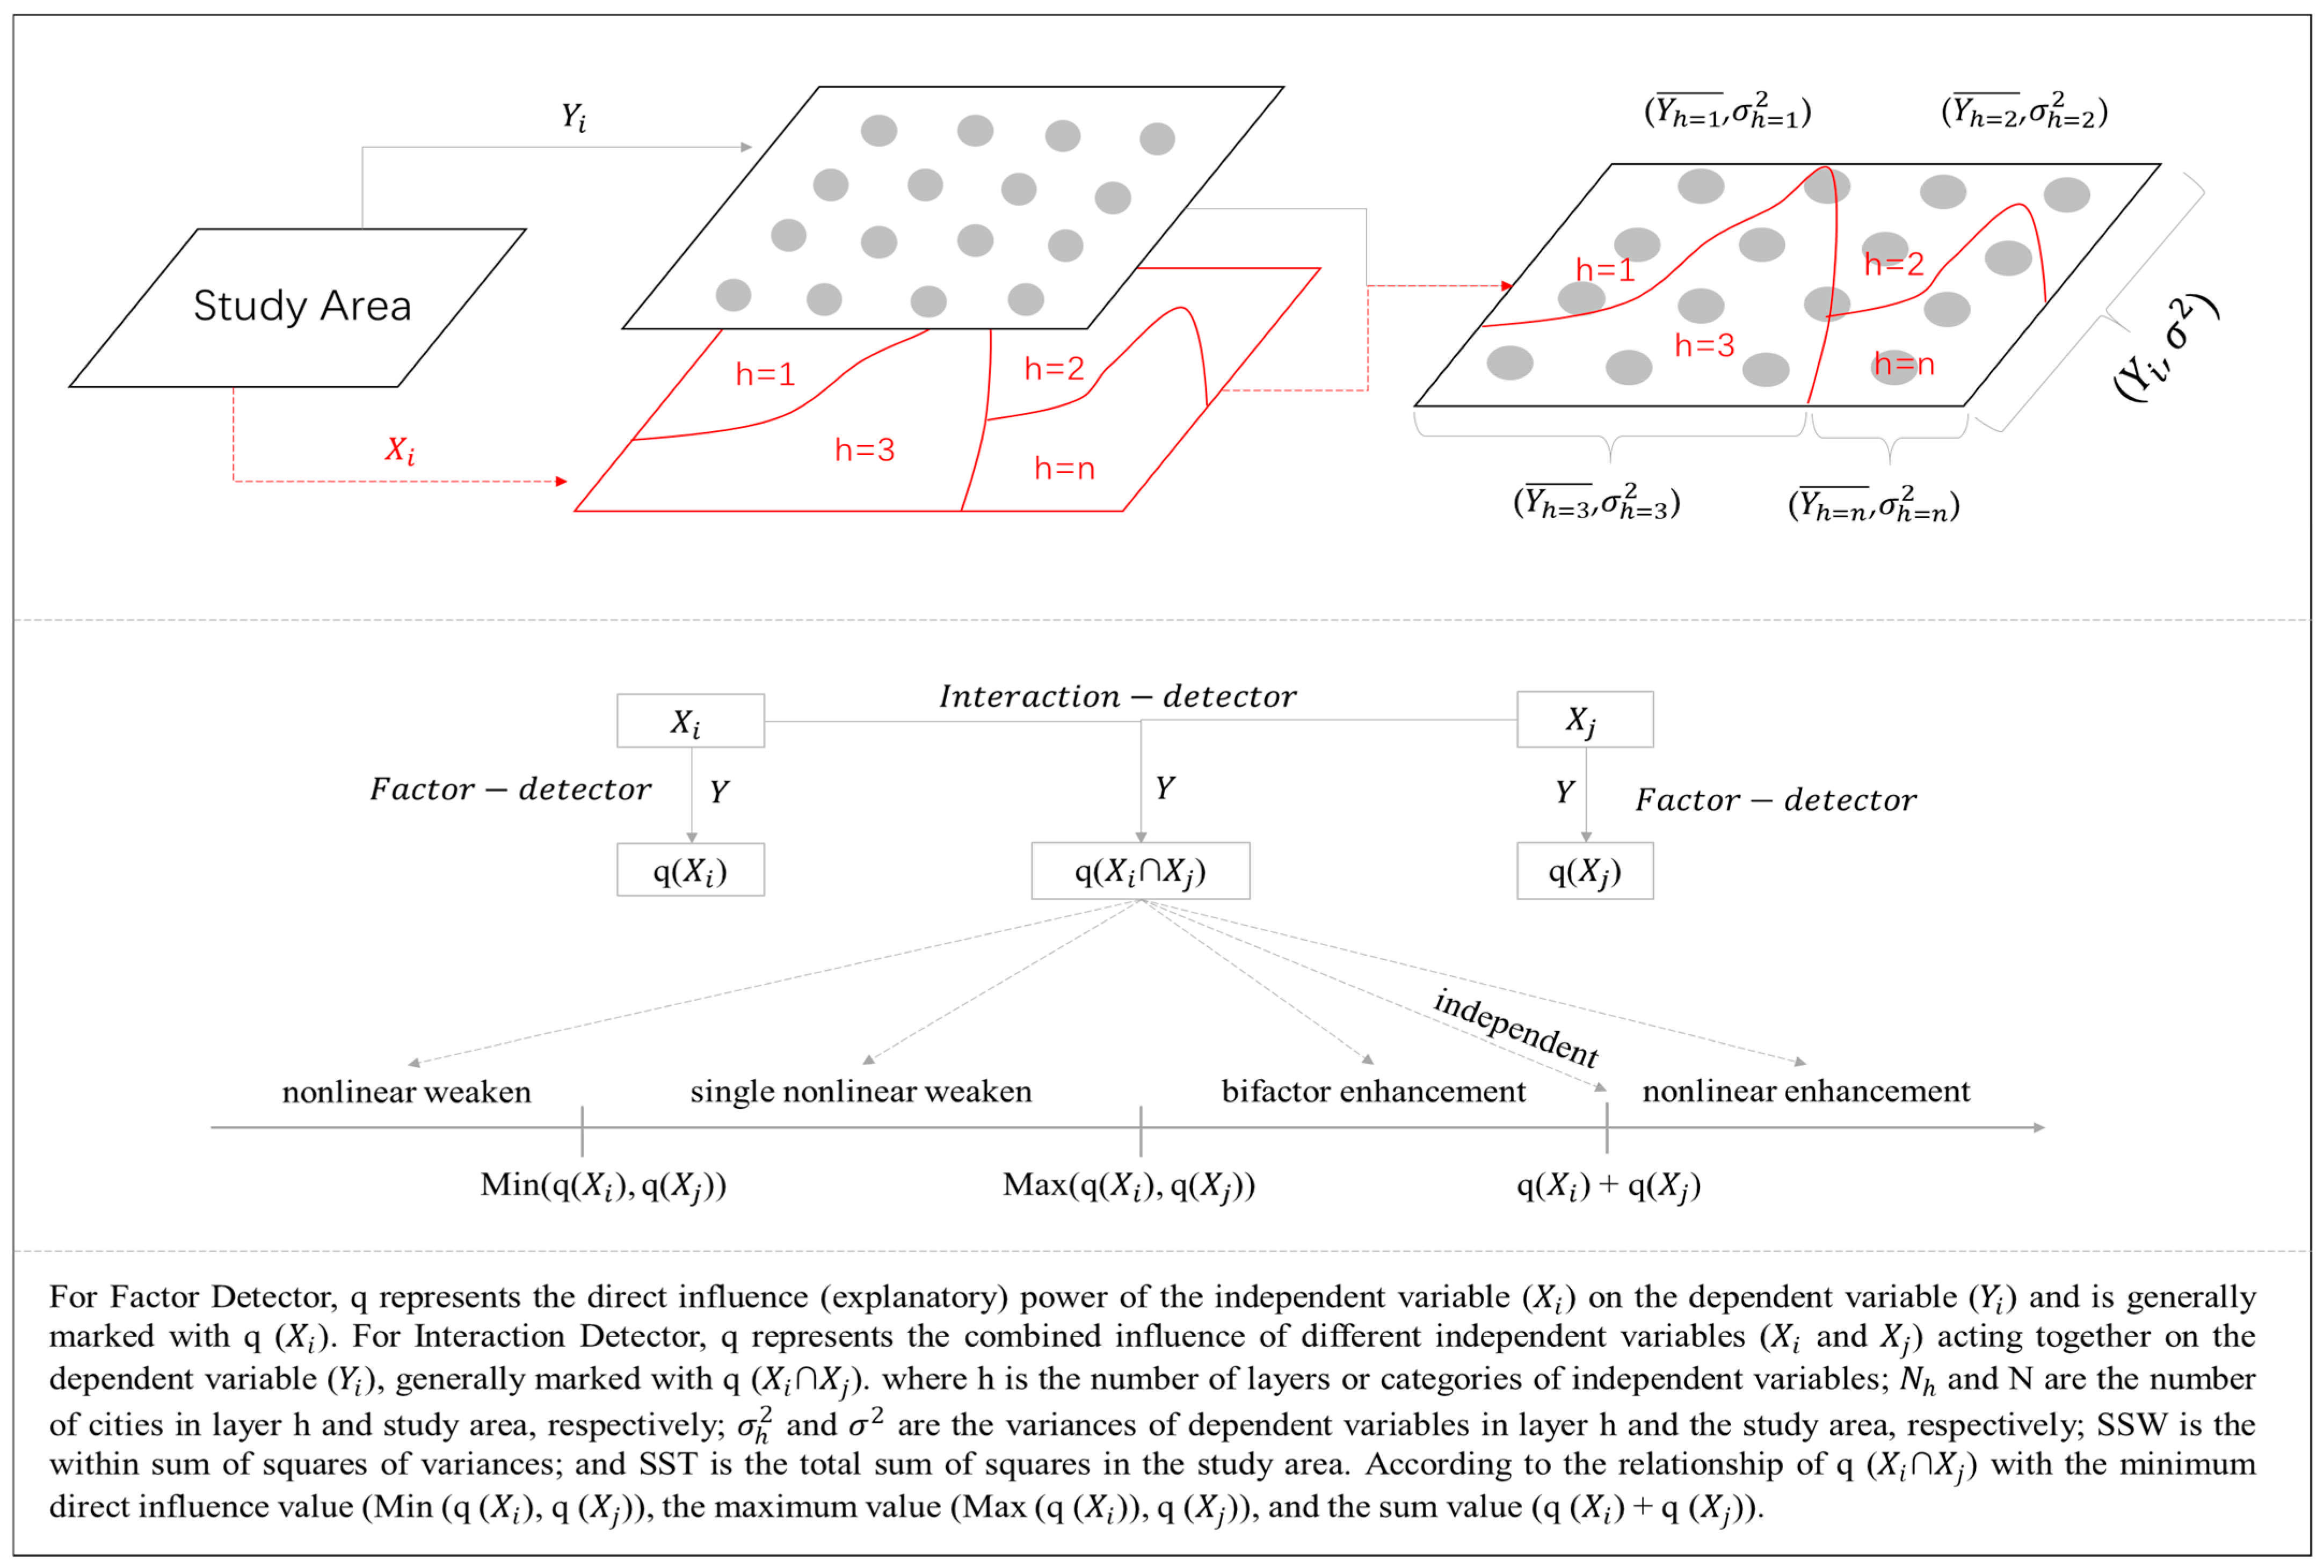
China is a vast country with an uneven distribution of forest resources in different regions. Influenced by regional and ethnic cultures, the demand for wood use in the construction industry varies. In addition, despite a strong historical and cultural tradition of wood architecture, the construction of buildings in China has been heavily influenced by globalization during its rapid industrialization and urbanization, resulting in a constant dynamic change in wood consumption. Therefore, the analysis of WCCI should take into account both the differences between different geographic areas and the influence of changes over time. In this study, relative share (RS) is used to represent the relative position of different provincial WCCIs in the country, and growth rate (GR) is used to represent the change trend of WCCI in time series. They are calculated as follows [32]:
Relative   Share = W C C I i e n d W C C I m a x e n d × 100 %
Growth   Rate = W C C I i e n d     W C C I i s t a r W C C I i s t a r 1 × 100 %
where  W C C I i e n d  and  W C C I i s t a r  are the WCCI values for the end and base periods, respectively, for the  i -th provincial administrative region, and  W C C I m a x e n d  is the maximum value of WCCI in the end study area (31 provinces). RS and GR are integrated using BCGM, and their mean values are used as the coordinate system to split the thresholds (marked with  M R S  and  M G R , respectively) to divide the spatiotemporal dynamics of WCCI into four categories. BCGM and the concept of gazelle enterprise are often used in the field of enterprise development strategy and management [33]. In this study, the spatiotemporal dynamics of WCCI are divided into four categories, namely star, gazelle, cow, and dog, based on BCGM’s quantitative analysis approach (Figure 1). The star represents wood consumption in the construction industry in large quantities and still in rapid growth, which is a key market area of wood consumption worthy of high attention. The cow represents high consumption, but at a slower rate of growth or even in a state of reduction. The gazelle represents a very low consumption of wood, but with a rapid growth, which may be a potential market area for wood consumption in the future. The dog represents a small amount of wood consumption and a relatively low growth rate, even in the process of reduction, which is a marginalized lost area.

2.2.2. Geodetector

Theoretically, the differences in WCCI in different provinces are influenced by many factors, and there may be complex interactions between different factors. The Geodetector model is used to analyze the influencing factors of WCCI in this empirical study. The analysis process is as follows: The first step is to discretize the data of the influencing factors using the quantile classification method of Python. Given that the study area covers 31 provinces, a high number of categories would result in few provinces in each category, resulting in a lack of sufficient representativeness. Therefore, this study limits the classification to 2–6 categories. The second step is to import the discretized data ( X i ) and the WCCI data ( Y i ) to calculate the direct influence and interactive influence, respectively, using the Factor Detector and Interaction Detector, and mark them as q ( X i ) and q ( X i X j ) correspondingly. Higher similarity between the spatial patterns of the impact factors and WCCI results in higher values of them [34,35]. The maximum value is 1, with larger values representing a stronger driving force of the factor; the minimum value of zero represents that the influencing factor has no effect on WCCI. The interactions are classified into five types [36] based on the comparison of the values of q ( X i ) and q ( X i X j ) (Figure 2). The third step is to optimize and screen the calculation results. Since the data discretization affects the computational results of the second step, the optimal solution is selected from the discretization schemes 2–6 as the final analytical result of this study. The  q  index is calculated as follows [37]:
q = 1 h = 1 l N h σ h 2 N σ 2 = 1 S S W S S T ,   S S W = h = 1 l N h σ h 2 ,   S S T = N σ 2

2.3. Indicator Selection and Data Sources

The WCCI data are sourced from the China Statistical Yearbook on Construction, while the influencing factor data are from the China Statistical Yearbook and the China Forestry and Grassland Statistical Yearbook. Wood is an important strategic resource for social sustainability, and its consumption is influenced by market demand and supply, as well as policy support, industry development, technological advances, and alternatives. Therefore, in this study, a total of 16 influencing factors are selected from four areas (Table 1).
First, high-quality economic and social development is a core requirement for wood, and four indicators are selected in this regard. Since resource consumption is closely related to economic development, GDP is used in this study to represent the demand for consumption of wood, the most common natural resource, created by the economic development of different provinces in China [38]. China is still in the process of rapid urbanization and industrialization, so the urbanization rate of the population and GDP per capita are used to represent the demand for wood consumption they have created, respectively [39]. Due to the very limited wood resources in China and the imbalance between supply and demand, the price of wood is relatively high, and thus, the consumption of wood construction needs a higher income level to support it. In this study, per capita disposable income is used to represent the ability of Chinese provinces to pay for WCCI.
Second, the factors supply capacity of wood and policy support directly affect the share of wood consumption available to the construction industry. Four indicators are selected in this regard: despite the huge volume of wood imports, China has been committed to self-reliance, encouraging enterprises to prioritize the use of domestically produced wood and providing significant policy support. The consumption of wood follows the principles of location and proximity because of its huge logistical costs. Therefore, the wood production in each province is used to represent the actual supply in this study. Since China has long implemented a policy of prohibition against forest logging and established reserve bases and artificial-forest-raising systems, its potential wood supply mainly comes from artificial forests rather than natural forests. In this study, it is represented by the artificial forest area. Artificial forest raising requires a large and long-term investment, most of which comes from the government in China, so the amount of forestry investment is used to represent the actual government support for the increase in wood supply potential. In addition, due to the significant share of local government investment in China’s forestry industry, the fiscal self-sufficiency rate of local governments (calculated by dividing fiscal revenue by fiscal expenditure) is used to represent their policy support capabilities.
Again, wood consumption is closely related to the quality of the development of the construction industry, and four indicators are considered in this regard. Profitability and efficiency are prerequisites for construction firms to use wood as an alternative to concrete and steel. In this study, the profitability of construction firms is measured using the profit and tax rate on assets in the construction industry, and the comprehensive development efficiency is represented using the per capita completed area. Technological advances directly determine the comprehensive utilization level of wood. In this study, the power equipment rate in the construction industry is used to represent the technical level of the construction industry, and the investment of R&D expenses is used to represent the innovation ability of construction enterprises.
Finally, wood alternatives significantly enhance the diversity of choices available to consumers, changing their consumption habits and increasing the elasticity of their demand, thus affecting the market share of wood consumption in the construction industry. Wood is commonly used in four areas in the construction industry. One is in the area of structural building elements, including beams, columns, and roof frames. The second is in the area of formwork works, including log formwork and plywood formwork. The third is in decoration, including flooring, doors and windows, wainscoting, decorative lines, or façade veneers. The fourth is in other elements, including scaffolding, building models, and waste wood particle fillers. In building construction and decoration, steel, concrete (cement), glass, aluminum, and other materials are generally used instead. Therefore, this study uses the amount of steel, cement, flat glass, and aluminum consumed in buildings to represent the impact of alternatives on WCCI.

3. Results

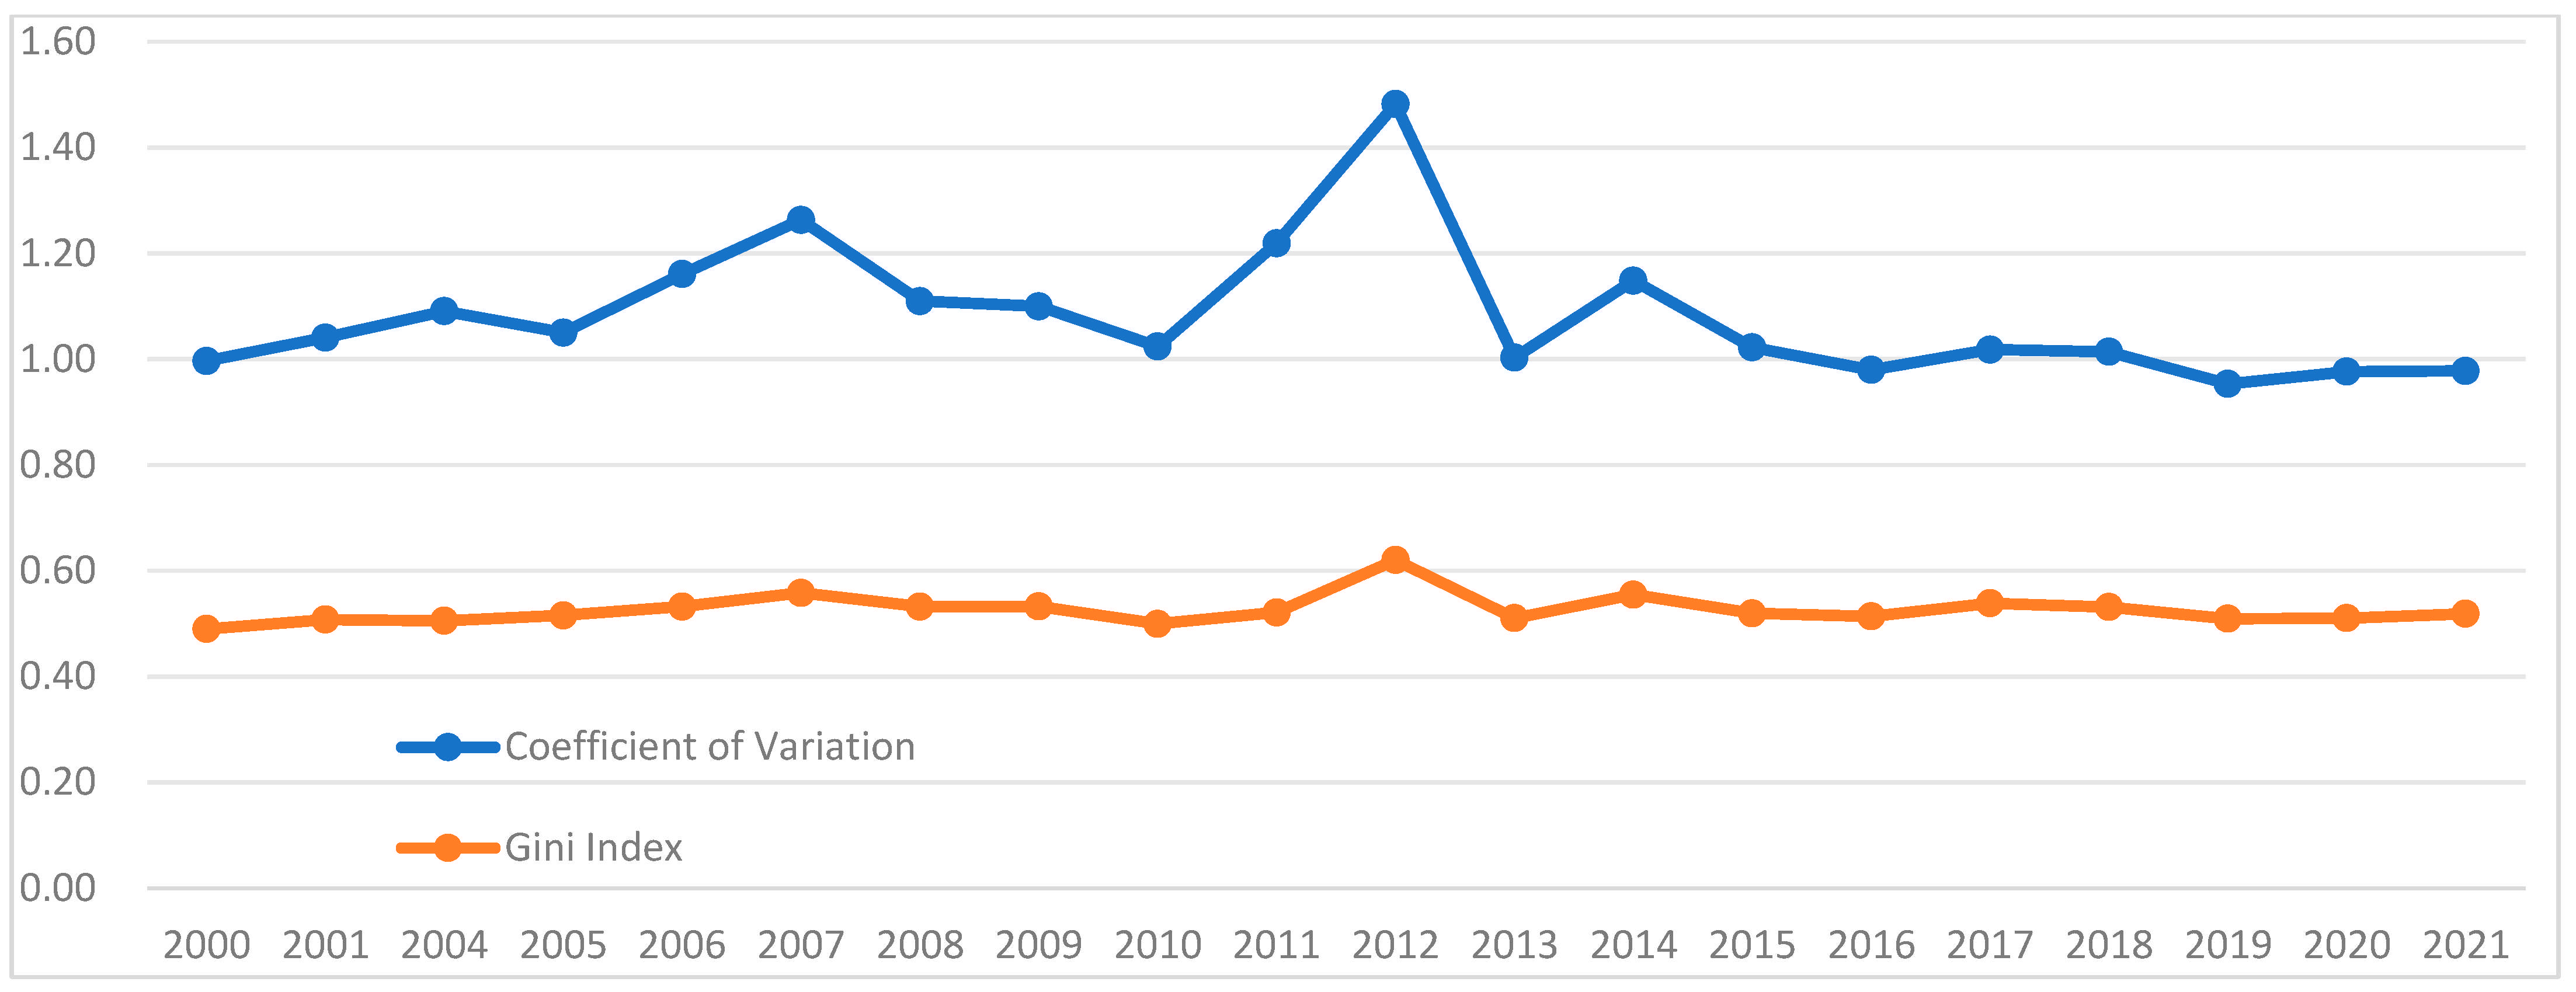
3.1. Overall Characteristics of Wood Consumption in the Construction Industry

The wood consumption in China’s construction industry was 36.81 mcm in 2000, growing to 557.75 mcm in 2021. The average annual growth of WCCI in China from 2000 to 2021 was 25.22 mcm, with an average growth rate of 13.82%, generally showing a rapid rise with fluctuation (Figure 3). In some years such as 2013 and 2015, WCCI showed a small decline, which may be the result of the influence of economic conditions, policy adjustment, industry development, and other factors. The recovery of and increase in WCCI in China mainly benefited from real estate in 2016, when China launched a development model of raising prices to reduce inventory, leading to a new period of rapid growth of real estate. Real estate destocking has been the main task of the central and local governments since 2016, and they have introduced policies, such as reducing the down payment ratio, increasing the loan limit of the provident fund, and granting purchase subsidies, to stimulate housing demand and move excess inventory. The destocking policy has driven up real estate prices and spawned a new round of a real estate market boom, which in turn has driven the expansion of the construction industry and led to the continuous rise in WCCI.
From 2000 to 2021, Hubei showed the largest growth in WCCI, while Qinghai had the smallest. Hubei saw a growth from 142.89 mcm to 6136.71 mcm, with an increased wood consumption reaching 5993.82 mcm, an average annual increase up to 287.62 mcm. Qinghai grew from 7.57 mcm to 25.46 mcm, with an increased wood consumption of only 17.89 mcm, an average annual increase of only 0.82 mcm. Notably, Fujian, Sichuan, Jiangsu, Zhejiang, Anhui, and Hunan led the nation in growth, all over 3000 mcm. Heilongjiang, Ningxia, Inner Mongolia, and Xizang had very little growth, all below 100 mcm, with an annual average of 2–7 mcm. From 2000 to 2021, WCCI enjoyed the largest growth rate in Fujian, at 19.69%, and the smallest in Heilongjiang, at only 3.62%. The average annual growth rate exceeded the national level in 12 provinces, including Fujian, Hubei, Jiangxi, Guizhou, Anhui, Shanghai, Henan, Yunnan, Hainan, Hunan, Xinjiang, and Guangxi, mostly located in the eastern and coastal regions. More than 60% of the provinces had growth rates lower than the national level, below 10% in Guangdong, Jilin, Liaoning, Qinghai, Inner Mongolia, and Heilongjiang.
In general, WCCI at the provincial scale in China from 2000 to 2021 exhibited diversified changes, with a variety of evolutionary patterns emerging including stable, growing, inverted U-shaped, M-shaped, and S-shaped. Regions in the stable pattern experienced steady but slow growth in WCCI from 2000 to 2021, including Tianjin, Hainan, Xizang, Gansu, Qinghai, and Ningxia. Regions in the growing pattern experienced rapid and significant growth in WCCI from 2000 to 2021, and they were divided into many sub-types based on the different stages of change. Shanxi, Anhui, and Fujian were characterized by steady and rapid growth, while Shanghai, Jiangxi, Hubei, Guangdong, and Sichuan were characterized by growth with fluctuation. Of note, Chongqing exhibited stepped growth, with significant changes presented approximately every five years, within which it maintained a relatively steady slow growth. Regions in the inverted U-shaped pattern showed first an increase and then a decline in WCCI from 2000 to 2021, including Beijing, Hebei, Inner Mongolia, Liaoning, Jilin, Zhejiang, Henan, Hunan, Guangxi, Yunnan, and Shaanxi. It is noteworthy that except for Liaoning and Shaanxi, the declining part of most regions in the inverted U-shaped pattern was still not yet fully developed with a short reduction stage. Therefore, it still needs to be continuously observed for a longer time whether there will be an uptrend (reversal) in the future. Regions in the M-shaped pattern were characterized by repeated rounds of first an increase and then a decline in WCCI from 2000 to 2021, including Heilongjiang and Xinjiang. Regions in the S-shaped pattern showed a characteristic of first an increase and then stabilization in WCCI from 2000 to 2021, including Jiangsu, Guizhou, and Shandong (Figure 4).
The regional heterogeneity of WCCI at the provincial scale in China has been high for a long time. The coefficient of variation from 2000 to 2021 remained around 1.0, much higher than 0.36 [40,41]. Over the same period, the Gini coefficient remained around 0.5, much higher than the standard set by the United Nations Development Programme (0.4) [42] (Figure 5). We categorized the WCCI of 31 provinces in China into high, medium, and low levels by the quantile method. Although the provinces varied dynamically in their rankings from year to year, about two-thirds remained the same. In ranking stability, Zhejiang, Guangdong, Jiangsu, Sichuan, Hunan, Hubei, and Fujian remained at the high level; Guangxi, Chongqing, Beijing, Yunnan, Shanghai, and Jiangxi remained at the medium level; and Inner Mongolia, Gansu, Tianjin, Hainan, Ningxia, Qinghai, and Xizang remained at the low level. In ranking transition, Shandong, Liaoning, and Hebei experienced a decline from high level to medium level, while Heilongjiang, Jilin, and Shanxi declined from medium level to low level, indicating hierarchical degradation. In contrast, Henan and Anhui rose from medium level to high level, while Shaanxi, Xinjiang, and Guizhou rose from low level to medium level, achieving hierarchical evolution (Table 2).

3.2. Spatiotemporal Evolution Pattern of Wood Consumption in the Construction Industry

Due to the large time span from 2000 to 2021, it is divided into two stages in this study in order to analyze the spatiotemporal evolution characteristics of WCCI in China more accurately, each with a span of ten years. In 2010, RS was the largest in Zhejiang and the smallest in Xizang (0.0035), with a mean value of 0.23. The maximum value of GR from 2000 to 2010 was 31.43% (Guizhou), the minimum value was 1.61% (Xizang), and the mean value was 15.42%. In 2021, Hubei had the largest RS, and Qinghai had the smallest (0.0042), with a mean value of 0.29. The maximum value of GR from 2011 to 2021 was 23.52% (Yunnan), the minimum value was −11.15% (Heilongjiang), and the mean value was 8.58%. It is important to note that all of the provinces in China showed that WCCI had positive growth from 2000 to 2010 and negative growth from 2011 to 2021, with reduced WCCI found in provinces including Jiangsu, Jilin, Xinjiang, Inner Mongolia, Liaoning, and Heilongjiang. Based on the mean values of RS and GR from 2000 to 2010 and from 2011 to 2021 as thresholds, we introduced the Boston Consulting Group Matrix to analyze the spatiotemporal evolution pattern of WCCI in China, as shown in Table 3. The number of star, gazelle, cow, and dog areas is in a dumbbell-shaped structure, with the star and dog areas at both ends having the largest number of members, while the gazelle and cow areas in the middle have the smallest number of members. A comparison of the results of the analyses for the periods 2000–2010 and 2011–2021 shows that the spatiotemporal evolution pattern of 11 provinces realized evolution, 9 provinces experienced degeneration, and 11 provinces remained unchanged.
From 2000 to 2010, eight provinces were star area members, including Hebei, Liaoning, Jiangsu, Zhejiang, Anhui, Fujian, Hubei, and Chongqing. The number of star area members increased to nine from 2011 to 2021, including Shanghai, Anhui, Fujian, Jiangxi, Henan, Hubei, Hunan, Guangdong, and Sichuan. A comparison of the analysis results from 2000 to 2010 and 2011 to 2021 shows that Anhui, Fujian, and Hubei remained unchanged, and they remained members of the star area, acting as leaders of WCCI in China. Hebei, Liaoning, Jiangsu, Zhejiang, and Chongqing were characterized by degeneration as a lost space in China’s WCCI regional system. Shanghai, Jiangxi, Henan, Hunan, Guangdong, and Sichuan were characterized by evolution as an emerging space in China’s WCCI regional system.
Cow area had the smallest number of members, with four provinces from 2000 to 2010, including Shandong, Hunan, Guangdong, and Sichuan. From 2011 to 2021, the number was further reduced to three, including Jiangsu, Zhejiang, and Shandong. According to the results of the analyses for 2000–2010 and 2011–2021, Shandong remained unchanged as a member of the cow area. Jiangsu and Zhejiang came from the decline of the star area and began to be marginalized in China’s WCCI regional system. Hunan, Guangdong, and Sichuan evolved from cow to star to activate the lost space.
Eight provinces were members of the gazelle area from 2000 to 2010, including Beijing, Tianjin, Shanghai, Jiangxi, Henan, Guizhou, Shaanxi, and Ningxia. The gazelle area members were reduced to six from 2011 to 2021, including Shanxi, Guangxi, Hainan, Guizhou, Yunnan, and Xizang. According to the analyses for 2000–2010 and 2011–2021, Guizhou remained unchanged as a member of the gazelle area, which is a potential area for increased WCCI in China. Beijing, Tianjin, Shaanxi, and Ningxia degraded from a gazelle area to a dog area, further marginalized in China’s WCCI market system. Shanxi, Guangxi, Hainan, Yunnan, and Xizang evolved from a dog area to a gazelle area, while Shanghai, Jiangxi, and Henan successfully transitioned from a gazelle area to a star area.
The dog area has always had the largest number of members, and the number continues to increase. From 2000 to 2010, it had 11 members, including Shanxi, Inner Mongolia, Jilin, Heilongjiang, Guangxi, Hainan, Yunnan, Xizang, Gansu, Qinghai, and Xinjiang. The number increased to 13 from 2011 to 2021, including Beijing, Tianjin, Hebei, Inner Mongolia, Liaoning, Jilin, Heilongjiang, Chongqing, Shaanxi, Gansu, Qinghai, Ningxia, and Xinjiang. Notably, Inner Mongolia, Jilin, Heilongjiang, Gansu, Qinghai, and Xinjiang remained members of the dog area as a space marginalized for a long time in China’s WCCI market system.

3.3. Factors Influencing Wood Consumption in the Construction Industry

The results of the Geodetector-based analysis are shown in Table 4 and Table 5. For the direct influence of the factors, the population urbanization rate has a very low and non-significant influence, and the artificial forest area also has a low influence and only passes the significance test under relaxed conditions. Flat glass consumption in the construction industry, aluminum consumption in the construction industry, cement consumption in the construction industry, gross domestic product, forestry and grassland investment, and steel consumption in the construction industry all have a direct influence greater than 0.7 as key factors, much higher than the other factors. Profit and tax rate on assets in the construction industry, research and development expenses in the construction industry, power equipment rate in the construction industry, fiscal self-sufficiency rate, and wood production also have a high direct influence as important factors. Artificial forest area, per capita GDP, per capita disposable income of residents, per capita completed area in the construction industry, and population urbanization rate have a weak direct influence, and they play a role relying on an interaction effect as auxiliary factors (Table 4). By calculating the group mean of the influencing factors, the influence of four dimensions on China’s WCCI can be measured quantitatively. Demand for high-quality economic and social development has the smallest influence, only at 0.30. Supply capacity and support system and efficiency and technology in the construction industry are not very different in influence, at 0.44 and 0.40, respectively. Alternative to wood in the construction industry has the greatest influence at 0.82, a doubling of other factors.
As for the interactive influence of factors, a total of 120 factor pairs coming from 16 factors are mostly in the interactive relationship of bifactor enhancement. Bifactor enhancement means that when two factors act together, their combined influence is greater than the maximum of their individual direct influences, which indicates a strong synergistic effect between the factors. Only 10 factor pairs are in the interactive relationship of nonlinear enhancement, accounting for less than 10%. In the interactive relationship of nonlinear enhancement, the population urbanization rate forms the most factor pairs with other factors, including wood production, forestry and grassland investment, fiscal self-sufficiency rate, profit and tax rate on assets in the construction industry, power equipment rate in the construction industry, and cement consumption in the construction industry. The artificial forest area is in the interactive relationship of nonlinear enhancement with three factors, including per capita GDP, per capita disposable income of residents, and fiscal self-sufficiency rate. Per capita completed area in the construction industry is also in the interactive relationship of nonlinear enhancement with the power equipment rate in the construction industry, and it is higher than other similar factor pairs. It is worth noting that many super factor pairs emerged in the interaction of different factors, and most of their interactive influence values were greater than 0.90, much higher than the direct influence (Table 5).

4. Discussion

The increasing WCCI in China and most of its provinces in the context of “dual carbon” is similar to the findings of other scholars. Some provinces have special changes in wood consumption. For example, consumption in Hainan increased significantly in a few years (around 2016) and then declined, which may be in connection with local construction projects or industrial development during a certain period. In Heilongjiang, Jilin, and other traditional forestry provinces, wood consumption is also changing with fluctuation, reflecting to some extent the impact of adjustments in forestry resource development and protection policies. Notably, the diversified WCCI changes at the provincial scale in China, with a small number of provinces experiencing a reduction, are new phenomena found from the regional scale that are different from the national scale. In this study, we found significant regional differences in China’s WCCI. On the one hand, the wood consumption of economically developed coastal provinces and some resource-rich provinces, such as Guangdong, Jiangsu, and Shandong, is relatively high. On the other hand, the overall wood consumption in the northwest and northeast provinces, such as Qinghai, Ningxia, and Gansu, is low. The spatiotemporal evolution pattern of China’s WCCI is diversified, and the BCGM model can well identify the star, potential, lost, and marginalized market space of China’s wood consumption [43]. The changes in the evolutionary pattern of China’s WCCI during different periods are also very complex, with evolution, degeneration, and unchanged appearing simultaneously.
The use of Geodetector not only can quantitatively measure the direct influence of different factors on WCCI, but also can identify the interactions between different factors. The findings have verified most of the theoretical hypotheses designed in this study, and for single factors, economy really has a high influence, ranking 4th out of the 16 factors. Many of the factor pairs have an interactive influence of more than 0.90. Alternatives generally have a high influence, with flat glass, aluminum, and cement ranking among the top 3 in terms of substitution effect among the 16 factors. Steel ranks sixth, with a leading edge in influence. The actual support of government policies has a relatively high influence on WCCI, ranking fifth [44]. Interestingly, some of the findings are not as expected and also differ from the conclusions reached by other scholars. In traditional knowledge, urbanization and industrialization are generally regarded as key factors influencing WCCI, but empirical analyses in China have found that their influence is not as high as imagined [39]. For example, the influence of urbanization is low and not significant. The probable reason is the natural limitation of the use of wood in high-rise buildings in China, where a large number of compact and dense high-rise buildings have been put up during its rapid urbanization. Wood has more advantages in low-rise buildings (especially 1–3 floors), which are more often found in rural areas of China, resulting in a less significant influence of urbanization [45]. It is important to emphasize that this is not to deny the influence of urbanization. According to the analysis of the interactive relationship, urbanization mainly plays an indirect role through the interaction effect of nonlinear enhancement, and super factor pairs have emerged in large numbers.
Government policies play an important role in guiding the utilization of wood in the construction industry. The findings in this study have great inspirational value and provide a scientific basis for the design of policies related to the comprehensive utilization of wood in the Chinese construction industry, green structures, and low-carbon buildings.
First, this study finds that the spatiotemporal evolution patterns of WCCI in China are diversified, with some provinces experiencing reductions, which inspires the government to accelerate the development of spatial policies rather than industry management policies. In the past, China’s wood consumption policies mainly focused on factors such as technological innovation and supply management, without considering the spatial heterogeneity and diverse characteristics of wood consumption in China. As a result, these management policies may not effectively address the spatial-difference challenges faced by the wood consumption in the construction industry (WCCI) in different regions of China. The Chinese government needs to delineate the policy zonings of WCCI and design differentiated management policies based on the dynamic changes in wood consumption in different regions and the “dual-carbon” goals undertaken by the construction industry. Designing integrated spatial–industrial policies based on the dynamic changes in wood consumption in different regions is more in line with the actual situation and can better promote the rational utilization of wood resources.
Second, the substitution effect of other materials such as glass, aluminum, steel, and cement in this study is found to be the biggest factor affecting WCCI. It has inspirational value for the government to strengthen the policy supply of these energy-intensive and carbon-intensive materials for reduction, to design more restrictive policies to force architects and building developers to replace them by using wood in more areas, and to help reduce carbon emissions in the construction industry [46]. In the context of ecological civilization, this study implies that the government should strengthen the policy supply for reducing the use of non-wood building materials like glass, aluminum, and cement. Designing more restrictive policies can force architects and building developers to use wood more, which helps reduce carbon emissions in the construction industry and promotes sustainable development.
Third, China’s WCCI is affected by many factors, and there are complex interactions between different factors. This suggests that policy design needs to focus not only on key measures, but also on synergies between different measures, so as to realize the best effectiveness of policies through the optimal combination of measures.
Fourth, this study reveals that supply factors, especially the leading influence of government investment, have a greater influence on WCCI than demand factors. Supply and demand for wood in China are currently showing a prominent contradiction. At a time when China is undergoing rapid and high-quality economic and social development, expanding supply to better meet demand is the path to sustainable development in the future. Accelerating the construction of strategic wood reserve bases in addition to the international trade of wood and improving the wood supply capacity of artificial forests are important ways to guarantee China’s wood supply security.
Fifth, the influence of the development trend of the construction industry, especially the influence of technological advances and innovativeness on the efficiency of wood utilization, should not be overlooked [47]. Improving wood resource utilization efficiency can benefit the construction industry’s sustainability by reducing waste and carbon emissions. Wood is a sustainable material, and better utilization can help the construction industry move towards a low-carbon and green future, meeting the requirements of the “dual-carbon” goal and enhancing the overall environmental performance of the industry.
While increasing the use of wood products in buildings may be advantageous from a climatic perspective, there are still significant difficulties in using sawn and engineered wood products in multi-story buildings, especially high-rise buildings, which is a comparatively new business. As Kern [48] suggests, architectural design features and new modes of wood use are key factors influencing the suitability of wood for modern architecture. As a result, it is necessary to further enhance technological research and design innovation capabilities in the future. For example, only by developing key technologies for the reuse of waste wood from the perspective of throttling can comprehensive utilization and recycling of wood be realized [49,50].
The innovation of this paper lies in the application of spatial econometric modeling to quantitatively identify the spatiotemporal evolution dynamics of WCCI at the provincial scale in China and reveal the driving mechanisms of different factors on wood consumption. By expanding the research methodology from qualitative to quantitative and upgrading the research scale from micro buildings to macro regions, this study shows a higher degree of fit with the needs of the government for industry management and spatial policy design. Inevitably, there are some shortcomings in this study, mainly in the selection of influencing factors. For example, wood architecture in China is more of a characterization of features and traditions, heavily influenced by regional culture, local history, and consumer preferences [51]. However, due to the lack of appropriate quantitative data, we did not include these factors in the analysis model in the empirical analysis.

5. Conclusions

Due to the fact that wood is better able to eliminate the negative impacts on the ecosystem, it is playing an increasingly important role in the material systems of green and low-carbon buildings in the context of the “dual-carbon” approach. This study quantitatively analyzed the spatiotemporal evolution dynamics and driving mechanisms of China’s WCCI from 2000 to 2021 using the Boston Consulting Group Matrix and Geodetector. The findings are as follows: First, changes in China’s WCCI are diversified, and reduction has become a new phenomenon. Second, China’s WCCI has high spatial heterogeneity, and the regions with high consumption are concentrated in the eastern coastal areas and areas rich in forest resources. Third, China’s WCCI consumer market is fragmented, and star, lost, potential, and marginalized spaces are quantitatively identified using the Boston Consulting Group Matrix. Fourth, the spatiotemporal evolution patterns of China’s WCCI are complex, with the coexistence of evolution, degeneration, and unchanged patterns. Fifth, China’s WCCI is influenced by a variety of factors. The substitution effect of non-wood materials such as glass and aluminum is the key influencing factor, with supply factors having a greater influence than demand factors, and technological advances and innovations having a greater influence than the business performance of construction companies. Sixth, factors show a higher interaction effect, mainly characterized by bifactor enhancement and nonlinear enhancement.
The findings can contribute to the scientific management of WCCI in China by providing a basis for rational planning of wood resource utilization. The identified spatiotemporal dynamics and influencing factors can help in formulating targeted policies, such as zoning management and promoting the use of wood in a more scientific way. As stated above, this study is innovative, but it also has some shortcomings. Regardless, it represents a new step forward. Wood is used in a variety of ways in the construction industry, with large differences in the quantities of logs, lumber, sawn timber, and pellets consumed. The exploration of their sub-types and sub-industries will improve the precision of the analysis results and have higher application value, which is a new direction for follow-up research.

Author Contributions

Conceptualization, S.Z. and X.Y.; methodology, J.X. and S.Z.; software, S.Z. and J.X.; validation, X.Y. and S.Z.; formal analysis, S.Z.; investigation, X.Y. and J.X.; resources, X.Y. and S.Z.; data curation, X.Y. and J.X.; writing—original draft preparation, X.Y. and J.X.; writing—review and editing, S.Z. and J.X.; visualization, J.X. and S.Z.; supervision S.Z.; project administration, X.Y. and S.Z.; funding acquisition, S.Z. All authors have read and agreed to the published version of the manuscript.

Funding

Research Project for Philosophy and Social Science Planning of Guangxi Zhuang Autonomous Region in 2024 (24GLF013).

Data Availability Statement

The data come from https://www.stats.gov.cn/sj/ndsj/ (accessed on 1 March 2024) and https://data.cnki.net/yearBook/single?id=N2024030154&pinyinCode=YZLPL (accessed on 5 November 2024).

Conflicts of Interest

The authors declare no conflicts of interest.

References

  1. Sutthichaimethee, P.; Mentel, G.; Voloshyn, V.; Mishchuk, H.; Bilan, Y. Modeling the Efficiency of Resource Consumption Management in Construction Under Sustainability Policy: Enriching the DSEM-ARIMA Model. Sustainability 2024, 16, 10945. [Google Scholar] [CrossRef]
  2. Milaj, K.; Sinha, A.; Miller, T.H.; Tokarczyk, J.A. Environmental Utility of Wood Substitution in Commercial Buildings Using Life—Cycle Analysis. Wood Fiber Sci. 2017, 49, 338–358. [Google Scholar]
  3. Crafford, P.L.; Wessels, C.B.; Blumentritt, M. Sustainability and wood constructions: A review of green building rating systems and life-cycle assessment methods from a South African and developing world perspective. Adv. Build. Energy Res. 2021, 15, 67–86. [Google Scholar] [CrossRef]
  4. Pramreiter, M.; Nenning, T.; Malzl, L.; Konnerth, J. A plea for the efficient use of wood in construction. Nat. Rev. Mater. 2023, 8, 217–218. [Google Scholar] [CrossRef]
  5. Goldaraz-Salamero, N.; Sierra-Perez, J.; Negro, F.; Zanuttini, R.; Blanc, S.; Brun, F. Integrated sustainability assessment of wood building products: The case of larch and chestnut cascading systems in Northern Italy. Sci. Total. Environ. 2024, 951, 175601. [Google Scholar] [CrossRef]
  6. Hildebrandt, J.; Hagemann, N.; Thrän, D. The contribution of wood-based construction materials for leveraging a low carbon building sector in europe. Sustain. Cities Soc. 2017, 34, 405–418. [Google Scholar] [CrossRef]
  7. Nässén, J.; Hedenus, F.; Karlsson, S.; Holmberg, J. Concrete vs. wood in buildings—An energy system approach. Build. Environ. 2011, 51, 361–369. [Google Scholar] [CrossRef]
  8. Nguyen, T. Climate effects of post-use wood materials from the building sector in a system perspective. Waste Manag. 2023, 170, 317–328. [Google Scholar] [CrossRef]
  9. Kalt, G. Carbon dynamics and GHG implications of increasing wood construction: Long-term scenarios for residential buildings in Austria. Carbon Manag. 2018, 9, 265–275. [Google Scholar] [CrossRef]
  10. Joensuu, T.; Tuominen, E.; Vinha, J.; Saari, A. Methodological aspects in assessing the whole-life global warming potential of wood-based building materials: Comparing exterior wall structures insulated with wood shavings. Environ. Res. Infrastruct. Sustain. 2023, 3, 045002. [Google Scholar] [CrossRef]
  11. Cobut, A.; Blanchet, P.; Beauregard, R. The environmental footprint of interior wood doors in non-residential buildings—Part 1: Life cycle assessment. J. Clean. Prod. 2015, 109, 232–246. [Google Scholar] [CrossRef]
  12. Pajchrowski, G.; Noskowiak, A.; Lewandowska, A.; Strykowski, W. Wood as a building material in the light of environmental assessment of full life cycle of four buildings. Constr. Build. Mater. 2014, 52, 428–436. [Google Scholar] [CrossRef]
  13. Wang, L.; Toppinen, A.; Juslin, H. Use of wood in green building: A study of expert perspectives from the UK. J. Clean. Prod. 2014, 65, 350–361. [Google Scholar] [CrossRef]
  14. Knowles, C.; Theodoropoulos, C.; Griffin, C.; Allen, J. Oregon design professionals views on structural building products in green buildings: Implications for wood. Can. J. For. Res. 2011, 41, 390–400. [Google Scholar] [CrossRef]
  15. Markström, E.; Kuzman, M.K.; Bystedt, A.; Sandberg, D.; Fredriksson, M. Swedish architects view of engineered wood products in buildings. J. Clean. Prod. 2018, 181, 33–41. [Google Scholar] [CrossRef]
  16. Viholainen, N.; Kylkilahti, E.; Autio, M.; Toppinen, A. A home made of wood: Consumer experiences of wooden building materials. Int. J. Consum. Stud. 2020, 44, 542–551. [Google Scholar] [CrossRef]
  17. Pomponi, J.P.; Quesada, H.J.; Smith, R.; Loferski, J. Factors Behind Construction Companies Wood Products Purchasing Decisions: Supplier Market Impact. For. Prod. J. 2021, 71, 262–274. [Google Scholar] [CrossRef]
  18. Markström, E.; Kitek Kuzman, M.; Bystedt, A.; Sandberg, D. Use of wood products in multi-storey residential buildings: Views of Swedish actors and suggested measures for an increased use. Wood Mater. Sci. Eng. 2019, 14, 404–419. [Google Scholar] [CrossRef]
  19. Blanchet, P.; Perez, C.; Cabral, M.R. Wood Building Construction: Trends and Opportunities in Structural and Envelope Systems. Curr. For. Rep. 2023, 10, 21–38. [Google Scholar] [CrossRef]
  20. Cobut, A.; Beauregard, R.; Blanchet, P. Reducing the environmental footprint of interior wood doors in non-residential buildings—Part 2: Ecodesign. J. Clean. Prod. 2015, 109, 247–259. [Google Scholar] [CrossRef]
  21. Xu, H.; Li, J.; Wu, J.; Kang, J. Evaluation of Wood Coverage on Building Facades Towards Sustainability. Sustainability 2019, 11, 1407. [Google Scholar] [CrossRef]
  22. Ratnasingam, J.; Ab Latib, H.; Ng, W.C.; Cellathurai, M.; Chin, K.A.; Senin, A.L.; Lim, C.L. Preference of using wood and wood products in the construction industry in peninsular Malaysia. BioResources 2018, 13, 5289–5302. [Google Scholar] [CrossRef]
  23. Padilla-Rivera, A.; Amor, B.; Blanchet, P. Evaluating the Link between Low Carbon Reductions Strategies and Its Performance in the Context of Climate Change: A Carbon Footprint of a Wood-Frame Residential Building in Quebec, Canada. Sustainability 2018, 10, 2715. [Google Scholar] [CrossRef]
  24. Blasco, D.K.; Saukkonen, N.; Korhonen, T.; Laine, T.; Muilu-Mäkelä, R. Wood material selection in school building procurement—A multi-case analysis in Finnish municipalities. J. Clean. Prod. 2021, 327, 129474. [Google Scholar] [CrossRef]
  25. Aaltonen, A.; Hurmekoski, E.; Korhonen, J. What About Wood?—“Nonwood” Construction Experts’ Perceptions of Environmental Regulation, Business Environment, and Future Trends in Residential Multistory Building in Finland. For. Prod. J. 2021, 71, 342–351. [Google Scholar] [CrossRef]
  26. Loucanová, E.; Olsiaková, M. Identification of Customers’ Drivers for the Wood Building as An Ecological Innovation in Building Construction in Slovakia. Acta Fac. Xylologiae Zvolen 2020, 62, 177–188. [Google Scholar]
  27. Švajlenka, J.; Kozlovská, M. Elements of the Fourth Industrial Revolution in the Production of Wood Buildings. Teh. Glas. 2020, 14, 365–368. [Google Scholar] [CrossRef]
  28. Gharaibeh, L.; Matarneh, S.; Eriksson, K.; Lantz, B. Digital transformation of the wood construction supply chain through building information modelling: Current state of practice. Constr. Innov. 2023, 24, 273–291. [Google Scholar] [CrossRef]
  29. Calquin, D.L.; Mata, R.; Correa, C.; Nuñez, E.; Bustamante, G.; Caicedo, N.; Fernandez, D.B.; Díaz, M.; Pulgar-Rubilar, P.; Roa, L. Implementation of Building Information Modeling Technologies in Wood Construction: A Review of the State of the Art from a Multidisciplinary Approach. Buildings 2024, 14, 584. [Google Scholar] [CrossRef]
  30. Cordier, S.; Robichaud, F.; Blanchet, P.; Amor, B. Exploring the regional-scale potential of the use of wood products in non-residential buildings: A building permits-based quantitative approach. BioResources 2019, 15, 787–813. [Google Scholar] [CrossRef]
  31. Kim, M.-J.; Chun, S.; Han, Y. Prediction of raw-wood consumption based on potential wood usage in public buildings: A quantitative approach using building construction statistics. BioResources 2024, 19, 6621–6637. [Google Scholar] [CrossRef]
  32. Chen, H.; Zhao, S.; Zhang, P.; Zhou, Y.; Li, K. Dynamics and Driving Mechanism of Real Estate in China’s Small Cities: A Case Study of Gansu Province. Buildings 2022, 12, 1512. [Google Scholar] [CrossRef]
  33. Kaya, M.C.; Persson, L. A theory of gazelle growth: Competition, venture capital finance and policy. N. Am. J. Econ. Financ. 2019, 50, 101019. [Google Scholar] [CrossRef]
  34. Zhao, S.; Zhang, C.; Qi, J. The Key Factors Driving the Development of New Towns by Mother Cities and Regions: Evidence from China. ISPRS Int. J. Geo-Inf. 2021, 10, 223. [Google Scholar] [CrossRef]
  35. Zhao, S.; Li, W.; Zhao, K.; Zhang, P. Change Characteristics and Multilevel Influencing Factors of Real Estate Inventory—Case Studies from 35 Key Cities in China. Land 2021, 10, 928. [Google Scholar] [CrossRef]
  36. Ma, Y.; Zhang, P.; Zhao, K.; Zhou, Y.; Zhao, S. A Dynamic Performance and Differentiation Management Policy for Urban Construction Land Use Change in Gansu, China. Land 2022, 11, 942. [Google Scholar] [CrossRef]
  37. Wang, J.F.; Hu, Y. Environmental health risk detection with GeogDetector. Environ. Model. Softw. 2012, 33, 114–115. [Google Scholar] [CrossRef]
  38. Iriarte-Goñi, I.; Ayuda, M.-I. Not only subterranean forests: Wood consumption and economic development in Britain (1850–1938). Ecol. Econ. 2012, 77, 176–184. [Google Scholar] [CrossRef]
  39. Kayo, C.; Oka, H.; Hashimoto, S.; Mizukami, M.; Takagi, S. Socioeconomic development and wood consumption. J. For. Res. 2015, 20, 309–320. [Google Scholar] [CrossRef]
  40. Guan, X.Y.; Wang, S.L.; Gao, Z.Y.; Lv, Y.; Fu, X.J. Spatio-temporal variability of soil salinity and its relationship with the depth to groundwater in salinization irrigation district. Acta Ecol. Sin. 2012, 32, 198–206. [Google Scholar]
  41. Miyamoto, S.; Chacon, A.; Hossain, M.; Martinez, L. Soil salinity of urban turf areas irrigated with saline water I. Spatial variability. Landsc. Urban Plan. 2005, 71, 233–241. [Google Scholar]
  42. Li, W.; Wang, M.; Zhao, S. The Spatio-Temporal Dynamics, Driving Mechanism, and Management Strategies for International Students in China under the Background of the Belt and Road Initiatives. ISPRS Int. J. Geo-Inf. 2023, 12, 405. [Google Scholar] [CrossRef]
  43. Sikkema, R.; Styles, D.; Jonsson, R.; Tobin, B.; Byrne, K. A market inventory of construction wood for residential building in Europe—In the light of the Green Deal and new circular economy ambitions. Sustain. Cities Soc. 2022, 90, 104370. [Google Scholar] [CrossRef]
  44. Wiegand, E.; Ramage, M. The impact of policy instruments on the first generation of Tall Wood Buildings. Build. Res. Inf. 2021, 50, 255–275. [Google Scholar] [CrossRef]
  45. Mergel, C.; Menrad, K.; Decker, T. Which factors influence consumers’ selection of wood as a building material for houses? Can. J. For. Res. 2024, 54, 467–478. [Google Scholar] [CrossRef]
  46. Head, M.; Levasseur, A.; Beauregard, R.; Margni, M. Dynamic greenhouse gas life cycle inventory and impact profiles of wood used in Canadian buildings. Build. Environ. 2020, 173, 106751. [Google Scholar] [CrossRef]
  47. Pramreiter, M.; Nenning, T.; Huber, C.; Müller, U.; Kromoser, B.; Mayencourt, P.; Konnerth, J. A review of the resource efficiency and mechanical performance of commercial wood-based building materials. Sustain. Mater. Technol. 2023, 38, e00728. [Google Scholar] [CrossRef]
  48. Kern, A.P.; Amor, L.V.; Angulo, S.C.; Montelongo, A. Factors influencing temporary wood waste generation in high-rise building construction. Waste Manag. 2018, 78, 446–455. [Google Scholar] [CrossRef]
  49. Piccardo, C.; Hughes, M. Design strategies to increase the reuse of wood materials in buildings: Lessons from architectural practice. J. Clean. Prod. 2022, 368, 133083. [Google Scholar] [CrossRef]
  50. Kiesnere, G.; Atstaja, D.; Cudecka-Purina, N.; Susniene, R. The Potential of Wood Construction Waste Circularity. Environments 2024, 11, 231. [Google Scholar] [CrossRef]
  51. Nyrud, A.Q.; Heltorp, K.M.A.; Roos, A.; Aguilar, F.X.; Lahtinen, K.; Viholainen, N.; Berghall, S.; Toppinen, A.; Thorsen, B.J.; Kniivila, M.; et al. Citizens’ knowledge of and perceptions of multi-storey wood buildings in seven European countries. Scand. J. For. Res. 2023, 39, 8–19. [Google Scholar] [CrossRef]
Figure 1. The spatiotemporal dynamic analysis of WCCI based on BCGM.
Buildings 15 00917 g001
Figure 2. The Factor and Interaction Detector analysis of WCCI based on Geodetector.
Buildings 15 00917 g002
Figure 3. Time series analysis of WCCI in China from 2000 to 2021.
Buildings 15 00917 g003
Figure 4. Time series analysis of WCCI at the provincial scale in China from 2000 to 2021.
Buildings 15 00917 g004
Figure 5. Regional heterogeneity analysis of WCCI in China from 2000 to 2021.
Buildings 15 00917 g005
Table 1. Indicator system for driving mechanism analysis.
IndicatorAbbreviationCodeMeaning
Wood Consumption in the Construction IndustryWCCI   Y 1 Dependent Variable
Gross Domestic ProductGDP   X 1 Demand for High-Quality Economic and Social Development
Population Urbanization RatePUR   X 2
Per Capita GDPPCGDP   X 3
Per Capita Disposable Income of ResidentsPCDIR   X 4
Wood ProductionWP   X 5 Supply Capacity and Support System
Artificial Forest AreaAFA   X 6
Forestry and Grassland InvestmentFGI   X 7
Fiscal Self-Sufficiency RateFSR   X 8
Profit and Tax Rate on Assets in the Construction IndustryPTRACI   X 9 Efficiency and Technology in the Construction Industry
Per Capita Completed Area in the Construction IndustryPCCACI   X 10
Power Equipment Rate in the Construction IndustryPERCI   X 11
R&D Expenses in the Construction IndustryRDECI   X 12
Steel Consumption in the Construction IndustrySCCI   X 13 Alternative to Wood in the Construction Industry
Cement Consumption in the Construction IndustryCCCI   X 14
Flat Glass Consumption in the Construction IndustryFGCCI   X 15
Aluminum Consumption in the Construction IndustryACCI   X 16
Table 2. Regional patterns of China WCCI in 2000 and 2021.
Type20002021
HighZhejiang, Guangdong, Jiangsu, Sichuan, Shandong, Hunan, Liaoning, Hubei, Fujian, HebeiHubei, Fujian, Zhejiang, Jiangsu, Sichuan, Anhui, Hunan, Guangdong, Henan, Jiangxi
MediumGuangxi, Chongqing, Beijing, Henan, Anhui, Heilongjiang, Yunnan, Shanghai, Jiangxi, Jilin, ShanxiShanghai, Shandong, Guangxi, Yunnan, Chongqing, Hebei, Guizhou, Beijing, Shaanxi, Liaoning, Xinjiang
LowShaanxi, Inner Mongolia, Xinjiang, Gansu, Guizhou, Tianjin, Hainan, Ningxia, Qinghai, XizangShanxi, Jilin, Hainan, Tianjin, Gansu, Heilongjiang, Inner Mongolia, Ningxia, Xizang, Qinghai
Table 3. Spatiotemporal evolution pattern of WCCI in China from 2000 to 2021.
No.Province2000–20102011–2021Change
RSGRPatternRSGRPattern
1Beijing0.1815.71Gazelle0.124.56DogDegeneration
2Tianjin0.0518.85Gazelle0.054.96DogDegeneration
3Hebei0.2818.48Star0.193.96DogDegeneration
4Shanxi0.0913.80Dog0.0912.15GazelleEvolution
5Inner Mongolia0.0612.35Dog0.02−3.37DogUnchanged
6Liaoning0.3115.82Star0.11−4.78DogDegeneration
7Jilin0.1014.03Dog0.05−1.39DogUnchanged
8Heilongjiang0.087.49Dog0.03−11.15DogUnchanged
9Shanghai0.1517.16Gazelle0.3719.43StarEvolution
10Jiangsu0.8417.73Star0.69−0.82CowDegeneration
11Zhejiang1.0018.20Star0.703.37CowDegeneration
12Anhui0.2318.69Star0.5819.88StarUnchanged
13Fujian0.5024.04Star0.9618.23StarUnchanged
14Jiangxi0.1921.01Gazelle0.4014.47StarEvolution
15Shandong0.3714.08Cow0.367.49CowUnchanged
16Henan0.1916.01Gazelle0.4116.41StarEvolution
17Hubei0.4120.94Star1.0016.11StarUnchanged
18Hunan0.3014.45Cow0.5512.84StarEvolution
19Guangdong0.479.92Cow0.459.28StarEvolution
20Guangxi0.1613.01Dog0.2915.69GazelleEvolution
21Hainan0.0313.85Dog0.0515.28GazelleEvolution
22Chongqing0.2820.66Star0.243.24DogDegeneration
23Sichuan0.3110.14Cow0.6817.21StarEvolution
24Guizhou0.1531.43Gazelle0.1417.81GazelleUnchanged
25Yunnan0.077.68Dog0.2723.52GazelleEvolution
26Xizang0.001.61Dog0.0118.80GazelleEvolution
27Shaanxi0.1016.61Gazelle0.128.15DogDegeneration
28Gansu0.0412.64Dog0.041.18DogUnchanged
29Qinghai0.0110.12Dog0.001.10DogUnchanged
30Ningxia0.0218.55Gazelle0.024.63DogDegeneration
31Xinjiang0.0513.02Dog0.10−2.40DogUnchanged
Table 4. Direct influence of factors on China’s WCCI.
CodeIndicator   q   p
  X 1 Wood Consumption in the Construction Industry0.780.00
  X 2 Gross Domestic Product0.020.44
  X 3 Population Urbanization Rate0.220.02
  X 4 Per Capita GDP0.200.03
  X 5 Per Capita Disposable Income of Residents0.380.01
  X 6 Wood Production0.230.06
  X 7 Artificial Forest Area0.750.00
  X 8 Forestry and Grassland Investment0.420.01
  X 9 Fiscal Self-Sufficiency Rate0.570.00
  X 10 Profit and Tax Rate on Assets in the Construction Industry0.160.04
  X 11 Per Capita Completed Area in the Construction Industry0.440.04
  X 12 Power Equipment Rate in the Construction Industry0.450.01
  X 13 R&D Expenses in the Construction Industry0.710.00
  X 14 Steel Consumption in the Construction Industry0.790.00
  X 15 Cement Consumption in the Construction Industry0.890.00
  X 16 Flat Glass Consumption in the Construction Industry0.880.00
Table 5. Interactive influence of factors on China’s WCCI.
  X 1   X 2   X 3   X 4   X 5   X 6   X 7   X 8   X 9   X 10   X 11   X 12   X 13   X 14   X 15   X 16
  X 1 0.78
  X 2 0.840.02
  X 3 0.800.270.22
  X 4 0.800.250.280.20
  X 5 0.880.510.550.520.38
  X 6 0.840.300.530.540.500.23
  X 7 0.920.840.800.790.800.790.75
  X 8 0.840.570.490.490.690.690.850.42
  X 9 0.910.700.730.670.710.760.820.920.57
  X 10 0.840.240.330.280.510.400.880.510.730.16
  X 11 0.900.520.560.620.820.570.920.870.890.830.44
  X 12 0.830.480.530.590.800.630.910.630.880.520.910.45
  X 13 0.980.760.730.770.960.900.940.780.920.790.970.770.71
  X 14 0.950.850.820.820.880.850.890.890.940.850.960.840.900.79
  X 15 0.950.920.900.910.900.900.910.930.910.920.960.930.950.920.89
  X 16 0.930.910.910.910.910.890.930.920.930.920.960.920.940.940.960.88
Disclaimer/Publisher’s Note: The statements, opinions and data contained in all publications are solely those of the individual author(s) and contributor(s) and not of MDPI and/or the editor(s). MDPI and/or the editor(s) disclaim responsibility for any injury to people or property resulting from any ideas, methods, instructions or products referred to in the content.

