Article

Residual Stress Distribution and Fatigue Behavior of Combined Bolted–Welded Joints

1
School of Highway, Chang’an University, Xi’an 710064, China
2
SCEGC Mechanized Construction Group Co., Ltd., Xi’an 710032, China
3
Henan Communication Investment Jiaozuo-Zhengzhou Expressway Co., Ltd., Zhengzhou 450006, China
*
Authors to whom correspondence should be addressed.
Buildings 2025, 15(6), 910; https://doi.org/10.3390/buildings15060910
Submission received: 16 December 2024 / Revised: 28 February 2025 / Accepted: 9 March 2025 / Published: 13 March 2025
(This article belongs to the Special Issue Experimental and Theoretical Studies on Steel and Concrete Structures)

Abstract

Combined bolted–welded joints use both bolting and welding methods to connect several members, resulting in a versatile and robust solution for structural connections. However, very limited studies have focused on the residual stress distribution and fatigue behavior of these joints. In this paper, a total of eight specimens of double lap joints using bolts and fillet welds were fabricated and tested to measure the residual stress distribution. A finite element model was also developed for predicting the residual stress and residual deformation, and then it was validated against the test results. The effects of different welding parameters on the residual stress and residual deformation were evaluated, including the welding sequence (four different welding sequences) and welding process (welding speeds of 4 mm/s, 6 mm/s and 10 mm/s; welding powers of 5000 W, 6000 W and 7000 W; and post-weld heat treatments of no insulation, insulation at 200 °C and insulation at 300 °C). The fatigue behaviors of combined bolted–welded joints with and without residual stresses were compared in terms of the fatigue life of crack propagation. It was shown that the maximum residual stress was approximately 450 MPa, far exceeding the yield strength of steel plate of 335 MPa, while welding sequence 1 produced the smallest residual stresses. Due to the presence of welding residual stresses, the fatigue life of combined bolted–welded joints was reduced by nearly 40%, which indicated that the fatigue life of the joint would be overestimated without considering the residual stresses.

1. Introduction

Combined bolted–welded joints are structural connections that utilize both bolting (high-strength pretensioned bolts) and welding methods to connect two or more members. On the one hand, the combination of welds and bolts provides enhanced strength and stiffness on the joint, making it suitable for high-load applications. On the other hand, it can provide redundancy, which improves the overall safety and reliability of the joint. In summary, combined bolted–welded joints offer a versatile and robust solution for structural connections, leading to their significant application potential for the joint design and strengthening of truss bridges.
To date, extensive research has been conducted on the strength of combined bolted–welded joints. Shi et al. [1,2,3] carried out experimental and numerical analyses on combined joints with bolts and longitudinal welds, where the design method was given. Waite et al. [4] performed tests on combined bolted–welded joints to reveal the influence of variables including the bolt pattern, bolt size, bolt grade, bolt pretensioning method, faying surface class and weld/bolt strength ratio. Kulak and Grondin [5], Manuel and Kulak [6], Jarosch and Bowman [7] and Kim et al. [8] examined the strength of combined bolted–welded joints and proposed equations to predict the bearing capacity of each part. Liu et al. [9] analyzed the failure mode and shear strength of combined bolted–welded joints using finite element models. Tamimi et al. [10] investigated the behavior of combined bolted welded joints under eccentric loading. Khandel et al. [11] quantified the reliability levels of various elements, i.e., slip critical bolts and longitudinal fillets, based on a probabilistic approach. Kim et al. [12] focused on the strength of combined bolted–welded joints using high-strength steel. Yokozeki et al. [13] researched the intricate mechanics of hybrid joints combining prestressed bolts and adhesive bonding.
Different from traditional bolted joints, bolted–welded joints undergo welding processes that induce thermal cycles and create residual stresses due to differential cooling rates. A lot of studies have demonstrated that residual tensile stresses can amplify the local stress intensity at weld toes and roots, which can promote fatigue crack initiation and drive its growth [14,15,16,17,18,19,20,21]. Thus, accurately understanding the nature and distribution of residual stresses is crucial in evaluating the fatigue crack growth rate. Smrity et al. [22] established a three-dimensional numerical analysis model based on COMSOL Multiphysics 5.2a software and obtained the distribution of the temperature field and stress field during the welding process. Zhu Chunyuan et al. [23] used the indentation strain method, which has less of an impact on components, to measure the post-weld stress values along two different paths: along the weld length direction and perpendicular to the weld direction in butt-welded flat plates. The stress results showed that the distribution of the post-weld residual stress field has certain regularity, and the maximum values of longitudinal and transverse stresses are both located at the center line of the weld. Luo Wenze et al. [24], based on SYSWELD 2022.0 finite element analysis software, selected the double-ellipsoidal heat source model to study and analyze the residual stress and post-weld deformation of multi-layer and multi-pass butt joints. It was found that the stress distribution shows a symmetrical trend, and the peak value of the residual stress caused by welding is positively correlated with the yield stress of the material. Deng et al. [25] conducted a numerical simulation of the welding process of stainless steel pipes based on ABAQUS 6.11 software, obtained the data of their temperature field and stress field and reasonably predicted the post-weld deformation. M. Shariyat et al. [26] conducted a three-dimensional elastic buckling analysis of functionally graded plates subjected to non-uniform in-plane compression for the first time. They compared the rule of mixtures with the Mori–Tanaka model, introduced a 3D cubic B-spline element and employed the non-linear 3D elasticity theory and the geo-metric stiffness concept to study the influence of multiple factors on buckling. Mondal et al. [27], Barsoum and Barsoum [28], Kollár [29], Qiang et al. [30] and Ghafouri et al. [31] revealed the residual stress distribution of butt-welded plates and T-fillet welds. Gadallah et al. [32] and Kollár et al. [33] presented the residual stress distribution at the weld of rib-to-deck joints in orthotropic steel bridge decks. Huang et al. [34] studied the residual stress distribution of the welded integral joint of steel truss bridges. Gadallah et al. [35], Jin et al. [36] and Cao et al. [37] investigated the residual stress and the residual deformation of tubular joints. In general, very limited research has focused on the residual stress distribution and fatigue behavior of combined bolted–welded joints.
To address these gaps, tests were carried out to measure the residual stress distribution of typical longitudinal fillet welds in combined bolted–welded joints. Then, three-dimensional finite elements were developed to predict the temperature field and residual stress and verified against the test results. Based on the developed finite elements, the influences of different welding parameters on the residual stress and residual deformation were evaluated, including the welding sequence and welding process, e.g., the welding heat input, welding speed and post-weld heat treatment. Finally, the influences of the residual stress distribution on fatigue crack propagation were investigated.

2. Tests to Measure the Residual Stress Distribution
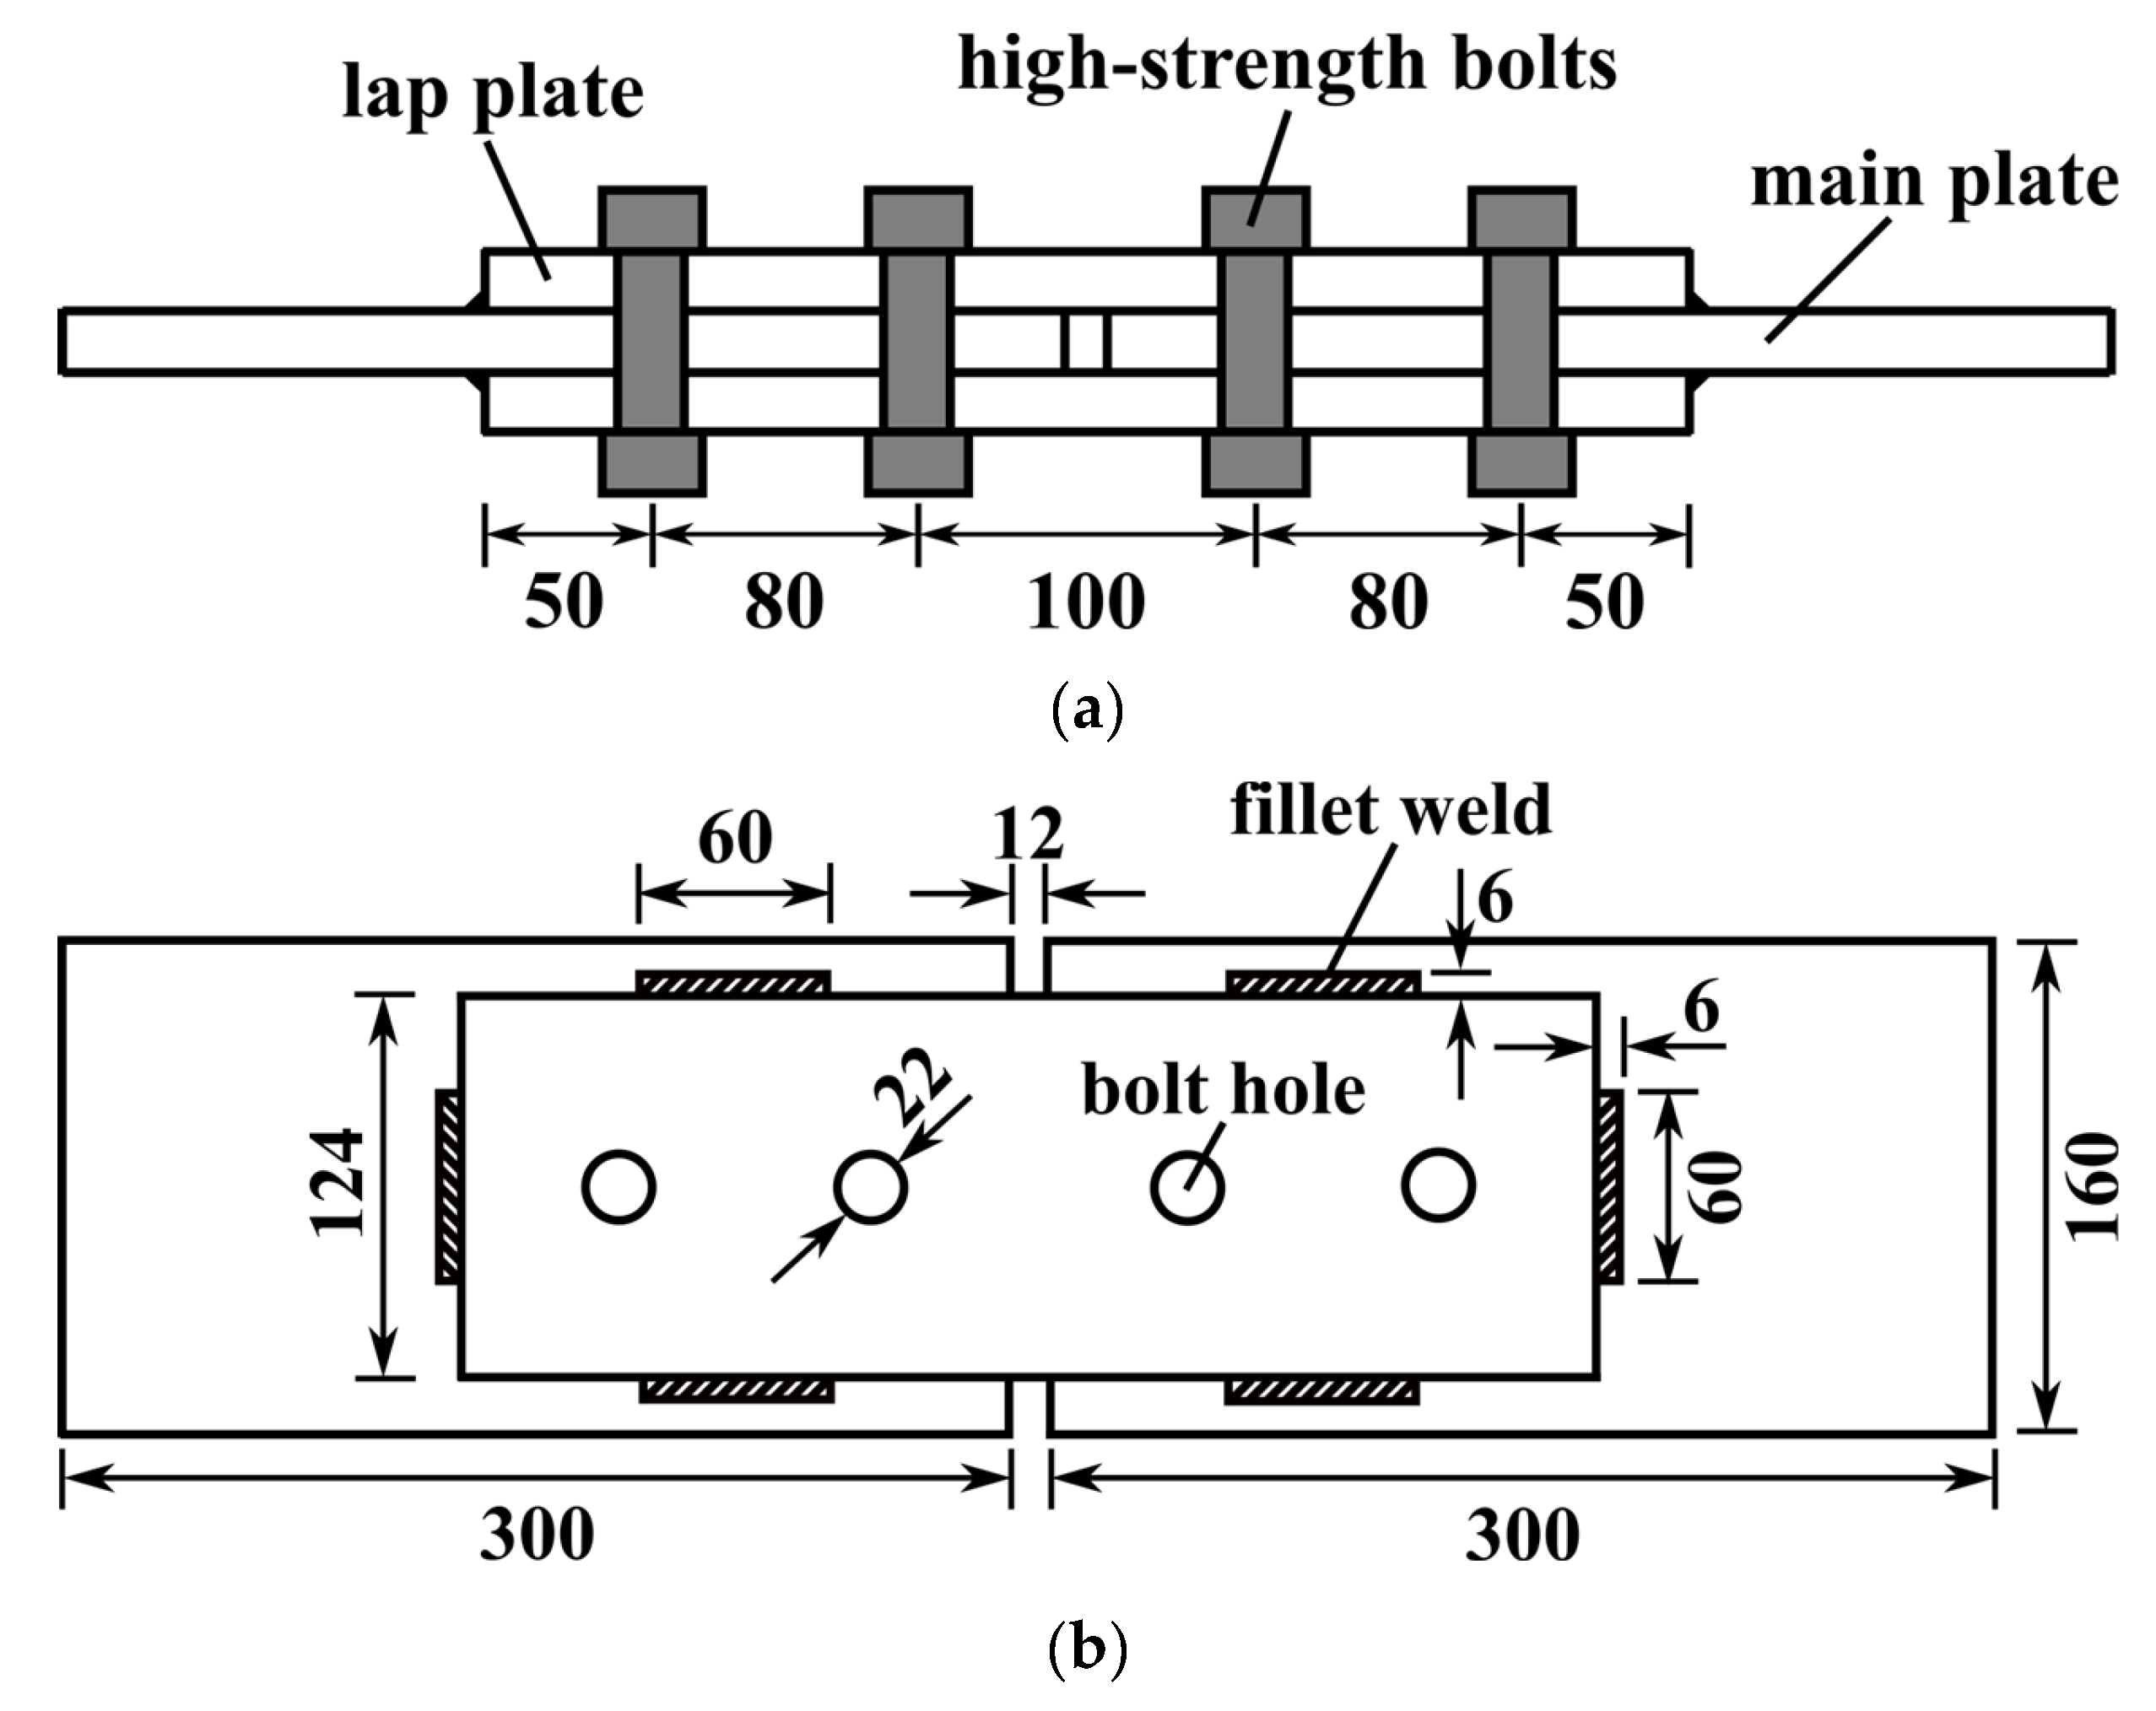
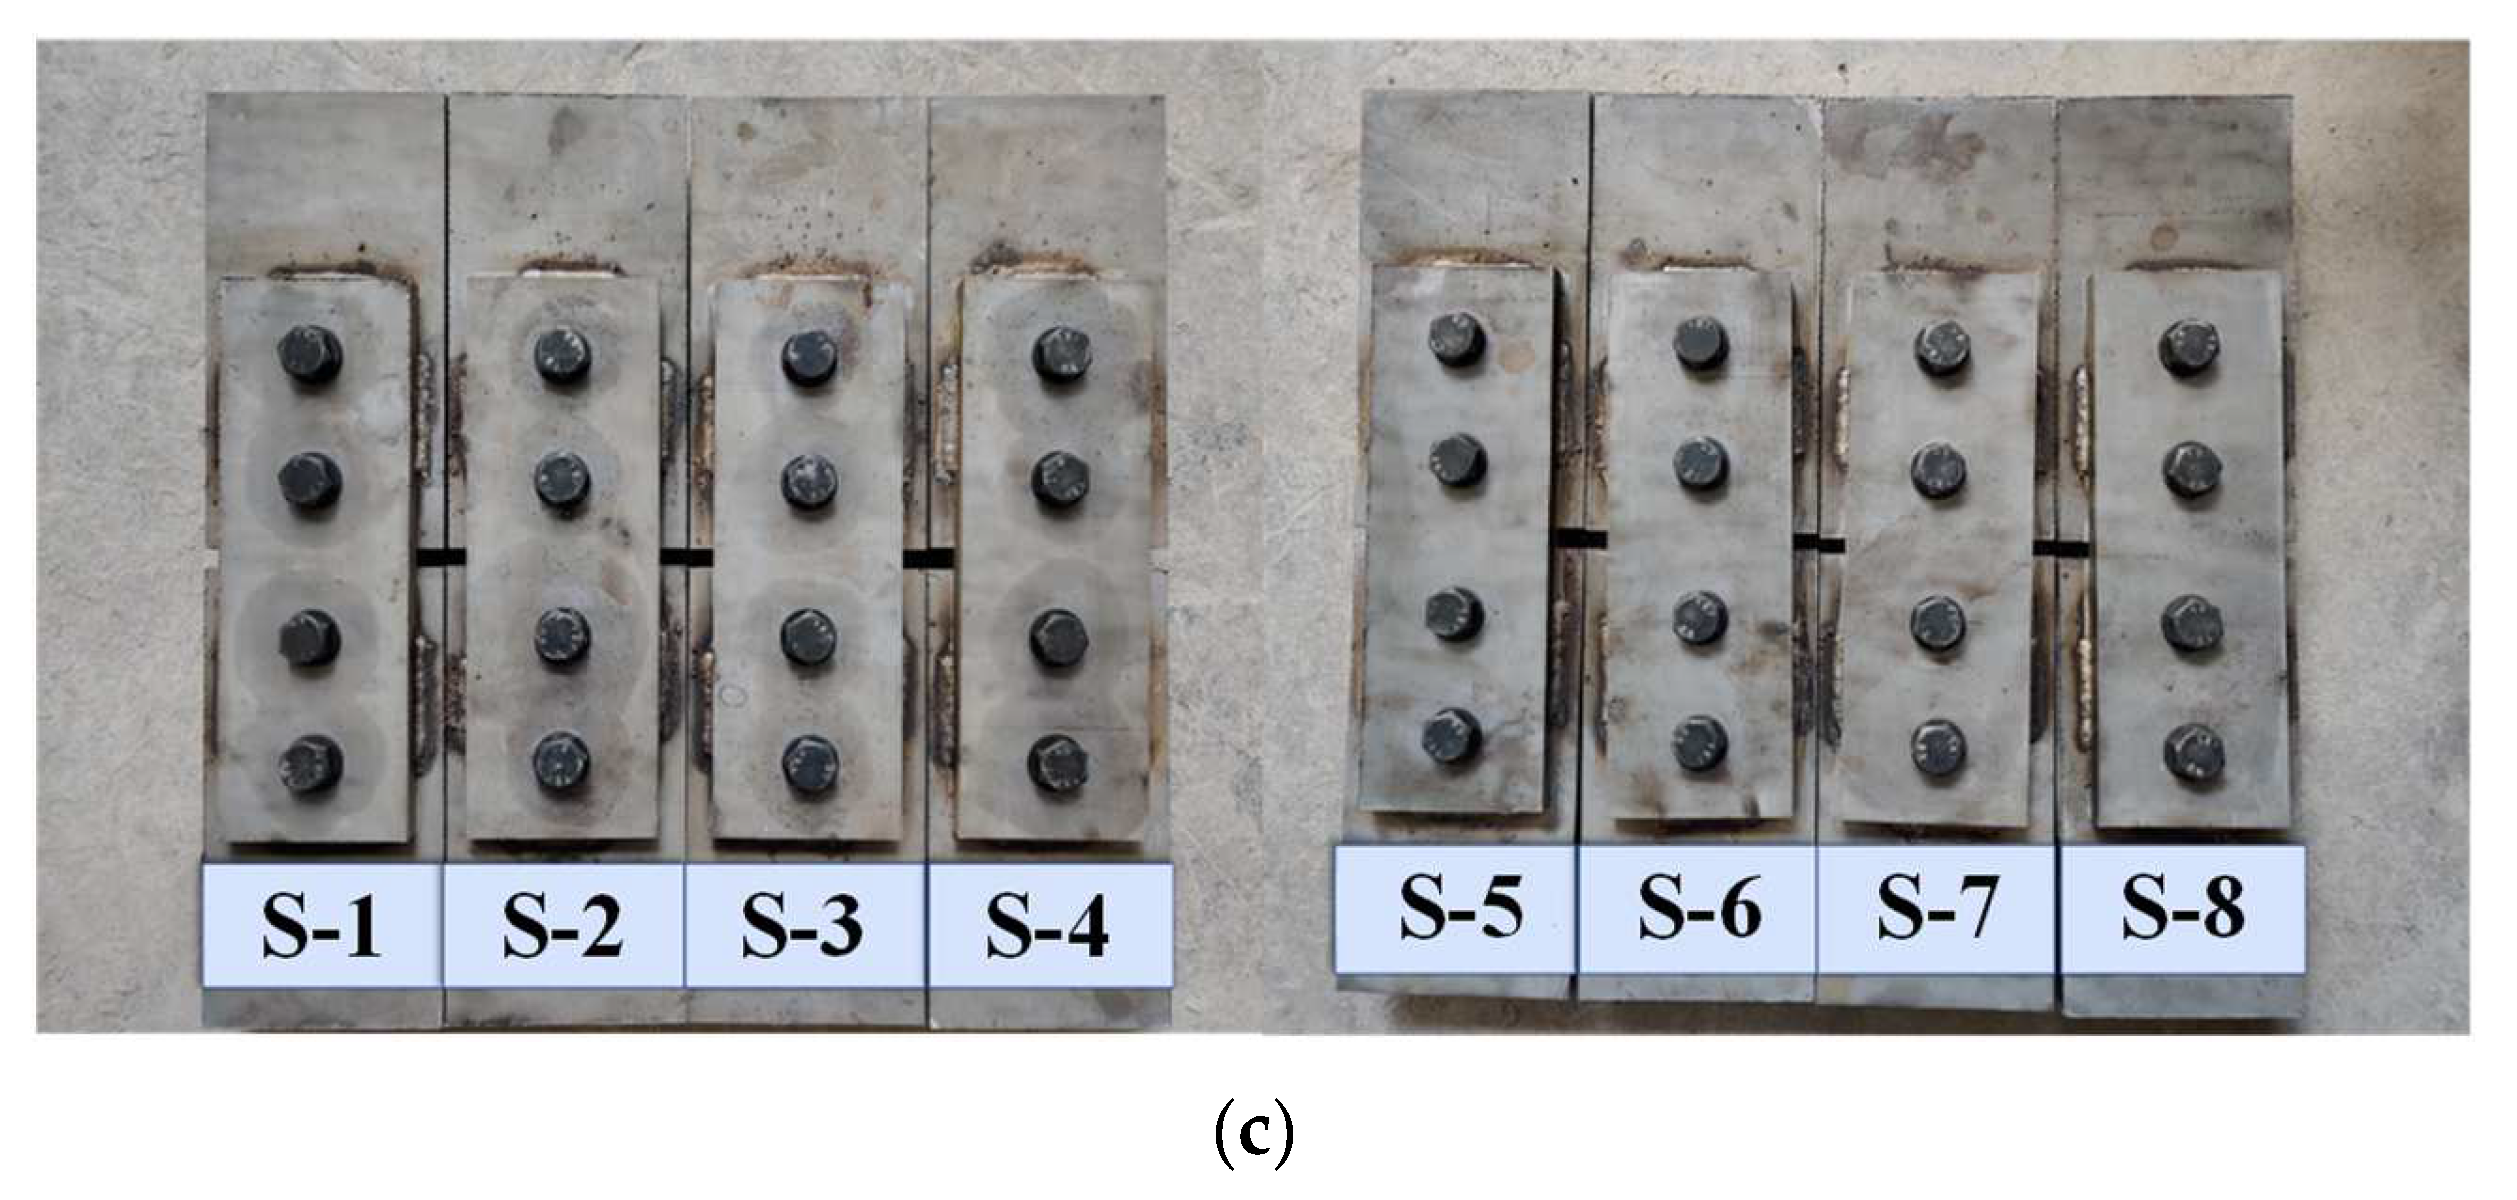
2.1. Test Specimens

A total of 8 specimens of double lap joints using bolts and fillet welds were fabricated and tested, as shown in Figure 1. The dimensions of the main plate and lap plate were 300 × 160 × 18 mm and 360 × 124 × 18 mm, respectively. To avoid issues such as bolts getting stuck or bent during installation, the bolt hole diameter was 22 mm, slightly larger than the bolt diameter of 20 mm. According to the provisions in the Chinese specifications of high strength bolts with large hexagon head, large hexagon nuts, plain washers for steel structures (GB/T 1231-2006) [38], the allowable distance between bolt centers should be in the range of 8 times the bolt diameter (160 mm) to 3 times the bolt diameter (60 mm); thus, the distance in the specimens was set to 80 mm. The allowable distance between the bolt center and member edge should be in the range of 4 times the bolt diameter (80 mm) to 2 times the bolt diameter (40 mm); thus, the distance in the specimens was set to 50 mm. The distance between the edges of the main plate and lap plate should not be less than 30 mm; therefore, the distance in the specimens was set to 50 mm. Besides the bolts, the double lap plates and main plate were connected through 60 mm lengths of side (longitudinal) and end (transverse) fillet welds with 6 mm leg lengths.

2.2. Material Properties

The steel used in this test was grade Q345, as specified in the Chinese specification for high strength low alloy structural steels (GB/T 1591-2018).(GB/T 1591-2018) [39]. According to the coupon test, the steel properties were measured as a Young’s modulus of 200 GPa, yield stress of 335 MPa, yield strain of 0.00167, ultimate strength of 475 MPa and ultimate strain of 0.20. To remove surface rust and improve its surface friction properties, sandblasting was used on the steel surface. In this case, the coefficient of friction for the steel surface can be taken as 0.4. The bolts used in this test were 8.8 grade M20 friction-type high-strength bolts, which complied with the Chinese specification GB/T 1231-2006. An electrode of grade E50 as specified in the Chinese specification code for welding of steel structures (GB 50661-2011) [40] was used, matched to the characteristics of the base materials.

2.3. Welding Process

During the fabrication of the specimens, all welding operations were executed sequentially in accordance with a pre-established protocol. Shielded metal arc welding (SMAW) was utilized, with the welding process conducted under ambient conditions at a temperature of 20 °C. The welding was performed using an E5015 electrode with a diameter of 4 mm. The welding parameters were meticulously controlled, with a welding current of 200 A, a welding voltage of 30 V and a welding speed of 6 mm/s. The welding procedure was maintained at a consistent speed to ensure uniformity and reproducibility. To mitigate oxidation, CO₂ gas shielding was employed throughout the welding process. After welding, the joints were allowed to cool naturally to ambient temperature. Subsequently, slag was removed, and the weld surfaces were ground to reduce stress concentrations caused by geometric discontinuities. The welding quality was inspected according to the standard non-destructive testing of welds—Ultrasonic testing—Techniques, testing levels and assessment (GB/T 11345-2023) [41]. If the weld quality did not meet the specified requirements, the corresponding specimen was remanufactured.

2.4. Measurement Arrangement
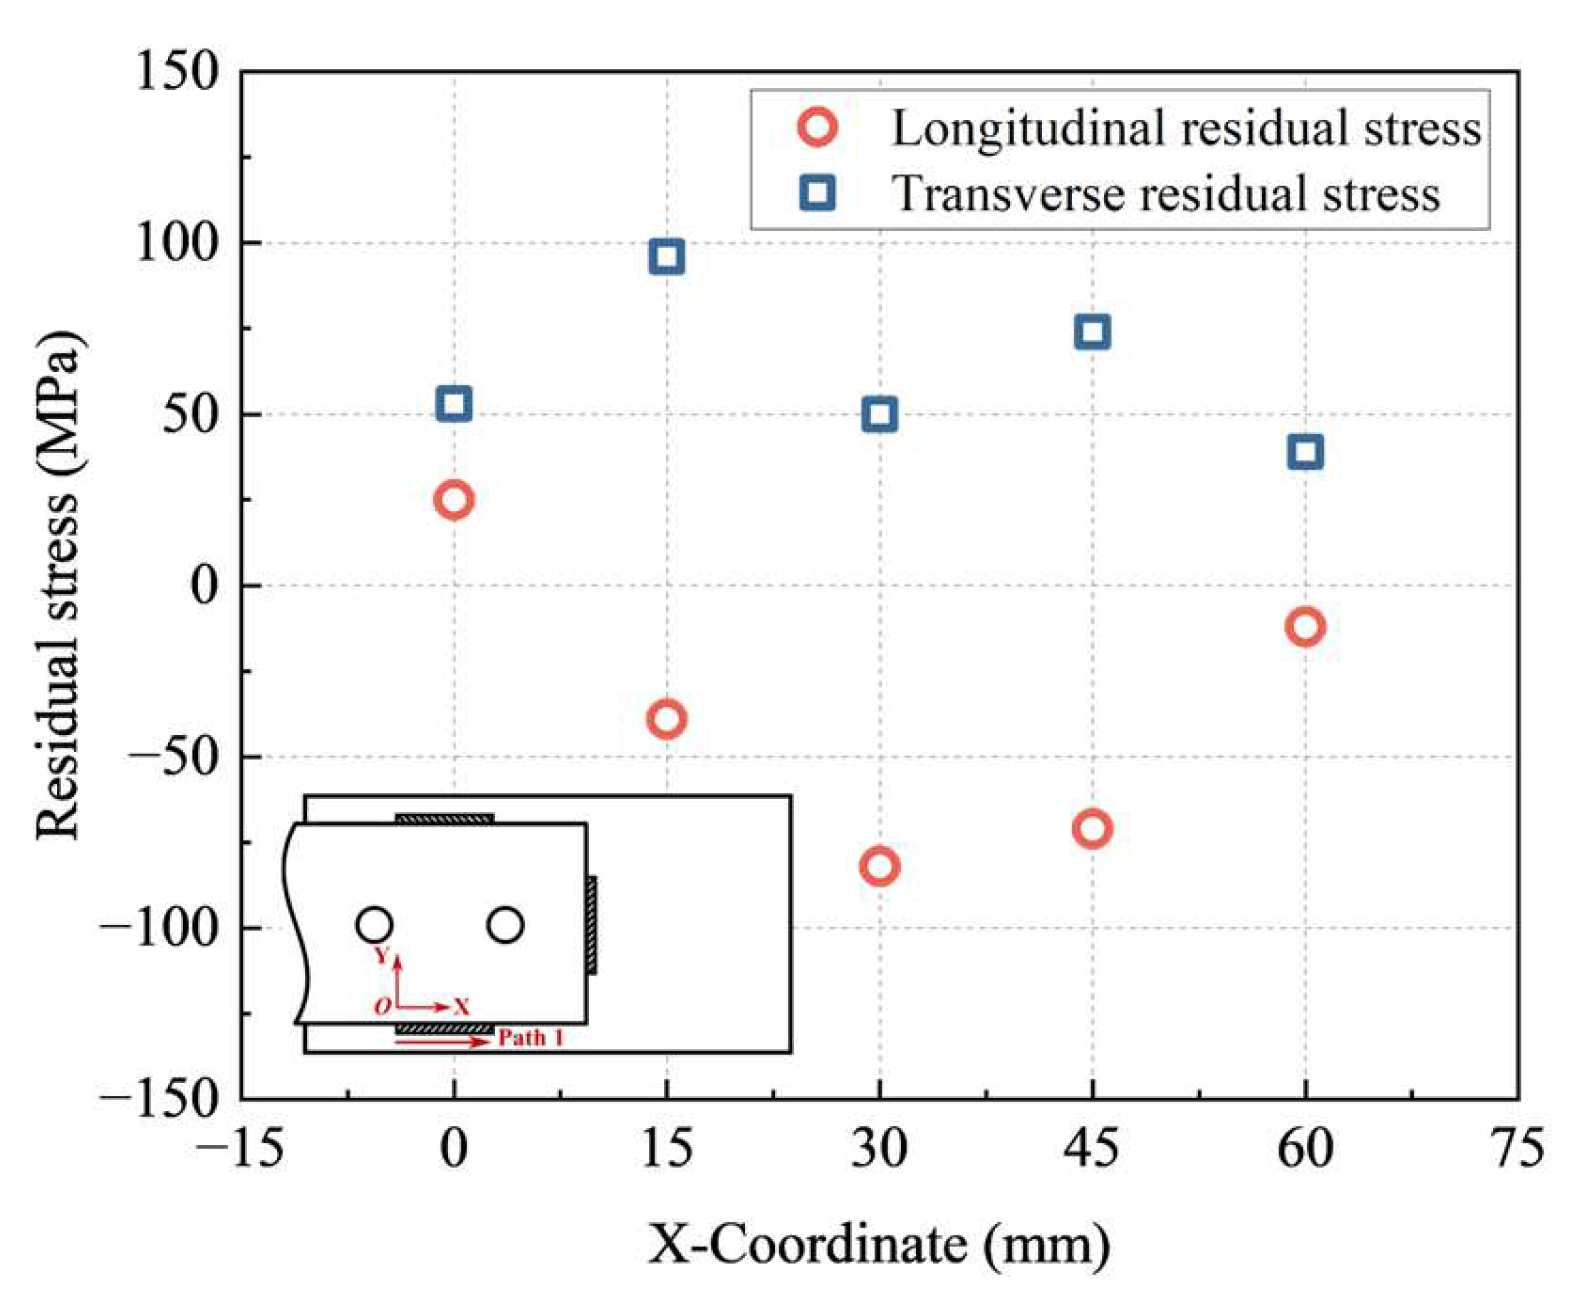
Figure 2 illustrates the arrangement of the measurement points. To measure the temperature changes during the welding process, temperature sensors, i.e., K-type thermocouples, were arranged at a distance of 6 mm away from the weld toe in the middle position along the length of the weld, as shown in Figure 2a. The blind hole drilling method was used to measure residual stresses. Five blind holes labeled L1 to L5 were drilled at a distance of 6 mm away from the weld toe with spacings of 15 mm, as shown in Figure 2b. Strain gauges were placed around the drilled holes to measure the deformations caused by the release of residual stresses as the material was removed. Various algorithms and methods (referring to the Standard Test Method for Determining Residual Stresses by the Hole-Drilling Strain-Gage Method) were applied to convert the measured strains into residual stress values.

2.5. Test Results

Figure 3 presents the measured time–temperature curve. The welding sequence and directions can also be found in Figure 3. The 1st, 2nd and 3rd passes were used to connect the top lap plate and main plate. Correspondingly, the 4th, 5th and 6th passes were used to connect the bottom lap plate and main plate. During the first welding process, the temperature at the measurement points gradually increased, reaching its peak at 337 °C after about 9 s. Subsequently, the temperature gradually decreased, reaching its trough at 148 °C after approximately 34 s. Then, the temperature increased again, reaching a second peak at 293 °C after 47 s, resulting from the welding of the 4th pass. It can be concluded that all passes after the 1st had small effects on the temperature field at the location of the 1st weld, except for the 4th pass.
Figure 4 shows the measured residual stresses along path 1 at a distance of 6 mm away from the weld toe. The longitudinal residual stress is along the weld length, that is, in the X direction. The transverse residual stress is vertical to the weld toe, that is, in the Y direction. It was found that both the longitudinal and transverse residual stresses near the welding endpoint were relatively small. Overall, the longitudinal residual stresses were compressive, and the transverse residual stresses were tensile. Also, both the longitudinal and transverse residual stresses were basically symmetrically distributed along path 1.

3. Finite Element Simulation of Residual Stresses

3.1. Finite Element Model and Mesh Scheme

In this study, three-dimensional thermo-elastic–plastic finite elements were developed in ABAQUS to simulate the residual stresses of combined bolted–welded joints. All members including steel plates, bolts and fillet welds were simulated using solid elements. In the thermal analysis, the 3D 8-node linear heat transfer brick element (DC3D8) with temperature as the only degree of freedom was used. In order to facilitate the data mapping between the thermal and mechanical models, the same finite element mesh scheme was used. In the mechanical analysis, the 3D 8-node linear brick element with reduced integration (C3D8R) was used. It has been demonstrated that the use of reduced integration elements achieves better convergence and takes less computational time [42,43,44].
Considering the geometric symmetry of the joint, a half-structure model was established to save computational time. Refined meshes with an approximate size of 2 mm were employed in the key research area, that is, the fillet weld and nearby region. Coarse meshes with an approximate size of 6 mm were employed in the other areas, as shown in Figure 5.
Surface-to-surface contacts were used between the main plate and lap plate, between the lap plate and the lower surface of the nut and between the bolt and the hole wall. Finite sliding between two contact surfaces was developed as friction and separation were allowed. Thus, ‘hard contact’ with Coulomb friction with a coefficient of 0.4 was employed. To enhance computational efficiency and ensure model convergence, a thermo-mechanical sequential coupling analysis was adopted. ‘Tie’ constraints were used to simulate the interactions between fillet welds and steel plates. High-strength bolts were preloaded using the ‘bolt-load’ command. To improve the convergence, an initial preload of 10 kN was applied to the bolts, followed by the application of the full preload, with the maximum preload reaching 110 kN. To simulate the tensile fracture process of the specimen, a fixed boundary condition was applied to the symmetry plane, and a tensile displacement load was applied to the other end of the main plate.

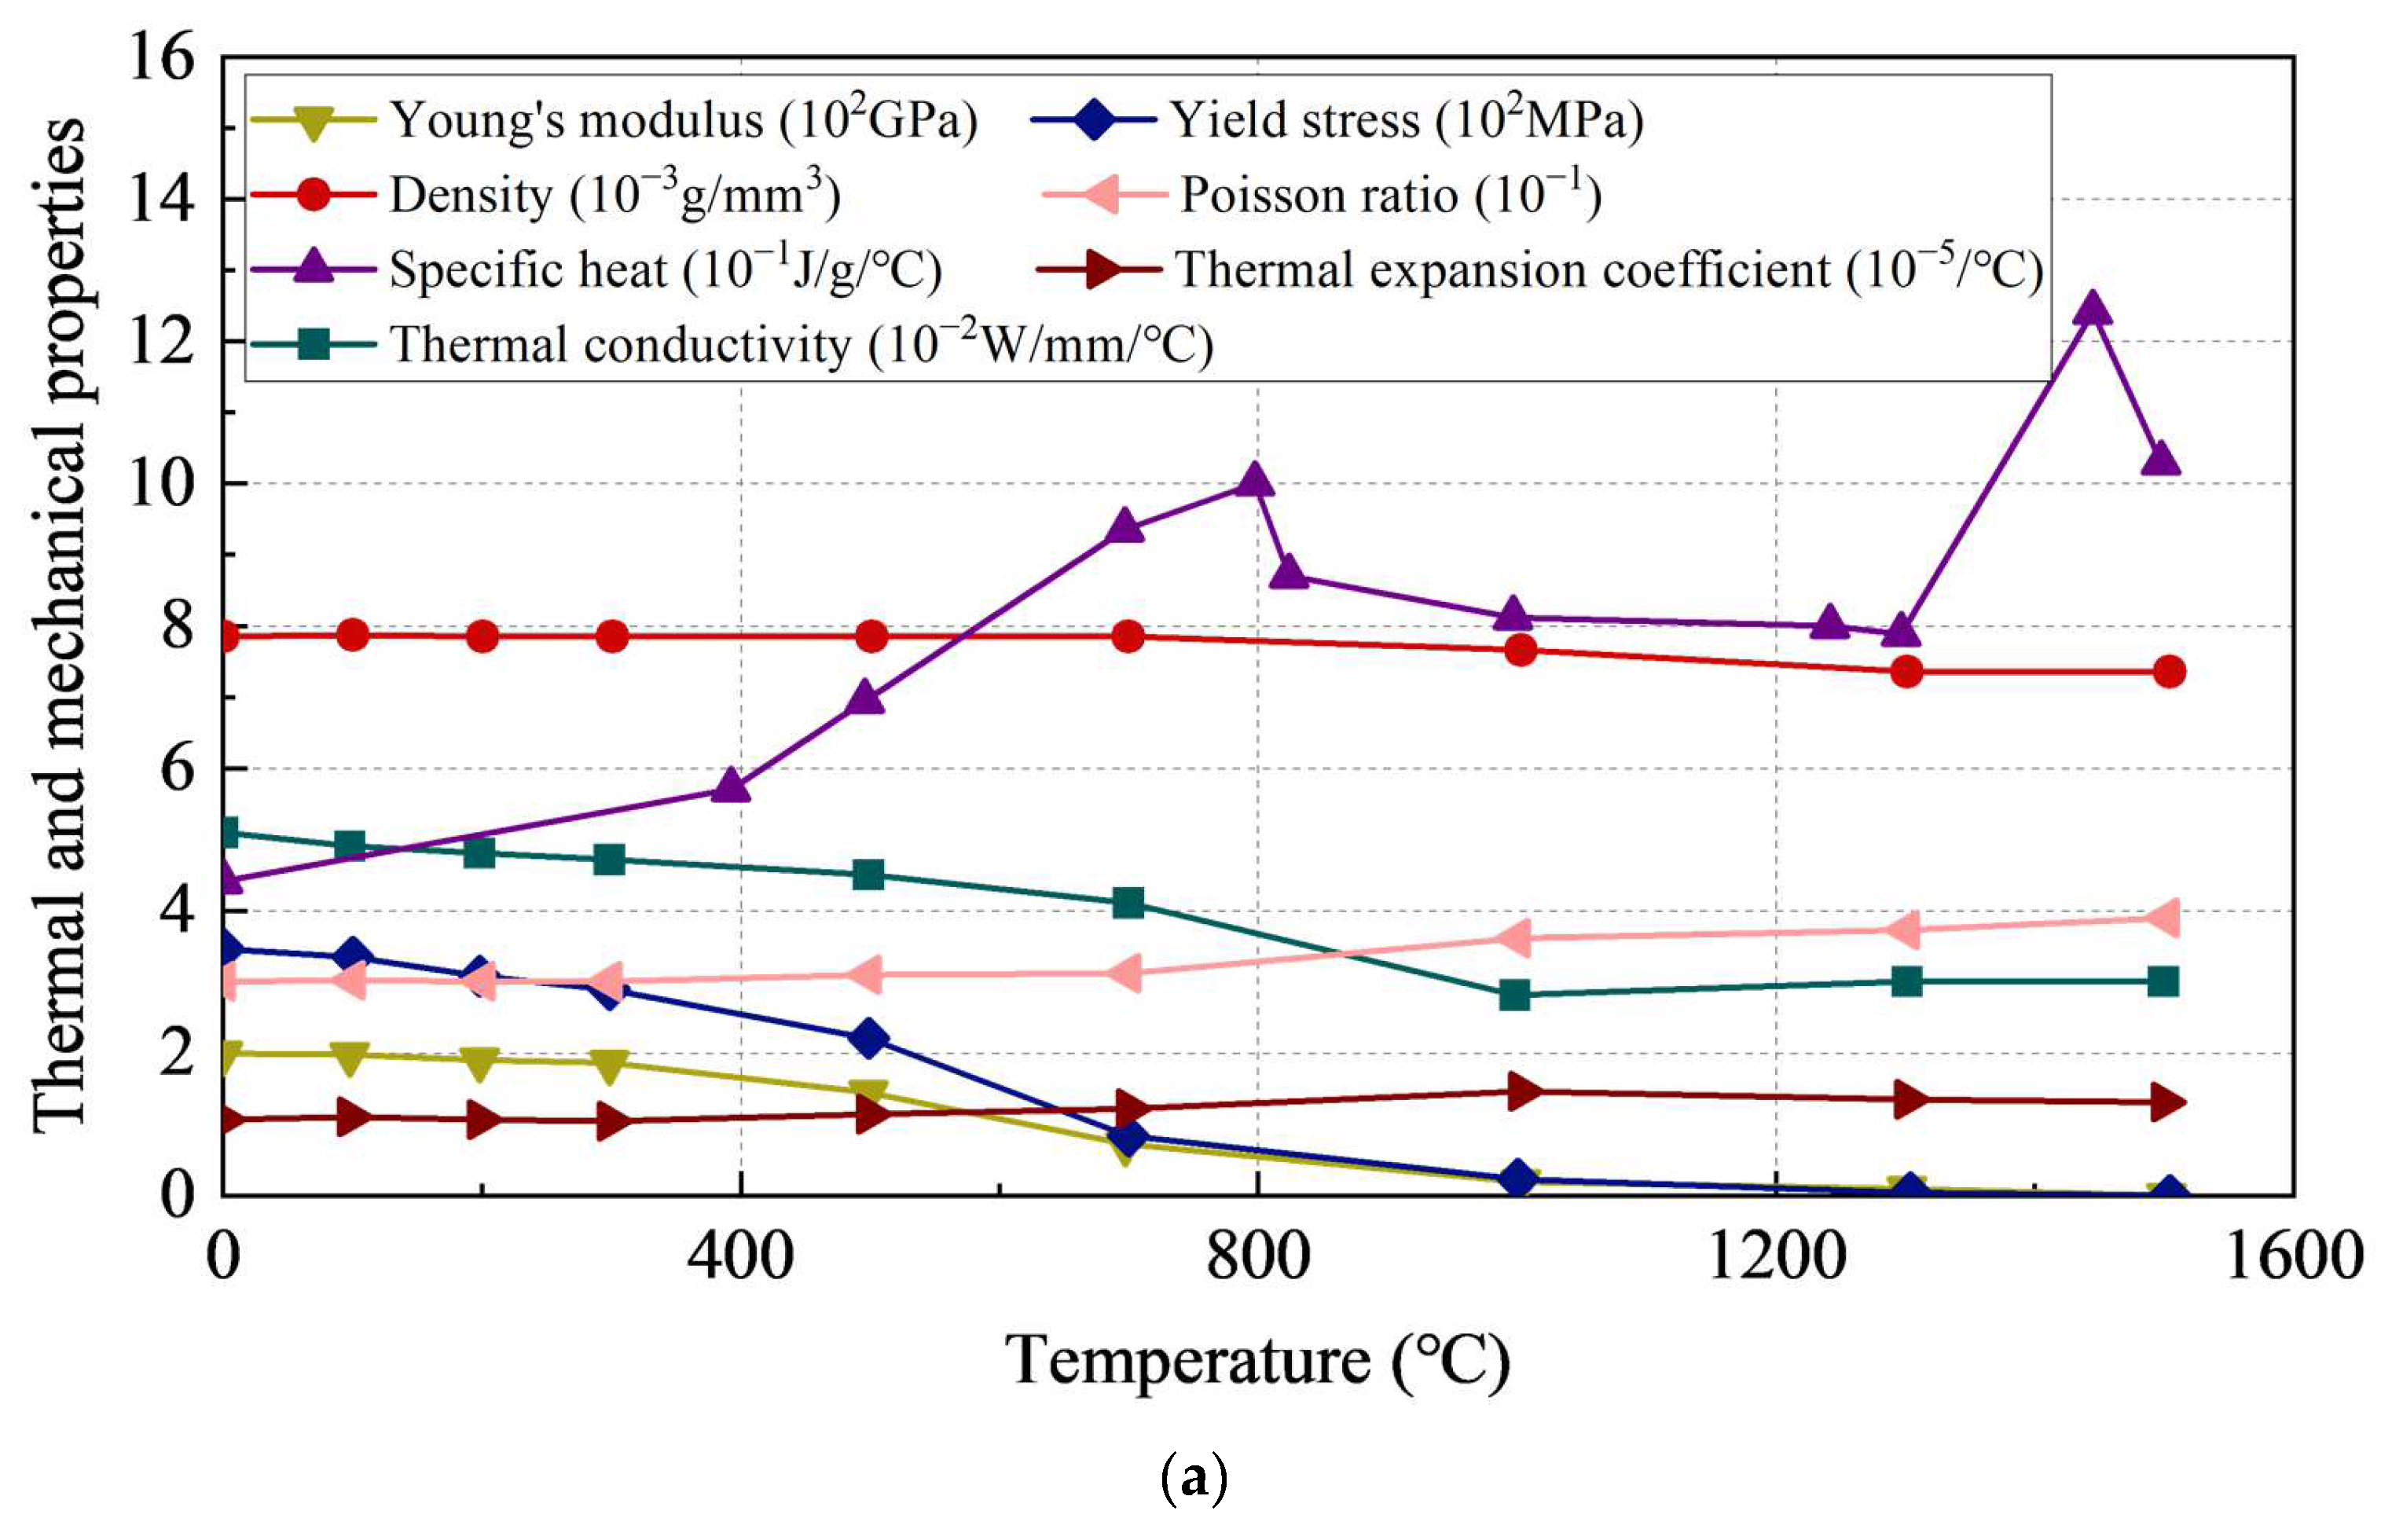
3.2. Thermal Properties of Materials

Ideal elastic–plastic constitutive models were employed for the steel plates, bolts and fillet welds, with the same material properties as the specimens. The welding process involves complex thermodynamic issues, and the thermal and mechanical properties of materials change with temperature. This includes changes in the Young’s modulus, yield stress, Poisson ratio and so on. Therefore, it is necessary to consider the effects of high temperatures on steel and electrodes, including the absorption or release of heat during solid and liquid phase transition. The latent heat was taken as 270 J/g, with the solidus temperature at 1450 °C and the liquidus temperature at 1500 °C. The temperature-dependent material properties were adopted from [45,46] and are illustrated in Figure 6.

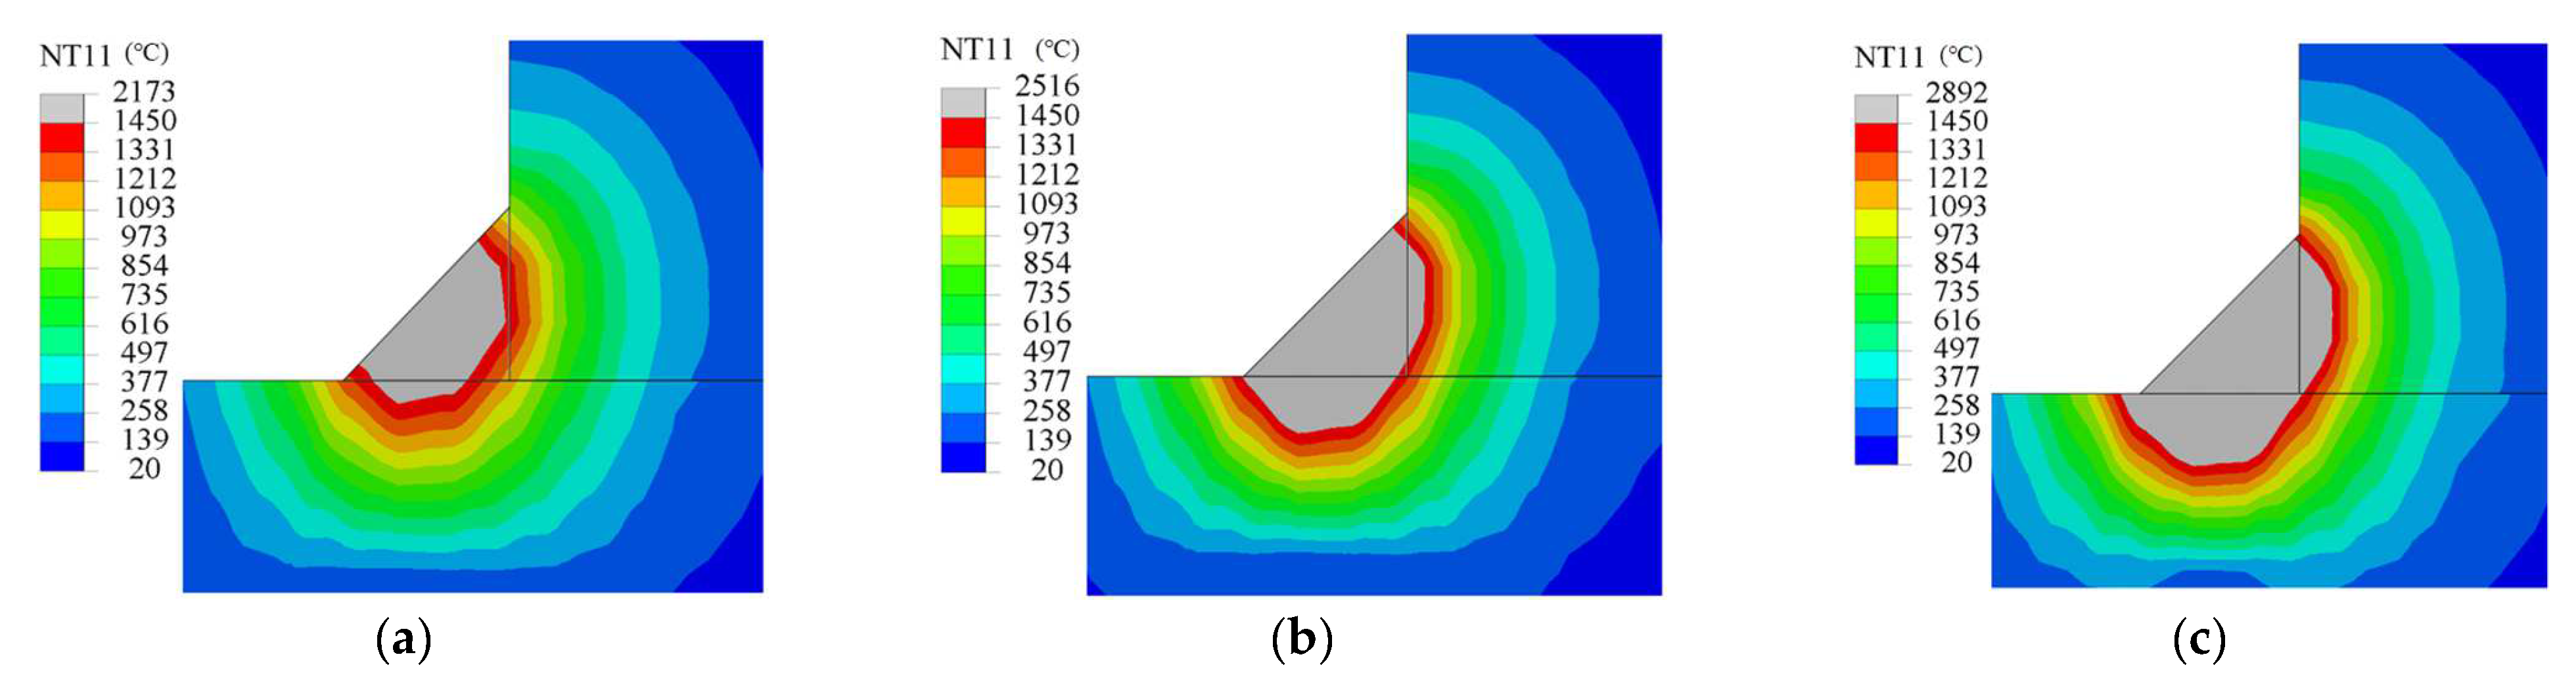
3.3. Thermal and Mechanical Analysis

For the simulation of the welding heat source, the double ellipsoidal heat source model proposed by Goldak et al. [47] was employed, as presented in Figure 7.
The volumetric heat flux distribution for the front half of the ellipsoid is
q ( x , y , x , t ) = 6 3 Q f r a b c r π π exp ( 3 x 2 c r 2 3 y 2 a 2 3 z 2 b 2 )
The volumetric heat flux distribution for the rear half of the ellipsoid is
q ( x , y , x , t ) = 6 3 Q f b a b c b π π exp ( 3 x 2 c b 2 3 y 2 a 2 3 z 2 b 2 )
where Q is the total heat input, Q = ηUI; η is the efficiency of the heat input, and for the shielded metal arc welding used in this study, η is generally taken as 0.85; U is the arc voltage and I is the current; x, y and z are the geometric coordinates; a is the semi-axis length in the width direction of the heat source, taken as 4 mm; b is the semi-axis length in the depth direction of the heat source, taken as 5.5 mm; cf and cb are the semi-axis lengths in the front and rear directions of the heat source length, taken as 4 mm and 8 mm; fr and fb are energy grading parameters such that fr + fb = 2, taken as 1.33 and 0.67, respectively.
The welding heat source moved at a speed of 6 mm/s. During the heating and cooling stages, the material undergoes heat transfer with the surrounding environment. Convective and radiative heat dissipation follow Newton’s law, and the relationship between heat flux density and the heat transfer coefficient is
q 1 = h T 2 T 1
where q1 is the heat flux density; T1 is the surface temperature of the specimen; T2 is the ambient temperature, which is taken as 20 °C; h is the convective heat transfer coefficient, which is taken as 10 W/(m2·K).
Relative heat transfer is considered according to the Stefan–Boltzmanm law as follows:
q 2 = ε δ ( T 1 + 273.15 ) 4 ( T 2 + 273.15 ) 4
where ε is the radiative heat transfer coefficient, which is taken as 0.8; δ is the Stefan–Boltzmanm constant, which is taken as 5.67 × 10⁻⁸ W·(m−2·K−4).
The thermal analysis was firstly conducted to obtain the temperature field data and then apply these data as thermal loadings to the joint for the mechanical analysis to calculate the residual stress distribution. The shape parameters, movement direction, welding speed, etc., of the volumetric heat source were defined through a Dflux file. The welding process was simulated using the ‘Model Change’ command. All weld elements were ‘killed’ before welding and then gradually activated by restoring their stiffness and material properties during the welding process. To facilitate data mapping, the finite element models used in the thermal and mechanical analyses should be kept consistent. In the mechanical analysis, the element type should be changed from DC3D8 to C3D8R.

3.4. Model Validation

The developed finite element models were validated with the test results in Figure 3 and Figure 4. Figure 8 shows comparisons of the time–temperature curves between the test and finite element results. It can be seen that the time–temperature curves obtained from the test and finite element calculations exhibit identical patterns of variation. However, the test results and finite element results do not completely overlap. This can be attributed to each fillet weld not being continuous in the actual welding process, resulting in unstable time control, while ideal time control could be achieved in the finite element simulation. Additionally, the ambient temperature during the actual welding process may have differed slightly from the finite element parameters.
Figure 9 illustrates comparisons of longitudinal and transverse residual stresses between the test and finite element results. It can be seen that the average difference between the test and finite element results is 13%, which suggests that the developed finite element model could accurately capture the residual stresses in the combined bolted–welded joints.

4. Effects of Manufacturing Processes on Residual Stress

4.1. Possible Manufacturing Processes

Based on the developed finite elements, the effects of welding sequences and welding parameters on the residual stresses and deformations were evaluated. Figure 10 depicts the numbering of the weld seams. There were a total of six weld seams existing in the joint. The possible welding sequences were investigated as follows:
  • Welding sequence 1: 1#→2#→3#→4#→5#→6#;
  • Welding sequence 2: 1#→2#→4#→5#→3#→6#;
  • Welding sequence 3: 1#→4#→2#→5#→3#→6#;
  • Welding sequence 4: 1#→4#→2#→5#→3#→6# (where seams 4#, 5# and 6# are welded in the opposite direction to that shown in Figure 10).
For the welding process, the specific parameters were studied as follows: welding power at 5000 W, 6000 W and 7000 W; welding speed at 4 mm/s, 6 mm/s and 10 mm/s; and post-weld heat treatments of no insulation, insulation at 200 °C and insulation at 300 °C.

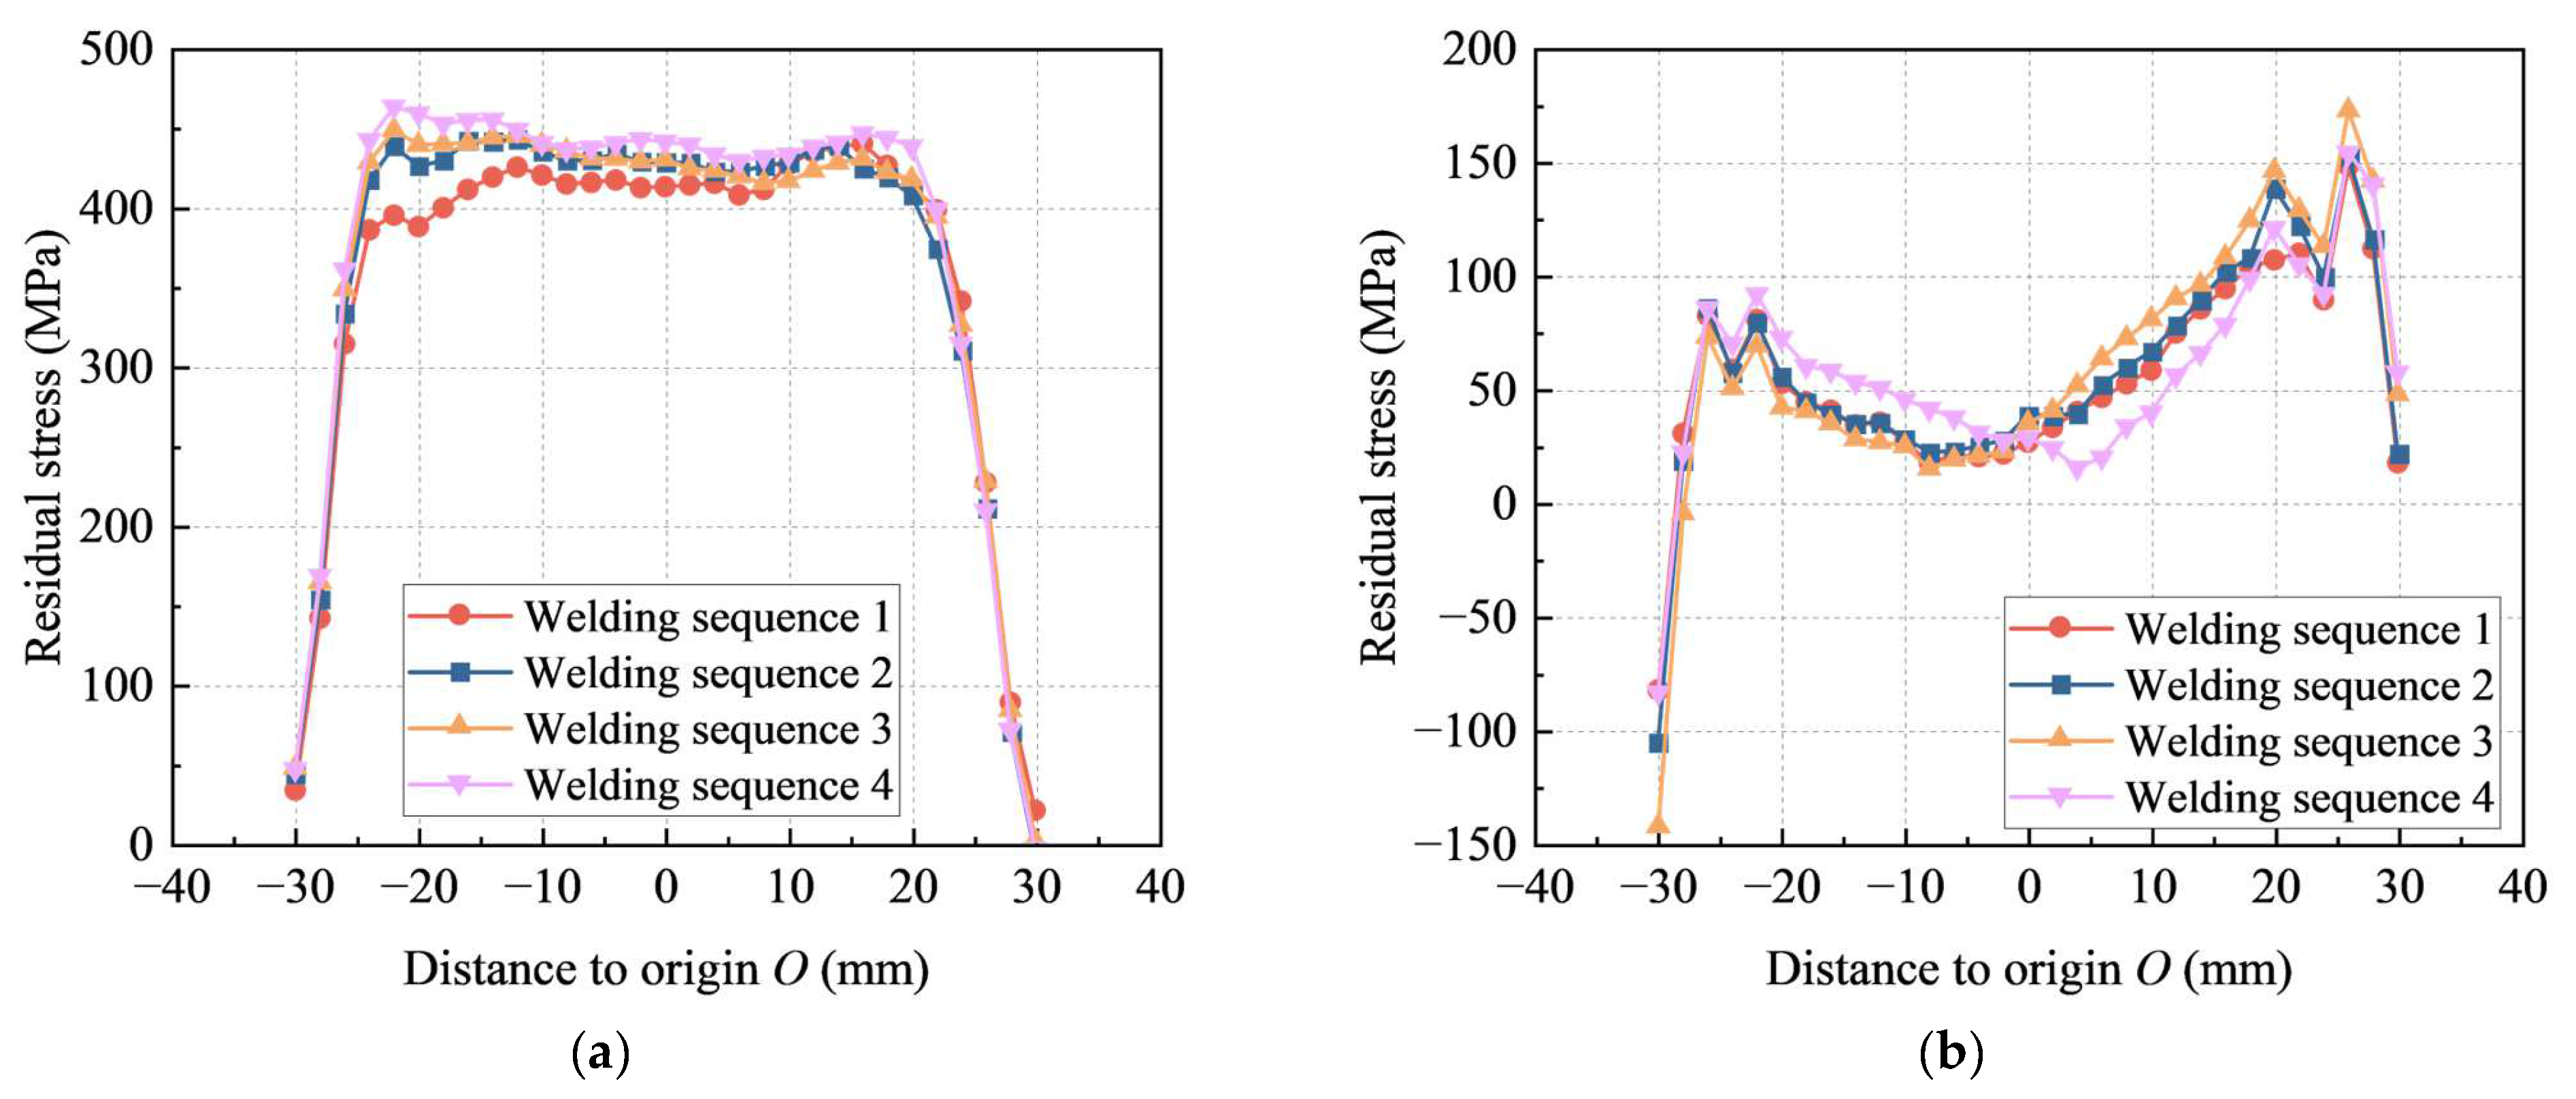
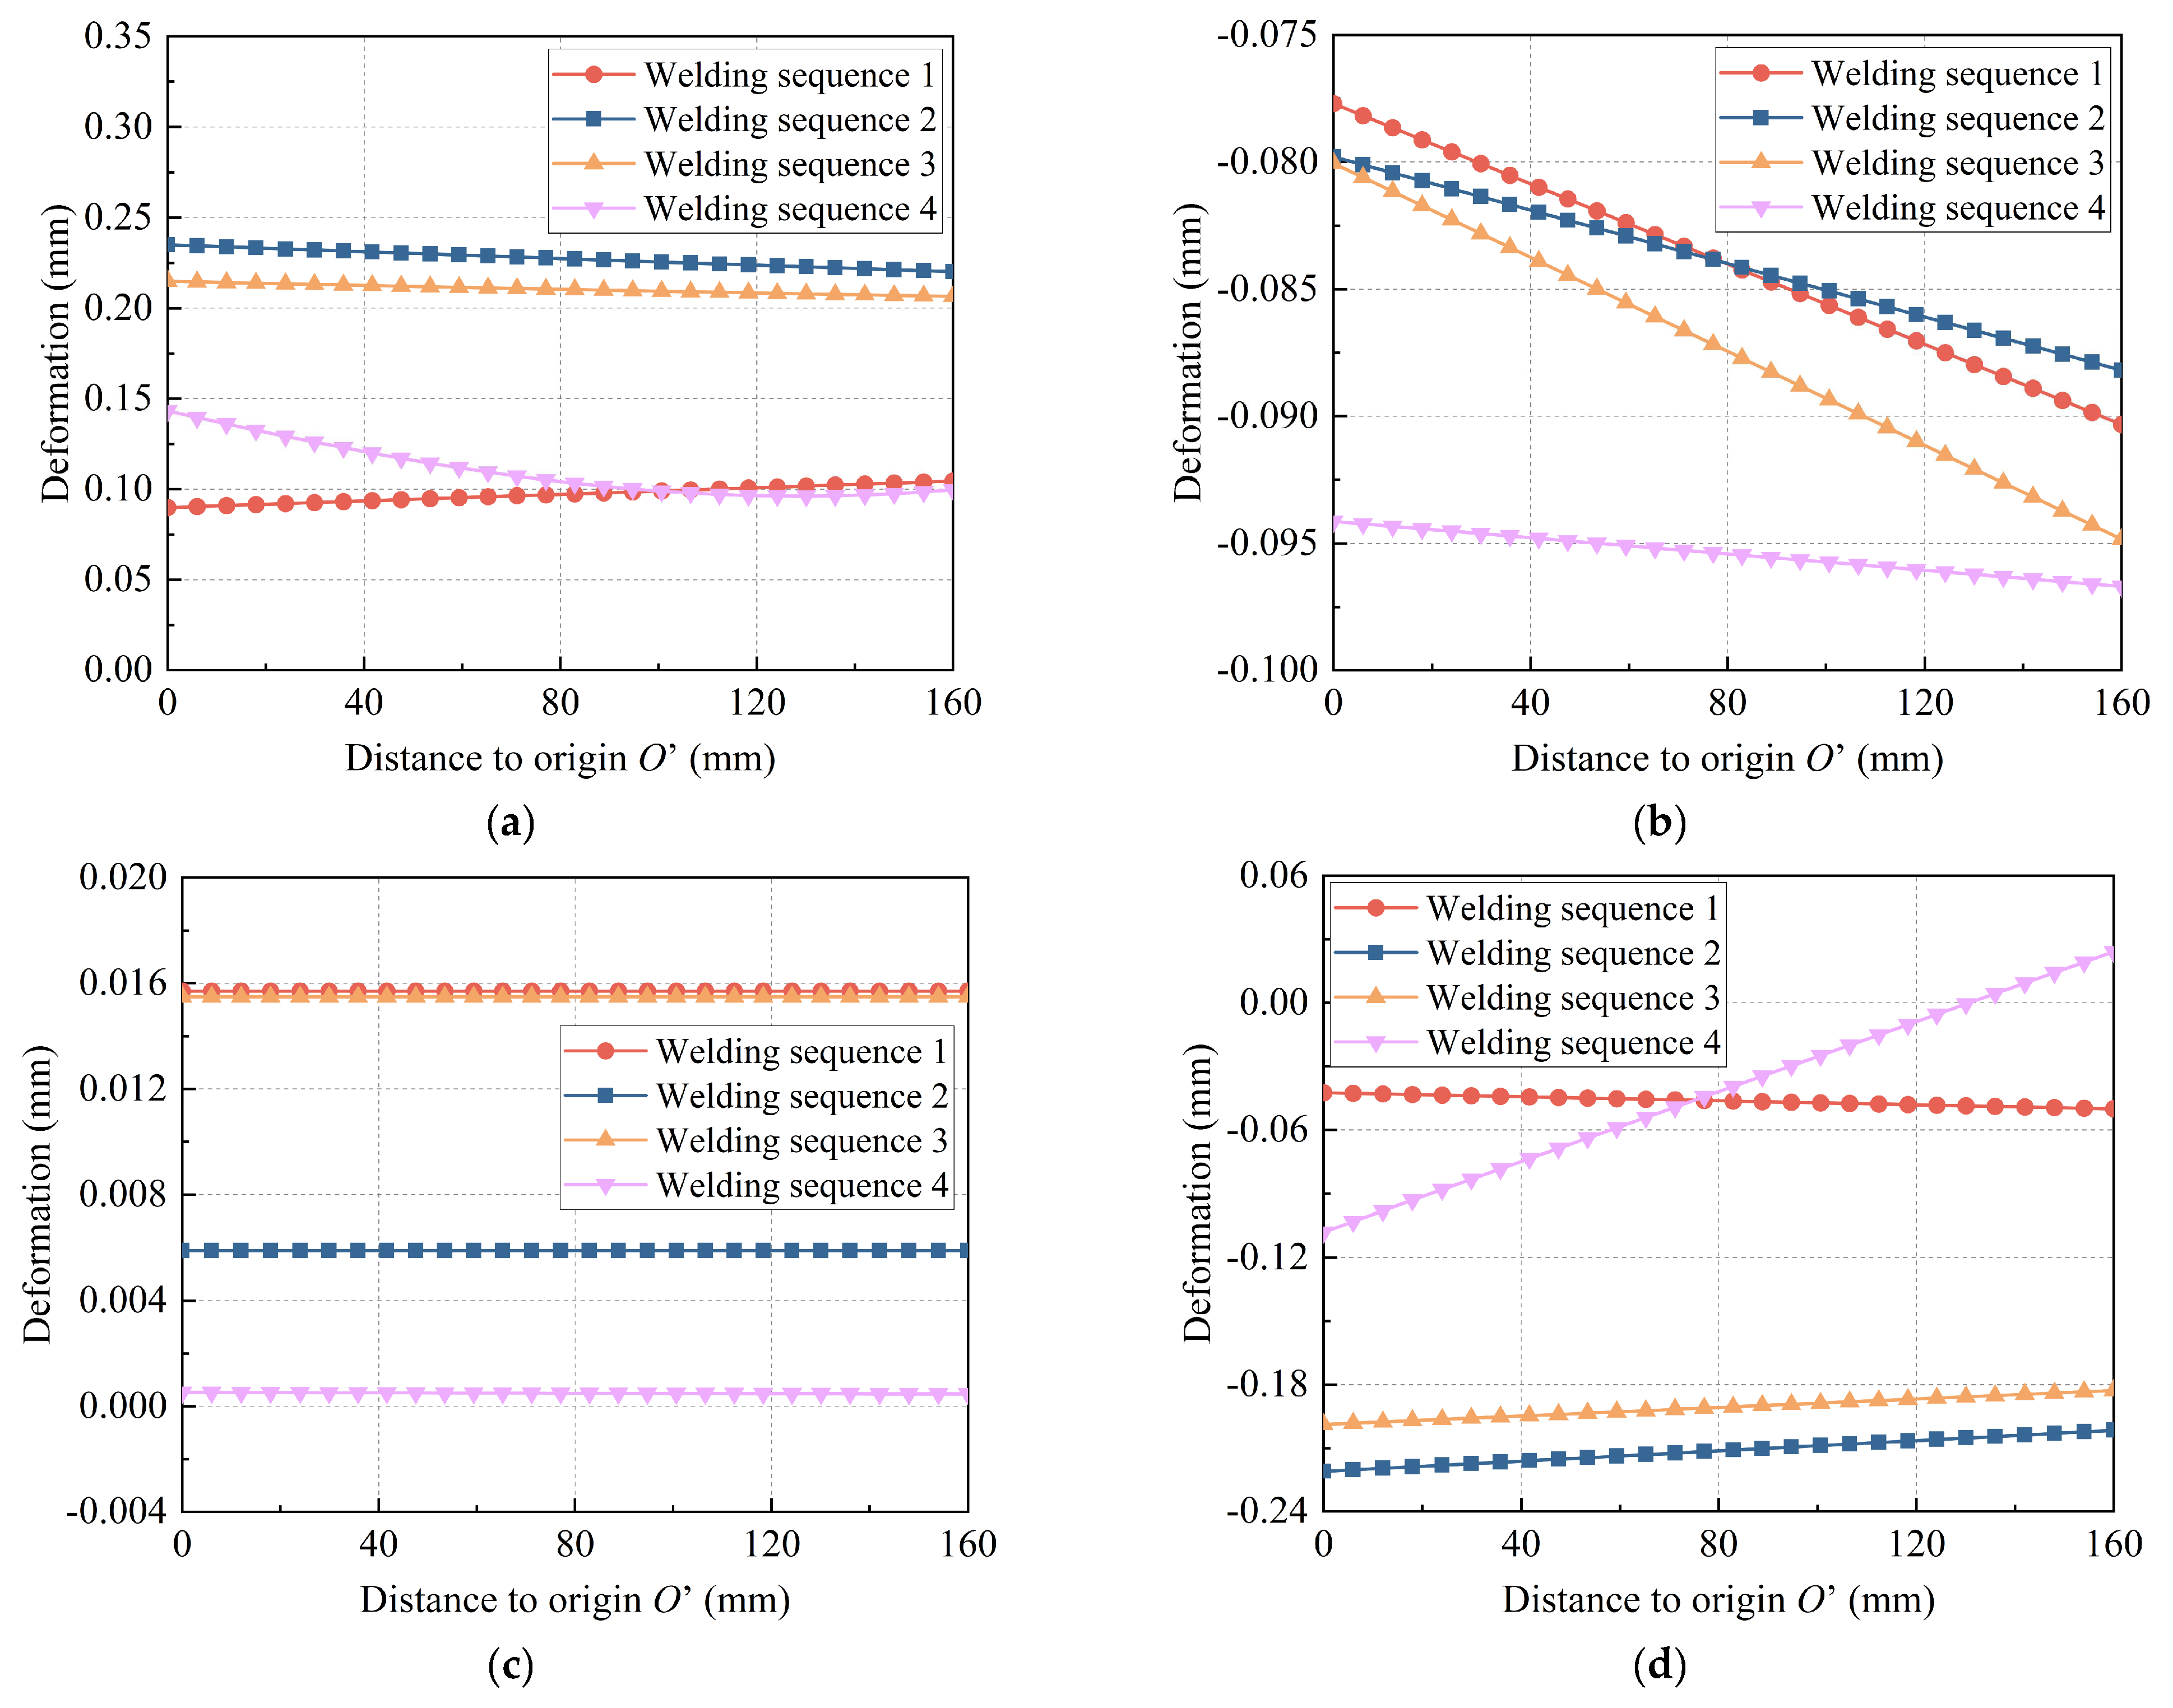
4.2. Effects of Welding Sequences on Residual Stresses

It was revealed in this test that welding seam 4# had significant effects on the residual stresses along seam 1#; thus, it is representative to analyze the respective residual stress distributions along path 1 and path 2, as shown in Figure 11. Also, due to the short welding interval between seam 1# and seam 4# in welding sequences 3 and 4, the residual stress in seam 1# is not fully developed. Therefore, analyzing the effects of seam 4# on the residual stress along seam 1# is of little significance.
Figure 12 illustrates the residual stress distribution under welding sequence 1. Before the welding of seam 4#, the longitudinal residual stress along path 1 rapidly increased from 59 MPa to a relatively uniform stress distribution, ranging from 423 MPa to 473 MPa, and then decreased to 70 MPa near the welding termination point, as shown in Figure 12a. The transverse residual stresses along path 1 were compressive with a maximum value of −174 MPa on both sides, while tension predominated in the middle section of the seam, as shown in Figure 12b. After the welding of seam 4#, the residual stress generated in seam 1# unevenly decreased because of temperature conduction rates and local heating effects. The maximum longitudinal residual stress decreased from 473 MPa to 437 MPa, with a reduction of 8%, and the maximum transverse residual stress decreased from −174 MPa to −96 MPa, with a reduction of 45%.
For path 2, the heat-affected zone farther from the seam with lower temperature had longitudinal compressive stresses due to the expansion deformation from higher temperatures in the seam and vice versa, as shown in Figure 12c. The maximum longitudinal residual tensile stress was 434 MPa. The transverse residual stress along path 2 showed no clear pattern but generally exhibited tensile stress with a maximum value of 87 MPa, as shown in Figure 12d. After the welding of seam 4#, the maximum longitudinal residual stress decreased from 434 MPa to 410 MPa, with a reduction of 6%, and the maximum transverse residual stress decreased from 87 MPa to 77 MPa, with a reduction of 11%.
Figure 13 illustrates the residual stress distribution under welding sequence 2. Similar patterns of change in the residual stress distribution along path 1 and path 2 to those for welding sequence 1 were observed for welding sequence 2. After the welding of seam 4#, the maximum longitudinal residual stress along path 1 decreased from 492 MPa to 434 MPa, with a reduction of 12%, as shown in Figure 13a, and the maximum transverse residual stress decreased from −193 MPa to −112 MPa, with a reduction of 42%, as shown in Figure 13b. Also, the maximum longitudinal residual stress along path 2 decreased from 445 MPa to 412 MPa, with a reduction of 7%, as shown in Figure 13c, and the maximum transverse residual stress decreased from 91 MPa to 72, with a reduction of 21%, as shown in Figure 13d.
Figure 14 presents the residual stress distribution after complete cooling for different welding sequences. Overall, comparing the longitudinal residual stress values along path 1, the order was as follows: welding sequence 1 < welding sequence 2 ≈ welding sequence 3 < welding sequence 4. The transverse residual stresses along path 1 for welding sequences 1, 2 and 3 showed a consistent trend, while that for welding sequence 4 was different. For the longitudinal residual stress along path 2, welding sequence 1 obtained the smallest value at 413 MPa, followed by welding sequences 2 and 3, and welding sequence 4 obtained the largest value at 441 MPa. The ranking of the transverse residual stress for different welding sequences was the same, with a maximum value of 236 MPa and a minimum value of 208 MPa.

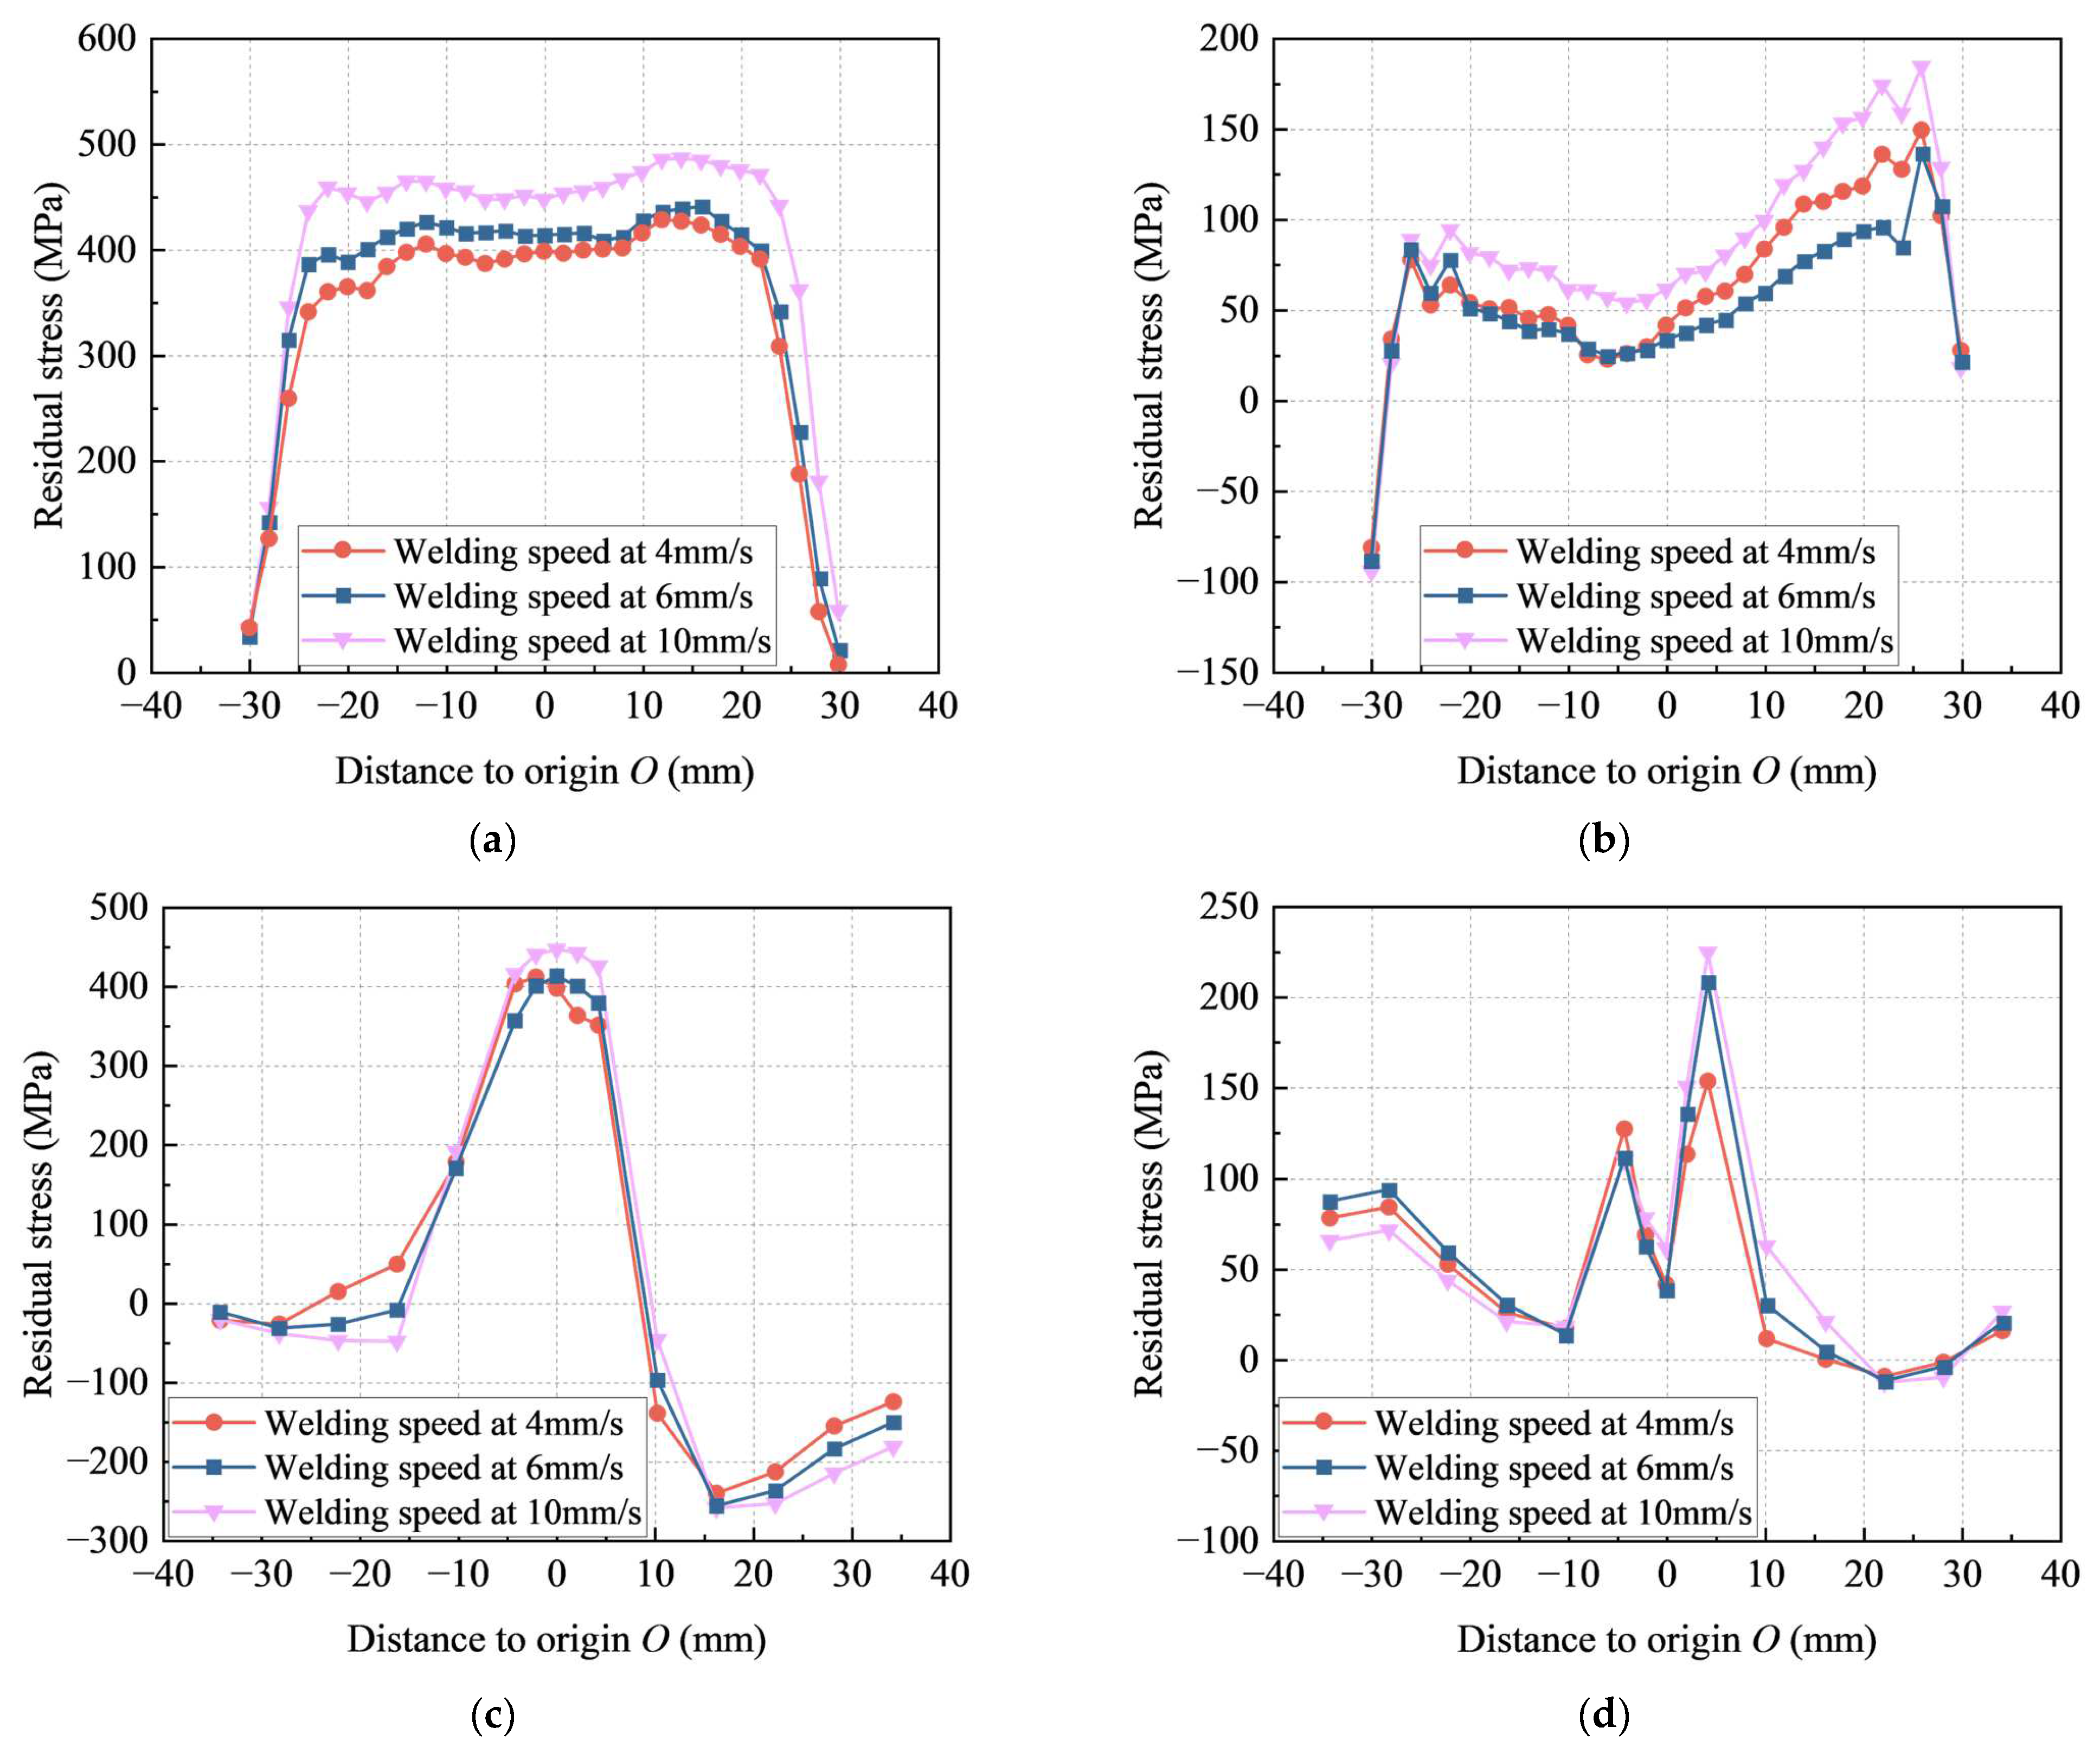
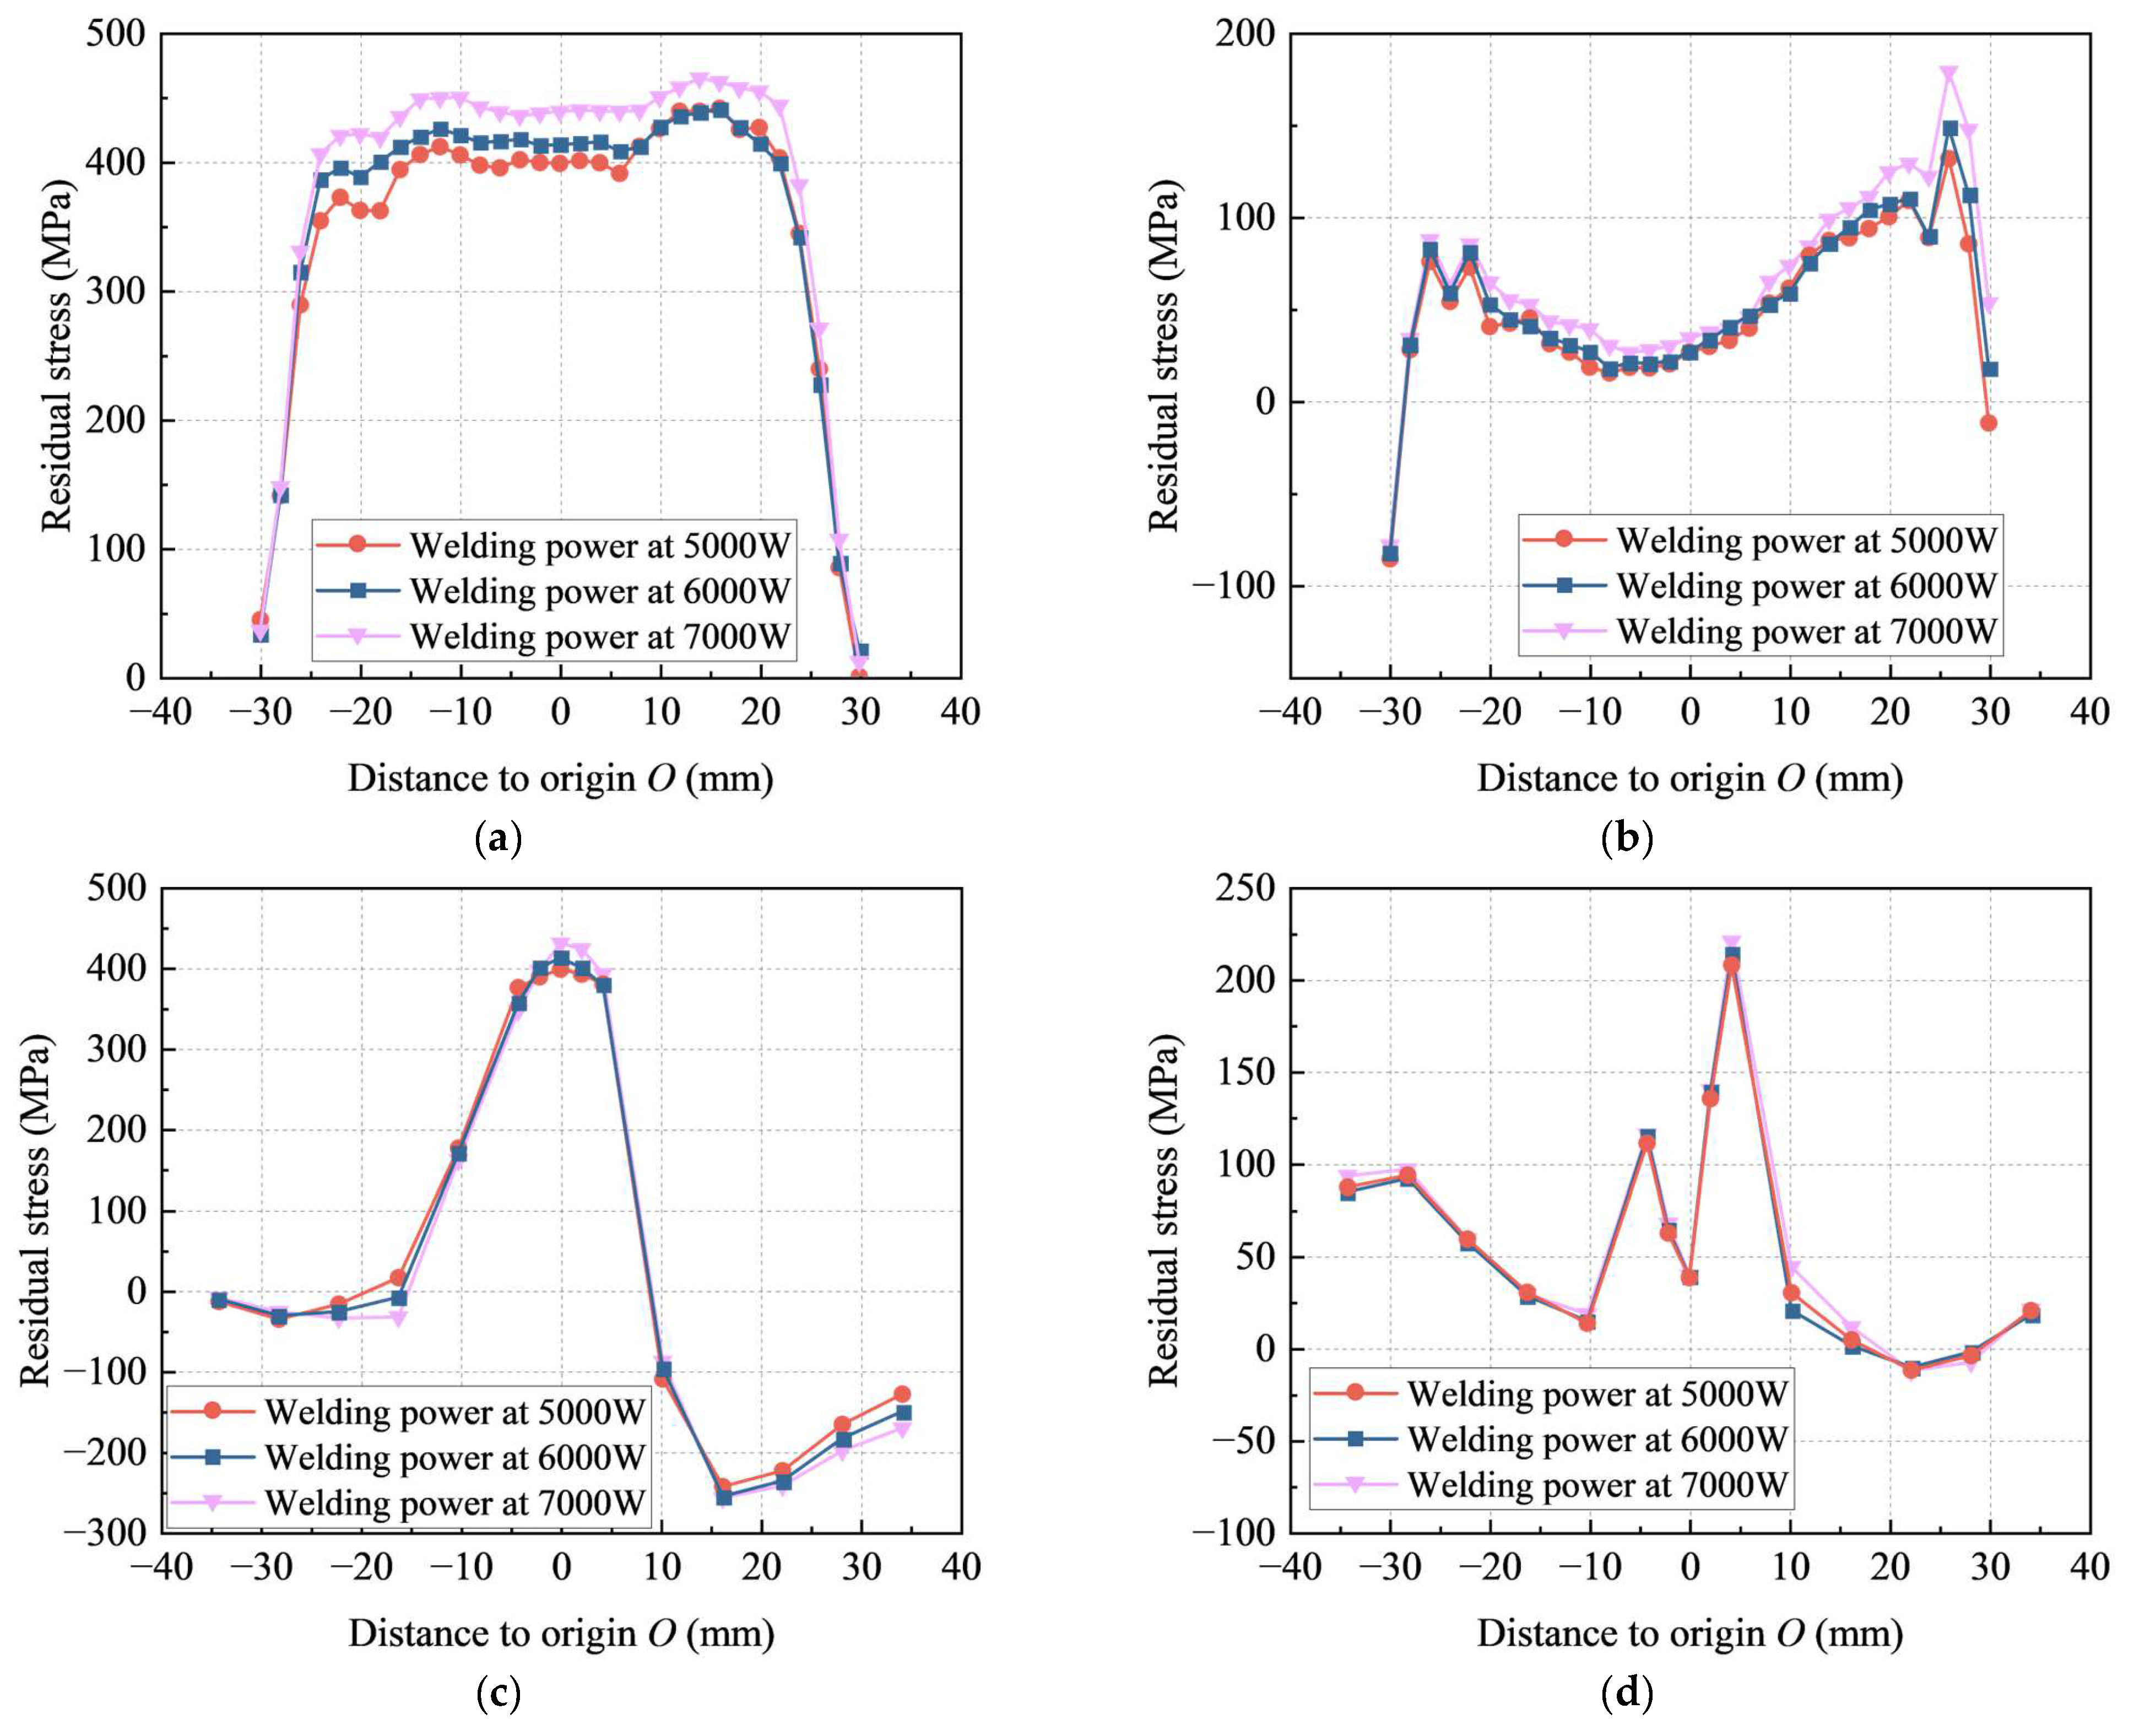
4.3. Effects of Welding Parameters on Residual Stresses

Using welding speed as the control variable, with the same welding heat input, welding speeds of 4 mm/s, 6 mm/s and 10 mm/s were employed. The equation for calculating the welding line energy is as follows:
E = η U I v
where E is the welding line energy; v is the welding speed.
As the welding speed decreased, the temperature at the measurement points increased. As shown in Figure 8, the highest temperatures at the measurement points for welding speeds of 4 mm/s, 6 mm /s and 10 mm/s were 439 °C, 337 °C and 232 °C, respectively. The second peak temperatures were 356 °C, 293 °C and 221 °C, respectively. The welding line energies were 127.5 J/mm, 85 J/mm and 51 J/mm, respectively.
Figure 15 shows the residual stress distribution for different welding speeds. As the welding speed increased, the longitudinal peak stresses along path 1 were 428 MPa, 441 MPa and 487 MPa, respectively, while the transverse peak stresses were 149 MPa, 136 MPa and 185 MPa, respectively. The longitudinal peak stresses along path 2 were 412 MPa, 413 MPa and 447 MPa, respectively, while the transverse peak stresses were 153 MPa, 208 MPa and 225 MPa, respectively. Many scholars have studied the effect of welding speed on the distribution of residual stresses. The analysis results from Ravisankar et al. [48] and Patel S et al. [49] are consistent with those of this study, where the peak residual stress increased with an increase in welding speed. As the welding speed increased, the heat input per unit length gradually decreased, while the penetration depth, weld width and weld pool area decreased. Therefore, the deformation caused by the welding temperature occurred only in a relatively small area, and the ability for synchronized expansion and contraction deformation was weaker, resulting in a larger residual stress.
As the welding heat input increased, the weld temperature rose. As shown in Figure 16, the maximum weld temperatures at welding powers of 5000 W, 6000 W and 7000 W were 2173 °C, 2516 °C and 2892 °C, respectively. Under the effects of thermal radiation and heat convection, the weld temperature was transferred to the surrounding base material. Higher welding temperatures meant that a larger area of the base material around the weld reached the liquidus limit of 1450 °C, increasing the cross-sectional area of the weld pool.
Figure 17 shows the residual stress distributions for different welding powers at a welding speed of 6 mm/s. As the heat input increased, the longitudinal peak stresses along path 1 were 441 MPa, 442 MPa and 465 MPa, respectively, while the transverse peak stresses were 132 MPa, 149 MPa and 179 MPa, respectively. The longitudinal peak stresses along path 2 were 399 MPa, 413 MPa and 431 MPa, respectively, while the transverse peak stresses were 208 MPa, 214 MPa and 221 MPa, respectively. This indicated that higher heat input caused the material to remain at high temperatures for a longer period, resulting in greater plastic deformation and larger residual stress upon cooling. Conversely, lower heat input resulted in less plastic deformation and smaller residual stress.
After the welding process was completed and the welded components were cooled to room temperature, they were slowly heated to specified temperatures of 200 °C and 300 °C and held at these temperatures for a period of time. This allowed the material to undergo thermal deformation and sufficient creep. The components were then gradually cooled back to room temperature. The joints were heated at uniform rates of 1.7 °C/min and 2.6 °C/min and held for 3 h, followed by uniform cooling at rates of 0.7 °C/min and 1.1 °C/min to room temperature.
Figure 18 shows the residual stress distributions for different post-weld heat treatments. It was found that the longitudinal peak stresses along path 1 for cases of no insulation, insulation at 200 °C and insulation at 300 °C were 441 MPa, 367 MPa and 325 MPa, respectively, while the transverse peak stresses were 136 MPa, 88 MPa and 62 MPa, respectively. The longitudinal peak stresses along path 2 for cases of no insulation, insulation at 200 °C and insulation at 300 °C were 413 MPa, 355 MPa and 308 MPa, respectively, while the transverse peak stresses were 208 MPa, 144 MPa and 82 MPa, respectively. Numerous studies on different welding joints have demonstrated the same trend [50,51]. This showed that post-weld holding, as an effective heat treatment method, had a significant stress-relieving effect on residual stress. It could effectively make the distribution of residual stress at the joints more uniform. As the holding temperature increased, the stress-relieving effect became more pronounced.

5. Effects of Manufacturing Processes on Residual Deformation

Figure 19 illustrates the residual deformation distribution after complete cooling for different welding sequences. Except for welding sequence 4, the total deformation distribution along the path was relatively uniform for the welding sequences. Under welding sequence 1, there was essentially no difference in the deformation along path 3. Under welding sequences 2 and 3, there were slight variations in deformation, with sequence 2 exhibiting more significant deformation compared to sequence 3. Under welding sequence 4, the deformation at the ends on both sides of the main plate differed significantly, and there was a tendency for a downward ‘concave’ deformation in the middle of the main plate.
The compressive deformation in the X-axis along path 3 increased for welding sequences 1, 2 and 3. However, welding sequence 4 exhibited more uniform compressive deformation in the X-axis along path 3. The Y-axis deformation in welding sequences 1 and 3 was relatively similar and larger, with welding sequence 2 showing slightly less deformation. Welding sequence 4 exhibited the smallest deformation in the Y-axis, which was nearly 0 mm. Under welding sequences 1, 2 and 3, the main plate experienced a certain upwards warping deformation. In contrast, welding sequence 4 caused downwards warping deformation.

6. Effects of Residual Stresses on Fatigue Behavior

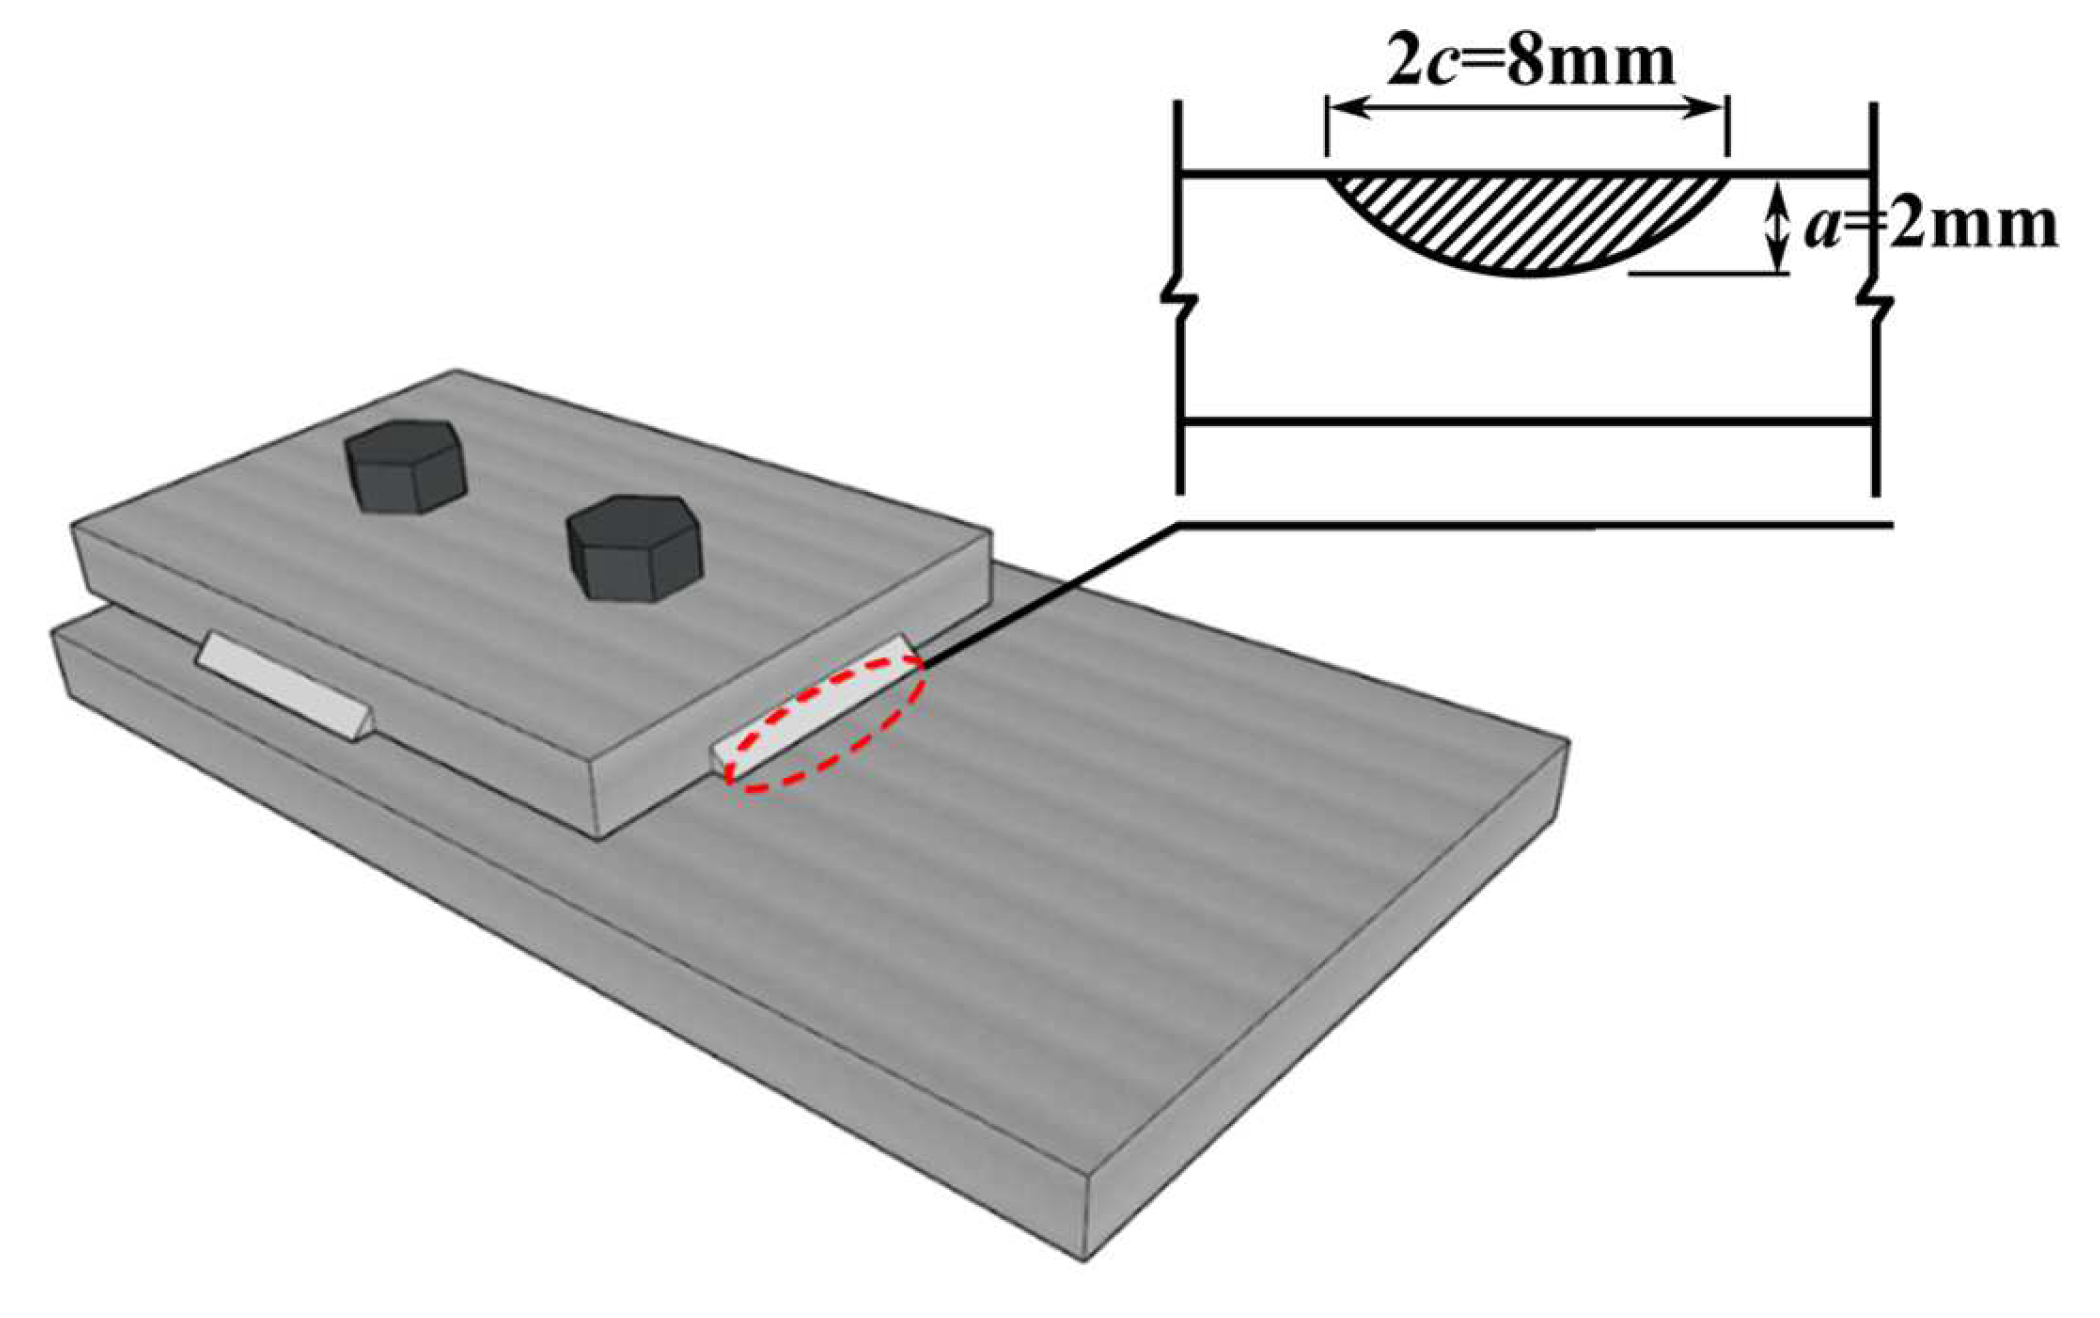
6.1. Finite Element Model with Initial Fatigue Crack

The finite element model of the combined bolted–welded joint with surface cracks was developed using the commercial software ABAQUS. Based on the static analysis results, the maximum stress concentration was located at the weld toe in the middle of the transverse fillet weld. Thus, a semi-elliptical crack with an initial crack length (2c) of 8 mm and initial crack depth (a) of 2 mm was employed, as shown in Figure 20. The left end of the main plate was fixed, and a cyclic displacement with a stress ratio of R = 0.1 and a maximum displacement of 1 mm was applied to the other end.
For the fatigue analysis model, the commonly used solid element type is the eight-node linear brick element with reduced integration (C3D8R). This element has certain advantages in computational efficiency. Additionally, to achieve higher precision and accuracy, some studies have used C3D8 elements. A sensitivity analysis on element types showed a difference of 4.7% in the results of using C3D8R and C3D8; therefore, C3D8R was used in this study.
To track the crack status, three output items, PHILSM, PSILSM and STATUSXFEM, were added in the analysis step. PHILSM visualizes the crack surface by specifying a unique function. PSILSM describes the distance to the initial crack tip, showing the crack propagation direction and trend. The STATUSXFEM value ranges from 0 to 1, where 0 indicates that the crack is not open, 1 indicates a fully open crack and values between 0 and 1 correspond to different degrees of crack opening.
When the crack reaches a certain depth, the structure is no longer able to bear the load. This depth is defined as the critical crack depth. In this investigation, the critical crack depth was taken as the half of the main plate thickness, as specified by the International Institute of Welding (IIW) [52]. Typical finite element results for crack propagation in the combined bolted–welded joint are presented in Figure 21.

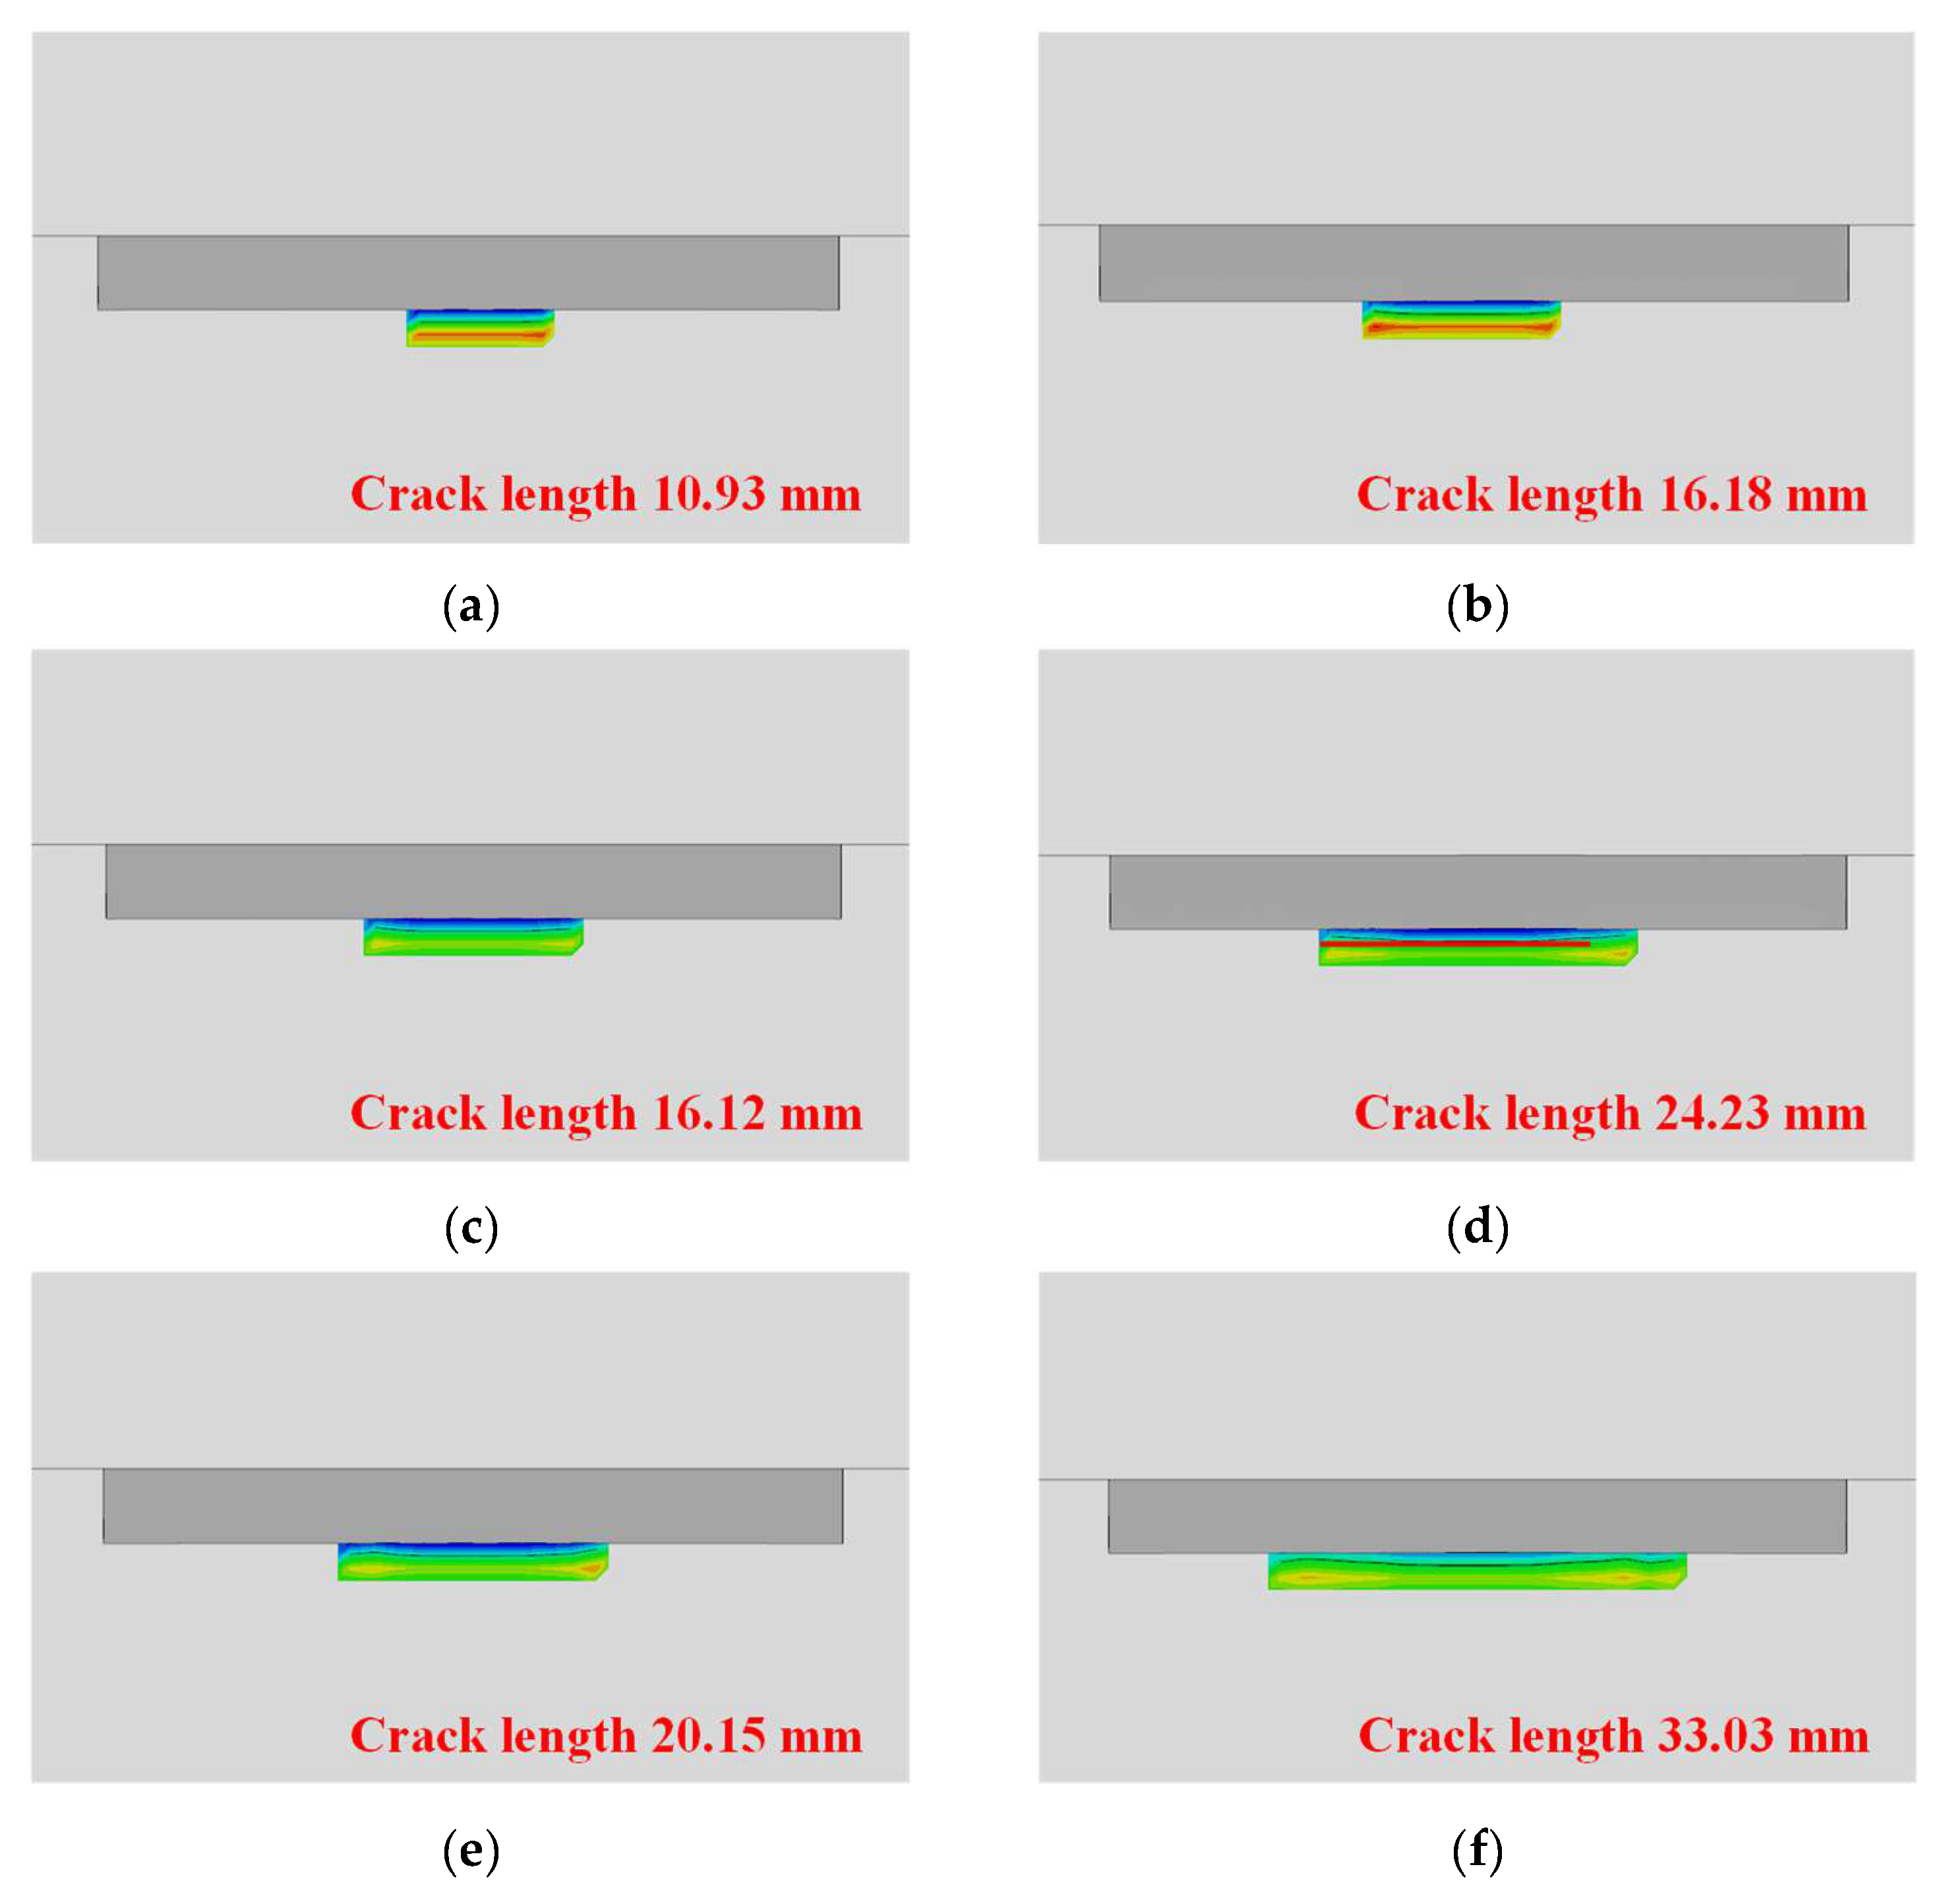
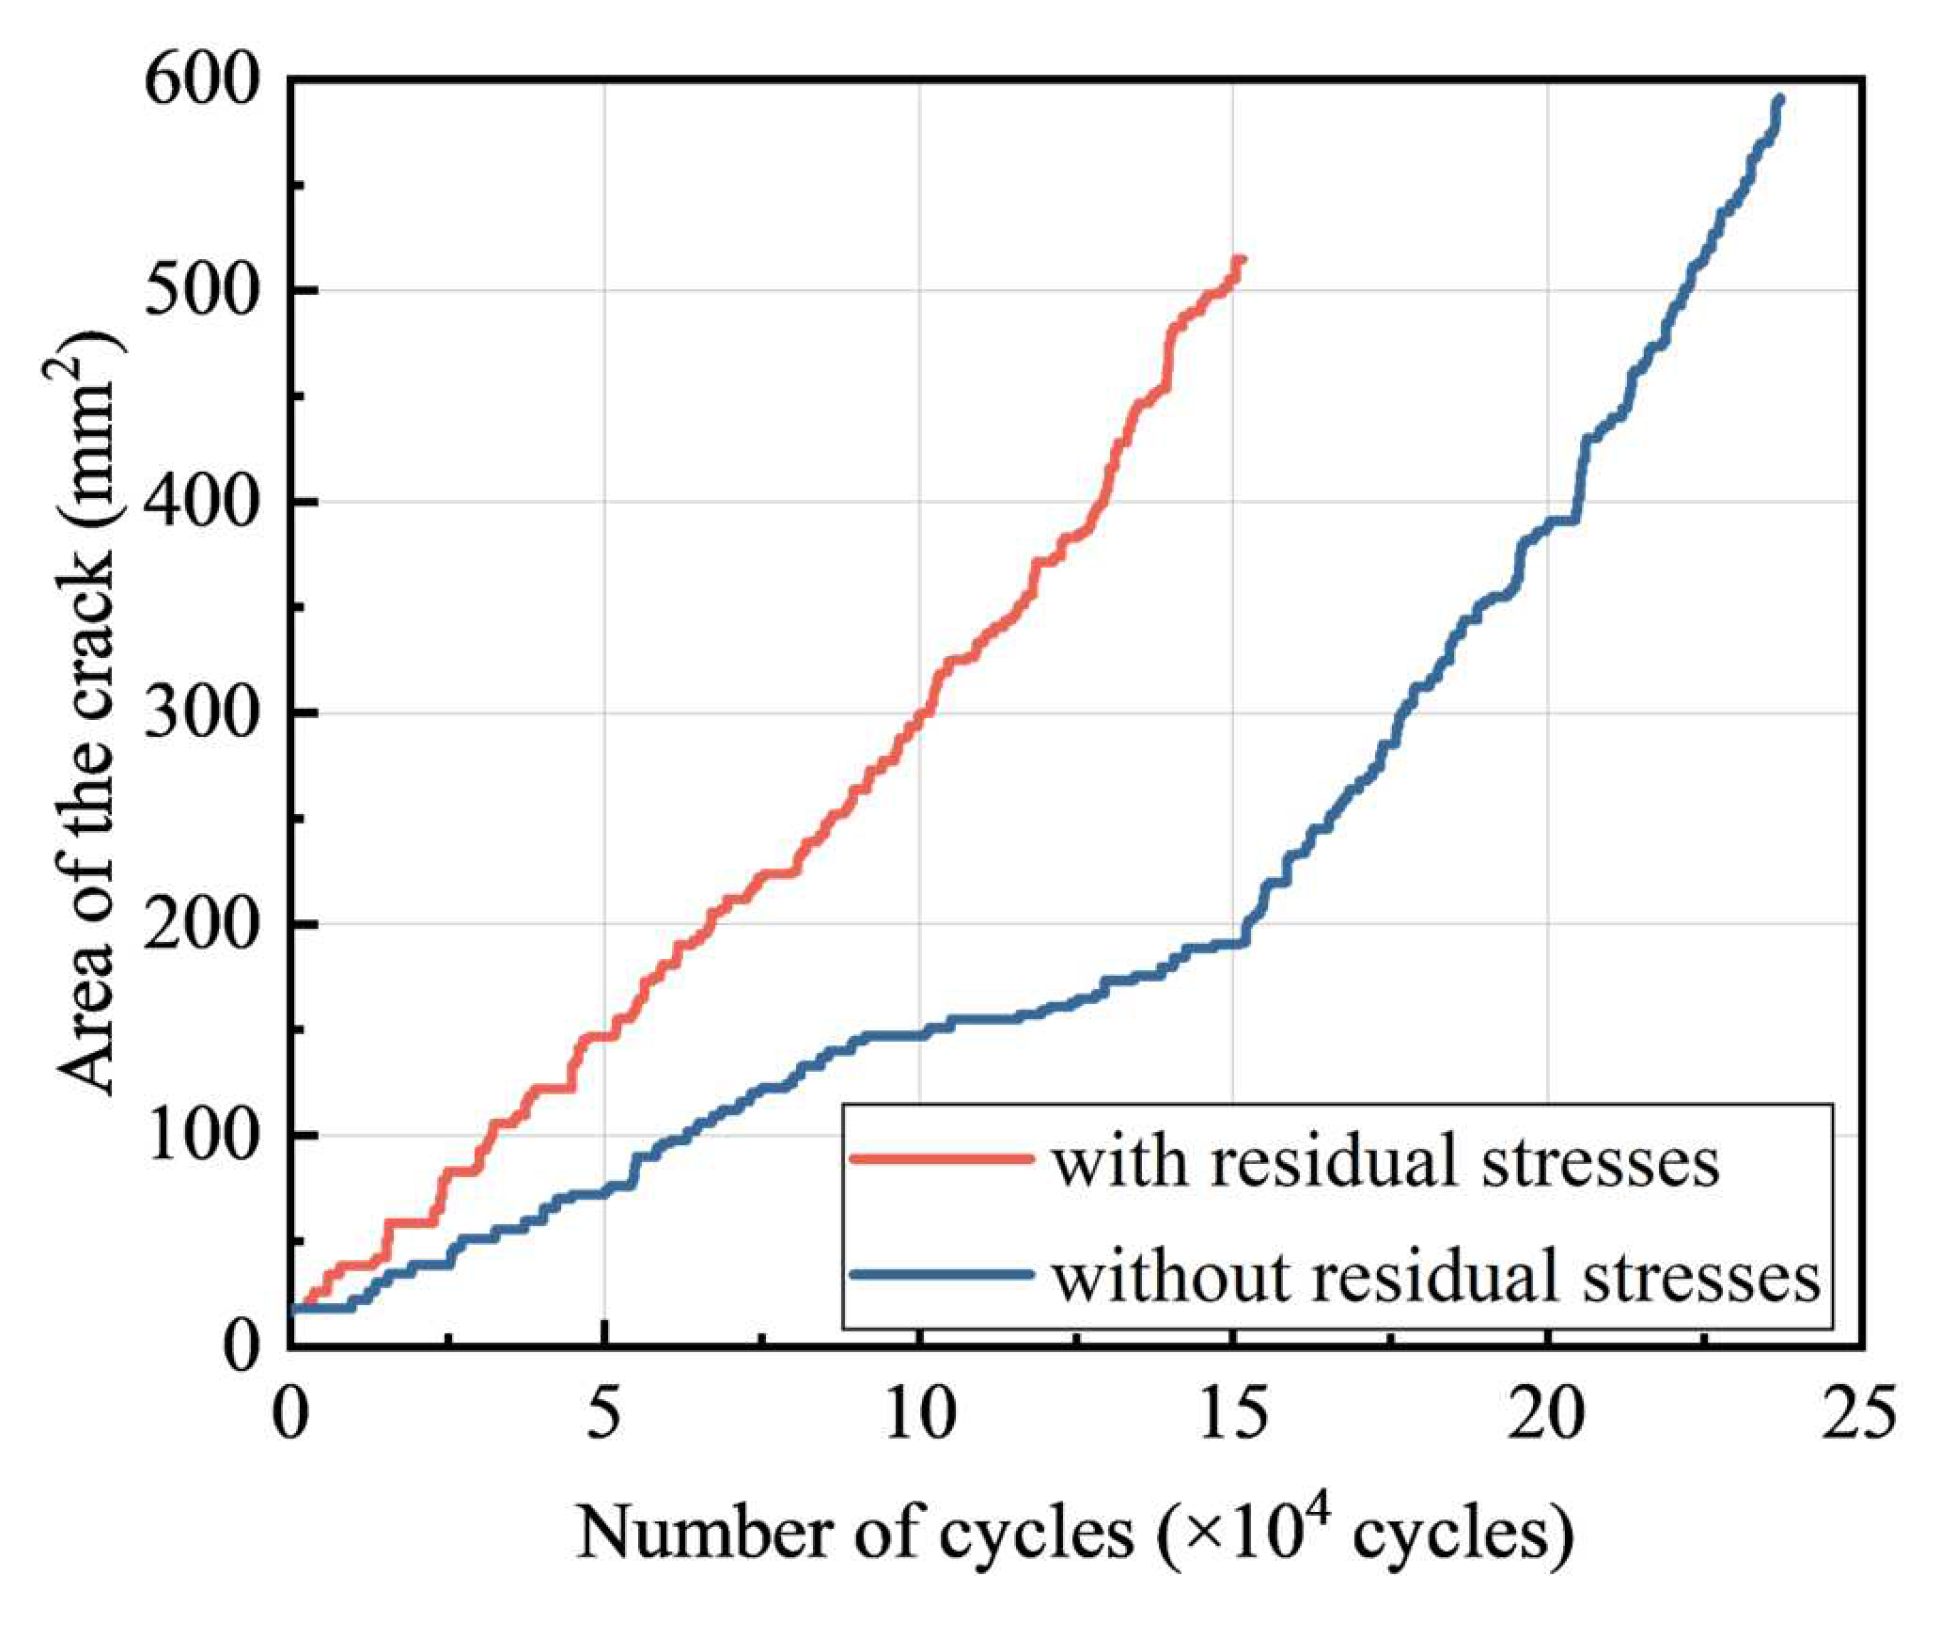
6.2. Effects of Residual Stresses on Crack Propagation

To research the effects of residual stresses on fatigue crack propagation, residual stress should be applied to the model as the initial stress field. The numbers of nodes and other data of the model for fatigue analysis should remain consistent with those of the model for thermal analysis. Thus, models with and without residual stresses were developed, while sequence 1 was employed. Cyclic loadings were then applied in the subsequent analysis to evaluate the fatigue crack propagation.
Figure 22 shows a comparison of crack propagation in the combined bolted–welded joints with and without residual stresses. With the number of loadings reaching 10,000 cycles, the crack length at the initial stage of crack propagation without residual stress was 10 mm, corresponding to a depth of 3 mm. When the influence of residual stresses was considered, the crack length reached 16 mm, with a corresponding depth of 4 mm. The same phenomenon could be observed throughout the entire cycling process, such as at 30,000 cycles and 50,000 cycles. The results clearly showed that for the same number of cycles, the crack length and depth in the joints were significantly larger when residual stresses were considered.
Figure 23 illustrates a comparison of the fatigue lives of combined bolted–welded joints with and without residual stresses. The slope at any point on the curve with residual stresses was greater than that on the curve without residual stresses. The existence of residual stresses caused a faster crack growth rate compared to the case without residual stresses. When the critical crack depth (half of the plate thickness) was reached, the fatigue life for the joint without residual stresses was 181,420 cycles, while the fatigue life for the joint with residual stresses was 108,745 cycles. Cui et al. conducted experiments on welded joints of a bridge [16], and their results showed that the fatigue life of the structure, considering residual stresses, was significantly lower than that without considering them. Therefore, the influence of residual stress on fatigue crack propagation should not be ignored in fatigue assessments of combined bolted–welded joints.

7. Summary and Conclusions

In this study, experimental and numerical investigations were carried out to analyze the residual stress distribution of combined bolted–welded joints. The effects of different welding parameters on the residual stress and residual deformation were evaluated, including the welding sequence and welding process, e.g., the welding speed, welding heat input and post-weld heat treatment. The fatigue behaviors of combined bolted–welded joints with and without residual stresses were compared in terms of the fatigue life of crack propagation. The following conclusions can be drawn from this study:
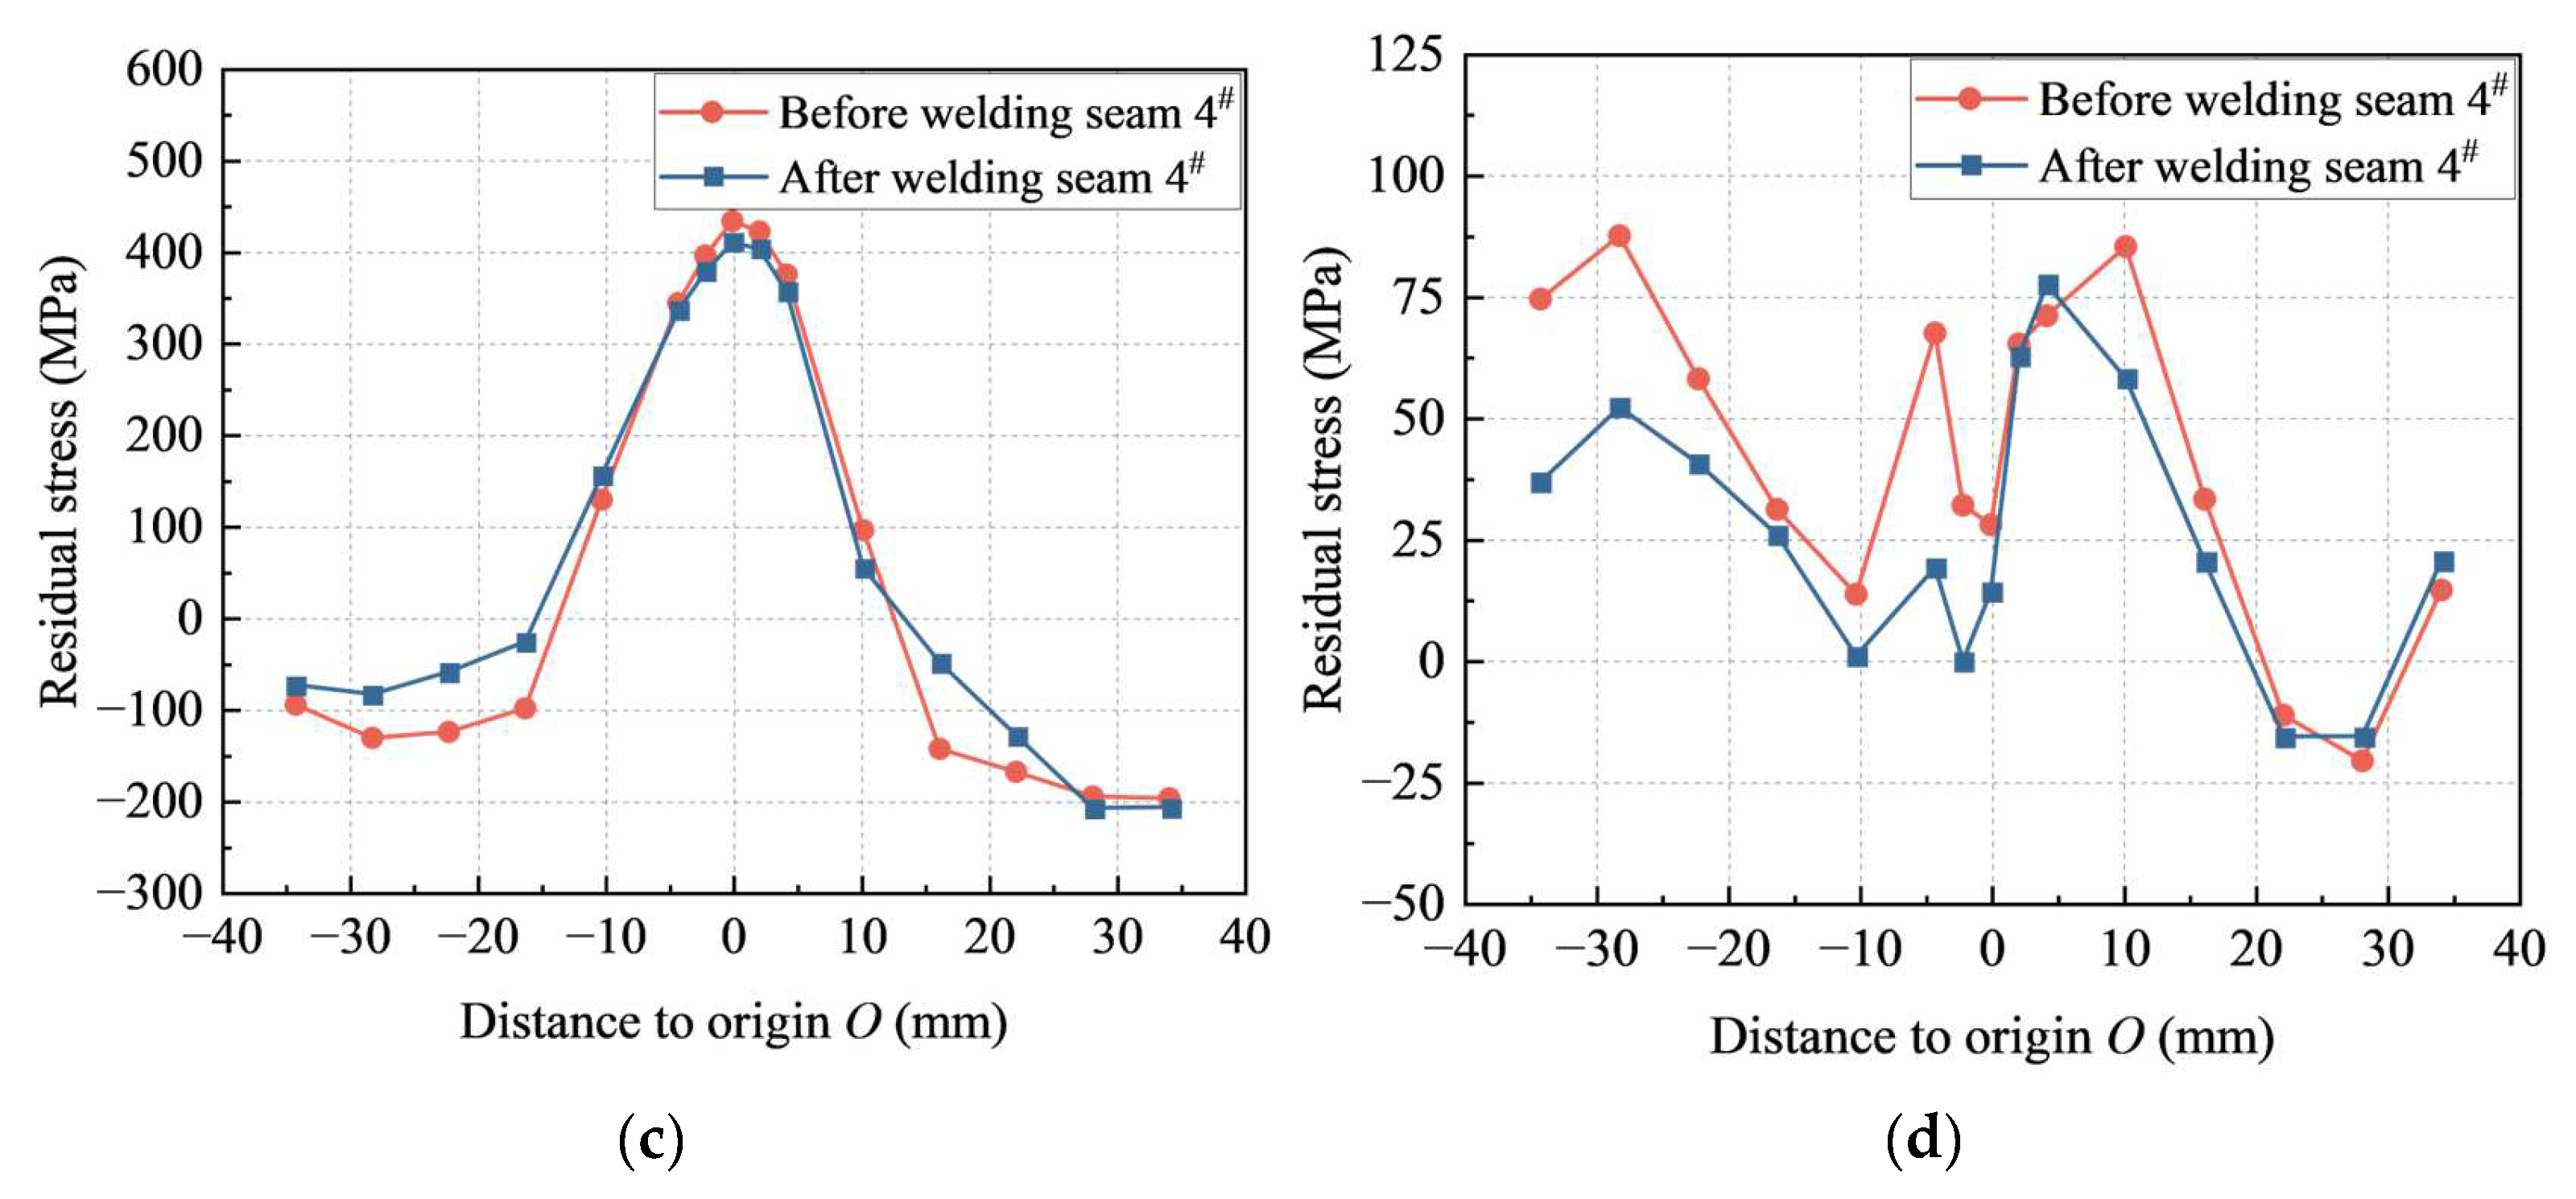
  • The measured residual stresses along path 1 at a distance of 6 mm away from the longitudinal fillet weld toe showed that both the longitudinal and transverse residual stresses were basically symmetrically distributed, while the longitudinal and transverse residual stresses were generally compressive and tensile, respectively. Also, they revealed that welding seam 4# had significant effects on the residual stresses along seam 1#.
  • A finite element model of combined bolted–welded joints to evaluate the residual stress was developed and validated against the test results, with an average difference of 13%. This suggested that the developed finite element model could accurately capture the residual stresses.
  • For different welding sequences, the maximum residual stress was approximately 450 MPa, far exceeding the yield strength of steel plates of 335 MPa. The order was as follows: welding sequence 1 < welding sequence 2 ≈ welding sequence 3 < welding sequence 4.
  • For different welding speeds, the deformation caused by the welding temperature occurred only in a relatively small area, and the ability for synchronized expansion and contraction deformation was weaker, resulting in a larger residual stress. A higher heat input caused the material to remain at high temperatures for a longer period, resulting in greater plastic deformation and larger residual stress upon cooling. Post-weld holding, as an effective heat treatment method, had a significant stress-relieving effect on the residual stress.
  • Due to the presence of welding residual stresses, the fatigue life of combined bolted–welded joints was reduced by nearly 40%. This indicated that the fatigue life of the joint would be overestimated without considering the residual stresses.
This study focused on the residual stresses of combined bolted–welded joints through testing and finite element models. Fatigue tests of combined bolted–welded joints should be conducted to further evaluate the effects of residual stresses on fatigue behavior in future work.

Author Contributions

Conceptualization, X.L., L.J. and G.C.; Methodology, X.L., L.J., G.C., J.L. and R.J.; Software, J.L. and B.X.; Validation, B.X. and R.J.; Formal analysis, X.L., L.J. and R.J.; Investigation, X.L. and G.C.; Resources, B.X.; Data curation, X.L. and B.X.; Writing—original draft, X.L. and B.X.; Writing—review & editing, L.J., G.C., J.L. and R.J.; Supervision, L.J., G.C. and J.L.; Project administration, J.L. and R.J.; Funding acquisition, L.J. and G.C. All authors have read and agreed to the published version of the manuscript.

Funding

Financial support was provided by the National Natural Science Foundation of China (52478125), Key Research and Development Program of Shaanxi Province (2024GX-ZDCYL-03-09), Overseas Students Science and Technology Activities Project Merit Funding in Shaanxi Province (2021-11) and Fundamental Research Funds for Central Universities, CHD (300102213207).

Data Availability Statement

Data are contained within the article.

Conflicts of Interest

Author Xiaoguang Liu was employed by the company SCEGC Mechanized Construction Group Co., Ltd. Authors Jun Liu and Ruibao Jin were employed by the company Henan Communication Investment Jiaozuo-Zhengzhou Expressway Co., Ltd. The remaining authors declare that the research was conducted in the absence of any commercial or financial relationships that could be construed as a potential conflict of interest.

References

  1. Shi, Y.J.; Wang, L.; Wang, Y.Q.; Ma, J.S.; Bai, R.S. Proposed design method of combined connections with bolts and longitudinal welds. Appl. Mech. Mater. 2011, 94, 923–928. [Google Scholar] [CrossRef]
  2. Shi, Y.J.; Wang, L.; Wang, Y.Q.; Ma, J.S.; Bai, R.S. Finite element analysis of the combined connection with bolts and welds. Appl. Mech. Mater. 2011, 94, 316–321. [Google Scholar] [CrossRef]
  3. Ma, J.S.; Bai, R.S.; Li, M.F.; Wang, Y.Q.; Wang, L.; Shi, Y.J. Finite element analysis of the influence of weld size on the combined connection with bolts and welds. Appl. Mech. Mater. 2014, 578, 1276–1280. [Google Scholar] [CrossRef]
  4. Waite, C.D.; Shen, L.; Soliman, M.; Russell, B.W. Experimental investigation into the capacity of concentrically loaded steel connections with pretensioned high-strength bolts and longitudinal fillet welds in combination. Eng. J. 2022, 59, 159–182. [Google Scholar] [CrossRef]
  5. Kulak, G.L.; Grondin, G.Y. Strength of joints that combine bolts and welds. Eng. J. 2003, 40, 89–98. [Google Scholar] [CrossRef]
  6. Manuel, T.J.; Kulak, G.L. Strength of joints that combine bolts and welds. J. Struct. Eng. 2000, 126, 279–287. [Google Scholar] [CrossRef]
  7. Jarosch, K.; Bowman, M.D. Tension butt joints with bolts and welds in combination. Eng. J. 1986, 23, 25–34. [Google Scholar] [CrossRef]
  8. Kim, D.K.; Lee, C.H. Generalized load deformation relationship for bearing-type single-bolted connections. J. Struct. Eng. 2020, 146, 04020116. [Google Scholar] [CrossRef]
  9. Liu, M.S.; Li, C.A.; Huang, J.R.; Ju, J.S. Numerical modeling and mechanical analysis of combined connection with bolts and welds. Strength Mater. 2016, 48, 862–869. [Google Scholar] [CrossRef]
  10. Tamimi, M.F.; Soliman, M.; Stringer, E.; Russell, B.W. Investigating the behavior and reliability of eccentrically loaded steel connections made with bolts and welds in combination. J. Struct. Eng. 2023, 149, 04023164. [Google Scholar] [CrossRef]
  11. Khandel, O.; Tamimi, M.F.; Soliman, M.; Russell, B.W.; Waite, C.D. Reliability assessment of connections with slip-critical bolts and fillet welds in combination. J. Constr. Steel Res. 2022, 188, 107036. [Google Scholar] [CrossRef]
  12. Kim, D.K.; Lee, C.H. Experimental and analytical study of combined bolted-welded lap joints including high-strength steel. J. Constr. Steel Res. 2020, 168, 105995. [Google Scholar] [CrossRef]
  13. Yokozeki, K.; Evers, T.; Vallée, T. Hybrid joints consisting of pre-tensioned bolts and a bonded connection—The influence of adhesives on the load-bearing capacity. Int. J. Adhes. Adhes. 2024, 132, 103689. [Google Scholar] [CrossRef]
  14. Acevedo, C.; Evans, A.; Nussbaumer, A. Neutron diffraction investigations on residual stresses contributing to the fatigue crack growth in ferritic steel tubular bridges. Int. J. Press. Vessels Pip. 2012, 95, 31–38. [Google Scholar] [CrossRef]
  15. Cui, C.; Zhang, Q.; Luo, Y.; Hao, H.; Li, J. Fatigue reliability evaluation of deck-to-rib welded joints in OSD considering stochastic traffic load and welding residual stress. Int. J. Fatigue 2018, 111, 151–160. [Google Scholar] [CrossRef]
  16. Cui, C.; Zhang, Q.; Bao, Y.; Bu, Y.; Luo, Y. Fatigue life evaluation of welded joints in steel bridge considering residual stress. J. Constr. Steel Res. 2019, 153, 509–518. [Google Scholar] [CrossRef]
  17. Ding, Y.; Zhong, W.; Sun, P.; Cao, B.; Song, Y. Fatigue life evaluation of welded joints in OSD for railway bridges considering welding residual stress. J. Perform. Constr. Facil. 2019, 33, 04018111. [Google Scholar] [CrossRef]
  18. Ding, Y.L.; Song, Y.S.; Cao, B.Y.; Wang, G.X.; Li, A.Q. Full-range S-N fatigue-life evaluation method for welded bridge structures considering hot-spot and welding residual stress. J. Bridge Eng. 2016, 21, 04016096. [Google Scholar] [CrossRef]
  19. Zhong, W.; Song, Y.; Ding, Y.; Fang, Z. A simplified method for fatigue life evaluation of welded joints in OSD considering welding residual stress relaxation. Structures 2023, 47, 165–176. [Google Scholar] [CrossRef]
  20. Van Den Berg, N.; Xin, H.H.; Veljkovic, M. Effects of residual stresses on fatigue crack propagation of an orthotropic steel bridge deck. Mater. Des. 2021, 198, 109294. [Google Scholar] [CrossRef]
  21. Qiang, B.; Li, Y.; Yao, C.; Wang, X. Through-thickness welding residual stress and its effect on stress intensity factors for semi-elliptical surface cracks in a butt-welded steel plate. Eng. Fract. Mech. 2018, 193, 17–31. [Google Scholar] [CrossRef]
  22. Choudhury, S.; Medhi, T.; Sethi, D.; Kumar, S.; Roy, B.S.; Saha, S.C. Temperature distribution and residual stress in Friction Stir Welding process. Mater. Today Proc. 2020, 26, 2296–2301. [Google Scholar] [CrossRef]
  23. Zhu, C.Y.; Li, H.; Huang, C.Q.; Luo, C.G.; Song, Y.L. Study on residual stress distribution of 2219 aluminum alloy. Trans. China Weld. Inst. 2017, 38, 32–36. [Google Scholar]
  24. Luo, W.Z.; Cheng, H.M.; Liu, H.Y.; Wang, Y.; Ye, Y.; Deng, D. Numerical Simulation of Residual Stress and Welding Deformation for High-Strength Steel Q960E Butt-Welded Joints. China Mech. Eng. 2023, 34, 2095–2105. [Google Scholar]
  25. Deng, D.; Murakawa, H. Numerical simulation of temperature field and residual stress in multi-pass welds in stainless steel pipe and comparison with experimental measurements. Comput. Mater. Sci. 2006, 37, 269–277. [Google Scholar] [CrossRef]
  26. Shariyat, M.; Asemi, K. 3D B-spline finite element nonlinear elasticity buckling analysis of rectangular FGM plates under non-uniform edge loads, using a micromechanical model. Compos. Struct. 2014, 112, 397–408. [Google Scholar] [CrossRef]
  27. Mondal, A.K.; Biswas, P.; Bag, S. Experimental and FE analysis of submerged arc weld induced residual stress and angular deformation of single and double sided fillet welded joint. Int. J. Steel Struct. 2017, 17, 9–18. [Google Scholar] [CrossRef]
  28. Barsoum, Z.; Barsoum, I. Residual stress effects on fatigue life of welded structures using LEFE. Eng. Fail. Anal. 2009, 16, 449–467. [Google Scholar] [CrossRef]
  29. Kollár, D. Numerical modelling on the influence of repair welding during manufacturing on residual stresses and distortions of T-joints. Results Eng. 2023, 20, 101535. [Google Scholar] [CrossRef]
  30. Qiang, B.; Li, Y.; Yao, C.; Wang, X.; Gu, Y. Through-thickness distribution of residual stresses in Q345qD butt-welded steel plates. J. Mater. Process. Technol. 2018, 251, 54–64. [Google Scholar] [CrossRef]
  31. Ghafouri, M.; Ahola, A.; Ahn, J.; Björk, T. Numerical and experimental investigations on the welding residual stresses and distortions of the short fillet welds in high strength steel plates. Eng. Struct. 2022, 260, 114269. [Google Scholar] [CrossRef]
  32. Gadallah, R.; Tsutsumi, S.; Yonezawa, T.; Shimanuki, H. Residual stress measurement at the weld root of rib-to-deck welded joints in orthotropic steel bridge decks using the contour method. Eng. Struct. 2020, 219, 110946. [Google Scholar] [CrossRef]
  33. Kollár, D.; Völgyi, I.; Joó, A. Development of residual stress model of orthotropic steel decks using measurements. Structures 2023, 58, 105601. [Google Scholar] [CrossRef]
  34. Huang, Y.; Wang, R.; Zhang, S.; Chen, G.; Fu, J.; Wang, T. Experimental study on the welding residual stresses of integral joint using full-scale joint model of a steel truss bridge. Adv. Struct. Eng. 2013, 16, 1719–1727. [Google Scholar] [CrossRef]
  35. Gadallah, R.; Tsutsumi, S.; Tanaka, S.; Osawa, N. Accurate evaluation of fracture parameters for a surface-cracked tubular T-joint taking welding residual stress into account. Mar. Struct. 2020, 71, 102733. [Google Scholar] [CrossRef]
  36. Jin, D.; Hou, C.; Shen, L. Effect of welding residual stress on the performance of CFST tubular joints. J. Constr. Steel Res. 2021, 184, 106827. [Google Scholar] [CrossRef]
  37. Cao, Y.; Meng, Z.; Zhang, S.; Tian, H. FEM study on the stress concentration factors of K-joints with welding residual stress. Appl. Ocean. Res. 2013, 43, 195–205. [Google Scholar] [CrossRef]
  38. GB/T 1231-2006; Specifications of High Strength Bolts with Large Hexagon Head, Large Hexagon Nuts, Plain Washers for Steel Structures. Standards Press of China: Beijing, China, 2006.
  39. GB/T 1591-2018; High Strength Low Alloy Structural Steels. Standards Press of China: Beijing, China, 2018.
  40. GB 50661-2011; Code for Welding of Steel Structures. China Architecture & Building Press: Beijing, China, 2011.
  41. GB/T 11345-2023; Non-Destructive Testing of Welds—Ultrasonic Testing—Techniques, Testing Levels and Assessment. Standards Press of China: Beijing, China, 2023.
  42. Jiang, L.; Liu, Y.; Fam, A.; Liu, B.; Pu, B.; Zhao, R. Experimental and numerical analyses on stress concentration factors of concrete-filled welded integral K-joints in steel truss bridges. Thin-Walled Struct. 2023, 183, 110347. [Google Scholar] [CrossRef]
  43. Jiang, L.; Liu, Y.; Fam, A. Stress concentration factors in concrete-filled square hollow section joints with perfobond ribs. Eng. Struct. 2019, 181, 165–180. [Google Scholar] [CrossRef]
  44. Jiang, L.; Liu, Y.; Fam, A.; Liu, J.; Liu, B. Stress concentration factor parametric formulae for concrete-filled rectangular hollow section K-joints with perfobond ribs. J. Constr. Steel Res. 2019, 160, 579–597. [Google Scholar] [CrossRef]
  45. Deng, D.; Murakawa, H. Prediction of welding distortion and residual stress in a thin plate butt-welded joint. Comput. Mater. Sci. 2008, 43, 353–365. [Google Scholar] [CrossRef]
  46. Zhang, Y.; Su, W.; Dong, H.; Li, T.; Cao, H. Effect of welding sequence and constraint on the residual stress and deformation of thick welded butt joint made of Q345qD steel. Adv. Civ. Eng. 2022, 2022, 5966274. [Google Scholar] [CrossRef]
  47. Goldak, J.; Aditya, C.; Malcolm, B. A new finite element model for welding heat sources. Metall. Trans. B 1984, 15, 299–305. [Google Scholar] [CrossRef]
  48. Ravisankar, A.; Velaga, S.K.; Rajput, G.; Venugopal, S. Influence of welding speed and power on residual stress during gas tungsten arc welding (GTAW) of thin sections with constant heat input: A study using numerical simulation and experimental validation. J. Manuf. Process. 2014, 16, 200–211. [Google Scholar] [CrossRef]
  49. Patel, S.; Patel, B.P.; Ahmad, S. Estimation of Residual Stresses in Steel Welded Joints Using Three Dimensional Finite Element Analysis. In Proceedings of the International Conference on Offshore Mechanics and Arctic Engineering, Madrid, Spain, 17–22 June 2018; American Society of Mechanical Engineers: New York, NY, USA, 2018; p. 51265. [Google Scholar]
  50. Javadi, Y.; Azari, K.; Ghalehbandi, S.M.; Roy, M.J. Comparison between using longitudinal and shear waves in ultrasonic stress measurement to investigate the effect of post-weld heat-treatment on welding residual stresses. Res. Nondestruct. Eval. 2017, 28, 101–122. [Google Scholar] [CrossRef]
  51. Li, X.; Fu, Z.; Cui, J.; Ji, B. Effect of Post-Weld heat treatment on residual stress in deck-rib double-side welded joints and process optimization. Eng. Fail. Anal. 2024, 164, 108731. [Google Scholar] [CrossRef]
  52. Hobbacher, A.F. Recommendations for Fatigue Design of Welded Joints and Components; Springer International Publishing: Cham, Switzerland, 2016. [Google Scholar]
Figure 1. Configurations and dimensions of combined bolt–weld joints: (a) side view, (b) top view and (c) photo. (Unit: mm).
Buildings 15 00910 g001aBuildings 15 00910 g001b
Figure 2. Arrangement of measurement points: (a) temperature measurement points; (b) strain measurement points (unit: mm).
Buildings 15 00910 g002
Figure 3. Measured time–temperature curve.
Buildings 15 00910 g003
Figure 4. Measured residual stresses along path 1 at a distance of 6 mm away from the weld toe.
Buildings 15 00910 g004
Figure 5. Finite element model and mesh scheme.
Buildings 15 00910 g005
Figure 6. Temperature-dependent material properties: (a) Q345 steel; (b) E50 electrode.
Buildings 15 00910 g006aBuildings 15 00910 g006b
Figure 7. Schematic of Goldak’s volumetric heat source shape.
Buildings 15 00910 g007
Figure 8. Comparisons of time–temperature curves between test and finite element results.
Buildings 15 00910 g008
Figure 9. Comparisons of residual stresses between test and finite element results: (a) longitudinal residual stress; (b) transverse residual stress.
Buildings 15 00910 g009
Figure 10. Numbering of weld seams.
Buildings 15 00910 g010
Figure 11. Diagram of stress extraction paths.
Buildings 15 00910 g011
Figure 12. Residual stress distributions under welding sequence 1: (a) longitudinal residual stress along path 1; (b) transverse residual stress along path 1; (c) longitudinal residual stress along path 2; (d) transverse residual stress along path 2.
Buildings 15 00910 g012aBuildings 15 00910 g012b
Figure 13. Residual stress distributions under welding sequence 2: (a) longitudinal residual stress along path 1; (b) transverse residual stress along path 1; (c) longitudinal residual stress along path 2; (d) transverse residual stress along path 2.
Buildings 15 00910 g013aBuildings 15 00910 g013b
Figure 14. Residual stress distributions after complete cooling for different welding sequences: (a) longitudinal residual stress along path 1; (b) transverse residual stress along path 1; (c) longitudinal residual stress along path 2; (d) transverse residual stress along path 2.
Buildings 15 00910 g014aBuildings 15 00910 g014b
Figure 15. Residual stress distributions for different welding speeds: (a) longitudinal residual stress along path 1; (b) transverse residual stress along path 1; (c) longitudinal residual stress along path 2; (d) transverse residual stress along path 2.
Buildings 15 00910 g015
Figure 16. Weld pool areas for different welding powers at welding speed of 6 mm/s: (a) welding power at 5000 W; (b) welding power at 6000 W; (c) welding power at 7000 W.
Buildings 15 00910 g016
Figure 17. Residual stress distributions for different welding powers at welding speed of 6 mm/s: (a) longitudinal residual stress along path 1; (b) transverse residual stress along path 1; (c) longitudinal residual stress along path 2; (d) transverse residual stress along path 2.
Buildings 15 00910 g017
Figure 18. Residual stress distributions for different post-weld heat treatments: (a) longitudinal residual stress along path 1; (b) transverse residual stress along path 1; (c) longitudinal residual stress along path 2; (d) transverse residual stress along path 2.
Buildings 15 00910 g018
Figure 19. Residual deformation distributions after complete cooling for different welding sequences: (a) total deformation along path 3; (b) deformation in X-direction along path 3; (c) deformation in Y-direction along path 3; (d) deformation in Z-direction along path 3.
Buildings 15 00910 g019
Figure 20. Geometric parameters and location of crack.
Buildings 15 00910 g020
Figure 21. Typical finite element results for crack propagation in the combined bolted–welded joint: (a) under 9693 cycles; (b) under 64,823 cycles; (c) under 181,420 cycles; (d) under 237,010 cycles.
Buildings 15 00910 g021aBuildings 15 00910 g021b
Figure 22. Comparison of crack propagation in the combined bolted–welded joints with and without residual stresses: (a) under 10,000 cycles without residual stress; (b) under 10,000 cycles with residual stress; (c) under 30,000 cycles without residual stress; (d) under 30,000 cycles with residual stress; (e) under 50,000 cycles without residual stress; (f) under 50,000 cycles with residual stress.
Buildings 15 00910 g022
Figure 23. Comparison of the fatigue lives of combined bolted–welded joints with and without residual stresses.
Buildings 15 00910 g023
Disclaimer/Publisher’s Note: The statements, opinions and data contained in all publications are solely those of the individual author(s) and contributor(s) and not of MDPI and/or the editor(s). MDPI and/or the editor(s) disclaim responsibility for any injury to people or property resulting from any ideas, methods, instructions or products referred to in the content.

