1. Introduction
The built environment is responsible for over 40% of natural resource extraction and 37% of carbon emissions globally [
1,
2]. These carbon emissions include operational and embodied carbon. The former refers to greenhouse gas (GHG) emissions produced during the use phase of the building. The latter refers to embodied carbon or GHG emissions in the rest of the life cycle phases: material extraction, component production, transport, construction, maintenance, and demolition. To present, relevant advances have been made concerning the operational emissions of buildings. However, as the built environment becomes more efficient in terms of operation, their energy and embodied carbon emissions become more relevant, representing 50% to 90% of total emissions in their life cycle [
3]. In this context, the highest percentage of embodied carbon comes from the structural system due to its high material mass and energy-intensive production [
4].
The total material quantity of a structure is directly proportional to the total embodied carbon of the building [
5]. One of the main factors determining material quantity is the structure’s shape. A structural shape optimized for the loads will reduce the cross-sectional area and the number of elements necessary for the structure, leading to material savings of up to 70% [
2]. This characteristic is mainly determined during the early stages of design, in which decisions can significantly influence the reduction in the total material quantity and, consequentially, the total embodied carbon [
6]. Thus, including optimization methods that focus on this is most effective during these early phases [
7]. To address these relevant aspects, integrating architectural, structural, and construction variables is a key aspect [
8]. An effective optimization process should address all of these aspects and support decision-making by providing information on the performance of possible solutions.
Structural optimization is a primary research subject in engineering and, over the last decade, growing interest has been shown in reducing embedded emissions in structural systems [
9]. As stated before, this is directly proportional to the material quantity, thus being associated with the structure’s self-weight, one of the main objectives in structural optimization [
10]. There are three main methods for structural optimization: cross-section optimization, shape optimization, and topology optimization. The latter has proven to be one of the most effective in reducing material quantity, which can be continuous or discrete [
11]. In the first case, it seeks to place material within a given design domain that results in the best structural performance for a specific set of loads, boundary conditions, and constraints [
12,
13]. Secondly, discrete topology optimization is mainly used for truss structure optimization and determines the number and position of bars for the truss and its respective cross-sectional areas [
14]. The process, also known as layout optimization, involves four stages: (a) specifying the design domain, loads, and supports; (b) discretizing the domain through a grid of nodes and interconnecting them with potential members, thus defining a ground structure; (c) optimizing to identify the subset of members forming the optimal structural layout; and (d) using geometry optimization to improve the solution [
15,
16].
On the other hand, multi-objective optimization allows two or more objectives to search for a compromise set of solutions, enabling the combination of different types of objectives or optimization methods [
17]. It also culminates in a group of diverse results in fitness to the objectives instead of one optimal solution. To find this compromise among solutions, there are two methods: the Pareto Front and preference-based methods. The first one refers to a set of non-dominated solutions, where improving one objective without worsening another is impossible. These solutions offer the designer a variety of balanced options to choose from, allowing for informed and efficient decision-making. Secondly, preference-based methods integrate user preferences at some stage of the optimization process. This procedure enables the search to be directed towards solutions that better align with the designer’s specific priorities, facilitating the selection of the most appropriate option [
18]. This characteristic means that a solution can be selected according to other conditions or user preferences that are harder to adjust in an optimization process based on a mathematical definition.
A way to achieve efficient solutions to complex optimization problems in engineering and construction is through the use of artificial intelligence and its branches, such as swarm intelligence and others [
19]. Regarding the applied algorithms for optimization, evolutionary computation has been widely used in building design optimization. These algorithms are some of the most robust, flexible, and efficient, based on Darwin’s evolutionary principles, inspired by natural processes [
20]. The most common algorithms for design optimization are genetic algorithms, which are based on principles of natural selection, where potential solutions to the optimization problem are considered as chromosomes. The process imitates biological evolution, including mechanisms such as selection, crossover, and mutation [
21]. Furthermore, algorithms have also been developed and used for other analyses, such as damage identification, showing the adaptability of these tools to the design and monitoring of truss structures [
22,
23,
24].
Many studies have focused on optimizing truss structures to reduce the material quantity, which, as stated before, is directly related to embedded emissions. This objective is usually combined with variables related to the cross-section’s size and structural elements’ shape [
10]. Ranjan et al. [
25] applied genetic algorithms to optimize the weight of two types of roof trusses by minimizing cross-sections and eliminating redundant or unnecessary truss members. Jawad et al. [
26] used a bee colony algorithm to minimize the weight of 2D and 3D truss systems by optimizing their cross-sections and layout. Zhao et al. [
27] developed a method that combines topology optimization and a predictive model based on machine learning, allowing for the incorporation of users’ preferences.
Furthermore, the optimization of truss layouts has been widely studied. Nevertheless, while results can reduce the structure’s mass in large percentages, other design aspects are rarely considered, such as constructability. This concept, also referred to as buildability, has been defined as the extent to which the design of a building facilitates ease of construction [
28]. It is a fundamental aspect of structural design, allowing for the evaluation of the construction process in terms of its technical and practical characteristics [
29]. Moreover, it has been proven that poor design and decision-making during the early stages of the project’s development can harm constructability, increase construction costs and time, and jeopardize quality [
28].
As commented on earlier, topology optimization can be very effective in reducing the structural volume and its corresponding embedded emissions. However, it can result in complicated shapes that require discretization and elements composed of bars with many different cross-sections, making them less suitable for construction and demanding high manufacturing costs [
30,
31]. An essential aspect of construction efficiency is standardization, and it should be integrated with the structure’s conceptual design and optimization processes applied in this phase [
29].
On the other hand, Lu and Xie [
30] sought to reduce the costs of layout-optimized trusses by controlling the number of different elements, considering their cross-sections and lengths. The process started with layout optimization, reducing the structural mass, which served as a starting point for clustering, grouping elements according to their cross-section and length, and adjusting the generated layout. This procedure increased structural mass by less than 3% compared to the original optimized geometry. Another way to approach it is through the grouping of truss elements. Carvalho et al. [
32] used multi-objective optimization to minimize structural mass and the number of different cross-sections. The optimization variable was the cross-sections of the truss members, with them being grouped automatically during the process according to their size, thus creating a more homogenous design.
This research aims to propose a procedure that allows for the evaluation of different geometries for truss structures, their material quantity, and their carbon footprint, contributing to the reduction in the structure’s environmental impact at an early stage of design. This process would support and inform decisions during the definition of the building’s shape, decreasing the material quantity and, consequently, the embedded emissions of the structure. For this, multi-objective optimization is implemented, considering criteria such as shape, displacements, utilization ratio, design rationalization, and material quantity. A case study is then analyzed to test the proposed workflow.
The paper is structured as follows: after the Introduction, the Materials and Methods section details the workflow, its phases, and the procedures and tools applied. It also presents the case studies and their characteristics. The Analysis of Results section presents the data obtained from the process carried out and compares them between case studies. The Final Reflections section presents and relates the main findings to the reviewed literature. Finally, the Conclusions section presents the main findings and reflects on the study’s limitations and future projections.
2. Materials and Methods
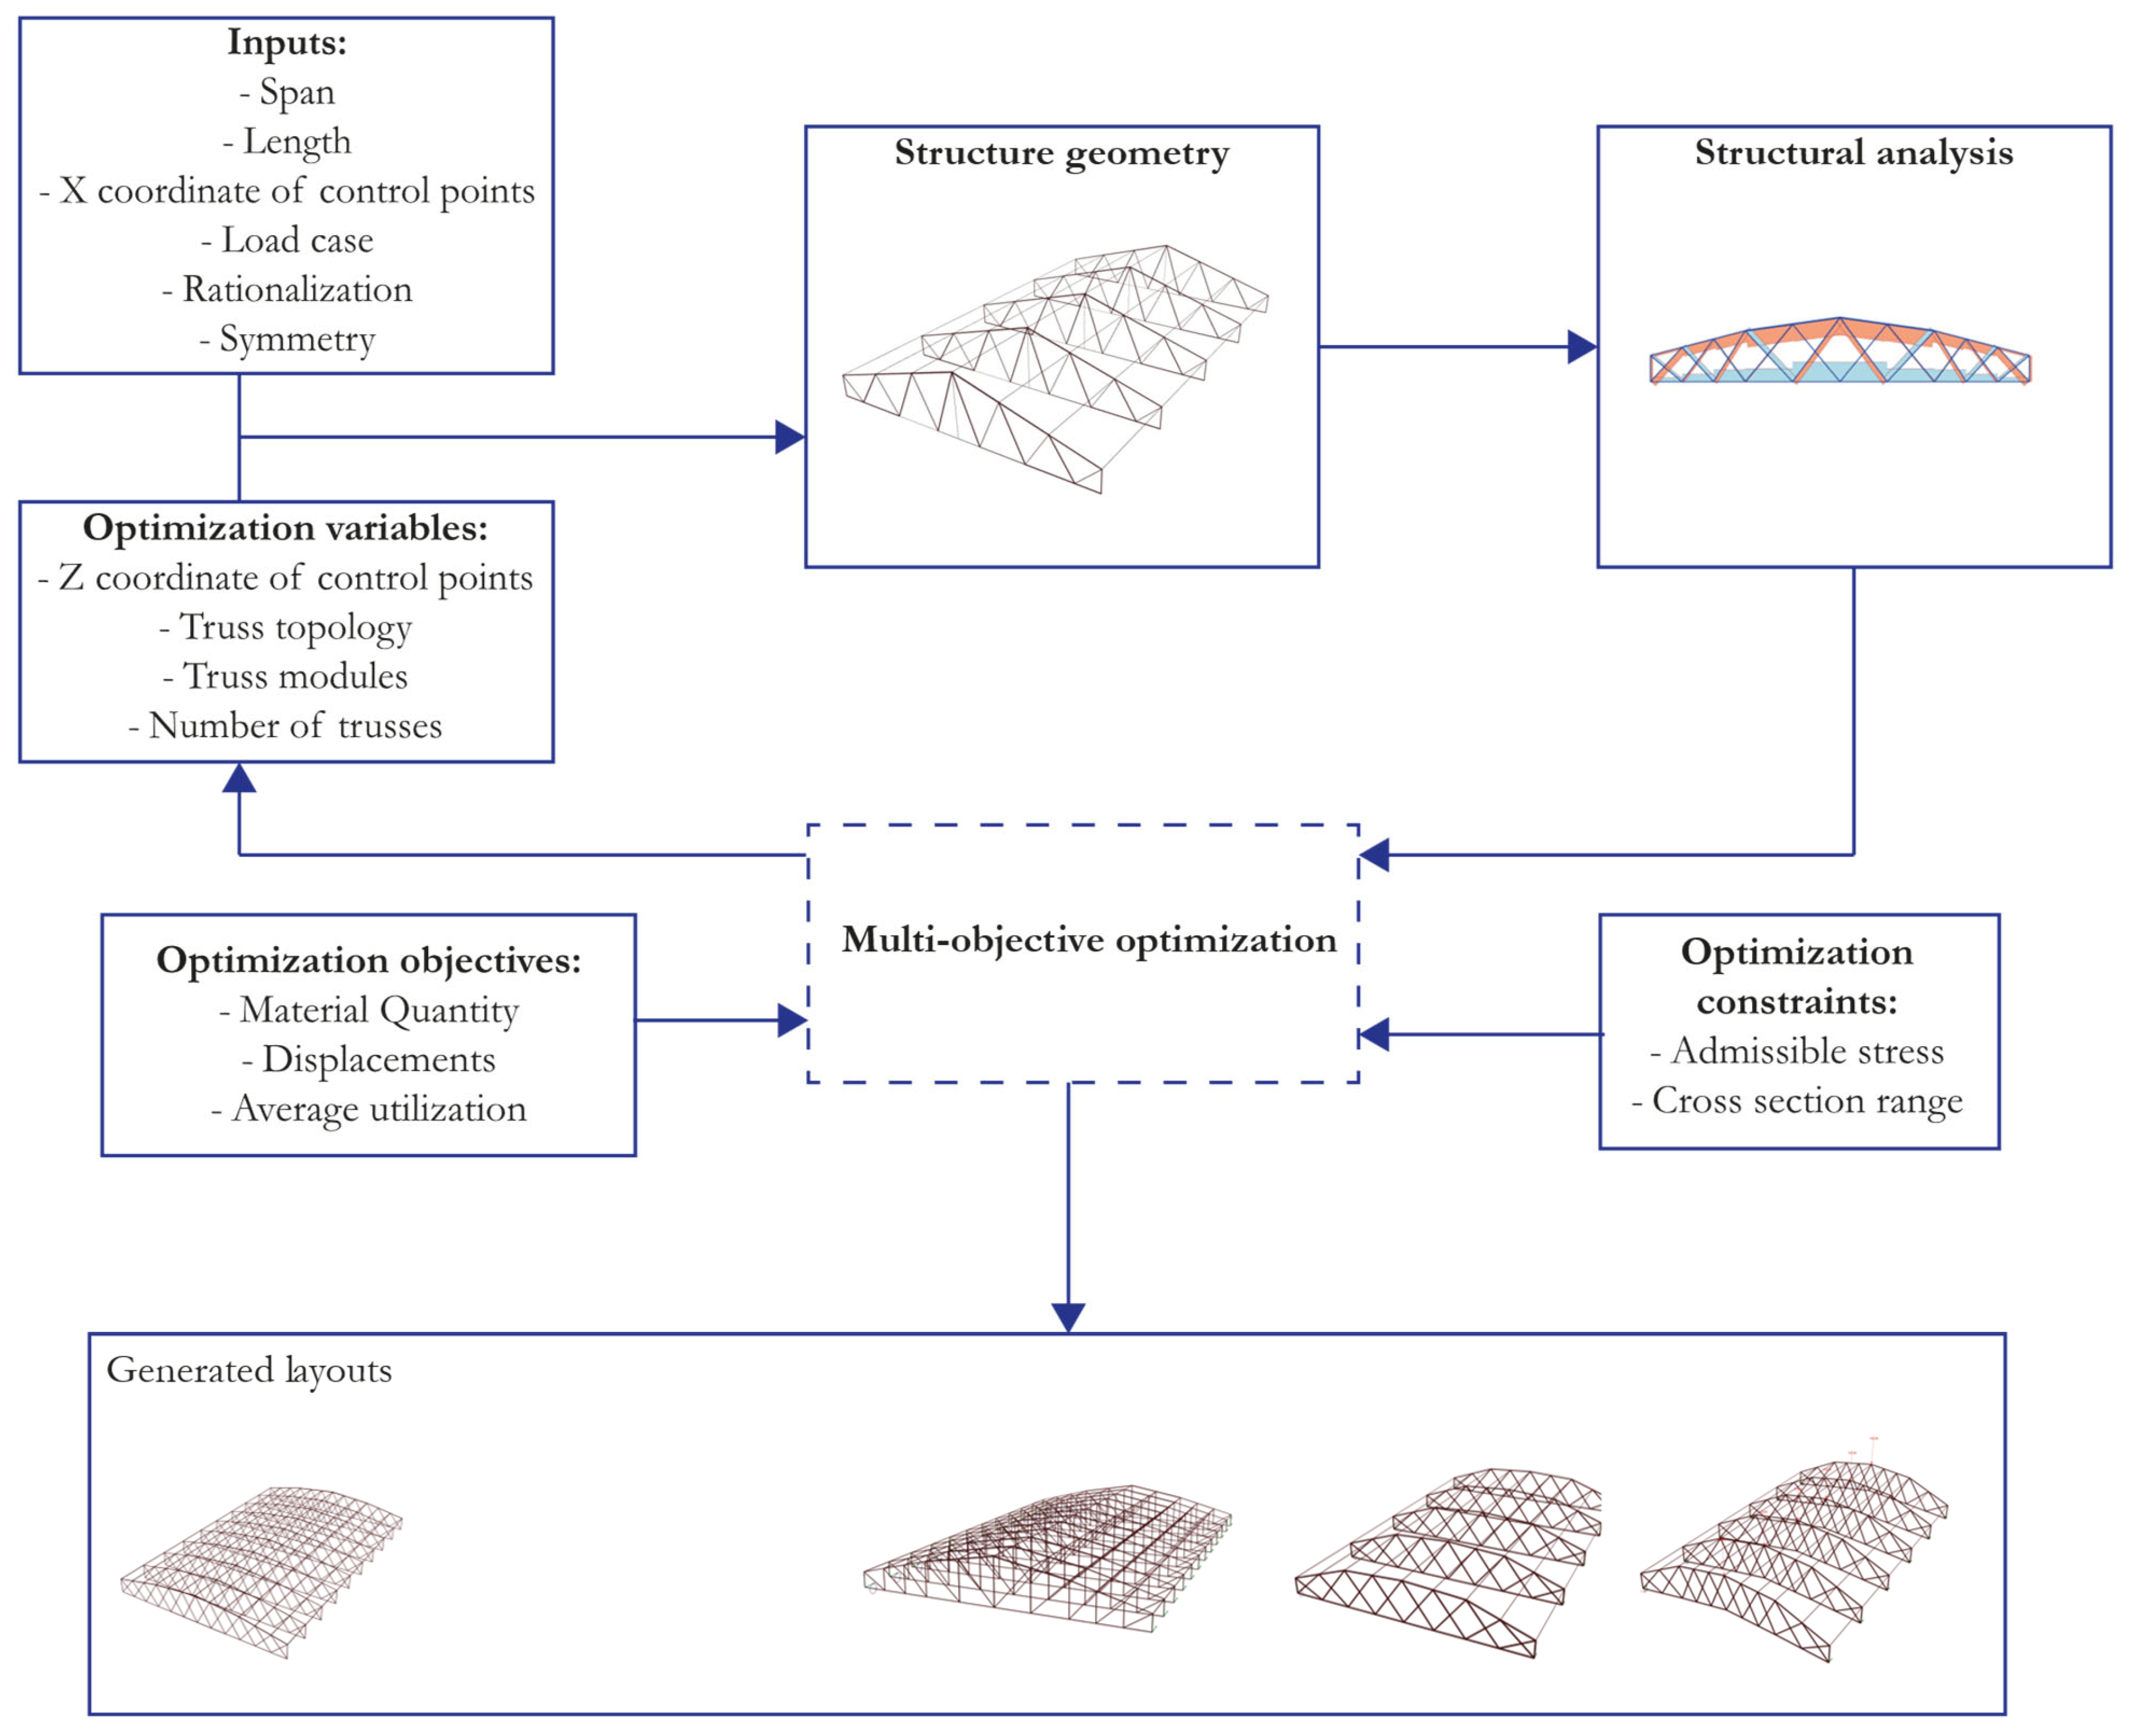
This research proposes an optimization process considering architectural, structural, and construction aspects intended to reduce the structure’s environmental impact, specifically minimizing material quantity and embedded emissions. The procedure is divided into two main phases: optimization processing and a post-process for selecting and evaluating the results. The workflow is based on Rhino/Grasshopper (version 7.38.24338.17001, 2024, Seattle, WA, USA), using the finite element analysis plug-in Karamba 3D (version 2.2.0.180-230616, 2024, Vienna, Austria) and the multi-objective optimization plug-in Wallacei X (version 2.7, 2022, London, UK). The embedded carbon emissions were estimated with a life cycle assessment of the results, considering phases A1 to A3 (material extraction, transport, and manufacturing), performed with One Click LCA software (version 4.0.8, 2024, Helsinki, Finland).
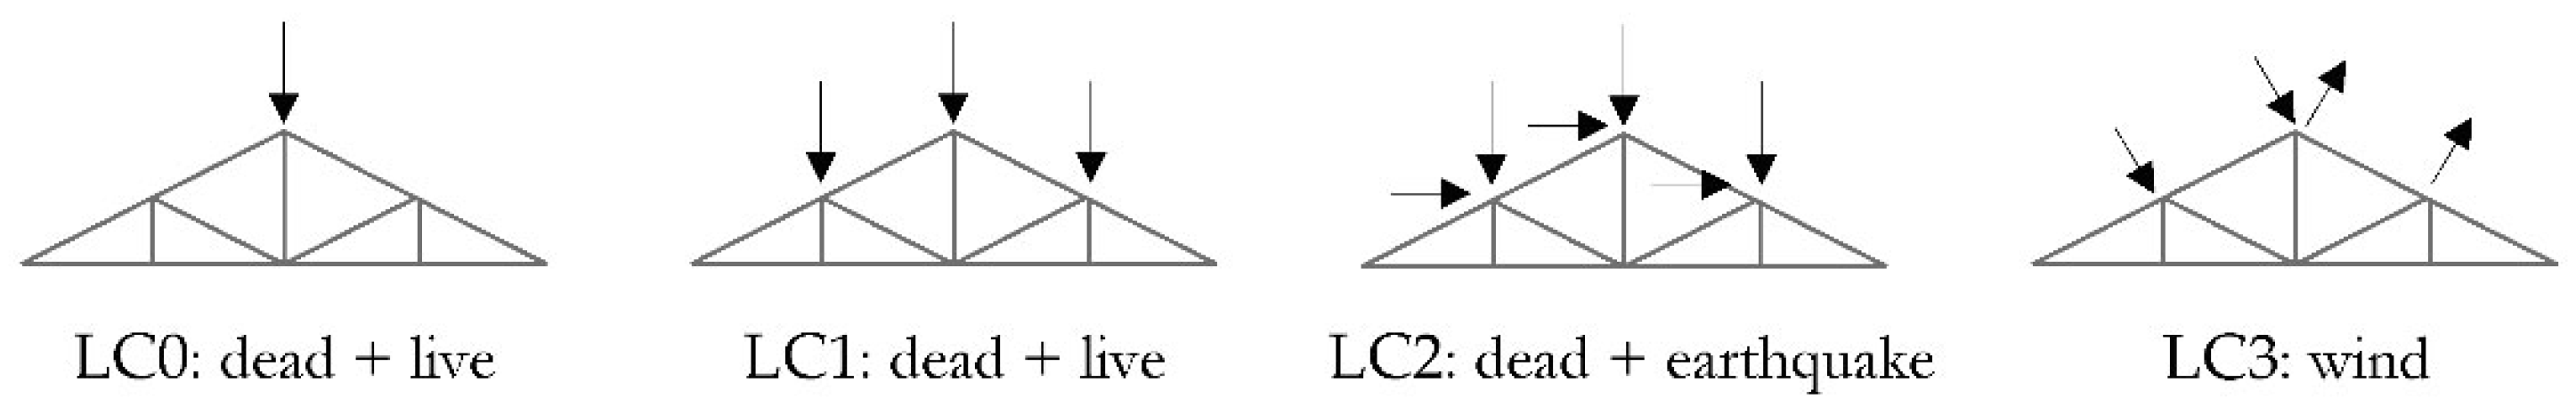
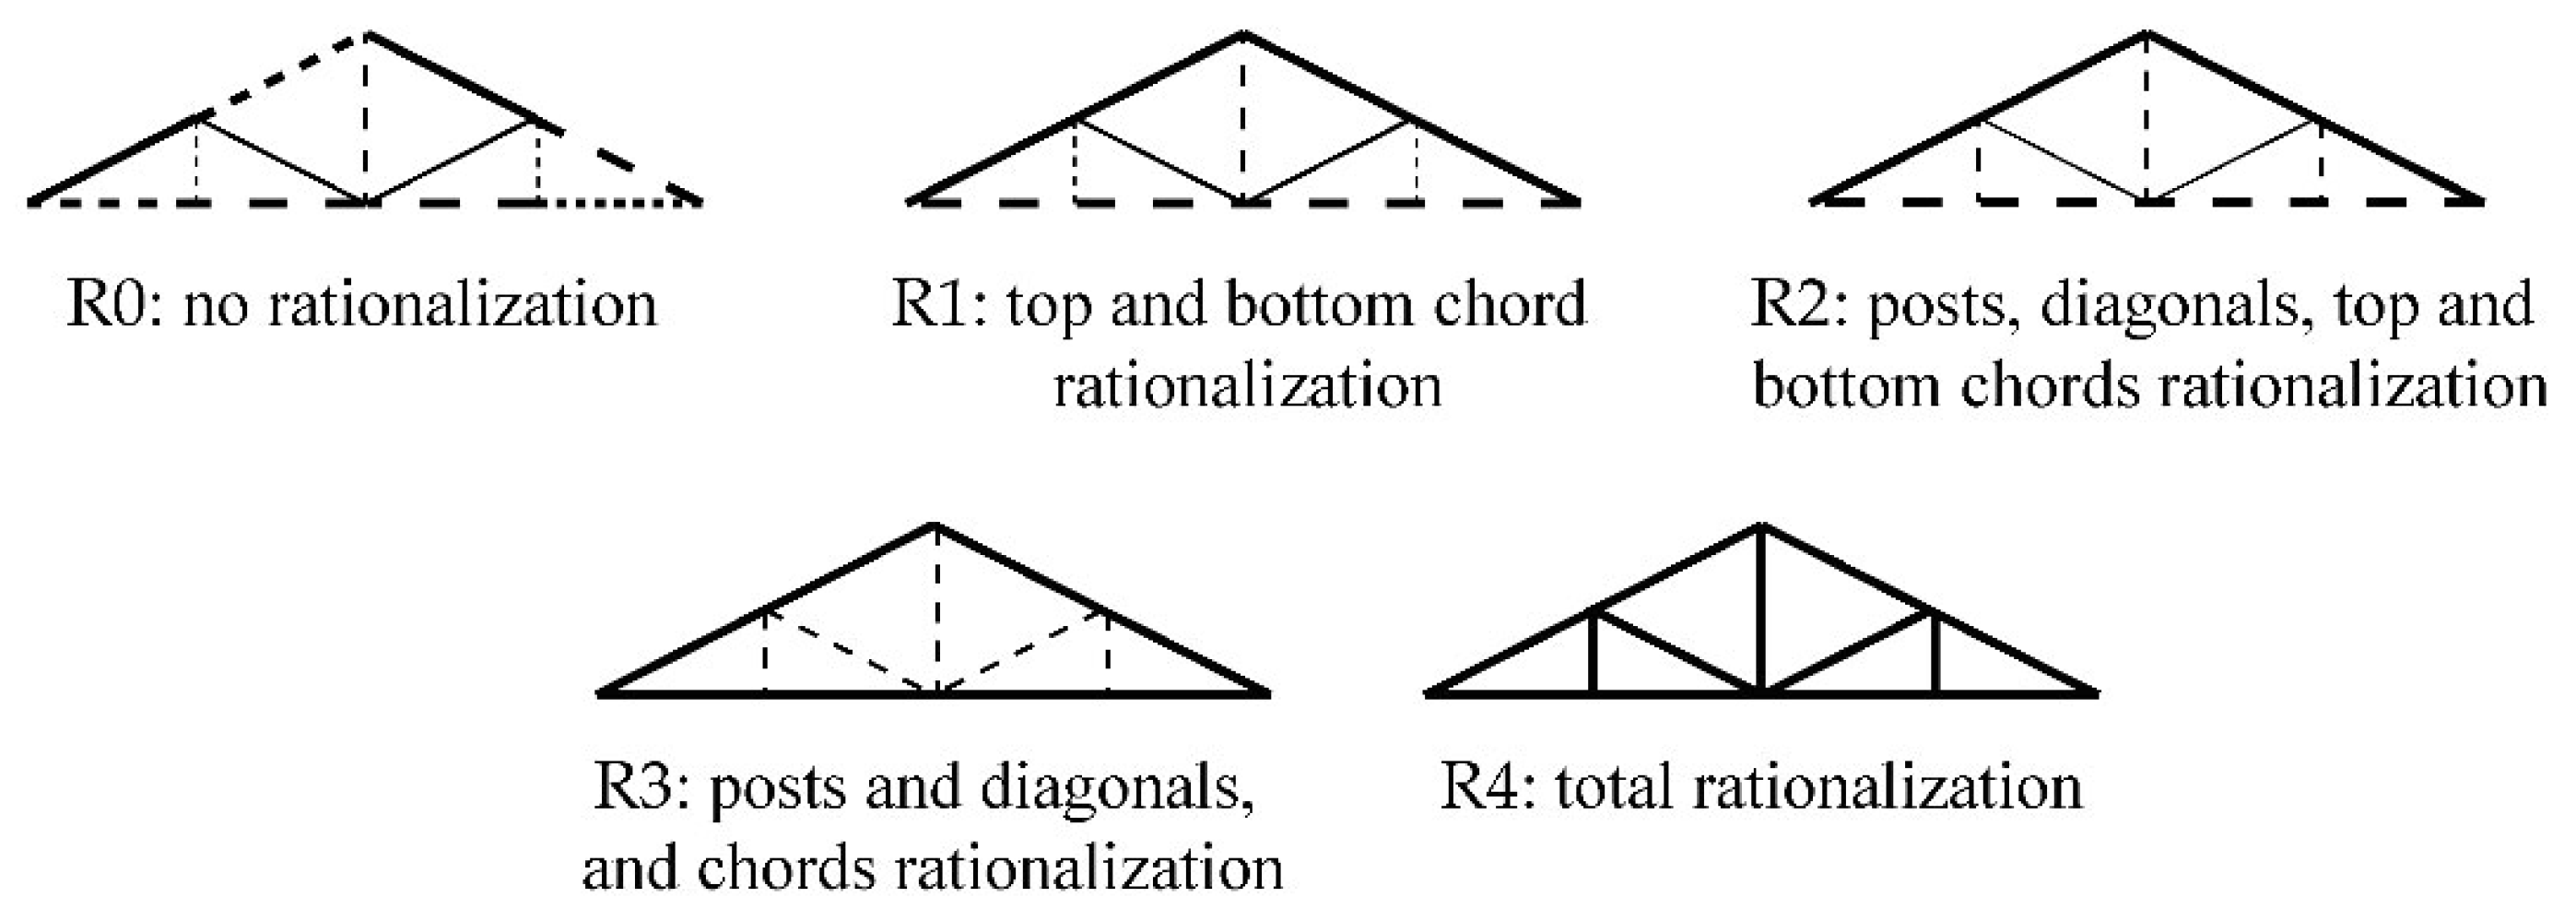
The first stage begins with constructing the parametric model, which is subjected to a structural analysis to collect data as the inputs for the optimization procedure. The model is configured with parameters established by the designer and the optimization variables, which are manipulated during this process. The former includes the span and length the structure will cover, the X coordinate for the control points of the truss, the load case and rationalization level to consider in the optimization, the activation or deactivation of some of the control points, and the option to work only with symmetric trusses. The setup enables working with 4 different types of load cases, as seen in
Figure 1 and defined in
Table 1, and 5 levels of design rationalization (
Figure 2). These last ones are based on a grouping of bars depending on their position in the truss: top and bottom chords, diagonals, and posts.
The optimization variables are the Z coordinate of the control points, the number of subdivisions or modules in the truss, the number of trusses in the system, and their topology. The construction of the parametric model begins with the control points between them, where there is a grid of possible nodes for the truss. The bars composing the chords, diagonals, and posts are selected between these nodes during optimization. Simultaneously, the number of trusses for the system is determined.
The resulting model is analyzed with Karamba 3D, considering pinned supports and the load case input in the initial configuration. This procedure delivers the information for the optimization objectives: the material quantity, the utilization of the structural elements, and the displacements. The multi-objective process is carried out with the tool Wallacei X, based on a Non-sorting genetic algorithm 2 (NSGA-II), and results in 5000 layouts, with different performances for each objective, following the diagram in
Figure 3.
The second phase begins with a classification of the previously obtained layouts, by filtering the solutions according to the designer’s admissibility conditions. These can be related to building code requirements, construction or project requirements, or design preferences. The designer can choose their preferred designs from the remaining layouts to continue the procedure, starting with cross-section optimization, considering the 4 load cases. The largest section for each bar is extracted in each case, resulting in a design proven to resist any load cases. The next step is to apply all of the rationalization levels to the chosen designs to obtain the material quantity, CO
2 emissions, and displacements for each, thus allowing the designer to compare them with precise information. Finally, they can select the layout and rationalization level to be used in the project. The complete workflow process is detailed in
Figure 4.
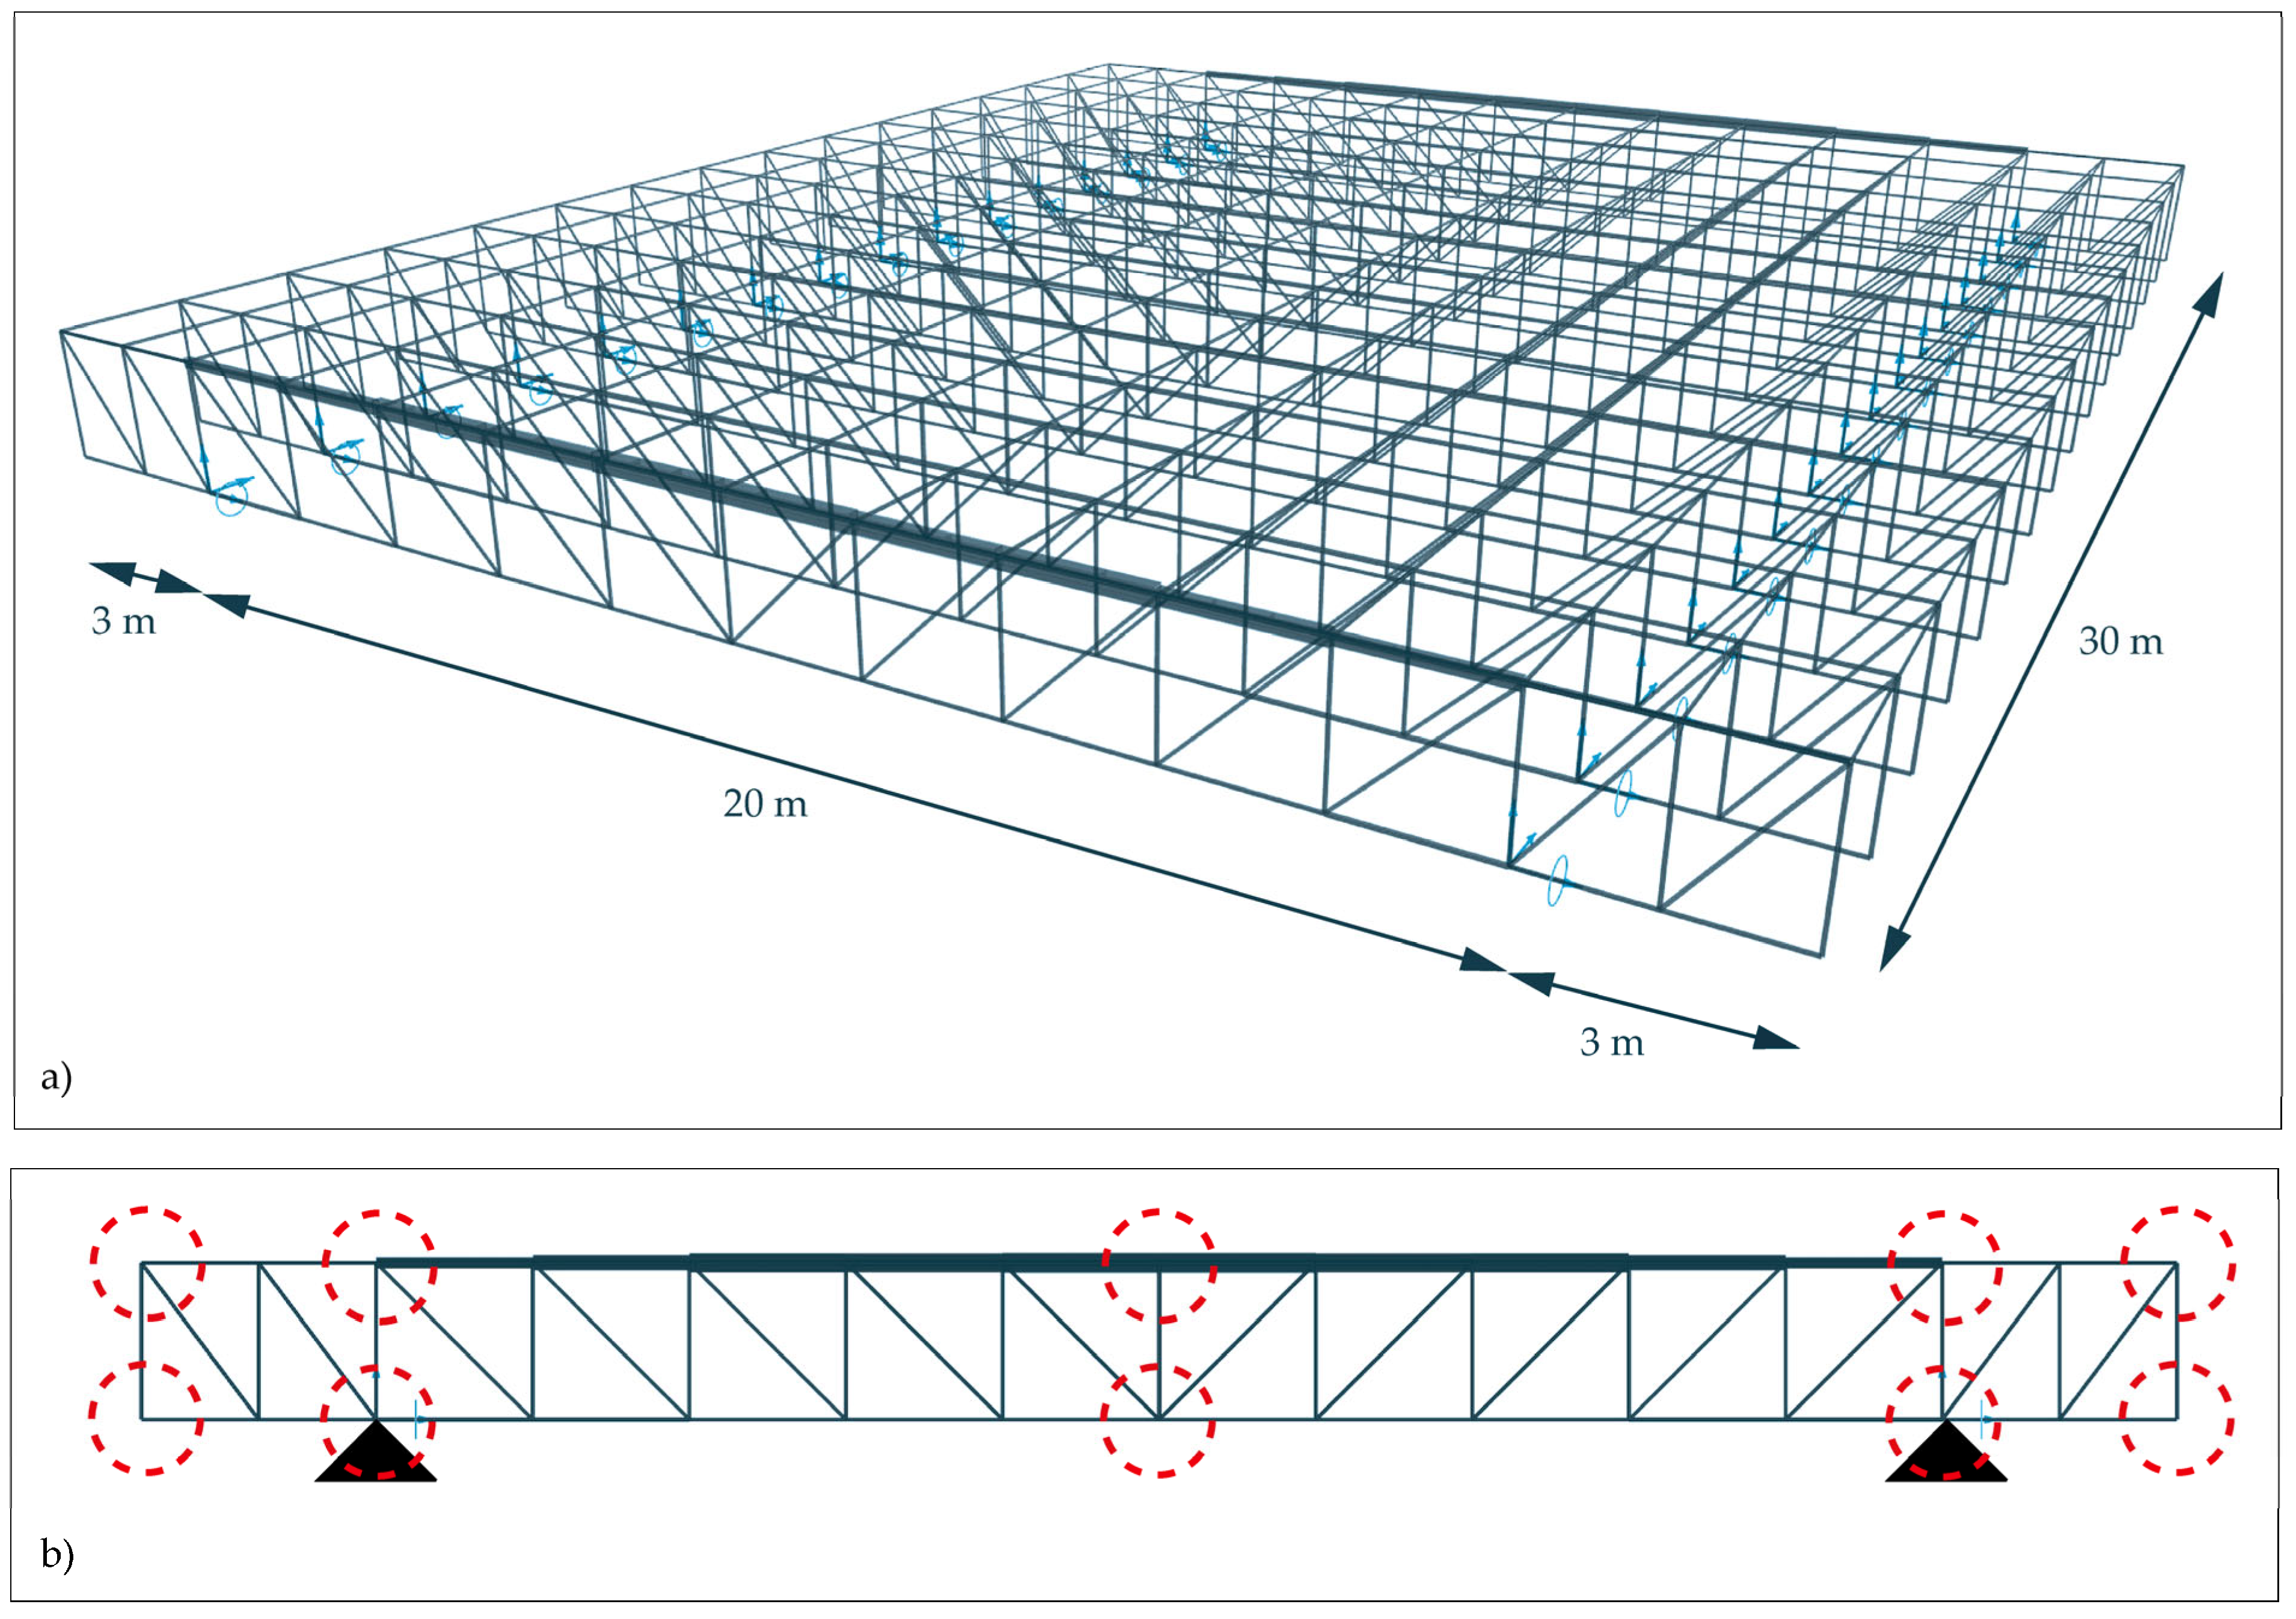
To test the proposed procedure, two case studies are analyzed based on a truss system covering an area of 20 × 30 m with pinned connections and cantilevers of 3 m at each extreme (
Figure 5). The first case had six control points activated, while the second had the three control points of the top chord fixed. The optimization considers ASTM 36 steel and rectangular hollow sections for each case, with rationalization level 0 and symmetry activated. Both cases are configured with LC0, which contemplates concentrated dead and live loads in the middle node of the upper chord and the extreme nodes of the upper chord in both cantilevers. The dead loads consider the roof materials, which results in 0.28 kN/m
2, and the structure’s self-weight, calculated during the process. The live loads correspond to a roof with access only for maintenance, which results in 1 kN/m
2.
Furthermore, for the cross-section optimization in the post-processing, the earthquake and wind loads are calculated according to local regulations, resulting in 144.77 kN for the former and 1.06 kN for the latter [
33,
34]. As mentioned earlier, this allows for the configuration of the resulting designs with the largest cross-sections obtained for each load case, so the final result is resistant to all of them. For reference, a structure of similar dimensions composed of a system of IPE beams results in a mass of 27,217.39 kg and embedded emissions of 99,642.77 kgCO
2e.
After the initial configuration, the optimization process is launched. Once the resulting layouts are ready, all the data are extracted into an Excel file. This process includes the mass, average utilization, and displacement for each layout, the z coordinates of the control points, the number of subdivisions or modules in the truss, the number of trusses in the system, and the topology. These steps allow the results to be filtered according to admissibility conditions. They correspond to a minimum average utilization of 50% and maximum displacements of L/700, in compliance with the local building codes. Another provision is related to mass reduction, which corresponds to a mass below the median. This value was calculated with the material quantity of all the results to determine a reference to filter the results, leaving only those that are under this value to continue the evaluation. The layouts that comply with all of these conditions are allowable solutions.
Next, the designer can choose which layouts they want to evaluate based on the filtered results. For the case studies, we selected the top-ranked layouts for the different fitness functions: the layout with the lowest mass for the trusses (L1), the layout with the lowest mass, considering trusses and battens (L2), the layout with the highest average utilization (L3), and the layout with the smallest displacements (L4). Considering each load case, the selected solutions are subjected to cross-section optimization to extract the largest one for each bar, resulting in a maximum mass. Then, it is evaluated in all of the rationalization levels, obtaining the material quantity, embedded emissions, and displacements for each one.
3. Analysis of Results
After carrying out the optimization for both cases, the results were analyzed to evaluate the variation in material quantity, embedded emissions, and displacements for the different chosen layouts and rationalization levels. The analysis is presented below.
3.1. Case 1: Truss with Six Control Points Activated
In this case, the filtering process of the optimization results culminated in 2479 admissible designs. The minimum total mass, which considers the complete roof structure with trusses and battens, equals 8209.12 kg, the maximum average utilization is 77.44%, and the minimum displacement is 0.0043 m. Considering the same values from the total results, previous to filtering, the minimum total mass has the same value mentioned earlier, the maximum average utilization is 84.22%, and the minimum displacement has a difference of almost 50%, with 0.0022 m. The fact that the former two are better performing in the total results than the filtered results means that those solutions probably had one or both other objectives over the admissible values. Filtering seeks to find balanced solutions that perform well in different objectives. The median shows an improvement, going from 10,626.92 kg before filtering to 9670.96 kg after this process. Additionally, it is relevant to consider that the filtered results comply with all of the admissibility conditions established in the previous section.
The four selected layouts have a mass after optimization that increases after cross-section optimization (R0), with a difference that goes from 32.33 kg to 822.62 kg, representing a maximum of a 12.99% increase from the initial mass. The mass increase after cross-section optimization for the different load cases is produced because layout optimization is executed with one of the load cases (LC0). However, when the load case changes, some bars may have their admissible stress exceeded. By optimizing the cross-sections of the resulting designs in all load cases, the largest cross-section obtained for each bar is extracted to leave a final set of cross-sections that ensures the layout’s performance in any load condition. The maximum increase in value shows that the resulting layouts have good performance in the different load cases, thus reducing the variation in cross-sections when optimizing for each one.
This process continues to augment with the variation in the rationalization levels since the standardization of sections implies the oversizing of the bars by taking the largest section of the group. This mechanism also impacts the embedded emissions, which increase accordingly.
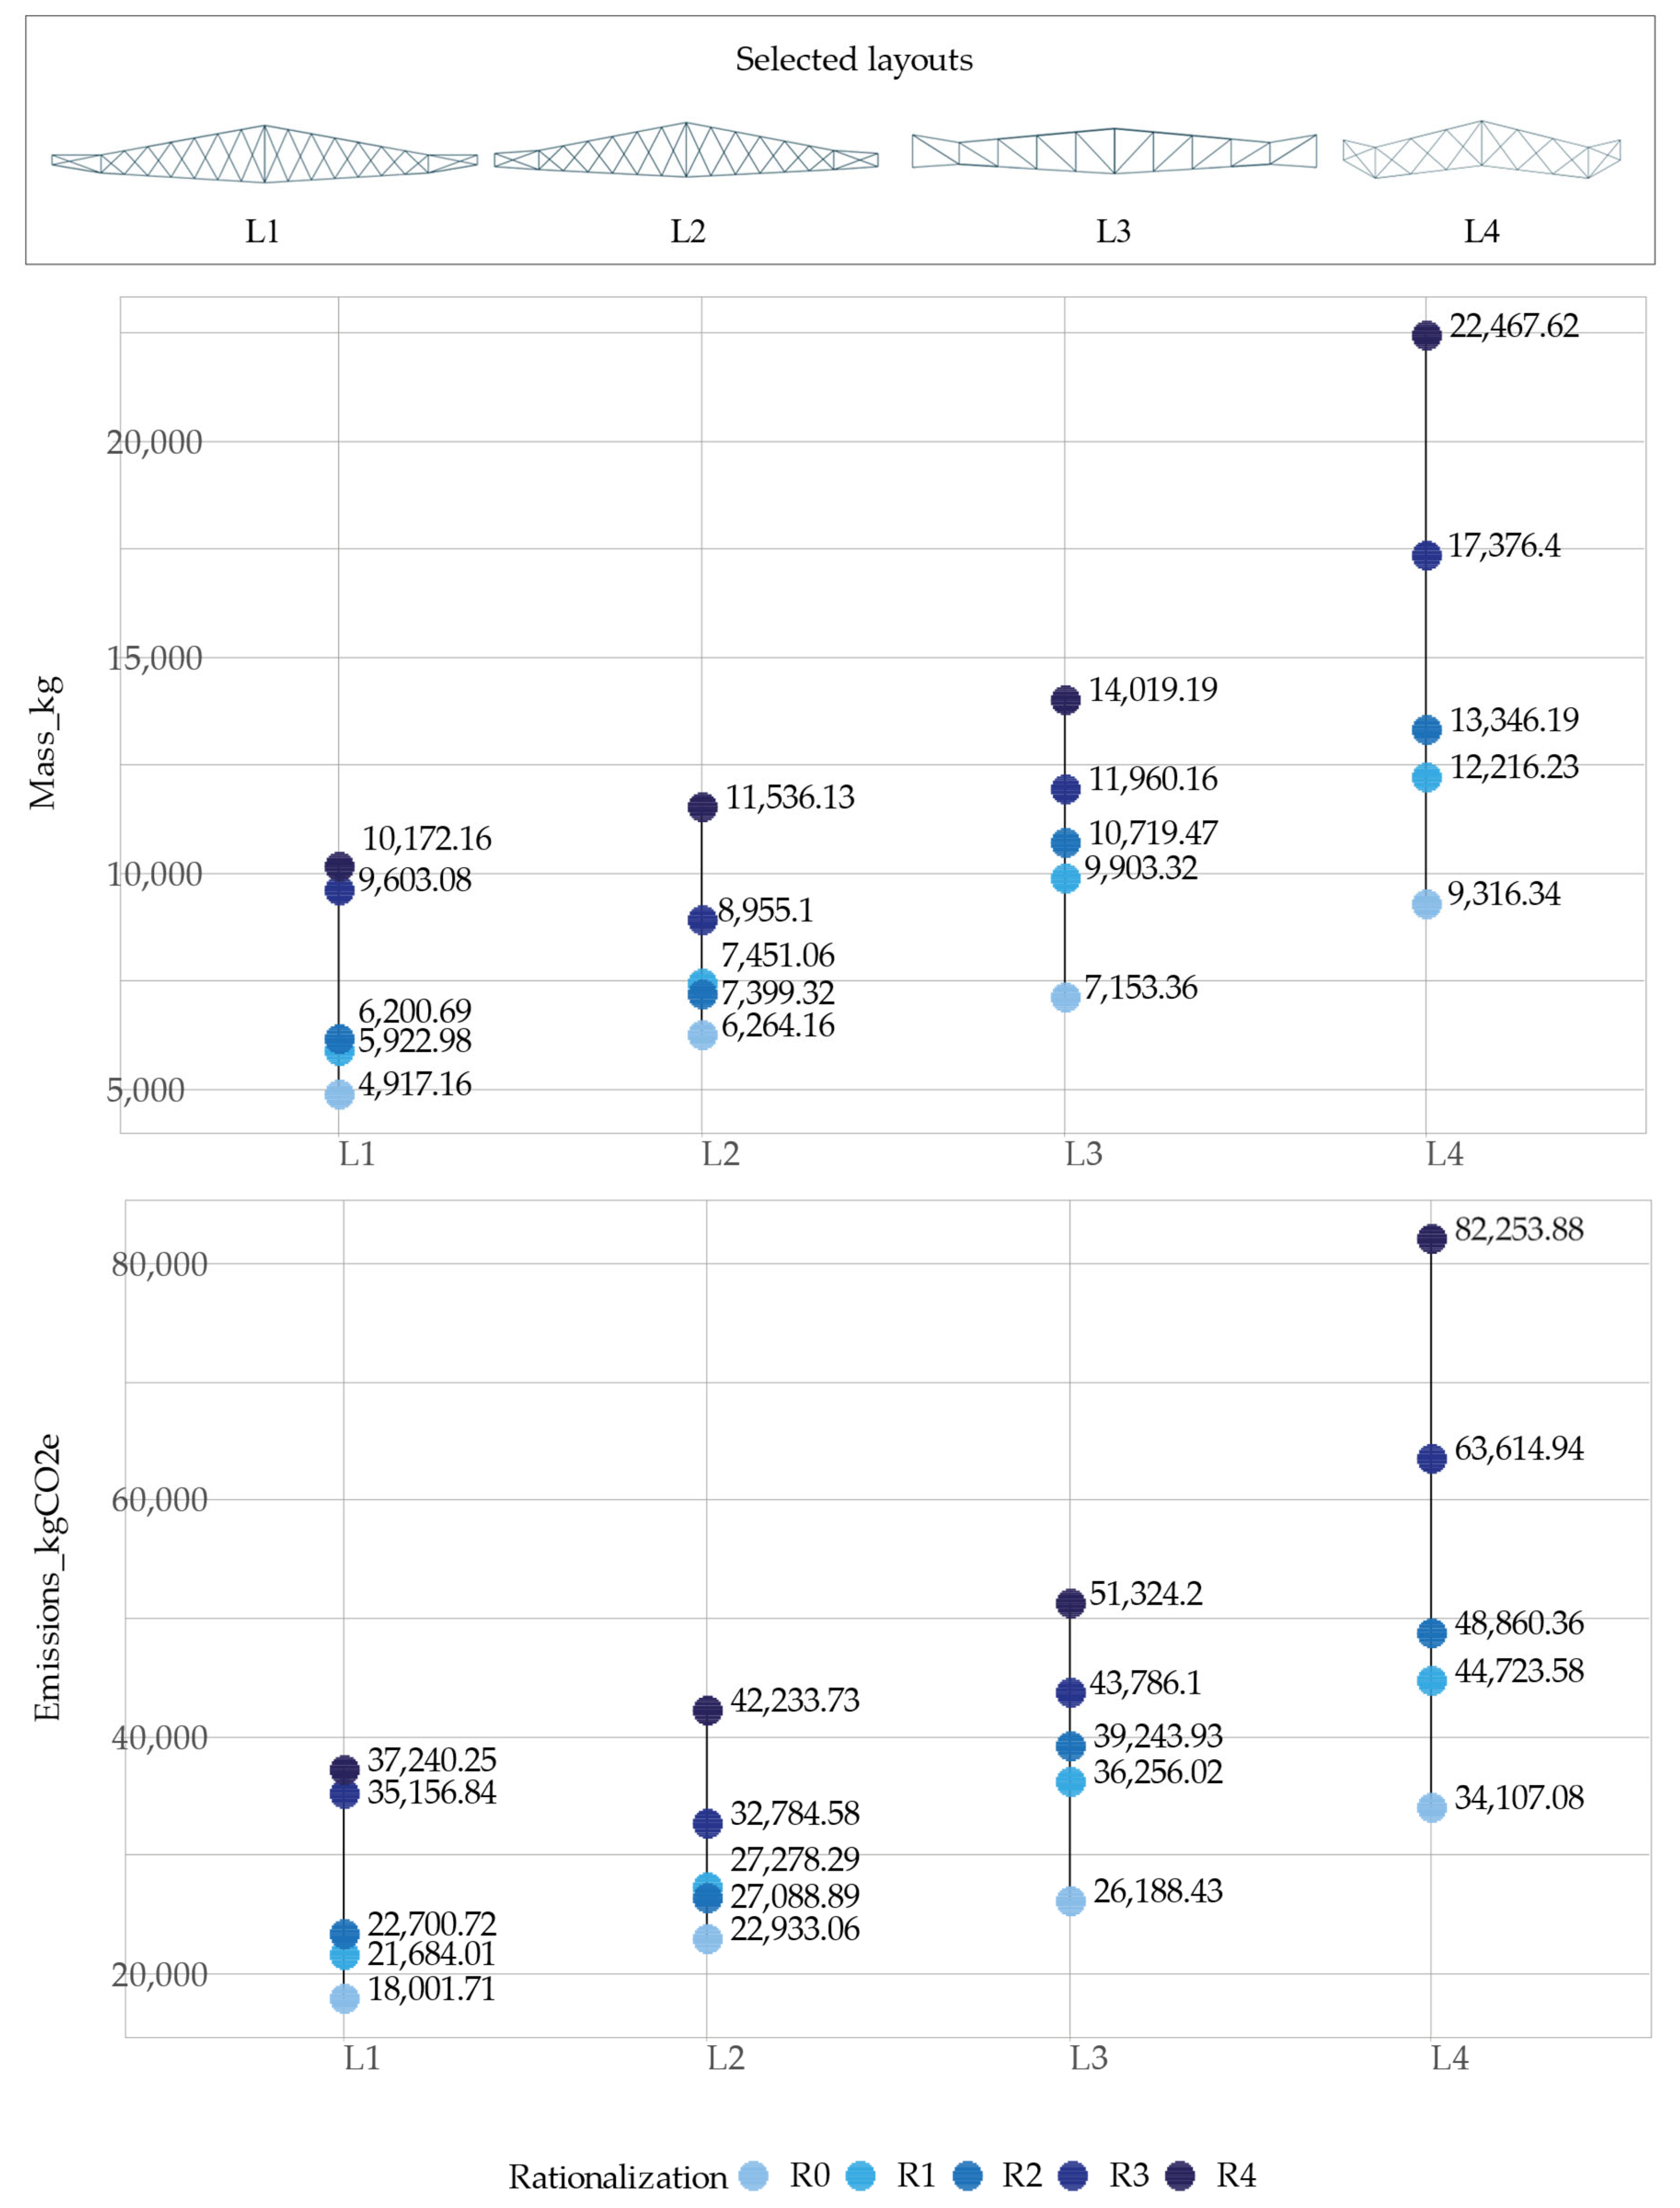
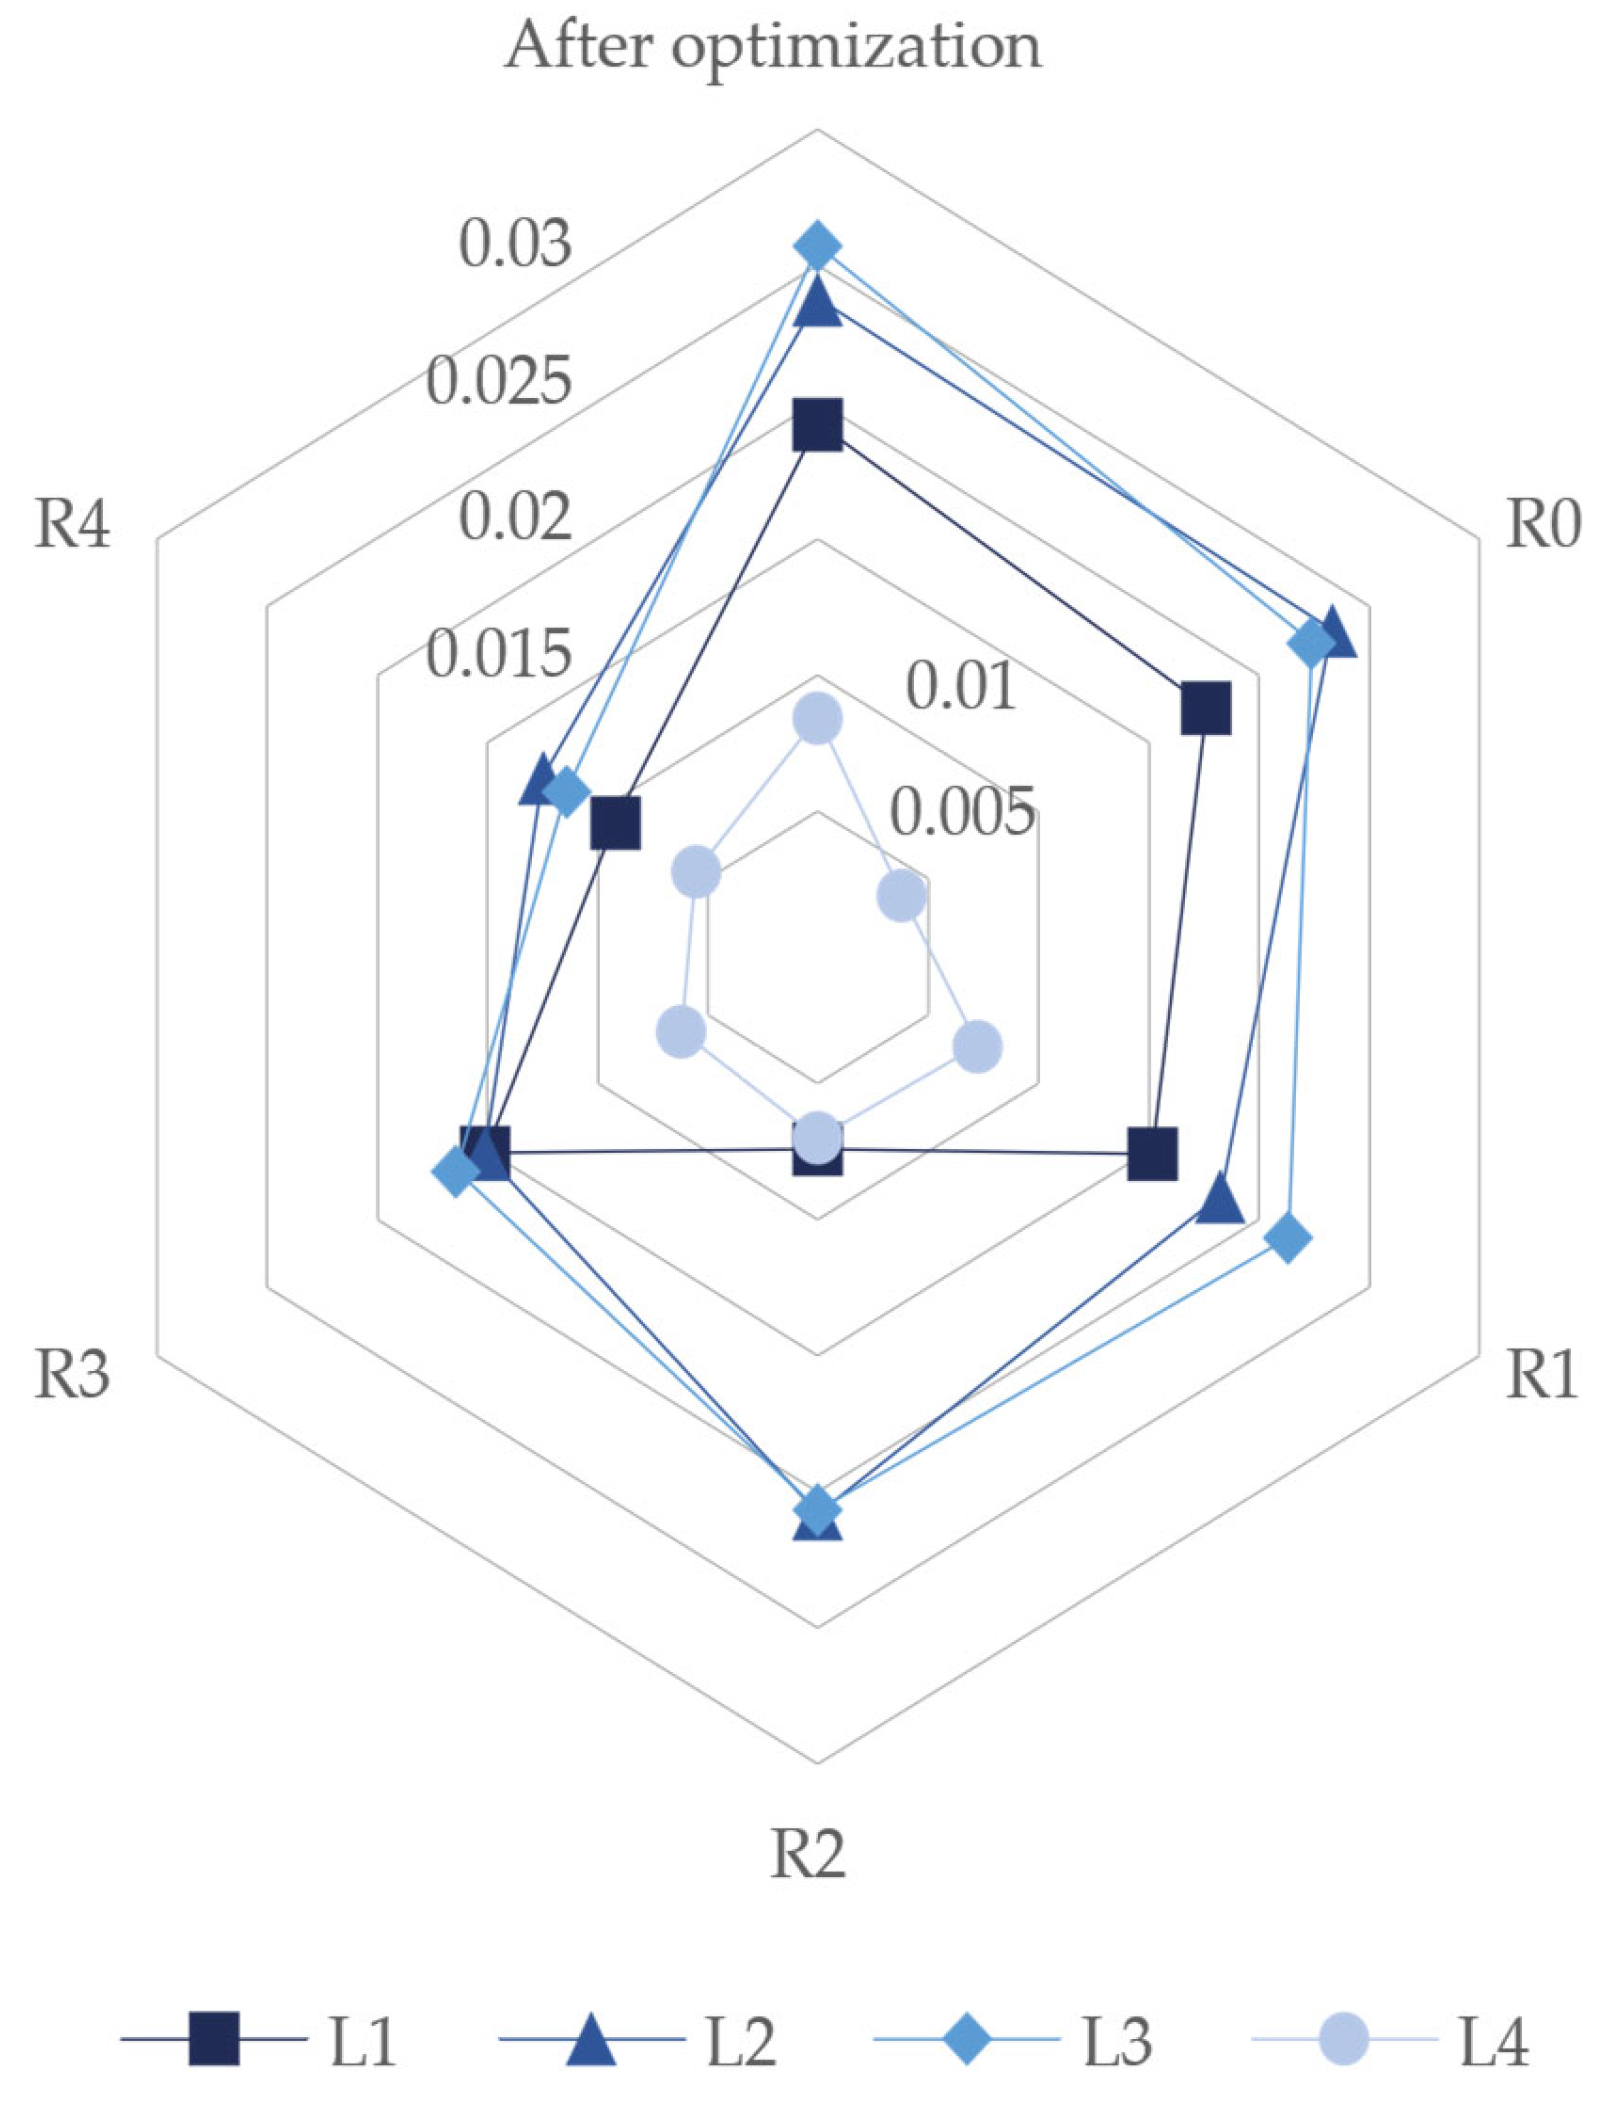
Figure 6 shows these variations for the chosen layouts in case 1, considering only the trusses.
When looking at mass and embedded emissions variability, there is a clear parallel between them. The lowest value for R0 is L1, while the highest is for L4. The same happens when assessing R1, where the chords are standardized, R2, which is composed of four different cross-sections for the trusses, and R4, where the trusses are composed of only one cross-section. The only difference is seen in the level of rationalization R3, which presents only two different cross-sections for the trusses, which shows L2 with the lowest and L4 with the highest. Additionally, L2 presents an inversion of rationalization levels R1 and R2, where the latter has a lesser mass and emissions. This phenomenon occurs because while standardizing cross-sections, it is not necessarily the largest that is required, thus helping to balance the mass and embedded emissions.
Regarding the differences between the variations in each layout, L1 has the smallest difference between R0 and R4, followed by L2, then L3, and finally L4. L2 and L4 present the most significant difference between R3 and R4, while L1 has it between R2 and R3. Moreover, L3 presents this between R0 and R1.
On the other hand, the geometry for the trusses is similar for L1 and L2, with more mid-span height, decreasing to extremes, and the same topology. L3 presents similar heights mid-span and at the end of both cantilevers, decreasing to the supports with a Pratt topology. Furthermore, L4 has a similar truss height mid-span; in the supports, however, the central control points are placed in a higher Z coordinate. The ends of the cantilevers are of smaller height and also placed in a higher Z coordinate than the supports, repeating the same topology as the first two layouts. Additionally, in terms of subdivisions, L1 and L2 present a higher density in the main span, and the four layouts have only one subdivision in the cantilevers.
Concerning the total roof structure, trusses, and battens, the parallel between mass and emissions remains (
Figure 7). In this case, the lowest and highest values for R0 are L2 and L3, respectively. The same output is found with R1, changing in R2 and the following rationalization levels, where L2 is again the lowest value, while L4 is the highest. Moreover, the inversion of the values in R1 and R2 is maintained for L2.
The differences between different rationalization levels are similar to what happens with the trusses, where L1 has the largest difference between R2 and R3, L2 and L4 in R3 and R4, and L3 in R0 and R1. Regarding the truss systems, L4 has the smallest distance between elements, at 1.67 m, while the most significant is present in L1, at 3.33 m.
On the contrary, displacements benefit from the augmentation of the standardization of the cross-sections, as seen in
Figure 8. Comparing the displacements of the optimized layouts and R0, there is a decrease in them, with a maximum difference of 40.36%, which is found in L2, except for L3, which increases by 0.41%. Then, they tend to decrease for all of the layouts until they reach R4, representing the lowest displacements for L3 and L4. However, L1 has its lowest value in R3 and L2 in R0. L4, the layout corresponding to the solution with the lowest displacements, performs best for all of the rationalization levels. Regardless, in any of the levels of standardization, the displacements will be lower than the admissible condition, L/700.
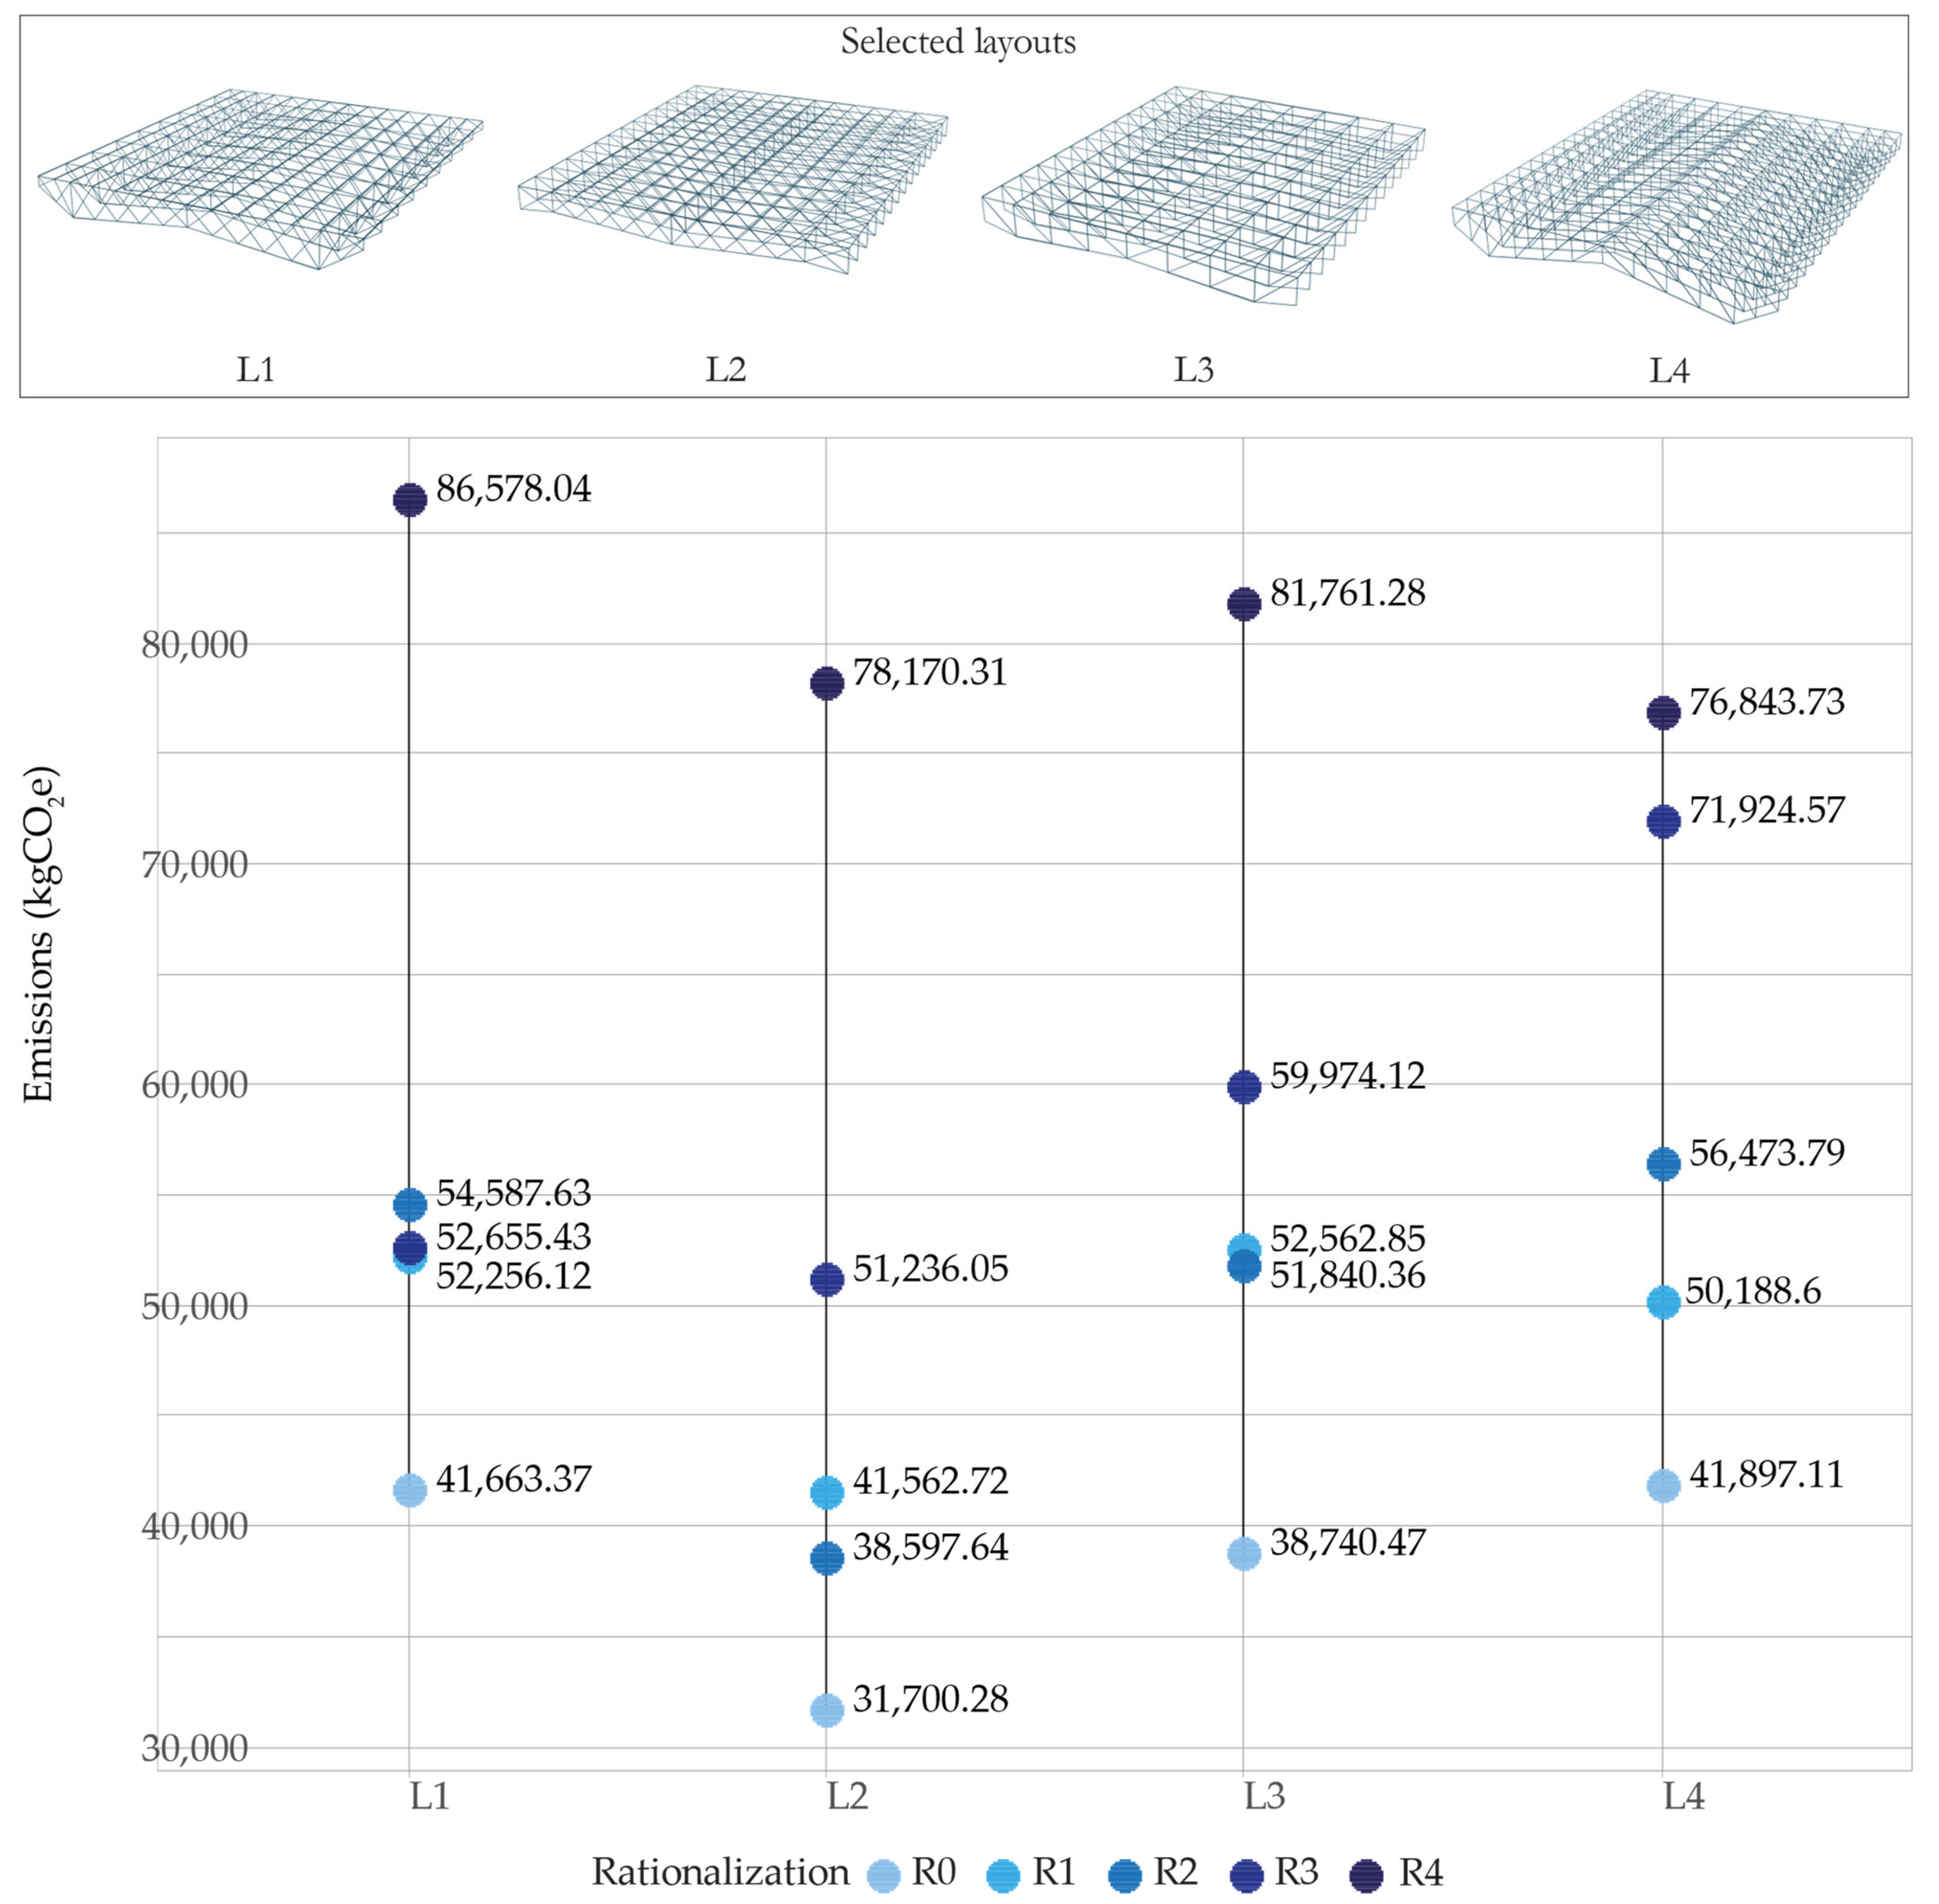
3.2. Case 2: Truss with Three Control Points Activated
First, the filtering process resulted in 992 admissible solutions, with a minimum total mass of 8468.54 kg, the highest average utilization of 78.75%, and a minimum displacement of 0.008 m. Comparing them to the total results from the optimization, there is an improvement in the median of the total mass, similar to the previous case, going from 10,680.35 kg in the latter to 9750.34 kg in the former. Moreover, the mass increment between the optimized layouts and the maximum mass after cross-section optimization is lower than in the first case, with a difference of 1.57% to 9.29%. The difference between the two cases demonstrates that the inverted truss optimization results in more efficient layouts that perform better in the different load cases and require fewer cross-section modifications. On the other hand, the impact on the assessment of CO
2 emissions is that if the mass increase is too much, it will also be for carbon emissions. Thus, the lowest difference means that by augmenting the rationalization level, the increased embedded emissions should be reduced, too. Given that mass and CO
2 emissions are directly proportional,
Figure 8 shows only the emissions related to the trusses.
Concerning the emissions of the different layouts, L1 has the lowest mass for R0, followed by L2, L3, and L4, which have the highest, similar to what happened in the previous case, except for the difference between each, which was larger. For R1 and R3, this order is maintained, but L1 and L2 have a similar value, just as L3 and L4 do. For R2, L2 has the lowest value, followed by L1, L3, and L4 with the highest emissions. Finally, for R4, L1 has the lowest value, followed by L2, L4 and L3.
Regarding the variations per layout, the augmentation of emissions in the different rationalization levels does not imply a continuous increase. For L1, the emissions values for R1 to R3 are near; however, the value for R3 is lower than for R2 and very close to R1. This scenario is comparable to what happens with L2 and L3, where R2 is lower than R1 in the latter, with them being much closer values.
For the shape of the trusses, there is more variability than in case 1, although L1, L3, and L4 all have similarities, whereby the support nodes have the lowest Z coordinates. L3 and L4 have almost the same Z coordinates for the mid-point and the cantilever control point, both with a difference of 0.1 m, while L1 has a difference of 0.9 between them, with the cantilever nodes being the highest. L2, on the other hand, has the mid-point with the lowest Z coordinates and the support nodes as the highest. Furthermore, the topology for L1 and L2 is the same as in the previous case, the same as L3, while L4 presents the Howe topology (
Figure 9).
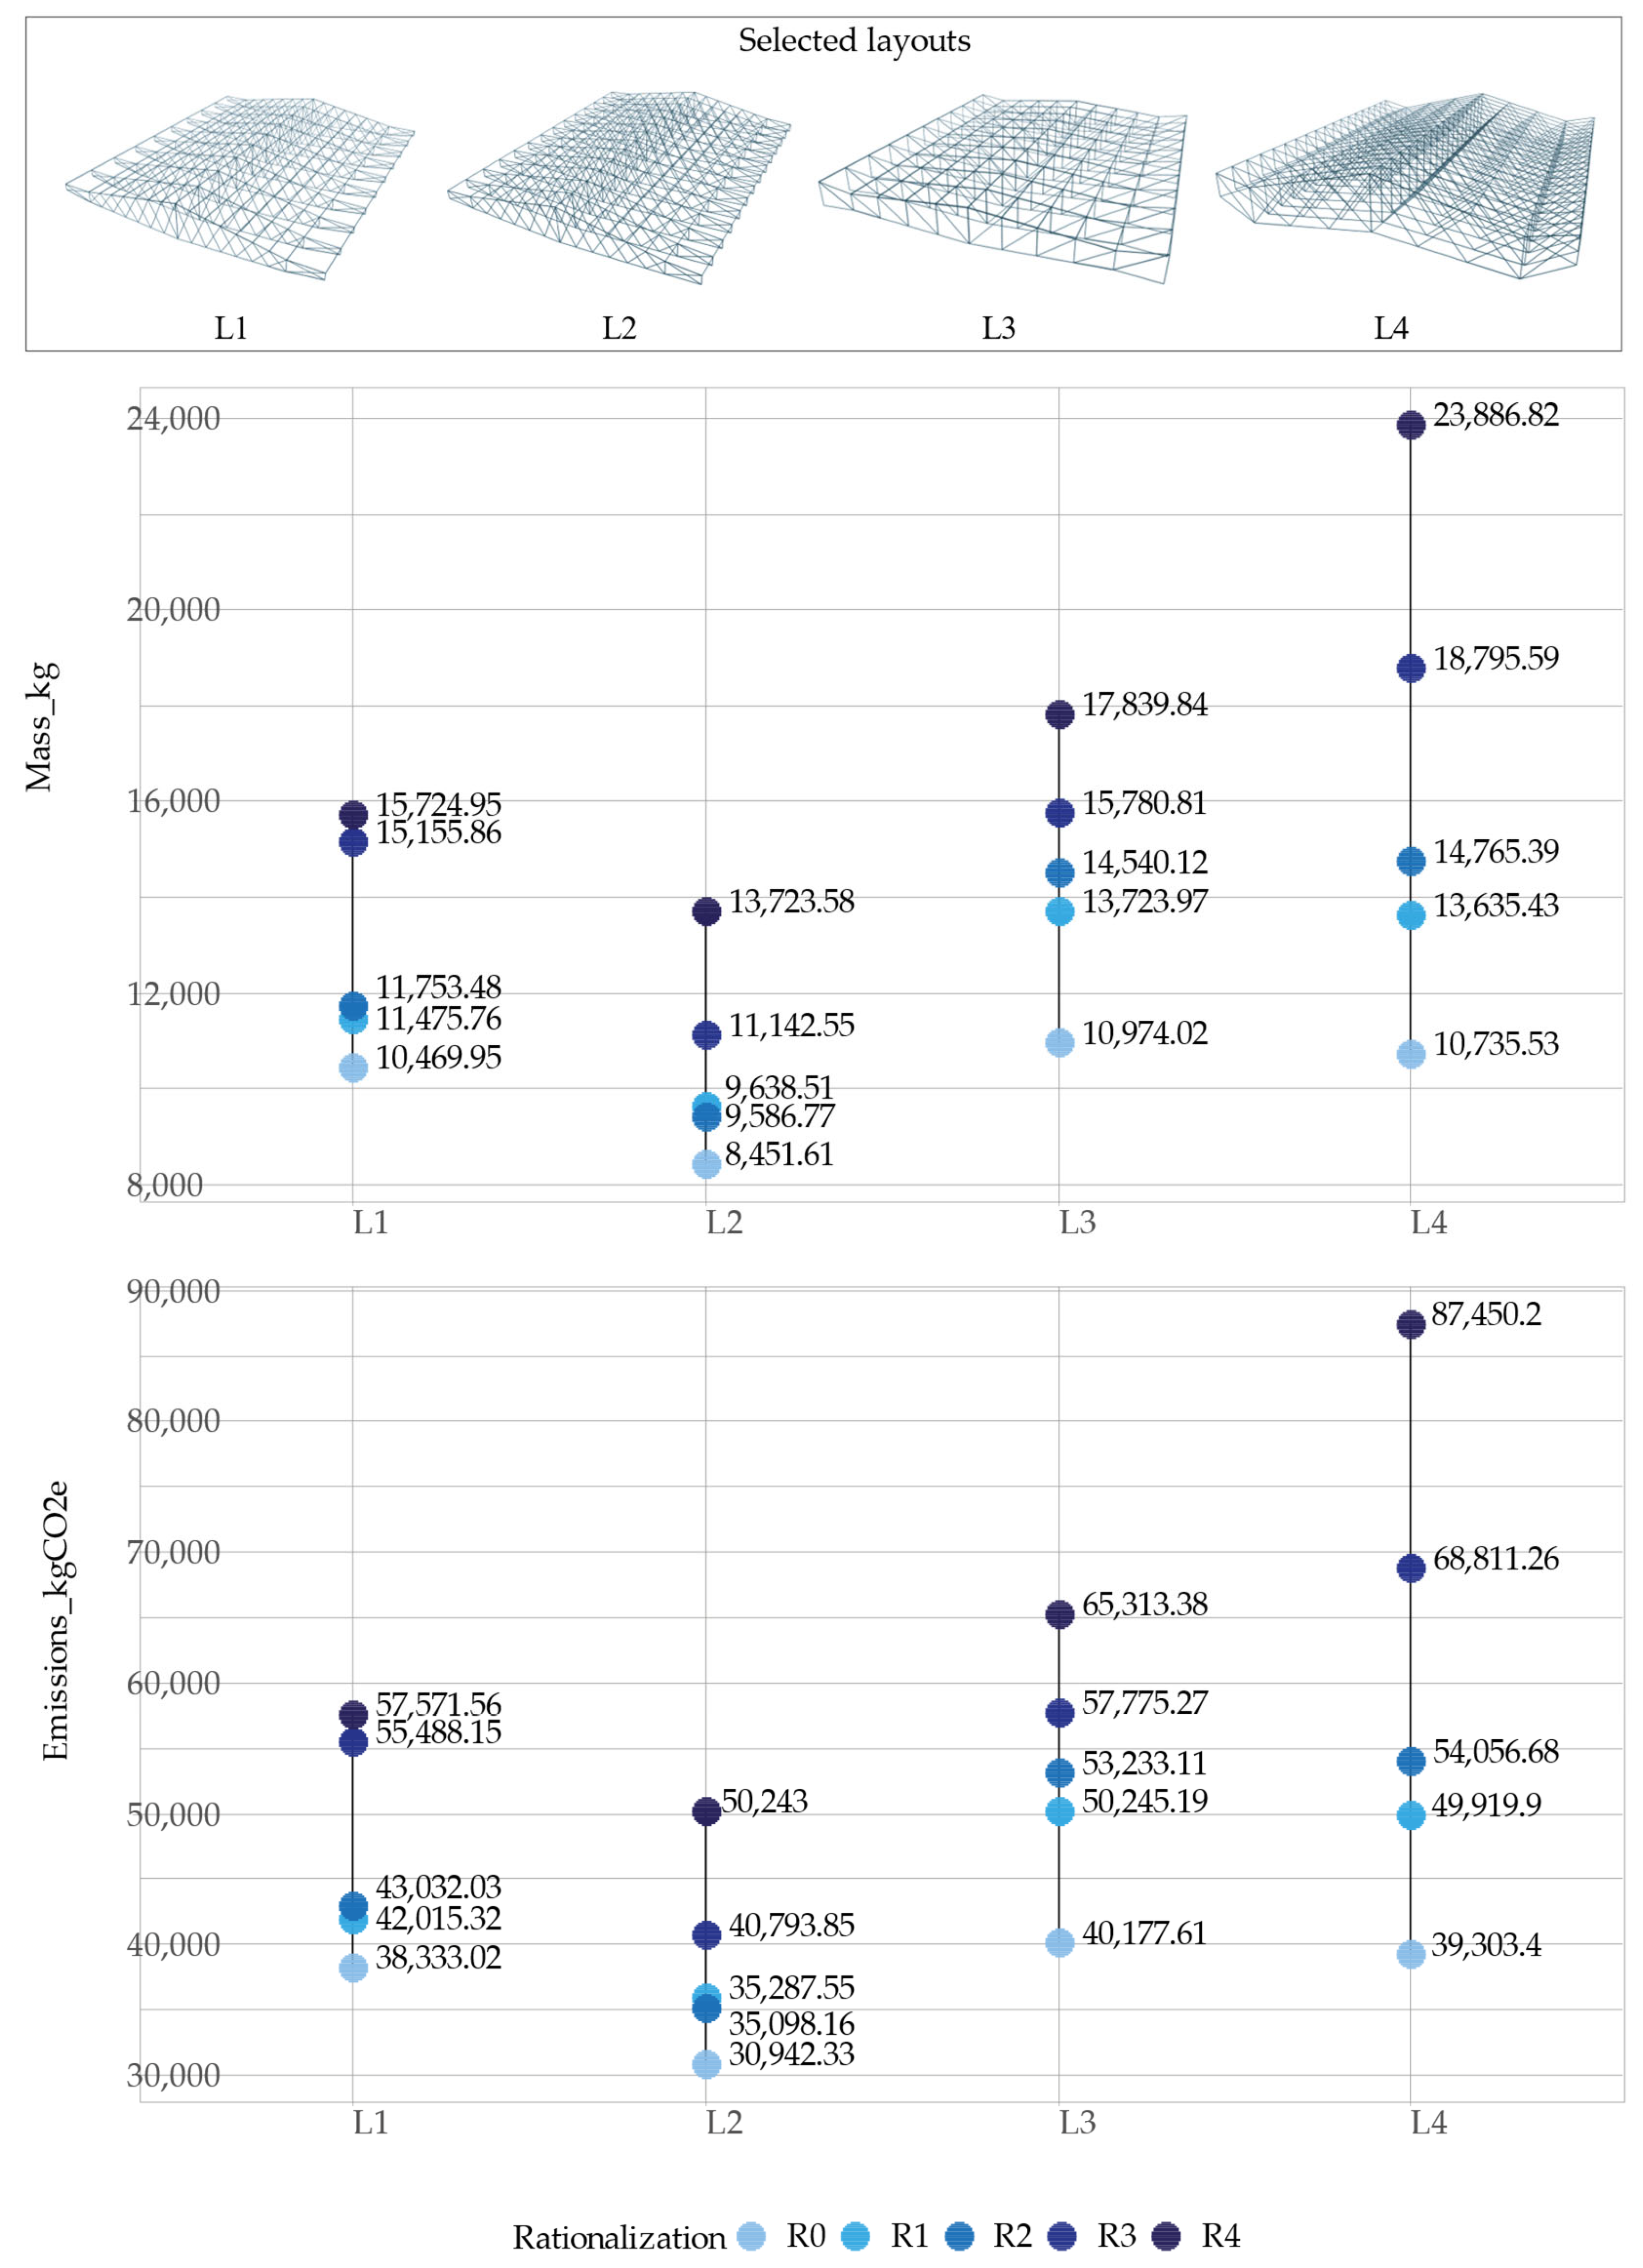
Considering the total roof structure, the lowest value of emissions for R0 and R2 is L2, followed by L3, L1, and L4, showing again that this can vary from the results of the trusses only (
Figure 10). For R2, L2 has the lowest value, followed by L3, L1, and L4 with the highest. For R3, L2 also has the lowest value, followed by L1, L3, and L4. Finally, for R4, L4 has the lowest value, followed by L2, L3, and L1. Hence, the best-performing layout may differ depending on the required rationalization level.
Regarding the distance between trusses, L2 has the smallest distance, at 2.14 m, meaning that the system has more trusses. The largest distance is for L1 and L3, at 3.33 m for both. This finding explains why they tend to have high emission values since the cross-sections for the battens will be larger.
Concerning displacements, there is not such a continuous decrease while augmenting rationalization, as in case 1. There is a decline in the displacements after optimization and R0, with a more significant difference in the case of L4. However, there is an increase in this value on different occasions, for example, L4 between R0 and R1 or L1 between R2 and R3. Furthermore, in this case, L4 is once again the best-performing of all of the rationalization levels (
Figure 11).
4. Final Reflections
This research presents an approach that enables the application of optimization processes during the conceptual design of truss roof structures. It allows for the evaluation of different layouts with specific information, considering material quantity, embedded emissions, and displacements. Hence, it enhances informed decision-making at the early stages of a project’s design. The approach considers layout optimization and a post-process that includes cross-section optimization for different load cases and the assessment of distinctive rationalization levels to compare diverse alternatives based on their characteristics, the project’s requirements, and the user’s design preferences.
Considering the general process, the division into two main phases, optimization and post-process, is a solution used in similar studies. For example, Xu et al. [
35] propose a similar approach based on the continuous topology optimization of 2D trusses whose results are refined to clean up geometrical complexities, such as round corners, in a post-processing phase that extracts the skeleton of the resulting layouts. Nevertheless, this can still result in trusses composed of many different cross-sections, an issue that is solved in our approach based on layout optimization, thus reducing geometrical complexities and grouping of bars.
In this regard, the presented procedure considers grouping according to their position. A comparable approach is proposed by Cucuzza et al. [
29], who suggest a two-stage grouping, first, by gathering bars according to their position and stress type, and second, within these groups, by the magnitude of the stress. This results in a process only applicable to symmetrical trusses with pinned connections on their extremes and a minimum of 3 different cross-sections. However, our approach can be applied to diverse types of trusses and consider solutions with only one cross-section, hence being adaptable to different structural typologies and giving more alternatives for rationalization.
Furthermore, Lu and Xie [
30] present a similar method, also based on layout optimization and a posterior grouping depending on the size of cross-sections and the length of the bars, reoptimizing the layouts afterward. Nonetheless, this implies modifying the resulting layouts from the optimization. Our procedure is grounded in the designers’ decision-making, who determine the admissible conditions and choose their preferred layouts; thus, maintaining their shapes is a relevant feature.
Concerning this aspect of designer preferences, this study seeks to deliver information and design alternatives, allowing for an informed decision process. Warmuth et al. [
36] developed a method that enhances the exploration of diverse truss systems, oriented to ensure performance and flexibility for design. For this, a digital environment based on Rhino/Grasshopper enables the designer to establish initial parameters, considering fixed nodes, for layout optimization, giving the option to modify them while the optimization proposes new configurations in static equilibrium. However, our procedure focuses on offering options that comply with performance and admissibility conditions determined by the user and provide data that allows for their comparison, favoring informed decisions.
Mass and consequential emissions augmentation during the post-process are also found in other studies. Lu and Xie [
30] observed an increase of 40% in the material volume of the layouts when reaching a single cross-section for a cantilever truss. In our study, this can result in an increment of over 146.59% of the mass. Nonetheless, there are intermediate solutions with a mid-level rationalization that can be more convenient. Moreover, our method centers on comparing alternatives to find the most suitable to meet the project’s requirements.
5. Conclusions
Energy efficiency has always been a topic of interest for both the scientific community and practitioners. From this perspective, the present research focused on addressing the conceptual design of truss systems for roof structures with data about their structural and environmental performance, considering material quantity, embedded emissions, and displacements. The procedure includes layout optimization and post-processing, where different rationalization levels can be evaluated to integrate buildability aspects. This approach enables the comparison of various design alternatives, including precise information about the indicators.
The process seeks to support informed decision-making while giving alternatives for the designer, thus allowing the assessment of different design options and rationalization levels and facilitating an improvement in the energy efficiency of structures from a design point of view. In this sense, the results show that high rationalization provokes an augmentation in the truss’ mass and embedded emissions but a reduction in terms of displacements. Thus, by assessing diverse options, it is possible to find balanced solutions that ensure good performance and maintain significant constructability.
Furthermore, concerning the designer’s role in the procedure, the approach presents various instances of interaction inputs to the process that can be incorporated. These are concentrated in the post-process after optimization is carried out. First, the users establish admissibility conditions to filter the total results, ensuring compliance with regulations or other project requirements. Then, they choose the layouts to be evaluated at different rationalization levels, allowing them to select the final alternative to be applied to the project.
Regarding limitations, the present study focused on different types of 2D trusses, while other typologies, such as 3D trusses and truss frames, were not included and could imply new conditions for the procedure. On the other hand, the optimization models considered only roof structures, excluding vertical elements, such as columns and braces. Integrating these structural components could help achieve more efficient results.
Furthermore, the grouping of bars for cross-section standardization depended on the position of these components since this is a common way to fabricate trusses. Other approaches, seen in the literature, classify elements by the type and magnitude of stress. An assessment of possible grouping options could help find the most effective method.
In terms of future research, upcoming studies could consider integrating the vertical elements of the structures, including columns and bracings, to enhance the possible reduction in embedded emissions. Moreover, they could examine the trusses’ connections, their optimization, and standardization to incorporate this critical aspect of truss structures. Additionally, they could explore the grouping method further to make it more effective for the process. Finally, they could expand to other types of truss structures.


