1. Introduction
Climate change and global warming are major threats to human society, and their root causes are related to energy consumption and greenhouse gas emissions. Buildings account for approximately 40% of global energy consumption and play an important role in the energy market. Global energy demand for buildings is expected to continue to grow in the coming decades [
1,
2]. The residential sector accounts for 27% and 17% of global energy consumption and carbon dioxide emissions, respectively, and plays an important role in mitigating global climate change [
3].
In the UK, the cold winter leads to a strong demand for heating, making heating energy consumption account for a large proportion of the overall energy consumption of residential buildings [
4,
5,
6]. To effectively reduce this energy consumption, the transformation and optimization of building envelopes is particularly critical.
By improving the energy efficiency of buildings, strengthening the insulation of building exterior walls, installing energy-saving equipment, and using renewable energy technologies, energy consumption can be significantly reduced, and indoor comfort can be improved [
7,
8]. In particular, innovative technologies, such as PCMs and high-efficiency insulation materials, can reduce dependence on energy while ensuring comfortable room temperatures and reducing carbon footprint [
9]. PCMs, with their excellent heat storage capabilities, can more effectively cope with severe fluctuations in ambient temperature by absorbing and releasing latent heat, which has significant advantages over traditional insulation materials. Most studies on PCM applications focus on hot climates, while research on its use in cold regions to reduce winter heating loads is relatively limited. A paper based on the climatic effects of PCMs on building energy demand and comfort in Auckland, New Zealand, shows that most of the savings from PCMs on building energy consumption come from cooling and only a small amount from heating [
10]. This is why it is more difficult to study the reasons for the effects of winter insulation. However, some studies about using PCMs for heating loads do exist.
Controlling the temperature range as much as possible within the phase-change range can not only regulate indoor temperature fluctuations, but also store a large amount of heat [
11]. A project from Iran tried to apply PCMs to hot regions and cool regions, and found that, for cool regions, energy consumption decreased in winter, but there was an energy consumption increase in summer, which is the function characteristic of PCMs [
12]. In addition, a study in the Middle East suggests that the effect of PCMs on heat exchange in winter and summer may be reversed, with PCMs with higher phase-transition temperatures performing better in summer and PCMs with lower phase-transition temperatures performing better in winter [
13]. Specifically, a PCM designed for a specific temperature range will not work for other extreme limits as the source material used in the PCM will have been optimized and likely combined. Another study from Shanghai used EnergyPlus to evaluate the performance of PCM siding in lightweight buildings in Shanghai in hot summer and cold winter climates. The effect of PCMs with lower transition temperatures in summer was better, and vice versa in winter [
14]. PCMs overheat easily in summer, so for cold winter areas such as the United Kingdom, where the summer temperature is low, and the impact on energy consumption is relatively small, using PCMs in winter can also be considered. Sultan Kenzhekhanov and Shazim Ali Memon et al. integrated PCM 19-PCM 27 into buildings in several cities with subarctic climates and found that PCMs with low melting temperatures were best during the swing season, while PCMs with high temperatures were best during the summer [
15]. Paul Devaux and Mohammed Mehdi Farid point out that PCM floor heating and PCM wall panels have great benefits for winter heating. Using a high-melting-point PCM with an underfloor heating system allows for significant peak load transfer, while using a low-melting-point PCM on walls and ceilings provides the comfort required by the building [
16]. These cases in cold areas show that PCMs also have great potential to reduce the winter heat load of buildings.
Several PCM-integrated products have been tested by researchers in various studies. A study by Saeed Esbati and Mohammad Ali Amooie et al. of the Sharif Institute for Energy Research in Iran shows that PCMs save up to 30% of the heating energy and about 8% in the country cooling load of the building [
17]. Dileep Kumar and Morshed Alam et al. have combined aerogel render and PCMs in building walls, a strategy that reduces energy use, peak cooling demand, CO
2 emissions, and operational energy costs in air-conditioned buildings [
18]. Guixiao Zhang and Yuyu Min et al. proposed a new concept of dynamic PCM wall structure, trying to apply PCM to cold cities in northern China. The selected PCMs all have the potential of winter heat release, and the study found that the thermal properties of different positions of PCM layer are significantly different [
19]. Frederic Kuznik and Joseph Virgone studied the thermal properties of PCM copolymer composite panels in winter and summer, and for all tested cases, the reduction factor varied between 0.73 and 0.78 [
20]. An evaluation of hybrid PCM gypsum and shape-stabilized PCM panels in passive-solar-heating buildings shows that the optimal melting temperature is around 21 degrees Celsius in colder-winter areas such as Beijing [
21]. Guobing Zhou and Yinping Zhang et al. studied a south-facing direct-gain room with a shape-stabilized phase-change material (SSPCM). Studies on plates show that PCM plates with large area and thin thickness have advantages, and the effect of PCM plates located on the inside surface of the inner wall is better than that of those located on the outer wall (south wall) [
22]. A Chinese study investigates the degree of influence of four key parameters of PCM integrated building envelopes in the Chinese climate: envelope type > PCM layer layout > PCM type > PCM layer thickness. This provides a reference for the combination of PCM and wall insulation in this project [
23]. A review of the application of PCMs in building heating summarizes many cases of application of PCMs in building heating. At present, no specific parameters of wall insulation and PCMs used in building can be found, so it is a new direction of thinking [
24].
A study highlighting the integration of Building Performance Simulation Tools (BPST) in building design highlights the importance of incorporating energy simulation tools early in the design process to optimize building performance, particularly in terms of energy consumption and thermal comfort. For this study, software tools such as OpenStudio and EnergyPlus were used to simulate optimization at the early stage of design, to enhance the impact of the combination of PCM and wall insulation on the total energy consumption of the building [
25].
A study has focused on improving the mechanical properties of concrete by integrating waste high-density polyethylene (HDPE) as an aggregate substitute, with an emphasis on optimizing material proportions for optimal performance. Reference to its optimization ratio method is helpful for testing different PCMs, their thicknesses, and their synergistic effects when combined with insulation materials in this project [
26]. Khalil, Umer, Aslam, Bilal et al.’s use of machine learning models to predict and optimize results can inform methods for predicting building performance, and energy consumption or thermal comfort when combining PCMs with insulation can also be optimized in conjunction with machine models [
27].
When a PCM is applied to a building’s exterior walls, it can significantly reduce the building’s energy consumption. However, since the phase-change temperature of the PCM has a certain range, to maximize its effectiveness in heating energy consumption, it is necessary to keep its operating temperature within the phase-change range as much as possible. For exterior walls with poor thermal insulation performance, combining PCM with exterior wall insulation materials can provide better working conditions for the performance of the PCM, thereby enhancing the overall thermal insulation effect. In EnergyPlus, a dedicated setting is provided for phase-change materials (PCMs), allowing users to incorporate the PCM as an independent layer within the wall structure of a building model. During heat transfer calculations, EnergyPlus employs the conduction finite difference (CFD) method, which differs significantly from the conduction transfer function (CTF) model commonly used for conventional wall insulation. Specifically, the CFD method discretizes the wall into multiple grid cells, performing calculations at each grid point to determine the temperature distribution and subsequently assessing the phase state of the PCM. This detailed computational approach enhances the accuracy of PCM thermal performance simulations, providing a more realistic representation of its thermal behavior in practical applications.
This project indicates that, compared with using wall insulation materials alone, the investment payback period of adding PCMs is longer, but with the continued development of PCM technology, its manufacturing costs are expected to be further reduced, thus improving its economic feasibility. This research simulates and analyzes three PCMs with different phase-change temperatures to reveal the key parameters that affect PCM performance, including phase-change temperature, wall insulation layer thickness, and indoor winter temperature set value. Research shows that there is a critical value for the thickness of the wall insulation layer: when the thickness is lower than the critical value, increasing the thickness of the PCM can effectively reduce building energy consumption; but when the thickness exceeds the critical value, further increasing the PCM thickness may lead to higher building energy consumption.
In addition, the study also found that the indoor temperature setting value of the building in winter has a significant impact on the performance of the PCM. When the set temperature is higher, a PCM with a lower phase-transition temperature reaches the critical point earlier; while when the set temperature is lower, the critical insulation layer thickness of the three PCMs generally increases. This shows that in building design, reasonable selection of wall insulation layer thickness and phase-change temperature of PCM, combined with optimization of indoor temperature set values, is the key to ensuring that the PCM exerts a positive energy-saving effect.
2. Materials and Methods
2.1. Explanation and Introduction of Research Methods
The primary goal of this project is to explore the application potential of PCMs on building winter energy consumption in cold areas.
Building information collection: The methodology began with data collection and establishing an accurate baseline model that aligned with actual building performance. The data gathered included construction details, energy consumption logs, and occupancy schedules. This process aimed to ensure that subsequent interventions and retrofits could be accurately simulated and assessed for their potential benefits.
Building simulation in Energyplus: By building a building model in SketchUp and OpenStudio and performing simulation calculations in EnergyPlus, the simulation results of building energy consumption were generated. The accuracy of the model was ensured by comparing the simulation results of the model with the actual measurement data.
Strategies added and data monitoring: Retrofit technologies were applied to improve the baseline model’s energy efficiency. The building’s external wall was modified to include insulation and a PCM. These materials were used independently and in combination, ensuring the PCM was within a temperature range to store heat and contribute to thermal comfort effectively. After the building retrofit was completed, a bedroom on the first floor of the building was selected as the research object to evaluate its performance. During the analysis, the indoor temperature, outdoor temperature, inside surface temperature of an exterior wall connected to the outside air, and outside surface temperature of the room were extracted. In addition, the number of hours that the PCMs on the inside surface of the external wall were in different states (solid, liquid, and in the phase-change process) within a year was obtained from the EnergyPlus report. These data provide a basis for evaluating the impact of building renovation on thermal performance. Finally, the payback years were obtained through cost analysis.
Results and analysis: This study uses building simulation and modification to obtain detailed data on the building’s energy consumption and environmental changes. By comparing and analyzing the effects of using wall insulation or PCMs alone and the combined impact of the two, a relatively optimal renovation plan for the building can be provided.
2.2. Introduction of the Original Building
This research is based on a detached house in Belper, Derbyshire, England. The latitude is 53°01′07.8″ N, and the longitude is 1°30′08.9″ W.
Figure 1 shows the 3D architectural model of the base-case building; the orange line points north. The building is a two-story structure with a pitched roof featuring a skylight to enhance natural light within the interior. On the building’s west side (left side) is an extension with three windows, adding extra space and ensuring good lighting. The front façade includes two main entrance doors, providing access to the building. Windows are distributed across multiple sides, particularly on the extension’s upper level, which helps improve indoor lighting conditions. The building is oriented 20 degrees northwest. Overall, this building model reflects the characteristics of a modern residential design, with the west extension adding more flexibility to the living space. At the same time, the skylight and windows maximize the use of natural light indoors.
The ground floor includes the entrance hall, utility room, kitchen, dining room, lounge, and lobby. The entrance hall is the main entrance to the building, connecting various areas. The utility room is located next to the corridor and can be used to store household items. The kitchen has an independent door adjacent to the utility room, with good lighting. The dining room is located on the kitchen’s south side and has windows to ensure sufficient light. The lounge is located on the left side of the building. It is an ample open space with multiple windows and enough natural light. The lobby is in the center of the building and connects the rooms. The overall layout is reasonable and fully functional.
The first floor includes several key rooms: the central landing area is accessible from the staircase and connects all the rooms. On the north side (right side), two bedrooms are on either side of the landing. On the south side (left side) is a main bedroom and a study/bedroom; the study/bedroom is positioned in the southwest corner, while the main bedroom is in the southeast. A void area is also located north of the main bedroom, providing structural support. Adjacent to the staircase is a cylinder room used for the hot water supply. The shower room and the bathroom are located on the northeast side of the floor, providing convenient access for residents. Overall, the layout is compact, with bedrooms on both the north and south sides and sanitary facilities on the north side, offering a well-designed and functional space.
The original building’s external wall comprises a three-layer structure with the following components: 100 mm natural sandstone (external), a 100 mm cavity, 100 mm lightweight concrete block, a 100 mm cavity filled with Shell blown polystyrene bead insulation, 100 mm lightweight concrete block, and a 12 mm layer of lightweight plaster and skim (internal). Due to this configuration, the wall exhibits high thermal insulation properties, achieving a U-factor as low as 0.207 W/m2-K. In contrast, most buildings in the United Kingdom still utilize a typical double-layer cavity wall, with a U-factor of approximately 1.766 W/m2-K. In this study, to evaluate the impact of different insulation layers on building energy consumption, the original external wall of the building was replaced with the typical double-layer cavity wall commonly found in the UK, and this modified building is treated as the base case for the analysis.
Regarding the weather file in this model, Watnall is the closest weather station, and weather data were downloaded from the Energyplus Weather File Network (GBR_ENG_Nottingham.Watnall.033540_TMYx.epw).
The structure of the windows is the common double glazing, consisting of two panes and an air gap between them. The physical performance parameters of window glass and air layer are shown below.
Table 1 provides a detailed overview of the physical performance parameters of the inner and outer glass layers of a window. These parameters include thickness, solar transmittance, electrical conductivity, solar and visible reflectance, and infrared transmittance.
Table 2 provides the thermal and physical properties of the air layer, such as conductivity coefficients (A, B, and C), viscosity coefficients, and specific heat coefficients. These detailed data are essential for analyzing the thermal performance of windows in building energy simulations, focusing on how these materials affect heat transfer, solar radiation, and overall energy efficiency.
Table 3 provides the types and thickness of materials for each building component.
The building’s operational schedules, including occupancy, lighting, and equipment, are customized to the lifestyle of the retired owner and his wife. They select the schedules for different parts of the building based on personal preference, aiming to manage the electricity loads for lighting and equipment to approximately 1 gigajoule (GJ).
People: The building accommodates two residents, with a fraction radiant of 0.3 and a carbon dioxide generation rate of 0.000038 L/s·W.
Lights and Equipment: The defined electric loads are 4 W/m2 for lighting and 2 W/m2 for electrical equipment, facilitating energy conservation.
Ventilation and Infiltration: Adequate ventilation is ensured with an outdoor airflow rate of 9.44 L/s per person. Infiltration is controlled at a flow rate of 0.000226568 m/s per exterior surface area, maintaining indoor air quality and thermal comfort.
This structured approach in detailing the construction and operational specifications of the building highlights the precision in balancing comfort with energy efficiency according to the owner’s preferences.
The building is a detached residential building with two elderly residents.
Figure 2a shows the total electricity consumption of the building from 1985 to 2021, in gigajoules (GJ). The horizontal axis represents the year and the vertical axis represents energy consumption. As can be seen from the figure, electricity consumption generally increased from 1985 to 2001, especially between 1995 and 2001, reaching a peak of nearly 12 GJ. After 2001, electricity consumption declined and reached its lowest point in 2009 (about 4 GJ). Since 2010, electricity consumption has gradually recovered and remained at a relatively stable level (about 6–8 GJ) from 2013 to 2021.
Figure 2b shows the total natural gas consumption of the building from 1983 to 2021, in gigajoules (GJ). The horizontal axis represents the year, and the vertical axis represents natural gas consumption. Overall, from 1983 to 2000, natural gas consumption showed an overall fluctuating upward trend, but the fluctuation was small, and the consumption was mostly stable at around 80 GJ. Subsequently, from 2001 to 2005, natural gas consumption fluctuated greatly, reaching a peak in 2005 (about 100 GJ), and then gradually declined. From 2006 to 2011, natural gas consumption continued to fluctuate and decline, falling to a lower level in 2011 (about 60 GJ). From 2012 to 2021, natural gas consumption gradually stabilized, remaining at around 60 GJ, with small fluctuation.
2.3. Technology’s Introduction
The widespread application of PCMs during the summer is primarily attributed to the significant daily temperature fluctuations, with the phase-transition temperature of PCMs typically falling within the range of daytime temperature variations. This enables PCMs to regulate the indoor thermal environment effectively by absorbing excess heat during the day and releasing it at night. However, during winter, outdoor temperatures—both day and night—tend to remain lower than the indoor setpoint, necessitating additional heating systems to maintain a comfortable indoor temperature.
In this context, integrating PCMs into the inside of the building’s external walls primarily enhances the thermal inertia of the structure. By increasing the thermal mass, a PCM helps to delay the building’s response to external temperature fluctuations, thereby reducing the frequency of heating system cycling. Additionally, as outdoor temperatures fluctuate, PCM stores and releases heat in response to these changes, mitigating rapid indoor temperature variations and further improving the operational efficiency of the heating system. This dual effect of thermal regulation and system optimization highlights the strategic role of PCMs in enhancing thermal comfort and energy efficiency, particularly in winter conditions where temperature stability is crucial.
To ensure that the PCM operates within a suitable temperature range, this study introduced three types of insulation material with different thermal conductivity between the PCM and the exterior wall. These materials are common products that are easily available in the UK market.
The three kinds of wall insulation material chosen for this project are shown in
Table 4.
Table 4 shows the conductivity of three materials: Knauf Supafil 40 Cavity Wall Insulation, Marmox Multiboard Waterproof Insulation Board, and Celotex TB4000 Insulation Board, respectively.
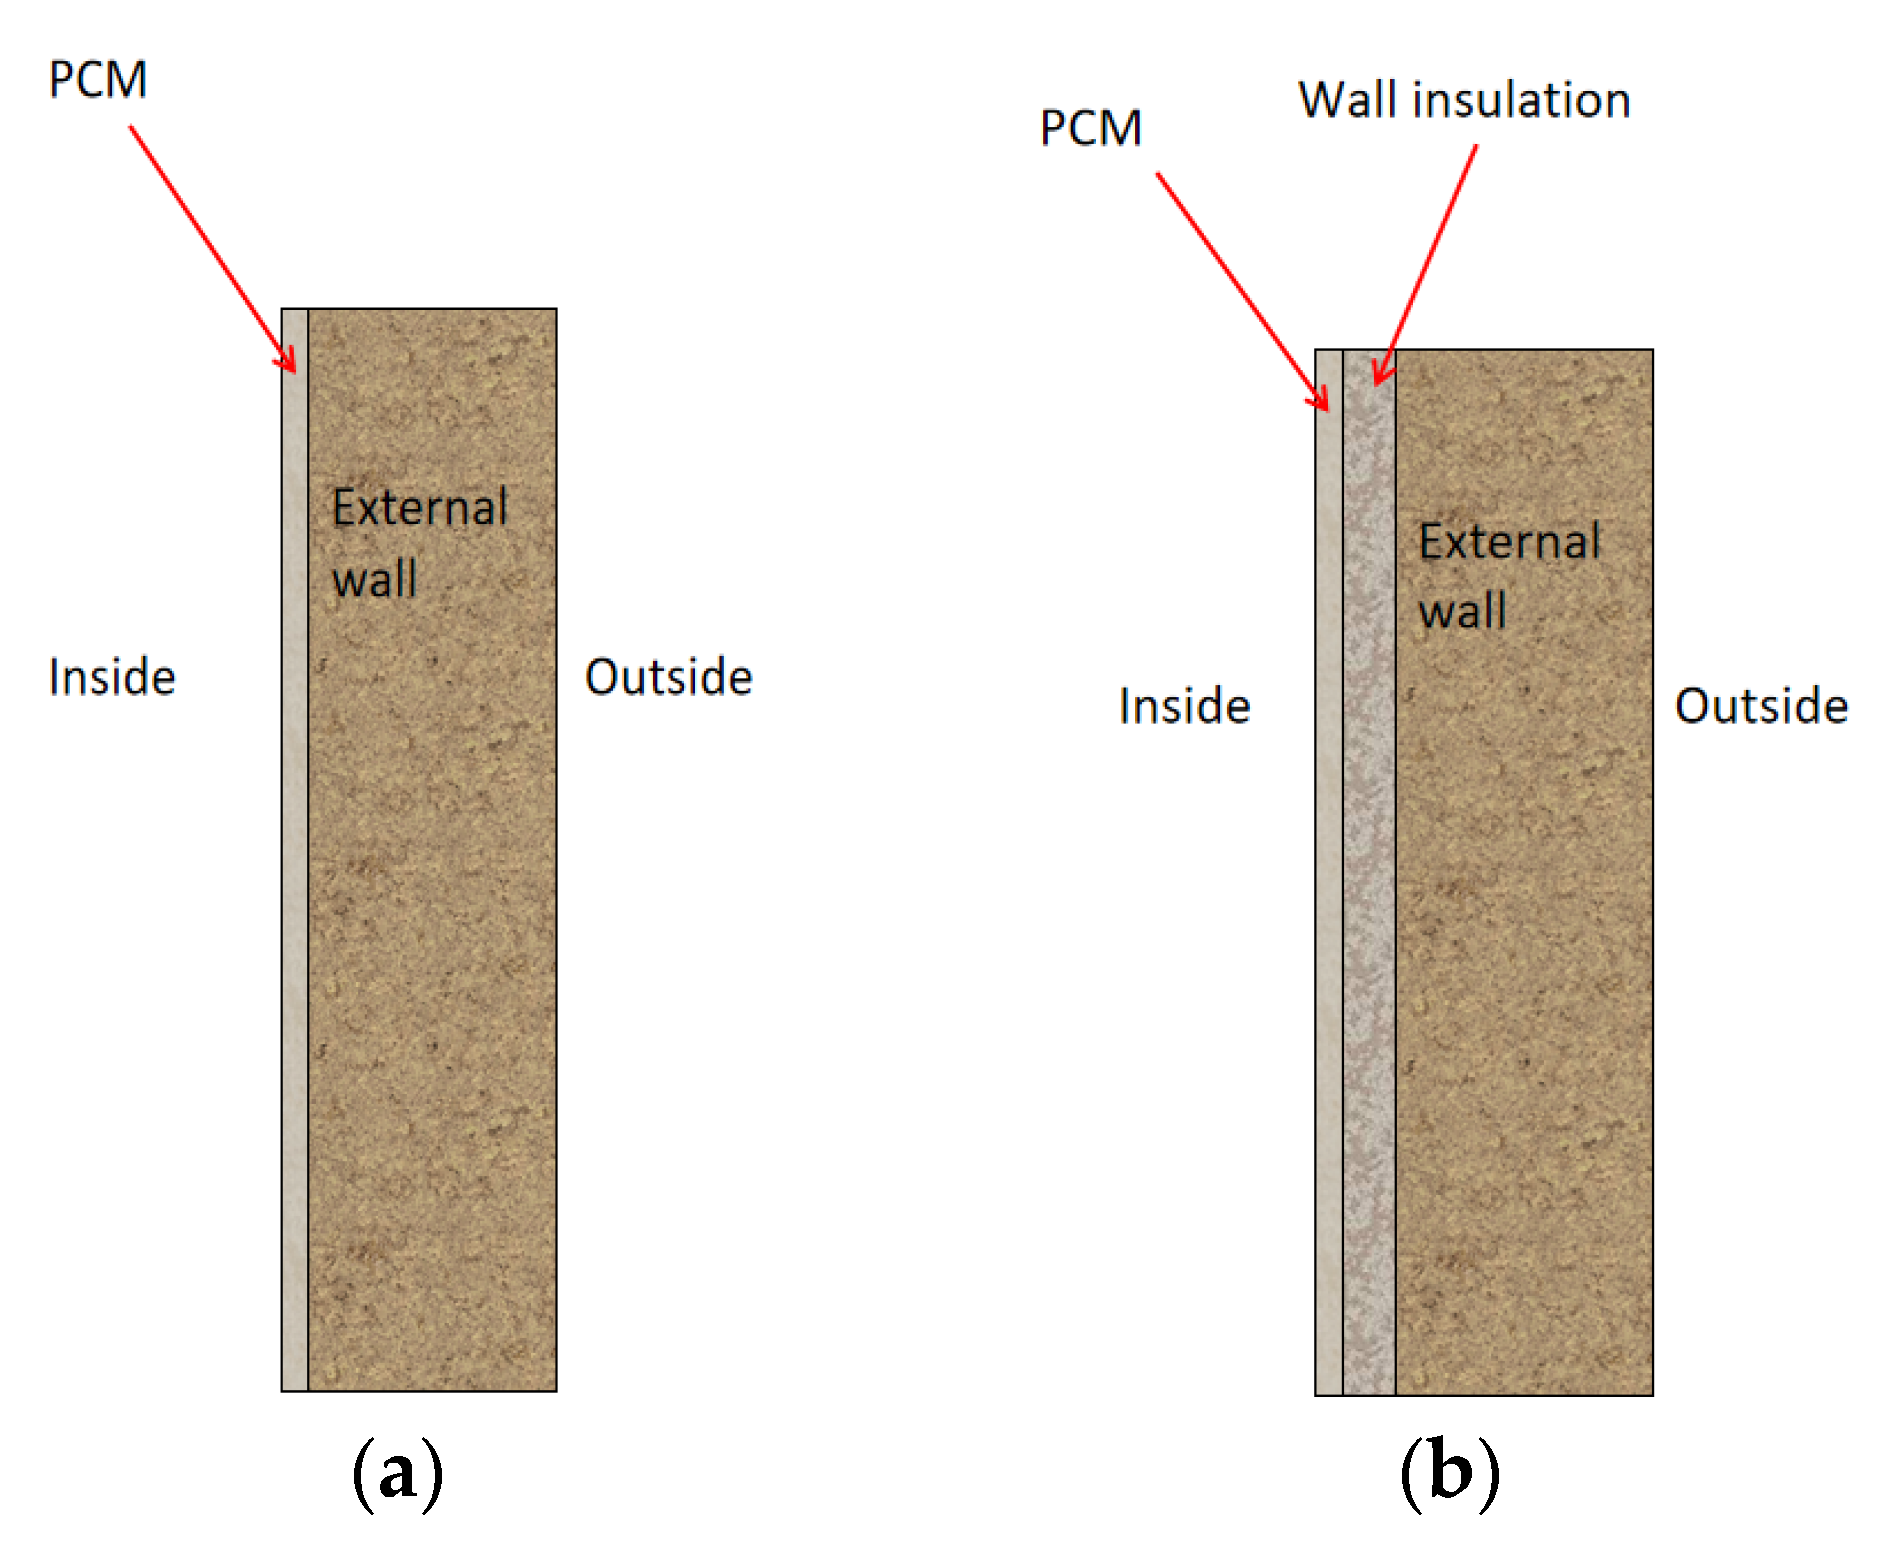
Figure 3 shows two types of PCM applied to building exterior walls. The left figure shows the layout of PCM applied to the inside surface of the building’s exterior wall, where the order from indoor to outdoor is indoor, PCM, external wall, and outdoor. The right figure shows the situation where PCM is combined with wall insulation material and applied to the inside surface of the building’s external wall, where the order from indoor to outdoor is indoor, PCM, wall insulation, external wall, outdoor.
Table 5 provides the parameters of each selected PCM. These three selected PCMs are all phase-change paraffin waxes. As organic paraffin waxes, their main characteristics include no phase separation, stable melting point, low corrosiveness, and good plasticity. Their phase-change temperature range is 22–24 °C, which provides important conditions for studying the role and performance of phase-change temperature on PCMs in building thermal performance.
3. Results
In this section, the original building and its modified external wall models are first presented. Specifically, the buildings were modeled as common double-wall structures with cavities and modeled using SketchUp and OpenStudio, and then the building energy consumption was simulated using EnergyPlus software. Next, the simulation results of the building’s external walls after technical modifications are presented. The modification measures include adding wall insulation materials with a thickness of 25 mm to 200 mm on the inside and outside of the building external walls, adding 1 to 5 cm PCMs on the inside of the external walls, and combining 1 to 5 cm-thick PCMs with 25 mm to 200 mm Celotex TB4000 insulation boards on the inside of the building. The simulation results of these modification schemes provide a basis for the subsequent building energy efficiency analysis.
3.1. Energy Consumption of the Original Building and Base-Case Building
Since three-layer walls are not very common in the UK, this study changes the wall into a common double-layer cavity wall.
Figure 4 provides the schematic diagram of the double-layer cavity wall.
The energy consumption of original building and base-case building is shown below.
Table 6 provides the energy consumption of the original building and the base-case building. By comparing the simulation results of the original building with the actual building energy consumption data (measurement data), it was found that there was a high degree of consistency between the two, indicating that the simulation results effectively reflect the actual energy consumption. Therefore, the model is reliable. After the building’s external wall was modified to a double-layer cavity wall typical of the UK, it served as the base-case building for this project.
3.2. Environment Condition of Thermal Zone 9
To more comprehensively evaluate the impact of adding insulation materials to the building’s exterior walls on building performance, this project selected a bedroom on the first floor as a reference object. The bedroom was defined as Thermal Zone 9 in the model. During the analysis, four indicators were selected for observation—the inside and outside surface temperature of the exterior wall (Surface 72) in the thermal zone, the temperature of Thermal Zone 9, and outdoor temperature of thermal zone 9—to better understand the effect of insulation materials on the indoor and outdoor thermal environment. To evaluate the impact of building materials on winter building energy consumption after being applied to buildings, this project selected data from 3 December, a day with lower outdoor temperatures in winter, for analysis to ensure that the analysis reflected the energy-saving effect of the materials under cold climate conditions. Thermal Zone 9 is the main observation object, and the external wall data of the room are derived from the EnergyPlus report as a reference object after adding different material combinations to the building.
Figure 5 shows the location of Thermal Zone 9 and Surface 72 in the Openstudio model.
Figure 6 shows the illustrations of the four key temperatures related to the external wall: the surface inside face temperature, the surface outside face temperature, the zone indoor temperature, and the outdoor temperature.
3.3. PCM Energy Consumption Analysis
When considering the addition of PCMs to the exterior wall of a building to regulate and balance indoor temperature, it is beneficial to place the PCM on the inside side of the external wall. This is because the indoor temperature is higher, while the outdoor temperature is too low for the PCM to reach its phase-change temperature range.
This study focuses on three selected PCMs: RT22 HC, RT24 HC, and PureTemp23. These materials were applied to the inside surface of the building’s exterior wall in thicknesses ranging from 1 cm to 5 cm, and their impact on the heating load was analyzed. The following sections provide a detailed comparison of the heating load reductions achieved by each material across the specified thicknesses.
Table 7 shows the heating loads of three PCM materials (RT22 HC, RT24 HC, and PureTemp23) added with different thicknesses. As the thickness of the PCM material increases from 1 mm to 5 mm, the heating load decreases.
Figure 7 uses a line chart to illustrate the impact of adding different thicknesses of three PCM materials—RT22 HC, RT24 HC, and PureTemp23—on the heating load of the building.
At a thickness of 0 mm (baseline, without PCM), the heating load for all three materials is identical, starting at 165.22 GJ. However, as the thickness increases, each material significantly reduces the heating load, albeit at different rates.
RT22 HC consistently reduces the heating load across the entire thickness range. It decreases from 165.22 GJ at 0 mm to 138.31 GJ at 5 mm, reflecting a total reduction of 26.91 GJ. RT24 HC exhibits a similar trend to RT22 HC, with the heating load decreasing from 165.22 GJ at 0 mm to 139.21 GJ at 5 mm. The total reduction is 26.01 GJ. PureTemp23 is also effective in reducing the heating load, but its reduction rate is somewhat slower compared to the other two materials. The heating load decreases from 165.22 GJ at 0 mm to 145.69 GJ at 5 mm, resulting in a total reduction of 19.53 GJ.
Overall, the general trend indicates diminishing returns as thickness increases. The most significant reductions occur between 0 mm and 3 mm, while the reductions become less pronounced from 4 mm to 5 mm for all materials. Among the three materials, RT22 HC achieves the greatest reduction in heating load at each thickness, followed closely by RT24 HC, while PureTemp23 lags slightly behind.
3.4. Wall + PCM Energy Consumption Analysis
3.4.1. Winter Thermostat Setpoint 22 °C
When considering adding phase-change materials to the exterior walls of buildings, the temperature of the phase-change materials should be kept within an appropriate range. For the original building, since the ideal air load is used, the indoor temperature in winter is set to 22 degrees Celsius. When the PCMs were added to the inside side of the building’s exterior walls, which are connected to the indoor environment, the temperature of the PCMs was also selected to be around 22 degrees Celsius. After trying to add the PCM materials to the inside side of the building’s exterior walls, the data for the building’s exterior walls are exported, and the inside surface temperature of the exterior walls can be obtained.
The next test was to combine three different thicknesses of PCMs (1, 2, 3, 4, 5 cm) with varying thicknesses of Celotex TB4000 Insulation Board (25, 50, 75, 100, 125, 150, 175, 200 mm) and add them to the building exterior wall. The combinations were as follows: PCM, wall insulation, original external wall.
Table 8 shows the heating loads after wall insulation and PCMs (RT22 HC, RT24 HC, and PureTemp23) with different thicknesses had been added. The thickness of the PCM material was from 1 mm to 5 mm, and the thickness of wall insulation was from 25 mm to 200 mm.
Figure 8 uses a line chart to illustrate the impact of adding different thicknesses of three PCM materials.
The analysis of RT22 HC and Celotex TB4000 insulation shows that combining insulation and PCM significantly reduces heating loads, with the effect most pronounced at moderate insulation levels. For an insulation thickness of 25 mm, adding 1–5 cm of PCM decreases the heating load from 95.58 GJ to 88.4 GJ. At 50 mm, the load drops from 74.65 GJ to 70.8 GJ, showing diminishing returns as insulation thickness increases. At 75 mm and 100 mm, the heating load further reduces from 66.91 GJ to 63.19 GJ and 61.81 GJ to 57.63 GJ, respectively, with the PCM impact becoming less significant. At 200 mm insulation, PCM provides negligible reductions, with the heating load only decreasing from 54.55 GJ to 51.36 GJ. These results highlight that the combination of insulation and PCM is most efficient at 75–100 mm thickness, where energy savings are substantial, while higher insulation levels diminish PCM’s effectiveness. Optimal design should balance insulation and PCM to maximize energy efficiency and cost-effectiveness.
As wall insulation thickness increases, the influence of PCM thickness on reducing building heating load diminishes for all three PCMs. Specifically, RT22 HC, with the lowest phase-change temperature, exhibits the fastest convergence of its lines as insulation thickness increases. This suggests that the impact of PCM thickness becomes negligible more quickly for RT22 HC, indicating that additional PCM thickness provides minimal energy-saving benefits at higher insulation levels.
In contrast, RT24 HC, with the highest phase-change temperature, maintains a more noticeable effect of PCM thickness even as wall insulation increases. This shows that the incremental energy-saving benefits of increasing PCM thickness remain observable for RT24 HC, suggesting a more sustained positive impact of the PCM at higher insulation levels. This behavior highlights a key characteristic: PCMs with higher phase-change temperatures, like RT24 HC, demonstrate greater effectiveness in leveraging PCM thickness for energy efficiency improvements in well-insulated buildings compared to PCMs with lower phase-change temperatures, such as RT22 HC.
3.4.2. Winter Thermostat Setpoint 24 °C
In the original building, the indoor setpoint temperature was 22 °C. However, even with increased wall insulation thickness, the inside surface temperature of the wall only reached approximately 22 °C at its highest. Given that the selected PCMs have phase-change temperatures of 22 °C, 23 °C, and 24 °C, the initial indoor temperature setting did not provide a clear indication of the PCM’s performance under phase-change conditions. Therefore, in this part of the study (winter thermostat setpoint 24 °C), the indoor temperature was increased to 24 °C in order to better assess the impact of PCMs on thermal performance.
The following is the change in the building’s heating load when the PCM, wall insulation, and original external wall structure are used.
Table 9 shows the heating loads after wall insulation and PCMs (RT22 HC, RT24 HC, and PureTemp23) with different thicknesses had been added and when the indoor setpoint is 24 °C. The thickness of the PCM material was from 1 mm to 5 mm, and the thickness of the wall insulation was from 25 mm to 200 mm.
Figure 9 uses a line chart to illustrate the impact of adding different thicknesses of three PCM materials when the indoor setpoint is 24 °C.
When the indoor temperature is raised to 24 °C, the performance of the PCMs becomes more distinct due to the corresponding increase in the temperature of the inside surface of the exterior wall, which influences the phase-change behavior of the materials.
RT22 HC: With its phase-change range below the increased temperature, the PCM begins to lose its effectiveness as wall insulation thickness exceeds approximately 75 mm. At this critical point, the surface temperature surpasses the phase-change range of RT22 HC, leading to diminished latent heat storage and, ultimately, a negative impact on energy efficiency with further increases in PCM thickness. This phenomenon highlights the limitations of RT22 HC in maintaining its effectiveness under higher indoor temperature conditions.
PureTemp23: With a slightly higher phase-change temperature range, PureTemp23 demonstrates better performance than RT22 HC. Its critical thickness occurs at around 125 mm of wall insulation. Beyond this point, the material also starts to exhibit reduced effectiveness as its phase-change capability is increasingly bypassed. However, it remains functional for a broader range of insulation thickness compared to RT22 HC under elevated indoor temperatures.
RT24 HC: With the highest phase-change temperature among the three PCMs, RT24 HC remains effective across all insulation thicknesses examined in this scenario. The surface temperature does not exceed the material’s phase-change range, allowing it to continue storing and releasing latent heat efficiently. This demonstrates that RT24 HC is better suited for applications involving higher indoor temperatures and thicker insulation layers.
3.5. Environmental Conditions of Thermal Zone 9 After Modified
Figure 10, shown below, includes the zone indoor temperature, external wall inside surface temperature, external wall outside surface temperature, and outdoor temperature of Thermal Zone 9, and represents vital environmental parameters of the thermal zone.
Figure 10a presents data for the original common wall condition without the addition of insulation. The graph shows hourly temperature profiles for the inside and outside surfaces of Surface 72, as well as the mean air temperature in Thermal Zone 9 and the outdoor air temperature.
Inside Surface Temperature (Surface 72) (black line): The inside surface temperature remains consistently lower than the indoor mean air temperature. This suggests that without insulation, the wall’s thermal resistance is insufficient to maintain the inside surface temperature close to the desired indoor air temperature, leading to potential heat loss from the indoor space to the wall surface.
Mean Air Temperature in Thermal Zone 9 (blue line): The indoor air temperature remains relatively steady, slightly below 20 °C, throughout the day. Despite maintaining a steady indoor air temperature, the heat is being transferred to the cooler wall surfaces, which implies heating energy requirements to compensate for this heat loss.
Outside Surface Temperature (Surface 72) (red line) and Outdoor Air Temperature (yellow line): The outdoor surface temperature closely follows the outdoor air temperature, indicating a strong correlation between the external conditions and the wall’s exterior surface.
Outdoor Air Dry-bulb Temperature (green line): The outdoor air temperature fluctuates significantly throughout the day, showing distinct peaks and troughs. This line demonstrates the dynamic changes in external environmental conditions. The outdoor air temperature directly impacts the outside surface temperature of the wall, highlighting the necessity of insulation to mitigate the influence of these fluctuations on the indoor environment.
The data indicate that in the original configuration without insulation, the inside surface of the common wall remains cooler than the indoor air temperature, leading to large heat loss and a less efficient thermal environment. Adding insulation is expected to mitigate this issue by increasing the thermal resistance of the wall, thereby reducing the temperature difference between the inside surface and the indoor air, ultimately enhancing the building’s energy efficiency.
Figure 10b shows the information recorded after adding 1 cm RT24 HC and 100 mm Celotex TB4000 Insulation Board to the inside surface of the external wall, which enhances the thermal resistance of the building envelope.
In this scenario, the inside surface temperature closely tracks the indoor air temperature, remaining within the range of the PCM’s phase-change temperatures (22–23 °C). This suggests that the PCM is operating within its optimal phase-change range, allowing it to absorb and release heat effectively. As the PCM undergoes phase transitions, it helps regulate the indoor temperature, providing enhanced thermal comfort and reducing the need for additional heating. The PCM’s ability to function within its phase-change range demonstrates its potential to contribute to energy efficiency by storing and releasing heat, particularly when the indoor temperature is maintained at levels that activate the phase-change process.
Figure 11 compares the inside surface temperature variations of four wall configurations over 24 h. The black line represents an uninsulated wall as a baseline. The red line shows a wall with 100 mm Celotex TB4000 insulation, demonstrating significant heat retention. The blue line corresponds to a wall with 1 cm RT24 HC PCMs, which mainly regulates temperature fluctuations. The green line represents a combination of both, offering the best insulation and stability.
Poor performance of the uninsulated wall: The black line shows rapid heat loss, leading to lower indoor temperatures.
Effective insulation with Celotex TB4000: The red line indicates a significant temperature increase, maintaining a steady indoor temperature near 21 °C.
Limited impact of RT24 HC PCM alone: The blue line shows only a slight improvement, as PCM primarily stabilizes rather than increases temperature.
Best results with combined insulation and PCM: The green line demonstrates the highest temperature and reduced fluctuations, optimizing thermal comfort and efficiency.
The chart highlights that combining insulation and PCM provides the most effective solution for minimizing heat loss and enhancing indoor comfort.
3.6. Analysis of the Phase-Change State After PCM Is Added to the Wall
In EnergyPlus simulations involving PCMs, the Conduction Finite Difference (CondFD) method is typically employed to handle the surface heat transfer properties. This method divides the structure into multiple small cells and reports the state and temperature of the PCM in each cell. To analyze the performance of PCMs under different configurations, data from the CondFD Phase-Change State report can be extracted on an hourly basis. The PCM state is determined based on specific numerical ranges: −2 to −1 indicates a liquid state, −1 to 1 represents the phase-transition zone, and 1 to 2 signifies a solid state. By counting the number of times each state occurs during a cold period of one year (From January to April and October to December), the total time spent in each PCM state can be calculated. This provides insights into the distribution of PCM states under various configurations, facilitating a deeper understanding of a PCM’s role in building energy performance.
Figure 12 shows the schematic diagram of PCM state classification in EnergyPlus CondFD reports.
Table 10 shows the hours of PCM in each state when the setpoint is 24 °C.
Table 10 shows the hours of PCM in each state when the setpoint is 24 °C.
Figure 13 shows the percentage of hours that PCMs are in phase-change, liquid, and solid states under different technical solutions. Each column in the chart represents a different PCM application technology, showing the proportion of time the material is in a phase-change state (Phase-change period), liquid (Liquid), and solid (Solid). The stacked bar chart can be used to intuitively compare how different technical solutions affect the distribution of PCM in the three states.
Figure 13 shows the percentage of hours in the phase-change period, liquid, and solid states of PCMs under different technical solutions, with a set temperature of 22 °C. The figure shows that different technical solutions significantly impact the distribution of the PCMs in the three states. For example, pure PCMs (such as 1 cm RT22 HC, 1 cm RT24 HC, 1 cm PureTemp23) spend most of their time in the solid state, indicating that these materials are more stable at lower temperatures and spend less time in the liquid state or phase-change phase. When combined with additional insulation materials (such as RT24 HC + 100 mm C, RT22 HC + 25 mm C), the PCMs’ phase-change period and liquid state times increase significantly, especially in thicker insulation layers. In combination (such as 1 cm RT24 HC + 175 mm C), the time the material is in the phase-change period and liquid state increases. This suggests that adding a layer of insulation can help the phase-change material reach its phase-change temperature more frequently, thereby extending the time it can regulate heat.
An essential factor to consider is that the phase-change temperatures of RT22 HC, PureTemp23, and RT24 HC are different. Therefore, even when additional wall insulation is applied, RT24 HC is less prone to overheating and exceeding its optimal working temperature due to the insulation thickness. In contrast, RT22 HC and PureTemp23, with lower phase-change temperatures, may gradually shift from the solid state to the liquid state and are more likely to experience overheating in thicker-insulation scenarios.
3.7. Cost Analysis
After energy consumption simulation and comparative analysis, it is crucial to conduct an economic feasibility analysis of various technologies. This part primarily focuses on the economic analysis and comparison of various technologies considered in this project. The analysis covers several key aspects: the energy consumption of the retrofitted building, the reduction in energy consumption compared to the base-case building, the annual cost savings resulting from the retrofitting, and the calculation of the payback period for the implemented measures.
3.7.1. PCM
For the case where the PCM was added only on the inside of the exterior wall, 1 cm of RT24HC was selected as the preferred material for this application.
The cost analysis was conducted for 1 cm RT24 HC added to the inside of the external wall.
Table 11 shows the energy reduction and annual cost saving of 1 cm RT24 HC.
The payback period is over 35 years. Due to the minimal reduction in the building’s overall energy consumption, the payback period for this intervention exceeds 35 years, making it financially unsustainable within a reasonable investment horizon.
3.7.2. Combination of Wall Insulation and PCM
After conducting separate simulation analyses for wall insulation and PCM, an energy analysis was also performed on the combined application of both materials. As a result, the combination of 1 cm RT24 HC and 100 mm Celotex TB4000 was selected for implementation. The cost analysis was conducted for 100 mm Celotex TB4000 and 1 cm RT24 HC added to the inside of the external wall.
Table 12 shows the energy reduction and annual cost saving of 1 cm RT24 HC and 100 mm Celotex TB4000 Insulation Board.
Table 13 shows the cash flow of 1 cm RT24 HC and 100 mm Celotex TB4000 Insulation Board.
Figure 14 is a line chart to show the cash flow of 1 cm RT24 HC and 100 mm Celotex TB4000 Insulation Board.
The payback period is 13 years. The data above indicate that by combining PCM and wall insulation, the building’s payback period can be maintained at 13 years. The relatively low cost and high efficiency of the wall insulation effectively offset the higher expense of the PCM material.
4. Discussion
Phase-change materials (PCMs) can significantly improve energy efficiency and promote the development of sustainable buildings in building design. Through their latent heat storage capacity, PCMs can absorb heat when the temperature rises and release it when the temperature drops, helping to maintain a stable indoor temperature, reducing the need for heating and cooling systems, and thus reducing energy consumption. In addition, PCMs can reduce the burden on HVAC systems, especially in poorly insulated buildings, reducing the building’s energy demand and carbon footprint. PCMs can also effectively relieve the load on the grid during peak energy demand, by storing excess heat during the day and releasing it at night, reducing the demand for electricity for air conditioning and heating, thereby achieving a more balanced energy use. The application of PCMs combined with renewable energy systems (such as solar energy) can further promote the sustainable development of buildings by storing thermal energy during periods of high energy production and releasing it when needed. In terms of improving indoor comfort, PCMs can help improve the living or working environment by eliminating temperature fluctuations and providing a stable indoor environment, and reduce the use of HVAC systems, thereby reducing energy costs. Although PCMs have a higher initial investment, the long-term energy savings often make up for these costs, making them a cost-effective energy solution. Ultimately, PCMs can help create zero-energy or low-energy buildings, and their combination with renewable energy systems can achieve more efficient energy use and push buildings towards zero-energy goals. Overall, PCMs play an important role in improving building energy efficiency, reducing environmental impact, and improving living comfort, and are one of the key technologies to promote sustainable building design.
The findings of this study contribute to a deeper understanding of the interaction between PCMs, wall insulation thickness, and indoor temperature settings in optimizing building energy efficiency. Prior research has established the effectiveness of PCMs in enhancing thermal comfort and reducing energy consumption by leveraging latent heat storage capabilities [
33,
34,
35]. However, this study demonstrates that when a PCM is applied directly to the inside surface of a building’s exterior wall without additional insulation, its performance is significantly influenced by outdoor temperature fluctuations. As a result, the indoor HVAC system struggles to maintain the PCM within its phase-change temperature range, limiting its effectiveness. Among the tested PCMs, RT22 HC outperforms PureTemp23 and RT24 HC in such a scenario due to its phase-change temperature aligning closely with the lower inside surface temperatures of the exterior wall.
The introduction of wall insulation significantly alters the thermal dynamics of the building envelope [
36,
37,
38]. Increasing insulation thickness raises the inside surface temperature of the exterior wall, facilitating better utilization of PCM for thermal storage. The results reveal that when the indoor temperature is set at 22 °C, RT22 HC reaches an optimal critical thickness beyond which additional PCM does not yield substantial energy savings. This diminishing-return effect suggests that excessive PCM thickness does not provide proportional improvements in thermal performance. Similarly, RT24 HC remains limited by the HVAC system settings, as its phase-change temperature is not sufficiently exceeded even with increased insulation.
Dardouri, S., Mankai, S., et al. conducted a numerical analysis of the combination of PCM with insulation materials in the building envelope to optimize the energy-saving effect. Their study discusses the role of PCMs in improving thermal performance by reducing heating and cooling needs, with energy savings of up to 76.46% using a PCM in combination with insulation similar to the significant reduction in energy found in this project using PCM RT24HC; in addition, their study also explores different configurations (e.g., double-layer PCM and interaction with the roof air layer) to improve energy efficiency is also an interesting angle to expand in future work [
39].
To further investigate the interplay between indoor temperature, insulation thickness, and PCM efficiency, an additional test was conducted by raising the indoor set temperature to 24 °C. The findings reinforce previous observations, highlighting a more distinct critical threshold. At this temperature, RT22 HC reaches a critical point at 75 mm of insulation thickness, beyond which additional PCM becomes less effective. PureTemp23 reaches a similar threshold at 100 mm, while RT24 HC does not exhibit a critical point within the tested parameters, as the indoor temperature does not significantly exceed its phase-change range. These results indicate that while PCM can be highly effective in reducing energy consumption, excessive thickness may lead to inefficiencies, particularly in well-insulated buildings where thermal storage capacity is already optimized.
When applying phase-change materials (PCMs) in buildings, choosing paraffin as the main material has many advantages. Paraffin is a common organic phase-change material. Its lack of phase separation, stable melting point, low corrosiveness, and good plasticity make it perform well in the field of construction. First, the phase-separation property of paraffin means that during the phase-change process, paraffin can maintain a uniform solid and liquid conversion, avoiding the physical property degradation that may occur in many PCMs after multiple phase changes. Its melting point stability ensures that paraffin can maintain a constant heat storage and release temperature during use, adapting to the temperature fluctuation requirements in the building. Secondly, paraffin has low corrosiveness, reducing the potential damage to building materials or structures, which is of great significance for long-term use and maintenance. Furthermore, the good plasticity of paraffin wax enables it to be easily combined with other building materials, improving the performance and adaptability of the overall system. In contrast, many inorganic materials and composite materials are not suitable as PCMs for construction. Inorganic materials, such as saline solutions or metal alloys, although they have high thermal conductivity, often have the disadvantages of poor thermal cycling stability and easy corrosion. In addition, many inorganic materials may produce phase separation, causing their thermal properties to change over time, affecting the energy efficiency of buildings. Although composite materials have advantages in thermal conductivity, their processing complexity and cost are often high, and they may lack the stability and corrosion resistance of paraffin wax. Therefore, considering the stability, economy, and adaptability of paraffin wax to the building environment, it has become one of the preferred materials for the application of PCMs in current buildings.
Another thing to consider is that the phase-change paraffin wax (such as PCM RT22, PCM RT24, and PureTemp23) used in this project may face some long-term performance and durability issues, although its behavior differs from other types of phase-change material. Over time and with multiple thermal cycles, the phase-change properties of paraffin wax, such as melting and freezing points, may degrade slightly. Temperature fluctuations can lead to leakage or separation of the wax, reducing its effectiveness. Frequent or extreme thermal cycles could cause thermal fatigue, altering phase-change behavior. External environmental factors like humidity, temperature fluctuations, and UV radiation may also negatively affect the paraffin wax and its encapsulation. To prolong the lifespan of paraffin wax, it is important to regularly check the encapsulation, avoid frequent temperature fluctuations, and implement moisture protection measures.
Also, when conducting a cost–benefit analysis, it is important to consider not only the initial costs of wall insulation and phase-change materials (PCMs), but also other potential cost fluctuations. These include installation costs, maintenance costs, energy price volatility, and changes in the payback period. Installation costs typically cover material procurement, labor, and potential additional equipment, influenced by factors like material price fluctuations, labor cost variations, and the complexity of installation. Maintenance costs involve periodic checks, repairs, and updates of the building envelope and PCM systems, including the replacement of encapsulation materials, inspection of heat exchange systems, and repairs due to performance degradation from excessive thermal cycles or extreme conditions. Energy price fluctuations play a crucial role in the payback period, as rising energy costs shorten the payback period, while falling prices lengthen it. Government policies and subsidies can also affect these dynamics. The payback period is a key indicator of economic feasibility, influenced by initial capital investment, energy price changes, and system efficiency degradation over time. To evaluate the project’s overall economic viability, methods like life-cycle cost analysis and sensitivity analysis can be used to account for maintenance cycles, repair costs, and energy price fluctuations. In summary, a comprehensive cost–benefit analysis should incorporate installation, maintenance, energy price variations, and system degradation to accurately predict the project’s economic impact, determine the payback period, and ensure its long-term sustainability.
This study extends prior work by providing a detailed analysis of the interaction between PCMs and insulation thickness, offering valuable insights into optimal design strategies for PCM application in residential buildings in cold climates. Future research could explore dynamic control strategies for PCM activation, investigate alternative PCM formulations with broader phase-change temperature ranges, and assess long-term material stability to further refine energy-efficient building designs. These studies can expand the application of phase-change materials (PCMs) in buildings through multiple directions, particularly by exploring different PCM formulations, integration with renewable energy systems, and incorporation into smart building technologies. Research could focus on optimizing chemical compositions of PCMs, such as organic materials like fatty acids, esters, and alcohols, or inorganic materials like salt solutions and metal alloys, to enhance phase-change temperatures, heat storage capacity, and performance. Improving the microstructure of PCMs with nanomaterials or novel fillers like carbon nanotubes or graphene could also boost thermal conductivity, stability, and durability. Combining PCMs with renewable energy systems such as solar, geothermal, and wind energy can significantly improve building energy efficiency. For instance, a PCM integrated with solar water heating or photovoltaic/thermal systems can store heat during the day and release it at night, while coupling with geothermal systems can provide stable temperature regulation across seasons. Wind energy, although primarily used for electricity, could also benefit from PCMs by storing excess energy for temperature control when wind energy is insufficient. The integration of PCMs with smart building technologies, such as IoT-based temperature control systems, energy management systems (BEMS), and AI-driven adaptive temperature control, can optimize PCM performance in real-time based on internal and external temperature variations, energy needs, and weather forecasts. Additionally, PCMs can be combined with other energy-saving technologies, like high-efficiency insulation materials, smart windows, and intelligent lighting, to further enhance energy use optimization. Research can also focus on the development of environmentally friendly, sustainable PCMs through life-cycle analysis (LCA) to minimize environmental impact. Cost–benefit analyses, considering energy price fluctuations and long-term investment returns, are essential to evaluate PCMs’ economic viability in various climates and regions. Lastly, integrated building energy systems that combine PCM with other technologies like air conditioning, ventilation, and solar heating can optimize both heating and cooling processes, reducing energy consumption and improving comfort. Overall, future research will aim to maximize building energy efficiency, promote sustainable building technologies, and ensure both energy savings and environmental sustainability through lifecycle analysis and impact assessments.


