Article

Multi-Level Gray Evaluation Method for Assessing Health Risks in Indoor Environments

1
School of Energy and Architectural Engineering, Shandong Huayu University of Technology, Dezhou 253000, China
2
School of Environmental Science and Engineering, Tianjin University, Tianjin 300072, China
3
School of Architecture, Tianjin University, Tianjin 300072, China
*
Author to whom correspondence should be addressed.
Buildings 2025, 15(5), 789; https://doi.org/10.3390/buildings15050789
Submission received: 30 December 2024 / Revised: 15 February 2025 / Accepted: 24 February 2025 / Published: 27 February 2025
(This article belongs to the Special Issue Indoor Environmental Quality and Human Wellbeing)

Abstract

Recently, health risk assessment and early warning systems for high-temperature events have become critical concerns. However, current high-temperature warning systems primarily focus on temperature alone, which fails to accurately reflect the actual heat exposure levels and associated health risks. Therefore, this paper proposes an improved AHP (analytic hierarchy process) combined with a multi-level gray evaluation method for assessing human health risks during high-temperature conditions. A comprehensive early warning system is developed, incorporating various indicators, including human status, building conditions, and weather forecasts, making it more holistic than traditional temperature-based warning systems. A case study shows that the highest evaluation score for young individuals is 3.41, while elderly males receive the highest score of 2.5. Furthermore, the highest evaluation score for males is 3.41, while for females the highest score of 3.1. The warning results indicate that for young individuals, no alert is issued; for the elderly, a red alert is triggered; and for middle-aged individuals, the system issues orange and yellow alerts based on varying levels of risk. This study can be used to monitor health risk and provide alert message to humans. Based on the proposed early warning system, people can be able to predict health risk in time.

1. Introduction

1.1. Background

As the effects of global warming intensify, extreme weather events are becoming increasingly frequent. In summer, high-temperature weather is characterized by high frequency, intensity, and prolonged duration [1]. Such conditions can disrupt bodily functions, impair the immune system, and affect the nervous system, potentially leading to hypertension [2,3,4]. Additionally, prolonged exposure to high temperatures has been shown to contribute to cognitive decline [5,6,7,8].
High temperatures not only pose a significant threat to physical health but also disrupt social activities and daily life. In some locations, like security pavilions or remote areas, air conditioning may not be feasible. Additionally, certain individuals with weakened constitutions may not be able to tolerate air-conditioned environments and are forced to endure prolonged exposure to high temperatures, which can negatively impact their health. Therefore, it is crucial to establish a thermal safety evaluation system for individuals in indoor environments.

1.2. Literature Review

1.2.1. Thermal Responses

In high-temperature environments, the human body produces thermal responses which heighten susceptibility to heat-related diseases, such as heatstroke and physical exhaustion. Therefore, it is necessary to thoroughly investigate the impact of high temperature on the human body to alleviate heat-related risks. A lot of experiments have been conducted on thermal responses and the results implied that numerous physiological responses could be observed in high-temperature conditions, which cause human to be more susceptible to heat-related diseases. Anderson [9] and Carlson [10] indicated that high temperatures result in a significant increase in core temperature. And many researchers have already proved that the human physiological parameters, such as skin temperature, heart rate, and blood pressure, also rise significantly due to increases in temperature. Jia et al. [11] conducted a study in which they measured the skin temperature of twenty subjects under four different air temperature conditions. The results showed that the impact of environmental temperature on skin temperature is more significant than that of exercise intensity. Wang et al. [12] conducted an experiment in a climate chamber to test the physiological responses under two types of high temperature environments, and the results show that skin temperature, heart rate, and blood pressure were considerably different in asymmetrical thermal environments. Zhao et al. [13] demonstrated that physiological responses occurred due to an increase in temperature, such as vasodilation and rising skin temperature. Yang et al. [14] carried out an experiment with 16 subjects in deep underground spaces, and it was observed that temperature has a great influence on heart rate variability and skin temperature. In addition, it has been confirmed that mean temperature and oral temperature are related to environment. Wang et al. [15] investigated physiological thermal responses by simulating hot–humid deep mine conditions. The results revealed that mean temperature and oral temperature exhibit an upward trend due to increasing air temperature. Overall, high temperature brings adverse physiological responses to humans, and, consequently, it is important to conduct a health risk evaluation of humans.

1.2.2. Evaluation Methods

In previous studies, the analytic hierarchy process (AHP) is often used to determine the weight of indicators for health risk evaluation. Wei et al. [16] used the AHP to conduct a thermal environment assessment of a deep mine, and results show that temperature, surrounding rock heat release, and dress sensitivity are the main influencing factors of thermal environment evaluation. Zheng et al. [17] used a trapezoidal fuzzy analytic hierarchy process (AHP) method to evaluate work safety in hot and humid environments. Ramavandi et al. [18] introduced a novel risk assessment and prioritization model for workers, which combined a fuzzy AHP and the VIKOR methods. Yazdanirad et al. [19] determined the relative importance of the effective factors in producing thermal strain in men at workplaces using a fuzzy AHP technique. Results showed that the environmental element had the highest relative weight and priority. However, with intense subjectivity and a complex scale system, the results obtained by the AHP lack accuracy.
Health risk evaluation is considered to be a multiple criteria decision making (MCDM) problem [17], and a fuzzy comprehensive evaluation method has been developed for MCDM problems. Zheng et al. [20] used the fuzzy comprehensive evaluation method to evaluate human physiological state in an indoor high-temperature environment, and five physiological parameters (skin temperature, rectal temperature, heart rate, systolic pressure, and sweat rate) were selected as the evaluation indexes. Zhai et al. [21] proposed a method for personnel work efficiencies evaluation based on the fuzzy comprehensive evaluation method to evaluate the work safety of humans in a high-temperature thermal-radiation environment. The study indicated that the ergonomic status score decreased significantly with the increase in radiation temperature. When the radiation temperature is 300 °C, the work should be stopped immediately to ensure the safety and health of personnel. Central to this method is the determination of membership, however, there is a lack of unified standards for determining membership, leading to inaccurate evaluation results. As an evaluation tool, a multi-level gray evaluation method can effectively handle uncertain information, and the evaluation results obtained by this method are more accurate than the comprehensive evaluation method. At present, the multi-level gray evaluation method has been used in MCDM problems [22,23]. However, limited studies have applied this method to human health risk assessment.

1.2.3. Early Warning System

To guarantee human safety, an early warning system in high-temperature environments is essential. Currently, the warning system widely used in China is the high-temperature warning system. It can monitor temperature conditions in real time and provide an alert message to humans.
The high-temperature warning system in summer is divided into three levels, the first is a yellow alert, with the highest temperature above 35 °C; the second is an orange alert, when the highest temperature will rise above 37 °C; the last is a red alert, when the maximum will rise above 40 °C. It can be concluded that the existing early warning system only considers temperature.

1.3. Research Gaps

From the literature review, several research gaps can be identified in human comprehensive evaluation, which are as follows:
(1)
Most evaluation methods rely on the AHP and the fuzzy comprehensive evaluation method. In the AHP method, due to subjectivity and a complex scale system, the results are not accurate enough and repeated calculations are required when the results do not meet the requirements of the consistency test. For the fuzzy comprehensive evaluation method, the use of an inappropriate membership function may lead to large deviations in the evaluation results.
(2)
The current high-temperature warning system primarily focuses on temperature alone, which fails to accurately reflect the actual heat exposure levels and associated health risks.

1.4. Research Contributions

To fill these research gaps, this study makes the following contributions:
(1)
Improves the traditional AHP method by simplifying the scale system. The improved AHP only considers a three item scale instead of the original nine item scale. This method decreases the impact of subjectivity and constantly meets the consistency requirements. In addition, a multi-level gray evaluation method is adopted to address disparities and uncertainties in the evaluation process, integrating both quantitative and qualitative indicators into the comprehensive gray evaluation framework.
(2)
An indoor human health risk early warning system for high-temperature weather has been developed, incorporating various indicators, including human status, building conditions, and weather forecasts. Unlike existing early warning systems, the proposed system specifically focuses on indoor human health, allowing individuals to accurately assess their health risk levels and take preventive measures against heatstroke in high-temperature conditions.
The rest of this paper is organized as follows: Section 2 describes the calculation processes of the improved AHP and the gray evaluation method. Section 3 describes the establishment of the steps of the health risk evaluation and early warning system. Section 4 describes specific implementation cases of the health risk evaluation through case studies. Section 5 presents the results and discusses the analysis of the case studies. Section 6 provides the conclusion.

2. Methodology

2.1. Improved AHP

The AHP (analytic hierarchy process) proposed by Saaty in 1977 is an efficient method for handling MCDM problems in various studies of diverse fields [24]. It is used in multi-objective decision making to calculate the weights of related indicators. The AHP combines qualitative and quantitative analysis based on evaluation indicators for objects. Central for the AHP is constructing a comparison matrix, which systematically compare criteria against one another to determine priorities [25,26,27].
However, in the process of comparison matrix structure, due to the decision-makers’ subjective judgment, the matrix does not always meet the requirement of the consistency test. And it is necessary to reconstruct the judgment matrix and check the consistency again. To solve the above problem, an improved AHP is used for determining weight of all indicators in this study. Compared with the AHP, the improved AHP strengths are as follows:
(1)
Instead of the previous nine item scale, a three item scale is used to determine the importance of two indicators, which simplifies the process of constructing the matrix.
(2)
It is unnecessary to check the consistency of the matrix, avoiding complicated calculation.
The calculation processes are as follows:
(1)
Construct a comparison matrix:
A = (aij)n×n
where aij is the element of the comparison matrix. When the ith index is more important than the jth index, aij = 1; when the ith index is equal to the jth index, aij = 0; and when the ith index is less important than the jth index, aij = −1.
(2)
Determine the optimal transfer matrix: B = (bij)n×n
b i j = 1 n k = 1 n a i k a j k = 1 n k = 1 n a i k + a k j
where bij is the element of the transfer matrix and n is the number of the indexes.
(3)
Determine the optimal quasi-optimal uniform matrix: A* = (aij*)n×n
aij* = 10bij
where aij* is the element of A*.
As A* satisfies the consistency requirement, there is no need to check the consistency.
(4)
Calculate the weight:
W = W 1 , W 2 , , W n T
W i = j = 1 n a i , i = 1 , 2 , , n n
where W i represents the relative weight of the ith indicator, i = 1, 2, …, n.
(5)
After normalization, W can be obtained as W = (W1, W2, …, Wn), and
W i = W i = 1 n W i
where Wi represents the weight of the ith indicator, i = 1, 2, …, n.

2.2. Multi-Level Gray Evaluation Method

The gray system theory aims to solve the uncertainty introduced by the incomplete information. In the gray system theory, the completely known information is considered as “white”, the unknown information is considered as “black” and the partially known and partially unknown information is considered as “gray”. In the multi-level gray comprehensive evaluation, the gray system theory is used, such as correlation analysis, gray statistics, and gray clustering.
Assuming that the evaluation system is divided into three levels, V represents the comprehensive evaluation value, U represents the set of the primary indicator u, denoted as U = u 1 , u 2 , u m where ui represents the set of secondary indicators, which are recorded as u i = u i 1 , u i 2 , u i n . The calculation processes of the gray evaluation are as follows:
(1)
Develop a rating scale for the evaluation indicators to evaluate the qualitative indicators.
(2)
Calculate the weight of each indicator.
(3)
Organize a group of experts to score and establish a sample evaluation matrix. Assume the kth expert’s score is dijk, then the matrix can be obtained as D.
(4)
Determine the evaluation of the gray class and gray evaluation coefficients. Determining the evaluation of the gray class is to determine the grade of the gray class, the gray number of the gray class, and the whitening weight function. Assuming that the evaluation of gray class number is e (e = 1, 2, …, g), a certain whitening weight function to describe the gray class can be selected. For uij, its gray evaluation coefficient belonging to eth class is as follows:
x i j e = k = 1 p f e d i j k
where xije is the gray evaluation coefficient which belongs to the eth gray class, p represents the total number of experts, and fe(dijk) represents the corresponding whitening weight function.
The total gray evaluation coefficients which belong to each gray evaluation class can be obtained as follows:
x i j = e = 1 g x i j e
where xij represents the total gray coefficient of each gray evaluation class.
(5)
Calculate the gray evaluation weight vector and weight matrix. The weight vector for the u i j belonging to the eth gray class is as follows:
r i j e = x i j e x i j
where rije represents the weight vector belonging to the eth gray class.
And r i j = r i j 1 , r i j 2 , , r i j g can be obtained. Based on rij, the gray evaluation weight matrix is obtained as follows:
R i = r i 1 r i 2 r i j = r i 11 r i 12 r i 1 g r i 21 r i 22 r i 2 g r i j 1 r i j 2 r i j g
where Ri represents the gray evaluation weight matrix of ui.
(6)
Evaluate ui and U. The comprehensive evaluation ui is as follows:
Bi = Wi·Ri = {bi1, bi2, … big}
where Bi represents the comprehensive evaluation results of ui and Wi represents the weight of each secondary indicator.
Based on Bi, the gray evaluation matrix R can be obtained as follows:
R = B 1 B 2 B m = b 11 b 12 b 1 g b 21 b 22 b 2 g b m 1 b m 2 b m g
Furthermore, the comprehensive evaluation results of U can be gained, which are as follows:
B = W·R = {b1, b2, …, bg}
where B is the comprehensive evaluation result of U and W is the weight of ui.
As B is a vector, it should be singularized for practical application. A certain value can be assigned for each gray class and then each gray class equivalent vector can be obtained. Thus, the comprehensive evaluation value can be obtained as:
V = B·CT
where V represents the comprehensive evaluation value of U and CT is the corresponding score of each gray class.

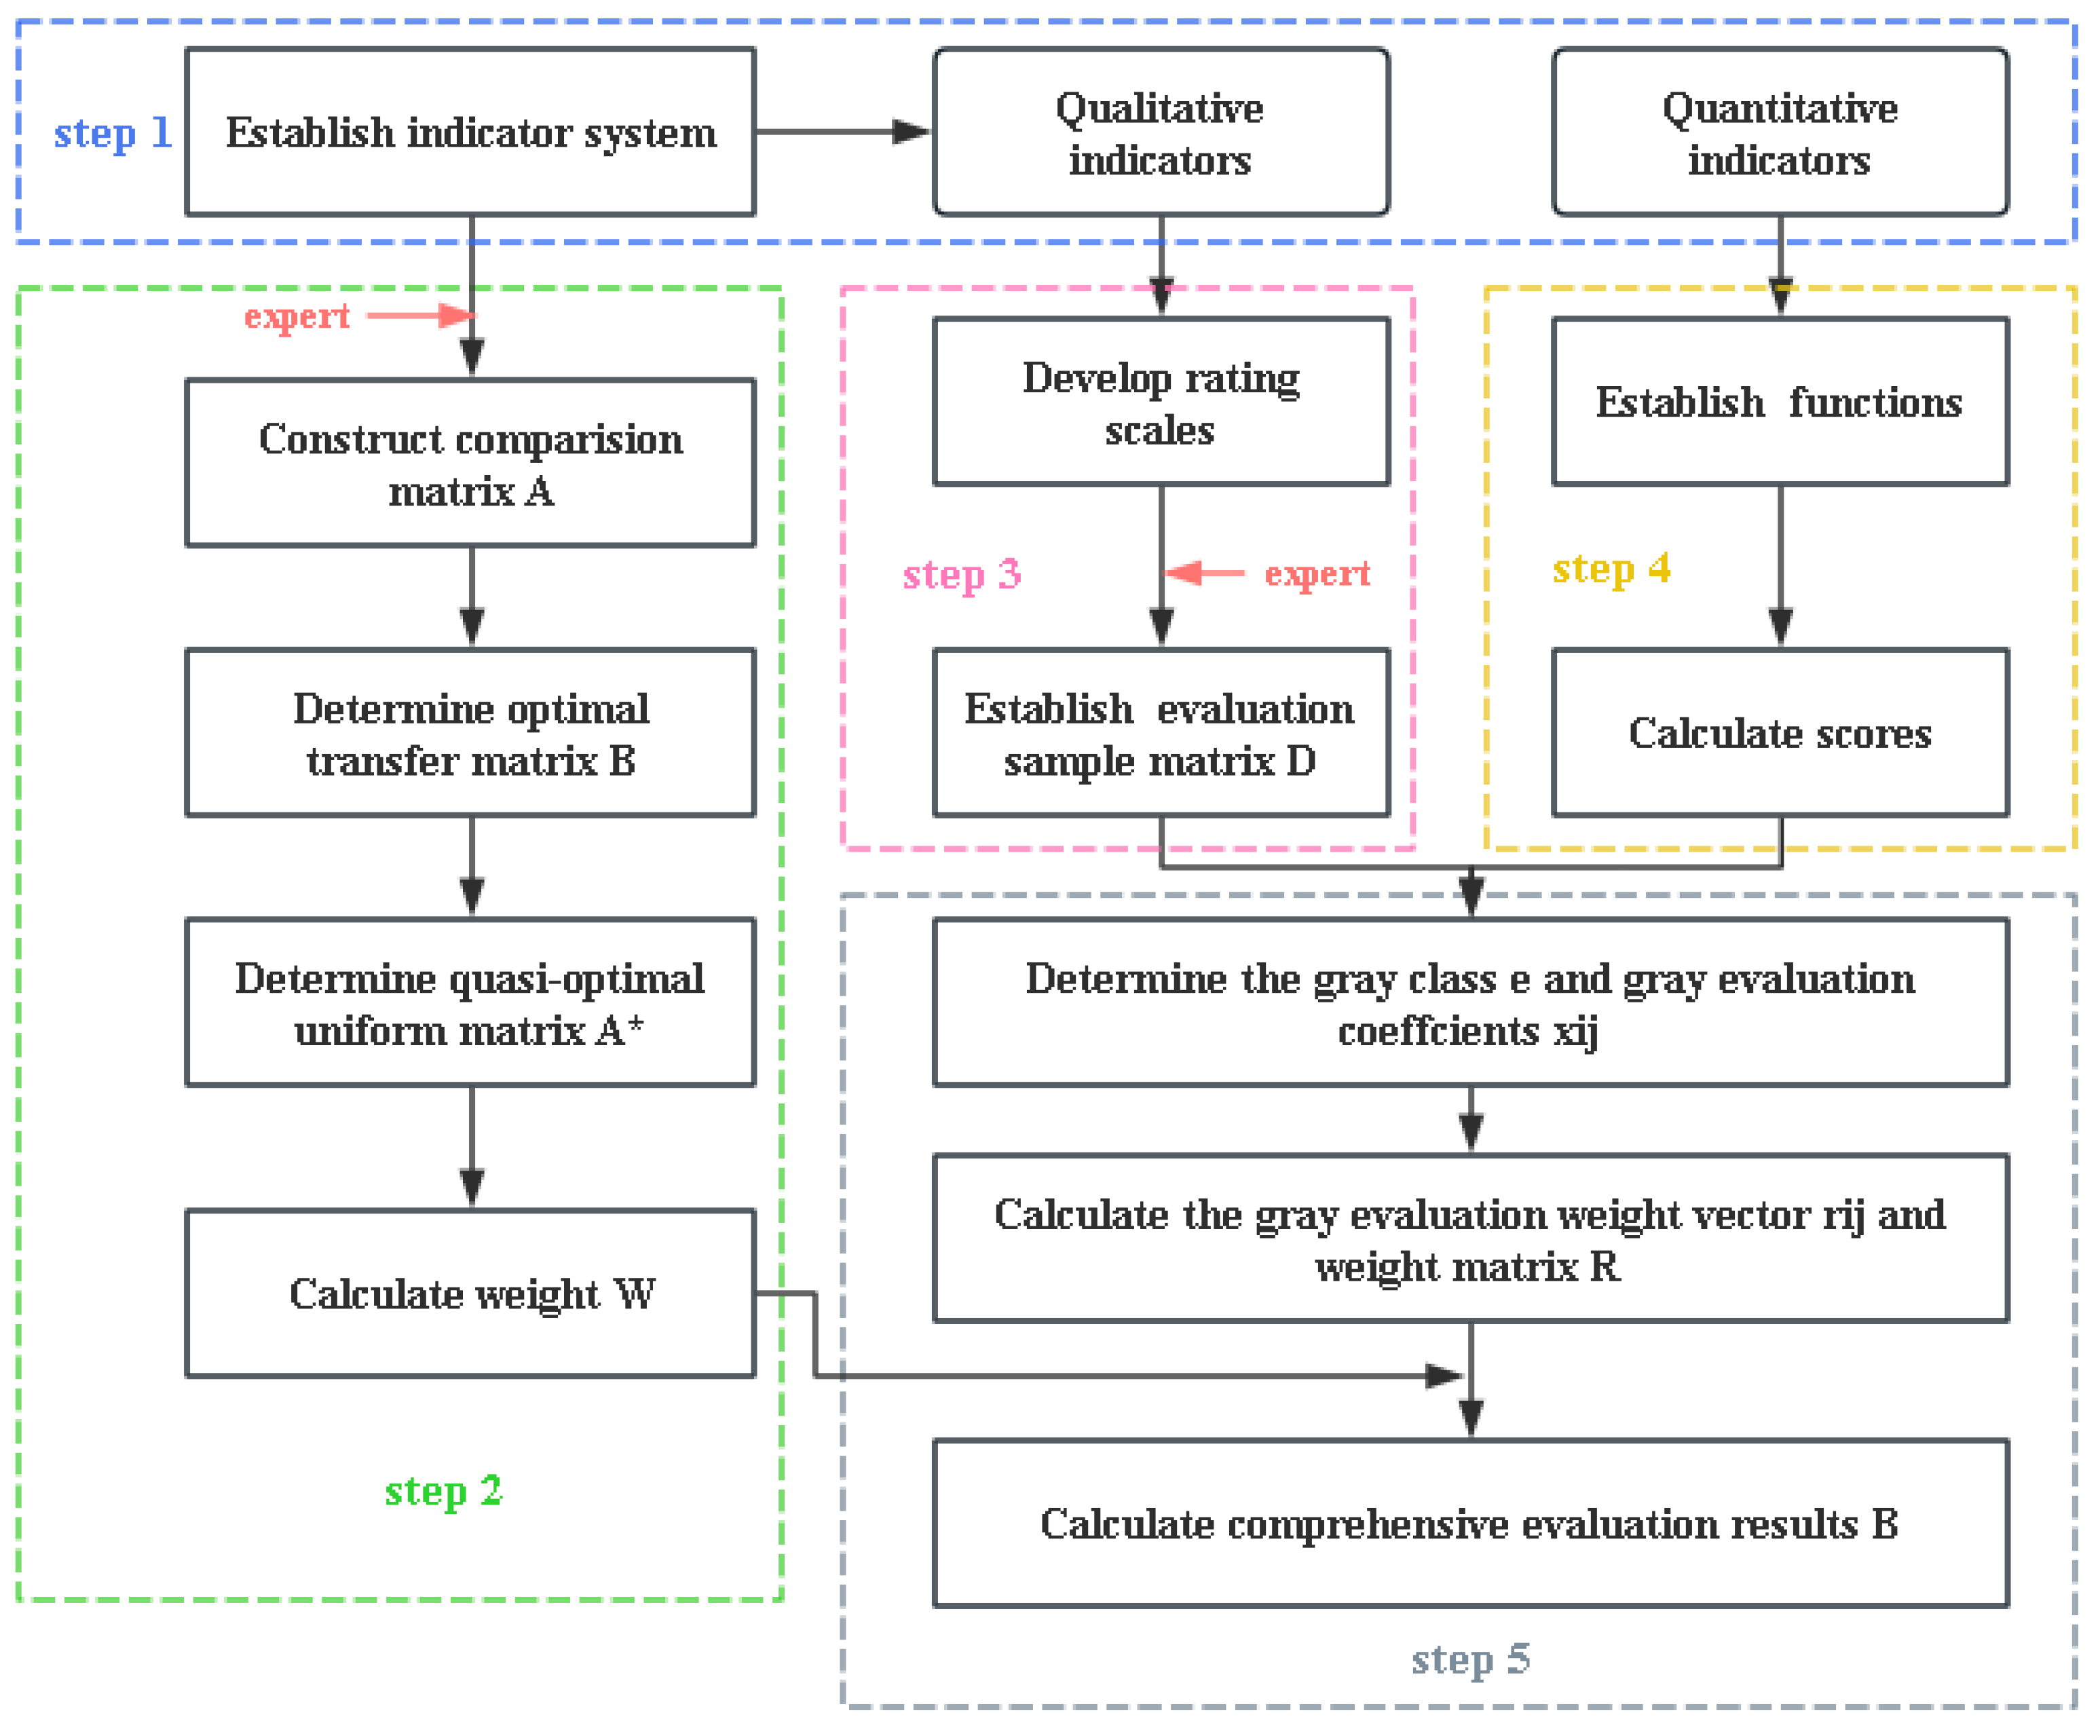
2.3. Flow Chart of Methods

The flowchart of the improved AHP method and multi-level gray evaluation method, which Figure 1 outlines, comprises the following key steps:
(1)
Step 1: establish an evaluation index system and divide the indicators into qualitative and quantitative indicators.
(2)
Step 2: use the AHP method to calculate the weight of all indicators.
(3)
Step 3: develop a rating scale for qualitative indicators and invite experts to give a corresponding score.
(4)
Step 4: establish functions between scores and quantitative indicators, then calculate the score according to specific values of the quantitative indicators and established equations.
(5)
Step 5: combine the weights calculated by the improved AHP with the multi-level gray evaluation method to receive the comprehensive evaluation results.

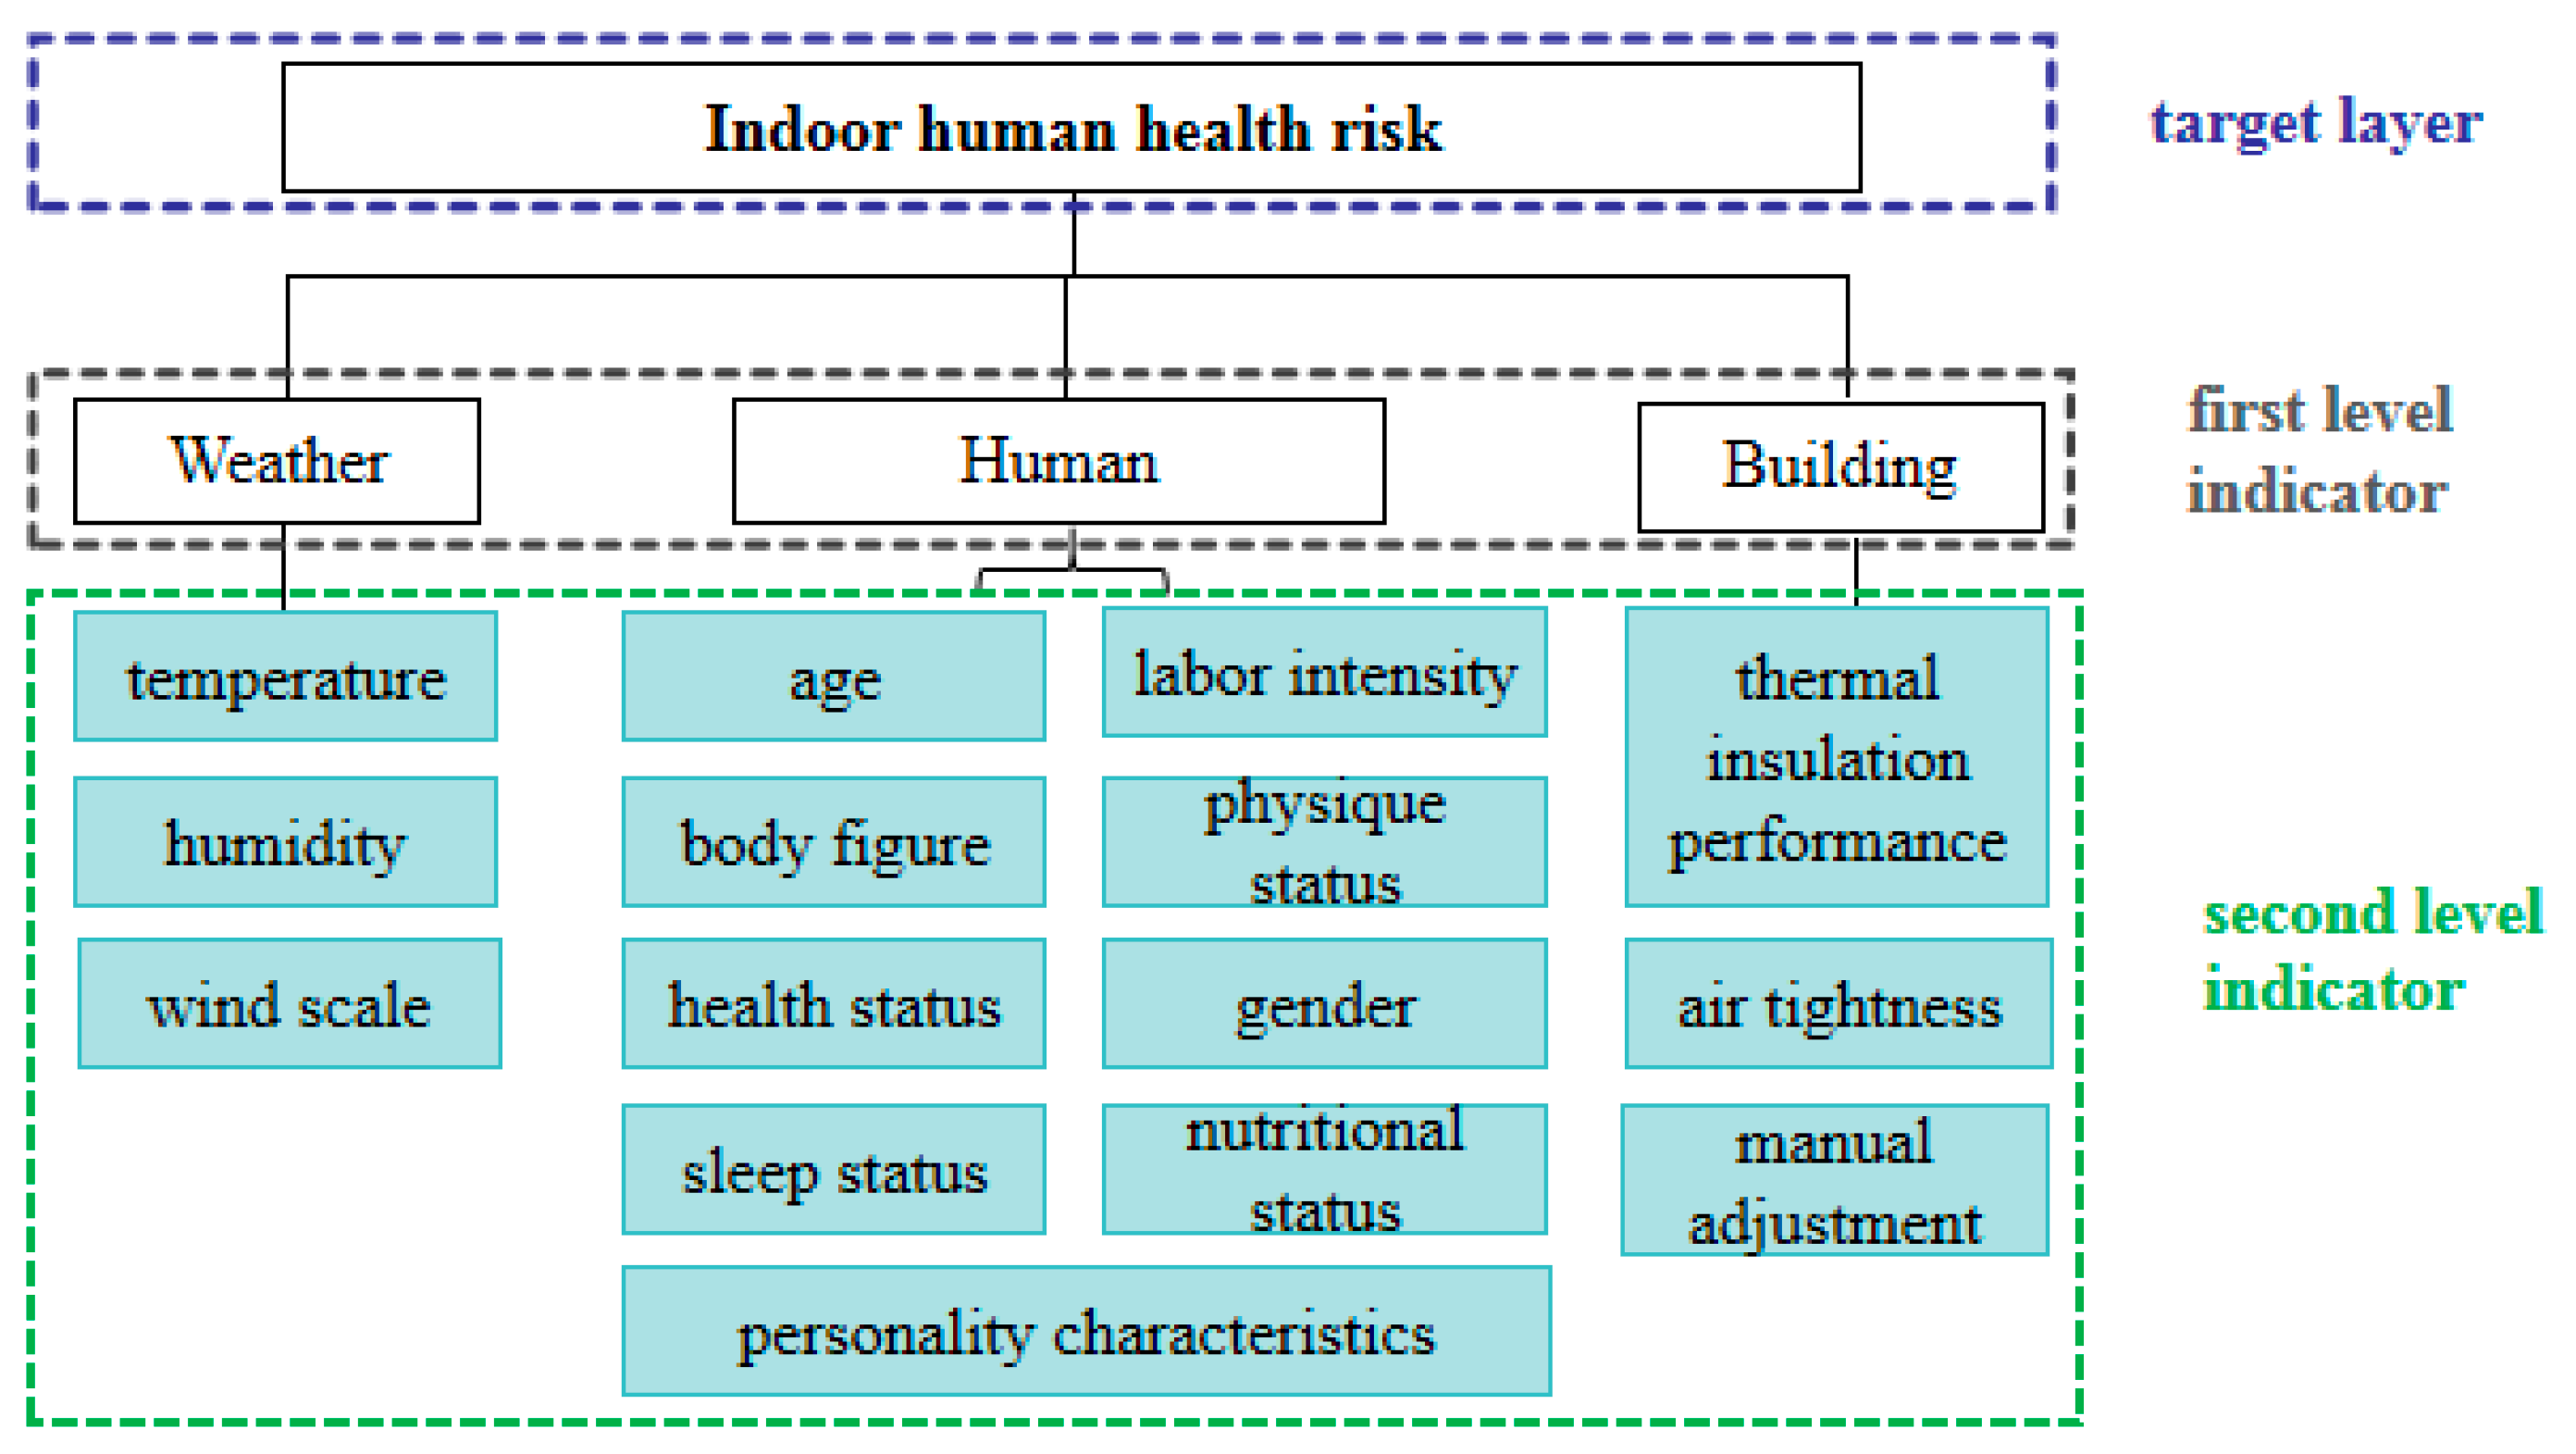
3. Establishment of the Health Risk Evaluation and Early Warning System

3.1. Establishment of Indicator System

In high-temperature weather, indoor human health is affected by many indicators. Gao et al. [28] indicated that the factors causing summer heatstroke are related to temperature, humidity, radiation, labor intensity, exposure time, physical strength, nutrition status, sleep status, and health status. Therefore, the labor intensity, physique status, nutritional status, sleep status, and health status are first selected as indicators. Gao [29] studied the effects of individual differences on physiological responses in a high temperature and humid environment. The results concluded that the individual differences, such as age, gender, and body figure, can directly or indirectly affect physiological responses in a high-temperature environment. For example, the elderly’s ability for thermoregulation is decreased and their threshold for perspiration is relatively high, which makes them more vulnerable to heat-related illnesses. Zhou et al. [30] found that the risk of death in the elderly increased by 1.466% as the maximum temperature increased by 1 °C. Iniguez et al. [31] indicated that heat waves have a more direct impact on children, especially for acute health hazards. Therefore, gender, age, and body figure are also selected as indicators. To classify the indicators, for age, referring to the classification of the World Health Organization, age is classified into four groups: juvenile (1 ≤ age < 18), youth (18 ≤ age < 44), middle-ager (44 ≤ age < 59), and elderly (age ≥ 59). For body figure, it is divided into thin, moderate, obese, and fat.
Gong [32] indicated that personality characteristics can affect human thermal sensation, and he classified personality characteristics into four types: multi-blood, depressive, mucous, and choleric temperament. Therefore, personality is also selected as an indicator. Multi-blood indicates that people are enthusiastic and lively; they are easier to adapt to new things than others, however, they have poor patience. Depressive indicates that people are quiet, reliable, and easygoing, in addition, they are willing to overcome difficulties, but they are also sensitive. Mucous indicates that people have a quiet personality and good tolerance, they work hard, and are serious, but they are not flexible enough and their attention is not easily transferred. Choleric temperament indicates that people are easily excited, straightforward, temperamental, and energetic; when they are excited, they feel that everything can be completed, but when they are exhausted, their emotion will fall very low.
In addition, the weather parameters (temperature, humidity, and wind speed), the air tightness of the building, and the thermal insulation performance of the envelopes are important indicators that affect the indoor thermal environment [33,34,35]. Therefore, both of them have an impact on indoor human health.
Based on above analysis, an indoor human health evaluation index system in high-temperature weather is established. The evaluation system is divided into three layers: the first is the target layer, that is, indoor human health risk in high-temperature weather; the second are three first level indicators (human indicator, weather indicator, and building indicator); the third are second level indicators (15 sub-factors), as Figure 2 shows.
The second level indicators can be divided into: qualitative indicators and quantitative indicators. The qualitative indicators include gender, age (age segmentation), body figure, personality characteristics, health status, labor intensity, physique status, nutritional status, sleep status, thermal insulation performance, air tightness, and manual adjustment. While the quantitative indicators include temperature, humidity, and wind scale.

3.2. Determination of Indicator Weight

The improved AHP method is adopted to determine the weight of the indicators. Firstly, the expert group is asked to give pair-wise comparisons of the relative importance of the indexes according to Equation (1). Then, the matrix B and A* can be obtained based on Equations (2) and (3). Thus, the weight of each index can be calculated according to Equations (4)–(6). Table 1, Table 2, Table 3 and Table 4 show the pair-wise comparison matrixes and the weight of the indicators.

3.3. Comprehensive Evaluation of Indoor Human Health Risk

To evaluate the sub-factors, for the qualitative indicators, except for gender, all of the sub-factors can be divided into four groups and they can be evaluated by the gray evaluation method. For the quantitative indicators, a function between the values of the parameters and the evaluation scores is established and then they can be evaluated by the gray evaluation method based on the evaluation scores.
The health risk level of indoor humans in high-temperature weather is divided into four grades: excellent, good, medium, and poor, and their corresponding number is e = 1, 2, 3, 4, while their corresponding evaluation score is 4, 3, 2, 1. Then, four gray class levels are set. Table 5 shows the corresponding gray number and whitening weight function.
(1)
Qualitative indicators
The multi-level gray evaluation method is widely used to evaluate qualitative indicators. Most of the qualitative indicators given in Table 1 are divided into four gray classes: excellent, good, medium, and poor, and their corresponding evaluation score is 4, 3, 2, 1, respectively. The classification of different indicators is detailed in Appendix A.
For gender, it can only be divided into two groups: man and woman. And the scores are assigned separately. Studies have shown that there is a significant difference in physiological heat stress between men and women under heat exposure. Kenney et al. [36] found that women’s oxygen consumption is smaller than men, and that women have a greater physiological response than men. Thus, man is given 3 points, which belongs to the second gray class, while woman is given 2 points, which belongs to the third gray class.
To sum up, for the qualitative indicators, corresponding evaluation scores are directly given by the experts based on the health risk grade and its corresponding score.
(2)
Quantitative indicators
In the health risk evaluation index system, temperature, relative humidity, and wind scale are quantitative indicators. Gu et al. [37] indicates that there is a positive correlation between temperature and heat-related diseases, thus the maximum temperature of a day is selected for health risk evaluation in the study. Considering the temperature distribution in summer, a temperature range between 18 and 42 °C is selected. The wind scale is divided into 18 levels, but the wind scales of level 7 and above rarely appear in urban areas. Therefore, wind scales of levels 0~6 are only considered.
To determine the evaluation results of the quantitative indicators, the functions between the initial values and the evaluation scores are established, respectively. And the maximum score and minimum score are set similarly to those of the qualitative indicators. The functions between the quantitative indicators and the evaluation scores are established as follows:
St = (50 − t)/8
Sh = (400 − 3h)/100
Sw = (2 + w)/2
where St, Sh, and Sw are the evaluation score of temperature, relative humidity, and wind scale, respectively; t is the temperature, °C; h is the relatively humidity, %; w is the wind scale.
(3)
Evaluation Process
Firstly, each expert is asked to fill in the questionnaire in Appendix A for the qualitative indicators. Then, the gray class coefficients are calculated according to the whitening weight functions in Table 5 using the evaluation scores offered by the experts, thus the gray evaluation vectors for the qualitative indicators can be obtained using Equations (7)–(9).
Secondly, the evaluation scores of the quantitative indicators are calculated according to Equations (15)–(17) based on the initial values of the weather forecast. According to the whitening weight functions in Table 6, the gray evaluation vectors of the quantitative indicators can be obtained.
Finally, the total gray evaluation matrix can be obtained by combining the gray evaluation vectors of the qualitative indicators and quantitative indicators. Then, the comprehensive evaluation value can be obtained using Equations (11)–(13).

3.4. Early Warning System

Based on the comprehensive evaluation value, Table 6 shows the early warning system for indoor human health risk which has been established. After calculation, it was found that the maximum and minimum score of the comprehensive evaluation value is 3.56 and 1.93, respectively, thus, the early warning system is established between 1.93 and 3.56.
According to the early warning system, the health risk of the indoor personnel in high-temperature weather can be predicted. If an early warning appears, some appropriate measures can be adopted to avoid the potential harm.

4. Case Study

4.1. Subjects

The sample size of the subjects is considered as follows: (1) In related studies, the sample sizes of the subjects range from 5 to 20 [3,38]. Thus, in this study, the sample size of the subjects can meet the requirements. (2) The sample size was tested by G*Power 3.1.0. In this study, F test with ANOVA (repeated measures, with factors) is used for sample size estimating. Referred to [39], input parameters are set as follows: the effect size is 0.25, the power is 0.9, and the alpha is 0.05. Finally, the total sample size calculated by software is eight.
Furthermore, to reflect the differences in research subjects and living environments, eight subjects (A~H) in Baoding with different characteristics were selected. Among them, A~D come from community 1, while E~H live in community 2. Table 7 shows their personal information.
From Table 7, the following can be summarized:
(1)
Four males and four females were selected;
(2)
Two youth individuals, two elderly individuals, and four middle-aged individuals were selected.

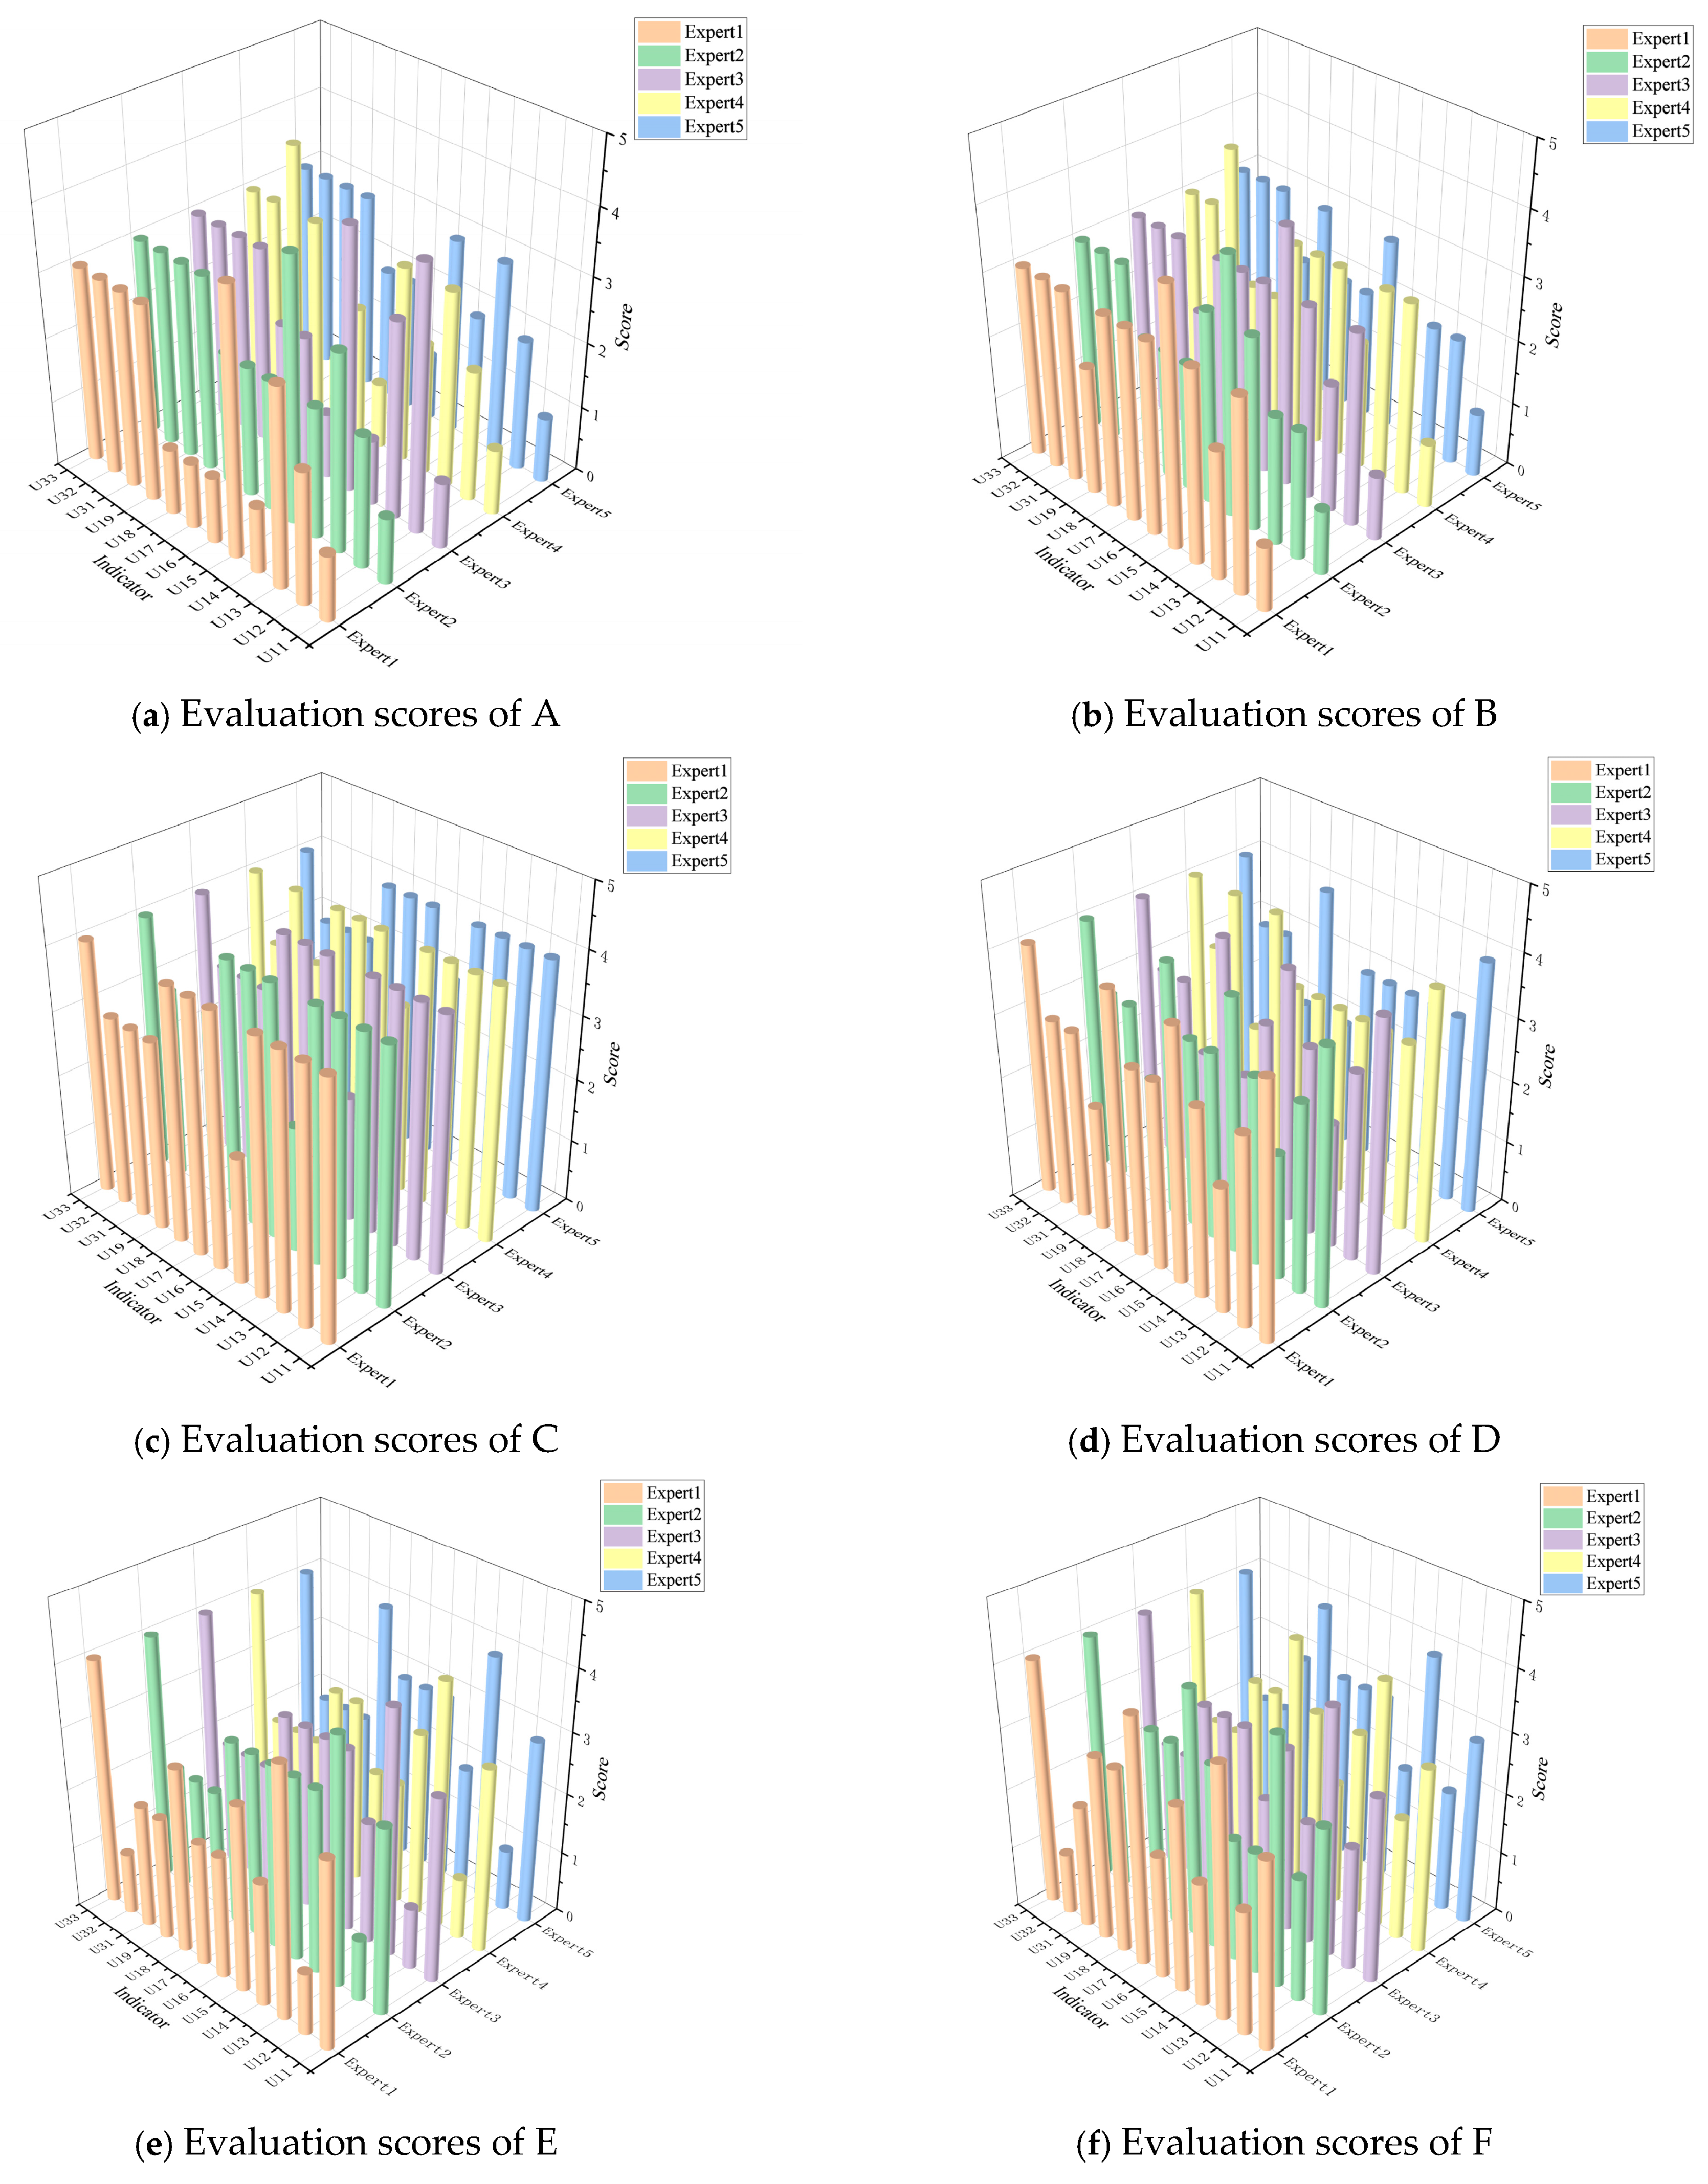
4.2. Evaluation for Qualitative Indicators

To evaluate qualitative indicators, an expert group consisting of five experts (two teachers and three researchers) was asked to fill in the questionnaire. Figure 3 shows the evaluation scores of all subjects.
Figure 3 shows that the evaluation scores of young individuals CD are the highest in eight subjects, with the elderly individuals AB have the lowest, and for EF and GH the evaluation scores are similar. Moreover, for young individuals and middle-aged individuals, an air conditioner is often used to lower the temperature in summer; however, for elderly individuals, they only rely on natural ventilation.

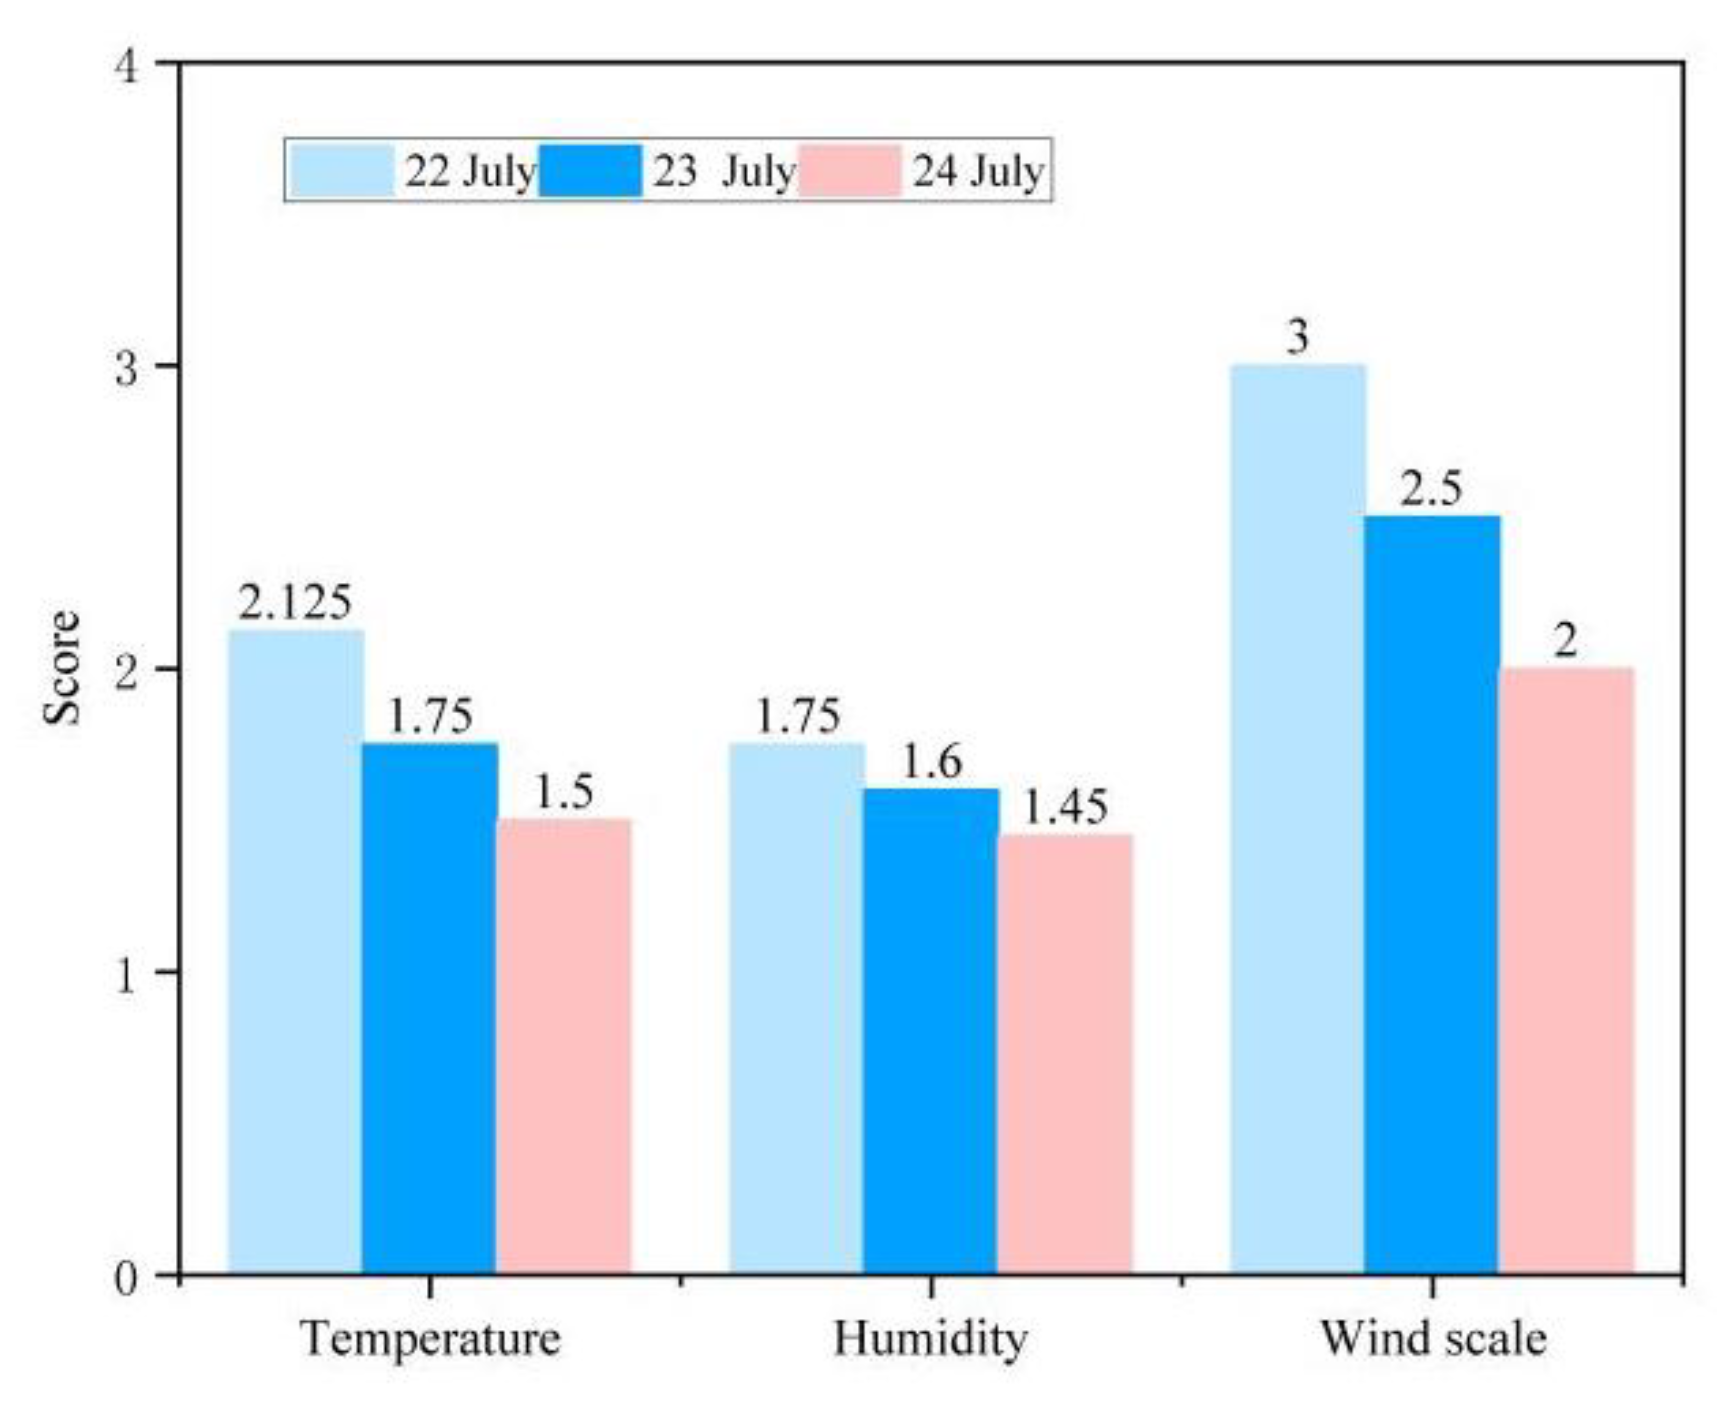
4.3. Evaluation for Quantitative Indicators

The weather forecasts from 22 July to 24 July were selected to conduct the health risk evaluation and give warning alerts. Table 8 shows the temperature, humidity, and wind scale in the weather forecasts from 22 July to 24 July.
According to Table 8 and Equations (15)–(17), the evaluation scores of all quantitative indicators can be obtained. Figure 4 shows the results.
The results in Figure 4 show that the evaluation scores for temperature on 22 July is the highest at 2.215, with the lowest on 24 July at 1.5; the evaluation scores for humidity on 22 July is the highest at 1.75, with the lowest on 24 July at 1.45; the evaluation scores for the wind scale on 22 July is the highest at 3, with the lowest on 24 July at 2.

5. Results and Discussion

5.1. Evaluation Results
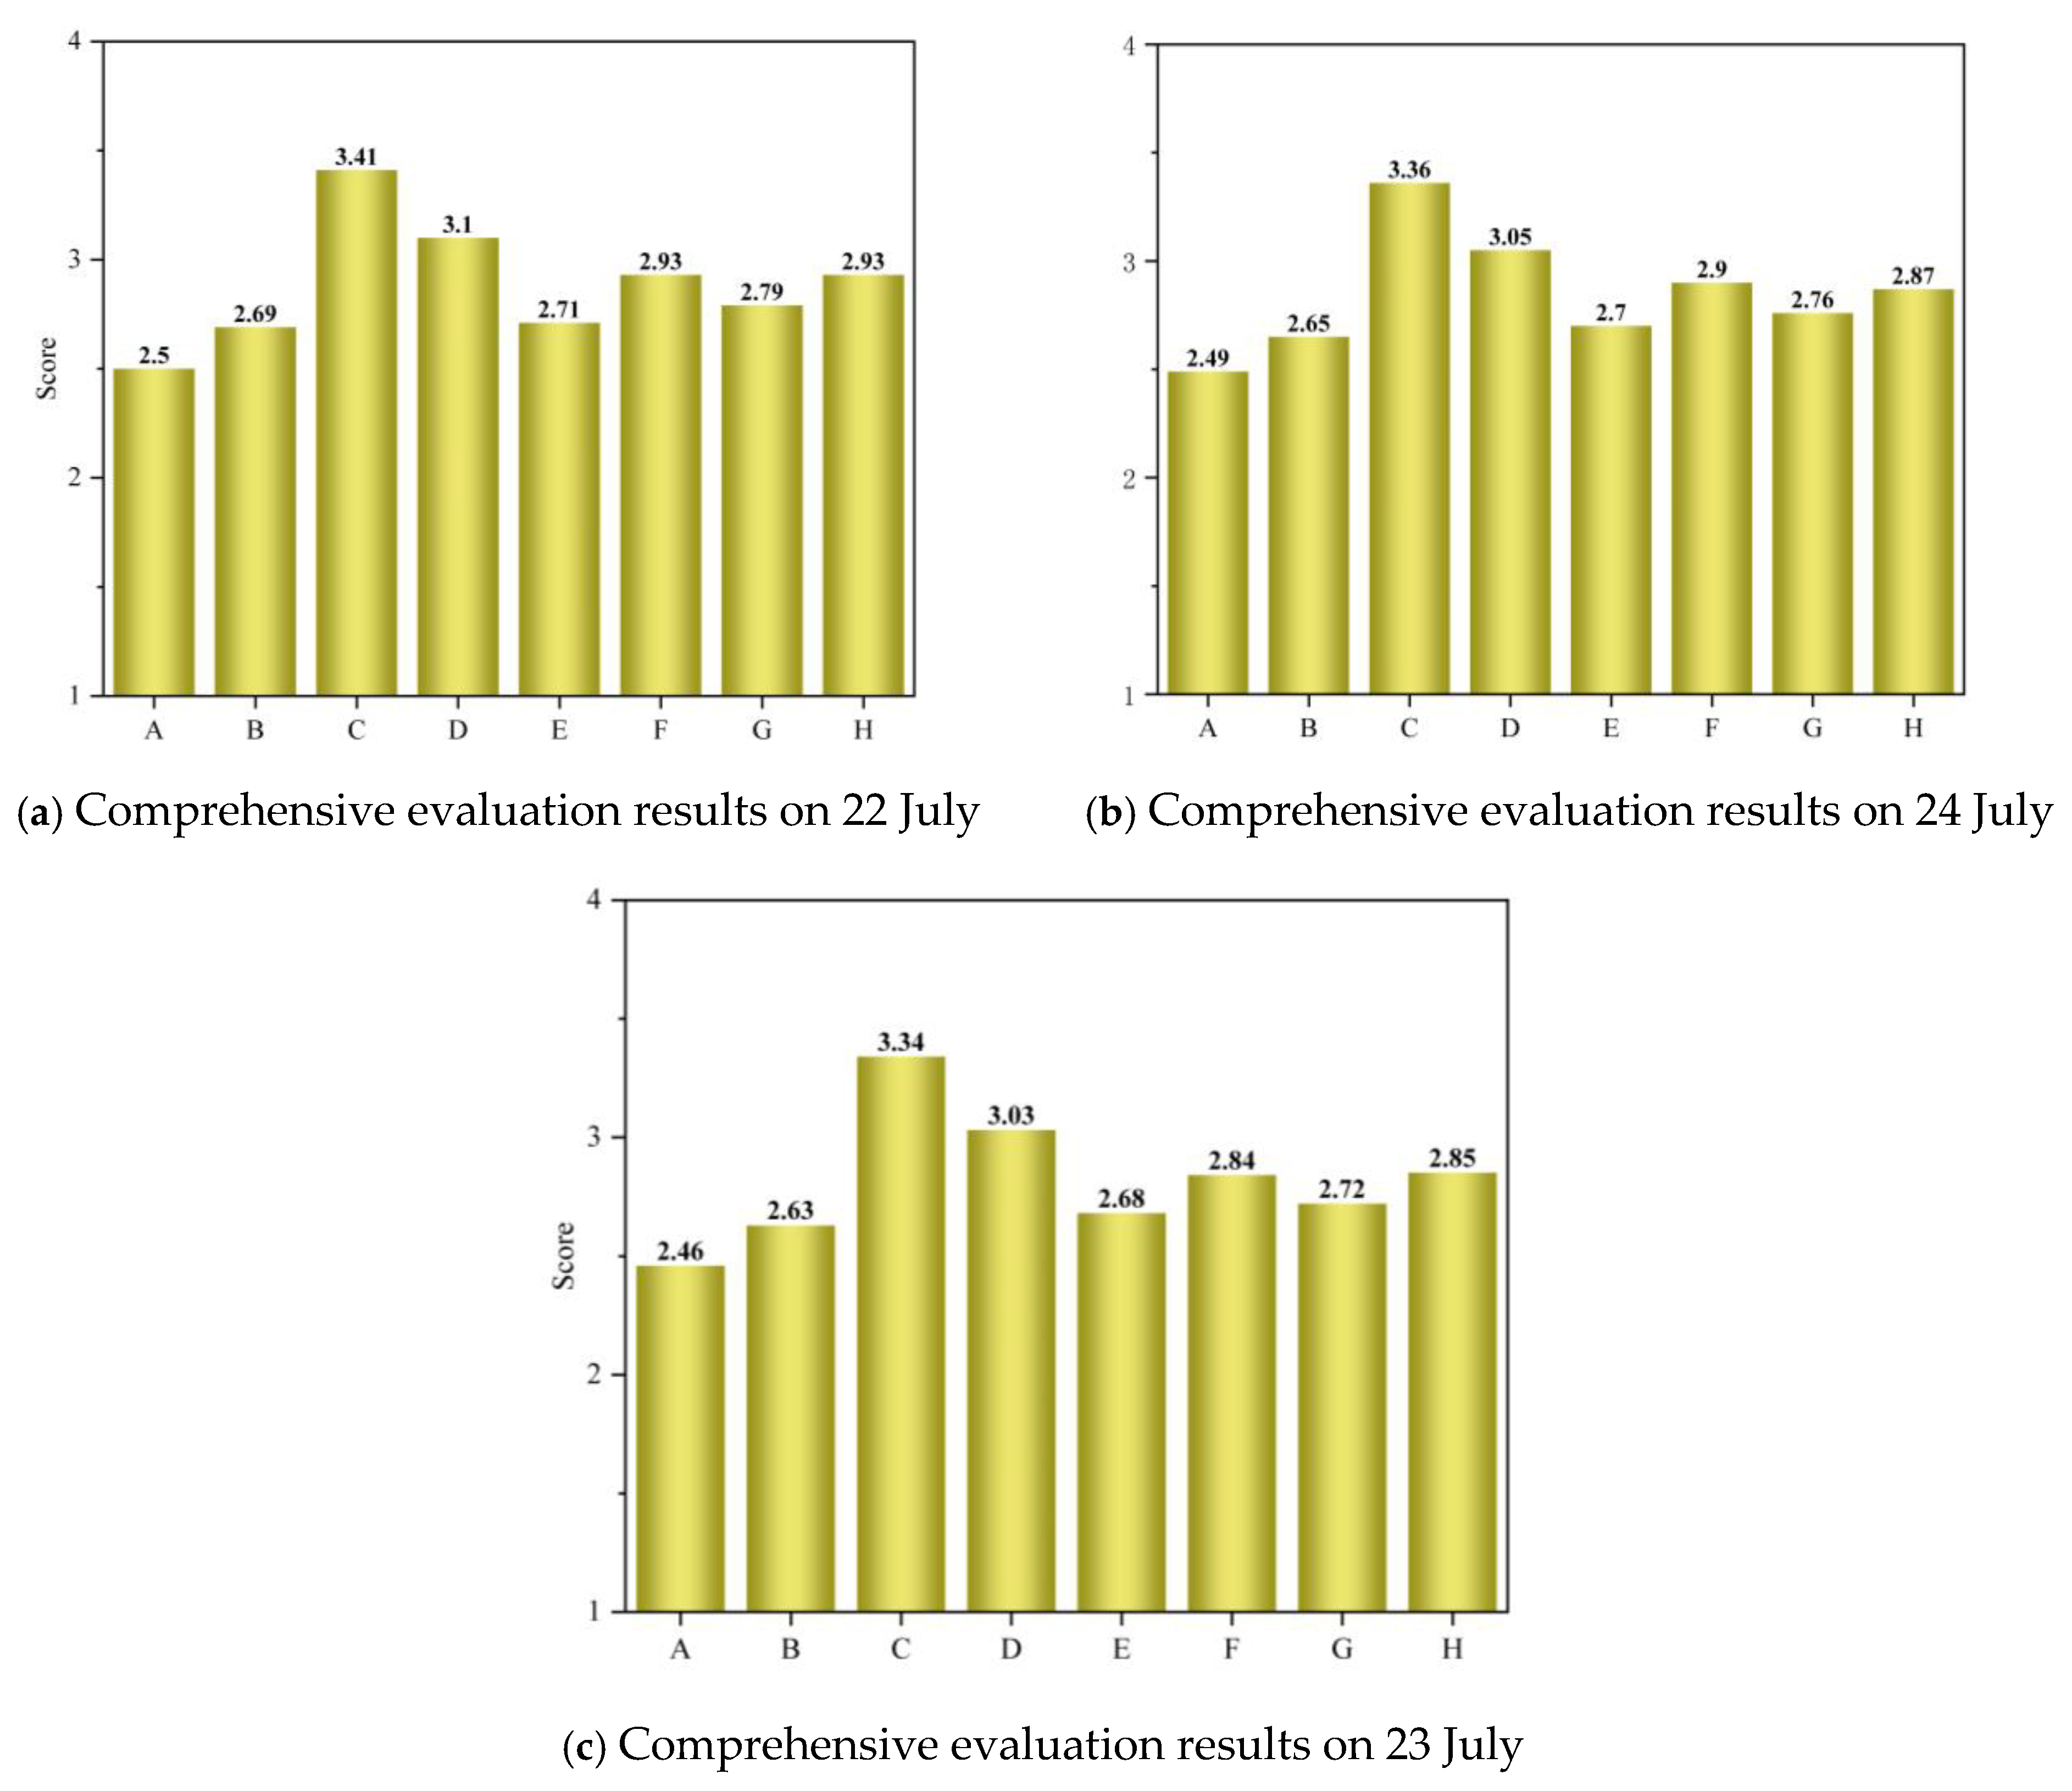
Combining the gray evaluation weight vectors of the qualitative sub-factors and quantitative sub-factors, the gray evaluation weight matrix Ri can be obtained. Based on the gray evaluation weight matrix and the weights of the sub-factors shown in Table 2, Table 3 and Table 4, the gray evaluation weight vectors can be obtained according to Equation (11). Then, the comprehensive evaluation results can be obtained using Equation (13). Figure 5 shows the comprehensive evaluation results of all the subjects.
As Figure 5 shows, the comprehensive evaluation scores of all the subjects are different. Furthermore, the following conclusions can be drawn:
(1)
The scores of the subjects will decrease as the outdoor environment deteriorates. Consequently, all subjects receive their highest scores on 22 July.
(2)
Among all subjects, the evaluation scores for young individuals are the highest, followed by middle-aged individuals, while elderly individuals receive the lowest. The maximum score for young individuals is 3.41, whereas the highest score for middle-aged individuals is 2.93. For elderly individuals, only 2.5 points are scored. It confirms that the elderly individuals are more susceptible to high temperatures.
(3)
The scores of males are commonly higher than those of females. The highest evaluation score for males is 3.41, while for females the highest score is 3.1, proving that females are more susceptible to high temperatures.

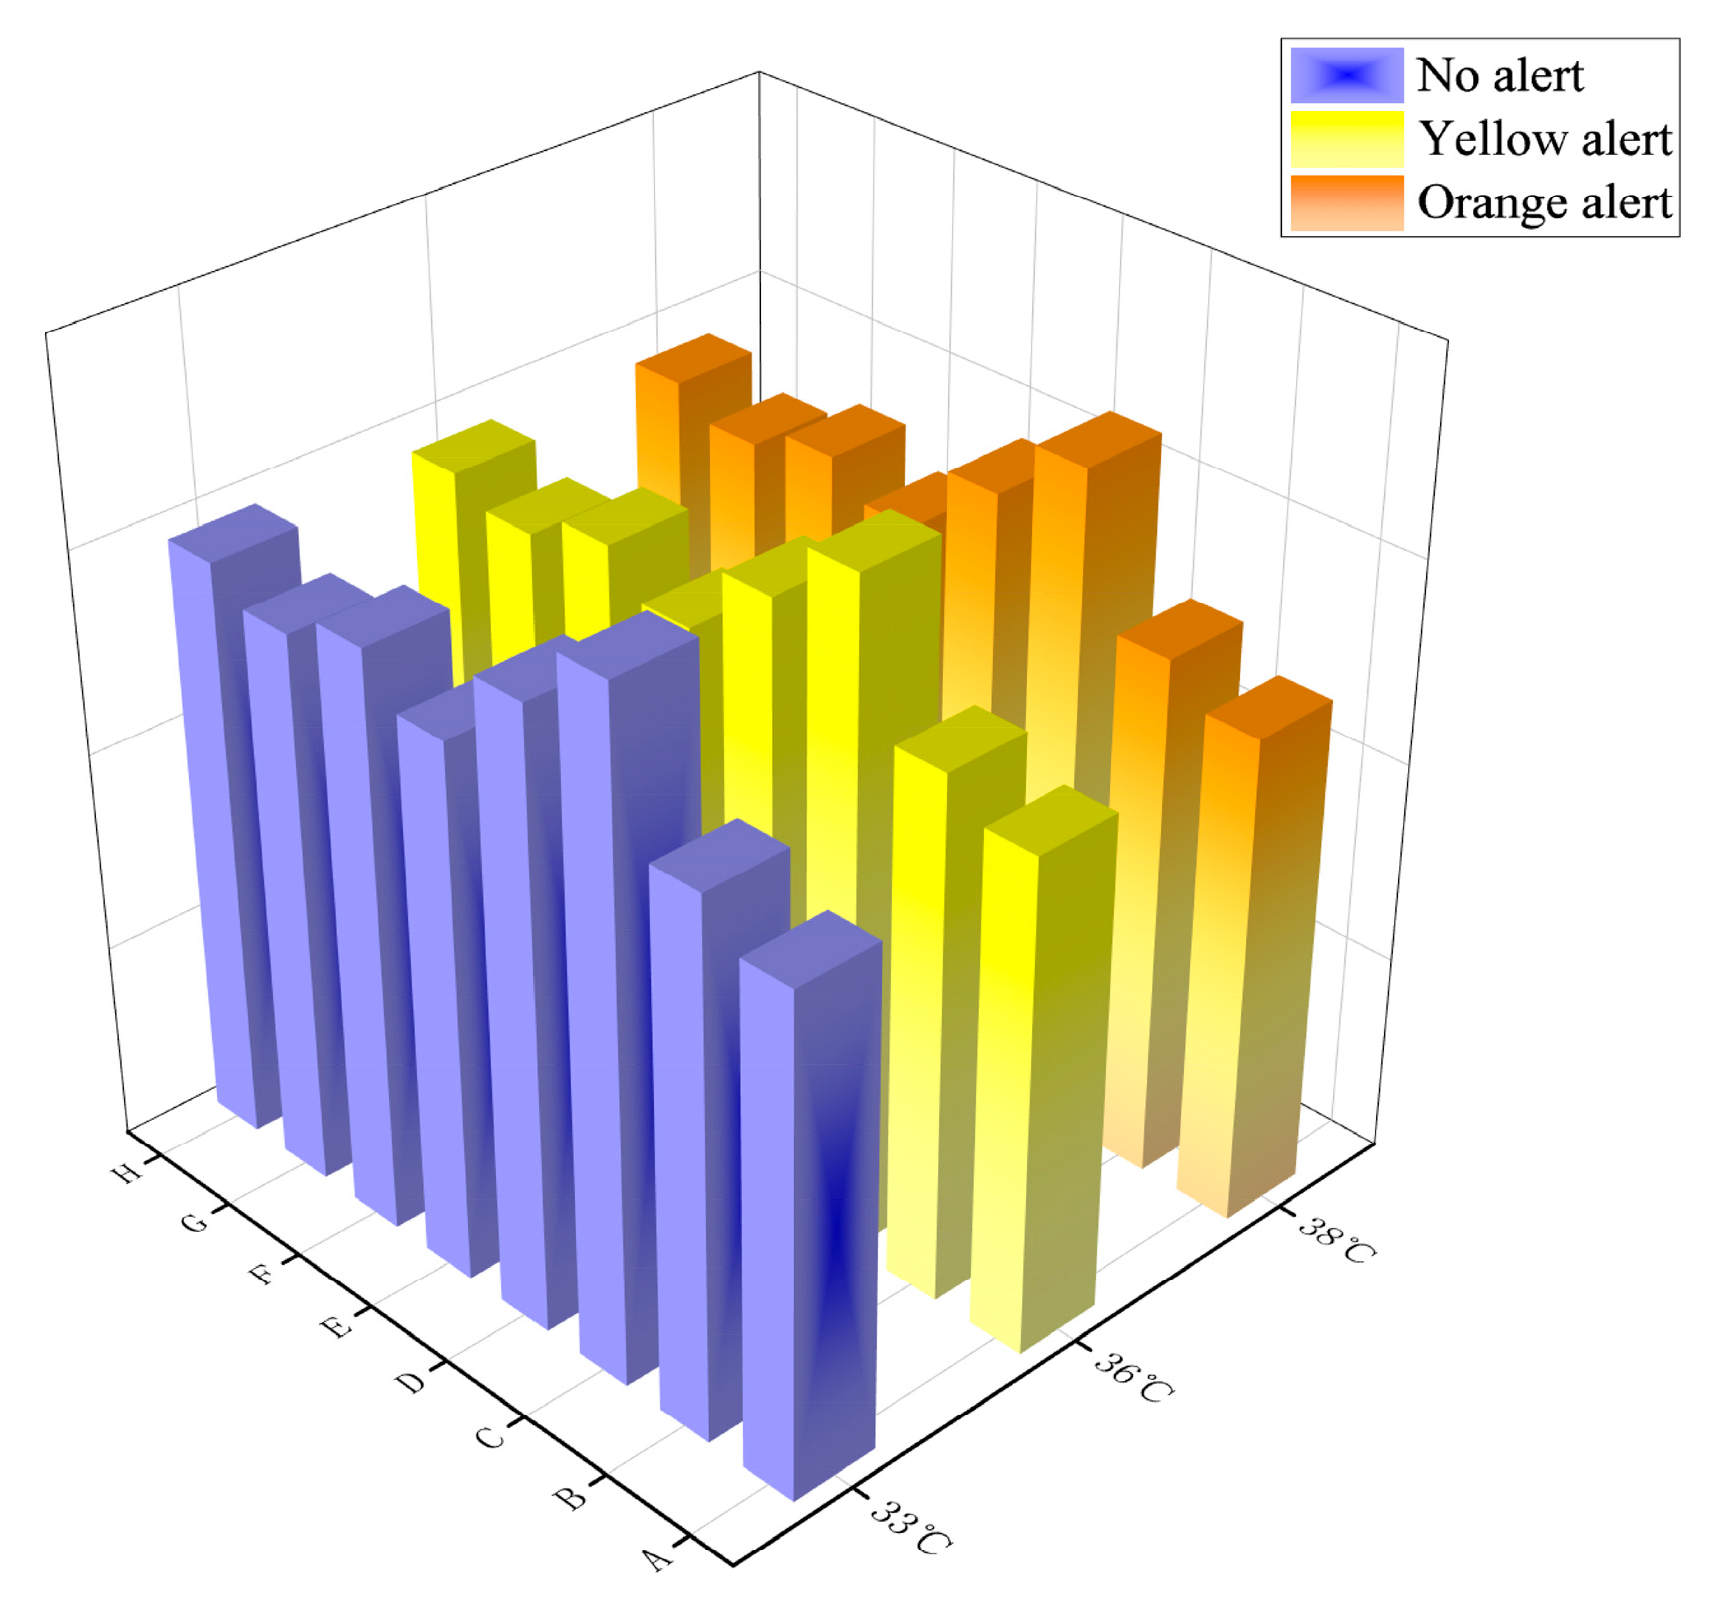
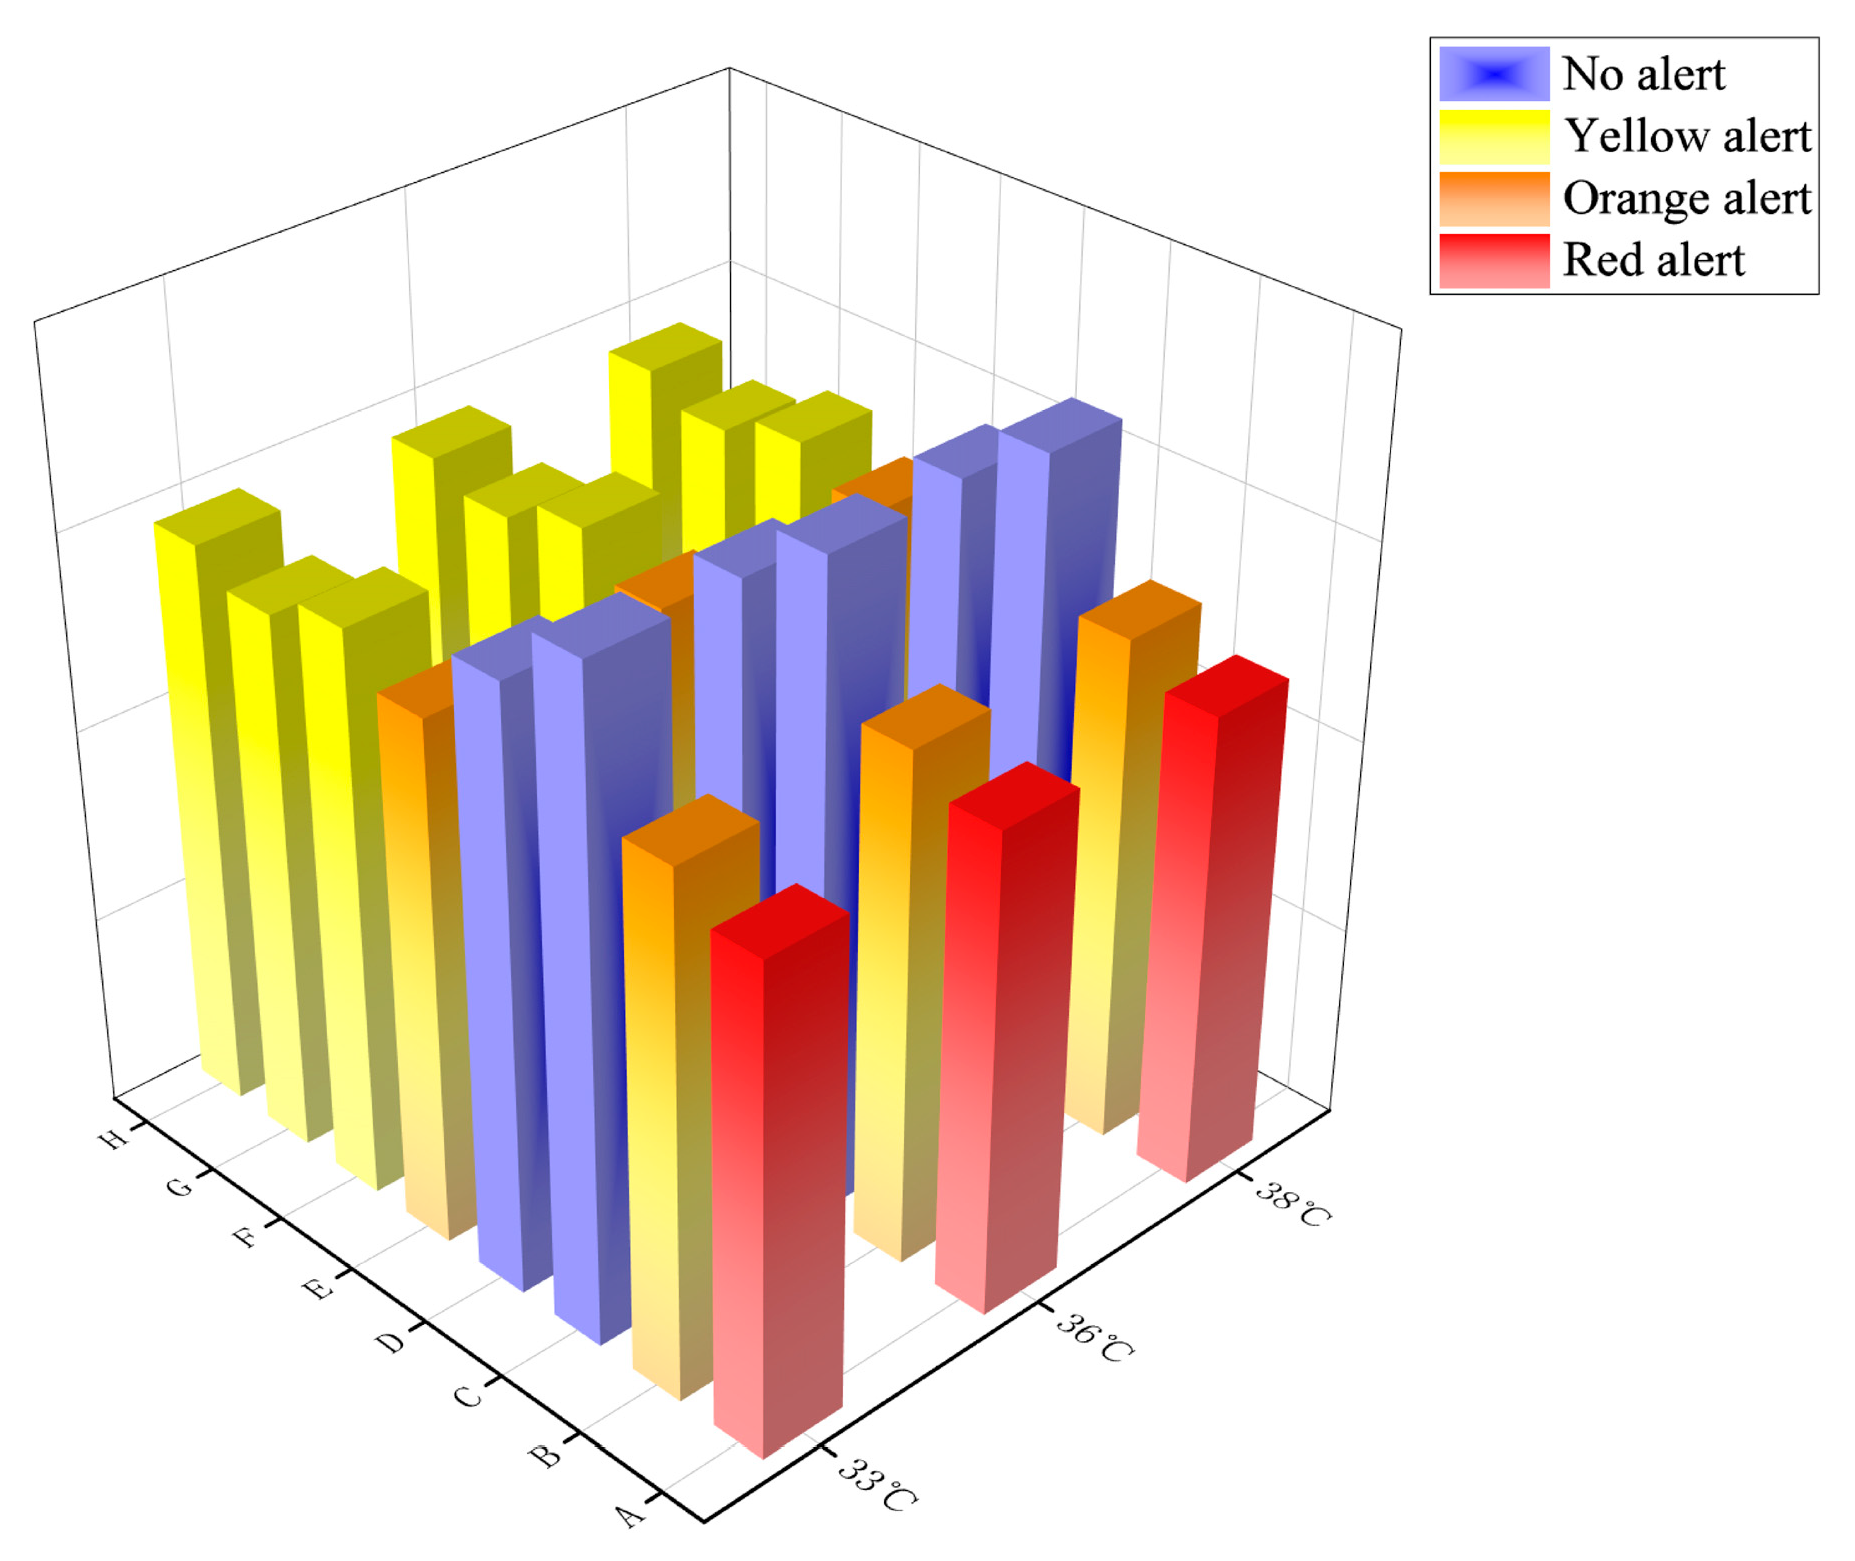
5.2. Early Warning Results

To validate the comprehensive early warning system developed in this study, the warning results are compared with those of the traditional temperature-based warning system. The warning results from different early warning systems are shown in Figure 6 and Figure 7, respectively.
Figure 6 indicates that under 36 °C conditions, the warning results obtained from the traditional temperature-based warning system are all a yellow alert. Under 38 °C conditions, orange alerts are triggered for all subjects, while no alert is issued for 33 °C conditions.
As Figure 7 shows, though in the same temperature conditions, the warning results of the comprehensive early warning system for all subjects are different, and the difference between the results are significant. Due to their weak physique, elderly individuals triggered red alerts at 33 °C. However, even under 38 °C conditions, no alert is issued for young individuals. Except for their good physique, the use of air conditioners brings them benefits.
Under 36 °C conditions, the middle-aged individuals E and F received yellow alerts from the traditional temperature-based warning system, while E received an orange alert on the comprehensive early warning system. The reason is that the traditional temperature-based warning system only considers the temperature, ignoring the effect of other indicators. The comprehensive early warning system developed in this study incorporates various indicators, including human health status, building conditions, and weather forecasts, making it more holistic. High temperatures indeed bring adverse effects on health, however some preventive measures, such as adequate sleep and effective cooling measures, will reduce the adverse effects.
The early warning system is an evaluation tool to assess health risk objectively and determine the degree of health risk. The early warning system can incorporate the weather forecast for certain people living or working in a certain building. It can be activated by inputting a weather forecast, personal information, and building information into the evaluation model. The evaluation model can be combined into software or app; thus, the early warning information can be given directly to the people indoors. The users can select his/her personal information (age, gender, body figure, personality characteristics, health status, labor intensity, physique status, nutritional status, and sleep status) and building information (thermal insulation, air tightness, and manual adjustment) when entering into the software/app. Once a weather forecast is given, the warning alerts can be sent and displayed. If a yellow alert, orange alert, or red alert is issued, some corresponding measures need be adopted to avoid potential threats. The following measures can be adopted: (1) adopt cooling measures; (2) drink enough water; (3) ensure adequate sleep; (3) avoid greasy and high-protein food, and intake more vegetables and fruits; (4) monitor physiological parameters and seek medical treatment in time if you have discomfort.

6. Conclusions

In this study, a comprehensive early warning system for people indoors in high-temperature weather is established based on human status, building conditions, and weather forecast. Based on the improved AHP method, the weights of all indexes are obtained. In addition, the gray evaluation method is adopted to conduct the health risk evaluation and obtain the early warning rating for people indoors in high-temperature weather. The main conclusions of this paper include the following:
(1)
This system considers three first level indicators. Among them, the weight of the human is 0.79 and the weight of the weather and building are 0.17, 0.04, respectively. Moreover, fifteen second level indicators are considered, and the weights of health status, temperature and manual adjustment are larger than other indicators.
(2)
The results of the health risk evaluation shows that the highest evaluation score for young individuals is 3.41, while elderly males receive the highest score of 2.5. Furthermore, the highest evaluation score for males is 3.41, while for females the highest score is 3.1.
(3)
Compared with the traditional temperature-based warning system, the comprehensive early warning system presents more accurate results. Even under identical weather conditions, individuals from different age groups receive varying outcomes. Due to their weak physique, elderly individuals triggered red alerts at 33 °C. However, even under 38 °C conditions, no alert is issued for young individuals.

Author Contributions

Conceptualization, Y.D. and Y.W.; methodology, software, and writing—original draft preparation, Y.W.; writing—review and editing, and supervision, Y.D.; formal analysis, and investigation, C.L. and K.L. All authors have read and agreed to the published version of the manuscript.

Funding

This research was funded by Development Fund of the National Key Laboratory of Building Safety and Environment, grant number BSBE2022-01.

Institutional Review Board Statement

The study was approved by Shandong Huayu University of Technology (approval number SDHY20240715, approval date is 15 July 2024).

Informed Consent Statement

Informed consent was obtained from all subjects involved in the study.

Data Availability Statement

The original contributions presented in this study are included in the article. Further inquiries can be directed to the corresponding author.

Acknowledgments

This research was supported by the “Green and low-carbon smart heating and cooling technology characteristic laboratory”.

Conflicts of Interest

The authors declare no conflicts of interest.

Appendix A

Table A1. The indoor human health evaluation index system and the questionnaire (Please tick in the [ ]).
IndicatorSub—FactorScoreDescriptionSignIndicatorSub—FactorScoreDescriptionSign
Human ( u 1 )Age ( u 11 )4 5 ≤ age < 18[ ] Nutritional status ( u 17 )4 excellent[ ]
3 18 ≤ age < 44[ ]3 good[ ]
2 44 ≤ age < 59[ ]2 medium[ ]
1 age ≥ 59 or age < 5[ ]1 poor[ ]
Body figure ( u 12 )4 moderate[ ]Sleep status ( u 18 )4 excellent[ ]
3 thin[ ]3 good[ ]
2 obese[ ]2 medium[ ]
1 fat[ ]1 poor[ ]
Personality
characteristics ( u 13 )
4 choleric temperament[ ]Gender ( u 19 )3 man[ ]
3 mucous[ ]2 woman[ ]
2 depressive[ ]Weather ( u 2 )Temperature ( u 21 )///
1 multi-blood[ ]Humidity ( u 22 )///
Health status ( u 14 )4 excellent[ ]Wind scale ( u 23 )///
3 good[ ]Building ( u 3 )Thermal insulationperformance ( u 31 )4 excellent[ ]
2 medium[ ]3 good[ ]
1 poor[ ]2 medium[ ]
Labor intensity ( u 15 )4 excellent[ ]1 poor[ ]
3 good[ ]Air tightness ( u 32 )4 excellent[ ]
2 medium[ ]3 good[ ]
1 poor[ ]2 medium[ ]
Physique status ( u 16 )4 excellent[ ]1 poor[ ]
3 good[ ]Manual adjustment ( u 33 )4 air conditioner[ ]
2 medium[ ]3 fan[ ]
1 poor[ ] 2 natural ventilation[ ]
1 nothing[ ]

References

  1. Zuo, J.; Palmer, S.; Bennetts, H.; Chileshe, N.; Ma, T. Impacts of heat waves and corresponding measures: A review. J. Clean. Prod. 2014, 92, 1–12. [Google Scholar] [CrossRef]
  2. Hua, X.; Zhang, C.; Ren, Y.; Shi, T.C. Spatiotemporal assessment of extreme heat risk for high-density cities: A case study of Hong Kong from 2006 to 2016. Sustain. Cities Soc. 2021, 64, 102507. [Google Scholar] [CrossRef]
  3. Zheng, G.Z.; Li, C.; Gao, Y.F. Determining the thresholds of environmental parameters for health protection of sanitation workers in summer based on mathematical programming. Build. Environ. 2021, 188, 107442. [Google Scholar] [CrossRef]
  4. Zheng, G.Z.; Fan, Z.Z.; Ge, M.; Li, C. Establishing a warning index for evaluating the physiological stress of sanitation workers in high temperature weather. Build. Environ. 2021, 100, 103074. [Google Scholar] [CrossRef]
  5. Tang, Y.M. Relationships between micronutrient losses in sweat and blood pressure among heat exposed steelworkers. Ind. Health 2016, 54, 215–223. [Google Scholar] [CrossRef] [PubMed]
  6. Garcia, G.M.; De, C.B. Working conditions, occupational injuries, and health among Filipino fish processing workers in Dutch Harbor, Alaska. Workplace Health Saf. 2017, 65, 219–226. [Google Scholar] [CrossRef]
  7. Sugg, M.M.; Fuhrmann, C.M. Relationships between maximum temperature and heat-related illness across North Carolina, USA. Int. J. Biometeorol. 2016, 60, 663–675. [Google Scholar] [CrossRef] [PubMed]
  8. Kim, E.; Kim, H.; Kim, Y.C.; Lee, P.J. Association between extreme temperature and kidney disease in South Korea, 2003-2013: Stratified by sex and age groups. Sci. Total Environ. 2018, 642, 800–808. [Google Scholar] [CrossRef] [PubMed]
  9. Anderson, G.B.; Bell, M.L. Heat waves in the United States: Mortality risk during heat waves and effect modification by heatwave characteristics in 43 U. S. communities. Environ. Health Persp. 2011, 119, 210–218. [Google Scholar] [CrossRef]
  10. Carlson, L.A.; Ferguson, D.P.; Kenefick, R.W. Physiological strain of stock car drivers during competitive racing. J. Therm. Biol. 2014, 44, 20–26. [Google Scholar] [CrossRef] [PubMed]
  11. Jia, C.Y.; Li, Y.Y.; Gao, S.R.; Zhao, S.K.; Liu, S.C.; Zhang, H. Thermal responses under different exercise intensity and air temperature. Build. Environ. 2025, 271, 112591. [Google Scholar] [CrossRef]
  12. Wang, Z.; Ning, H.; Ji, Y. Human thermal physiological and psychological responses under different heating environments. J. Therm. Biol. 2015, 52, 177–186. [Google Scholar] [CrossRef]
  13. Zhao, P.; Zhu, N.; Chong, D.K.; Hou, Y.Z. Developing a new heat strain evaluation index to classify and predict human thermal risk in hot and humid environments. Sustain. Cities Soc. 2022, 76, 103440. [Google Scholar] [CrossRef]
  14. Yang, B.; Yao, H.C.; Yang, P.F.; Guo, Y.Y. Effects of thermal and acoustic environments on workers’ psychological and physiological stress in deep underground spaces. Build. Environ. 2022, 212, 112591. [Google Scholar] [CrossRef]
  15. Wang, Y.J.; Wang, Y.T.; Wang, X.M.; Wang, C.X.; Li, G. Experimental investigation on physiological and perceptual thermal responses through simulated hot-humid deep mine conditions. Build. Environ. 2024, 255, 111435. [Google Scholar] [CrossRef]
  16. Wei, D.Y.; Du, C.F.; Lin, Y.F.; Chang, B.M.; Wang, Y. Thermal environment assessment of deep mine based on analytichierarchy process and fuzzy comprehensive evaluation. Case Stud. Therm. Eng. 2020, 19, 100618. [Google Scholar] [CrossRef]
  17. Zheng, G.Z.; Zhu, N.; Tian, Z.; Chen, Y.; Sun, B.H. Application of a trapezoidal fuzzy AHP method for work safety evaluation and early warning rating of hot and humid environments. Saf. Sci. 2012, 50, 228–239. [Google Scholar] [CrossRef]
  18. Ramavandi, B.; Darabi, A.H.; Omidvar, M. Risk assessment of hot and humid environments through an integrated fuzzy AHP-VIKOR method. Stoch. Environ. Res. Risk Assess. 2021, 35, 2425–2438. [Google Scholar] [CrossRef]
  19. Yazdanirad, S.; Golbabaei, F.; Monazzam, M.; Dehghan, H.; Foroushani, A.R. Identification, classification, and prioritization of effective factors in producing thermal strain in men at workplaces using fuzzy AHP technique. Indian J. Occup. Environ. 2020, 24, 106–113. [Google Scholar]
  20. Zheng, G.Z.; Li, K.; Bu, W.T.; Wang, Y.J. Fuzzy comprehensive evaluation of human physiological state in indoor high temperature environments. Build. Environ. 2019, 150, 108–118. [Google Scholar] [CrossRef]
  21. Zhai, Y.; Wang, X.; Niu, H.; Wang, X.; Nie, Y.; Huang, Y. Fuzzy Comprehensive Evaluation of Human Work Efficiency in a High-Temperature Thermal-Radiation Environment. Sustainability 2022, 14, 13959. [Google Scholar] [CrossRef]
  22. Ni, X.; Li, J.; Xu, J.Y.; Shen, Y.; Liu, X.G. Grey relation analysis and multiple criteria decision analysis method model for suitability evaluation of underground space development. Eng. Geol. 2024, 338, 107608. [Google Scholar] [CrossRef]
  23. Kan, Z.; Wei, Y.M.; Zhao, T.Y.; Cao, J.T. Risk evaluation of submarine pipelines in FMEA by combination of gray relation projection and VIKOR method. Ocean. Eng. 2024, 302, 117695. [Google Scholar] [CrossRef]
  24. Pinheiro, B.C.; SanťAna, P.H.M. AHP-based decision making to selecting energy-efficient air conditioning equipments in a commercial building. Energ. Build. 2025, 329, 115281. [Google Scholar] [CrossRef]
  25. Cyrine, B.; Rihab, R.; Abdelaziz, S.; Sinda, S.; Noamen, R. Advanced groundwater potential and contamination vulnerability assessment using integrated GIS-based AHP techniques: A case study from the Bizerte watershed, Tunisia. Environ. Sustain. Ind. 2025, 26, 100597. [Google Scholar]
  26. Zheng, X.Y.; Liu, Q.; Li, Y.F.; Wang, B.; Qin, W.T. Safety risk assessment for connected and automated vehicles: Integrating FTA and CM-improved AHP. Reliab. Eng. Syst. Safe 2025, 257, 110822. [Google Scholar] [CrossRef]
  27. Wang, Y.; Wei, H.W.; Wen, J.; He, J.Y.; Li, P.C. Assessing organizational vulnerability of nuclear power plants using AHP-fuzzy sets method. Ann. Nucl. Energy 2025, 211, 110896. [Google Scholar] [CrossRef]
  28. Gao, X.; Jia, C.G.; Luo, S.L.; Liu, H.Y. Meteorological conditions and countermeasures of high temperature heatstroke in Anyang. In Proceedings of the Twenty-Eighth Annual Meeting of China Meteorological Society in 2011, Xiamen, China, 1–3 November 2011. [Google Scholar]
  29. Gao, P. Effect of Individual Difference on Physiological Responses Under Hot and Humid Environment. Master’s Thesis, Tianjin University, Tianjin, China, 2012. [Google Scholar]
  30. Zhou, Y.Y.; Zhang, S.Y.; Liu, H.C.; Kuang, Z.Z.; Tian, Y. Analysis of the impact of high temperature heat waves on death in the elderly in Nanjing from 2005 to 2008. In Proceedings of the 31st Annual Meeting of China Meteorological Society, Beijing, China, 3–5 November 2014. [Google Scholar]
  31. Iñiguez, C.; Schifano, P.; Asta, F.; Michelozzi, P.; Vicedo-Cabrera, A.; Ballester, F. Temperature in summer and children’s hospitalizations in two Mediterranean cities. Environ. Res. 2016, 150, 236–244. [Google Scholar] [CrossRef] [PubMed]
  32. Gong, Z.Y. Indoor Thermal Environment Control Based on Thermal Sensation Prediction. Master’s Thesis, North China University of Technology, Beijing, China, 2018. [Google Scholar]
  33. Matsee, W.; Charoensakulchai, S.; Khatib, A.N. Heat-related illnesses are an increasing threat for travellers to hot climate destinations. J. Travel. Med. 2023, 30, taad072. [Google Scholar] [CrossRef] [PubMed]
  34. Rodrigues, L.; Tubelo, R.; Pasos, A.V.; Gonçalves, J.C.S.; Wood, C.; Gillott, M. Quantifying airtightness in Brazilian residential buildings with focus on its contribution to thermal comfort. Build. Res. Inf. 2021, 49, 639–660. [Google Scholar] [CrossRef]
  35. Ding, Y.; Han, S.X.; Tian, Z.; Yao, J.; Chen, W.Y.; Zhang, Q. Review on occupancy detection and prediction in building simulation. Build. Simul. 2022, 15, 333–356. [Google Scholar] [CrossRef]
  36. Kenney, W.L.; Havenith, G. Heat stress and age: Skin blood flow and body temperature. J. Therm. Biol. 1993, 18, 341–344. [Google Scholar] [CrossRef]
  37. Gu, S.; Huang, C.; Li, B.; Chu, C.; Liu, Q. Heat-related illness in China, summer of 2013. Int. J. Biometeorol. 2016, 60, 131. [Google Scholar] [CrossRef] [PubMed]
  38. Joshi, A.; Wang, F.M.; Kang, Z.X.; Yang, B.; Zhao, D.L. A three-dimensional thermoregulatory model for predicting human thermophysiological responses in various thermal environments. Build. Environ. 2022, 207, 108506. [Google Scholar] [CrossRef]
  39. Duan, G.N.; Song, C.; Liu, Y.F.; Wang, D.J.; Suolang, B.M. Study on the influence of hypobaric hypoxia on human thermal comfort under step change thermal environments. Energ. Build. 2023, 279, 112683. [Google Scholar] [CrossRef]
Figure 1. Flowchart of the methodology.
Buildings 15 00789 g001
Figure 2. Indoor human health evaluation index system.
Buildings 15 00789 g002
Figure 3. Evaluation scores of qualitative indicators for eight subjects.
Buildings 15 00789 g003aBuildings 15 00789 g003b
Figure 4. Evaluation scores of quantitative indicators.
Buildings 15 00789 g004
Figure 5. Comprehensive evaluation results.
Buildings 15 00789 g005
Figure 6. Results of traditional temperature-based warning system.
Buildings 15 00789 g006
Figure 7. Results of comprehensive early warning system.
Buildings 15 00789 g007
Table 1. Pair-wise comparison matrix and the weights of the first level indicator.
Indicatoru1u2u3Weight
u10110.79
u1−1010.17
u3−1−100.04
Table 2. Pair-wise comparison matrix and the weights of the sub-factors within “human”.
Indicatoru11u12u13u14u15u16u17u18u19Weight
u110111111110.246
u12−1011111110.025
u13−1−101111110.006
u14−1−1−10111110.411
u15−1−1−1−1000010.148
u16−1−1−1−1000010.025
u17−1−1−1−1000010.025
u18−1−1−1−1000010.025
u19−1−1−1−1−1−1−1−100.089
Table 3. Pair-wise comparison matrix and the weights of the sub-factors within “weather”.
Indicatoru21u22u23Weight
u210110.79
u22−1010.17
u23−1−100.04
Table 4. Pair-wise comparison matrix and the weights of the sub-factors within “building”.
Indicatoru31u32u33Weight
u310110.17
u32−1010.04
u33−1−100.79
Table 5. Gray class and whitening weight function.
Gray Class eHealth Risk LevelExpressionWhitening Weight Function
First gray classExcellent 1 ∈ [4, ∞]dijk/4dijk ∈ [0, 4]
1dijk ∈ [4, ∞]
0dijk ∉ [0, ∞]
Second gray classGood 2 ∈ [0, 3, 6]dijk/3dijk ∈ [0, 3]
(6 − dijk)/3dijk ∈ [3, 6]
0dijk ∉ [0, 6]
Third gray classMedium 3 ∈ [0, 2, 4]dijk/2dijk ∈ [0, 2]
(4 − dijk)/2dijk ∈ [2, 4]
0dijk ∉ [0, 4]
Fourth gray classPoor 4 ∈ [0, 1, 2]1dijk ∈ [0, 1]
2 − dijkdijk ∈ [1, 2]
0dijk ∉ [0, 2]
Table 6. Indoor human health risk early warning system.
Score[1.93–2.5](2.5–2.71](2.71–3.03](3.03–3.56]
Early warningRed alertOrange alertYellow alertNo alert
Table 7. Personal information of A~H.
ABCDEFGH
Age6060171742425050
Gendermalefemalemalefemalefemalemalefemalemale
Table 8. The parameters in weather forecasts from 22 July to 24 July.
DateTemperatureHumidityWind Scale
23 July36 °C80%3
24 July38 °C85%2
22 July33 °C75%4
Disclaimer/Publisher’s Note: The statements, opinions and data contained in all publications are solely those of the individual author(s) and contributor(s) and not of MDPI and/or the editor(s). MDPI and/or the editor(s) disclaim responsibility for any injury to people or property resulting from any ideas, methods, instructions or products referred to in the content.

