Article

Strength Characteristics and Prediction of Ternary Blended Cement Building Material Using RSM and ANN

by
Xiaofeng Li
1,2,*,
Chia Min Ho
3,
Shu Ing Doh
2,
Mohammad I. Al Biajawi
2,4,
Quanjin Ma
5,6,
Dan Zhao
1 and
Rusong Liu
1
1
China Hebei Construction and Geotechnical Investigation Group Limited, Shijiazhuang 050227, China
2
Faculty of Civil Engineering Technology, Universiti Malaysia Pahang Al-Sultan Abdullah, Gambang 26300, Malaysia
3
School of Materials Science and Engineering, Beihang University, Beijing 100191, China
4
Shenzhen International Graduate School, Tsinghua University, Shenzhen 518055, China
5
School of System Design and Intelligent Manufacturing, Southern University of Science and Technology, Shenzhen 518055, China
6
Centre for Advanced Industrial Technology, Universiti Malaysia Pahang Al-Sultan Abdullah, Pekan 26600, Malaysia
*
Author to whom correspondence should be addressed.
Buildings 2025, 15(5), 733; https://doi.org/10.3390/buildings15050733
Submission received: 17 January 2025 / Revised: 13 February 2025 / Accepted: 14 February 2025 / Published: 24 February 2025
(This article belongs to the Special Issue Bionic Materials and Structures in Civil Engineering)

Abstract

In this study, steel slag (SS) and ground coal bottom ash (GCBA) were utilized to partially substitute for cement in manufacturing ternary blended cement mortar. The replacement ratios of both SS and GCBA ranged from 0% to 20%, and the total replacement ratio varied from 0 to 40%. Response-surface methodology (RSM) and an artificial neural network (ANN) were employed to establish models with which the effects of the various combined contents of SS and GCBA on the distribution of 28-day strength and 91-day strength could be identified. The results showed that the combination of SS and GCBA had a positive effect on strength at a low replacement ratio, while it had an adverse effect on strength at a high replacement ratio. At a late curing age, the pozzolanic reaction of GCBA contributes to the strength enhancement. A total of 15 out of 27 experimental data were used to establish the RSM and ANN models. Through analysis of variance (ANOVA), the models established by RSM were well-fitted with the experimental data. The ANN-trained models also exhibited a good fit with the experimental data, as indicated by an R2 of >0.99. The remaining 12 out of 27 experimental data were used for the validation of the developed models, and the performances of the RSM and ANN models in prediction were compared. In conclusion, the ANN showed a better performance in strength prediction.

1. Introduction

Cement manufacturing is a critical process that enables the construction of infrastructure and buildings worldwide by serving as a binding agent in concrete. However, this process generates significant environmental issues, including greenhouse gas emissions and the depletion of non-renewable resources. According to the United States Geological Survey, global cement production reached 4.1 billion metric tons in 2020 [1]. Cement production consumes huge amounts of natural resources, such as limestone, clay, and other raw materials. Particularly, for each ton of ordinary Portland cement (OPC) generated, nearly 1.5 tons of fuel and raw materials is consumed, and approximately 1 ton of carbon dioxide (CO2) is released into the atmosphere [2,3]. Cement production accounts for approximately 8% of the total carbon dioxide emissions worldwide, making it a significant factor in the exacerbation of climate change [4]. Hence, the search for alternative constituent materials that can partially or fully replace cement is crucial to minimizing cement consumption and its environmental impact.
Ternary blended binders are a type of cementitious materials that incorporate two or more supplementary cementitious materials (SCMs) in addition to Portland cement [5]. The combination of SCMs with Portland cement allows for the optimization of the binder’s properties, including its strength, workability, and durability [6,7]. Previous studies have explored the use of ternary blended binders that incorporate industrial waste materials, for instance, ground granulated furnace slag, fly ash, and silica fume, as partial replacements for Portland cement in concrete [8,9,10]. The most popular materials used for manufacturing ternary blended cement concretes include the combination of fly ash and metakaolin and the combination of slag and metakaolin [11,12,13]. Studies have shown that these blends have a denser cementitious matrix with a corresponding reduction in pore space [14,15,16]. Furthermore, Alani et al. [17] revealed that concrete produced using a ternary blended binder outperformed other mixes in terms of compressive strength and could simultaneously reduce porosity, water permeability, and chloride permeability. These ternary blended binders can provide comparable or superior performance to traditional concrete mixes while also reducing the carbon footprint of concrete production and diverting waste materials from landfills [18,19].
Steel slag (SS) is a byproduct of the steel-making process that is generated when iron ore is melted and refined in a blast furnace. The physical and chemical properties of SS vary depending on the production process and can be influenced by factors such as the cooling rate and chemical composition [20]. SS typically consists of calcium, silicon, and iron oxides and also contains trace amounts of heavy metals, such as chromium and nickel [21,22,23]. One of the main environmental issues associated with SS is its disposal, which can result in soil and water pollution due to the leaching of heavy metals and other contaminants [24,25]. However, recent research has explored the use of SS as a partial replacement for cement in concrete production [26,27,28]. Palod et al. [29] observed that the 7-day compressive strength of ternary blended concrete using SS as a partial substitution for cement was lower than that of the reference specimen, owing to the low hydraulic activity of SS [30]. Zhao et al. [31] revealed that a ternary blended cement containing a higher proportion of SS exhibited superior strength and a denser microstructure when compared to the reference blended cement after 28 days of curing. At a later age, the hydration of the SS led to the production of more calcium silicate gel from the increased calcium hydroxide, which subsequently stabilized the ettringite in the paste [32,33]. These findings highlight the potential of SS as a promising alternative to conventional cement in high-performance concrete, with improved strength and durability properties.
Coal bottom ash (CBA) is a byproduct of coal combustion in thermal power plants and is typically collected in hoppers located beneath the combustion chamber [34]. Based on an investigation conducted by the World of Coal Ash (WOCA), the evaluated global production of CBA is approximately 730 million metric tons [35]. Commonly, CBA is either reclaimed in ash ponds or disposed of in landfills and nearby regions, posing potential risks to both human health and the environment [34,36]. Previous studies have explored the potential of CBA as a sustainable alternative to replace cement in concrete production to overcome these issues [37,38,39]. The chemical composition of CBA differs based on factors including the type of coal, combustion temperature, and residence time. Typically, it contains high levels of silicon, aluminum, calcium, and iron oxides [39,40]. Khan and Ganesh [41] concluded that incorporating 20% CBA as a partial substitution for cement in mortar achieved a compressive strength comparable to the reference specimen. A replacement of 30% CBA showed the highest resistance to acid attack. In addition, Kasaniya et al. [42] indicated that the use of CBA in concrete improved the electrical resistivity and resistance to chlorides. Studies have also shown that the pozzolanic reaction of CBA is initiated after 14 days of curing, while the utilization of calcium hydroxide becomes remarkable after 90 days of curing [36,43,44]. This suggests that incorporating CBA as a partial substitute for cement in concrete has the potential to enhance the long-term durability and overall performance of concrete structures.
Response-surface methodology (RSM) and artificial neural networks (ANNs) have gained popularity in the concrete research field due to their ability to predict and optimize material properties [45,46,47]. RSM is a statistical method used to analyze and optimize the relationship between multiple input factors and output responses, such as compressive strength and workability, while ANNs belong to a class of machine-learning algorithms capable of identifying intricate correlations between input and output data [48,49,50]. Previous studies have explored the employment of the RSM and ANNs in the optimization of concrete mix design and incorporated various SCMs and aggregates, to improve the performance of materials [51,52]. Dabbaghi et al. [53] employed an ANN and RSM to forecast the flexural strength of concrete treated with coal waste. The findings indicated that the RSM-modified ANN demonstrated better predictive accuracy with a root mean square error (RMSE) value of 0.875. Hammoudi et al. [46] compared the use of RSM and ANNs in analyzing and predicting the compressive strength of concrete at 7, 28, and 56 days. The results demonstrated that both techniques were effective, but the ANN model exhibited better accuracy with a high correlation coefficient (R2 = 0.9980). In short, the integration of RSM and ANN techniques in concrete research has the potential to reduce the cost and time associated with material testing and to facilitate the development of more sustainable and durable concrete structures [54].
The aim of this study was to examine the feasibility of the combination of ground CBA (GCBA) and SS as supplementary cementitious materials to replace OPC in the production of ternary mixture mortar. Previous research has demonstrated the individual benefits of both GCBA and SS in the mechanical properties of cement mortar when utilized as partial replacements for OPC. However, limited studies have explored their synergistic effects when combined in ternary mixtures. In this study, the replacement ratios of both SS and GCBA are varied between 0% and 20%, with the total replacement ratio ranging from 0% up to 40%, by weight. The compressive strength of ternary blended cement mortar was investigated. RSM and an ANN were employed to analyze and establish the relationship between the addition of SS and GCBA and the compressive strength of the ternary blended cement mortar. The accuracy of the models was verified by comparing the experimental data and predicted data calculated with the RSM and ANN models, respectively.

2. Materials and Methods

2.1. Materials

The binder used for manufacturing ternary blended cement mortar consists of OPC, SS, and GCBA. The OPC used in the present study is classified as CEM I 42.5N cement according to BS EN 197 [55]. Basic oxygen furnace slag (BOFS), a type of SS, was obtained from Hebei Baifeng Steel Slag Process Company, Shijiazhuang, China, and employed in this study. The particle size of SS was measured to be less than 75 μm (passing 200 mesh). The CBA used in this study was sourced from Tanjung Bin Energy Power Plant, Johor, Malaysia. The CBA was ground into powder, referred to as GCBA. The particle size of the GCBA was also controlled to be less than 75 μm (passing 200 mesh). The chemical compositions of the binders are shown in Table 1.
The fine aggregate used was river sand, conforming to BS EN 12620 [56], with a fineness modulus of 2.7 and a specific gravity of 2.65.
The chemical admixture used was a polycarboxylate-based superplasticizer with a water-reducing rate of up to 45%.

2.2. Mortar Preparation and Testing

The reference mix was designed with a water-to-binder ratio of 0.48 and a binder-to-sand ratio of 1:3, with cement as the only binder. Previous studies have indicated that replacement ratios below 20% can lead to optimal mechanical properties without compromising the performance of the mortar [36,57,58,59]. In this study, GCBA and SS were used as a partial substitution of cement and ranged from 0 to 20% of the total weight of the binder. The mix proportions for the ternary blended cement mortar are shown in Table 2. It should be noted that the mix proportions were adjusted to maintain the constant water-to-binder ratio of 0.48 for all mixes. Polycarboxylate-based superplasticizer was added as 1% of the total weight of the binder. The mix was prepared using a pan mixer to achieve a uniform consistency. The mix was cast into a 50 × 50 × 50 mm cube and allowed to cure in a standard curing room maintained at 23 ± 2 °C and 95% relative humidity for 28 days and 91 days before testing.

2.3. Mathematical Models

2.3.1. Response-Surface Methodology (RSM)

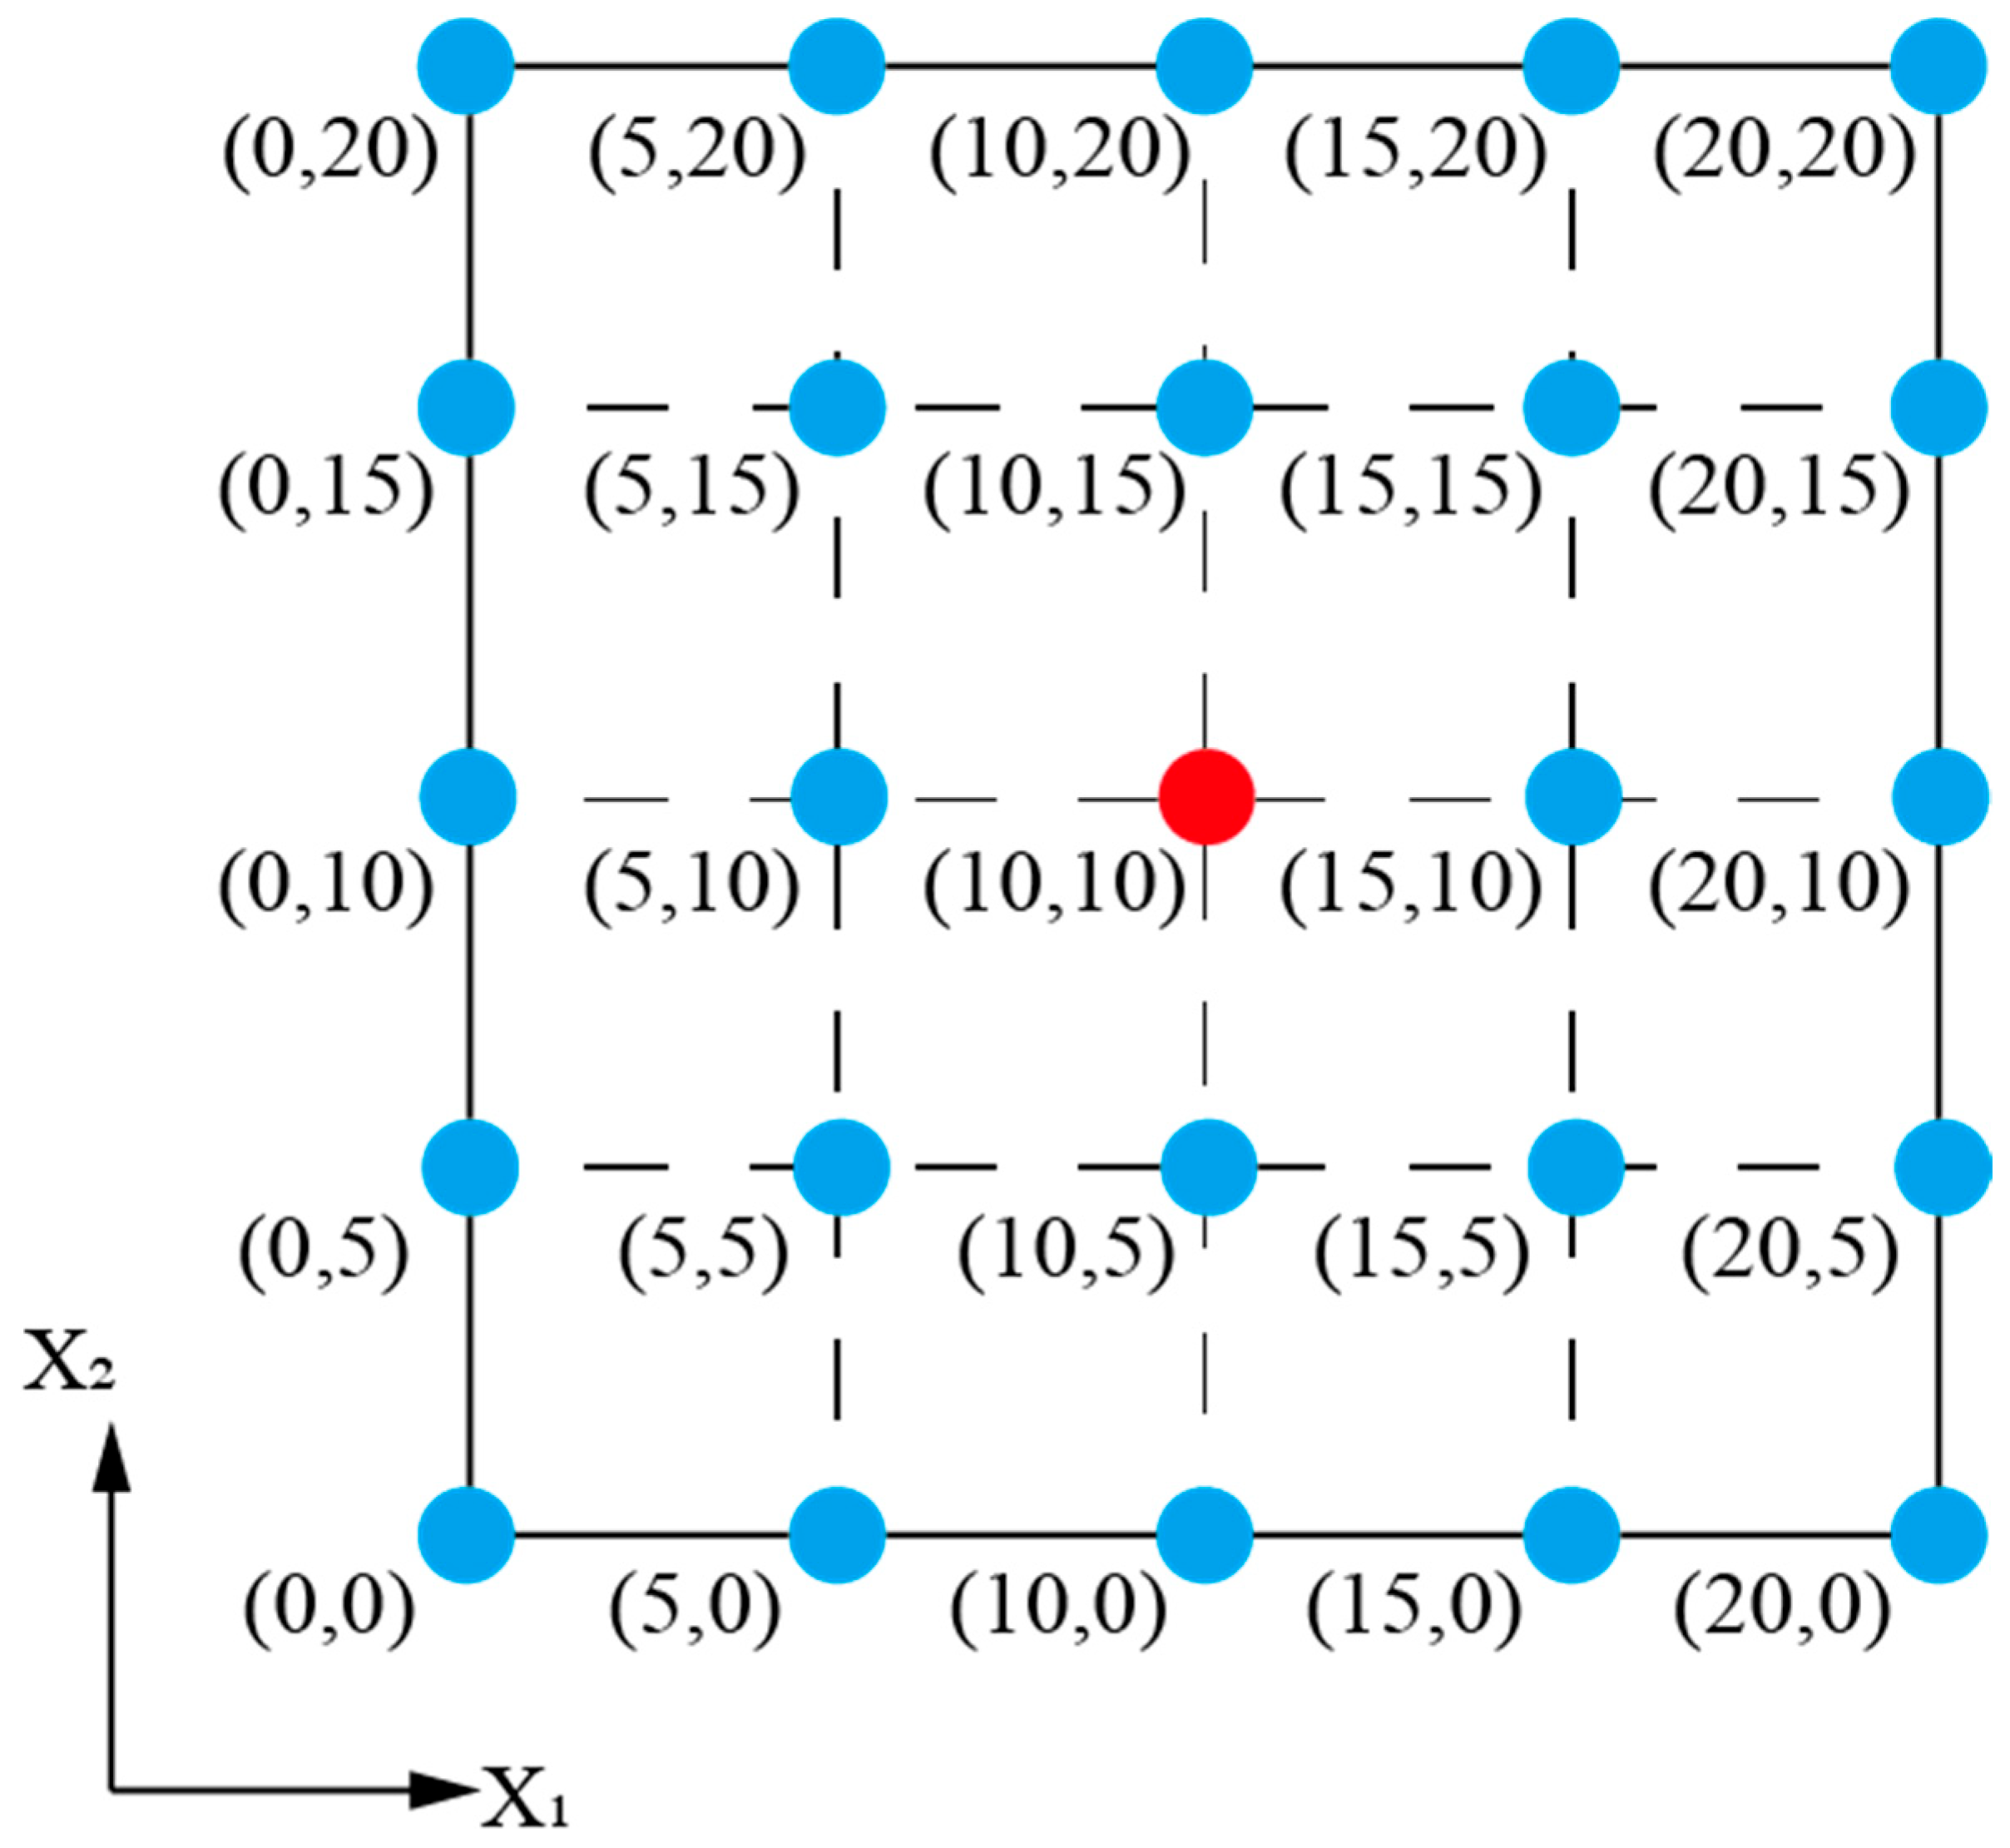
RSM is a powerful statistical and mathematical technique used to model and optimize complex relationships between multiple input variables and a response variable. It has been applied in the studies of concrete material [60]. RSM involves a series of carefully designed experiments or runs to collect data on the response variable across a range of input variable combinations. Central Composite Design (CCD) is a widely used experimental design technique within the framework of RSM. CCD is characterized by a combination of factorial points and additional runs, strategically placed at key positions within the experimental space. CCD consists of three types of points: factorial points, axial points, and center points (Figure 1).
The factorial points are the core of the design, allowing for a systematic exploration of the input variable space at different levels. The axial points, situated at a fixed distance (expressed as “alpha”) from the center of the design, enable the investigation of potential curvature and nonlinearity in the response surface. The center points provide additional data points that help to estimate the pure error and assess the model adequacy. Custom design is another option in RSM that offers researchers the flexibility to optimize the allocation of experimental runs based on their specific goals, which cannot be achieved with CCD. In the present study, the custom design used for determining the experimental design points is based on face-centered CCD, in which the “alpha” was set to 1. The variables taken were the SS replacement ratio (0–20%) and GCBA replacement ratios (0–20%). Five levels were set for each variable, with the same distance between every two levels. The center point was set with three replications (Figure 2).

2.3.2. Artificial Neutral Network

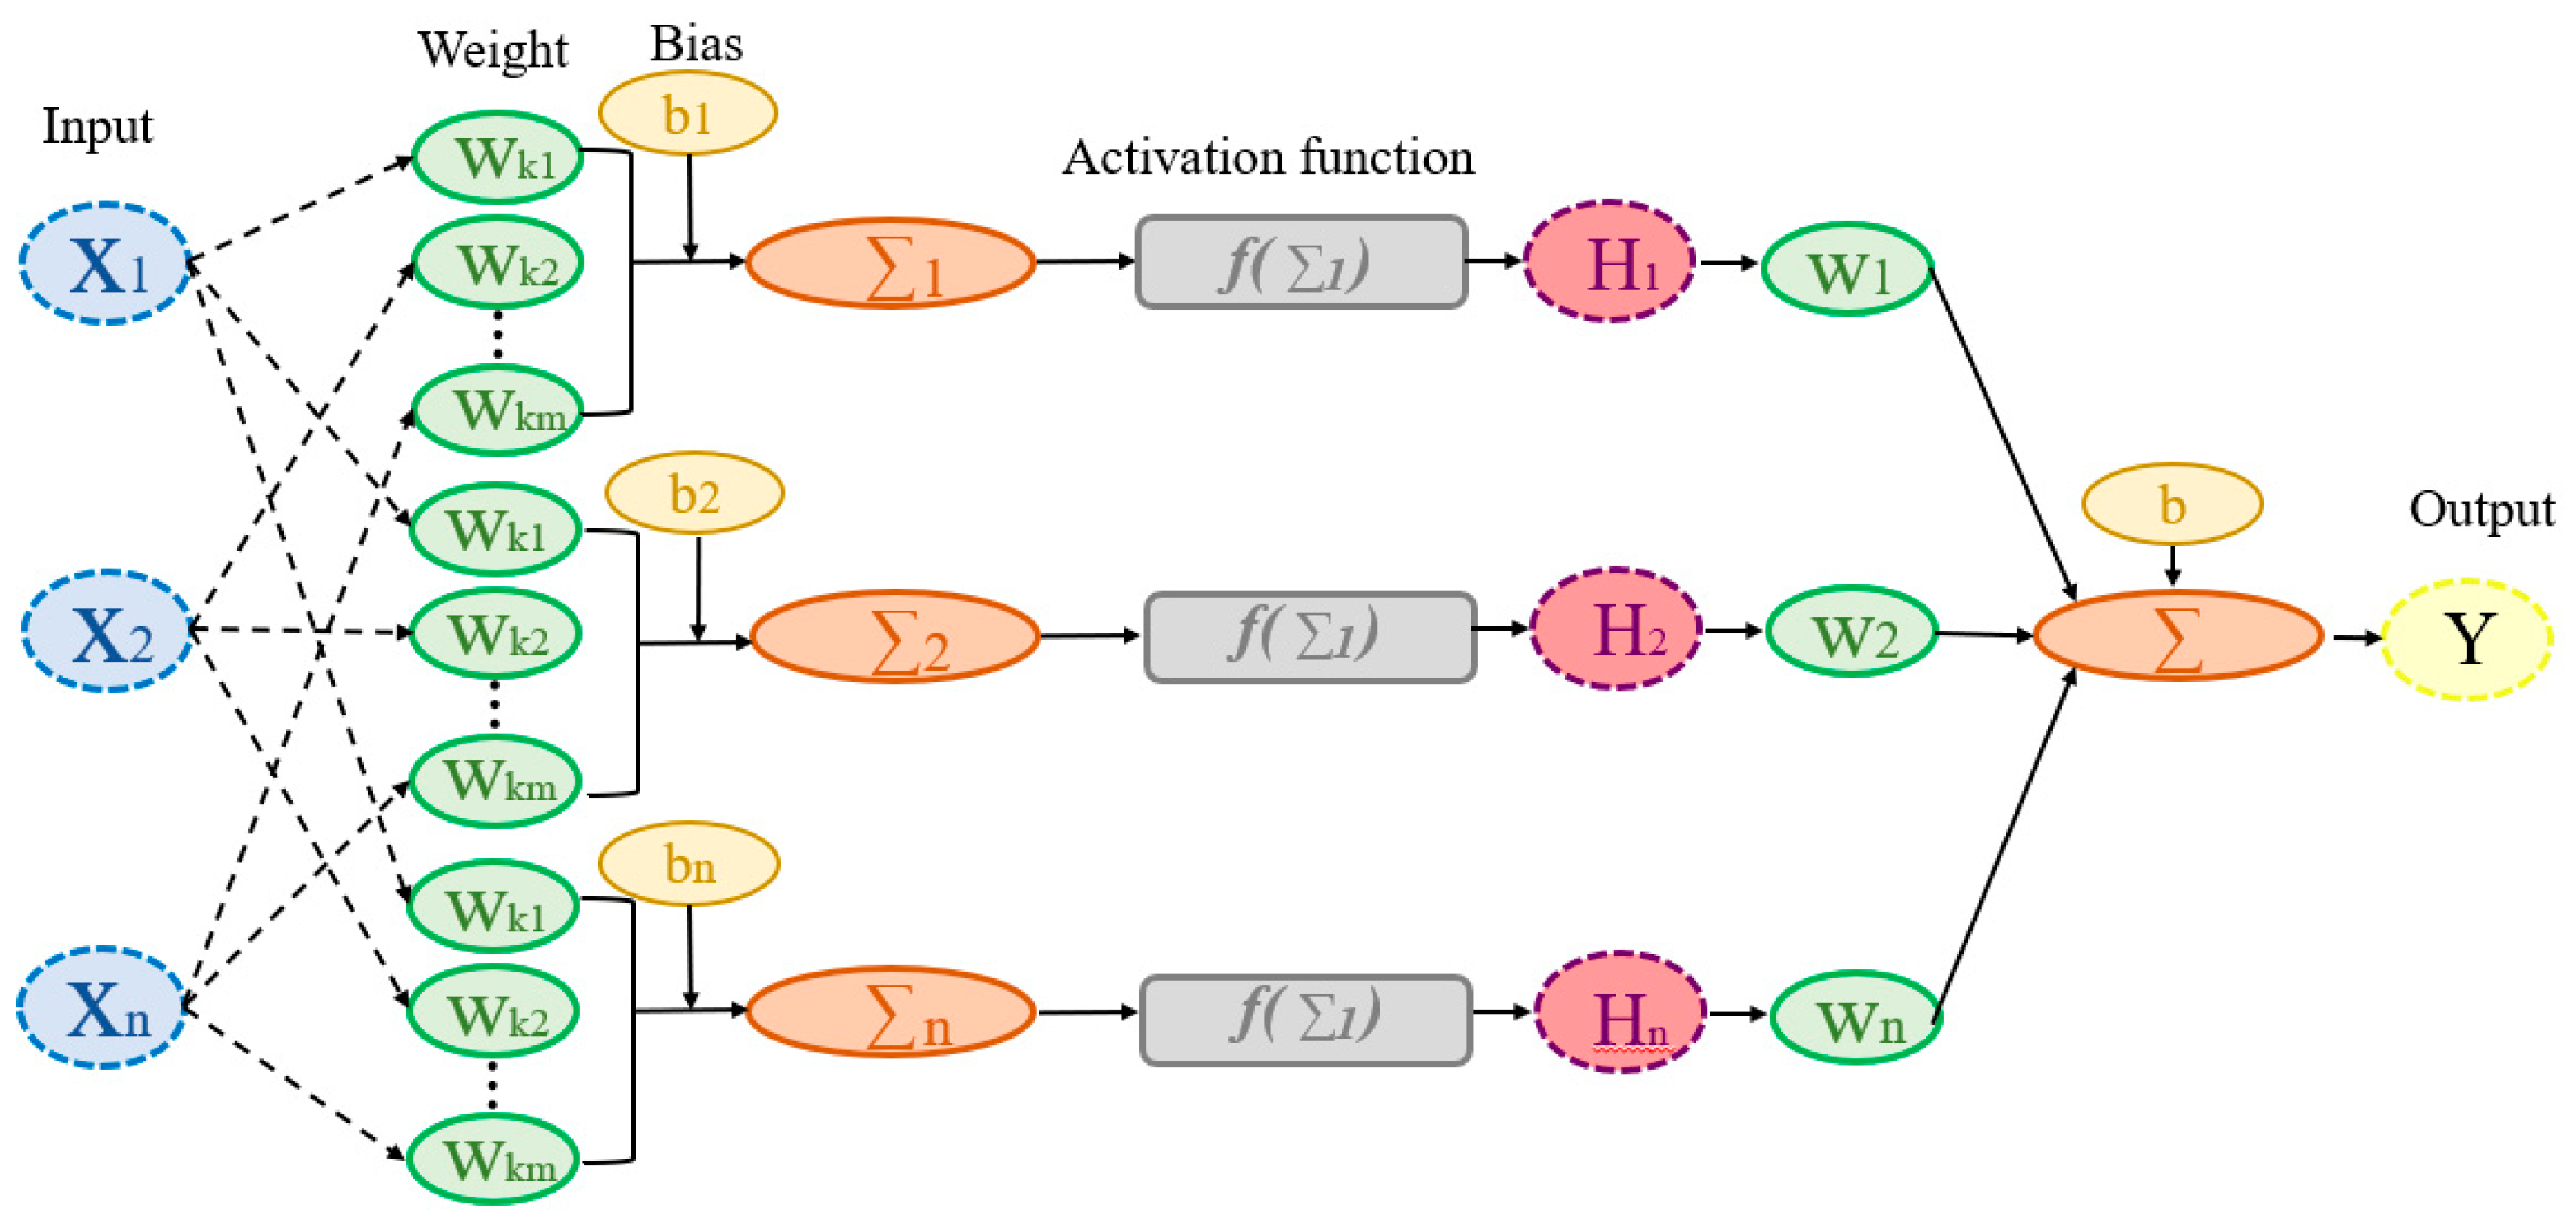
ANNs are computational models that have gained significant attention in recent years. ANNs are composed of interconnected nodes, called neurons, organized in multiple layers, and they are designed to process input data and produce corresponding output predictions or classifications (Figure 3). One key characteristic of ANNs is their multilayer structure, which allows for the modeling of complex relationships. Intermediate layers, known as hidden layers, exist between the input and output layers. These hidden layers consist of multiple neurons, each performing calculations on the input data using weighted connections and activation functions. Each neuron can be expressed by Equation (1).
Y = f H = 1 1 + e H
where f is a function of activation, selected as sigmoidal in the present study; H, gained from Equation (2), is the weighted sum of the inputs.
H = i = i n W i X i   + b
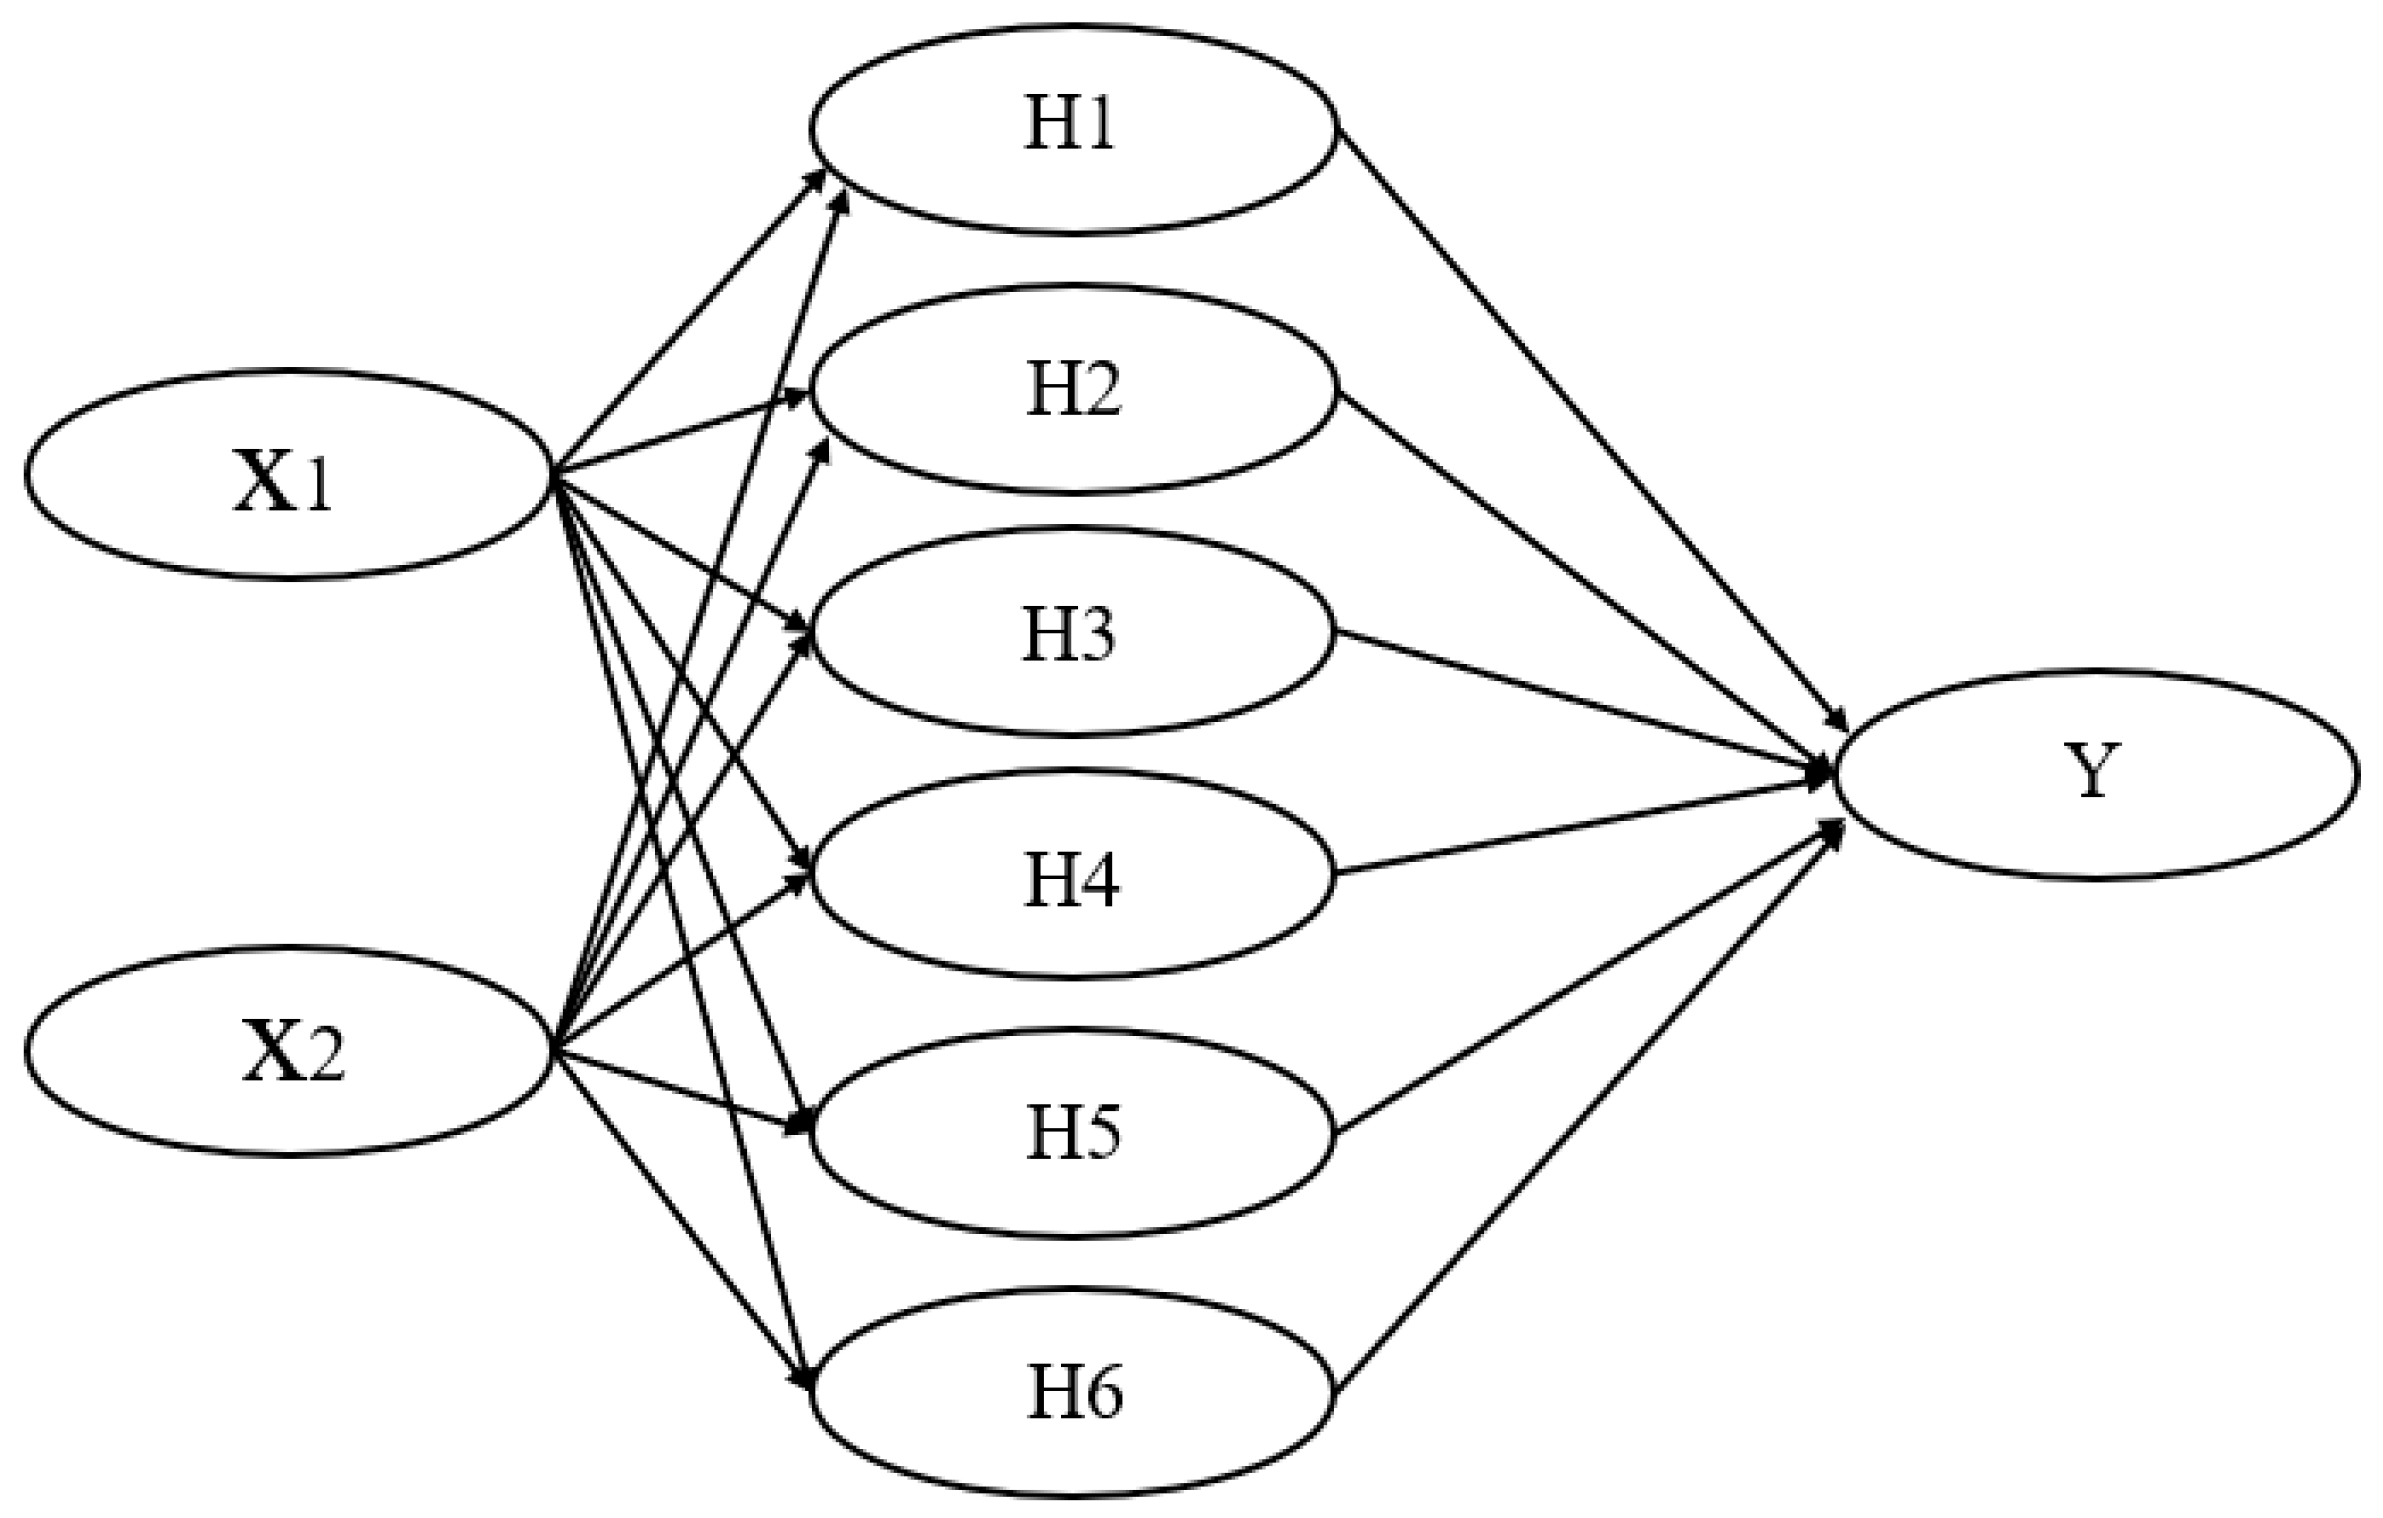
In this study, the input layer consists of two neurons, which are the same with the two independent variables, the SS and GCBA replacement ratios, used for establishing the RSM models. After several tests, the number of neurons was fixed at six. At the end, the result is given in the output layer (Figure 4).

2.3.3. Model Validation and Comparison

The significance of the RSM and ANN models was assessed based on the parameters below:
(a)
Coefficient of correlation (R)
R = Σ 1 n x x ¯ y y ¯ Σ 1 n x x ¯ 2 Σ 1 n y y ¯ 2
(b)
Coefficient of determination (R2)
R 2 = Σ 1 n x x ¯ y y ¯ Σ 1 n x x ¯ 2 Σ 1 n y y ¯ 2 2
(c)
Chi-square (χ2)
x 2 = Σ 1 n ( y x ) 2 y
(d)
Mean square error (MSE)
M S E = Σ 1 n ( y x ) 2 n
(e)
Root mean square error (RMSE)
R M S E = Σ 1 n ( y x ) 2 n
(f)
Mean absolute error (MAE)
M A E = 1 n Σ 1 n y x
(g)
Standard error of prediction (SEP)
S E P = 100 x ¯ Σ 1 n ( y x ) 2 n
where x is the actual data, y is the predicted data, x ¯ and y ¯ are the average of the predicted and actual data, respectively, and n denotes the number of samples.

3. Results and Analysis

3.1. Compressive Strength

SS is mineralogically characterized by possessing olivine, merwinite, dicalcium silicate (C2S), tricalcium silicate (C3S), tetra-calcium aluminoferrite, dicalcium ferrite, RO phase, and free calcium oxide [61,62]. The existence of C2S and C3S gives SS cementitious properties [63]. Previous studies have demonstrated that a weak pozzolanic reaction was detected when using SS as a supplementary cementitious material for manufacturing concrete [33]. However, GCBA is regarded as a pozzolanic material characterized by high contents of oxides including silica, alumina, and ferrite, and it can be classified under class “F” or class “C” [64,65]. Therefore, it is necessary to analyze the long-term strength performance resulting from the synergy of SS and GCBA in ternary blended cement mortar, as the pozzolanic reaction will take several weeks or even a few months to occur.
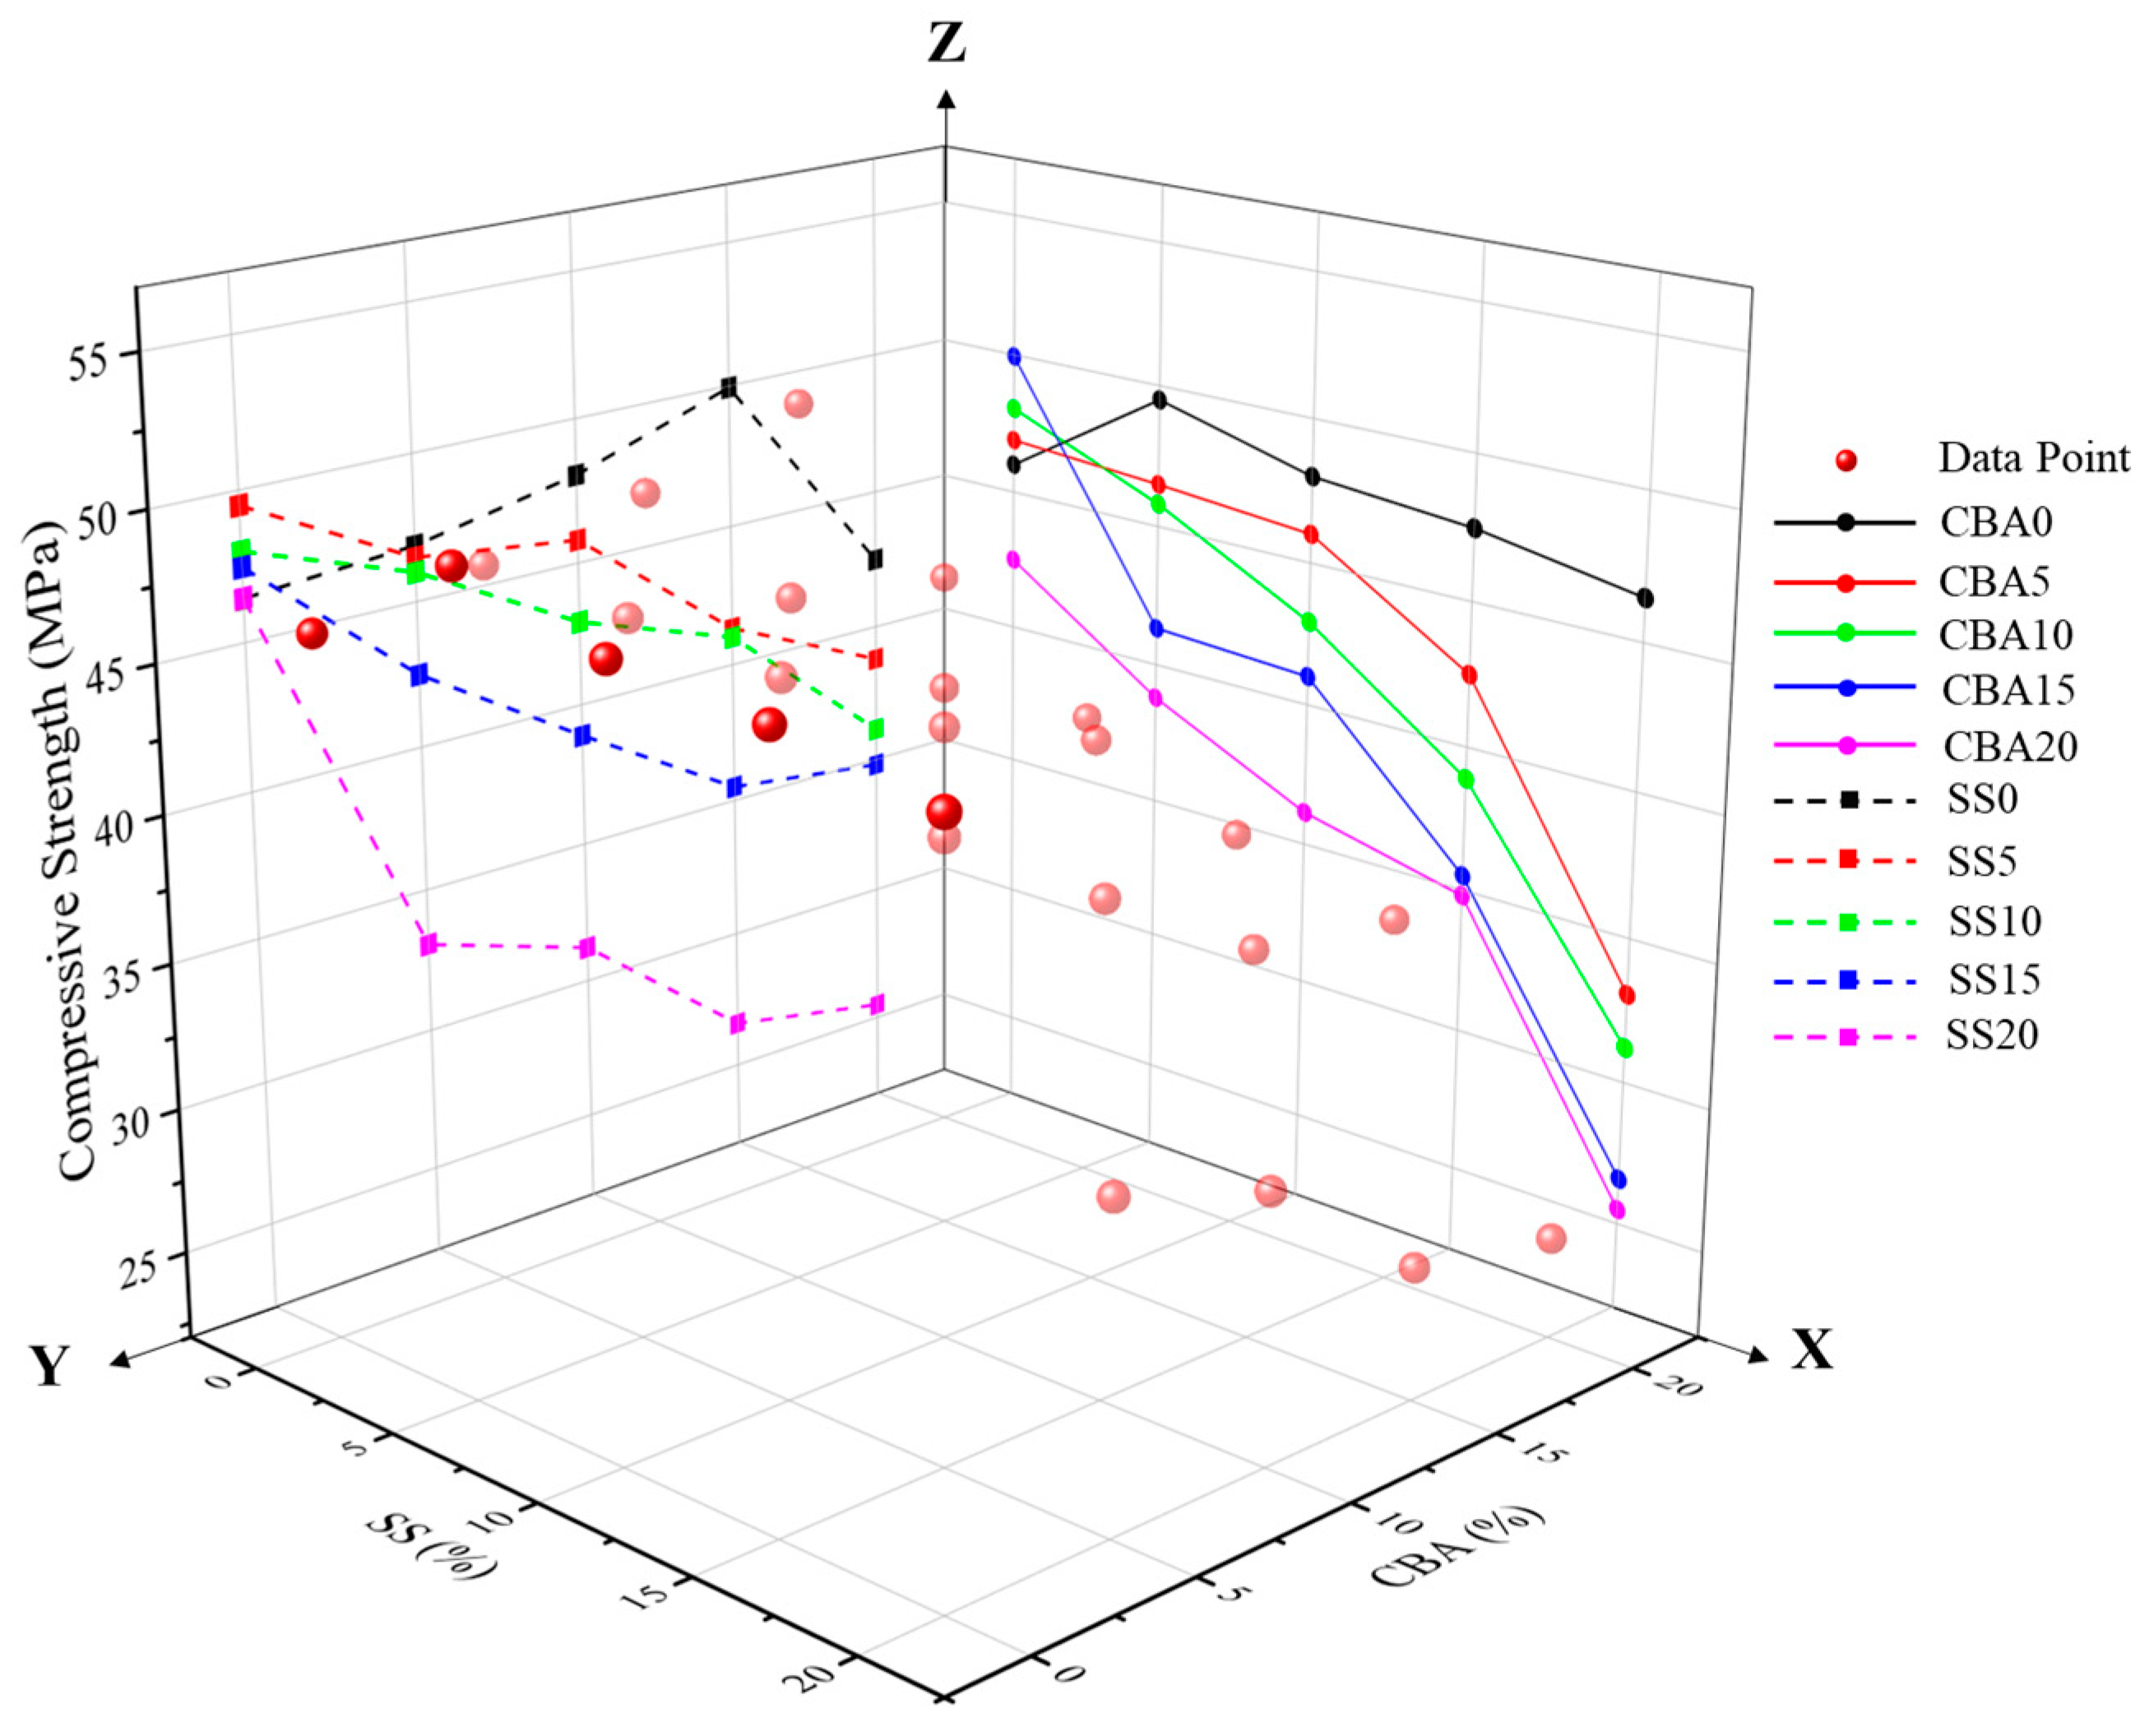
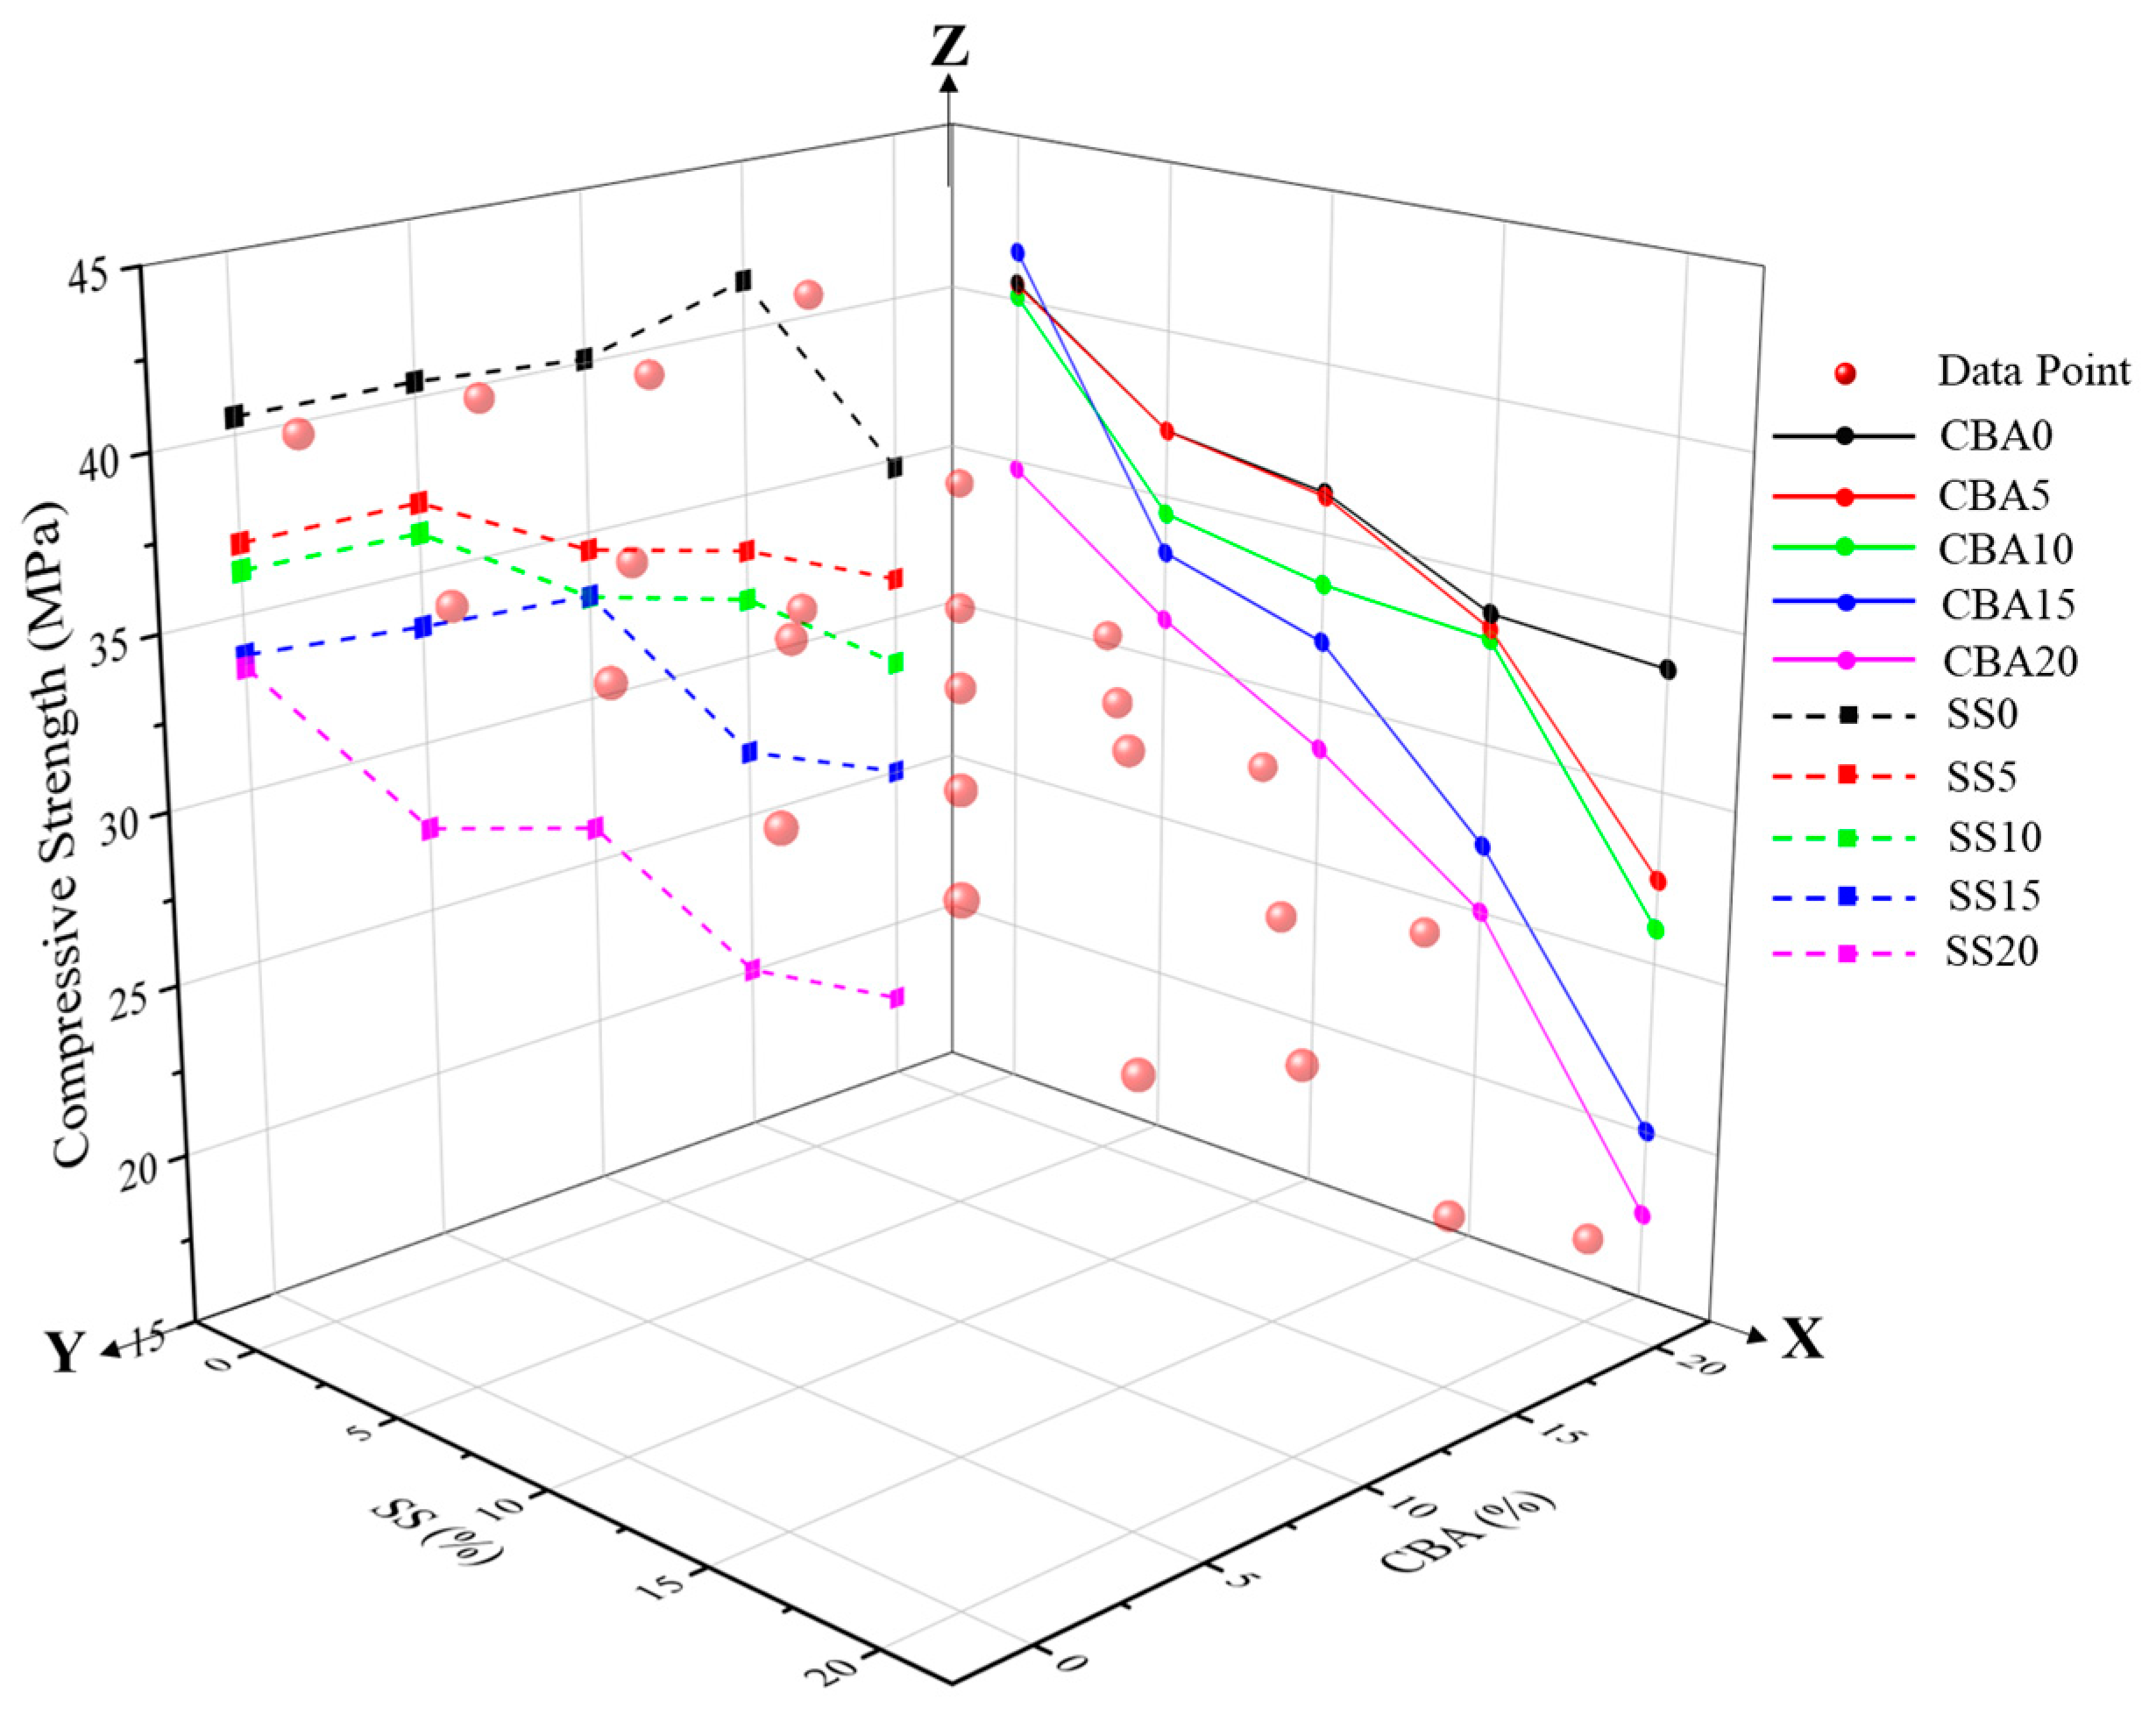
The three-dimensional scatter plots depicting the resulting data for the 28-day and 91-day compressive strength of ternary blended cement mortar are shown in Figure 5 and Figure 6. The impact of the combined use of SS and GCBA on the ternary blended cement mortar was analyzed by projecting the data in the three-dimensional graph onto the two two-dimensional planes (XZ plane and YZ plane). In general, the 28-day strength of the mortar reached from 17.5 to 41.5 MPa, with the lowest strength observed in the S20A20 mix and the highest in the S0A15 mix. The effect of SS with a fixed CBA content on the strength of ternary blended cement mortar can be investigated through the projection of data points onto the XZ plane. With the fixed GCBA content, the increase in the SS replacement ratio resulted in a reduction in mortar strength. When the GCBA content was fixed at 0, 5, 10, 15, and 20%, the increment in SS replacement ratios from 0 to 20% led to a reduction in strength by 7.0, 13.0, 14.1, 21.4, and 17.3 MPa, respectively. This means that the adverse effect of SS on the mortar strength was reduced at a low CBA content compared to that at a high GCBA content. Although the combination of SS and GCBA tended to decrease the strength of the mortar, it is worth noting that the use of individual SCMs (5% of SS and 15% of GCBA) could improve the mortar strength, as seen in CBA0 and SS0 (Figure 5). The projection of data points onto the YZ plane displayed the influence of GCBA with a fixed SS content on the strength of ternary blended cement mortar. When the SS content was fixed at 0%, replacing OPC with 0–10% GCBA had a negligible effect on mortar strength. The addition of 15% GCBA exhibited a positive effect on mortar strength, while a further increase in GCBA engendered a significant drop in mortar strength. The addition of GCBA resulted in a decrease in mortar strength at fixed SS content levels of 5, 10, 15, and 20%. When the SS replacement ratios were fixed at 5, 10, 15, and 20%, the addition of GCBA at each fixed SS content level led to a reduction in mortar strength by 5.8, 7.7, 8.9, and 16.0 MPa, respectively, which means the addition of GCBA had a less negative effect at a low SS content level compared to a high SS content level.
The 91-day compressive strength of ternary blended cement mortar ranged from 25.5 to 50.0 MPa, as observed for the mixes of S20A20 and S0A15 with the minimum and maximum strength. An increase in strength was obtained for all mortar when the curing age was prolonged from 28 days to 91 days. This demonstrated that the combined use of SS and GCBA as SCMs does not have a negative effect on mortar strength during the designed curing period. The influence of SS with a fixed CBA content on mortar strength is shown on the XZ plane. Without the addition of GCBA, the replacement of SS led to the increase in mortar strength with the replacement ratio from 0 to 5%, while a further increase in the SS replacement ratio caused a decrease in mortar strength. When the GCBA contents were fixed at 5, 10, 15, and 20%, the increase in the SS replacement ratio resulted in a decrease in mortar strength, with reductions of 13.8, 16.8, 23.4, and 17.0 MPa, respectively. The influence of CBA with a fixed SS content on mortar strength is shown on the YZ plane. Without the addition of SS, using GCBA to replace OPC from 0 to 15% led to continuous increase in mortar strength, and a further increase in CBA content caused a decrease in mortar strength. When the SS content was fixed at 5, 10, 15, and 20%, the increase in the GCBA replacement ratio resulted in a decrease in mortar strength, with reductions of 10.7, 11.2, 12.7, and 21 MPa, respectively, which means the addition of GCBA has a less negative effect at a low SS content level compared to a high SS content level.

3.2. RSM Modeling

RSM has been widely used as a statistical technique to model and optimize the development of the compressive strength of concrete. By designing experiments and obtaining experimental data, a mathematical model was developed using RSM that describes the relationship between the input variables and the response variables and further predicts the response value at a non-experimental point. The design points used for building the RSM model are labeled in Table 3.
In RSM, the relationship between the response and factor is modeled using polynomial equation [66]. In this study, the 28-day and 91-day compressive strength can be expressed by the cubic polynomial equation based on the custom experimental design. The equations, given in Equations (10) and (11), were obtained in terms of coded factors (Table 4).
Y28-day = 33.33 − 4.56 × X1 − 4.94 × X2 − 2.57 × X1X2 − 0.51 × X12 − 1.19 × X22 − 1.59 × X12X2 + 0.98 × X1X22 − 2.48 × X13 + 1.09 × X23
Y91-day = 41.58 − 5.17 × X1 − 6.08 × X2 − 4.22 × X1X2 − 1.92 × X12 + 0.5 × X22 − 0.17 × X12X2 + 4.29 × X1X22 − 3.25 × X13 + 0.13 × X23
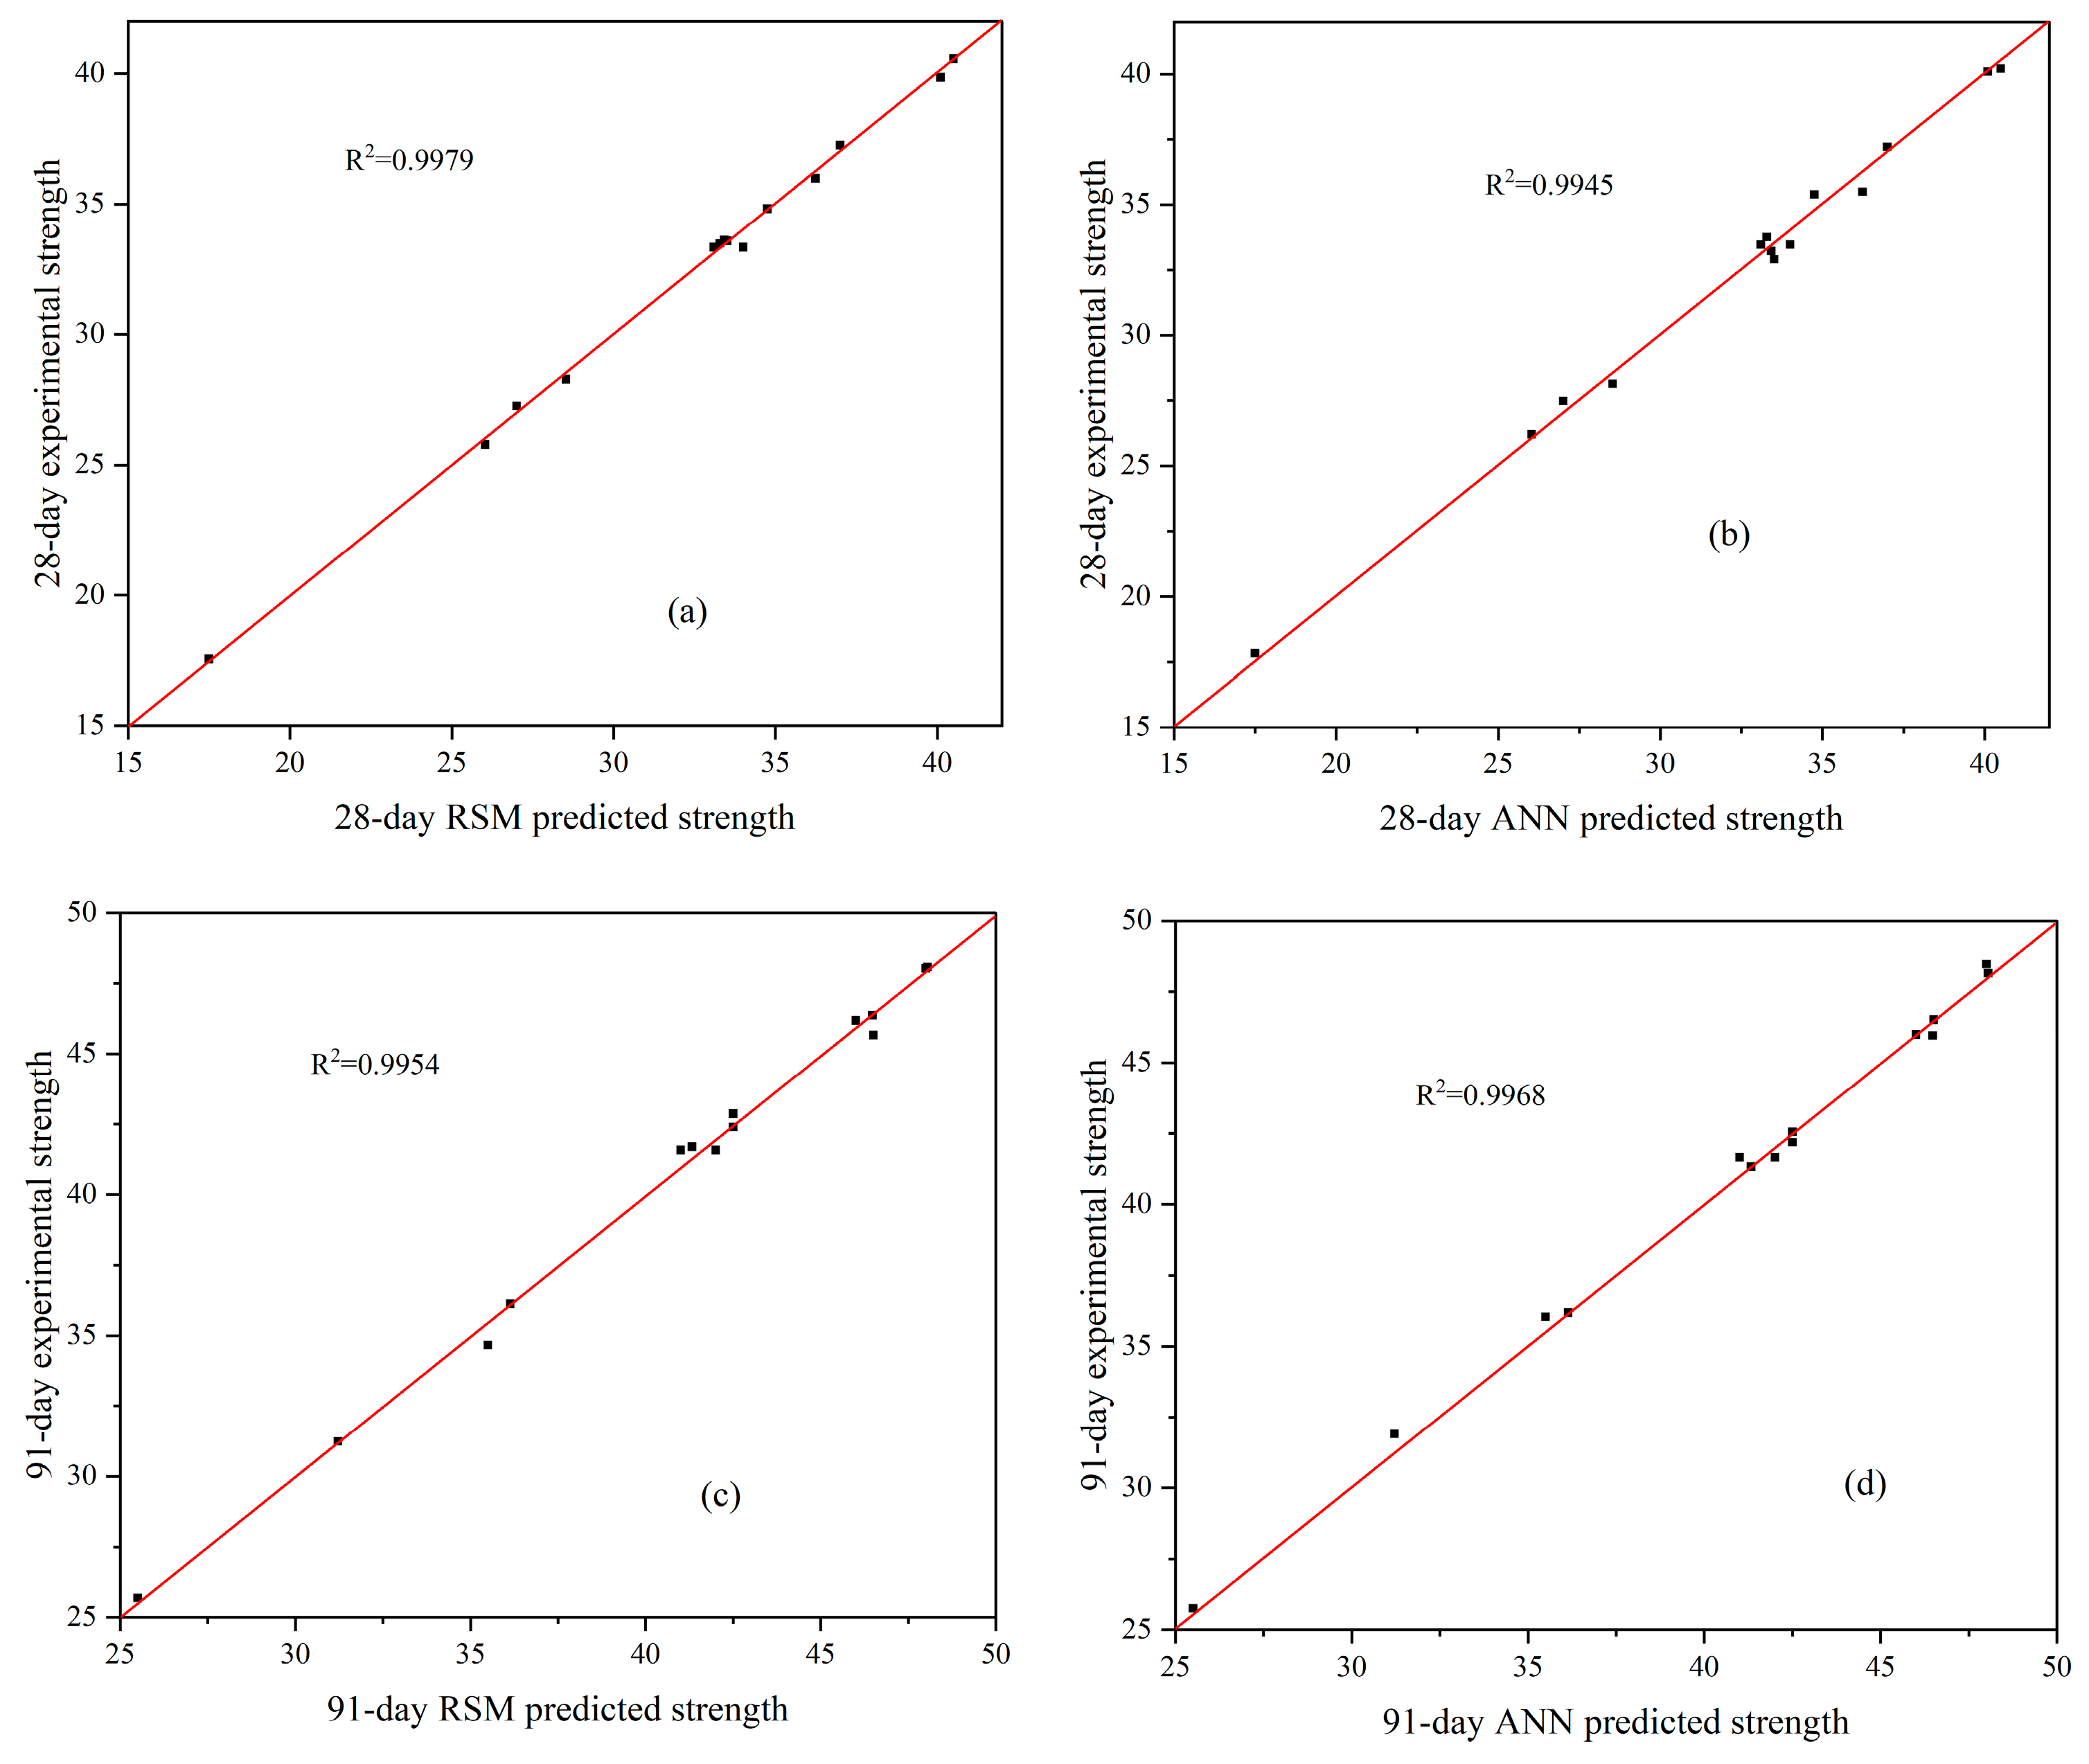
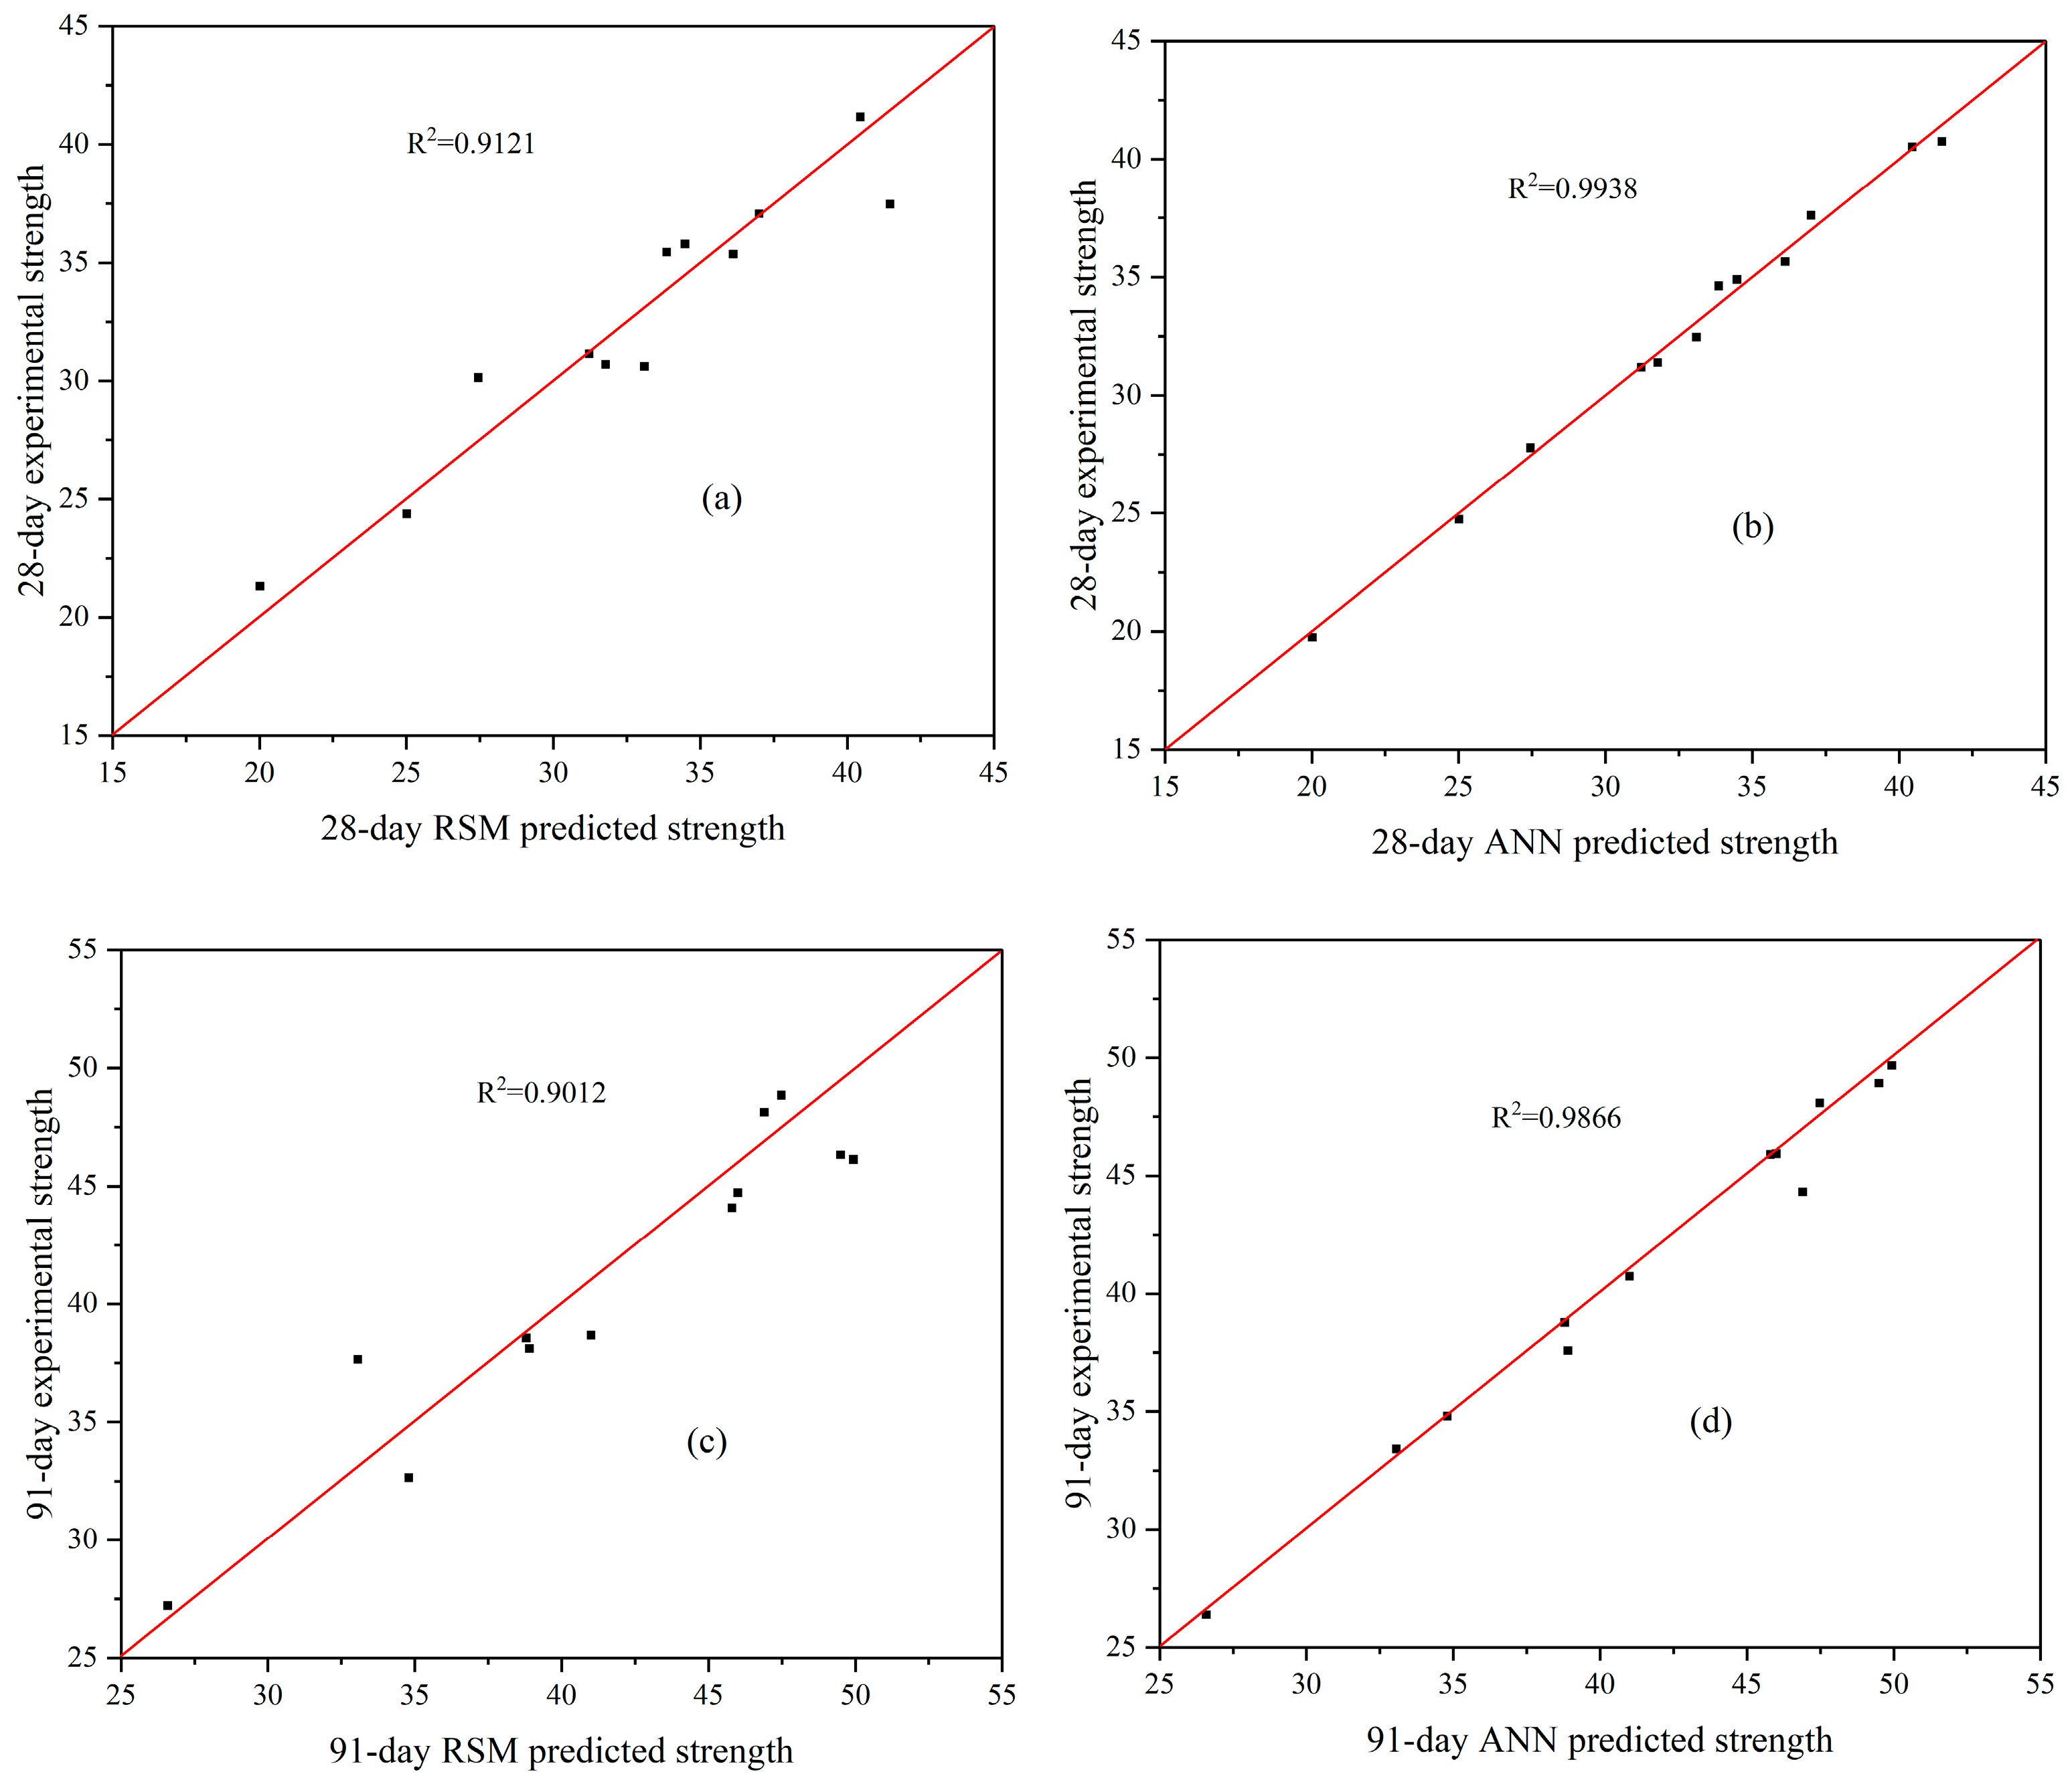
The accuracy of the model and the impact of the two factors on the 28-day and 91-day strength and the significance of the terms in the equations were investigated by conducting an analysis of variance (ANOVA), as shown in Table 5. The p-value was used as a tool to verify the significance of each term when building the model, with values <0.05 and <0.01 representing significant and highly significant results, respectively [45]. The p-values of both models established for 28-day and 91-day strength were <0.0001, which indicates that the models achieved extremely significant results. The p-values of X1 and X2 in both models were <0.01, which revealed that both SS and GCBA have a significant impact on mortar strength at the 28-day and 91-day curing ages. The cross-term (X1X2) in the RSM model is used to examine nonlinear relationships and the interaction between factors. A p-value < 0.0001 of the cross-term in both models means that the combined use of SS and GCBA has a significant effect on mortar strength and that the cross-term is significantly important for building the models. Regarding the other terms, X22, X12X2, and X13 were significant for building the 28-day strength model, while X12, X1X22, and X13 were significant for building the 91-day strength model. R2, adjusted R2, and predicted R2 are statistical measures for evaluating the goodness-of-fit and predictive performance of a regression model. The R2 values of the 28-day and 91-day strength models were 0.9979 and 0.9954, respectively, which indicated that the obtained models were well-fitted with the experimental data (Figure 7a,c). The predicted R2 of 0.9688 and 0.9633 of the 28-day and 91-day strength models indicated that both models have an excellent performance on predicting the new and unseen data. It is notable that the predicted R2 was in reasonable agreement with the adjusted R2 in both models, with a difference of less than 0.2.
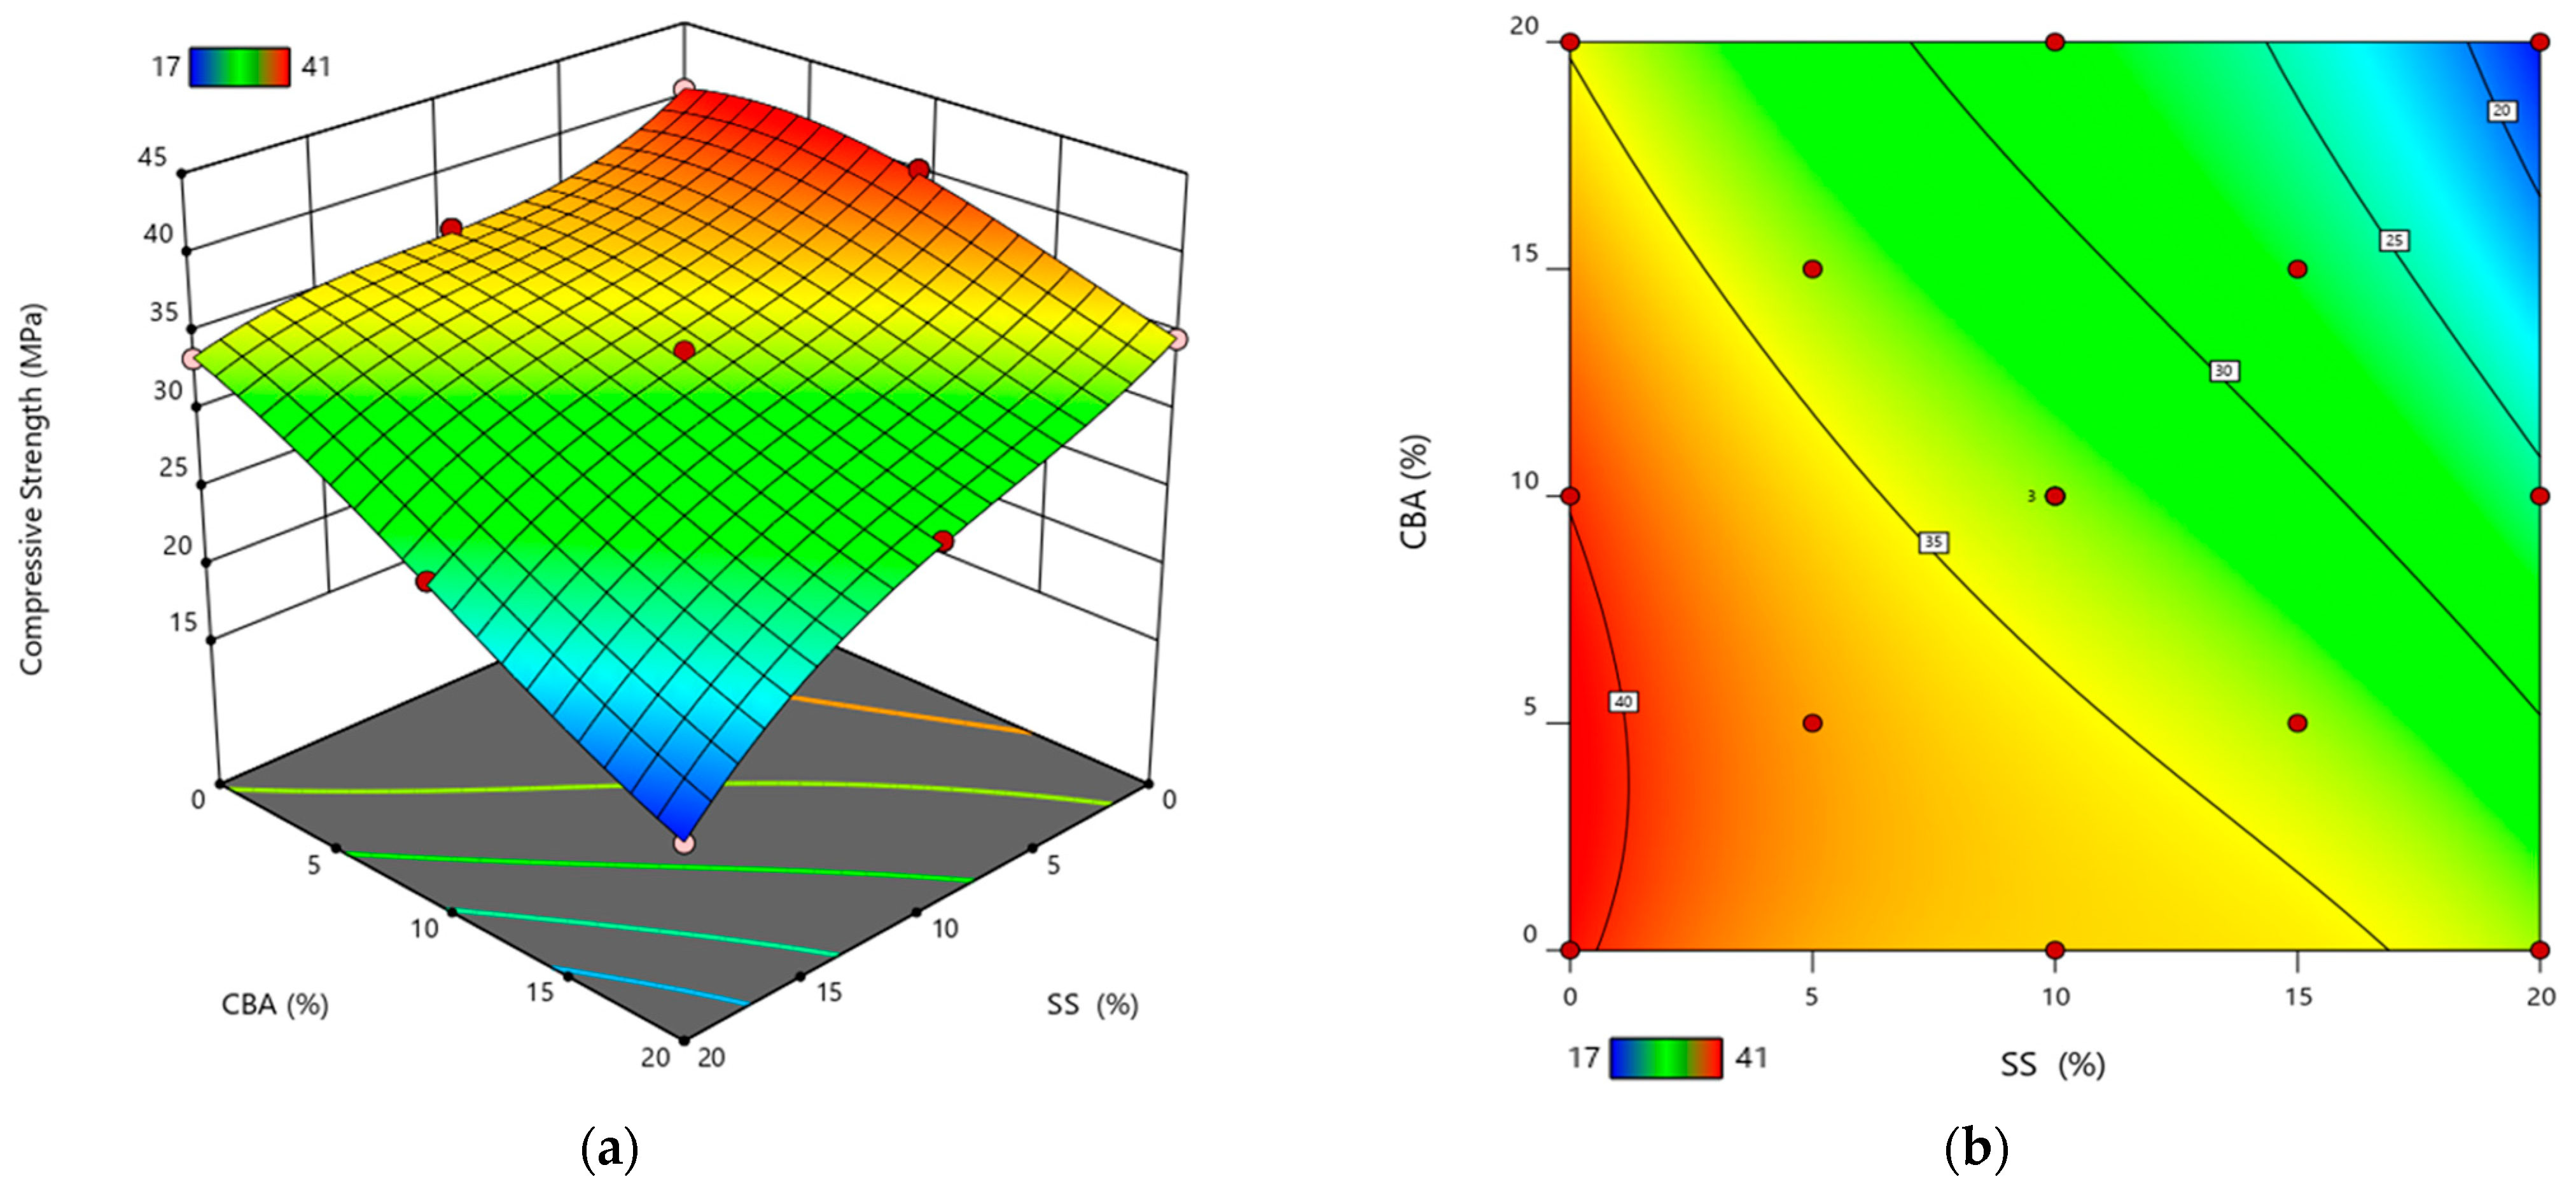
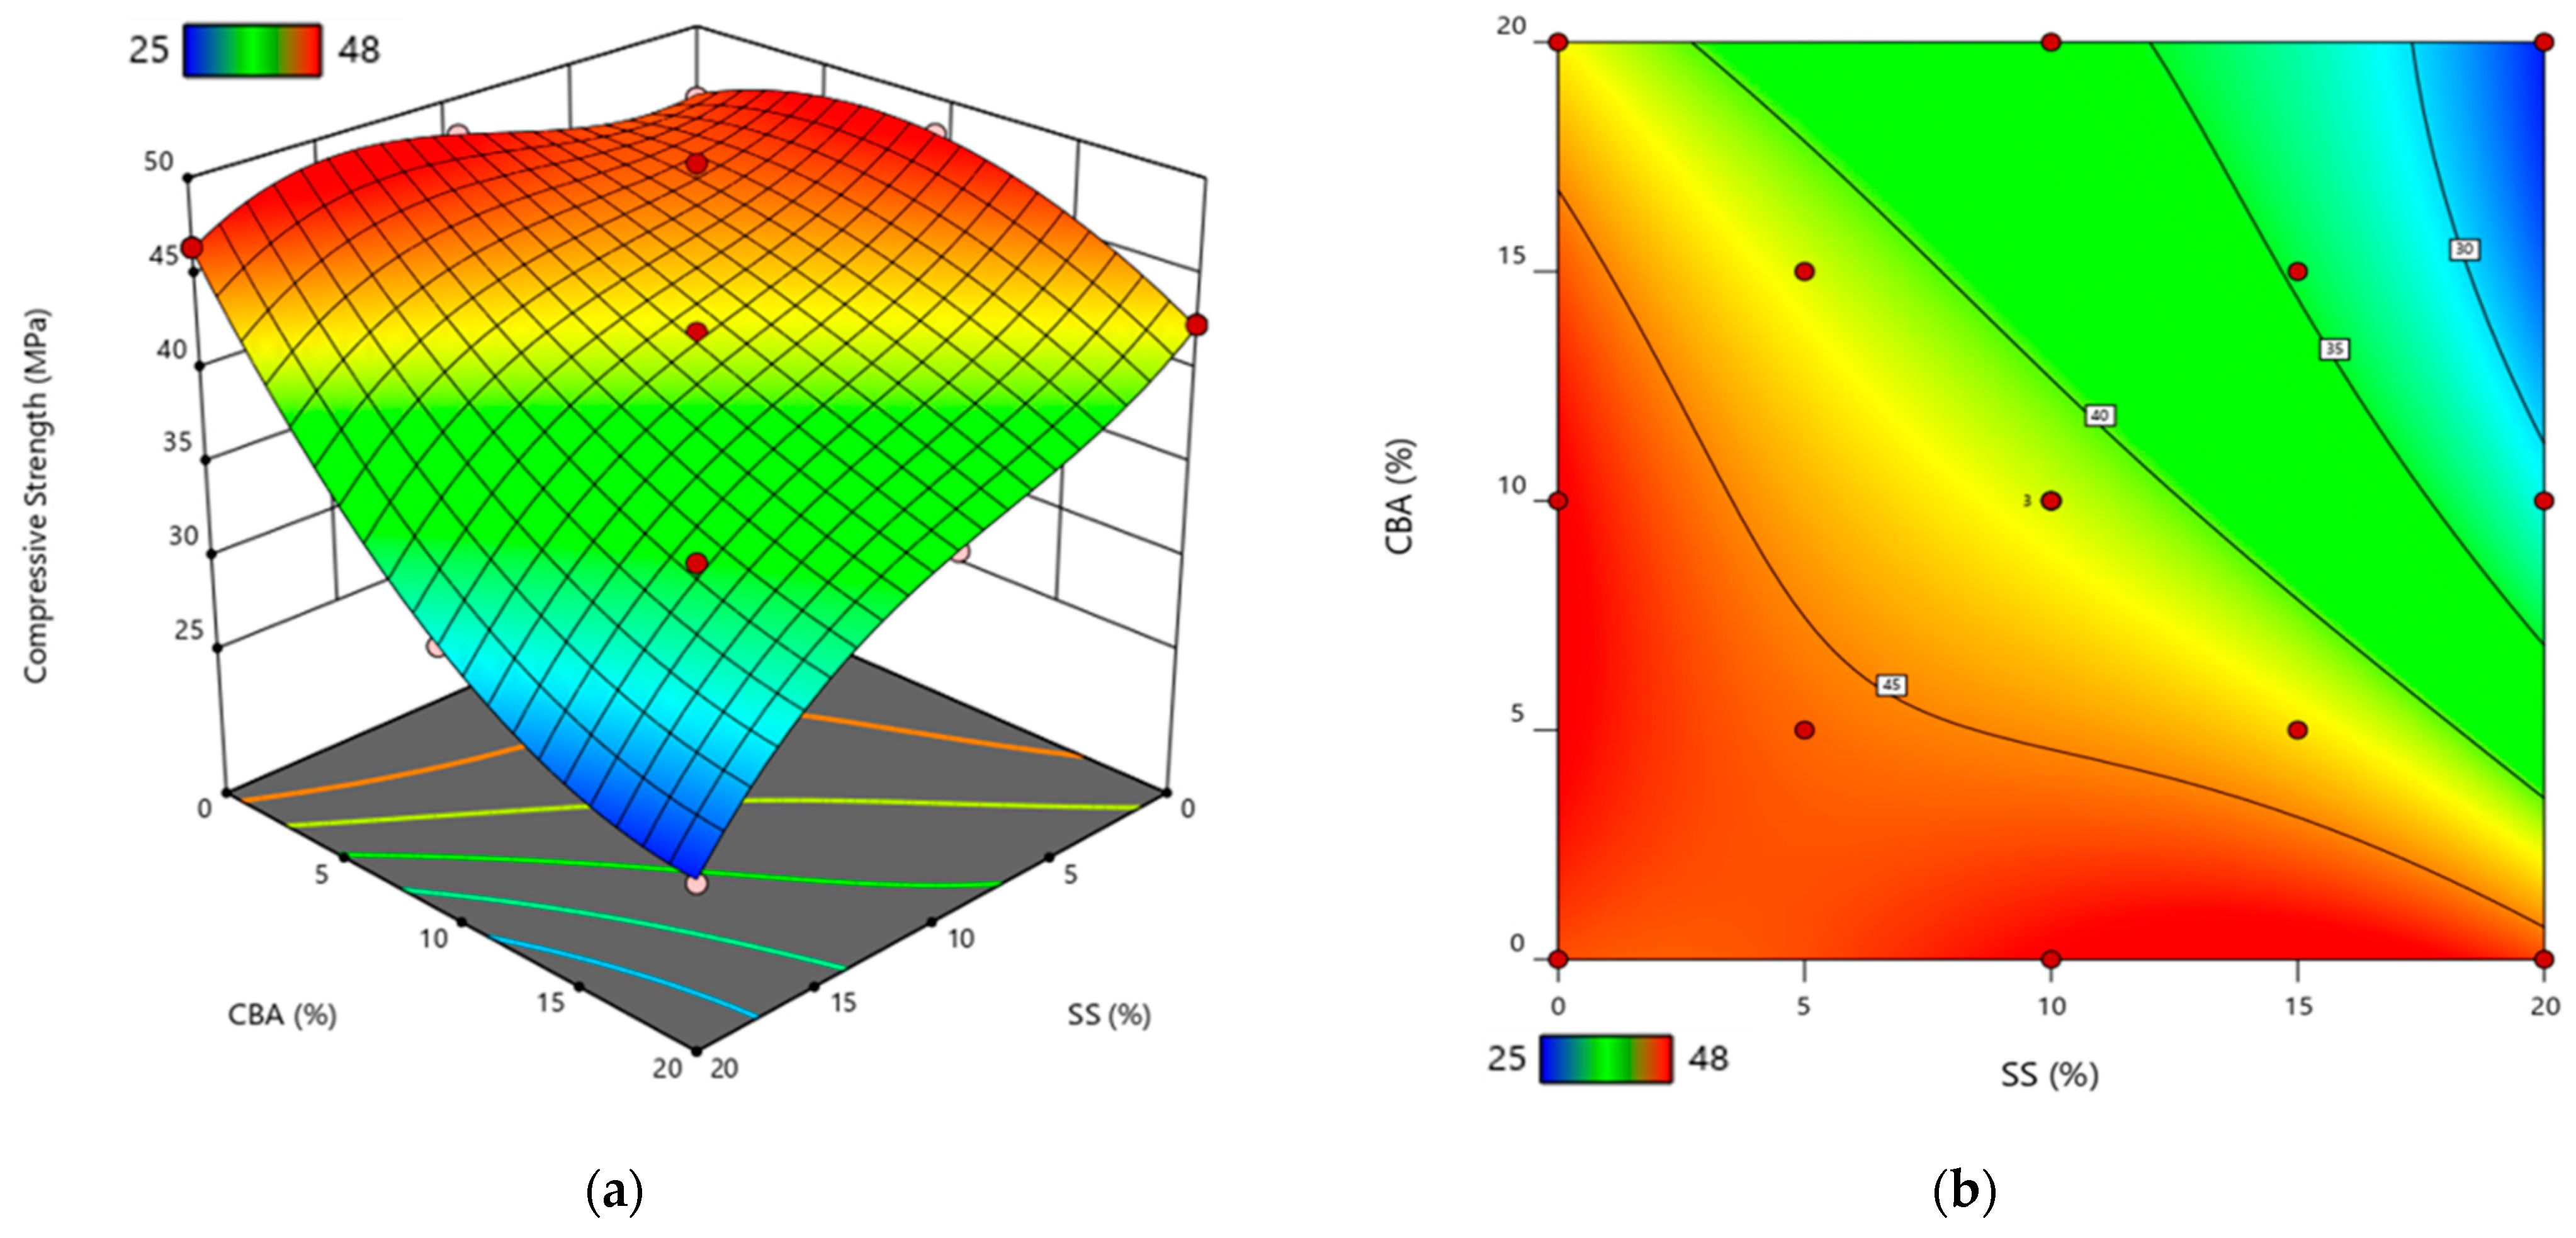
The 2D contour plots and 3D response-surface plots were established for 28-day and 91-day compressive strength with the SS and GCBA replacement ratios ranging from 0 to 20%, as shown in Figure 8 and Figure 9. Figure 8a exhibits a decreasing trend in mortar strength with the increase in the combined use of SS and GCBA. In Figure 8b, the contour lines are lightly curved in shape indicating the synergy of SS and GCBA on strength, which corresponds to the significance of X1X2 (p-value < 0.0001) in the ANOVA results. The yellowish and reddish area in the 2D plot indicates the positive effect of the combination of SS and GCBA on the mortar strength that yields the desired strength value. In the bottom left area, the red portion indicates the optimum strength value, which is higher than 40 MPa. To reach the optimum strength, the addition of SS has to be constrained to a low level (<2%), while the addition of GCBA has a relatively broad range (<10%). The bluish area, in which the SS and GCBA replacement ratios were close to 20%, indicates low strength. This may be attributed to the different chemical components between SS and GCBA. C2S and C3S are predominant in SS and contribute to the cementitious properties of SS [63]. However, the C2S and C3S in SS have a much lower activity than those in OPC [67]. Therefore, the excessive addition of SS as a cement replacement material has a negative effect on mortar strength at an early curing age. GCBA is characterized by high contents of silica, alumina, and iron oxide and resembles fly ash. Similarly, GCBA exhibits pozzolanic properties when used as a cement replacement material, which has been demonstrated by previous studies [68]. Therefore, the addition of GCBA could lead to the consumption of the calcium hydroxide generated during the hydration process of cement and subsequently form more calcium silicate hydrate gel. Both processes described above contribute to the enhancement of strength. Figure 9a exhibits a decreasing trend of 91-day strength with the addition of SS and GCBA ranging from 0 to 20%, which is similar to the findings in Figure 8a. However, it was notable that the effect of the combination of SS and GCBA at a certain level on the 91-day strength was different from that on the 28-day strength, observed at the 45 MPa contour line in Figure 9b. The reddish area, located at the bottom left of the 45 MPa contour line, indicates an excellent combination of SS and GCBA that yields the optimum strength value and presents that there are multiple combinations that can be chosen to obtain the optimum strength, such as SS at <5% with GCBA at 0–15% or GCBA at <5% with SS at 0–20%. This may be due to the synergy between the pozzolanic properties of GCBA and the low hydration rate of SS. The occurrence of the pozzolanic reaction slowly contributes to the strength enhancement. The SS also takes time to achieve sufficient hydration, which contributes to the strength enhancement. The distribution of greenish and bluish areas indicates that the SS had a predominant effect on the low strength of the mortar.

3.3. ANN

Any amount of data can be fed into the ANN for training to obtain the model when using an ANN to develop the equations between independent variables and dependent variables [69]. To rationally compare the accuracy of the RSM model and the ANN model, the data points used for establishing the ANN model were identical to the data points chosen for establishing the RSM model. Several tests were conducted before the number of neurons in the hidden layer was determined to diminish both the prediction error and the number of neurons. In this training, the number of neurons was fixed at four. In the 15 samples, 70%, 15%, and 15% were randomly chosen as the training set, validation set, and testing set, respectively, corresponding to 11, 2, and 2 samples. The equations established with the ANN are shown in Equations (13)–(18) for 28-day strength and Equations (19)–(25) for 91-day strength. The ANN training results for 28-day and 91-day strength are presented in Table 3. The R correlation coefficient obtained in the results can be regarded as a tool to evaluate the goodness of fit of the model. The R2 values were 0.9945 and 0.9968 for the 28-day and 91-day strength models (Figure 7b,d), indicating that suitable models are obtained via training using the ANN method [70].
Y28-day = −0.38984786423722079 × (1 + EXP(−H1)) − 0.20333385083634439 × (1 + EXP(−H2)) + 0.28028964078571622 × (1 + EXP(−H3)) + 0.077058074000281515 × (1 + EXP(−H4)) + 0.26563479368150744 × (1 + EXP(−H5)) − 0.28809965927595271 (1 + EXP(−H6)) + 0.061474436395715364
H1 = 3.4064665945028967X1 + 1.0362070571338462X2 − 3.1620539565554004
H2 = 1.865839254832133X1 − 3.2660221384883288X2 − 2.5659212317531388
H3 = −0.91546895105038939X1 − 5.1528803988830196X2 + 2.650550936617579
H4 = −3.3702228912518177X1 + 2.6314187802728104X2 − 0.71524946136733614
H5 = −0.2747760735868473X1 − 4.3614683224676281X2 − 2.1901902042968522
H6 = 5.5345370926650848X1 − 2.099457323590793X2 + 5.049134298562219
Y91-day = −1.3492357051505848 × (1 + EXP(−H1)) + 0.35853692628865091 × (1 + EXP(−H2)) + 1.1318273719630805 × (1 + EXP(−H3)) + 0.322476186831471 × (1 + EXP(−H4)) − 0.44960365775511879 × (1 + EXP(−H5)) + 0.24216787052686281 × (1 + EXP(−H6)) + 1.440804803794753
H1 = 0.45898550951666955X1 − 0.67146813080538703X2 + 0.72462438362992398
H2 = −0.96244600443166806X1 − 5.9063556331931784X2 + 3.5165045140394424
H3 = 0.11573455229411936X1 − 2.034227159772807X2 − 2.81318542375553
H4 = −3.8258284235572315X1 − 6.036843713519831X2 − 0.68096150023437341
H5 = 2.4496596136158684X1 + 0.62426184763774639X2 − 2.5591568291666413
H6 = 4.5795935171150468X1 − 2.3477917133074659X2 + 1.8110989456538067

3.4. Validation and Comparison of RSM and ANN Models

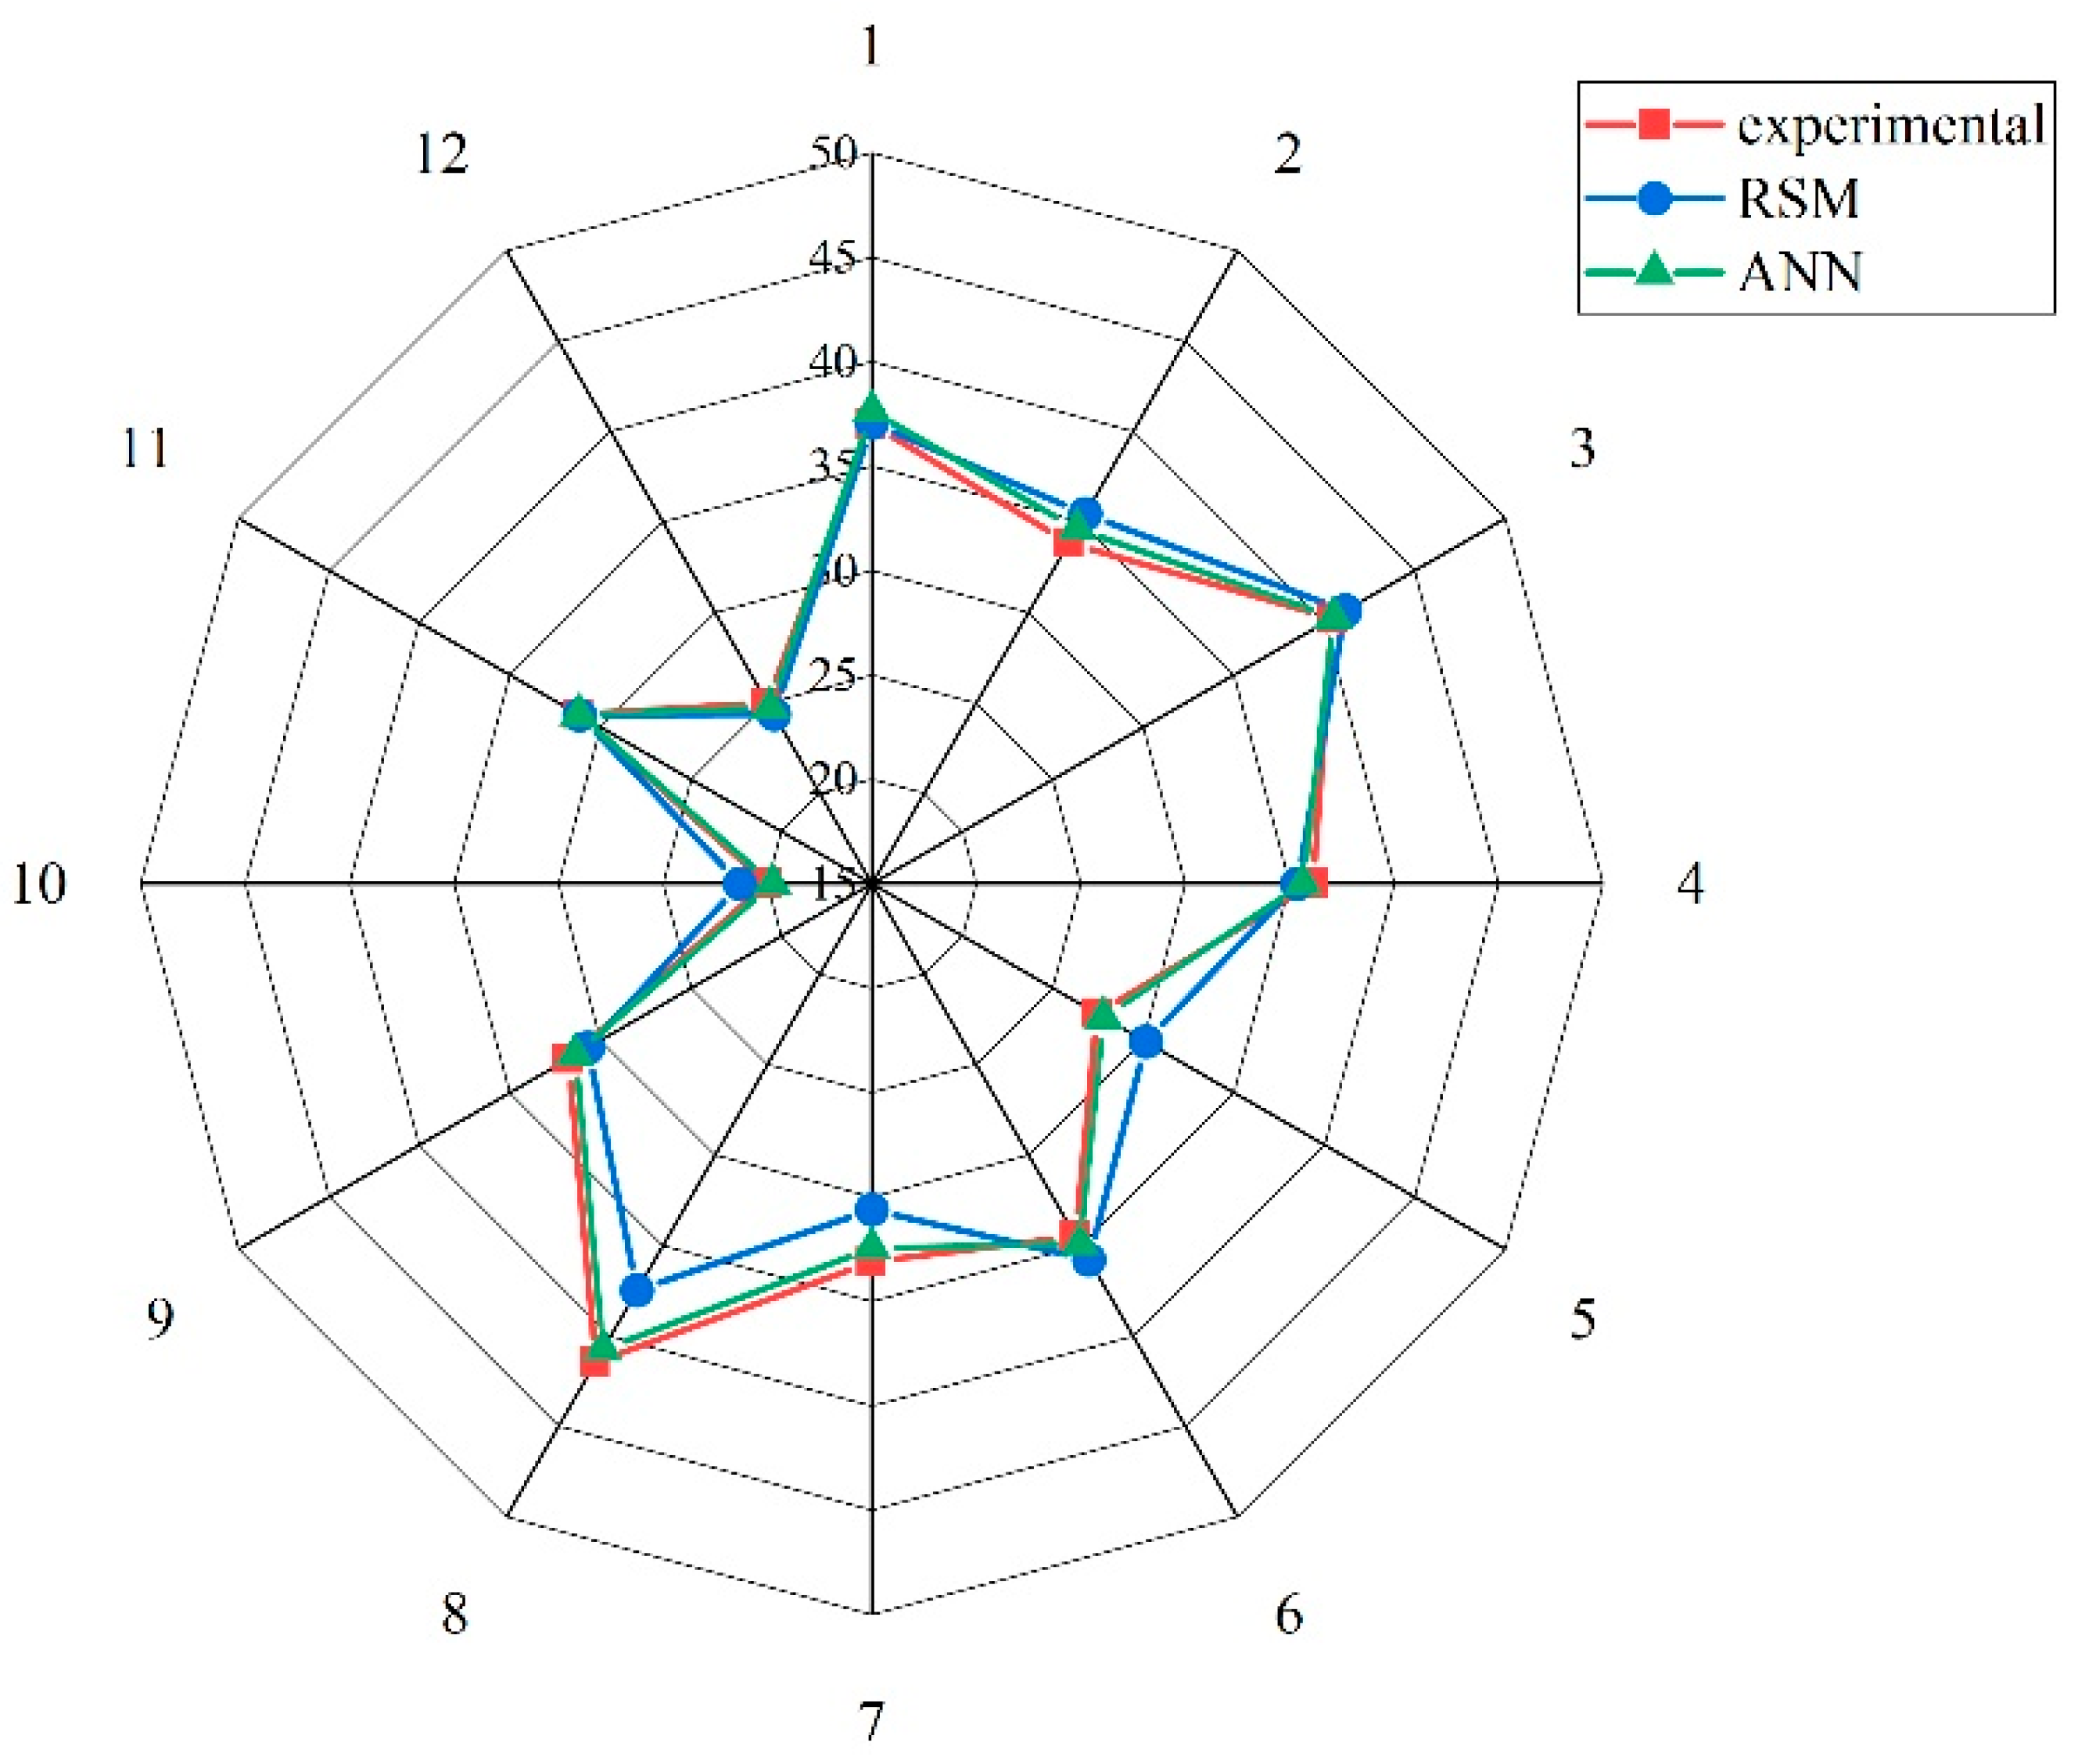
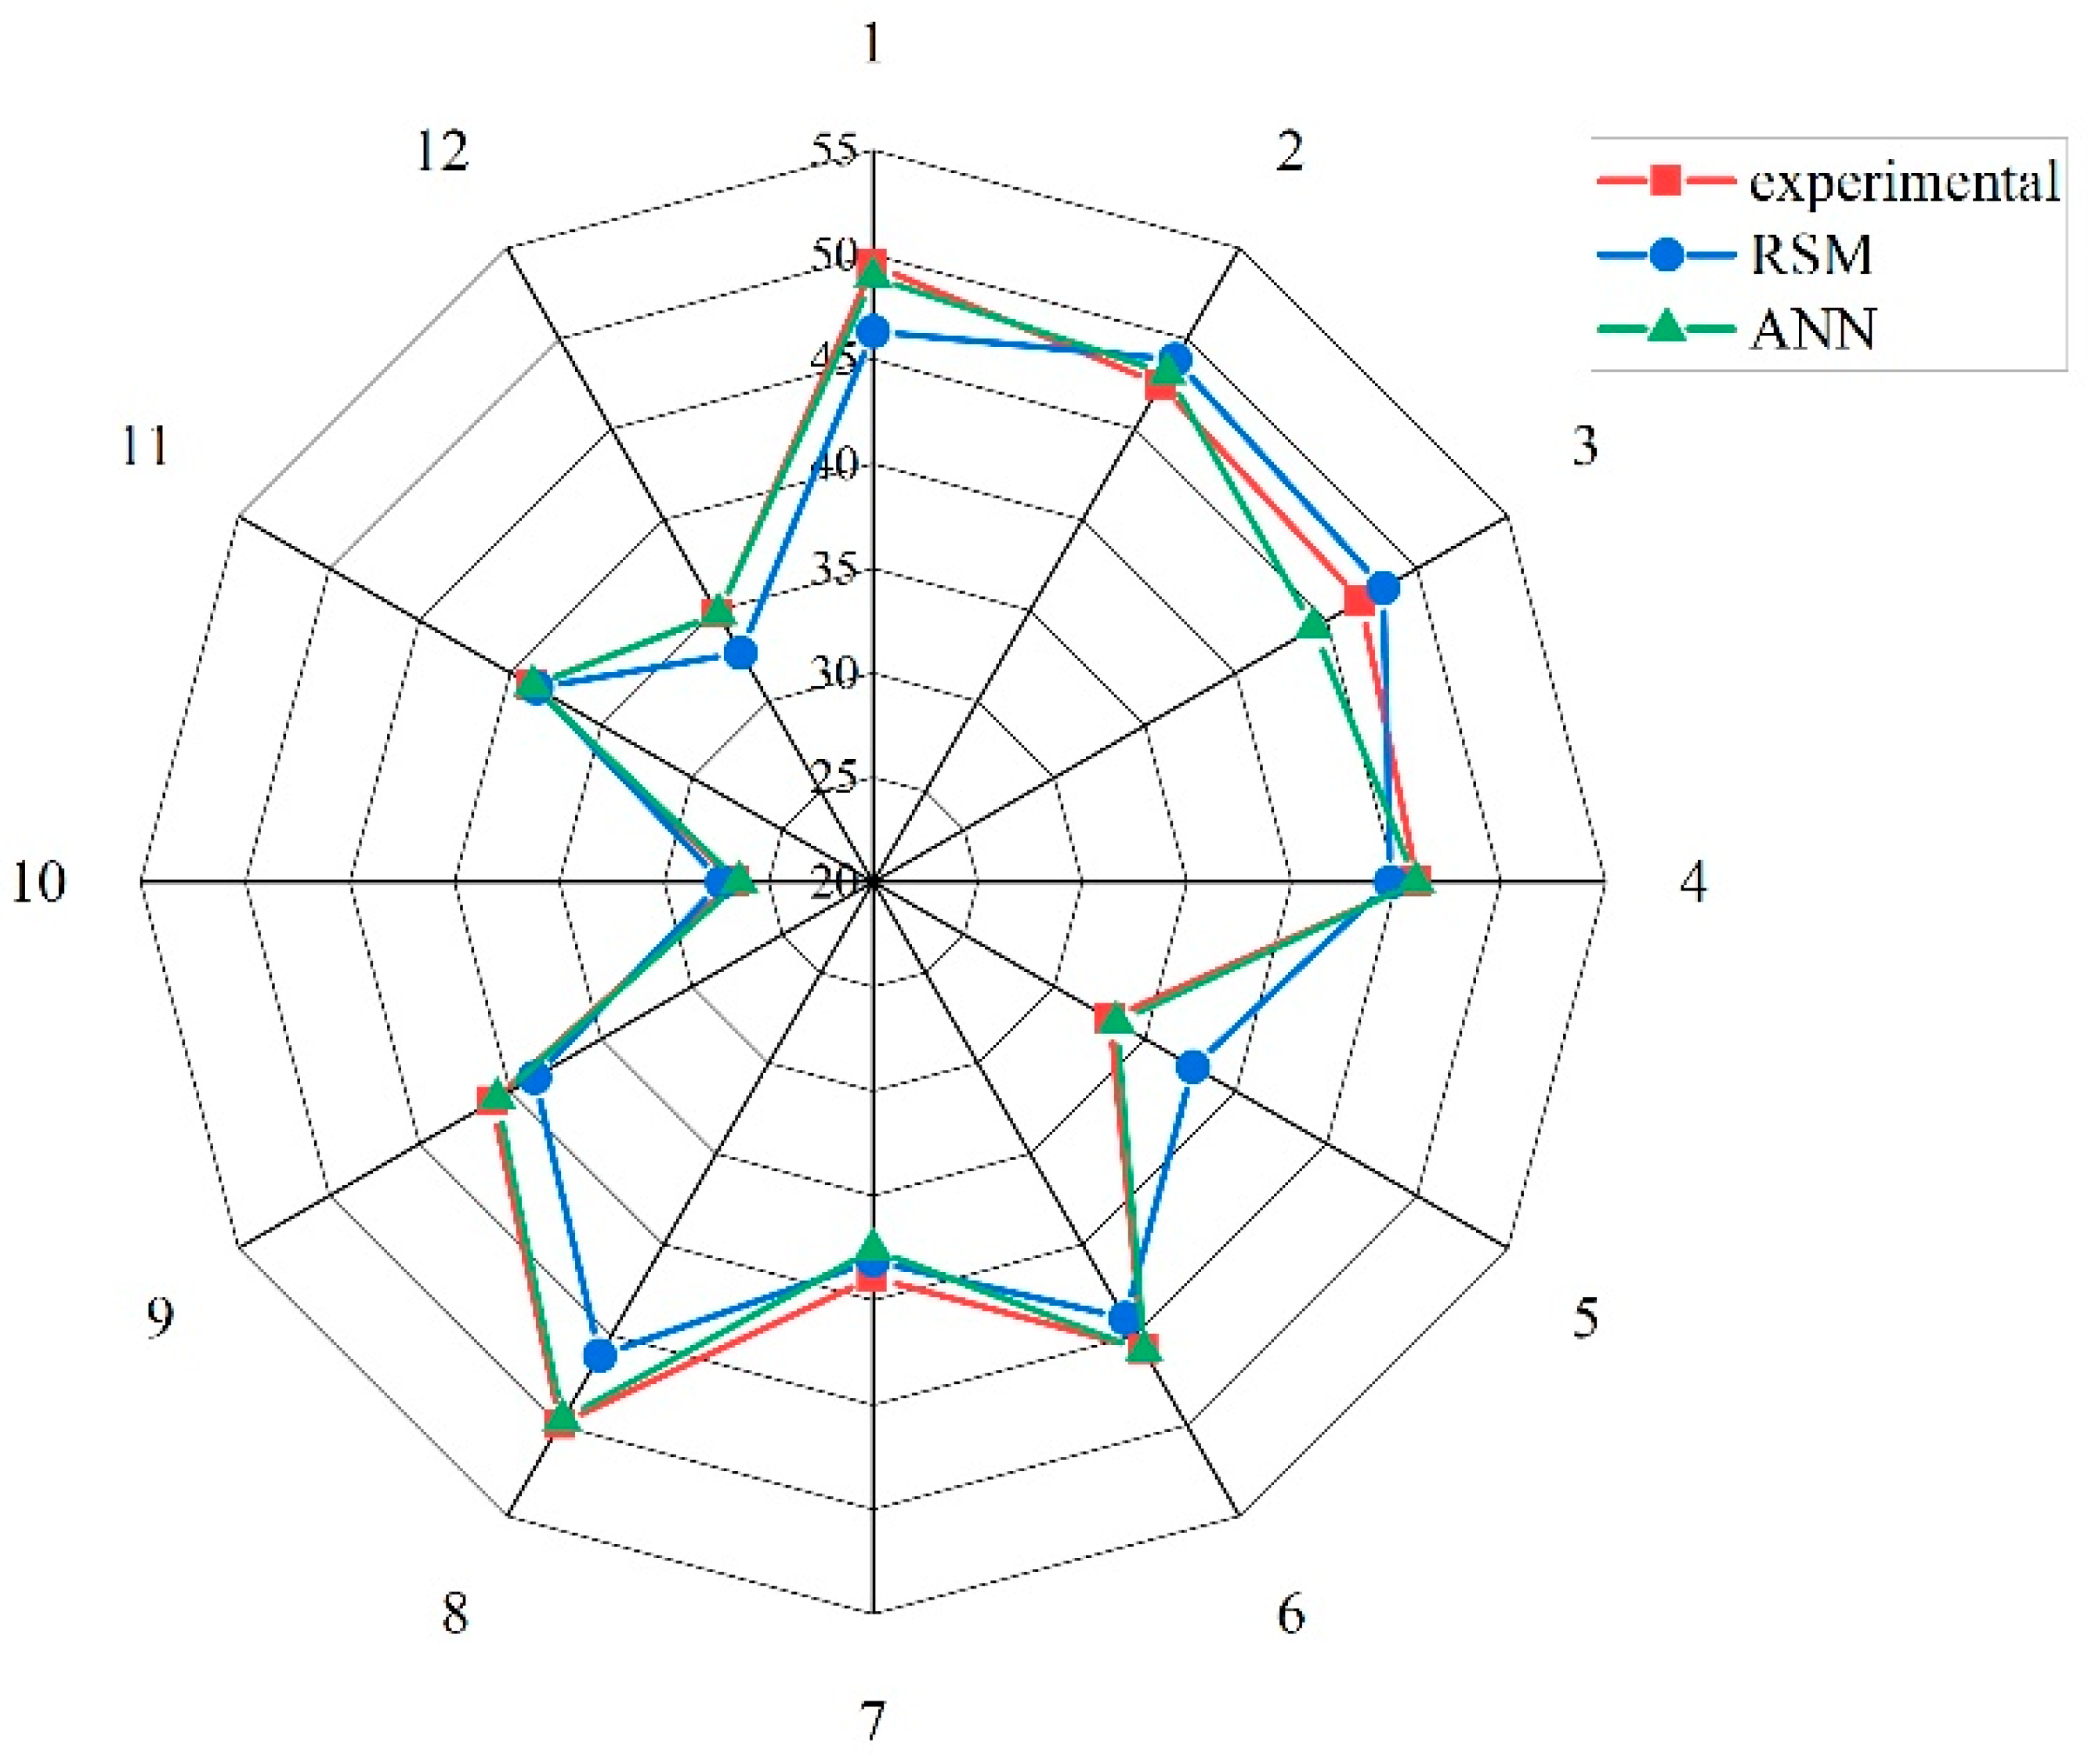
Through validation, the accuracy and goodness of fit of the established RSM and ANN models could be evaluated. The data set used for validation should be different from the data set for establishing models. Very few data have been used in the validation processes in previous studies [47]. However, this may lead to randomness concerning the accuracy and goodness of the models. In the present study, there were 12 samples used to evaluate the performance of the established RSM and ANN models. The results of the 28-day and 91-day strength predicted with the RSM and ANN models are depicted in Table 6. The radar graphs in Figure 10 and Figure 11 show the comparison between the experimental values and values predicted with RSM and ANN for 28-day and 91-day compressive strength, respectively. It can be clearly observed that the ANN-predicted values were closer to the experimental values compared to the RSM-predicted values for both of 28-day and 91-day strength. Further evidence is presented in Figure 12 and expressed by R2. The R2 was 0.9121 for the experimental values vs. RSM-predicted values (Figure 12a), and it was 0.9938 for the experimental values vs. ANN-predicted values of 28-day strength (Figure 12b). The R2 was 0.9012 for the experimental values vs. RSM-predicted values (Figure 12c), and it was 0.9866 for the experimental values vs. ANN-predicted values (Figure 12d) for 91-day strength. The ANN demonstrates a better performance compared to RSM, as evidenced by lower values of RMSE, MSE, χ2, MAE, and SEP for the ANN in Table 7. This indicates that ANN models exhibit less deviation in their predictions, which can be seen in Figure 10 and Figure 11, reflecting better data fitting and greater accuracy than RSM.

4. Conclusions

In this study, SS and GCBA were utilized to replace OPC for manufacturing ternary blended cement mortar. A total of 25 mixes were designed to investigate the effect of the combination of SS and GCBA on the 28-day and 91-day compressive strength. RSM and an ANN were employed to explore the relationship between the contents of SS and GCBA in ternary blended cement mortar and strength at different curing ages. The major conclusions are listed as follows:
(a)
At each fixed GCBA level, the increase in the SS content led to a reduction in the 28-day and 91-day strength. Similarly, at each fixed SS level, the increase in GCBA content led to a decrease in strength. By comparing the strength reduction, it was determined that the addition of GCBA had a less negative effect at a low SS content level compared to a high SS content level. However, the use of individual SCMs enhanced mortar strength with 5% of SS and 15% of GCBA, respectively.
(b)
Prolonging the curing age resulted in the strength enhancement of each mix, demonstrating that the combined use of SS and GCBA did not have a negative effect on strength.
(c)
A set of data consisting of 15 data points was used to establish an RSM model of 28-day and 91-day strength. According to the ANOVA analysis, the R2 values of 0.9979 and 0.9954 for the 28-day and 91-day strength models indicate that the obtained models were well-fitted with the experimental data. The predicted R2 of 0.9688 and 0.9633 for the 28-day and 91-day strength models implies a good performance in prediction.
(d)
By analyzing the 3D response-surface plots and 2D contour plots of 28-day and 91-day strength, it was found that the synergy between the pozzolanic properties of GCBA and the low hydration rate of SS resulted in a difference in the strength distribution at the 28-day and 91-day curing ages.
(e)
A set of data consisting of 12 data points was used for validating the performance of the RSM models and ANN models by comparing the R2 of experimental values vs. RSM-predicted values and experimental values vs. ANN-predicted values. The higher R2 value indicates that the ANN has a better performance in the strength prediction of 28-day and 91-day strength.

5. Recommendations

(a)
It is recommended that future studies incorporate comprehensive chemical analyses of GCBA and SS to establish a clearer understanding of their compositions and reactivity.
(b)
The application of advanced machine-learning algorithms should be considered to refine predictive models of the mechanical properties of ternary blended mortars.
(c)
Future research could investigate a broader spectrum of replacement ratios beyond the 0% to 40% range used in this study. Investigating higher replacement ratios could provide valuable information on the point of diminishing returns regarding strength and performance criteria.
(d)
Long-term studies examining the durability and degradation of ternary blended mortars over time under various environmental conditions should also be investigated. This will help to assess the longevity and resilience of using GCBA and SS as supplementary cementitious materials.

Author Contributions

X.L.: Conceptualization, writing—original draft, methodology, investigation, data curation, formal analysis; C.M.H.: Writing—review and editing, methodology, validation; S.I.D.: Writing—review and editing, resources, project administration, funding acquisition; M.I.A.B.: Writing—review and editing, supervision, data curation; Q.M.: Resources; D.Z.: Writing—review and editing; R.L.: Writing—review and editing. All authors have read and agreed to the published version of the manuscript.

Funding

The work was financially supported by the University of Malaysia Pahang Al-Sultan Abdullah under the Postgraduate Research Scheme (PGRS200376), and the Science and Technology Program of the Inner Mongolia Autonomous Region, China (2022YFHH0044).

Data Availability Statement

Data will be made available on request.

Conflicts of Interest

Xiaofeng Li, Dan Zhao and Rusong Liu are employed by the China Hebei Construction and Geotechnical Investigation Group Limited. The remaining authors declare that the research was conducted in the absence of any commercial or financial relationships that could be construed as a potential conflict of interest.

References

  1. US Geological Survey. Mineral Commodity Summaries; US Geological Survey: Reston, VA, USA, 2022. Available online: https://pubs.usgs.gov/publication/mcs2022 (accessed on 31 January 2022).
  2. He, Z.; Zhu, X.; Wang, J.; Mu, M.; Wang, Y. Comparison of CO2 emissions from OPC and recycled cement production. Constr. Build. Mater. 2019, 211, 965–973. [Google Scholar] [CrossRef]
  3. Naqi, A.; Jang, J.G. Recent progress in green cement technology utilizing low-carbon emission fuels and raw materials: A review. Sustainability 2019, 11, 537. [Google Scholar] [CrossRef]
  4. Nie, S.; Zhou, J.; Yang, F.; Lan, M.; Li, J.; Zhang, Z.; Chen, Z.; Xu, M.; Li, H.; Sanjayan, J.G. Analysis of theoretical carbon dioxide emissions from cement production: Methodology and application. J. Clean. Prod. 2022, 334, 130270. [Google Scholar] [CrossRef]
  5. Pavlíková, M.; Zemanová, L.; Záleská, M.; Pokorný, J.; Lojka, M.; Jankovský, O.; Pavlík, Z. Ternary blended binder for production of a novel type of lightweight repair mortar. Materials 2019, 12, 996. [Google Scholar] [CrossRef] [PubMed]
  6. Hamada, H.M.; Al-Attar, A.; Shi, J.; Yahaya, F.; Al Jawahery, M.S.; Yousif, S.T. Optimization of sustainable concrete characteristics incorporating palm oil clinker and nano-palm oil fuel ash using response surface methodology. Powder Technol. 2023, 413, 118054. [Google Scholar] [CrossRef]
  7. Raghav, M.; Park, T.; Yang, H.-M.; Lee, S.-Y.; Karthick, S.; Lee, H.-S. Review of the effects of supplementary cementitious materials and chemical additives on the physical, mechanical and durability properties of hydraulic concrete. Materials 2021, 14, 7270. [Google Scholar] [CrossRef]
  8. Aydın, S. A ternary optimisation of mineral additives of alkali activated cement mortars. Constr. Build. Mater. 2013, 43, 131–138. [Google Scholar] [CrossRef]
  9. Shubbar, A.A.; Jafer, H.; Dulaimi, A.; Hashim, K.; Atherton, W.; Sadique, M. The development of a low carbon binder produced from the ternary blending of cement, ground granulated blast furnace slag and high calcium fly ash: An experimental and statistical approach. Constr. Build. Mater. 2018, 187, 1051–1060. [Google Scholar] [CrossRef]
  10. Özkan, Ö.; Yüksel, I.; Muratoğlu, Ö. Strength properties of concrete incorporating coal bottom ash and granulated blast furnace slag. Waste Manag. 2007, 27, 161–167. [Google Scholar] [CrossRef]
  11. Chen, J.; Ng, P.L.; Chu, S.; Guan, G.; Kwan, A. Ternary blending with metakaolin and silica fume to improve packing density and performance of binder paste. Constr. Build. Mater. 2020, 252, 119031. [Google Scholar] [CrossRef]
  12. Kumar, R.; Shafiq, N.; Kumar, A.; Jhatial, A.A. Investigating embodied carbon, mechanical properties, and durability of high-performance concrete using ternary and quaternary blends of metakaolin, nano-silica, and fly ash. Environ. Sci. Pollut. Res. 2021, 28, 49074–49088. [Google Scholar] [CrossRef] [PubMed]
  13. Vance, K.; Kumar, A.; Sant, G.; Neithalath, N. The rheological properties of ternary binders containing Portland cement, limestone, and metakaolin or fly ash. Cem. Concr. Res. 2013, 52, 196–207. [Google Scholar] [CrossRef]
  14. Cheah, C.B.; Liew, J.J.; Le Ping, K.K.; Siddique, R.; Tangchirapat, W. Properties of ternary blended cement containing ground granulated blast furnace slag and ground coal bottom ash. Constr. Build. Mater. 2022, 315, 125249. [Google Scholar] [CrossRef]
  15. Izadifar, M.; Ukrainczyk, N.; Koenders, E. Atomistic Insights into Silicate Dissolution of Metakaolinite under Alkaline Conditions: Ab Initio Quantum Mechanical Investigation. Langmuir 2024, 40, 19332–19342. [Google Scholar] [CrossRef] [PubMed]
  16. Sekkal, W.; Izadifar, M.; Zaoui, A.; Ukrainczyk, N.; Koenders, E. Theoretical investigation of protective graphene-coated metakaolin geopolymer interface under moisture and chemical composition effects. Powder Technol. 2023, 430, 119007. [Google Scholar] [CrossRef]
  17. Alani, A.H.; Johari, M.A.M.; Aldahdooh, M.; Muhamad Bunnori, N. Development of engineering and transport properties of green high strength concrete utilizing ternary blended binders. Eur. J. Environ. Civil Eng. 2021, 25, 1251–1267. [Google Scholar] [CrossRef]
  18. Juenger, M.C.; Snellings, R.; Bernal, S.A. Supplementary cementitious materials: New sources, characterization, and performance insights. Cem. Concr. Res. 2019, 122, 257–273. [Google Scholar] [CrossRef]
  19. Talefirouz, D. Use of Granulated Blast Furnace Slag, Steel slag and Fly Ash in Cement Bentonite Slurry Wall Construction. Master’s Thesis, Middle East Technical University, Ankara, Turkey, 2013. [Google Scholar]
  20. Martins, A.C.P.; De Carvalho, J.M.F.; Costa, L.C.B.; Andrade, H.D.; de Melo, T.V.; Ribeiro, J.C.L.; Pedroti, L.G.; Peixoto, R.A.F. Steel slags in cement-based composites: An ultimate review on characterization, applications and performance. Constr. Build. Mater. 2021, 291, 123265. [Google Scholar] [CrossRef]
  21. Gao, D.; Wang, F.-P.; Wang, Y.-T.; Zeng, Y.-N. Sustainable utilization of steel slag from traditional industry and agriculture to catalysis. Sustainability 2020, 12, 9295. [Google Scholar] [CrossRef]
  22. Reddy, K.R.; Gopakumar, A.; Chetri, J.K. Critical review of applications of iron and steel slags for carbon sequestration and environmental remediation. Rev. Environ. Sci. Bio/Technol. 2019, 18, 127–152. [Google Scholar] [CrossRef]
  23. Yüksel, İ. A review of steel slag usage in construction industry for sustainable development. Environ. Dev. Sustain. 2017, 19, 369–384. [Google Scholar] [CrossRef]
  24. Hu, R.; Xie, J.; Wu, S.; Yang, C.; Yang, D. Study of toxicity assessment of heavy metals from steel slag and its asphalt mixture. Materials 2020, 13, 2768. [Google Scholar] [CrossRef] [PubMed]
  25. Navarro, C.; Díaz, M.; Villa-García, M.A. Physico-chemical characterization of steel slag. Study of its behavior under simulated environmental conditions. Environ. Sci. Technol. 2010, 44, 5383–5388. [Google Scholar] [CrossRef]
  26. Rosales, J.; Cabrera, M.; Agrela, F. Effect of stainless steel slag waste as a replacement for cement in mortars. Mechanical and statistical study. Build. Mater. 2017, 142, 444–458. [Google Scholar] [CrossRef]
  27. Saly, F.; Guo, L.; Ma, R.; Gu, C.; Sun, W. Properties of steel slag and stainless steel slag as cement replacement materials: A comparative study. J. Wuhan Univ. Technol. Mater. Sci. Ed. 2018, 33, 1444–1451. [Google Scholar] [CrossRef]
  28. Wang, Q.; Yang, J.; Yan, P. Cementitious properties of super-fine steel slag. Powder Technol. 2013, 245, 35–39. [Google Scholar] [CrossRef]
  29. Palod, R.; Deo, S.; Ramtekkar, G. Effect on mechanical performance, early age shrinkage and electrical resistivity of ternary blended concrete containing blast furnace slag and steel slag. Mater. Today Proc. 2020, 32, 917–922. [Google Scholar] [CrossRef]
  30. Li, X.; Doh, S.; Ho, C.; Jing, G.; Ashraf, T. The investigation on properties of sodium sulfate-activated mortar incorporating steel slag with various replacement ratio and particle size. Phys. Chem. Earth Parts A/B/C 2022, 128, 103241. [Google Scholar] [CrossRef]
  31. Zhao, J.; Wang, D.; Yan, P. Design and experimental study of a ternary blended cement containing high volume steel slag and blast-furnace slag based on Fuller distribution model. Constr. Build. Mater. 2017, 140, 248–256. [Google Scholar] [CrossRef]
  32. Liao, Y.; Jiang, G.; Wang, K.; Al Qunaynah, S.; Yuan, W. Effect of steel slag on the hydration and strength development of calcium sulfoaluminate cement. Constr. Build. Mater. 2020, 265, 120301. [Google Scholar] [CrossRef]
  33. Roslan, N.H.; Ismail, M.; Abdul-Majid, Z.; Ghoreishiamiri, S.; Muhammad, B. Performance of steel slag and steel sludge in concrete. Constr. Build. Mater. 2016, 104, 16–24. [Google Scholar] [CrossRef]
  34. Singh, N.; Bhardwaj, A. Reviewing the role of coal bottom ash as an alternative of cement. Constr. Build. Mater. 2020, 233, 117276. [Google Scholar] [CrossRef]
  35. Heidrich, C.; Feuerborn, H.-J.; Weir, A. Coal combustion products: A global perspective. In Proceedings of the World of Coal Ash Conference, Lexington, KY, USA, 24 April 2013; Volume 22, p. 25. [Google Scholar]
  36. Kim, H.-K. Utilization of sieved and ground coal bottom ash powders as a coarse binder in high-strength mortar to improve workability. Constr. Build. Mater. 2015, 91, 57–64. [Google Scholar] [CrossRef]
  37. Mangi, S.A.; Ibrahim, M.W.; Jamaluddin, N.; Arshad, M.; Ramadhansyah, P. Effects of ground coal bottom ash on the properties of concrete. J. Eng. Sci. Technol. 2019, 14, 338–350. [Google Scholar]
  38. Ibrahim, M.W.; Hamzah, A.; Jamaluddin, N.; Ramadhansyah, P.; Fadzil, A. Split tensile strength on self-compacting concrete containing coal bottom ash. Procedia Soc. Behav. Sci. 2015, 195, 2280–2289. [Google Scholar] [CrossRef]
  39. Rafieizonooz, M.; Mirza, J.; Salim, M.R.; Hussin, M.W.; Khankhaje, E. Investigation of coal bottom ash and fly ash in concrete as replacement for sand and cement. Constr. Build. Mater. 2016, 116, 15–24. [Google Scholar] [CrossRef]
  40. Poudel, S.; Menda, S.; Useldinger-Hoefs, J.; Guteta, L.E.; Dockter, B.; Gedafa, D.S. The Use of Ground Coal Bottom Ash/Slag as a Cement Replacement for Sustainable Concrete Infrastructure. Materials 2024, 17, 2316. [Google Scholar] [CrossRef]
  41. Khan, R.A.; Ganesh, A. The effect of coal bottom ash (CBA) on mechanical and durability characteristics of concrete. J. Build. Mater. Struct. 2016, 3, 31–42. [Google Scholar] [CrossRef]
  42. Kasaniya, M.; Thomas, M.D.; Moffatt, E.G. Pozzolanic reactivity of natural pozzolans, ground glasses and coal bottom ashes and implication of their incorporation on the chloride permeability of concrete. Cem. Concr. Res. 2021, 139, 106259. [Google Scholar] [CrossRef]
  43. Abdulmatin, A.; Tangchirapat, W.; Jaturapitakkul, C. An investigation of bottom ash as a pozzolanic material. Constr. Build. Mater. 2018, 186, 155–162. [Google Scholar] [CrossRef]
  44. Hashemi, S.S.G.; Mahmud, H.B.; Djobo, J.N.Y.; Tan, C.G.; Ang, B.C.; Ranjbar, N. Microstructural characterization and mechanical properties of bottom ash mortar. J. Clean. Prod. 2018, 170, 797–804. [Google Scholar] [CrossRef]
  45. Habibi, A.; Ramezanianpour, A.M.; Mahdikhani, M.; Bamshad, O. RSM-based evaluation of mechanical and durability properties of recycled aggregate concrete containing GGBFS and silica fume. Constr. Build. Mater. 2021, 270, 121431. [Google Scholar] [CrossRef]
  46. Hammoudi, A.; Moussaceb, K.; Belebchouche, C.; Dahmoune, F. Comparison of artificial neural network (ANN) and response surface methodology (RSM) prediction in compressive strength of recycled concrete aggregates. Constr. Build. Mater. 2019, 209, 425–436. [Google Scholar] [CrossRef]
  47. Vishnupriyan, M.; Annadurai, R. A study on the macro-properties of PCB fiber-reinforced concrete from recycled electronic waste and validation of results using RSM and ANN. Asian J. Civil Eng. 2023, 24, 1667–1680. [Google Scholar] [CrossRef]
  48. Li, Z.; Lu, D.; Gao, X. Optimization of mixture proportions by statistical experimental design using response surface method—A review. J. Build. Eng. 2021, 36, 102101. [Google Scholar] [CrossRef]
  49. Poorarbabi, A.; Ghasemi, M.; Moghaddam, M.A. Concrete compressive strength prediction using non-destructive tests through response surface methodology. Ain Shams Eng. J. 2020, 11, 939–949. [Google Scholar] [CrossRef]
  50. Wang, X.; Wu, D.; Zhang, J.; Yu, R.; Hou, D.; Shui, Z. Design of sustainable ultra-high performance concrete: A review. Constr. Build. Mater. 2021, 307, 124643. [Google Scholar] [CrossRef]
  51. Ho, C.; Doh, S.; Li, X.; Chin, S.; Ashraf, T. RSM-based modelling of cement mortar with various water to cement ratio and steel slag content. Phys. Chem. Earth Parts A/B/C 2022, 128, 103256. [Google Scholar] [CrossRef]
  52. Moein, M.M.; Saradar, A.; Rahmati, K.; Mousavinejad, S.H.G.; Bristow, J.; Aramali, V.; Karakouzian, M. Predictive models for concrete properties using machine learning and deep learning approaches: A review. J. Build. Eng. 2023, 63, 105444. [Google Scholar] [CrossRef]
  53. Dabbaghi, F.; Rashidi, M.; Nehdi, M.L.; Sadeghi, H.; Karimaei, M.; Rasekh, H.; Qaderi, F. Experimental and informational modeling study on flexural strength of eco-friendly concrete incorporating coal waste. Sustainability 2021, 13, 7506. [Google Scholar] [CrossRef]
  54. Awolusi, T.; Oke, O.; Akinkurolere, O.; Sojobi, A. Application of response surface methodology: Predicting and optimizing the properties of concrete containing steel fibre extracted from waste tires with limestone powder as filler. Case Stud. Constr. Mater. 2019, 10, e00212. [Google Scholar] [CrossRef]
  55. BS EN 197-1:2011; Methods of Testing Composition, Specifications and Conformity Criteria for Common Cements. BSI: London, UK, 2011.
  56. BS EN 12620:2013; Aggregates for Concrete. BSI: London, UK, 2013.
  57. Argiz, C.; Sanjuán, M.Á.; Menéndez, E. Coal bottom ash for Portland cement production. Adv. Mater. Sci. Eng. 2017, 2017, 6068286. [Google Scholar] [CrossRef]
  58. Jing, W.; Jiang, J.; Ding, S.; Duan, P. Hydration and Microstructure of Steel Slag as Cementitious Material and Fine Aggregate in Mortar. Molecules 2020, 25, 4456. [Google Scholar] [CrossRef] [PubMed]
  59. Wang, Y.; Suraneni, P. Experimental methods to determine the feasibility of steel slags as supplementary cementitious materials. Constr. Build. Mater. 2019, 204, 458–467. [Google Scholar] [CrossRef]
  60. Ray, S.; Haque, M.; Ahmed, T.; Nahin, T.T. Comparison of artificial neural network (ANN) and response surface methodology (RSM) in predicting the compressive and splitting tensile strength of concrete prepared with glass waste and tin (Sn) can fiber. J. King Saud Univ. Eng. Sci. 2023, 35, 185–199. [Google Scholar] [CrossRef]
  61. Shi, C. Steel slag—Its production, processing, characteristics, and cementitious properties. J. Mater. Civ. Eng. 2004, 16, 230–236. [Google Scholar] [CrossRef]
  62. Yildirim, I.Z.; Prezzi, M. Chemical, mineralogical, and morphological properties of steel slag. Adv. Civ. Eng. 2011, 2011, 463638. [Google Scholar] [CrossRef]
  63. Wang, Q.; Yan, P.; Feng, J. A discussion on improving hydration activity of steel slag by altering its mineral compositions. J. Hazard. Mater. 2011, 186, 1070–1075. [Google Scholar] [CrossRef]
  64. Khongpermgoson, P.; Boonlao, K.; Ananthanet, N.; Thitithananon, T.; Jaturapitakkul, C.; Tangchirapat, W.; Ban, C.C. The mechanical properties and heat development behavior of high strength concrete containing high fineness coal bottom ash as a pozzolanic binder. Constr. Build. Mater. 2020, 253, 119239. [Google Scholar] [CrossRef]
  65. Menéndez, E.; Argiz, C.; Sanjuán, M.Á. Reactivity of ground coal bottom ash to be used in Portland cement. J 2021, 4, 223–232. [Google Scholar] [CrossRef]
  66. Dahmoune, F.; Remini, H.; Dairi, S.; Aoun, O.; Moussi, K.; Bouaoudia-Madi, N.; Adjeroud, N.; Kadri, N.; Lefsih, K.; Boughani, L. Ultrasound assisted extraction of phenolic compounds from P. lentiscus L. leaves: Comparative study of artificial neural network (ANN) versus degree of experiment for prediction ability of phenolic compounds recovery. Ind. Crops Prod. 2015, 77, 251–261. [Google Scholar] [CrossRef]
  67. Wang, Q.; Yan, P. Hydration properties of basic oxygen furnace steel slag. Constr. Build. Mater. 2010, 24, 1134–1140. [Google Scholar] [CrossRef]
  68. Al Biajawi, M.I.; Embong, R.; Muthusamy, K.; Ismail, N.; Obianyo, I.I. Recycled coal bottom ash as sustainable materials for cement replacement in cementitious Composites: A review. Constr. Build. Mater. 2022, 338, 127624. [Google Scholar] [CrossRef]
  69. Paquin, F.; Rivnay, J.; Salleo, A.; Stingelin, N.; Silva, C. Multi-phase semicrystalline microstructures drive exciton dissociation in neat plastic semiconductors. arXiv 2013, arXiv:1310.8002. [Google Scholar]
  70. Kursuncu, B.; Gencel, O.; Bayraktar, O.Y.; Shi, J.; Nematzadeh, M.; Kaplan, G. Optimization of foam concrete characteristics using response surface methodology and artificial neural networks. Constr. Build. Mater. 2022, 337, 127575. [Google Scholar] [CrossRef]
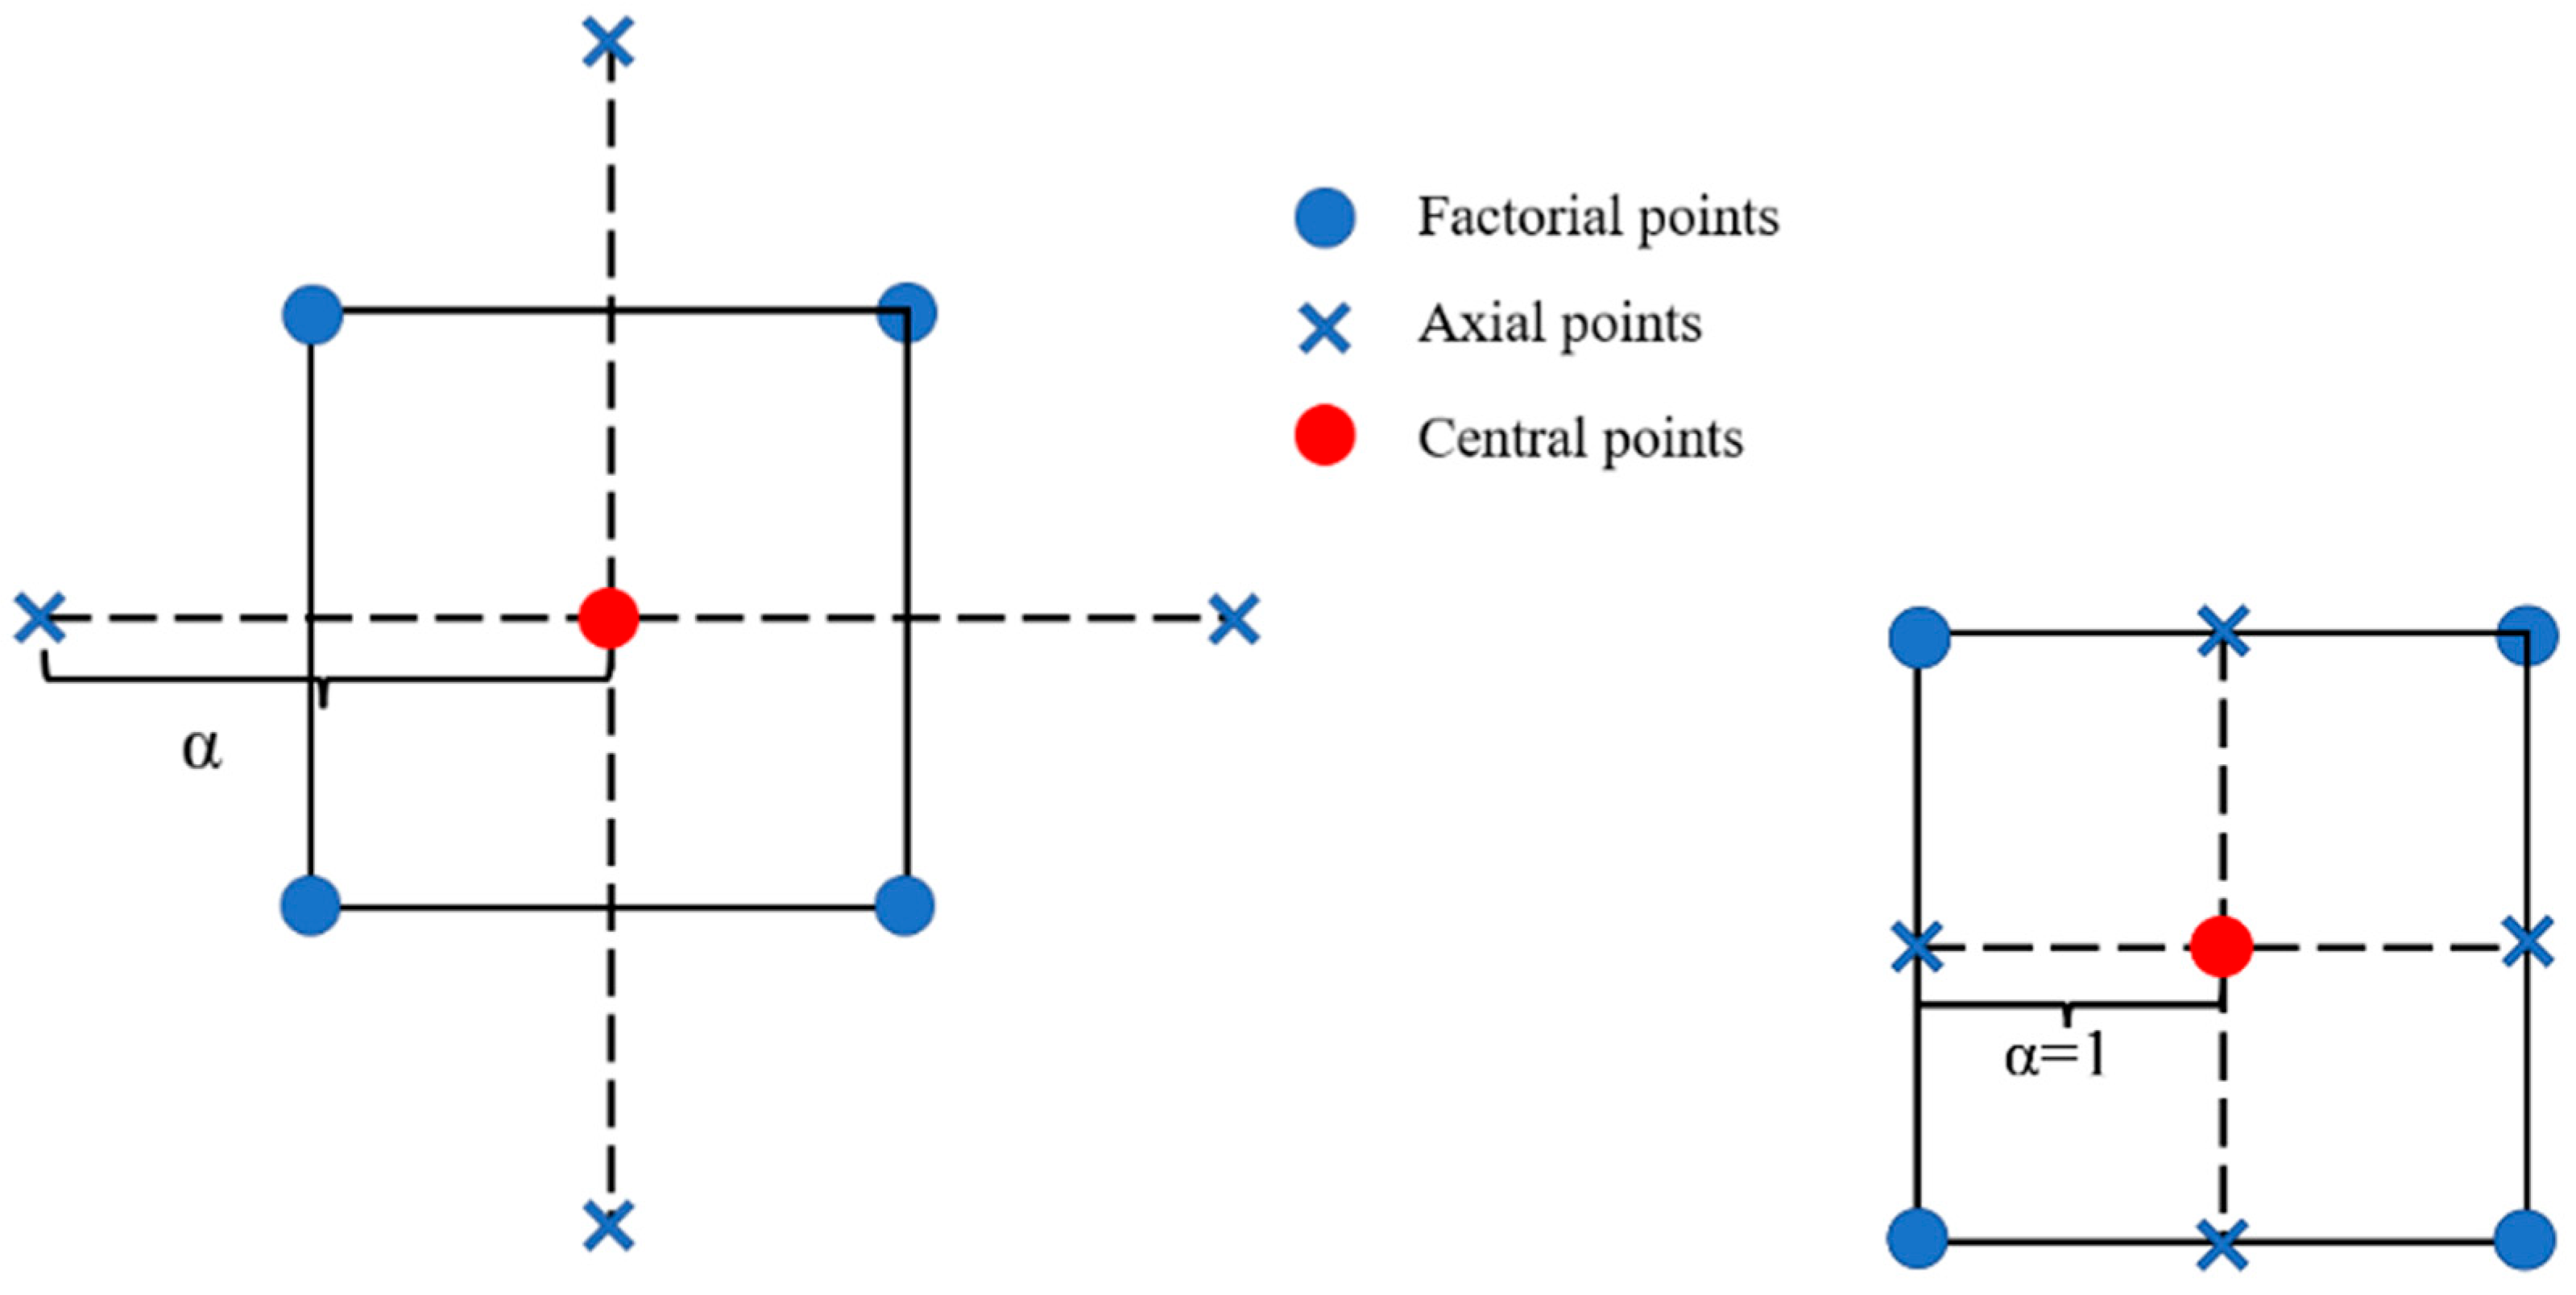
Figure 1. Schematic diagram of CCD in RSM.
Buildings 15 00733 g001
Figure 2. Schematic diagram of experimental design points in the RSM in the present study.
Buildings 15 00733 g002
Figure 3. Neuron model of the ANN used in the present study.
Buildings 15 00733 g003
Figure 4. The multilayer perceptron neural network topology used in the model.
Buildings 15 00733 g004
Figure 5. The 28-day compressive strength of ternary blended cement mortar.
Buildings 15 00733 g005
Figure 6. The 91-day compressive strength of ternary blended cement mortar.
Buildings 15 00733 g006
Figure 7. Comparison between experimental and predicted values of 28-day and 91-day compressive strength for RSM (a,b) and ANN (c,d) models.
Buildings 15 00733 g007
Figure 8. Response-surface plot (a) and contour plot (b) of 28-day compressive strength. Red dots represent the experimental data for model development.
Buildings 15 00733 g008
Figure 9. Response-surface plot (a) and contour plot (b) of 91-day compressive strength. Red dots represent the experimental data for model development.
Buildings 15 00733 g009
Figure 10. Comparison of experimental, RSM-predicted, and ANN-predicted 28-day compressive strength.
Buildings 15 00733 g010
Figure 11. Comparison of experimental, RSM-predicted, and ANN-predicted 91-day compressive strength.
Buildings 15 00733 g011
Figure 12. Comparison between experimental and predicted values of 28-day and 91-day compressive strength for RSM (a,c) and ANN (b,d) models in validation procedure.
Buildings 15 00733 g012
Table 1. Chemical compositions of binders.
BinderCaOSiO2Al2O3Fe2O3MgOSiO3K2ONa2O
%%%%%%%%
OPC63.3719.263.644.221.491.710.250.18
SS39.1213.348.4124.313.531.220.460.27
CBA29.424.5514.7920.021.554.982.670.44
Table 2. Ternary blended cement mortar mix design.
SS (%)
05101520
CBA (%)0S0A0 *S0A5S0A10 *S0A15S0A20 *
5S5A0S5A5 *S5A10S5A15 *S5A20
10S10A0 *S10A5S10A10 *S10A15S10A20 *
15S15A0S15A5 *S15A10S15A15 *S15A20
20S20A0 *S20A5S20A10 *S20A15S20A20 *
* The mix design used for establishing RSM models.
Table 3. Experimental data used for establishing the RSM and ANN models of 28-day and 91-day strength and the predicted values calculated with these models.
MixSS%CBA%28-Day 91-Day
ExperimentalPredictedExperimentalPredicted
RSMANN RSMANN
S0A00040.5040.5640.2246.0046.1945.99
S10A010036.2335.9935.5048.0048.0348.48
S20A020033.5133.5832.9146.4746.3745.96
S5A55537.0037.2637.2246.5045.6746.52
S15A515533.4233.6133.2342.5042.8742.18
S0A1001040.1039.8640.1048.0548.0848.16
S10A10101034.0033.3333.4842.0041.5841.65
S10A10101033.1033.3333.4841.0041.5841.65
S10A10101033.0933.3333.4841.0041.5841.65
S20A10201026.0325.7826.2131.2131.2431.91
S5A1551533.2833.4833.7741.3241.6941.33
S15A5151527.0027.2627.4935.5034.6736.04
S0A2002034.7534.8235.3942.5042.3942.56
S10A20102028.5328.2928.1536.1436.1336.19
S20A20202017.5017.5617.8425.5025.6925.77
Table 4. Coded and real levels for custom RSM model.
VariablesSymbolUnitCoded Factor Levels
−1−0.500.51
SSX1%05101520
CBAX2%05101520
Table 5. Analysis of variance (ANOVA) of RSM models.
28 Days91 Days
DfSsF-Valuep-ValueSsF-Valuep-Value
Model9478.3258.34<0.0001577.42119.22<0.0001
X1111.555.910.000714.8127.530.0033
X2113.5365.780.000520.4638.020.0016
X1X2128.13136.75<0.000175.62140.51<0.0001
X1210.68843.350.12699.8218.240.0079
X2213.7718.350.00780.67561.260.3134
X12X213.3616.350.00990.03750.06970.8023
X1X2211.276.180.055424.5745.660.0011
X1312.6712.960.01564.598.530.033
X2310.51562.510.17420.00720.01330.9127
Residual51.03 2.69
Lack of Fit30.48250.58910.67871.881.560.4141
Pure Error20.5461 0.8067
R2 0.9979 0.9954
Adjusted R2 0.994 0.987
Predicted R2 0.9688 0.9233
Adeq pre 62.1075 37.3744
Cor Total14479.33 580.11
Table 6. The experimental result and predicted value of RSM and ANN for model validation.
MixSS%CBA%28-Day 91-Day
ExperimentalPredictedExperimentalPredicted
RSMANN RSMANN
15037.0037.0837.6149.5046.3348.93
215033.8635.4534.6347.4848.8648.08
30540.4541.1640.5346.9048.1344.31
410536.1235.3735.6546.0044.7345.93
520527.4530.1427.7833.0637.6633.41
651034.4835.7934.8945.8044.0945.90
7151033.1030.6132.4638.9038.1137.58
801541.4637.4740.7549.9446.1349.68
9101531.7830.7031.3941.0038.6840.74
10201520.0221.3119.7526.5827.2226.40
1152031.2231.1531.1938.7938.5638.78
12152025.0124.3824.7534.8032.6534.81
Table 7. Model comparison.
Parameter28-Day91-Day
RSMANNRSMANN
R0.95500.99690.94930.9933
R20.91210.99380.90120.9866
X21.14760.07841.57980.2201
MSE2.55190.178434.31810.6294
RMSE1.59750.422412.077990.7933
MAE1.39000.41421.94170.5267
SEP4.89081.29334.99971.9088
Disclaimer/Publisher’s Note: The statements, opinions and data contained in all publications are solely those of the individual author(s) and contributor(s) and not of MDPI and/or the editor(s). MDPI and/or the editor(s) disclaim responsibility for any injury to people or property resulting from any ideas, methods, instructions or products referred to in the content.