Article

Effect of the Initial Damage State on the Seismic Behavior of A Five-Story CLT Building

by
Franco Benedetti
1,2,*,
Julieta Álvarez M.
1,
Alan Jara-Cisterna
1,2,
Alexander Opazo-Vega
1,2 and
Víctor Rosales
2,3
1
Department of Civil and Environmental Engineering, University of Bío-Bío, Av. Collao 1202, Concepción 4081112, Chile
2
Centro Nacional de Excelencia para la Industria de la Madera (CENAMAD)-ANID BASAL FB210015, Pontificia Universidad Católica de Chile, Santiago 7820436, Chile
3
Department of Construction Sciences, University of Bío-Bío, Av. Collao 1202, Concepción 4081112, Chile
*
Author to whom correspondence should be addressed.
Buildings 2025, 15(5), 727; https://doi.org/10.3390/buildings15050727
Submission received: 4 February 2025 / Revised: 20 February 2025 / Accepted: 21 February 2025 / Published: 24 February 2025
(This article belongs to the Special Issue Research on Timber and Timber–Concrete Buildings)

Abstract

Timber construction experiences a growing trend in different countries due to its inherent environmental benefits and proven lateral load performance. However, most of the previous studies on structural and seismic performance have focused on undamaged structures without any signs of deterioration. This paper focuses on the analysis of the effects of the initial damage state on the seismic response and fragility of a five-story CLT building designed under a force-based approach. A detailed 3D finite element model was developed and validated through experimental data in order to perform incremental dynamic analyses that considered different arbitrarily imposed initial damage states. The residual response and the fragility functions are analyzed to characterize the impact of the initial state on seismic behavior. The results of this work highlight the need to properly consider the effect of previous load actions for the seismic performance evaluation during the operating life of CLT structures. Findings suggest that the initial state can significantly modify the probability of reaching a given limit state. Moreover, it was found that if the initial damage is defined as severe, the collapse margin ratio is reduced by 58.8% compared to the case in which the initial state is undamaged.

1. Introduction

Recently, there has been a growing interest in developing structural systems that promote industrialized construction and that are also environmentally friendly [1]. In particular, wood-based construction systems, such as cross-laminated timber (CLT), have their unique characteristics that make them a good alternative that addresses these challenges, including good energy efficiency performance [2,3], a high level of industrialization [4], and good structural performance [5]. These panels generate rigid structural elements capable of resisting in-plane and out-of-plane loads [6] and building low- to medium-rise buildings of cross-laminated timber ranging from three to eight stories [7].
From a structural performance perspective, significant efforts have been made in the last decade to understand structural behavior. To this purpose, studies on the behavior of walls [8,9,10,11,12,13,14,15], critic connections (hold down, brackets, splines) [15,16,17,18,19,20], and even full-scale tests [5,21,22,23,24,25,26,27] have been carried out. It is important to highlight that, from a structural point of view, although CLT is a material with a fragile nature, it behaves as a construction system with a suitable level of ductility. This is due to the fact that energy dissipation is concentrated in the connections [28]; therefore, some studies have focused on characterizing connections with a high level of energy dissipation [24,25,26,27].
Despite positive international evidence, CLT does not have explicit seismic design standards in certain countries with high earthquake proneness (e.g., Chile). This means, for example, that CLT buildings must meet the same seismic deformation design requirements as a reinforced concrete structure. This fact can generate over-stiffened and oversized structures that do not take advantage of the ductility that CLT can provide. In addition, the use of traditional force-based design methods and general seismic design regulations generates uncertainty about the earthquake response and safety of CLT structures.
It is of special interest to evaluate the behavior of cross-laminated timber structures in areas of high seismicity where it may be common for structures to face multiple seismic events during their service life. For example, the Sophie [5] project performs shaking table seismic testing on two timber structures of seven and three stories. In particular, for the seven-story structure, 22 sequential earthquake tests were performed, which contemplated repair processes when there was damage. It should be noted that it was impossible to completely restore the initial natural frequencies of the building. Recently, Pei et al. [26] developed a full-scale shaking table test on a 10-story post-tensioned CLT building equipped with energy dissipation connectors. They conducted 88 earthquake tests, recording no structural damage but moderate period elongation.
To evaluate the behavior and safety of buildings in seismic environments, incremental dynamic analyses (IDAs) have been performed, which provide valuable information regarding the collapse margin coefficients (CMRs) that different structures achieve. For example, for CLT structures, Pan et al. [29] investigated the seismic behavior and collapse risk of a balloon-frame cross-laminated timber building. The results showed that the building had a low probability of collapse, about 4.2%. In a related study, Shahnewaz et al. [30] observed collapse probabilities ranging from 4.1% to 8.1%, for CMR values between 2.78 and 3.55. Furthermore, Aloisio et al. [31] performed a parametric analysis of different CLT buildings’ configurations, finding that both the fragility functions and the failure probability are most affected by the number of stories instead of the structural configurations of the walls.
Despite these relevant advances, most of the developed studies have assessed undamaged CLT structures, disregarding the effects of previous lateral load actions on the seismic safety. Therefore, it is still necessary to study how the initial state, damage, or deterioration impact the seismic performance of CLT buildings.
Numerous studies have been carried out on the accumulation of damage in structures subjected to sequential analysis covering liquefiable soils [32], steel structures [33], tunnels [34] and the evaluation of structural performance under seismic loads and the after-effects of tsunamis [35,36]. Although these studies are valuable, they have not focused on cross-laminated timber structures.
The experimental and numerical evaluation of CLT buildings mentioned above has contributed to the knowledge of their structural performance. However, there is still a lack of evidence on the seismic behavior of CLT structures that have sustained previous damage, especially when subjected to consecutive seismic loads. Consequently, this research aims to contribute to our understanding of the structural response of CLT structures by analyzing the seismic fragility of a mid-rise panelized CLT building with imposed initial damage, utilizing incremental dynamic analyses (IDAs) and sequential seismic analysis.

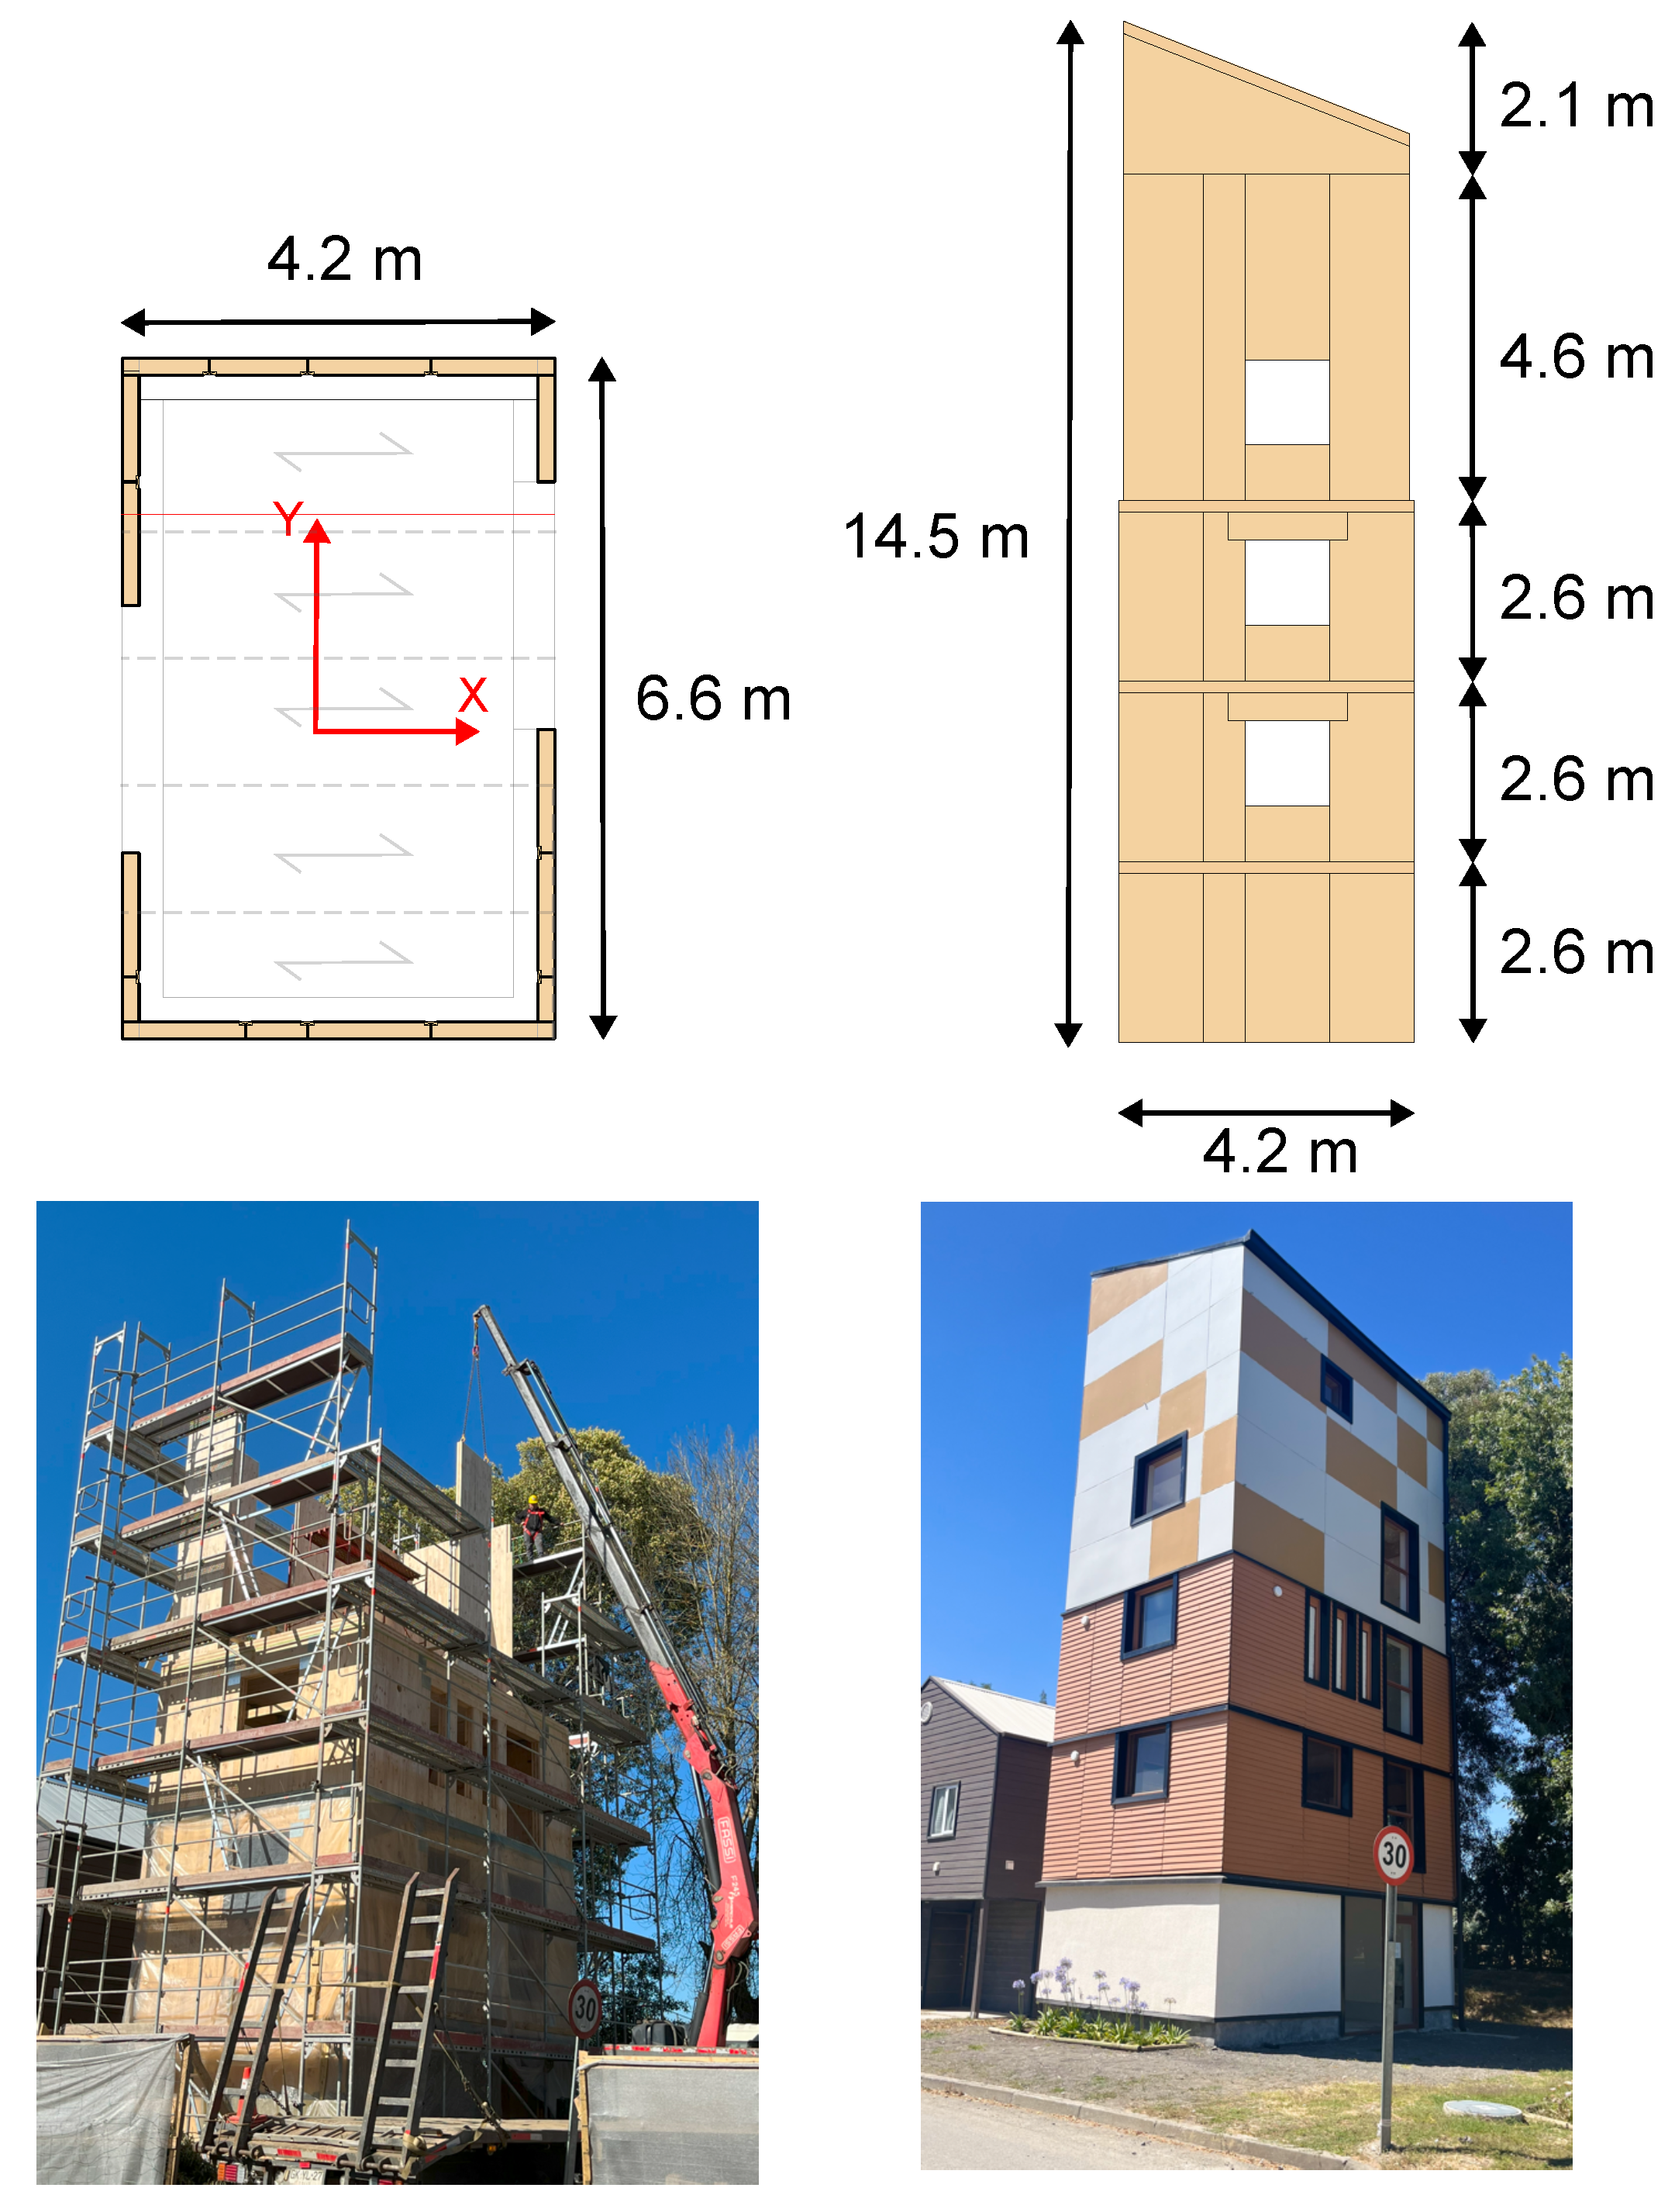
2. Prototype Building

The studied building is a panelized cross-laminated timber (CLT) building. It is a five-story structure located in the University of Bío-Bío, Concepción, Chile. This building was the result of a collaborative effort between public and private organizations [37]. Funding was provided by the Production Development Corporation of the Chilean Ministry of Economy (CORFO), while the University of Bío-Bío (Concepción, Chile) oversaw the execution of the project. The goal of the project was to bring together a large number of local small- and medium-sized enterprises (SMEs) in the timber sector to innovate and create associative support networks. As a result of this collaborative effort, the building (called PymeLAB Building) was constructed, which serves as a living laboratory for timber companies to test and validate their products and manufacturing capacities. While the building is not suitable for habitation, it provides a unique opportunity for the timber industry to develop and refine its products, as well as a case study to deepen the knowledge about the performance of CLT constructions designed under Chilean regulations.

2.1. Building Configuration

The building’s structural system is based on a simple regular prism with stiff and strong corners and concentrated openings in the center of each elevation, in order to provide vertical continuous load paths. Figure 1 illustrates three different views of the five-story cross-laminated timber (CLT) building. It has a plan dimension of 6.6 m by 4.2 m, and an inter-story height of 2.5 m. The first three floors utilize a platform framing system with 165 mm-thick, five-layer CLT walls. The upper two floors, however, employ balloon framing with 100 mm-thick, three-layer CLT walls. Due to local manufacturing capacity, panelized designs are used for walls (maximum width 1.2 m) and slabs (maximum width 1.8 m). For panel-to-panel connections in the same plane, spline joints are used, while perpendicular wall-to-wall and slab-to-wall connections are made using self-tapping screws.
Although the same design principles were followed for both principal directions of the building, providing a similar amount of connectors and wall length for each axis, there are certain unique differences in terms of structural configuration. Given the larger dimension of the longitudinal axis (Y-direction), slab panels were installed, with their strong axis acting parallel to the X-direction, aiming to provide a minor free span between supports. This situation leads to a larger vertical load transfer from floor slabs to the walls parallel to the Y-direction, as well as less in-plane bending stiffness for the floor system in this axis due to the segmentation of the slab elements. Moreover, the vertical openings (for windows and doors) are bigger for the longitudinal axis elevations than for the transverse elevations, having a total opening area ratio of 13.9% for the Y-direction and 6.8% for the X-direction.

2.2. Seismic Design

The structure was designed using the allowable stress design method, following the Chilean seismic code [38], the Chilean structural wood design standard [39], and North American recommendations [40]. Because Chile currently lacks a specific structural design code for CLT, international guidelines [40] and the authors’ own criteria were used to design and verify the CLT elements. The Chilean code for sawn timber [39] provided a framework consistent with local practice and was used to calculate certain design parameters and material properties.
According to the Chilean code for seismic design (NCh 433 [38]), the design base shear demand is defined using the maximum seismic coefficient C = 0.46 with a load reduction factor R = 2. The seismic demand is applied as lateral forces in the mass center of each floor slab. In addition, accidental torsion is considered by displacing the mass center 10% of the plan width. The seismic weight (P) is determined as the dead load plus 25% of the live load, resulting in 2.5 kN/m2/story and a base shear Q = C·P = 142.4 kN. Regarding the displacement limits, following the design code requirements [38], the maximum center of mass inter-story drift must be below a 0.2% limit under reduced seismic loads.
Concerning the design of the connections, the recommendations of [41] and the authors’ experience were followed to define the dissipative and non-dissipative connections. Rocking-resisting joints using hold-down devices and wall-to-wall in-plane spline connections were designed as dissipative joints. On the other hand, non-dissipative connections include shear brackets, wall-to-wall and slab-to-wall perpendicular joints, and slab-to-slab spline joints. Further details regarding the building’s design are presented in [42].

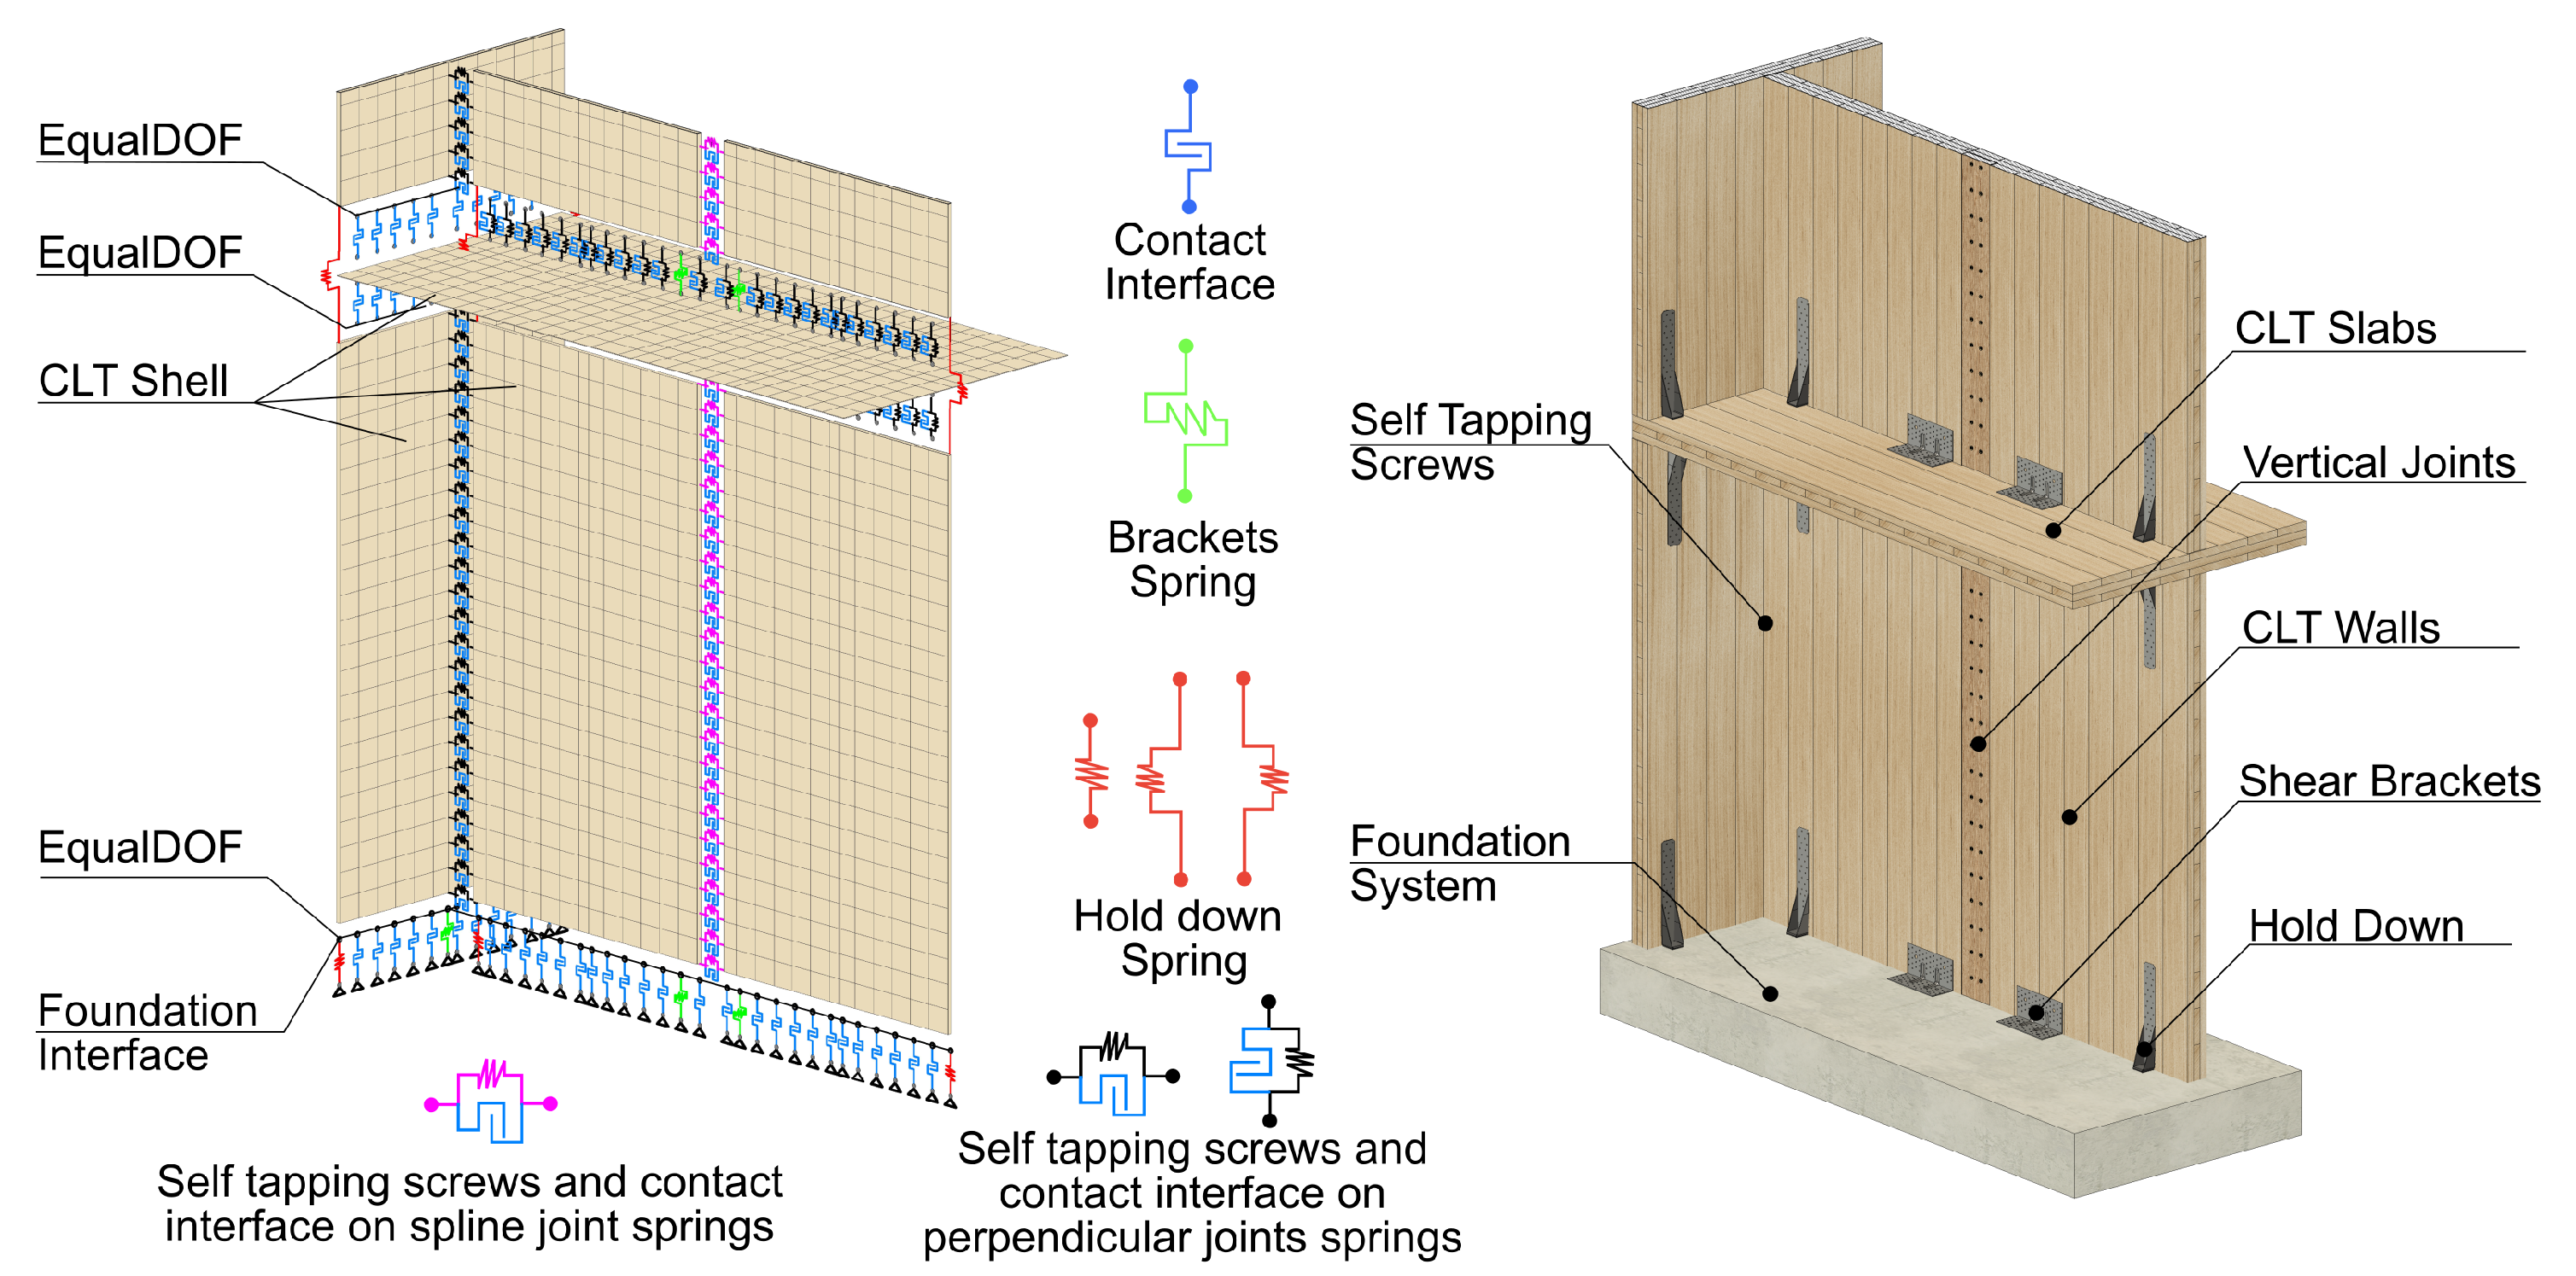
2.3. Construction Detailing

Due to the panelized configuration of the building, a large number of metal joints and screw connectors are employed. On average, the total number of connectors in the building is 2 connectors/m2, in addition to approximately 205 fasteners/m2 (nails + screws). Moreover, CLT consumption is 0.34 m3/m2, giving a large wall density of 10% at the first story. Additional information about detailing, construction solutions, and design criteria has been widely described in previously published works [42,43].

3. Model Development

In this section, the modeling strategy is presented and discussed in order to provide the detailed framework considered to develop the numerical study.

3.1. Modeling Approach

The building was modeled in OpenSees [44] following a detailed approach. The numerical model includes all structural components, using linear and nonlinear elements to reproduce the expected structural response and the in-plane and out-of-plane deformability of walls and slabs. CLT wall and slab panels were modeled with elastic orthotropic shell elements (shellMITC4), while hysteretic nonlinear springs simulated the nonlinear behavior of the connections.
For each connection device, the three orthogonal translation degrees of freedom (uplift traction, in-plane, and out-of-plane shear sliding) were modeled as independent springs through the pinching 4 material law. For the hold-down connectors, traction response was considered nonlinear, while the two shear sliding components were defined as linear. Concerning the shear brackets, nonlinear behavior was assigned to the in-plane sliding as well as the traction component, but the out-of-plane shear degree of freedom was considered linear. Wall-to-wall and slab-to-wall screwed joints were also modeled as nonlinear links with three independent springs, where the two lateral withdrawal shear responses were considered nonlinear, but with elastic behavior for the screw’s axial withdrawal component. This approach was also employed to model wall and slab spline connections.
The foundation level was modeled as translation-restrained nodes located under the bottom wall nodes. In addition, a friction interface was used to represent the contact interaction between the different structural components (wall–wall, wall–slab, slab–slab, and wall–foundation) using the ZeroLengthContact3D element. As the use of contact interfaces brings numerical issues regarding the compatibility of degrees of freedom, an auxiliary layer of dummy nodes and equalDOF constraints was employed between the displacements of the contact elements and the structural components.
Regarding the modeling of the mass, it was considered as lumped at each node of the numerical model, assigning translational masses for the vertical and horizontal displacements according to the tributary seismic weight of the node. No rigid diaphragm constraints were employed to provide a more realistic lateral behavior to the panelized slab systems.
The proposed modeling approach is illustrated in Figure 2. Table 1 and Table 2 present details about the elements, constitutive laws, and main parameters employed in the modeling of the principal structural components. Further details about the connection modeling parameters are presented in Table A1. These parameters were obtained through the calibration of equivalent devices (see Section 4). Additional characteristics of the finite element model are available in [43].

3.2. Parallel Domain Decomposition

The modeling strategy implemented generates a complex and large-numerical-scale model, having around 32,000 degrees of freedom. Moreover, given the high nonlinearity expected for the seismic response, combined with the large amount of long-duration dynamic analyses required, a parallel computing strategy was considered. Accordingly, the model was segmented into different subdomains to distribute the computation load, and the analyses were performed using the parallel multi-process version of OpenSees (OpenSeesMP v2.4.4).
In terms of the parallel modeling approach, several strategies have been developed to segment nonlinear computational domains [45]. However, this study employed a static decomposition approach due to its simplicity and straightforwardness. Moreover, the decomposition is conducted, looking to prevent load imbalances between the processing cores [43].
Additionally, an iterative approach was employed to address the numerical integration and convergence issues caused by the high nonlinearity of the complex numerical model. An algorithm was used to dynamically and adaptively modify the nonlinear solver, time step (or displacement step), and convergence tolerance, if necessary, in order to ease the solving of the analyses.

4. Model Validation

Considering the objective of the study, the validation of the model is carried out by focusing on two aspects of the expected behavior of the building studied. Firstly, the modeling approach is validated at a local level by checking whether it is able to reproduce the real deformation mechanism of a panelized CLT structure under lateral loads. In addition, a global-level validation is developed in order to identify if the modeling strategy can produce the same observed dynamic response for the studied building under service conditions.

4.1. Lateral Deformation Mechanism

For the evaluation of the deformation mechanism, a comparison was made between a numerical model developed based on the proposed strategy with the results of a lateral load test performed on a two-story panelized CLT structure which has a similar structural configuration to the studied building. More detailed information regarding this experimental test can be found in ref. [46].
The comparison between the numerical model and the experimental test results is focused on the analysis of the behavior of the different flexibility sources of the structure, including the hold-down anchors, the shear connectors, and the in-plane vertical spline joints between panels. Moreover, the lateral load vs. displacement curve is also compared.
In particular, the test used for the validation corresponds to the T1 configuration studied in [46], due to the similitude of its structural and connection layout with the constructive configuration of the building under study in this paper.
For the considered reference structure, the experimental response showed a coupled wall behavior, where the response was dominated by the wall panels’ rotation, yielding the in-plane wall splines and hold-downs, while the sliding at the foundation and inter-story levels remained elastic [46].
For both the studied building and the validation test structure, the elastic properties for the CLT panels were calculated through the theory of composite materials, or K-method [47]. In addition, for the structural connections, the modeling parameters were obtained through the calibration of equivalent experimental tests. For the hold-downs and spline joints, experimental tests were conducted and then used for calibration [15,48]. On the other hand, for shear brackets and self-tapping screws, the literature references were employed [5,10,17,49]. In cases where the number of fasteners used in the test of the CLT structure used for validation (and also for the studied building) was different from the reference tested connection, once the parameters of the constitutive law of the connection were calibrated, a linear expansion of the load coordinates was applied to approximate the load capacity of the actual joint [29]. This procedure assumes that the failure mode of the connection does not vary with the number of fasteners. The modeling properties are presented in Table 1 and Table 2.
Figure 3 shows the comparison between the displacement response of the measured connections during the test with the displacement demand obtained through the model. The results show that, from the point of view of the failure mechanisms considered, the model is able to reproduce the behavior observed experimentally because of the similitude between modeled and measured displacements in principal connectors (hold-downs, in-plane wall splines, and foundation shear brackets).
The larger local displacement demands occurred at hold-down connectors located at the pulled-up side of the tested module (HD1 and HD2). In this case, even though the model can simulate the local displacement response when the structure reached its ultimate state during the test, it failed to reproduce the rapid increase in hold-down deformation demand. For the in-plane spline joints, the model was capable of reproducing the relative displacement between the wall panels of the first and second story (VJ-S1 and VJ-S2, respectively) for the entire roof displacement range of the test. At the foundation level shear brackets (AB), the model was also capable of replicating the displacement response, but for large roof displacement demand, the model tended to slightly underestimate the local displacement demand.
On the other hand, if the global lateral load vs. roof displacement behavior is analyzed (Figure 3), it becomes evident that the model underestimates the force response for small-to-medium roof displacement values. This could be due to other conditions that were poorly modeled, such as the interlocking between CLT panels, among others. This issue can be observed more clearly by calculating the lateral force error produced for different lateral deformation levels. For example, for a roof displacement of 3 mm, the average error is about 28%, but for higher levels, for example, for roof displacements of 50 mm, the model reaches average errors of 2%.

4.2. Global Dynamic Properties

In order to validate the modeling strategy at a global level, the service condition dynamic response of the five-story studied structure is assessed by means of the comparison of the small displacement ambient vibration periods measured in the studied building [50] with the ones calculated through the numerical model developed for the PymeLAB building.
Regarding the measured properties, Jara-Cisterna et al. [50] performed ambient vibration measurements under operating conditions in the following two stages: discrete and continuous monitoring. The authors identified five vibration modes by means of operational modal analysis techniques in the time domain, where the first two correspond to translational modes with frequencies of 3.13 Hz and 3.66 Hz for the X- and Y-directions, respectively.
From the point of view of the numerical model, the studied building’s model was developed following the modeling approach proposed, including all its construction and structural details (Section 2). Furthermore, the mechanical properties employed were specified in Section 3.1. Given that the prototype building model was developed under a parallel computing approach, the X- and Y-axes’ translation vibration periods were calculated through free vibration analysis under initial conditions that excited the desired direction of translation. Those initial conditions were lateral displacements that triggered the chosen modal movement but were small enough to not induce a nonlinear response. Free vibration displacement time-history responses are presented in [42]. The results of the model and the experimental dynamic parameters are shown in Table 3. Although it is observed that the model has larger periods than the actual building, the difference is considered suitable enough for this study (less than 4%).
Additionally, the Modal Assurance Criterion (MAC) index was calculated. Because a free vibration analysis was used instead of traditional eigen analysis, the MAC was computed using the displacements of the free vibration response to construct the displacement vector for the numerically derived modal shapes. This vector incorporates the bi-directional (X and Y) free vibration displacements. Experimental modal shapes were obtained from Jara-Cisterna et al. [50]. The resulting MAC values for the translational modes are 0.99 (X-axis) and 0.99 (Y-axis).
The results show that the PymeLAB structure model closely matches the measured modal response for the ambient vibration condition. Therefore, the modeling strategy is accepted.

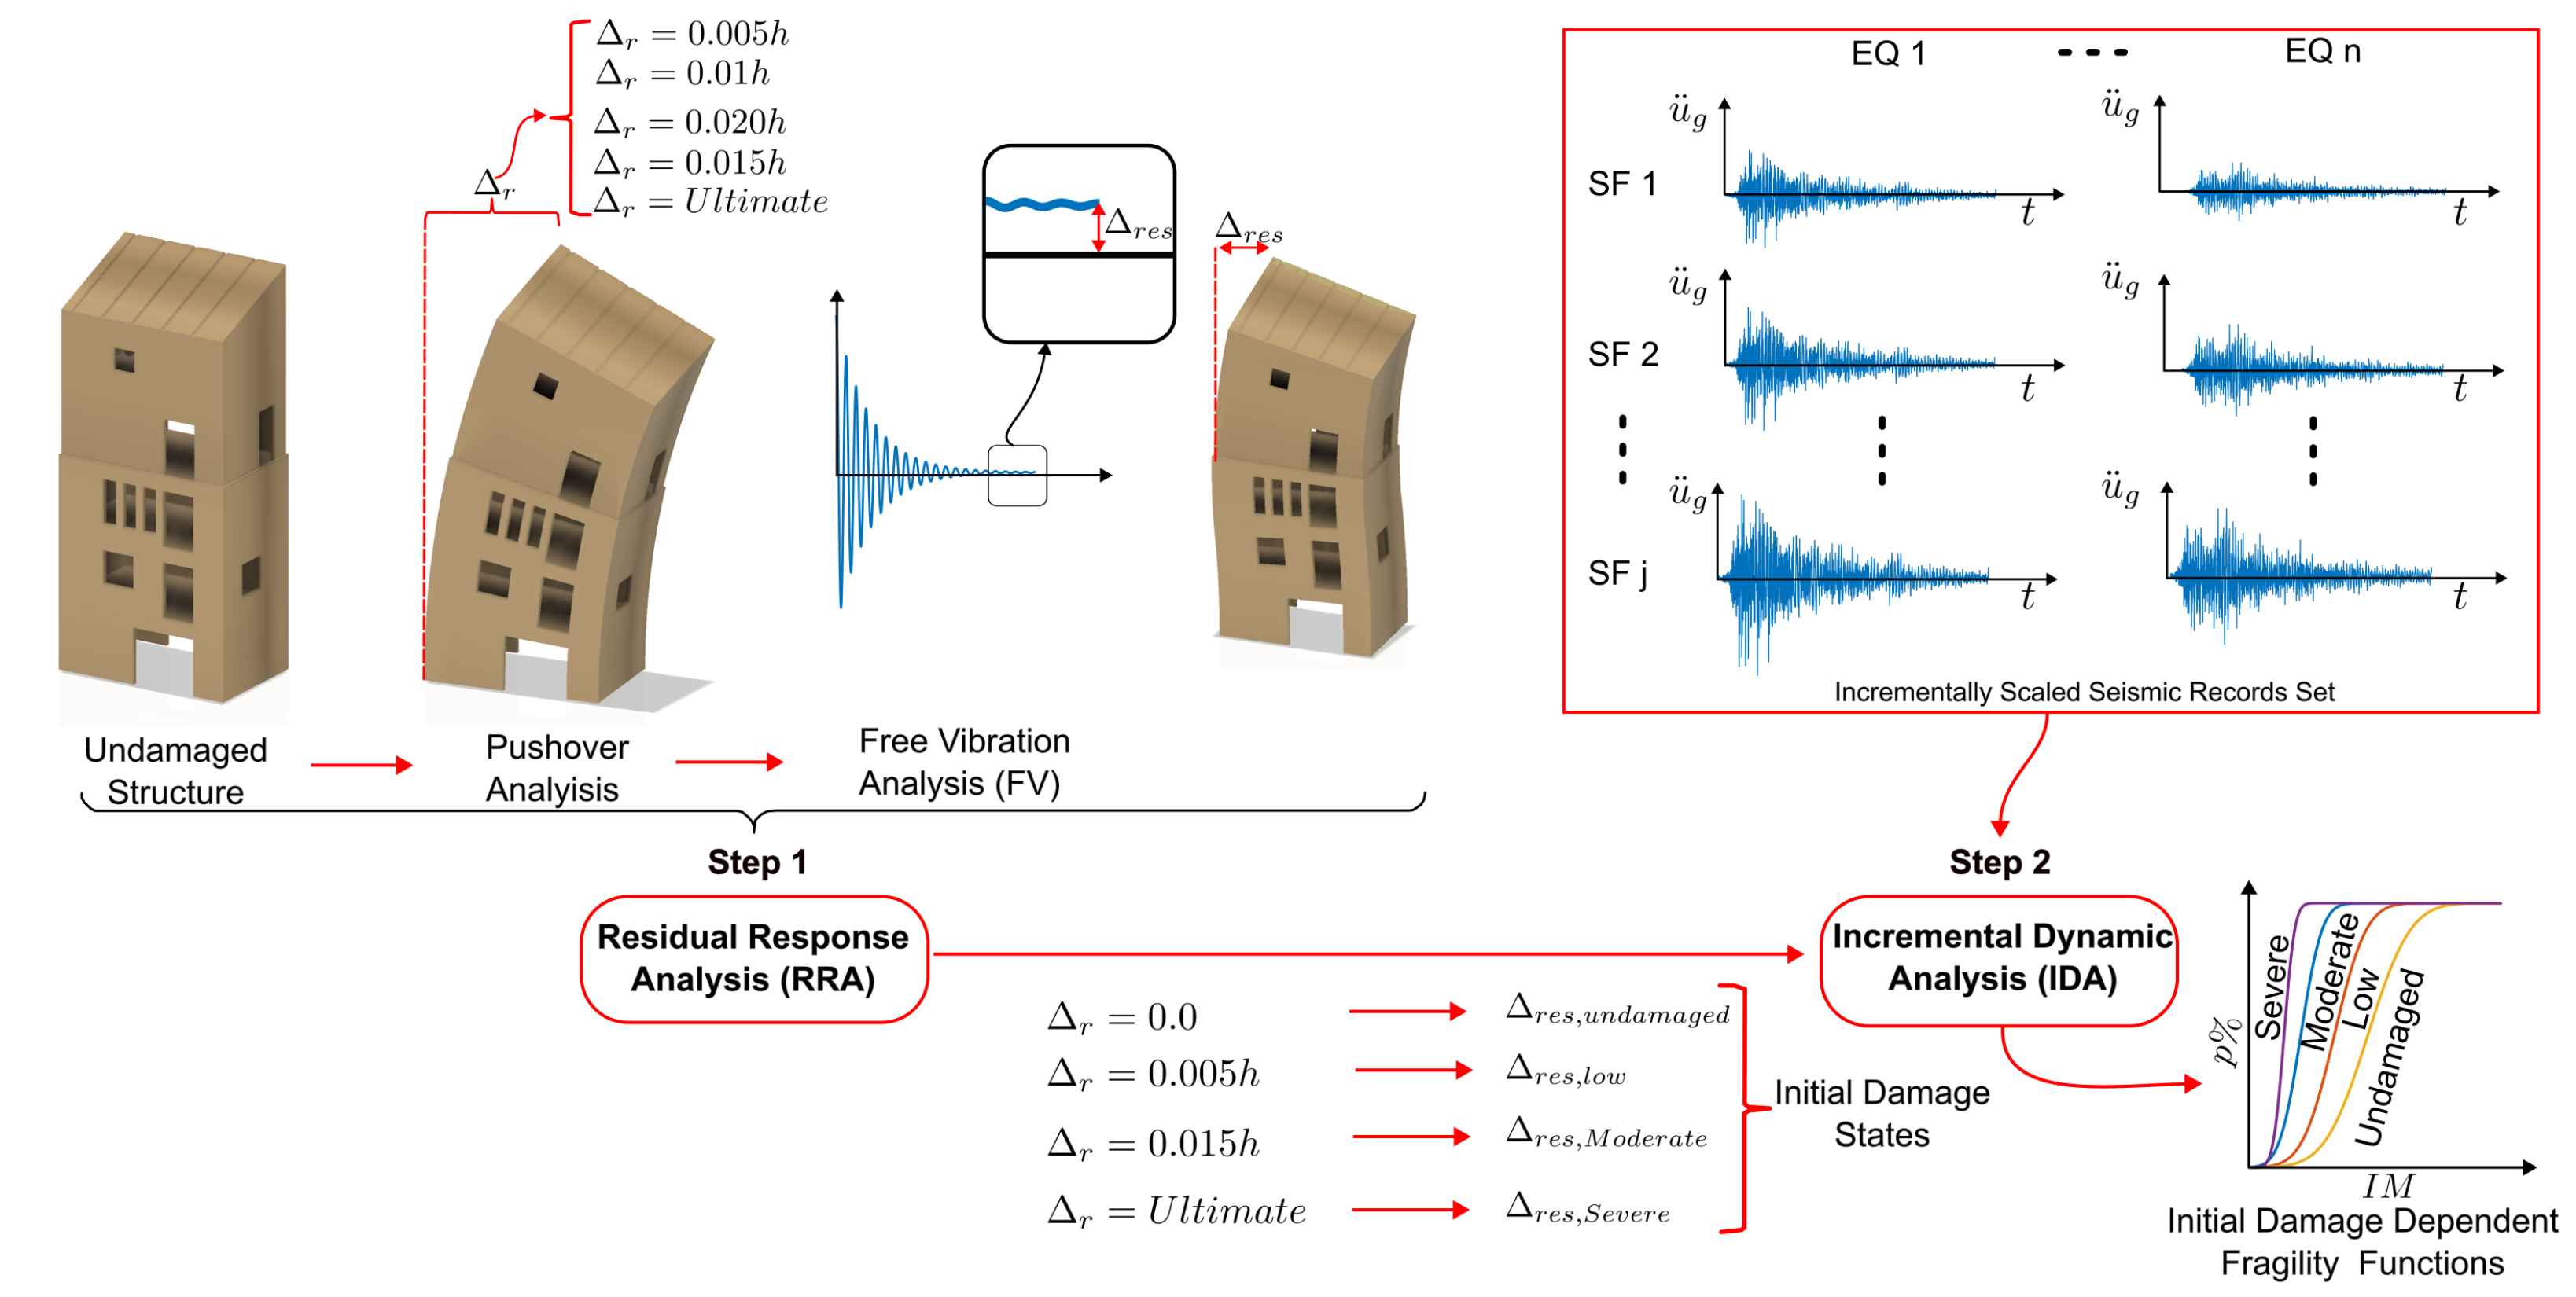
5. Initial Damage State Analysis Approach

To understand the influence of the initial damage state on the seismic behavior of the building, a two-step analysis is conducted. First, the initial damage is simulated using a residual response analysis (Step 1). Subsequently, the building’s seismic fragility is assessed (Step 2). Figure 4 depicts the main aspects and the sequence of analysis performed following the methodology utilized. The specific techniques employed are detailed in the following sections.

5.1. Residual Response Analysis

The Residual Response Analysis (RRA) developed consists of performing a traditional pushover (PO) followed by a free vibration (FV) analysis in order to find the residual displacement that remains in the structure after the application of a given roof displacement demand.
Each PO considers a lateral load pattern consisting of horizontal forces applied at the center of mass of the roof slab of each story. This load pattern is defined following the design lateral load demand established in the Chilean seismic design code [38]. On the other hand, for the FV analysis, after the end of the previous PO, the imposed load pattern is retired and the structure is left to vibrate freely until its residual state is achieved, which is considered as the roof displacement that remains stable at the end of the FVs.
The procedure was applied in both the X- and Y-directions of the building, considering five roof displacement demand levels. These levels are measured as roof drift, defined as the ratio of the imposed lateral displacement Δ i to the structure’s height (h). The imposed roof drifts were 0.005, 0.01, 0.015, 0.02, and the ultimate roof drift (maximum achieved capacity). Thus, five RRA analyses were conducted for each direction.
Furthermore, the effect of the imposed lateral displacement on the global response of the building is analyzed through the relationship between the displacement demand and the residual displacement, the fundamental frequency degradation, and the damage level. The frequency degradation is assessed considering the ratio between the initial building model frequencies (calculated before the RRA) and the predominant frequency derived from the FV analysis. Moreover, the damage level is quantified by means of the Final Softening Index (DF) proposed by ref. [51] . This index correlates the fundamental period degradation with a damage index that can be easily computed. Even though this index has certain drawbacks [52], it provides a general idea about the global damage level that the building has suffered under a given roof displacement demand.

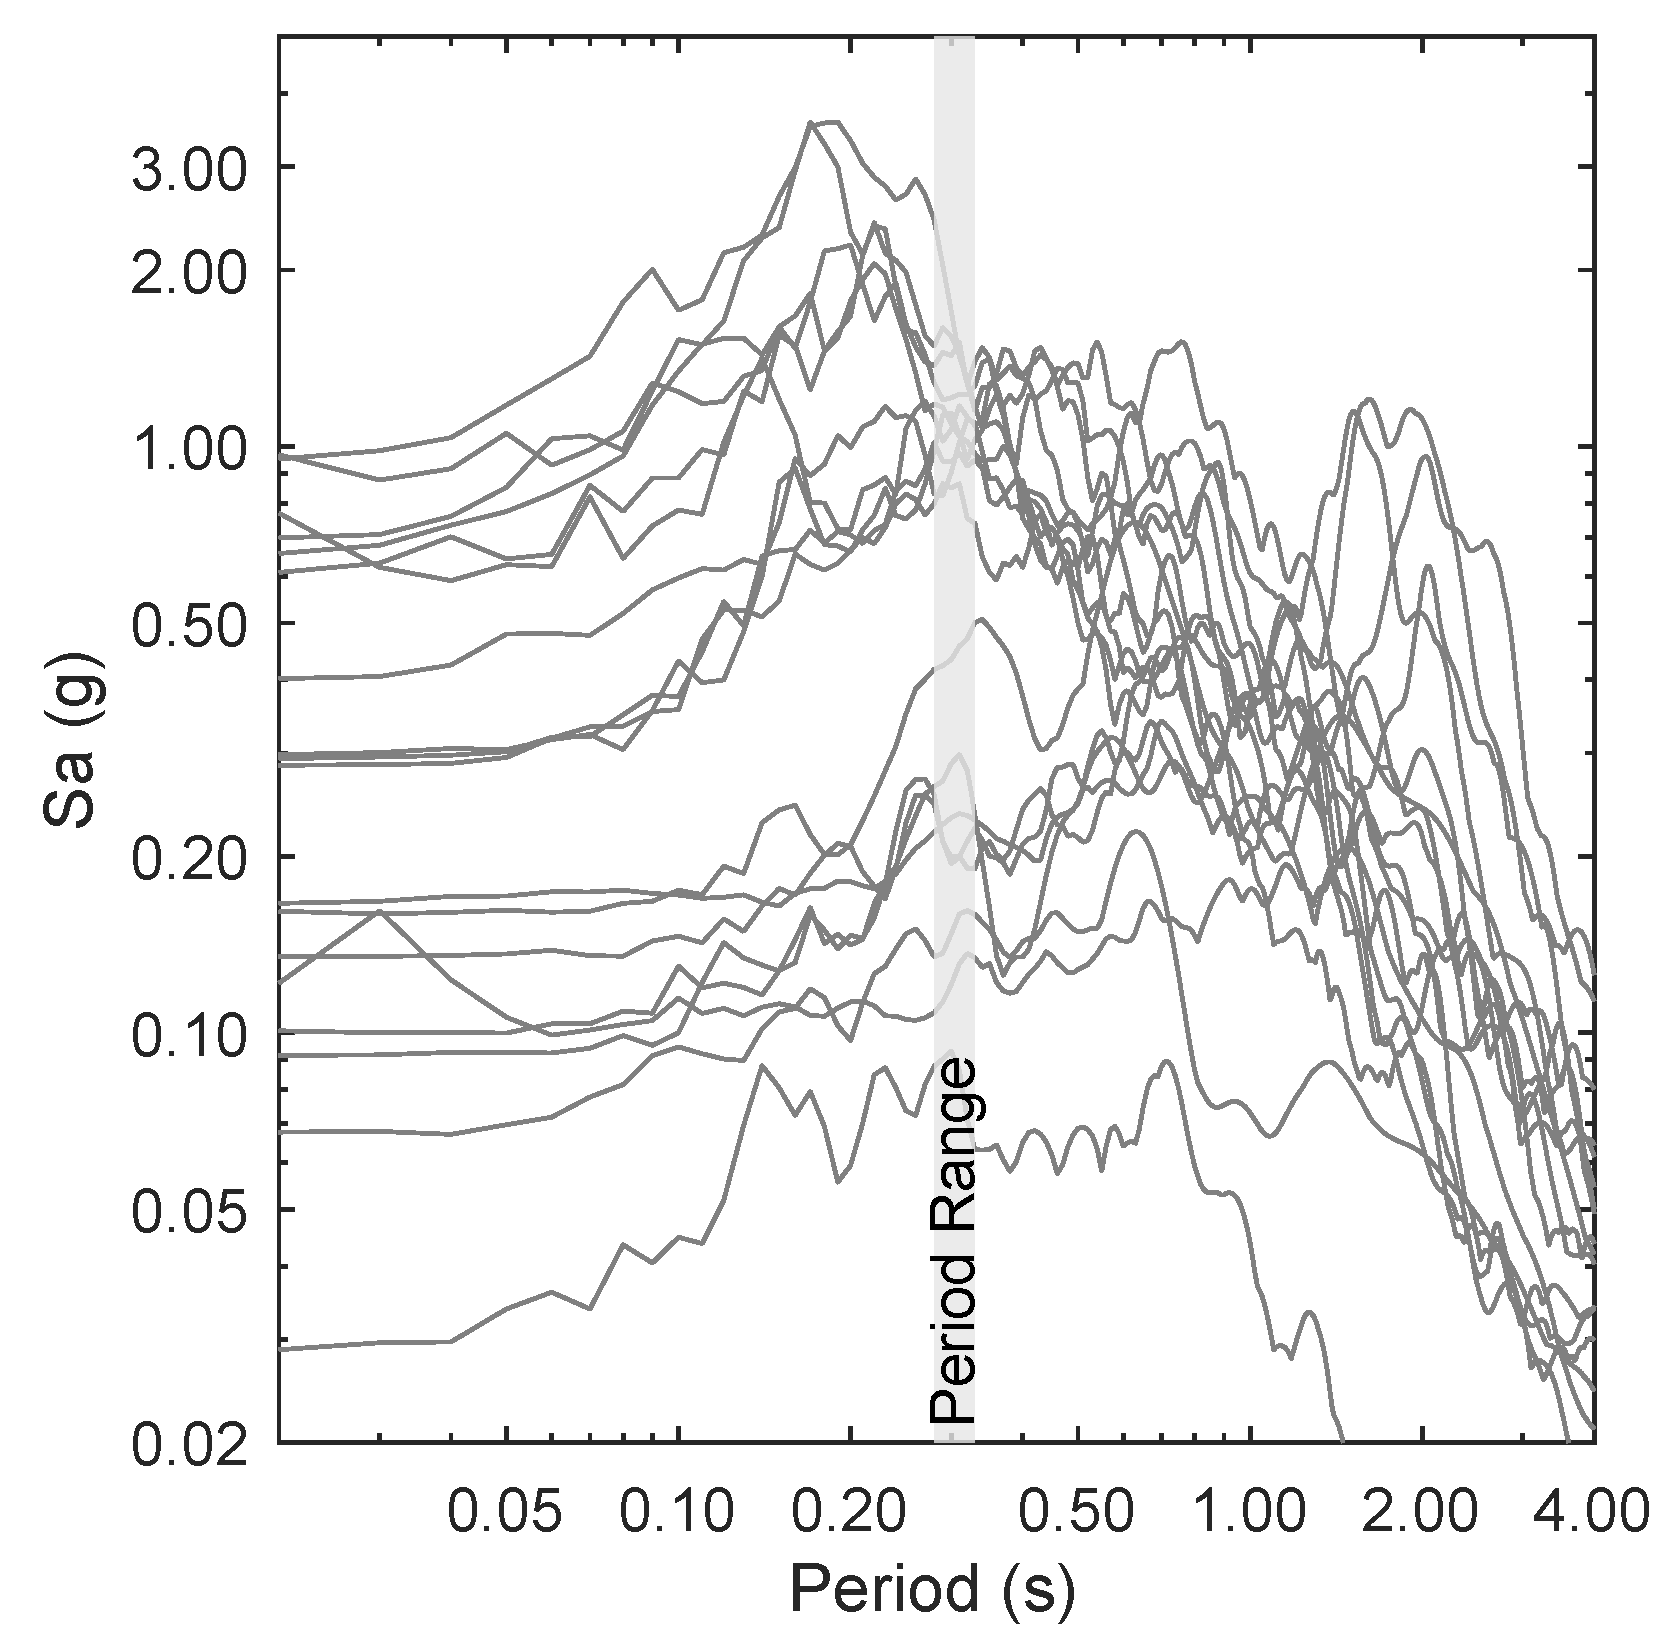
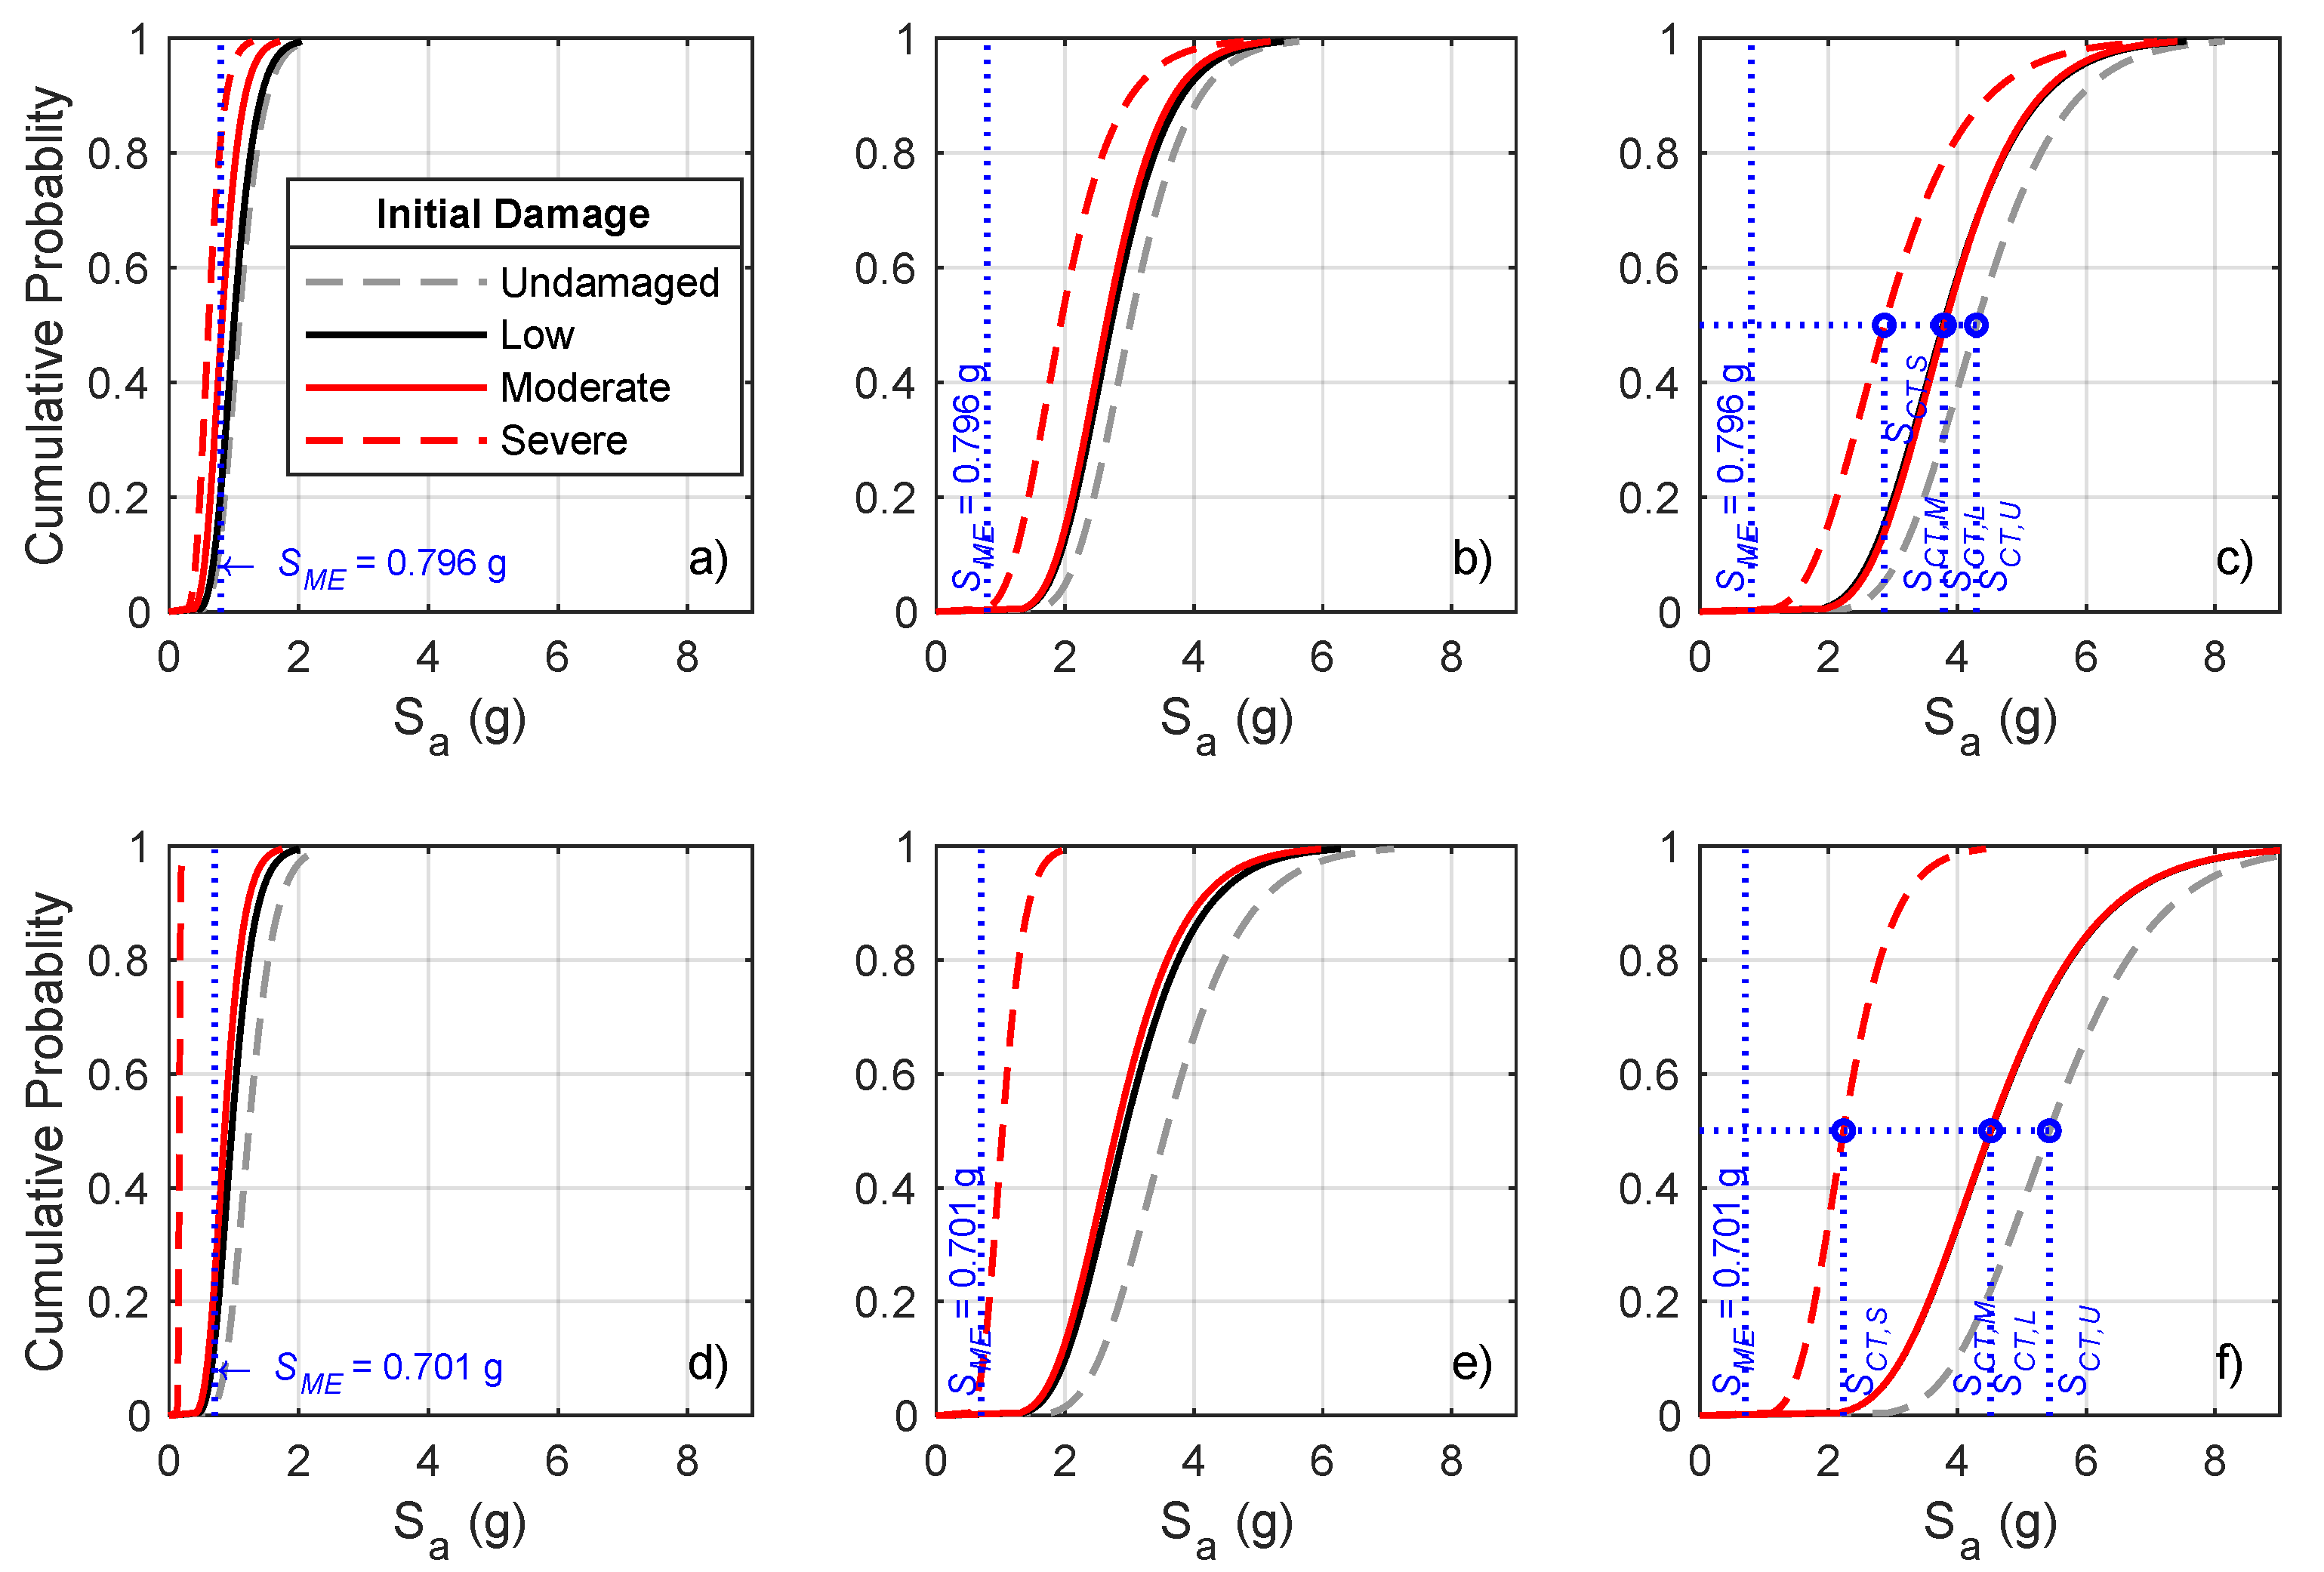
5.2. Seismic Fragility Evolution

With the aim of understanding the effect of the initial damage state of the studied building on its seismic behavior, the seismic fragility was evaluated after performing the RRA. Three levels of initial damage (Low, Moderate, and Severe) were considered, corresponding to the residual state reached after the RRA with imposed roof drift demands of 0.005, 0.015, and the ultimate, respectively. Additionally, the Undamaged state, representing a structure with no previous damage, was included in the fragility analysis.
The seismic fragility was defined utilizing fragility functions, expressed as log-normal cumulative distributions, quantifying the probability of achieving a given structural limit state based on the intensity of earthquake ground motion. The fragility functions were developed through the use of the Incremental Dynamic Analysis technique [53]. This technique involves subjecting a structure to a set of time-domain earthquake loads that are progressively scaled until the desired final limit state is reached. The predominant mode spectral acceleration S a was used as the intensity measure (IM) and the inter-story drift as the damage measure (DM).
In this case, three limit states are considered as follows: fully operational (FO), life safety (LS), and collapse (C). Each limit state has a corresponding damage measure (DM) of inter-story drift (0.5%, 1.5%, and 2.5%), chosen based on engineering judgment to reflect the expected damage behavior. The inter-story drift is calculated as the ratio between the relative lateral displacement of two consecutive stories and the height of the story. Therefore, for each limit state and principal direction (X and Y), four fragility functions were calculated, one for each initial damage state. The analysis of these fragility functions reveals how the initial damage affects the probability of reaching a specific limit state.
In addition, the collapse margin ratio (CMR) is calculated for each considered initial damage level and principal direction as a measurement to quantify the variation of the expected safety margin against failure. The CMR is defined as the ratio between the median collapse IM ( S C T ) and the maximum considered earthquake intensity ( S M E ). Following the Chilean seismic design recommendations [54], S M E =1.3 S D , where S D is the design level spectral acceleration according to INN [38], while S M E corresponds to the seismic level for a 10% exceedance probability in 100 years.
A combination of 14 long-duration subduction and 4 impulsive strike-slip earthquake recordings were selected for the IDA, aiming for a wide seismic demands scenario. Special emphasis has been placed on long-duration and large-magnitude subduction earthquake ground motions because these demands are expected for the studied building given its location. Figure 5 shows the unscaled elastic spectrum of each seismic record, while Table 4 presents additional details on the employed ground motions. The reported duration corresponds to the significant duration calculated as the time interval between 5% and 95% of the Arias Intensity of the ground motion.
Before the execution of the IDA, the seismic recordings were normalized to the same first-mode pseudo-acceleration coordinate, being equal to the design level spectral acceleration S D . After this, during the IDA, each normalized ground motion time series was progressively scaled until the ultimate target limit state (C) was reached. Finally, the IDA was performed independently for each principal direction of the building, giving more than 1000 nonlinear time-history analyses for both the X and Y building axes.

6. Results and Discussion

In the following section, the main results of the study are analyzed and discussed accordingly.

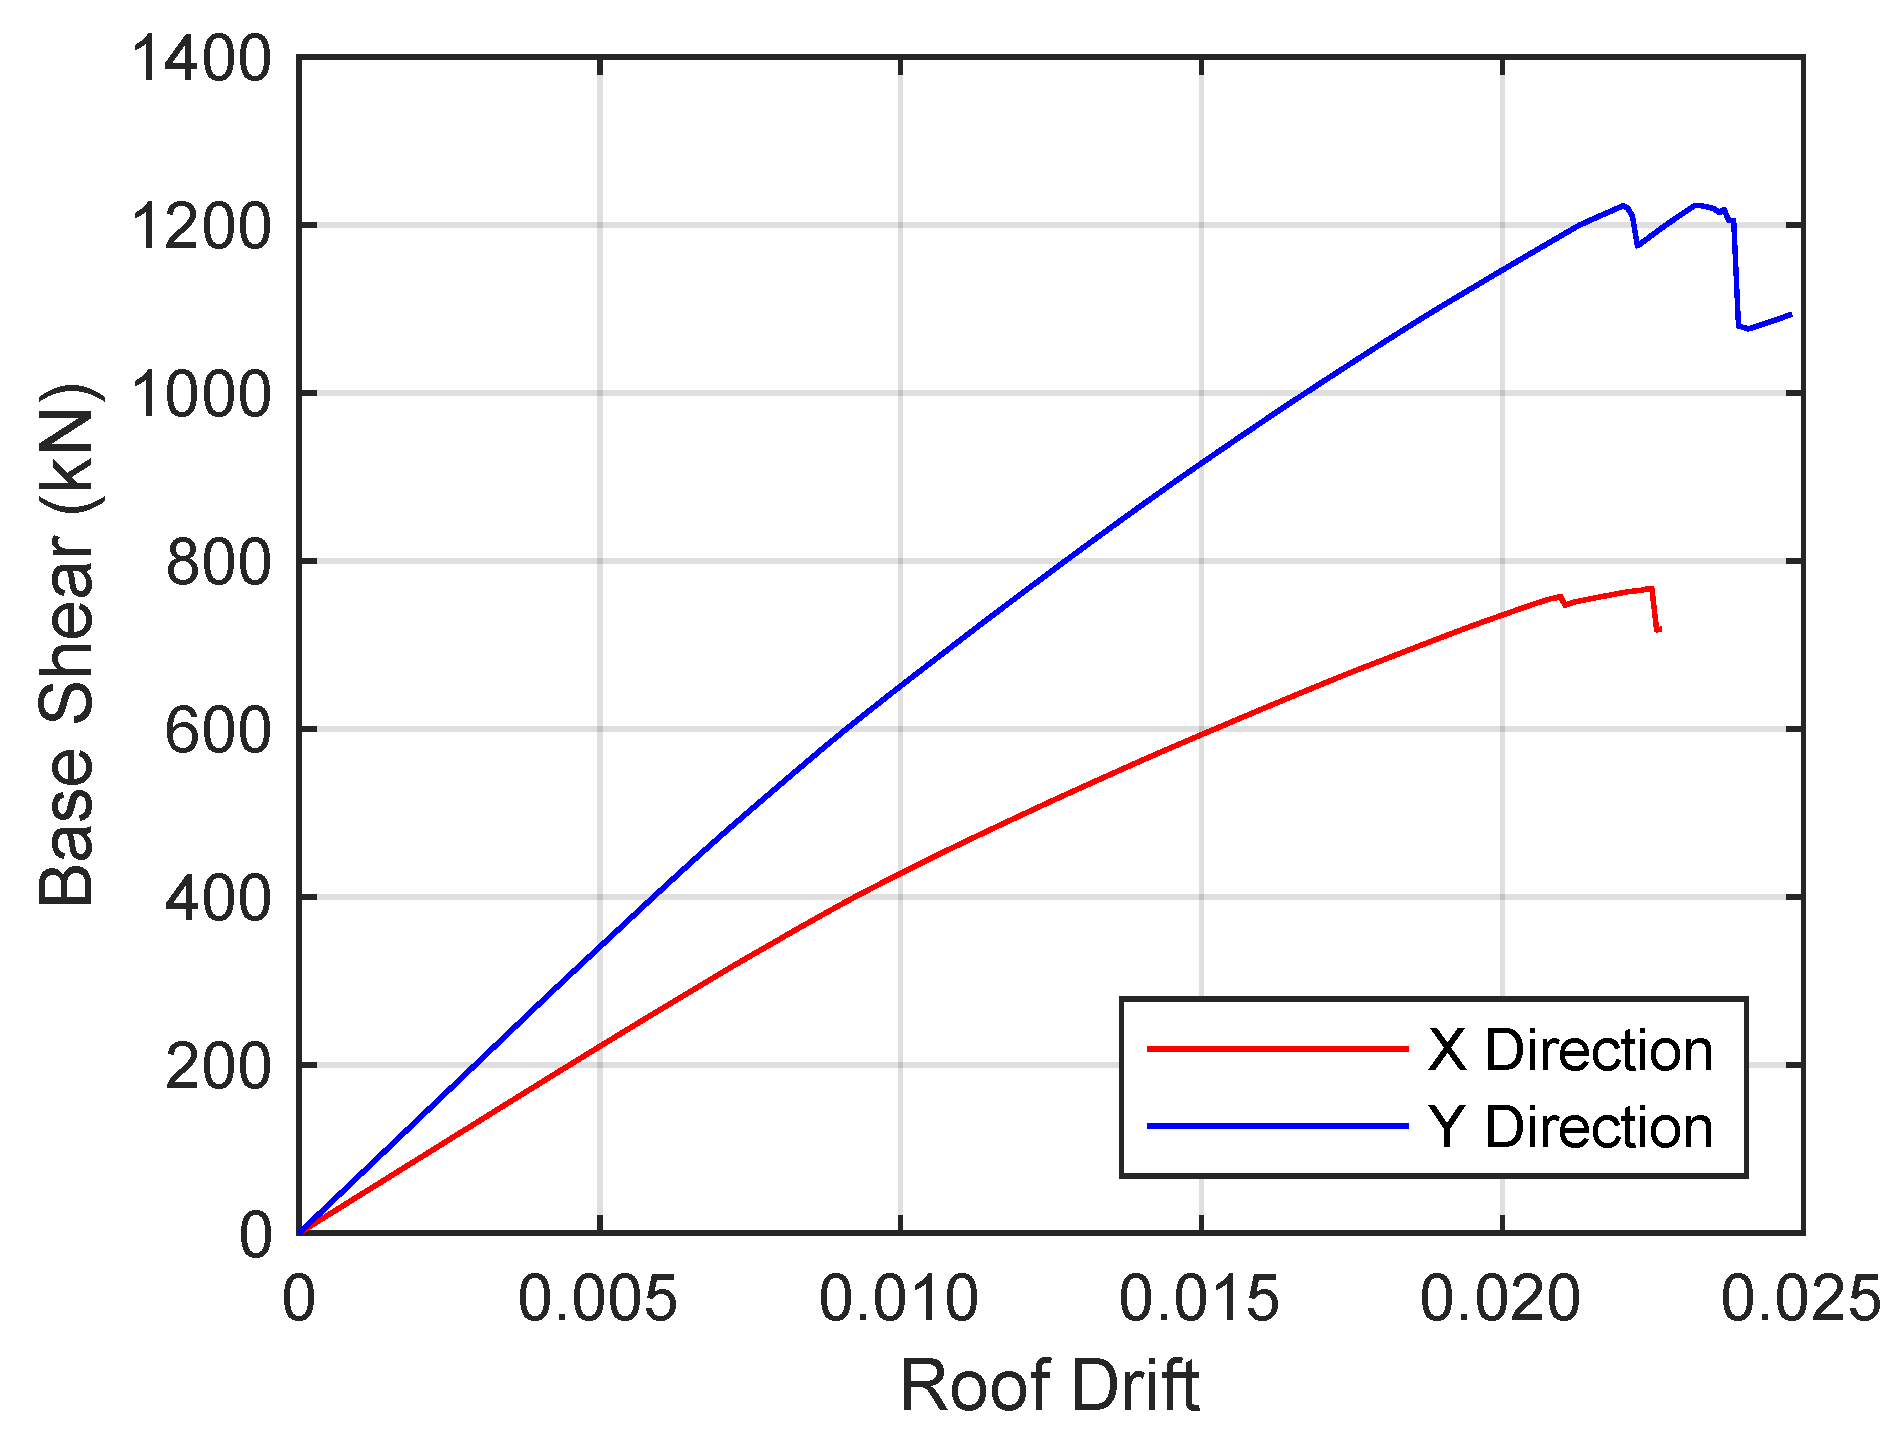
6.1. Global Lateral Load Response

The global lateral response is studied employing the results of the PO analysis performed for the ultimate state. Figure 6 shows the pushover curves for both analysis directions.
The capacity curves obtained suggest that the global behavior of the structure for both principal directions is nearly linear for the entire roof drift range until the maximum capacity is achieved, without the appearance of a clear yield range. However, around a roof drift of 0.9%, a slight slope change is observed, which can be related to the system’s yielding. The elastic stiffness calculated using the first slope of the curves is 5270 kN/m and 3460 kN/m for the Y- and X-directions, respectively.
Notwithstanding that the X-direction is more flexible and weaker than the Y-direction, both reached the maximum capacity and ultimate state at similar inter-story drifts, which are 2.48% and 2.3% for the longitudinal (Y)- and transverse (X)-direction, respectively. These ultimate state points are defined as the lateral roof displacement that the nonlinear model is able to achieve with a stable numerical solution before failing due to convergence issues. Moreover, the structure’s lateral load behavior seems brittle because of the abrupt drop in the lateral load capacity at the ultimate state.
Additionally, comparing the maximum lateral load capacity with the seismic design base shear (Q = 142.4 kN), it is found that the structure has large overstrength factors, equal to 5.4 in the transverse direction and 8.7 in the longitudinal direction. This is due to the large seismic design lateral force (as a consequence of a small reduction factor R = 2) and the strict inter-story deformation limit imposed by the force-based seismic design regulation employed [38].

6.2. Residual Response Results

In this Section, the Residual Response Analysis (RRA) results are presented and discussed.

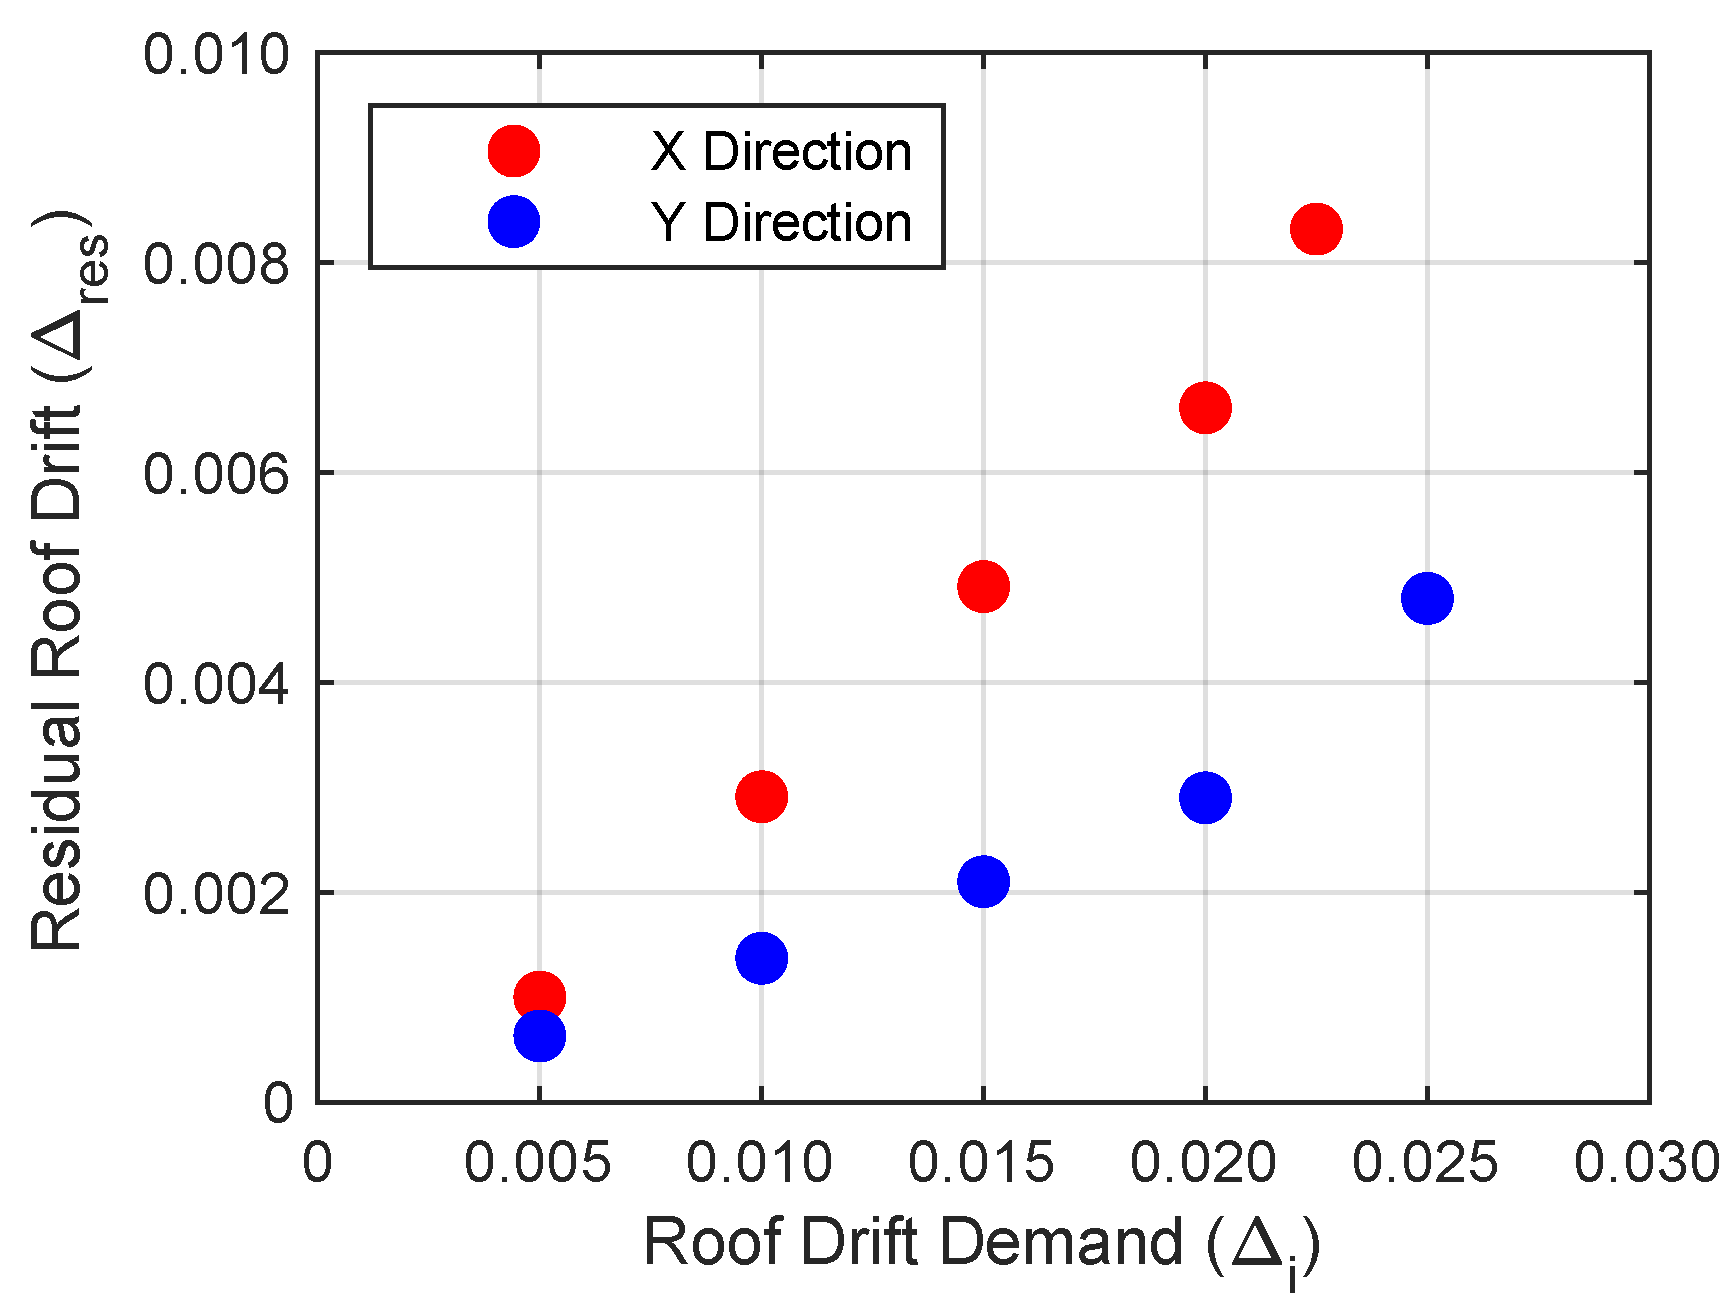
6.2.1. Static Nonlinear Analysis Residual Drift Response

The residual behavior is assessed through the FV analysis performed for each RRA. Figure 7 summarizes the roof drift response obtained for each building direction and every PO roof displacement’s imposed demand. This shows the FV response obtained at the beginning of the FV analysis (first 1.5 s), and the end (last 0.5 s), where the steady state is reached and the residual response can be observed.
With regard to the residual roof drift, it is observed that the remaining roof displacement rises as the imposed PO demand increases. Moreover, the transverse direction (X-direction) of the building appears to be less capable of returning to its undeformed initial state, because of the larger residual roof displacements that remain at the end of the FV analysis with respect to the longitudinal axis (Y-direction). This behavior might be related to the minor global stiffness and capacity of the X-direction, its larger slenderness ratio, and the less restitutive action triggered by the minor vertical load acting in the X-direction walls.
Figure 8 shows the relationship between the imposed PO roof drift demand and the residual drift obtained at the FV steady state. An increasing relation is observed for both building directions, as the longitudinal direction (Y-direction) is more prone to return to its undeformed state. In fact, given the same displacement demand, the remaining roof displacement for the Y-direction is around half of that calculated for the X-direction.
The mean ratio between the PO imposed drift Δ i and the residual drift Δ res is equal to 0.15 and 0.30 for the Y- and X-directions, but it rises from 0.12 to 0.19 and from 0.20 to 0.37 as the imposed demand increases for the X- and Y-directions, respectively. These values are smaller than the ratio obtained by means of experimental tests (0.45 according to [46] data), but for the weakest building direction, the ratio tends to match the experimental value at higher displacement demands.

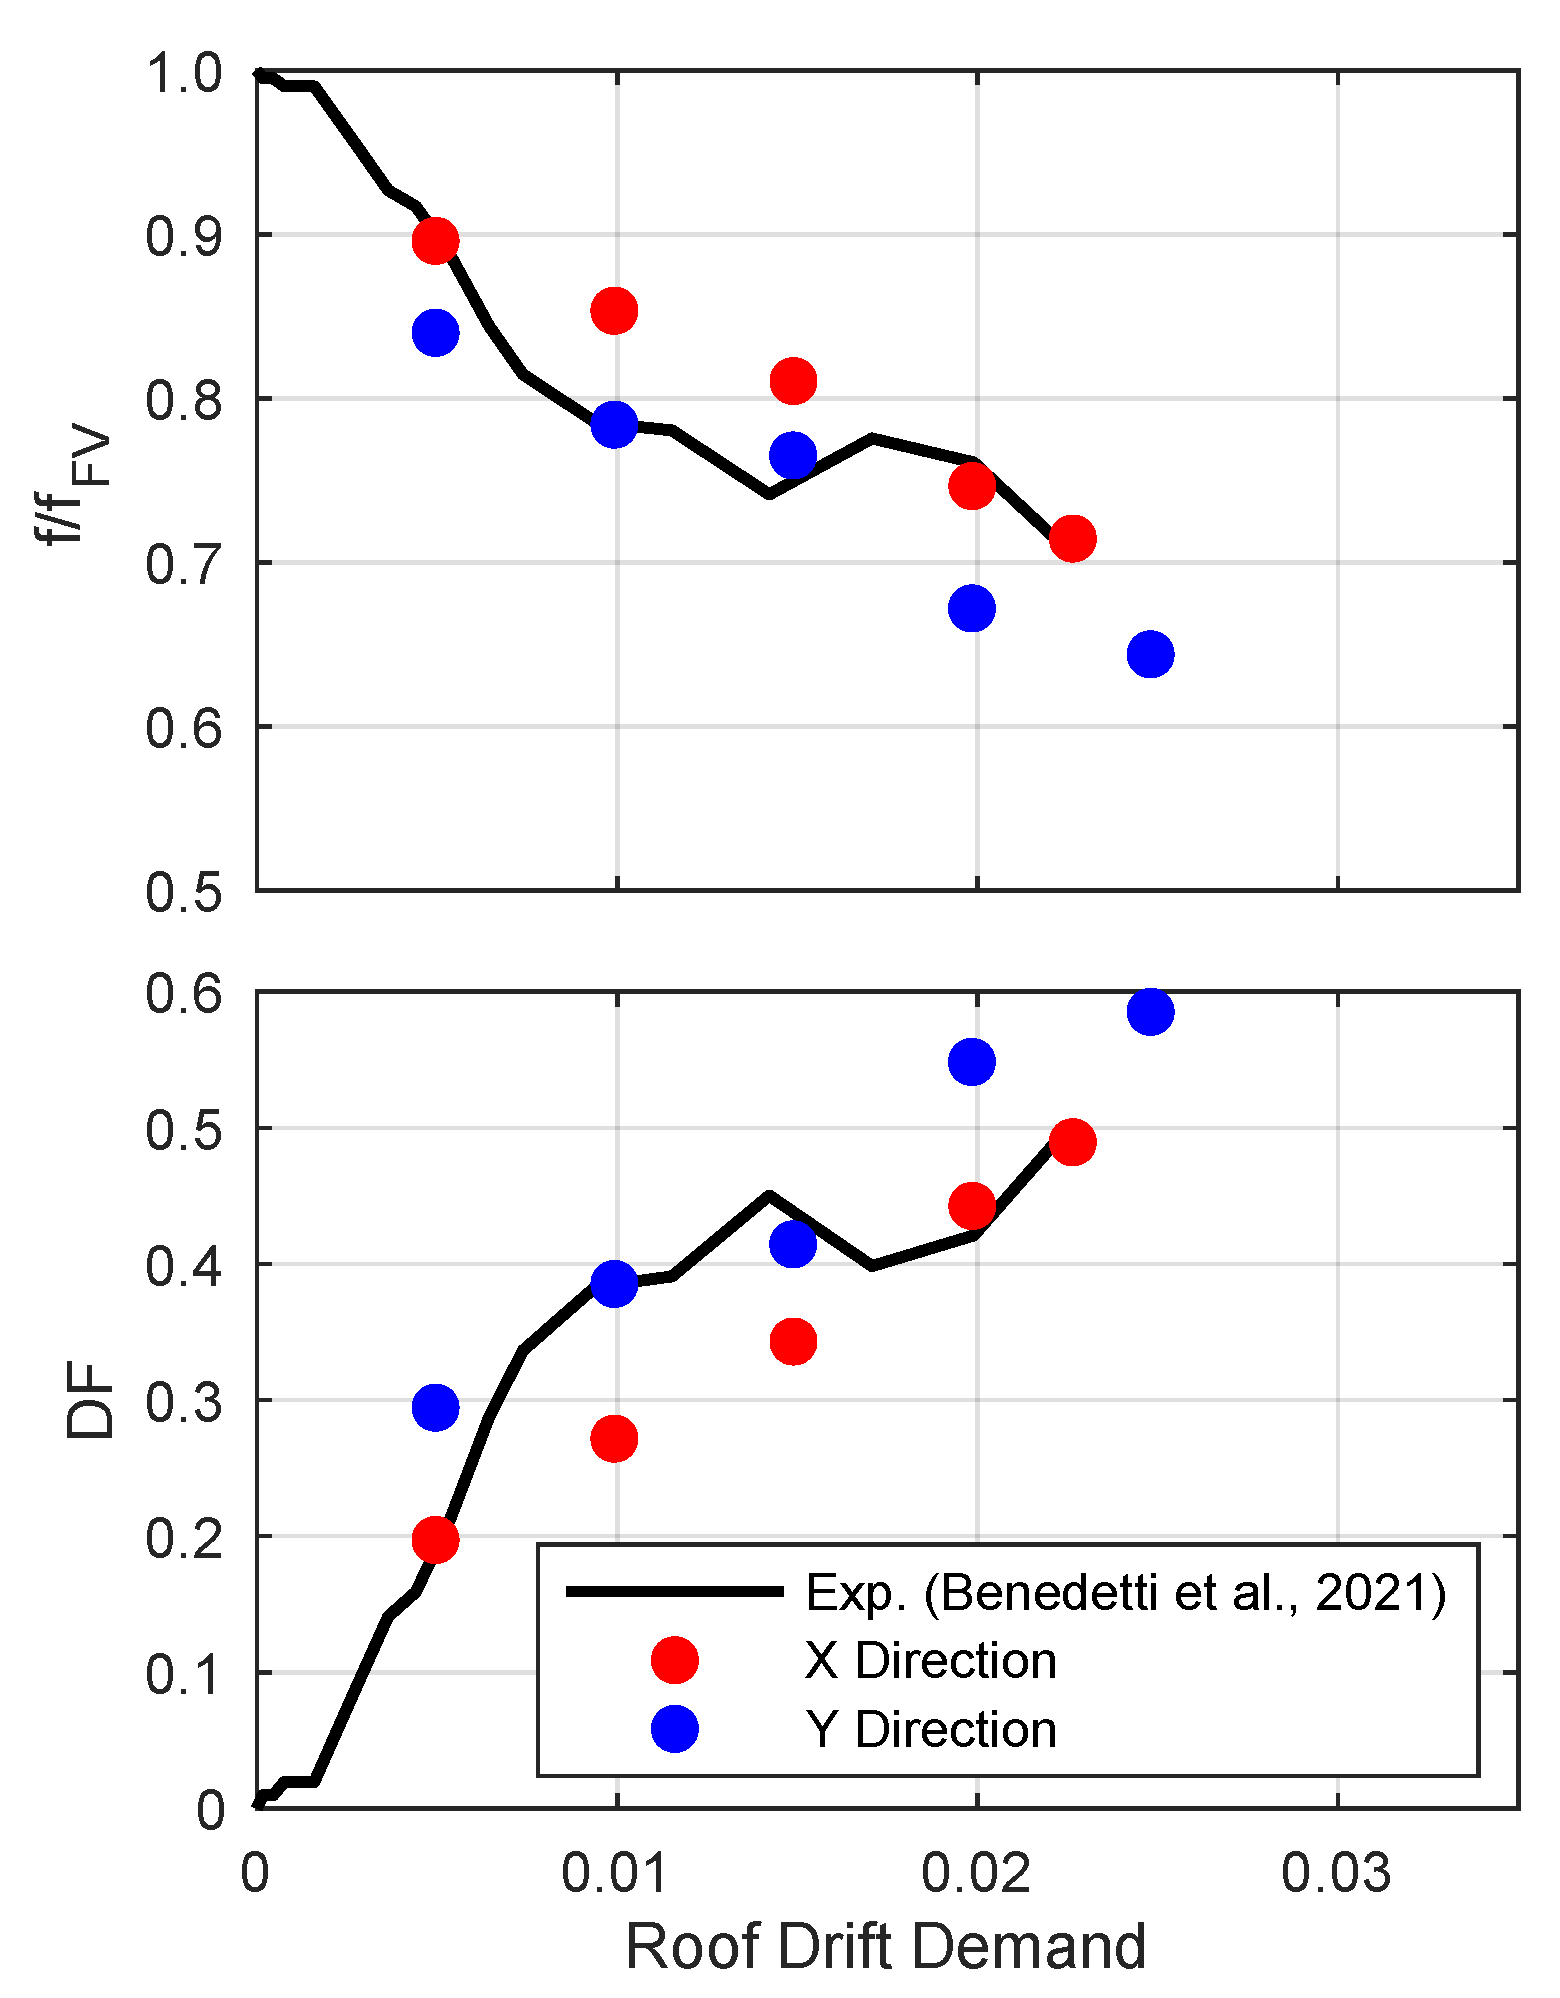
6.2.2. Fundamental Frequency Degradation

Knowing the undamaged frequency of the model for each direction ( f x and f y , Section 4.2), and the post-damage predominant frequency f F V defined by the FV responses shown in Figure 7, the frequency degradation can be assessed. The post-damage predominant frequency is calculated directly through a simple frequency domain transformation of the FV time series for each direction of the building.
As depicted in Figure 7, for the first 1.5 s of vibration, the free vibration period length increases as the roof drift demand rises. In order to quantify the degradation of the predominant frequency of each building axis, the ratio of the undamaged frequency against the damaged frequency is calculated for each direction and plotted against the PO roof drift demand (Figure 9). It is shown that the degradation for the longitudinal axis (Y-direction) is quicker than for the transverse axis, reaching ratios of 0.64 and 0.71 for the maximum imposed demand, respectively.
By comparing the period degradation results of the model with the available experimental data for the equivalent CLT structures, it can be observed that the modeled behavior closely matches the actual measured response. In Figure 9, the degradation is contrasted with the experimental results of ref. [46], where a similar trend can be noticed for the entire roof drift demand range. Moreover, the period degradationevel is similar to the reduction reported in the experimental studies of refs. [22,23]. They found that for a roof drift demand of 1%, the period degradation ratio is 0.82 [23], while according to the results of ref. [22], it is about 0.68 for 1.8% of the imposed roof drift.
Additionally, in Figure 9, the Final Softening Index is presented. Given the available DF and damage level relationships [55], it is observed that for roof drift demands larger than 1.5%, the global damage state can be categorized as severe (DF > 0.4). However, this statement is only an approximation because of the scarce evidence about the actual period reduction and the observed damage state of CLT structures.

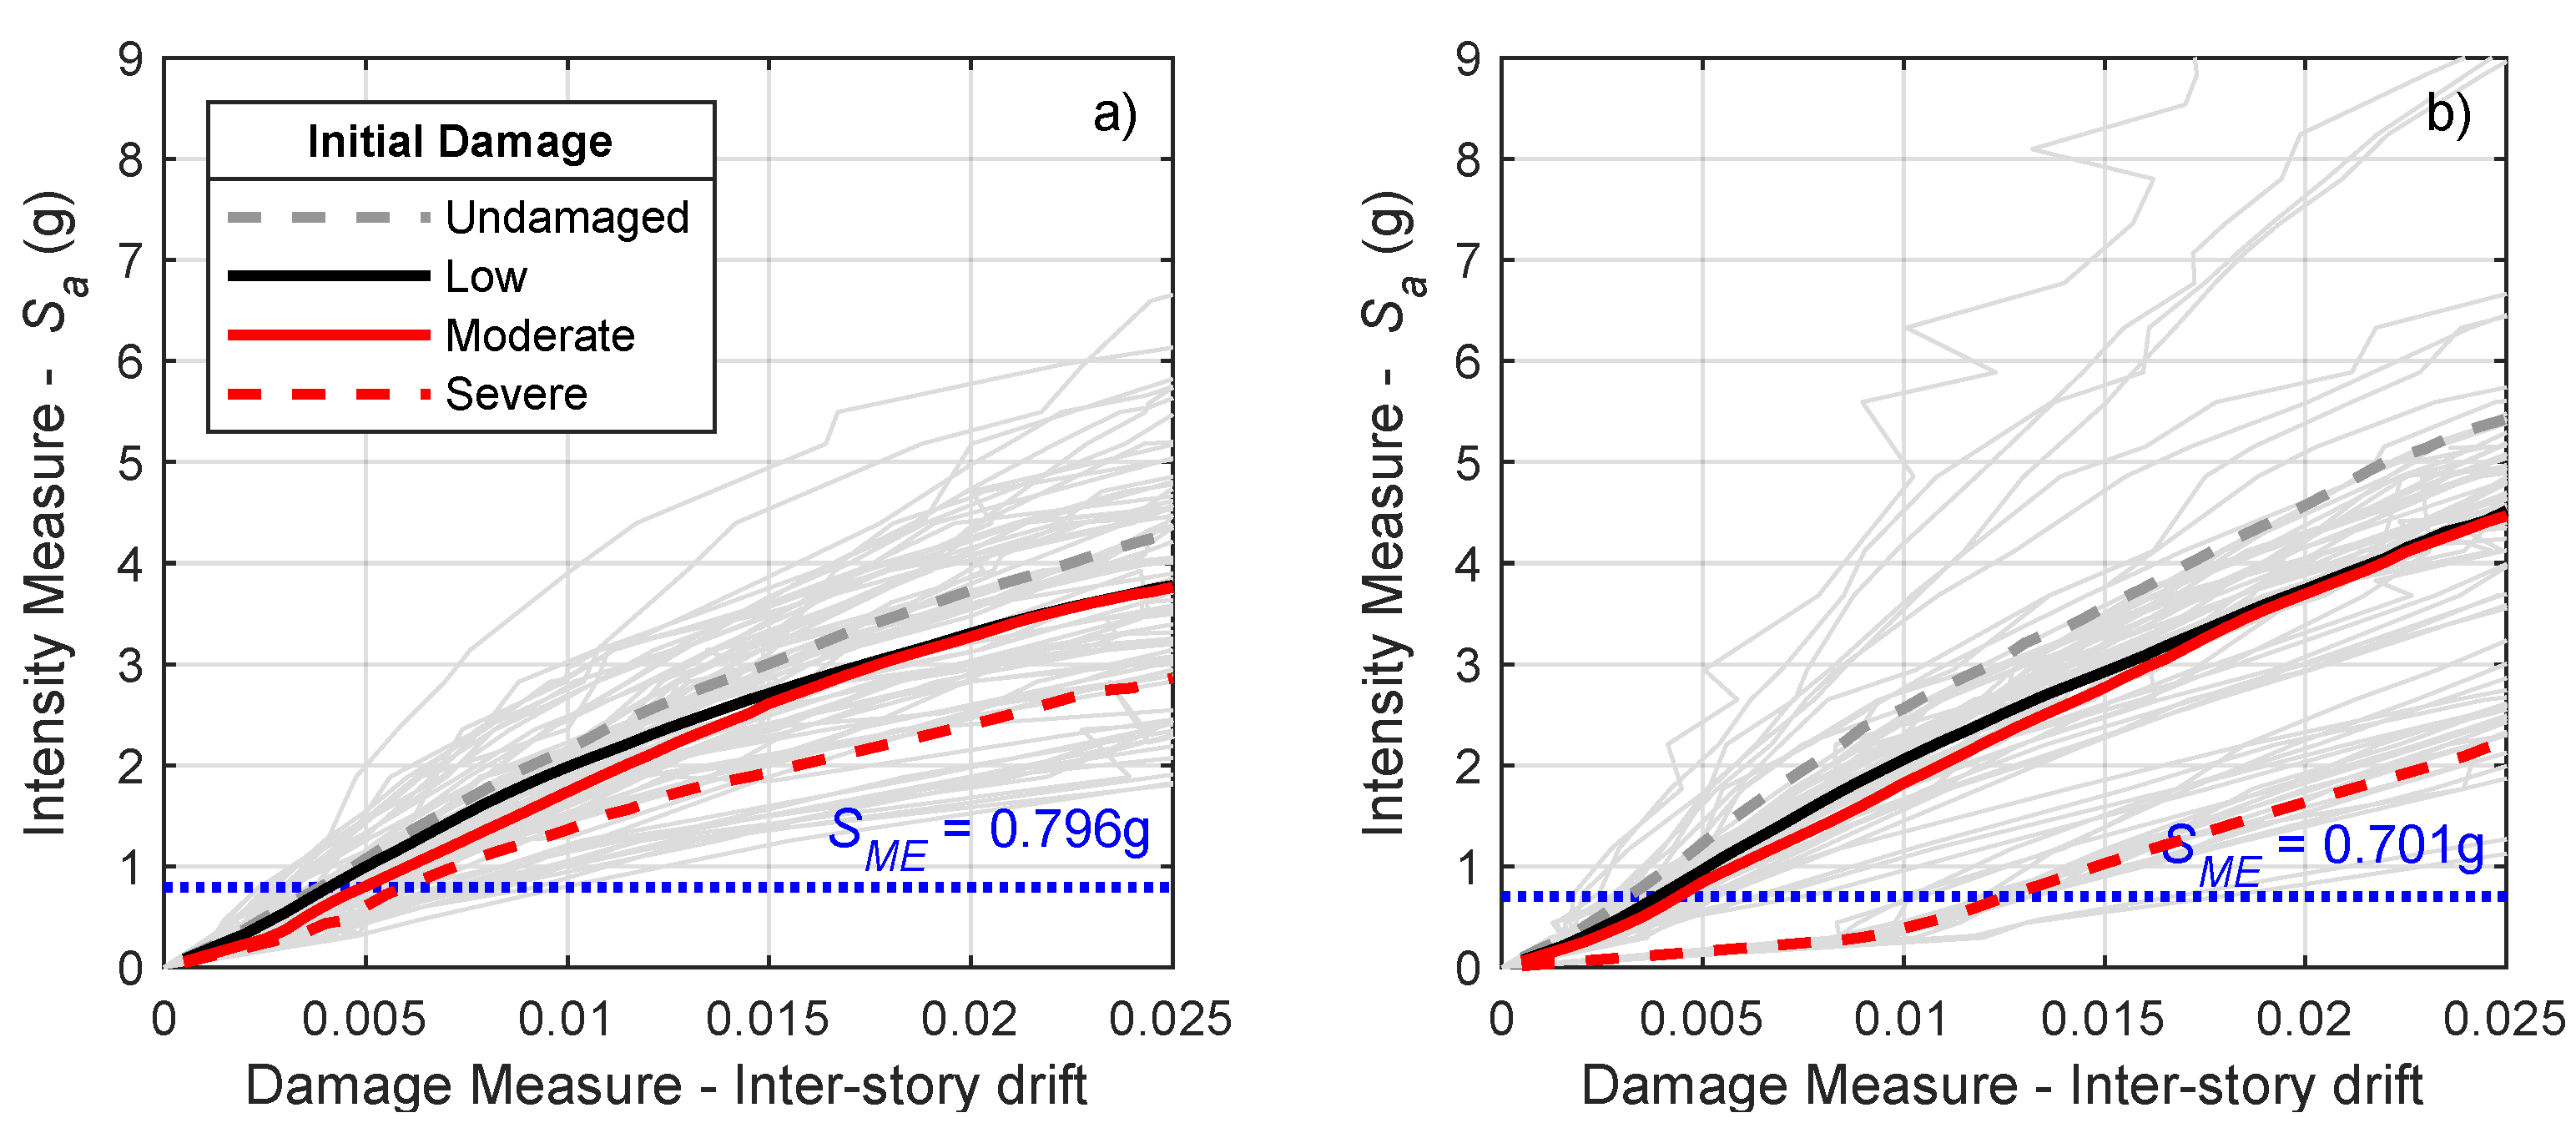
6.3. Seismic Fragility Assessment

Through the seismic fragility evolution analysis (Section 5.2), the effect of the initial damage on seismic fragility is assessed. Figure 10 shows the IDA curves for every Incremental Dynamic Analysis performed in each building’s direction. Moreover, this figure also shows the evolution of the median IM concerning the DM obtained for each considered initial damage, where it is clearly observed that the initial damage significantly reduces the median IM value. The maximum inter-story drift of the first story’s center of mass was used as the damage measure (DM) for each IDA, as it was consistently the largest across all time history analyses.
Although a specific analysis of the effect of individual acceleration recordings on the IDA curves was not performed, the normalization process seems to strongly affect the ground motion influence. Ground motions that required the most significant up-scaling to reach the target intensity level tended to produce the highest damage measure values. In addition. the inherent impact of the imposed motions’ frequency content on the damage response was likely amplified by the scalation and normalization process.
The results demonstrate that, for both building directions, the highest median IM corresponds to the case where the building has no initial damage (Undamaged). Conversely, the lowest median IM values are observed for the Severe initial damage cases. Although the median IM for Low initial damage is slightly higher than that for Moderate initial damage across the entire DM range, the difference becomes noticeable only for DM values below 0.015. For higher damage measure values, the difference between Low and Moderate initial damage becomes negligible.
As expected, according to the global lateral load behavior of the studied building (Figure 6), the median IM for the Undamaged, Low, and Moderate initial damage states obtained for the Y-direction are larger than those achieved for the X-direction. In contrast, for the Severe initial damage state, the median IM for the Y-direction falls significantly below the values obtained for the transverse axis, particularly at small DM values.
The Y-direction appears particularly sensitive to initial damage. Comparing the median IM for each damaged state to the Undamaged case, it is found that the ratio of the median values for Severe to Undamaged cases in the Y-direction ranges from 0.12 to 0.41, while for the X-direction it is 0.47 to 0.67. Similarly, the Moderate to Undamaged ratio is 0.62 to 0.82 for the Y-direction and 0.58 to 0.88 for the X-direction.
The analysis of the residual drift (Figure 8), fundamental frequency degradation, and Final Softening Index (DF) behavior (Figure 9) has revealed the greater sensitivity of the building’s Y-direction to the initial damage state. Despite exhibiting smaller residual drifts and a larger lateral load capacity, the Y-direction shows more pronounced degradation in both frequency and DF.
The larger sensitivity of the Y-direction of the building to the initial damage state has already been observed in the previous analyses (Figure 8 and Figure 9), where it was obtained that, even though the Y-direction reaches smaller residual drifts and has a larger lateral load capacity, the degradation of both the frequency and the DF is more notorious. This increased sensitivity is attributed to structural configuration differences between the X- and Y-directions, particularly the more extensive vertical openings in the walls parallel to the Y-direction.
Using the data of the IDA curves of Figure 10, the fragility functions are derived for each considered limit state for both building directions (Figure 11). In general, it is observed that the initial damage state impacts the probability of reaching a determined limit state given a certain spectral acceleration level S a (IM). For the Fully Operational limit state in both directions (Figure 11a,d), although the fragility functions for all initial damage states are relatively similar, a clear difference emerges when analyzing the probability of achieving this limit state, triggered by an acceleration level equal to the maximum considered earthquake intensity S M E . In the transverse building axis (X), these probabilities are 13.5%, 21.0%, 47,5%, and 82.5% for the Undamaged, Low, Moderate, and Severe initial damage states, respectively. Moreover, the achieved probabilities are 1.5%, 12.4%, 23.6%, and 100.0% for the Y-direction.
Concerning the fragility functions calculated for the Life Safety limit state, a more noticeable effect of the initial damage occurs, especially between the Undamaged and Severe initial states (Figure 11b,e). In the X-direction, the spectral acceleration needed to reach the same cumulative probability is approximately 0.6 to 0.7 times that of the Undamaged case when the initial damage is Severe. For the Y-direction, this reduction is even more significant, around 0.28 times. On the other hand, as previously suggested by Figure 10, the difference between the Low and Moderate initial states tends to vanish, implying that from this limit state onwards, no notable difference in the seismic response appears if the initial damage is either Low or Moderate. Furthermore, with regard to the probability of reaching the Life Safety limit state under a demand of S M E intensity, only for the Y-direction with Severe initial damage is larger than 0% (7.5% probability).
For the Collapse limit state, similar findings to the LS limit state are achieved. Figure 11c,f shows the significant effect of the Severe initial damage case due to an important reduction in the spectral accelerations needed to reach the same level of cumulative probability, as compared to the Undamaged case. Moreover, there is also a negligible difference between the behavior obtained for the Low and Moderate initial states. Nevertheless, the intermediate detrimental effect of these initial damage levels is evident.
In addition, the variation of the expected safety margin with respect to the initial damage is evaluated through the CMR values for each initial state and direction (Table 5). These ratios are calculated by dividing the median collapse accelerations obtained for each initial damage state depicted in Figure 11c,f (stated as S C T , U , S C T , L , S C T , M , and S C T , S for the Undamaged, Low, Moderate, and Severe initial states, respectively) by the corresponding S M E intensity. The results suggest that the safety margin against failure for the studied building is highly dependent on the initial damage state. If the initial damage state is considered Severe, the CMR values decrease by 33.2% and 58.8% compared to the Undamaged case for the X- and Y-directions, respectively. For their part, the Low and Moderate initial states correspond to an intermediate reduction condition of about 12% to 17%.
Despite the observed CMR reduction, the probability of reaching the Collapse limit state under an S M E intensity demand remains zero, regardless of the initial damage or building direction. This probability is even lower than that calculated for initially undamaged CLT structures [29,30,31]. Since these probabilities are below the 10% threshold recommended by FEMA P695 [56], the building appears to provide a sufficiently safe seismic response, even after experiencing a prior lateral load event.
Finally, the effect of the initial damage state on the seismic safety is explored through the relation between the CMR values and the residual roof drift corresponding to each initial damage state (Figure 12). The results show a generally linear decrease trend in CMR with increasing residual drift, with a steeper decline in the Y-direction compared to the X-direction. This fact indicates that while the Y-direction initially has a higher CMR for the Undamaged condition, it is more sensitive to the effects of initial damage. Therefore, smaller pre-earthquake residual drifts lead to a more significant reduction in the safety level.
Although we observe a remarkable effect of the initial damage state on the fragility functions and the CMR values, the smallest CMR (obtained for the Severe initial damage state) is in the same order of magnitude of the collapse margins reported in other studies, even though they defined the collapse level at larger inter-story drift values. Ref. Shahnewaz et al. [30] found a collapse margin ratio of 2.78 for 5% of the collapse level inter-story drift. Similarly, Pan et al. [29] showed a CMR of 3.18 for an inter-story drift of 7%.

7. Conclusions

This work assessed the effect of the initial damage state on the seismic behavior of a mid-rise cross-laminated timber building designed under a force-based scheme for a large earthquake-prone zone. Special attention was paid to the development of a high-quality numerical model aiming to accurately reproduce the lateral load dynamic response. The obtained results highlight the necessity to properly consider the effect of previous load actions on the seismic performance evaluation during the operation life of CLT structures.
The results suggest that the remaining deformation after a lateral load action can be significantly affected by the vertical load level. It was observed that for the building axis in which the vertical load transferred from the floor slabs was lower, the largest residual drifts occurred. Therefore, in a panelized floor slab system that works as a one-way element, it is particularly important to take into account the orientation of the floor system’s structural components in the structural configuration design to avoid lateral damage concentrations and unexpected residual deformations after lateral load events.
The structural configuration appears to play a key role in the effect of the initial damage on seismic performance. Despite having a larger overstrength factor, static stiffness, lateral load capacity, and less residual deformation prior to seismic actions, the Y-direction of the building was more susceptible to the detrimental effects of initial damage. This fact seems related to the large vertical opening area of the Y-direction, as well as the less in-plane bending stiffness of the slab system for this direction. Further research is required to explore how the failure mechanism and global structural configuration influence the effect of the initial damage level on the seismic response of CLT buildings.
The effect of the initial damage was observed in all three seismic limit states studied. Although the fragility functions apparently become notoriously separated for the Life Safety and Collapse limit states, our results suggest that the probability of achieving any of the considered limit states strongly depends on the initial damage level. For the case of the Fully Operational limit state, the probability of reaching this condition under a S M E intensity seismic excitation can vary from less than 2% for the Undamaged initial state to 100% if the initial damage is Severe. Similarly, the probability of achieving the Collapse limit state for the Severe initial damage state can be larger than 50%, even if the probability calculated when no initial damage occurs is near 0%. However, our results also suggest that the difference between the Low and Moderate initial damage levels vanishes if the limit state is related to high damage conditions.
The detrimental impact of the initial damage condition on the seismic performance becomes explicit in the relationship between the initial residual drift and the expected safety margin against collapse (CMR). For the studied building, this relationship appears to follow a linear decreasing trend, which shows that as the pre-earthquake deformation increases, the CMR can rapidly decrease to less than half of the safety margin calculated for an initially undamaged structure. Therefore, particular attention should be paid to the seismic safety of existing structures that have suffered lateral load events (or even decay or deterioration), where the expected margin against collapse for undamaged initial conditions is smaller than the values found in this research.
Through the analysis performed in this research, it is found that the studied building maintains a safe seismic behavior, even if the initial damage is classified as Severe. The expected safety margins and the collapse probability remain within acceptable thresholds and suitable engineering limits, suggesting both safety and resilience. Nevertheless, it is worth noting that the building’s design was developed under the regulations of seismic codes that do not include specific rules for CLT buildings. Consequently, the design was conservative, imposing large seismic demands and considering a small lateral deformation capacity. These design principles lead to a strong and stiff structure with low ductility but a high overstrength factor (5.4 and 8.7 for the X- and Y-directions). In particular, it seems that the large overstrength was a key aspect for the assurance of suitable seismic safety.
The results of this work have showcased the impact of the pre-earthquake state on the seismic performance of CLT buildings. Even though the work was focused on assessing the effect of an arbitrarily imposed initial structural damage, the actual initial state modification on existing timber structures might be a consequence of many different conditions (i.e., weathering, bio-chemical agents, insects, unexpected loads, physical and mechanical property decay, and creep, among others). Future work will focus on the service life seismic performance assessment of CLT structures, considering actual deterioration scenarios.
Finally, this work recommends carefully considering the previous loading history and current physical condition of timber elements when assessing the structural and seismic performance of existing CLT structures. The consequent decay of the mechanical properties of both the timber and its connections, caused by existing deterioration, can significantly compromise the seismic safety of CLT buildings.

Author Contributions

Conceptualization: F.B., J.Á.M. and A.J.-C.; Methodology: F.B. and J.Á.M.; Formal analysis and investigation: F.B., J.Á.M., A.J.-C., A.O.-V. and V.R.; Writing—original draft preparation: F.B. and A.J.-C.; Writing—review and editing: F.B., A.J.-C., A.O.-V., V.R. and J.Á.M.; Funding acquisition: F.B., V.R. and A.O.-V.; Resources: A.O.-V., F.B. and V.R.; Supervision: F.B., A.O.-V. and V.R. All authors have read and agreed to the published version of the manuscript.

Funding

This research was supported by Universidad del Bío-Bío, through project grant DICREA 2260525 IF/R.

Data Availability Statement

The data that support the findings of this study can be made available from the corresponding authors upon reasonable request.

Acknowledgments

The authors thank ANID BASAL FB210015 for their ongoing scientific collaboration with our academic department.

Conflicts of Interest

The authors declare no conflicts of interest.

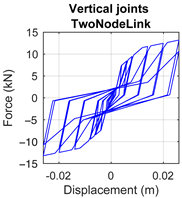
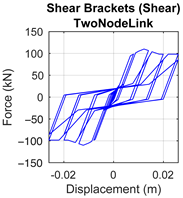
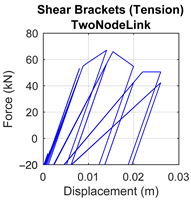
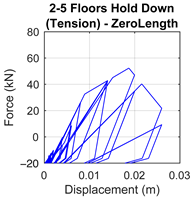
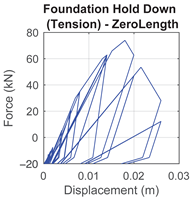
Appendix A. Summary of Connection Modeling Parameters

Table A1 presents the parameters of the pinching4 material model used for modeling the connections.
Table A1. Pinching4 model parameters of the different connections.
ParameterConnection Type
Vertical
Joints
Lintels Shear Brackets
(Shear)
Shear Brackets
(Tension)
2-5 Floors
Hold Down
Foundation
Hold Down
ePf1 (kN)7.38105.1292.6271.2052.5250.0
ePd1 (mm)3.882.4606.117.248.927.0
ePf2 (kN)11.50147.00105.0078.0062.4280.0
ePd2 (mm)12.0010.0010.0010.0013.8113.0
ePf3 (kN)13.29174.84110.1188.1972.3394.0
ePd3 (mm)26.6015.0012.2014.5018.7018.0
ePf4 (kN)5.00139.8898.3570.5712.4825.0
ePd4 (mm)35.0016.3018.3021.7032.9330.0
eNf1 (kN)−7.38−105.12−92.62−71.20−52.52−50.0
eNd1 (mm)−3.88−2.460−6.11−7.24−8.92−7.0
eNf2 (kN)−11.50−147.00−105.00−78.00−62.42−80.0
eNd2 (mm)−12.00−10.00−10.00−10.00−13.81−13.0
eNf3 (kN)−13.29−174.84−110.11−88.19−72.33−94.0
eNd3 (mm)−26.60−15.00−12.20−14.50−18.70−18.0
eNf4 (kN)−5.00−139.88−98.35−70.57−14.46−25.0
eNd4 (mm)−35.00−16.30−18.30−21.70−32.93−30.0
rDispP0.50.550.50.50.50.5
fForceP0.30.150.30.30.30.3
uForceP−0.050.030.050.05−0.05−0.05
rDispN0.50.550.50.50.50.5
fForceN0.40.150.30.30.40.4
uForceN−0.050.030.050.05−0.05−0.05
gK1−2.5000−2.5−2.5
gK2000000
gK3000000
gK4000000
gKLim−0.5000−0.5−0.5
gD1000000
gD2000000
gD3000000
gD4000000
gDLim0.080.970.950.950.080.08
gF1000000
gF2000000
gF3000000
gF4000000
gFLim00.050.10.100
gE111111
Damage Typeenergyenergyenergyenergyenergyenergy

References

  1. Shan, M.; Hwang, B.G.; Zhu, L. A Global Review of Sustainable Construction Project Financing: Policies, Practices, and Research Efforts. Sustainability 2017, 9, 2347. [Google Scholar] [CrossRef]
  2. Dong, Y.; Cui, X.; Yin, X.; Chen, Y.; Guo, H. Assessment of Energy Saving Potential by Replacing Conventional Materials by Cross Laminated Timber (CLT)—A Case Study of Office Buildings in China. Appl. Sci. 2019, 9, 858. [Google Scholar] [CrossRef]
  3. Penfield, P.; Germain, R.; Smith, W.B.; Stehman, S.V. Assessing the adoption of Cross Laminated Timber by architects and structural engineers within the United States. J. Green Build. 2022, 17, 127–147. [Google Scholar] [CrossRef]
  4. De Araujo, V.; Aguiar, F.; Jardim, P.; Mascarenhas, F.; Marini, L.; Aquino, V.; Santos, H.; Panzera, T.; Lahr, F.; Christoforo, A. Is Cross-Laminated Timber (CLT) a Wood Panel, a Building, or a Construction System? A Systematic Review on Its Functions, Characteristics, Performances, and Applications. Forests 2023, 14, 264. [Google Scholar] [CrossRef]
  5. Ceccotti, A.; Sandhaas, C.; Okabe, M.; Yasumura, M.; Minowa, C.; Kawai, N. SOFIE project—3D shaking table test on a seven-storey full-scale cross-laminated timber building. Earthq. Eng. Struct. Dyn. 2013, 42, 2003–2021. [Google Scholar] [CrossRef]
  6. Brandner, R.; Flatscher, G.; Ringhofer, A.; Schickhofer, G.; Thiel, A. Cross laminated timber (CLT): Overview and development. Eur. J. Wood Wood Prod. 2016, 74, 331–351. [Google Scholar] [CrossRef]
  7. Svatoš-Ražnjević, H.; Orozco, L.; Menges, A. Advanced Timber Construction Industry: A Review of 350 Multi-Storey Timber Projects from 2000 to 2021. Buildings 2022, 12, 404. [Google Scholar] [CrossRef]
  8. Baño, V.; Godoy, D.; Figueredo, D.; Vega, A. Characterization and Structural Performance in Bending of CLT Panels Made from Small-Diameter Logs of Loblolly/Slash Pine. Materials 2018, 11, 2436. [Google Scholar] [CrossRef]
  9. van de Lindt, J.W.; Amini, M.O.; Rammer, D.; Line, P.; Pei, S.; Popovski, M. Seismic Performance Factors for Cross-Laminated Timber Shear Wall Systems in the United States. J. Struct. Eng. 2020, 146, 04020172. [Google Scholar] [CrossRef]
  10. Shen, Y.L.; Schneider, J.; Tesfamariam, S.; Stiemer, S.F.; Mu, Z.G. Hysteresis behavior of bracket connection in cross-laminated-timber shear walls. Constr. Build. Mater. 2013, 48, 980–991. [Google Scholar] [CrossRef]
  11. Gavric, I.; Fragiacomo, M.; Ceccotti, A. Cyclic Behavior of CLT Wall Systems: Experimental Tests and Analytical Prediction Models. J. Struct. Eng. 2015, 141, e4015034. [Google Scholar] [CrossRef]
  12. Ganey, R.; Berman, J.; Akbas, T.; Loftus, S.; Daniel Dolan, J.; Sause, R.; Ricles, J.; Pei, S.; Lindt, J.v.d.; Blomgren, H.E. Experimental Investigation of Self-Centering Cross-Laminated Timber Walls. J. Struct. Eng. 2017, 143, e4017135. [Google Scholar] [CrossRef]
  13. Hashemi, A.; Zarnani, P.; Masoudnia, R.; Quenneville, P. Experimental Testing of Rocking Cross-Laminated Timber Walls with Resilient Slip Friction Joints. J. Struct. Eng. 2018, 144, e4017180. [Google Scholar] [CrossRef]
  14. Yasumura, M.; Kobayashi, K.; Okabe, M.; Miyake, T.; Matsumoto, K. Full-Scale Tests and Numerical Analysis of Low-Rise CLT Structures under Lateral Loading. J. Struct. Eng. 2016, 142, E4015007. [Google Scholar] [CrossRef]
  15. Benedetti, F.; Rosales, V.; Opazo-Vega, A.; Norambuena-Contreras, J.; Jara-Cisterna, A. Experimental and numerical evaluation of hold-down connections on radiata pine Cross-Laminated-Timber shear walls: A case study in Chile. Eur. J. Wood Wood Prod. 2019, 77, 79–92. [Google Scholar] [CrossRef]
  16. Rinaldin, G.; Amadio, C.; Fragiacomo, M. A component approach for the hysteretic behaviour of connections in cross-laminated wooden structures. Earthq. Eng. Struct. Dyn. 2013, 42, 2023–2042. [Google Scholar] [CrossRef]
  17. Gavric, I.; Fragiacomo, M.; Ceccotti, A. Cyclic behaviour of typical metal connectors for cross-laminated (CLT) structures. Mater. Struct. 2014, 48, 1841–1857. [Google Scholar] [CrossRef]
  18. Dietsch, P.; Brandner, R. Self-tapping screws and threaded rods as reinforcement for structural timber elements – A state-of-the-art report. Constr. Build. Mater. 2015, 97, 78–89. [Google Scholar] [CrossRef]
  19. Loss, C.; Piazza, M.; Zandonini, R. Connections for steel–timber hybrid prefabricated buildings. Part I: Experimental tests. Constr. Build. Mater. 2016, 122, 781–795. [Google Scholar] [CrossRef]
  20. Gavric, I.; Fragiacomo, M.; Ceccotti, A. Cyclic behavior of typical screwed connections for cross-laminated (CLT) structures. Eur. J. Wood Wood Prod. 2015, 73, 179–191. [Google Scholar] [CrossRef]
  21. van de Lindt, J.W.; Furley, J.; Amini, M.O.; Pei, S.; Tamagnone, G.; Barbosa, A.R.; Rammer, D.; Line, P.; Fragiacomo, M.; Popovski, M. Experimental seismic behavior of a two-story CLT platform building. Eng. Struct. 2019, 183, 408–422. [Google Scholar] [CrossRef]
  22. Popovski, M.; Gavric, I. Performance of a 2-Story CLT House Subjected to Lateral Loads. J. Struct. Eng. 2016, 142, e4015006. [Google Scholar] [CrossRef]
  23. Matos, F.T.; Branco, J.M.; Rocha, P.; Demschner, T.; Lourenço, P.B. Quasi-static tests on a two-story CLT building. Eng. Struct. 2019, 201, 109806. [Google Scholar] [CrossRef]
  24. Pei, S.; van de Lindt, J.W.; Barbosa, A.R.; Berman, J.W.; McDonnell, E.; Daniel Dolan, J.; Blomgren, H.E.; Zimmerman, R.B.; Huang, D.; Wichman, S. Experimental Seismic Response of a Resilient 2-Story Mass-Timber Building with Post-Tensioned Rocking Walls. J. Struct. Eng. 2019, 145, e4019120. [Google Scholar] [CrossRef]
  25. Mugabo, I.; Barbosa, A.R.; Sinha, A.; Higgins, C.; Riggio, M.; Pei, S.; van de Lindt, J.W.; Berman, J.W. System Identification of UCSD-NHERI Shake-Table Test of Two-Story Structure with Cross-Laminated Timber Rocking Walls. J. Struct. Eng. 2021, 147, e4021018. [Google Scholar] [CrossRef]
  26. Pei, S.; Ryan, K.L.; Berman, J.W.; van de Lindt, J.W.; Pryor, S.; Huang, D.; Wichman, S.; Busch, A.; Roser, W.; Wynn, S.L.; et al. Shake-Table Testing of a Full-Scale 10-Story Resilient Mass Timber Building. J. Struct. Eng. 2024, 150, e4024183. [Google Scholar] [CrossRef]
  27. Chen, J.; Wu, Z.; Zheng, Y.; Furuta, T.; Xiong, H. Full-scale shaking table tests of cross-laminated timber structures adopting dissipative angle brackets and hold-downs with soft-steel and rubber. Eng. Struct. 2024, 313, 118292. [Google Scholar] [CrossRef]
  28. Li, Z.; Tsavdaridis, K.D. Design for Seismic Resilient Cross Laminated Timber (CLT) Structures: A Review of Research, Novel Connections, Challenges and Opportunities. Buildings 2023, 13, 505. [Google Scholar] [CrossRef]
  29. Pan, Y.; Shahnewaz, M.; Tannert, T. Seismic Performance and Collapse Fragility of Balloon-Framed CLT School Building. J. Earthq. Eng. 2022, 27, 3115–3135. [Google Scholar] [CrossRef]
  30. Shahnewaz, M.; Pan, Y.; Shahria Alam, M.; Tannert, T. Seismic Fragility Estimates for Cross-Laminated Timber Platform Building. J. Struct. Eng. 2020, 146, e4020256. [Google Scholar] [CrossRef]
  31. Aloisio, A.; Alaggio, R.; Fragiacomo, M. Fragility functions and behavior factors estimation of multi-story cross-laminated timber structures characterized by an energy-dependent hysteretic model. Earthq. Spectra 2020, 37, 134–159. [Google Scholar] [CrossRef]
  32. Khalil, C.; Lopez-Caballero, F. Survival analysis of a liquefiable embankment subjected to sequential earthquakes. Soil Dyn. Earthq. Eng. 2021, 140, 106436. [Google Scholar] [CrossRef]
  33. Hassan, E.M.; Admuthe, S.; Mahmoud, H. Response of semi-rigid steel frames to sequential earthquakes. J. Constr. Steel Res. 2020, 173, 106272. [Google Scholar] [CrossRef]
  34. Mohsenian, V.; Gharaei-Moghaddam, N.; Hajirasouliha, I. Seismic performance assessment of tunnel form concrete structures under earthquake sequences using endurance time analysis. J. Build. Eng. 2021, 40, 102327. [Google Scholar] [CrossRef]
  35. Xu, J.G.; Wu, G.; Feng, D.C.; Fan, J.J. Probabilistic multi-hazard fragility analysis of RC bridges under earthquake-tsunami sequential events. Eng. Struct. 2021, 238, 112250. [Google Scholar] [CrossRef]
  36. Petrone, C.; Rossetto, T.; Baiguera, M.; la Barra Bustamante, C.D.; Ioannou, I. Fragility functions for a reinforced concrete structure subjected to earthquake and tsunami in sequence. Eng. Struct. 2020, 205, 110120. [Google Scholar] [CrossRef]
  37. Rosales, V.; Benedetti, F.; Suazo, M.; Vargas, M.; Rojas, I.; Jara, A.; Rebolledo, A. Associativity between SMEs towards mid-rise building timber construction: PymeLab Project. In Proceedings of the World Conference on Timber Engineering, Santiago, Chile, 9–12 August 2021; pp. 9–12. [Google Scholar]
  38. Instituto Nacional de Normalización. NCh433: 1996 Mod 2009: Diseño síSmico de Edificios; Instituto Nacional de Normalización: Santiago, Chile, 2009. [Google Scholar]
  39. Instituto Nacional de Normalización. Nch 1198; Instituto Nacional de Normalización: Santiago, Chile, 2014. [Google Scholar]
  40. Karacabeyli, E.; Gagnon, S. Canadian CLT Handbook, 2019; National Library of Canada: Ottawa, ON, Canada, 2019. [Google Scholar]
  41. Izzi, M.; Casagrande, D.; Bezzi, S.; Pasca, D.; Follesa, M.; Tomasi, R. Seismic behaviour of Cross-Laminated Timber structures: A state-of-the-art review. Eng. Struct. 2018, 170, 42–52. [Google Scholar] [CrossRef]
  42. Benedetti, F.; Valenzuela, T.; Jara-Cisterna, A.; Opazo-Vega, A.; Rosales, V. Incremental dynamic analysis of a five storeys CLT building designed through force-based methods. In Proceedings of the World Conference on Timber Engineering (WCTE 2023), Oslo, Norway, 19–22 June 2023. [Google Scholar] [CrossRef]
  43. Benedetti, F.; Jara-Cisterna, A.; Meza, S.; Castillo, J.; Casanova, E. Nonlinear Modeling of Midrise Cross-Laminated Timber Buildings Through Parallel and Sequential Computing Techniques. In Proceedings of the 2022 Eurasian OpenSees Days; Springer: Cham, Switzerland, 2023; pp. 388–397. [Google Scholar] [CrossRef]
  44. McKenna, F.; Scott, M.H.; Fenves, G.L. Nonlinear Finite-Element Analysis Software Architecture Using Object Composition. J. Comput. Civ. Eng. 2010, 24, 95–107. [Google Scholar] [CrossRef]
  45. Sayegh, A.T.A.; Sotelino, E.D. A new row-wise parallel finite element analysis algorithm with dynamic load balancing. Int. J. Earthq. Impact Eng. 2020, 3, 120. [Google Scholar] [CrossRef]
  46. Benedetti, F.; Rosales, V.; Opazo-Vega, A.; Sepúlveda, S.; Jara-Cisterna, A. Experimental analysis of a two-story three-dimensional panelized CLT module. In Proceedings of the World Conference on Timber Engineering WCTE2020, Santiago, Chile, 9–12 August 2021; pp. 24–27. [Google Scholar]
  47. Blass, H.J.; Fellmoser, P. Design of solid wood panels with cross layers. In Proceedings of the 8th World Conference on Timber Engineering, Lahti, Finland, 14–17 June 2004; Volume 14, p. 2004. [Google Scholar]
  48. Asparren, K. Characterization of the Mechanical Behavior of Screws in Cross Laminated Timber Walls. Bachelor’s Thesis, University of Bío-Bío, Concepción, Chile, 2019. [Google Scholar]
  49. Casagrande, D.; Polastri, A.; Sartori, T.; Loss, C.; Chiodega, M. Experimental tests for mechanical characterization of timber buildings connections. In Proceedings of the World Conference on Timber Engineering (WCTE 2016), Vienna, Austria, 22–25 August 2016. [Google Scholar]
  50. Jara-Cisterna, A.; Benedetti, F.; Rosales, V.; Almazán, J.L.; Opazo-Vega, A. Vibration-based monitoring of a cross-laminated timber building in a high seismicity zone. J. Civ. Struct. Health Monit. 2024, in press. [Google Scholar] [CrossRef]
  51. DiPasquale, E.; Ju, J.; Askar, A.; undefinedakmak, A.S. Relation between Global Damage Indices and Local Stiffness Degradation. J. Struct. Eng. 1990, 116, 1440–1456. [Google Scholar] [CrossRef]
  52. Ghobarah, A.; Abou-Elfath, H.; Biddah, A. Response-based damage assessment of structures. Earthq. Eng. Struct. Dyn. 1999, 28, 79–104. [Google Scholar] [CrossRef]
  53. Vamvatsikos, D.; Cornell, C.A. Incremental dynamic analysis. Earthq. Eng. Struct. Dyn. 2001, 31, 491–514. [Google Scholar] [CrossRef]
  54. ACHISINA. Diseño Sísmico Basado en Desempeño. Un Procedimiento Alternativo para el Análisis y Diseño Sísmico de Edificios, 1st ed.; Chilean Association of Seismology and Earthquake Engineering: Santiago, Chile, 2017. (In Spanish) [Google Scholar]
  55. Ghobarah, A. On drift limits associated with different damage levels. In Proceedings of the Performance-Based Seismic Design Concepts and Implementation International Workshop, Bled, Slovenia, 28 June–1 July 2004; Fajfar, P., Krawinkler, H., Eds.; Pacific Earthquake Engineering Research Center: Berkeley, CA, USA, 2004; pp. 321–332. [Google Scholar]
  56. FEMA. Quantification of Building Seismic Performance Factors; Federal Emergency Management Agency: Washington, DC, USA, 2009.
Figure 1. Floor plan and elevation views (top). Image during the construction stage, and the finished state of the building (bottom).
Buildings 15 00727 g001
Figure 2. Cross-laminated timber (CLT) shear wall components (right) and model implementation (left).
Buildings 15 00727 g002
Figure 3. Deformation mechanism (top), and lateral load-displacement response comparisons (bottom).
Buildings 15 00727 g003
Figure 4. Two-step analysis scheme developed for the initial damage state assessment.
Buildings 15 00727 g004
Figure 5. Unscaled elastic ground motion spectra of the seismic demands used for the IDA.
Buildings 15 00727 g005
Figure 6. Studied building capacity curves.
Buildings 15 00727 g006
Figure 7. Free vibration (FV) response after the imposed pushover roof displacement. Initial FV response (left) and residual drift at the end of the FV stage (right).
Buildings 15 00727 g007
Figure 8. Residual drift with respect to the imposed roof displacement demand.
Buildings 15 00727 g008
Figure 9. Fundamental frequency degradation (above) and Final Softening Index (DF) evolution (bellow) with respect to roof displacement demand.
Buildings 15 00727 g009
Figure 10. Variation of the median IM with respect to the inter-story drift (DM) and the initial damage level for the X-direction (a) and Y-direction (b). Light gray lines correspond to the IDA curves of each considered seismic demand for all the initial damage states.
Buildings 15 00727 g010
Figure 11. Fragility curves for the following limit states and directions: (a) Fully Operational in X-direction, (b) Life Safety in X-direction, (c) Collapse in Y-direction, (d) Fully Operational in Y-direction, (e) Life Safety in Y-direction, and (f) Collapse in Y-direction.
Buildings 15 00727 g011
Figure 12. Relationship between initial damage residual roof drift ( Δ res ) and the Collapse Margin Ratio (CMR).
Buildings 15 00727 g012
Table 1. Calibrated constitutive laws and elements used for modeling of connections.
Buildings 15 00727 i001Buildings 15 00727 i002Buildings 15 00727 i003
Buildings 15 00727 i004Buildings 15 00727 i005Buildings 15 00727 i006
Table 2. Mechanical properties of CLT walls and slabs.
Mechanical PropertiesValue
Elastic Modulus Ex (3 layers)2750 MPa
Elastic Modulus Ey (3 layers)5250 MPa
Elastic Modulus Ex (5 layers)1755 MPa
Elastic Modulus Ey (5 layers)6250 MPa
Shear Modulus324 MPa
Poisson Coefficient0.3
Density450 kg/m3
Table 3. FEM and experimental vibration periods comparison for the prototype building.
T x (s) T y (s) f x (hz) f y (hz)
FE Model0.320.283.123.57
Measurement Results0.320.273.133.66
Table 4. Main parameters of the seismic demands employed in the IDA.
Earthquake M w StationDirectionPGA (g)PGV (m/s)Sig. Duration (s)
Maule 20108.8CCPL0.400.6780.7
T0.280.5188.1
CSPEO0.600.4372.8
NS0.650.3769.5
AngolNS0.690.3750.8
EO0.930.3349.8
PeñalolénNS0.290.2233.7
EO0.290.2934.2
ValdiviaNS0.130.1833.9
EO0.090.1329.0
Algarrobo 19858.0Llolleo100.710.4035.9
1000.440.2340.8
Mexico City 19858.1SCTEO0.160.5839.0
NS0.090.3571.1
Loma Prieta 19896.9Treasure Island00.090.156.0
900.150.334.4
Yerba buena00.020.0418.7
900.060.148.0
Table 5. Collapse Margin Ratio (CMR) for each initial damage state.
DirectionUndamagedLowModerateSevere
X (Transverse)5.394.754.743.60
Y (Longitudinal)6.815.685.662.80
Disclaimer/Publisher’s Note: The statements, opinions and data contained in all publications are solely those of the individual author(s) and contributor(s) and not of MDPI and/or the editor(s). MDPI and/or the editor(s) disclaim responsibility for any injury to people or property resulting from any ideas, methods, instructions or products referred to in the content.

