Article

Collapse Fragility Analysis of RC Frame Structures Considering Capacity Uncertainty

by
Tailin Zeng
and
Yang Li
*
College of Civil Engineering, Hunan University, Changsha 410082, China
*
Author to whom correspondence should be addressed.
Buildings 2025, 15(5), 694; https://doi.org/10.3390/buildings15050694
Submission received: 8 January 2025 / Revised: 10 February 2025 / Accepted: 18 February 2025 / Published: 23 February 2025

Abstract

To analyze the impact of capacity uncertainty on the seismic collapse fragility of reinforced concrete (RC) frame structures, a fragility analysis framework based on seismic reliability methods is proposed. First, incremental dynamic analysis (IDA) curves are plotted by IDA under a group of natural seismic waves. Subsequently, collapse points are identified based on recommendations from relevant standards, yielding the probability distribution of the maximum inter-story drift ratios (MIDRs) at collapse points. Then, the distribution of the MIDRs under various intensity measures (IMs) of artificial seismic waves is calculated by using the fractional exponential moments-based maximum entropy method (FEM-MEM). Next, the structural failure probability is determined based on the combined performance index (CPI), and a seismic collapse fragility curve is plotted using the four-parameter shifted generalized lognormal distribution (SGLD) model. The results indicate that the collapse probability is lower considering the capacity uncertainty. Compared to deterministic MIDR limits of 1/25 and 1/50, the median values of the structure’s collapse resistance increased by 13.2% and 87.3%, respectively. Additionally, the failure probability obtained by considering the capacity uncertainty is lower than the results based on deterministic limits alone. These findings highlight the importance of considering capacity uncertainty in seismic risk assessments of RC frame structures.

1. Introduction

Earthquakes are one of the common natural disasters, and strong earthquakes may cause structural damage or even collapse, resulting in significant loss of life and property. Such earthquakes often trigger nonlinear structural failures and collapses. Consequently, it is imperative to investigate the seismic collapse fragility under seismic loading. Fragility analysis is a crucial component of seismic risk analysis, with the main purpose of evaluating the probability that structures exceed one specific limit state under varying IMs. This analysis facilitates a probabilistic assessment of structural seismic performance, revealing the intrinsic relationship between earthquake intensity and structural damage on a macro scale.
Seismic fragility is the possibility of a certain degree of damage to engineering structures under the influence of earthquakes of different intensities [1,2,3]. It can quantitatively describe the seismic performance of structures from a probabilistic perspective, reflecting the relationship between earthquake intensity and structural failure probability. In the early fragility analysis, a damage probability matrix (DPM) is proposed to describe the degree of damage to building structures exposed to different intensities [4]. Another method of describing seismic fragility results is to use smooth and continuous curves to characterize the variation of structural failure probability with seismic intensity. It originated from the seismic probability risk assessment in the nuclear industry in the 1970s [2], and subsequently, fragility curves have been widely used for fragility analysis of various engineering structures. The fragility curve can be categorized as empirical, judgmental, analytical, and hybrid based on the different sources of data and methods [5]. The analytical method is widely used for seismic fragility analysis with a large number of time history analyses. The incremental dynamic analysis (IDA) method was first adopted for fragility analysis [6,7]; multiple stripe analysis [8,9] and cloud analysis [10,11] are alternative methods for time history analysis. Sainct et al. [12] proposed a method for estimating fragility curves based on a combination of support vector machines and active learning algorithms. Kazemi et al. [13] proposed a seismic risk assessment method for reinforced concrete buildings based on machine learning algorithms, providing an effective and accuracy tool for RC building seismic risk assessment. Feng et al. [14] proposed a PDEM- based non-parametric seismic fragility assessment framework without pre-defined distribution of the structural demand and performance. Liu et al. [15] predicted the seismic damage of a steel frame by training an artificial neural network. Xu et al. [16] deduced the failure probability of the structure under earthquake action using the method of dynamic reliability. Mai et al. [17] computed the fragility curves for a three-story steel frame using kernel density estimation without assuming the shape for the fragility curve. Furthermore, artificial intelligence has been applied in fragility analysis as well, presenting novel alternatives for seismic risk assessment [18,19,20].
IDA is a widely employed method for assessing structural collapse fragility in structural collapse fragility analysis, initially proposed by Bertero [21] in 1977 and later endorsed by the Federal Emergency Management Agency (FEMA) in the FEMA 350 [22] document in 2000. Fattahi et al. [23] used the IDA to investigate the seismic collapse fragility of steel moment frames of varying heights. Cardone et al. [24] employed IDA to study the collapse fragility functions of both an isolation system and superstructure. Meanwhile, Dabaghi et al. [25] explored the impact of different structural parameters on the seismic collapse fragility of reinforced concrete shear wall structures. The IDA derives results from the dynamic time history analyses of structures subjected to seismic excitations. It typically identifies collapse points based on fixed response limits and yields fragility curves using lognormal distributions. However, relying solely on fixed parameters such as a specific displacement to determine a structure’s ultimate capacity may lead to misjudgments in assessing the collapse fragility. Moreover, the uncertainties associated with both structural capacity and engineering demand parameters (EDPs) have not yet been incorporated into fragility studies. Therefore, accurately defining the collapse limit states of structures is crucial for the seismic collapse fragility analysis of structures.
According to Chinese regulations, previous studies [16] have classified the levels of structural damage based on inter-story drift ratios. These classifications are as follows: slight damage (SD = 1/550), moderate damage (MD = 1/100), extensive damage (ED = 1/50), and complete damage (CD = 1/25). In fragility analysis focused on collapse risk, the collapse limit states are typically determined based on specific thresholds of key indicators, such as inter-story drift ratios.
However, in engineering practice, the inter-story drift ratio at the collapse point is not a fixed value. To investigate the distribution of the maximum inter-story drift ratios (MIDRs) at collapse points, this study defines collapse scenarios based on the thresholds from FEMA 350 [22] and other literature [26]: A structure is considered to be in a collapse scenario when the tangent stiffness of the IDA curve decreases to 20% or less of the initial value or when the inter-story drift ratio exceeds 0.045.
Based on the defined collapse criteria, this study proposes a fragility analysis framework grounded in seismic reliability methods, innovatively incorporating uncertainties related to the bearing capacity of RC frame structures and the EDPs. The purpose of the research is to provide a more comprehensive and accurate analytical framework for earthquake risk assessment, which helps to better understand and predict the performance and safety of structures under seismic events.
This study employs OpenSees 3.5 to construct a finite element model of the interested structure. IDA is performed using natural seismic waves motivating the structure, allowing for the identification of collapse points and their corresponding MIDR based on the defined collapse states. The probability distribution of the MIDRs is then fitted to serve as a criterion for determining the collapse limit states. Subsequently, stochastic seismic excitations of artificial samples are generated in accordance with Chinese regulations, followed by time history analyses of the structure. Using the defined collapse state, the distribution of the EDPs under various IMs is fitted using the fractional exponential moments-based maximum entropy method (FEM-MEM). Next, the failure probability of the structure under different IMs is calculated using the combined performance index (CPI), which is derived from the difference between the EDPs values and the distribution of MIDRs at collapse points. Finally, the collapse fragility curve of the structure is fitted using a shifted generalized lognormal distribution. The process of the method proposed in this article is shown in Figure 1.

2. Seismic Collapse Fragility Analysis Considering Uncertainty in the Bearing Capacity

2.1. Problem Description

IDA can provide valuable insights into the response and damage accumulation of structures under various IMs. According to the suggestion of FEMA350 [22], there are two main criteria for determining structural collapse. The first is that the tangent stiffness of the IDA curve reduces to 20% of the initial stiffness. The second is that the MIDR of the structure exceeds 0.1. These two criteria are derived from extensive testing and on-site observations, offering significant practical values for assessing the structural collapse state. In current reliability-based fragility analyses, it is essential to obtain the distribution of the EDPs and to obtain the failure probability on the basis of a predetermined threshold.
However, the structural responses under stochastic earthquake excitation (such as inter-story drift ratio, etc.) inherently exhibit randomness and uncertainty. Therefore, when performing structural seismic collapse fragility analysis, it is vital to comprehensively consider these uncertain factors to achieve more accurate and reliable results. This method provides a stronger scientific foundation for the seismic design and risk assessment of structures.
In existing fragility studies [27], many scholars have conducted in-depth discussions on the uncertainty related to structures and seismic movements. Cao [28] proposed an analytical framework for seismic hazard and fragility that comprehensively considers uncertainties in both structural capacity and demand. Similarly, Jia et al. [29] investigated the uncertainties in the mean and standard deviation of the EDPs and thresholds, successfully extending traditional probabilistic seismic risk analysis formulas to scenarios involving probability distributions.
It is worth noting that the demand uncertainty is generally more significant than the capacity uncertainty [28]. However, in numerous seismic studies, the uncertainty in the capacity is often overlooked or simplified, which may lead to bias in the fragility analysis results, potentially misguiding seismic design and decision-making.

2.2. Seismic Fragility Analysis of Structures Based on Seismic Reliability

2.2.1. Seismic Reliability Analysis Based on the Fractional Exponential Moments-Based Maximum Entropy Method

Accurately and efficiently determining the seismic demand distribution of a structure is crucial for calculating the failure probability and conducting a fragility analysis. This study examines structural fragility from the perspective of seismic reliability, using the FEM-MEM to derive the distribution of the MIDRs under stochastic seismic motions.
For structures under seismic events, the response of interest in this paper is represented by Equation (1). Subsequently, the structural failure probability is derived, followed by the fragility analysis.
Z ( t ) = W X ( t ) , X ˙ ( t ) = W Φ , t
where W and W are the corresponding physical operators.
The maximum absolute value Z of the structural response is given by
Z = max t [ 0 , T ] Z ( t )
Through this method, the maximum response of the structure under earthquake action can be more accurately captured, providing a solid foundation for the fragility analysis.
For a continuous random variable Z, its probability density function is expressed as f Z ( z ) . The FEM-MEM shown in Equation (3) can be used to solve the probability density function of Z [30]:
Find : α ¯   and   λ = λ 1 , λ 2 , , λ m Minimize : Γ ( α , λ ) = log Ω z exp k = 1 m λ k exp ( α k z )   d z + k = 1 m λ k M Z α k Subject   to : 2 α ¯ 2
where M Z α k is the k-th fractional exponential moments based on the random variable Z, and m is the number of constraints. As long as the values of α and λ are determined, the probability density function of the random variable Z can be obtained. An effective univariate strategy is adopted to solve α [31], and the formula is as follows:
α k = k α * m = k α ¯ , k = 1 , , m
where α ¯ is a low fractional order, usually taken as [−2,2], which simplifies the solution of α . After the initial value of α is determined, the Lagrange multiplier λ is determined using an estimator–corrector scheme [32]. After determining the values of λ and α , the probability density function of the random variable Z can be obtained through Equation (3).
Based on the above methods, this study utilizes the FEM-MEM to fit the structural response obtained from the time history analyses. The probability distributions of the EDPs (D) and the MIDRs at the collapse points (C) are derived.
The probability distribution of the CPI, defined as the difference value between the MIDR at collapse point C and the EDPs (D), is obtained. Finally, the structural failure probability can be calculated by
P r ( DM | IM ) = 1 CDF CPI | IM ( 0 ) = 1 0 p CPI | IM
In the fragility analysis, the focus is typically placed on large failure probability [16]. The method adopted in this paper is capable of capturing the main body of the extreme response and efficiently reconstructing the PDF of the CPI to calculate the failure probability. Consequently, the application of the FEM-MEM can enhance the fragility analysis process, enabling a more accurate and efficient quantification of seismic fragility.

2.2.2. Fragility Curve Fitting Based on Shift Generalized Lognormal Distribution
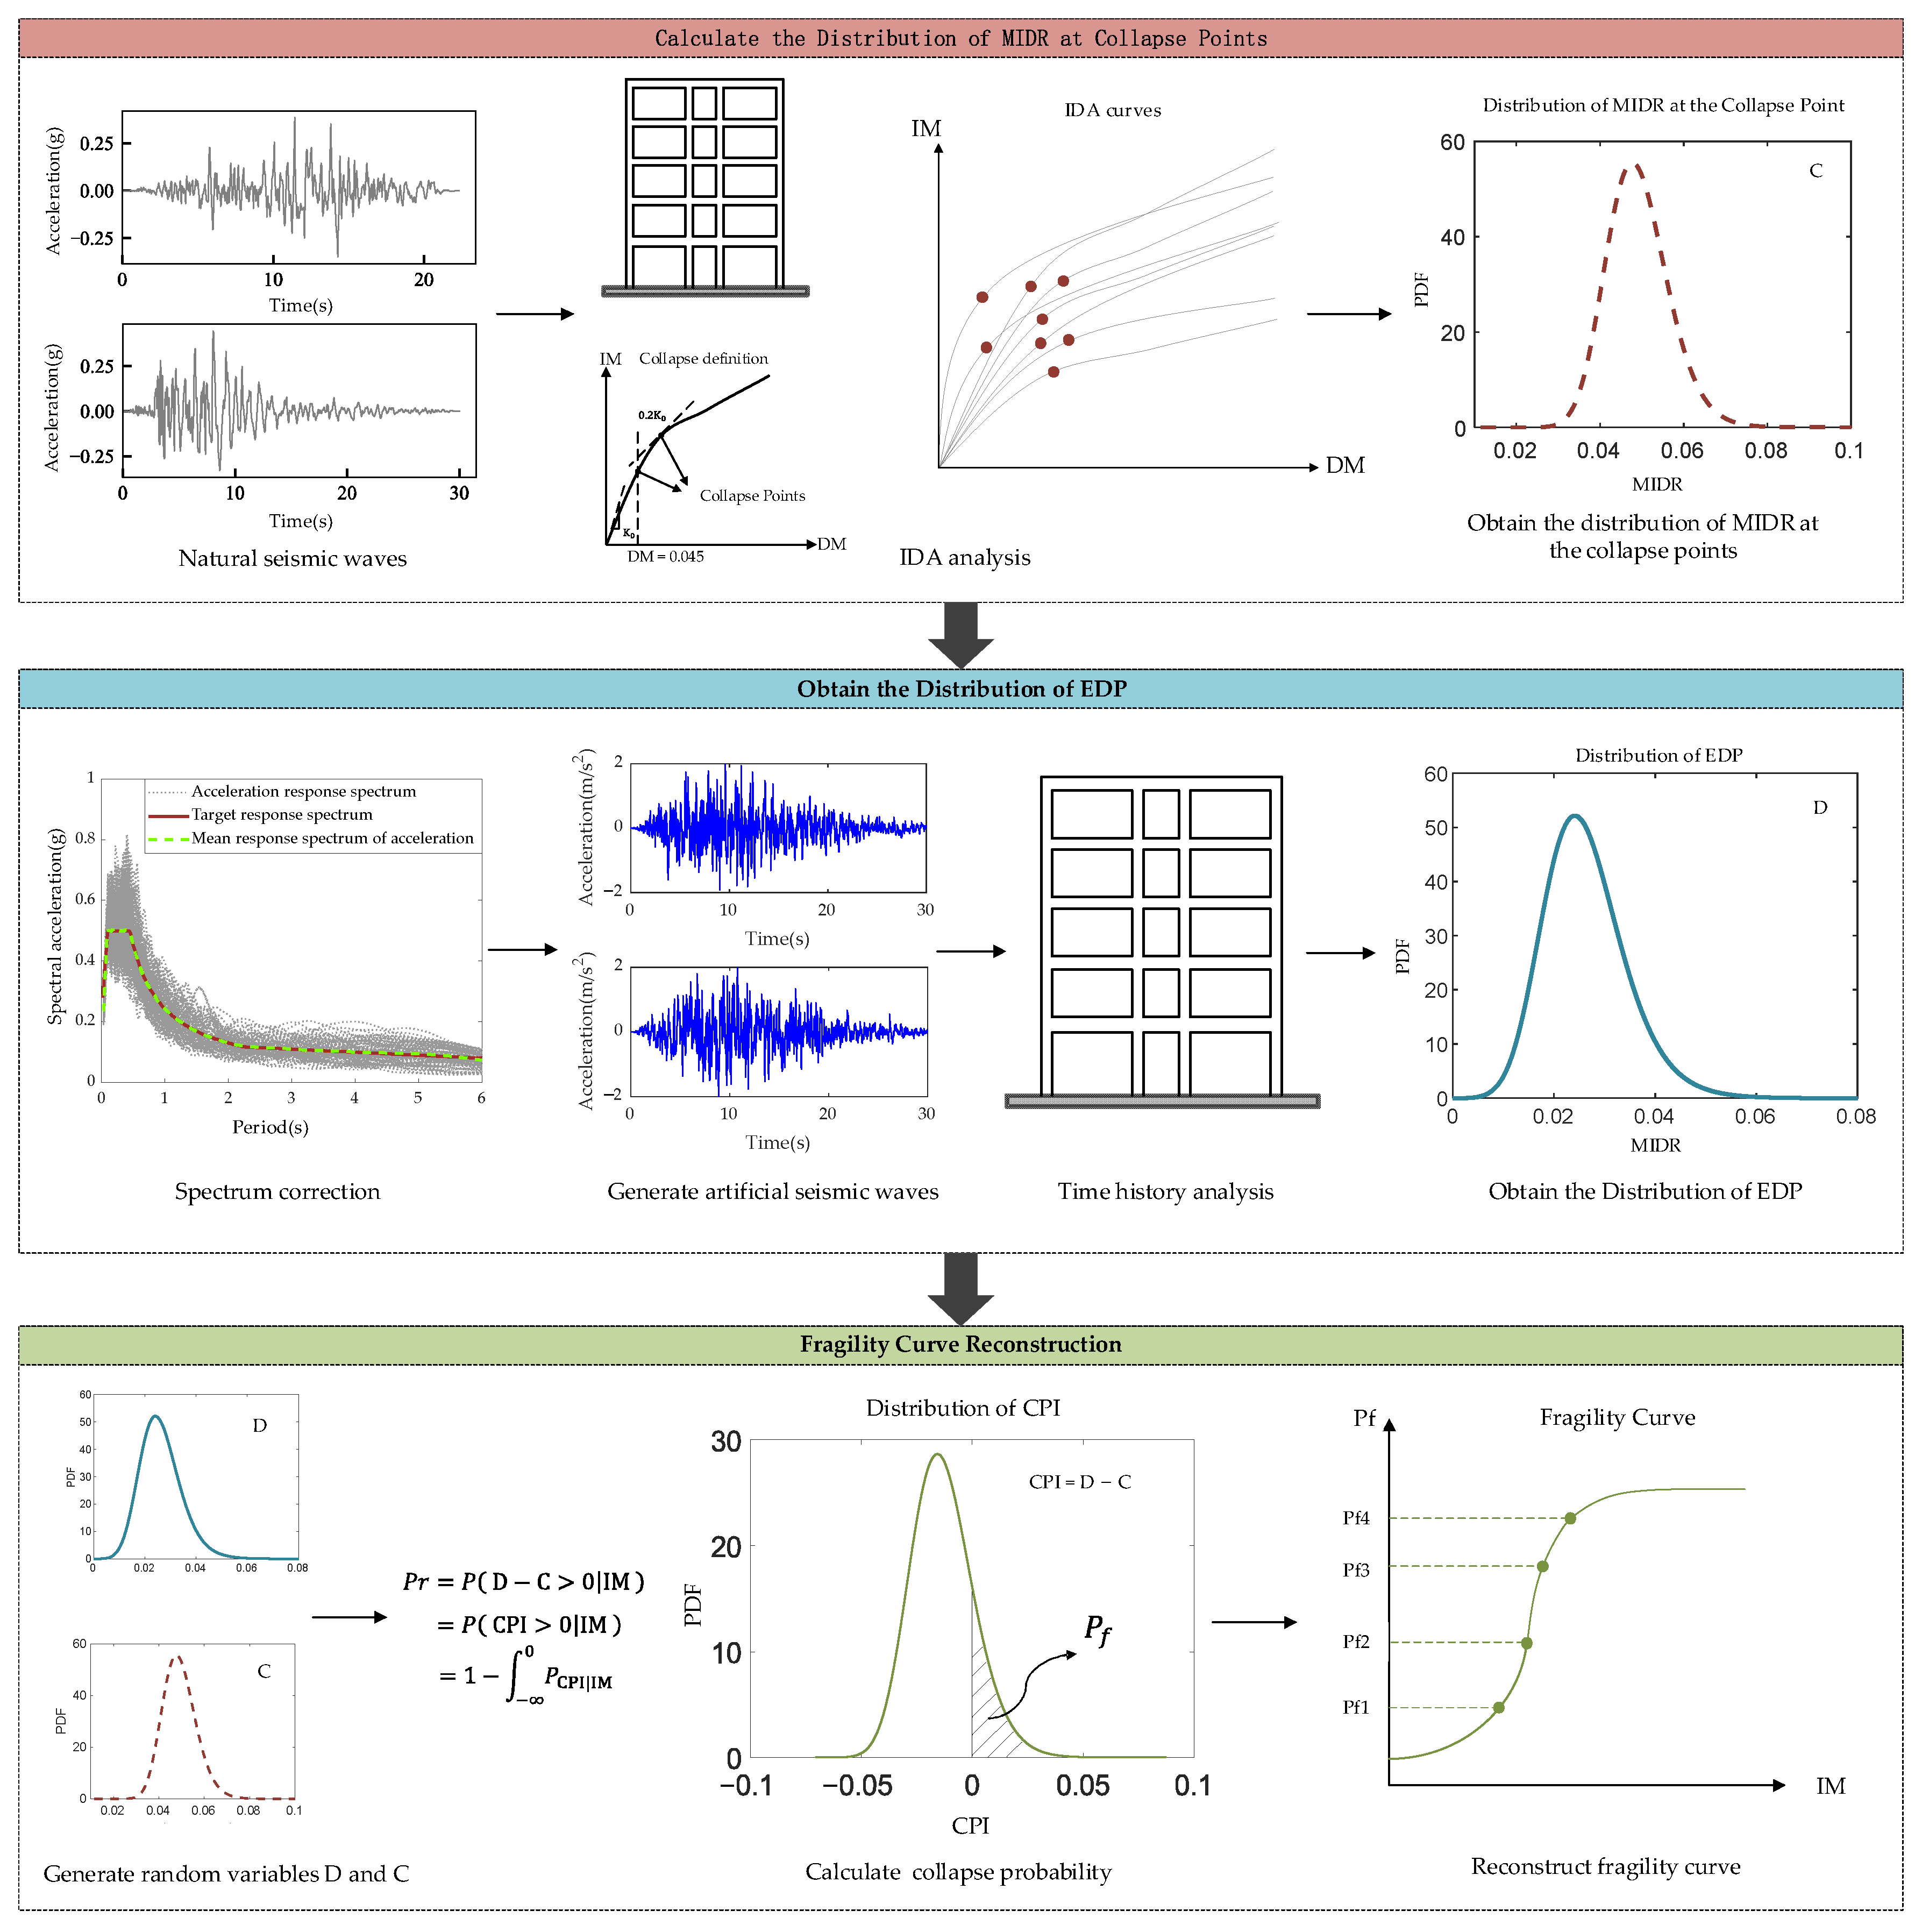
The lognormal cumulative distribution function is usually used to fit the fragility curves [33]:
P Collapse | IM = x = Φ ln x / θ β
where P Collapse | IM = x represents the probability of structural collapse when IM = x ; Φ ( ) is the cumulative distribution function of the standard normal distribution; θ is the median value of fragility function, representing the IM value corresponding to a 50% probability of structural collapse; and β represents the deviation of the IM.
Although fitting a fragility curve with a lognormal distribution can achieve certain results in the fragility analysis, the assumption of a lognormal distribution is subjective and may not accurately reconstruct the fragility curve. Moreover, current seismic collapse fragility analysis methods still rely on IDA or multiple strip analysis (MSA), which require extensive time history analyses. To address this issue, various non-lognormal methods have been proposed in recent studies to reconstruct fragility curves. For example, Jeon et al. [34] used logistic regression to obtain fragility curves for bridge components and systems. Mangalathhu et al. [35] applied machine learning to derive the fragility curve of concrete bridges. Xu et al. [16] reconstructed the fragility curve using a four-parameter shifted generalized lognormal distribution (SGLD), which does not rely on the lognormal assumption and requires only the failure probabilities at four IM values to obtain the fragility curve. The probability density function of the SGLD [36] is expressed as follows:
f SGLD ( x ) = β s x c exp 1 r η r ln x c ξ r
where c and ξ are the position and scale parameters; η and r are the shape parameters. β s = 1 2 η Γ 1 + 1 / r r 1 / r , Γ ( ) represents the Gamma function. The value range of the parameters in Equation (7) [37] are r , η , ξ > 0 , c R .
F SGLD ( x ) = 1 2 + 1 2 sgn x c ξ 1 h 1 r , 1 η ln x c ξ r r
where sgn(·) represents the sign function, and h ( m , n ) = 0 n t m 1 e t d t / Γ ( m ) .
In this paper, the cumulative distribution function of the SGLD is used to reconstruct the fragility function. By calculating the failure probability of the structure under four IMs using seismic reliability methods and substituting these values into Equation (8), the fragility curve can be reconstructed with ease.
Compared to the traditional lognormal distribution model, the SGLD offers a more flexible form, allowing for more accurate fitting results and providing advantages in both generality and precision.

3. Proposed Method

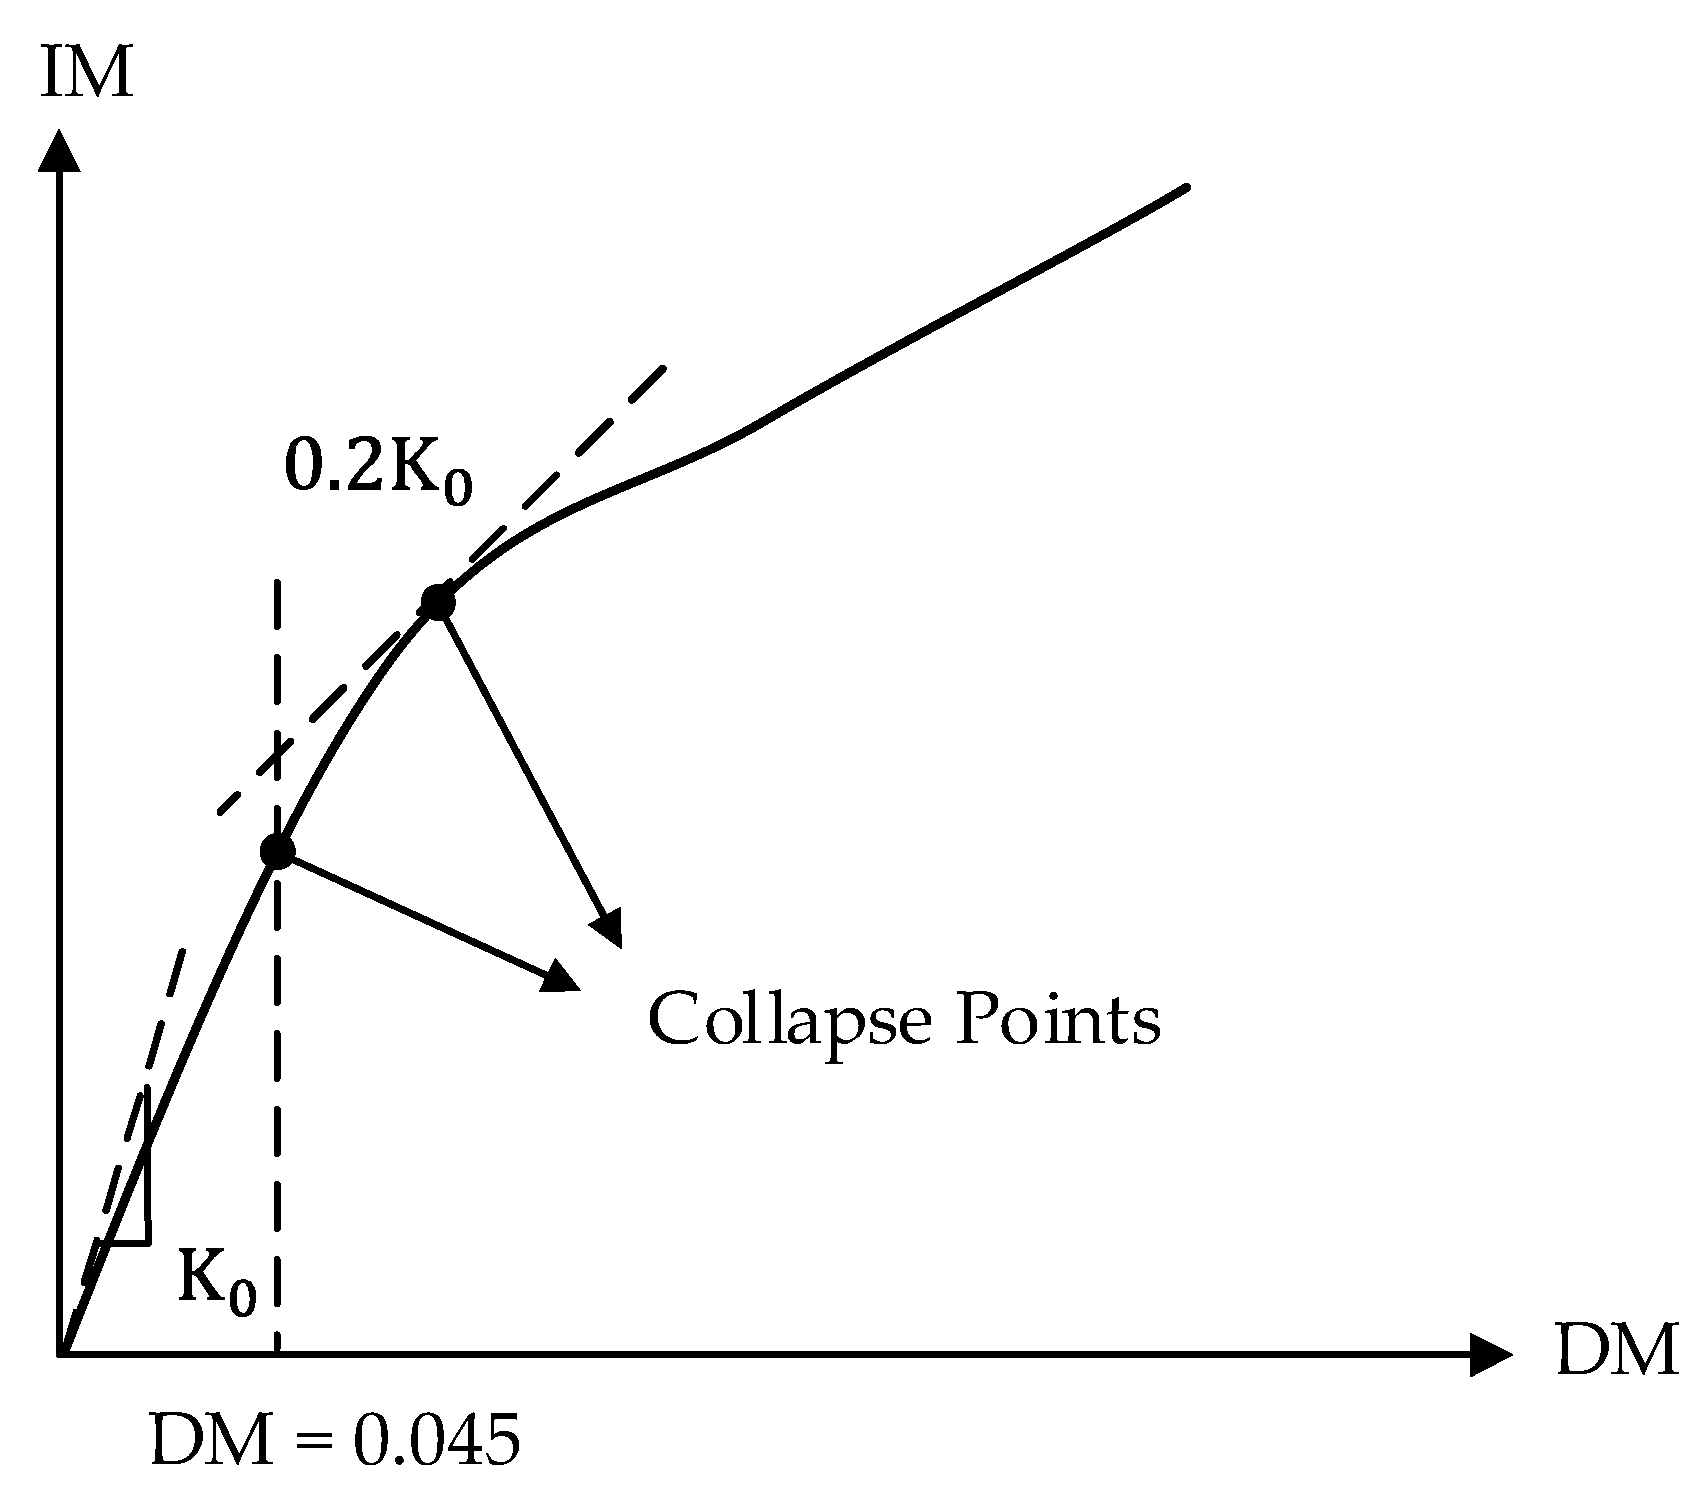
3.1. Definition of the Collapse Point

According to previous studies and relevant standards [26], a structure is considered to collapse when the inter-story drift ratio exceeds 0.045. Therefore, in this study, the collapse point is defined as the point where the stiffness in the IDA curve decreases to 20% of the initial stiffness or where the inter-story drift ratio exceeds 0.045. The collapse point criteria used in this article are shown in Figure 2.
This article investigates the collapse risk of building structures under seismic loads. Structures under earthquakes mainly bear dynamic loads, which are the main factor causing collapses. Hence, dynamic analysis is used in this article to investigate the collapse threshold of structures under earthquake loads. Compared to static analysis, using dynamic methods such as time history analysis can better reflect the dynamic characteristics of structures and explore the real response under earthquake loads. Hence, employing the time history analysis method can yield more precise collapse thresholds, a critical aspect for structural collapse fragility analysis, thereby enhancing the precision of the subsequent fragility analysis.
In this article, we choose a representative set of natural earthquake waves to conduct IDA analysis on a RC structure. Based on the collapse definition proposed in this article, the collapse points of the structure under dynamic loads are determined by continuously increasing the PGA of natural earthquake waves through IDA. In order to efficiently obtain the distribution of the MIDRs of the collapse points of the structure, the FEM-MEM is used in this paper to explore the distribution.

3.2. Engineering Demand Parameters Analyzing

Without a loss of generality, the kinematic equation of a multi-degree-of-freedom system under earthquake excitation can be expressed as
M X ¨ ( t ) + C X ˙ ( t ) + F ( X , t ) = M I U ¨ g ( t )
where X , X ˙ , and X ¨ are the displacement, velocity, and acceleration vectors, respectively. M and C are the mass matrix and damping matrix, respectively. F ( X , t ) is restoring the force vectors, and U ¨ g ( t ) is stochastic ground motions. To obtain the distribution of the EDPs, this study performs time history analysis on the structure based on a group of artificial stochastic seismic waves. Fully non-stationary stochastic seismic waves, modeled through the spectral representation method [38,39,40], are expressed as
U ¨ g ( t ) = k = 0 2 S U ¨ g ( ω k , t ) Δ ω cos ( ω k t + φ k )
where S U ¨ g ( ω k , t ) represents the evolutionary power spectral density function, which can be expressed as
S U ¨ g ( ω k , t ) = A 2 ( ω , t ) S ( ω )
where A ( ω , t ) is the time–frequency modulation function, which can be expressed as [41]
A ( ω , t ) = exp η 0 ω t ω g T t c exp 1 t c k
In this article, the target double-sided power spectral density S ( ω ) is selected as the Clough Penzien spectrum [42], which can be expressed as
S ( ω ) = ω g 4 + 4 ζ g 2 ω g 2 ω 2 ω g 2 ω 2 2 + 4 ζ g 2 ω g 2 ω 2 × ω 4 ω f 2 ω 2 2 + 4 ζ f 2 ω f 2 ω 2 S 0
where S 0 is the intensity factor of ground motions [43], expressed as
S 0 = a ¯ max 2 γ 0 2 π ω g 2 ζ g + 1 2 ζ g
The meanings of the parameters related to artificial seismic waves are provided in Table 1. Moreover, to enhance the correlation between the artificial seismic waves and real engineering scenarios, this study employs an iterative correction method [44] to refine the seismic waves. This correction process involves iterative calculations to ensure that the mean response spectrum of the artificial seismic accelerations aligns with the standard response spectrum.

3.3. Fragility Analysis Based on the CPI

The uncertainty in the bearing capacity significantly impacts the calculation results [27,28]. Relying solely on the deterministic thresholds recommended in the codes may lead to an underestimation of the structural performance levels, resulting in inaccurate seismic risk assessments [28]. In light of this, this study comprehensively considers both demand and capacity uncertainties in the seismic collapse fragility analysis.
This study derives the probability distributions of the structural demand parameters and bearing capacity through time history analysis. Based on these distributions, the CPI is introduced as a criterion for evaluating the seismic performance of the structure, defined by the following formula [28]:
P r ( DM | IM ) = P r ( D C > 0 | IM ) = P r ( CPI > 0 | IM ) = 1 P r ( CPI 0 | IM )
where DM is the damage measure of the structure, IM is the intensity measure, represented by the peak ground acceleration (PGA), D is the EDPs, and C is the structural bearing capacity.
According to Equation (15) the failure probability of the structure under IM is related to the distribution of the CPI. P r ( CPI 0 | IM ) represents the probability of the CPI < 0 under the IM, which can be written as the value of the cumulative distribution function (CDF) of the random variable CPI at 0. Therefore, Equation (15) can be expressed in the form of Equation (5).
P CPI | IM represents the probability density function of the combined performance index (CPI) under a specific IM. Once the distribution of the CPI is determined, calculating the failure probability becomes simple and direct.

4. Case Analysis

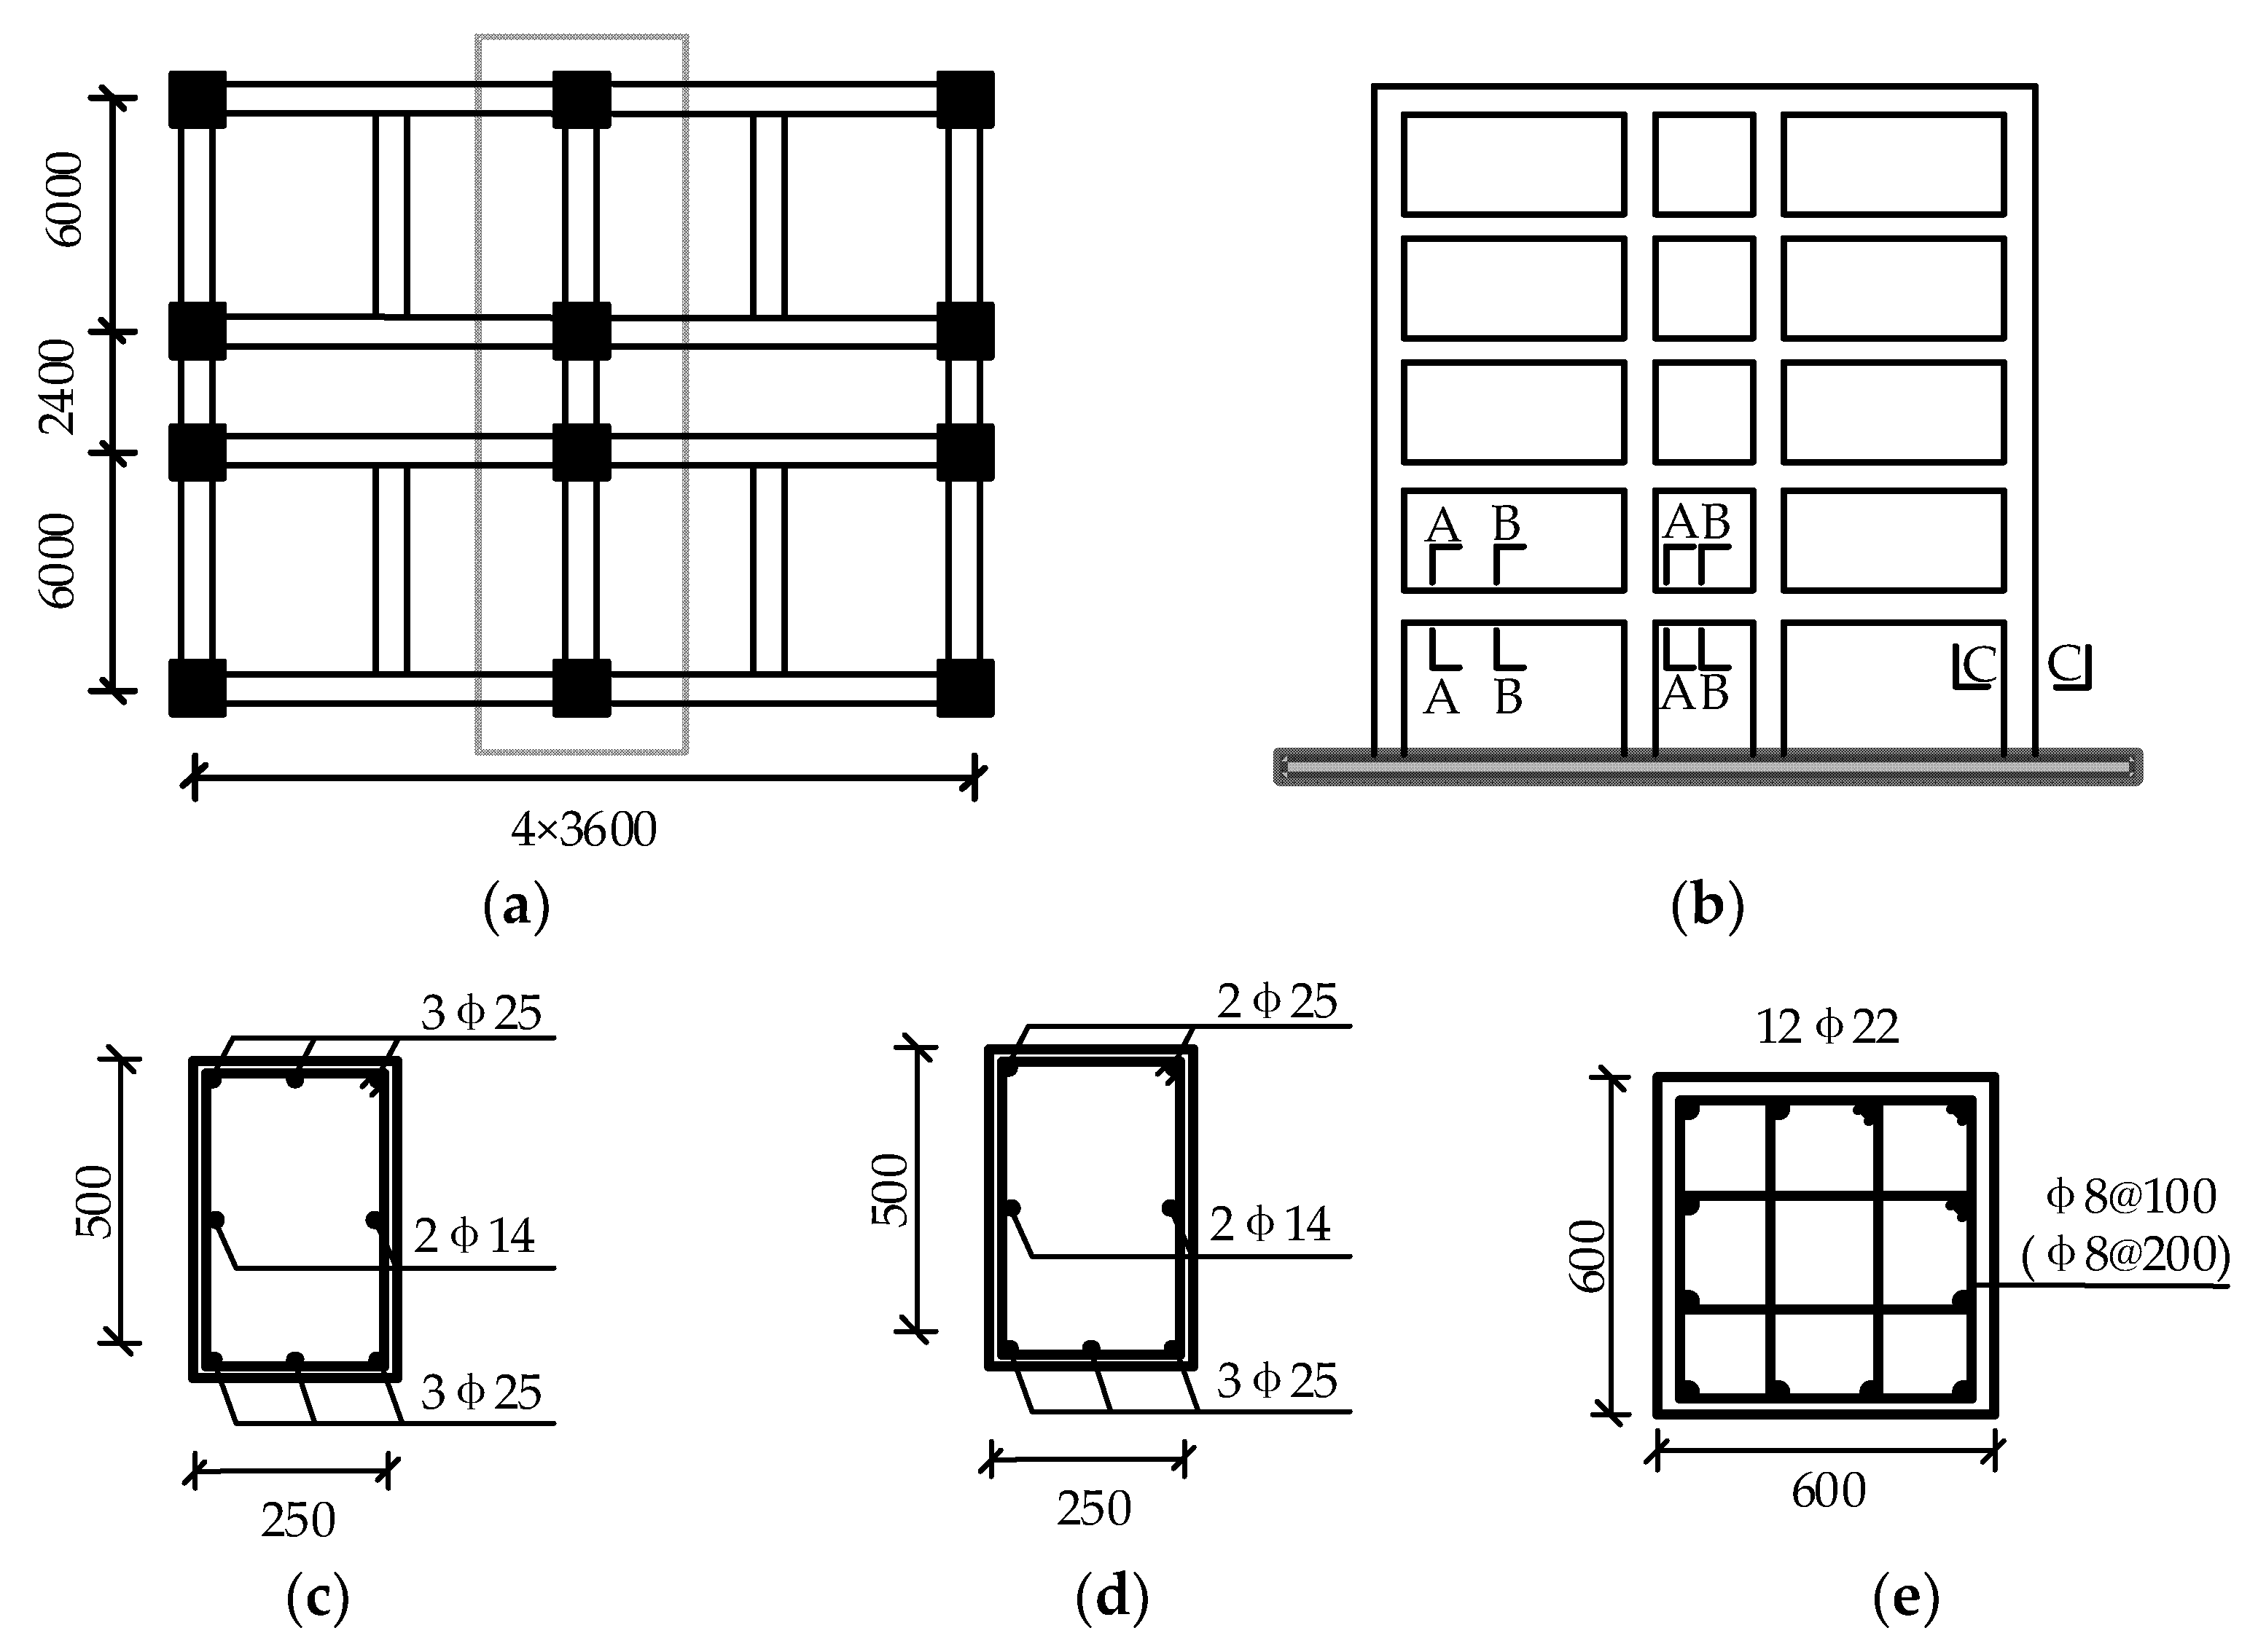
4.1. OpenSees Model of a RC Frame

This study conducts a fragility analysis of a five-story three-span reinforced concrete frame structure [45]. According to the Chinese code [46], the fortification intensity of the structure is set at 8 degrees, with a design basic acceleration of 0.2 g. The design earthquake group is classified as the first group, and the design site category is categorized as Class II. The floor dead load is 4.5 K N / m 2 , while the live load is 2.0   K N / m 2 . The framework layout and reinforcement details of the beam and column sections are shown in Figure 3. OpenSees is used for the modeling and time history analysis. The beam and column members are modeled with the nonlinear force-based element with fiber sections. The concrete01 constitutive model is used for concrete, and the steel02 constitutive model is used for steel reinforcement. The constraint effect of stirrups on the core concrete is considered with the confined concrete model. An amplification factor is incorporated to account for the enhancing effects of stirrups on the concrete ductility, as well as strength, according to the modified Kent–Park model [47,48]. The compressive strength of the concrete is 26.8 MPa, and the elastic modulus of the concrete is 32,500 MPa. The yield strength of the longitudinal reinforcement and hoop reinforcement are 400 MPa and 235 MPa, respectively, and the elastic modulus of the steel reinforcement is 200 GPa.

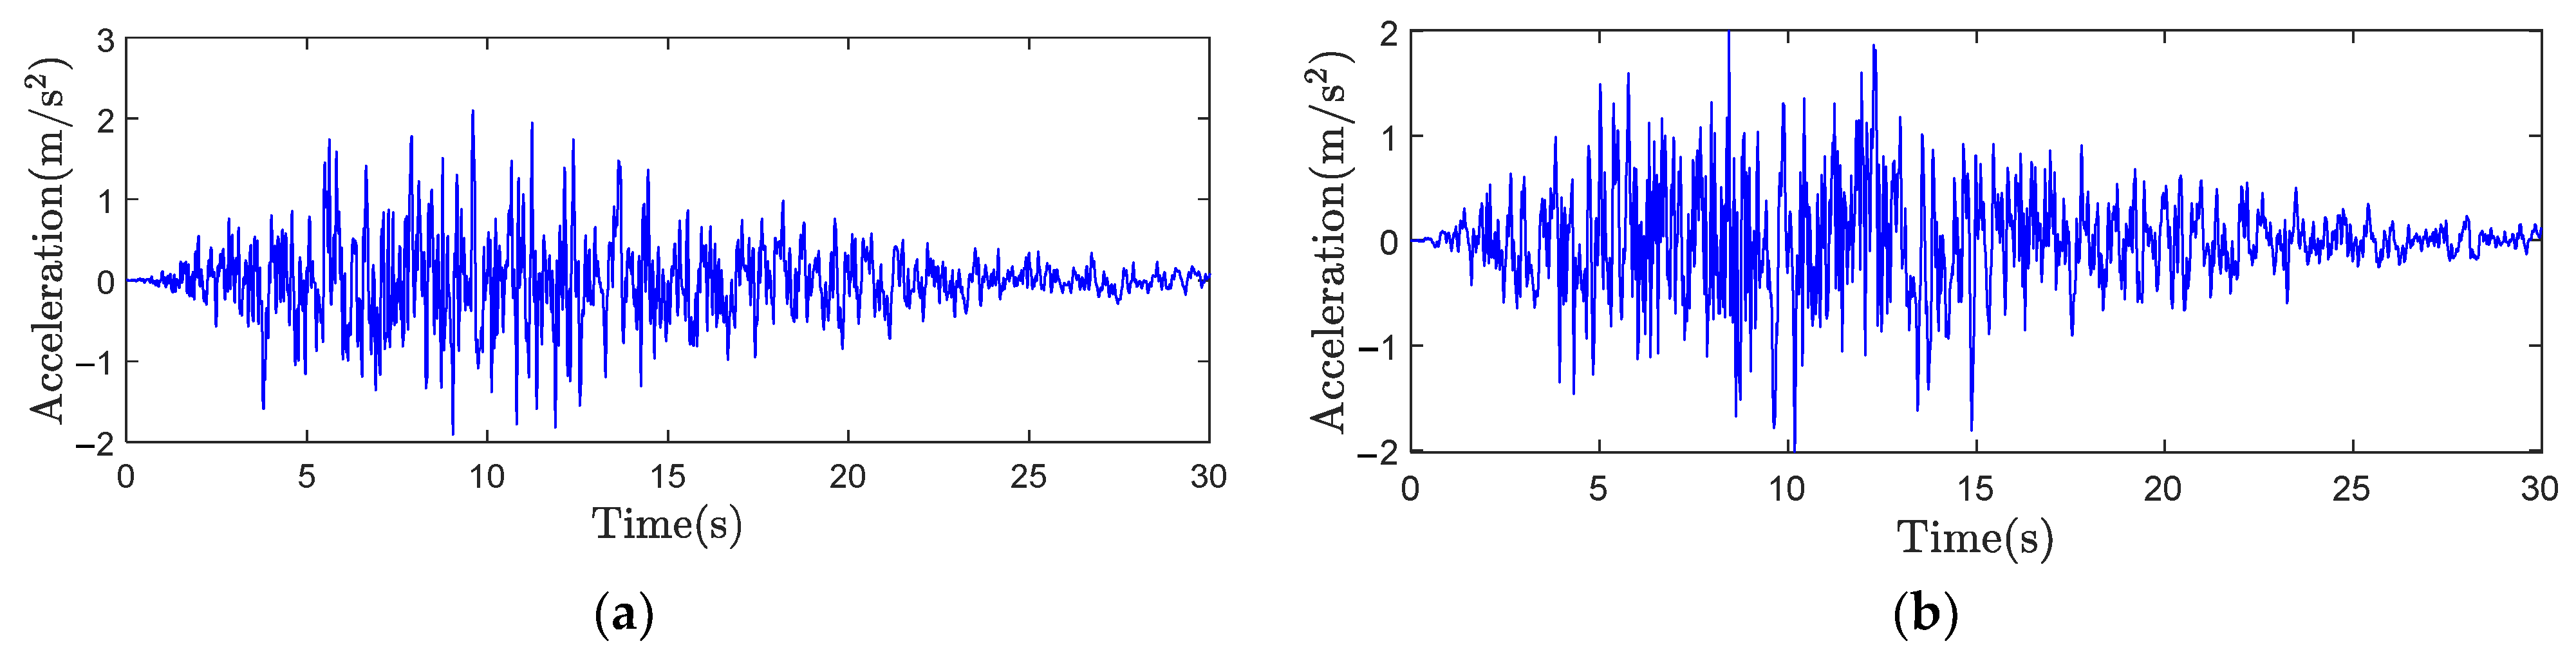
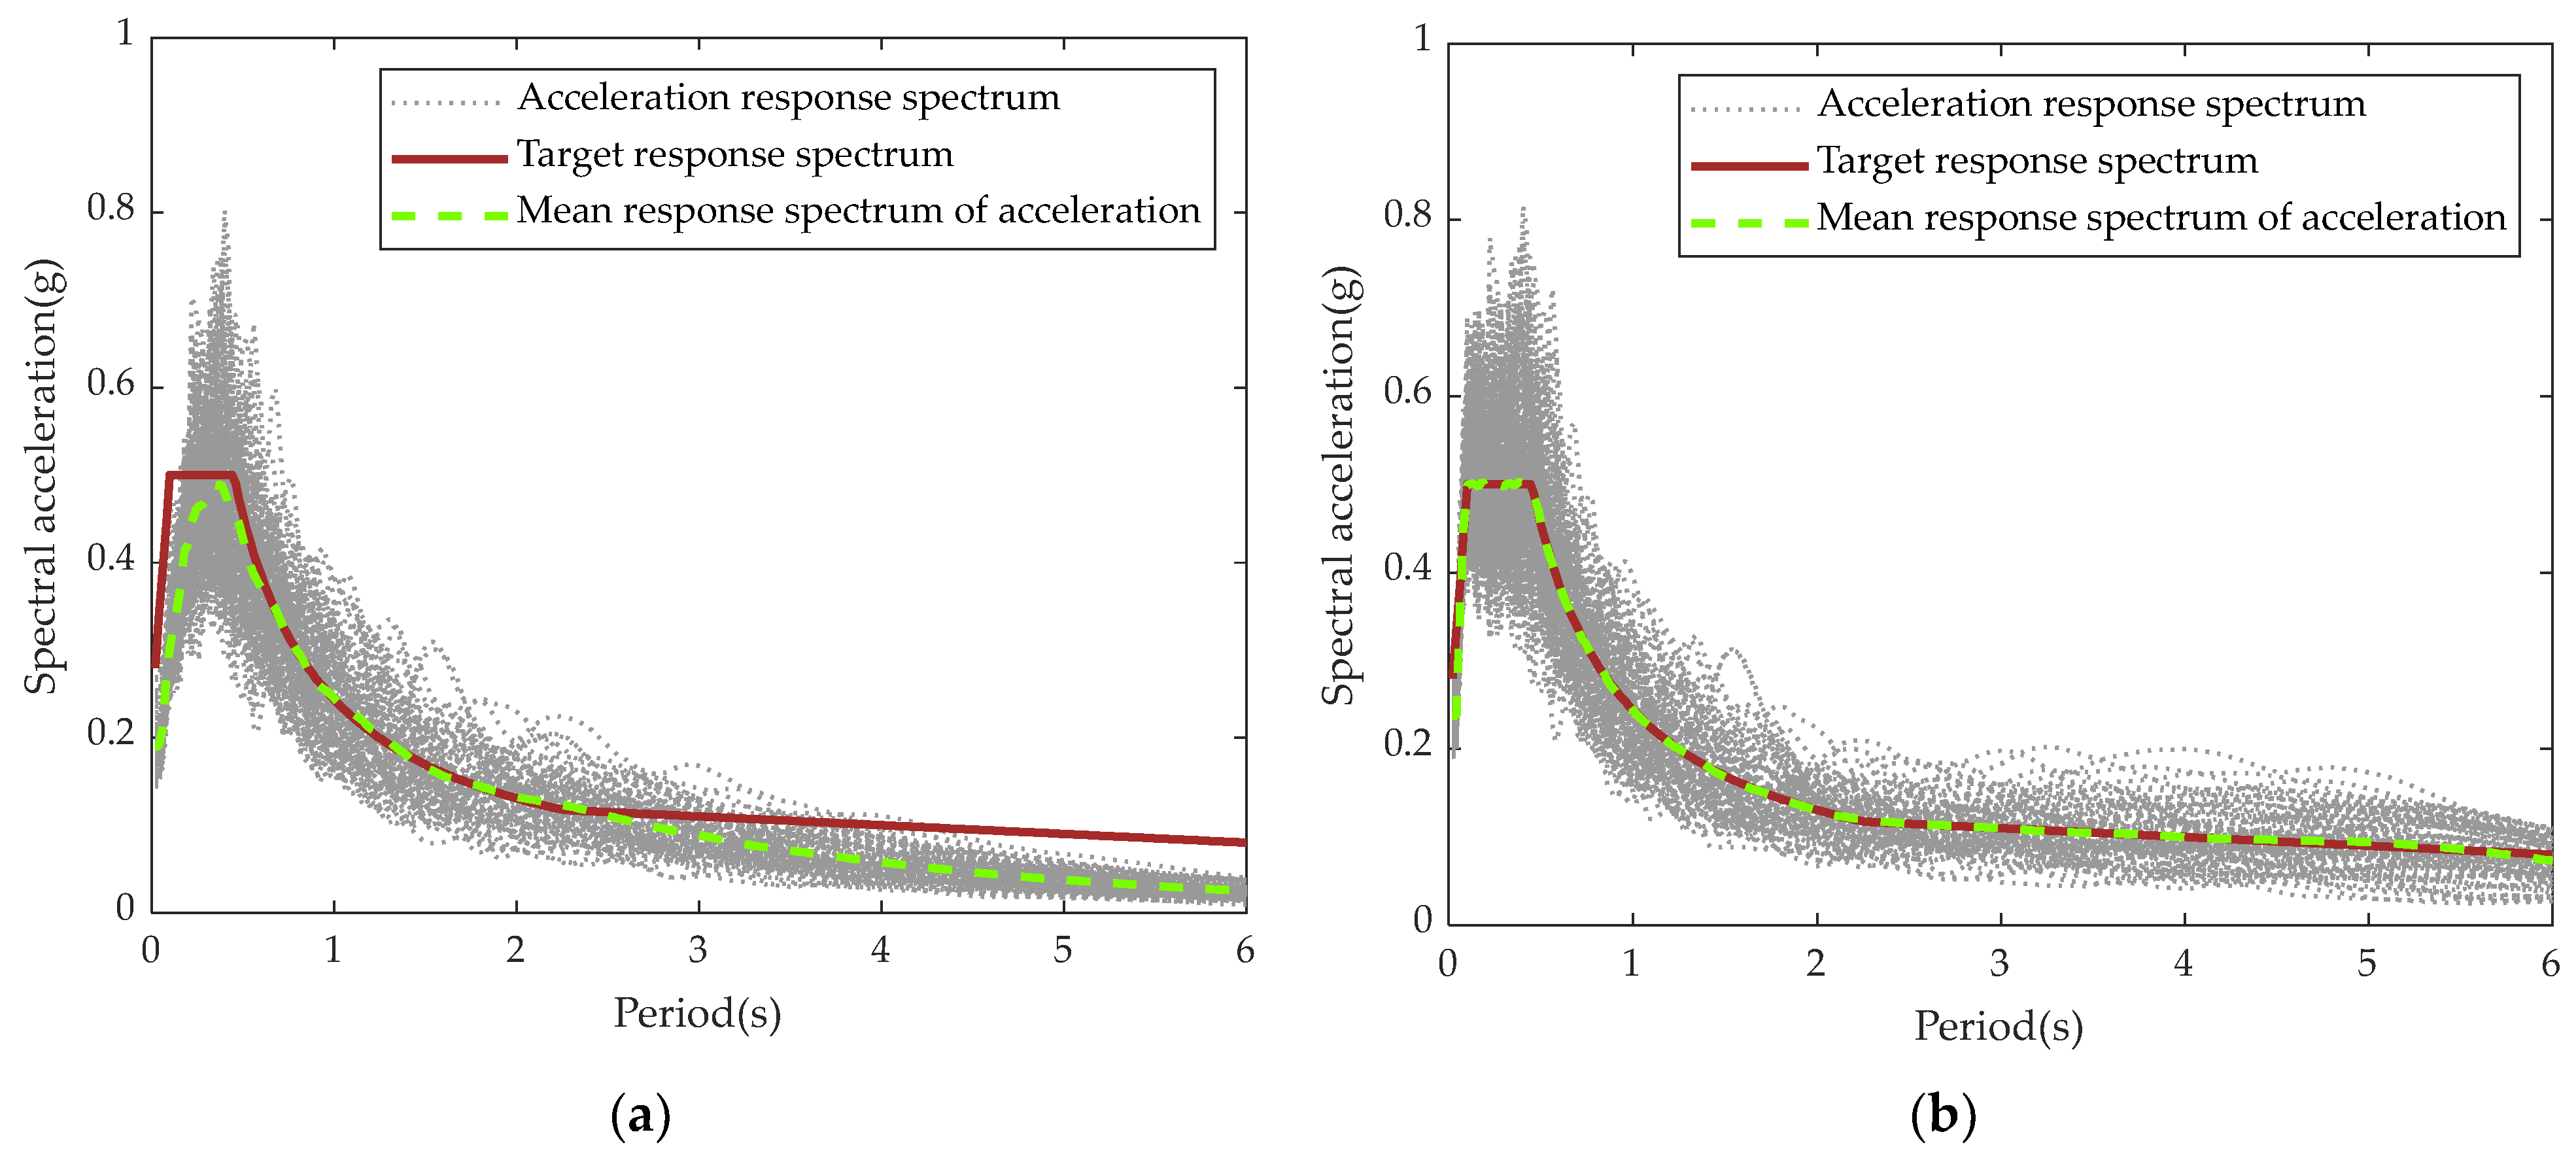
4.2. Stochastic Ground Motions Generation

In order to generate seismic motions that comply with the seismic design parameters of the structure, this article generates a total of 89 seismic motions based on the recommendations given in Reference [49]. The parameter values used to generate completely non-stationary stochastic seismic motion in this paper are as follows: ζ g = ζ f = 0.6 , ω g = 15.71   rad / s , ω f = 1.57   rad / s , γ 0 = 2.9 , a ¯ max = 200 cm / s 2 , Δ ω = 0.1 , T = 30   s , k = 2.0 , η 0 = 0.15 , c = 9.0   s , and ω k = k Δ ω ( k = 1 , 2 , , 1000 ) . The generated stochastic seismic samples are shown in Figure 4.
This study employs an iterative method to calibrate the seismic motion based on the acceleration response spectrum. The mean of the corrected acceleration response spectrum closely aligns with the standard response spectrum. Meanwhile, artificial seismic waves effectively capture the randomness of earthquakes, reflecting the characteristics of real ground motions. Figure 5 illustrates the acceleration response spectra before and after correction. This approach ensures that the stochastic seismic motions exhibit strong randomness while maintaining a high degree of correlation between their acceleration response spectra and the standard spectrum, thereby enhancing the accuracy of the subsequent fragility analyses.

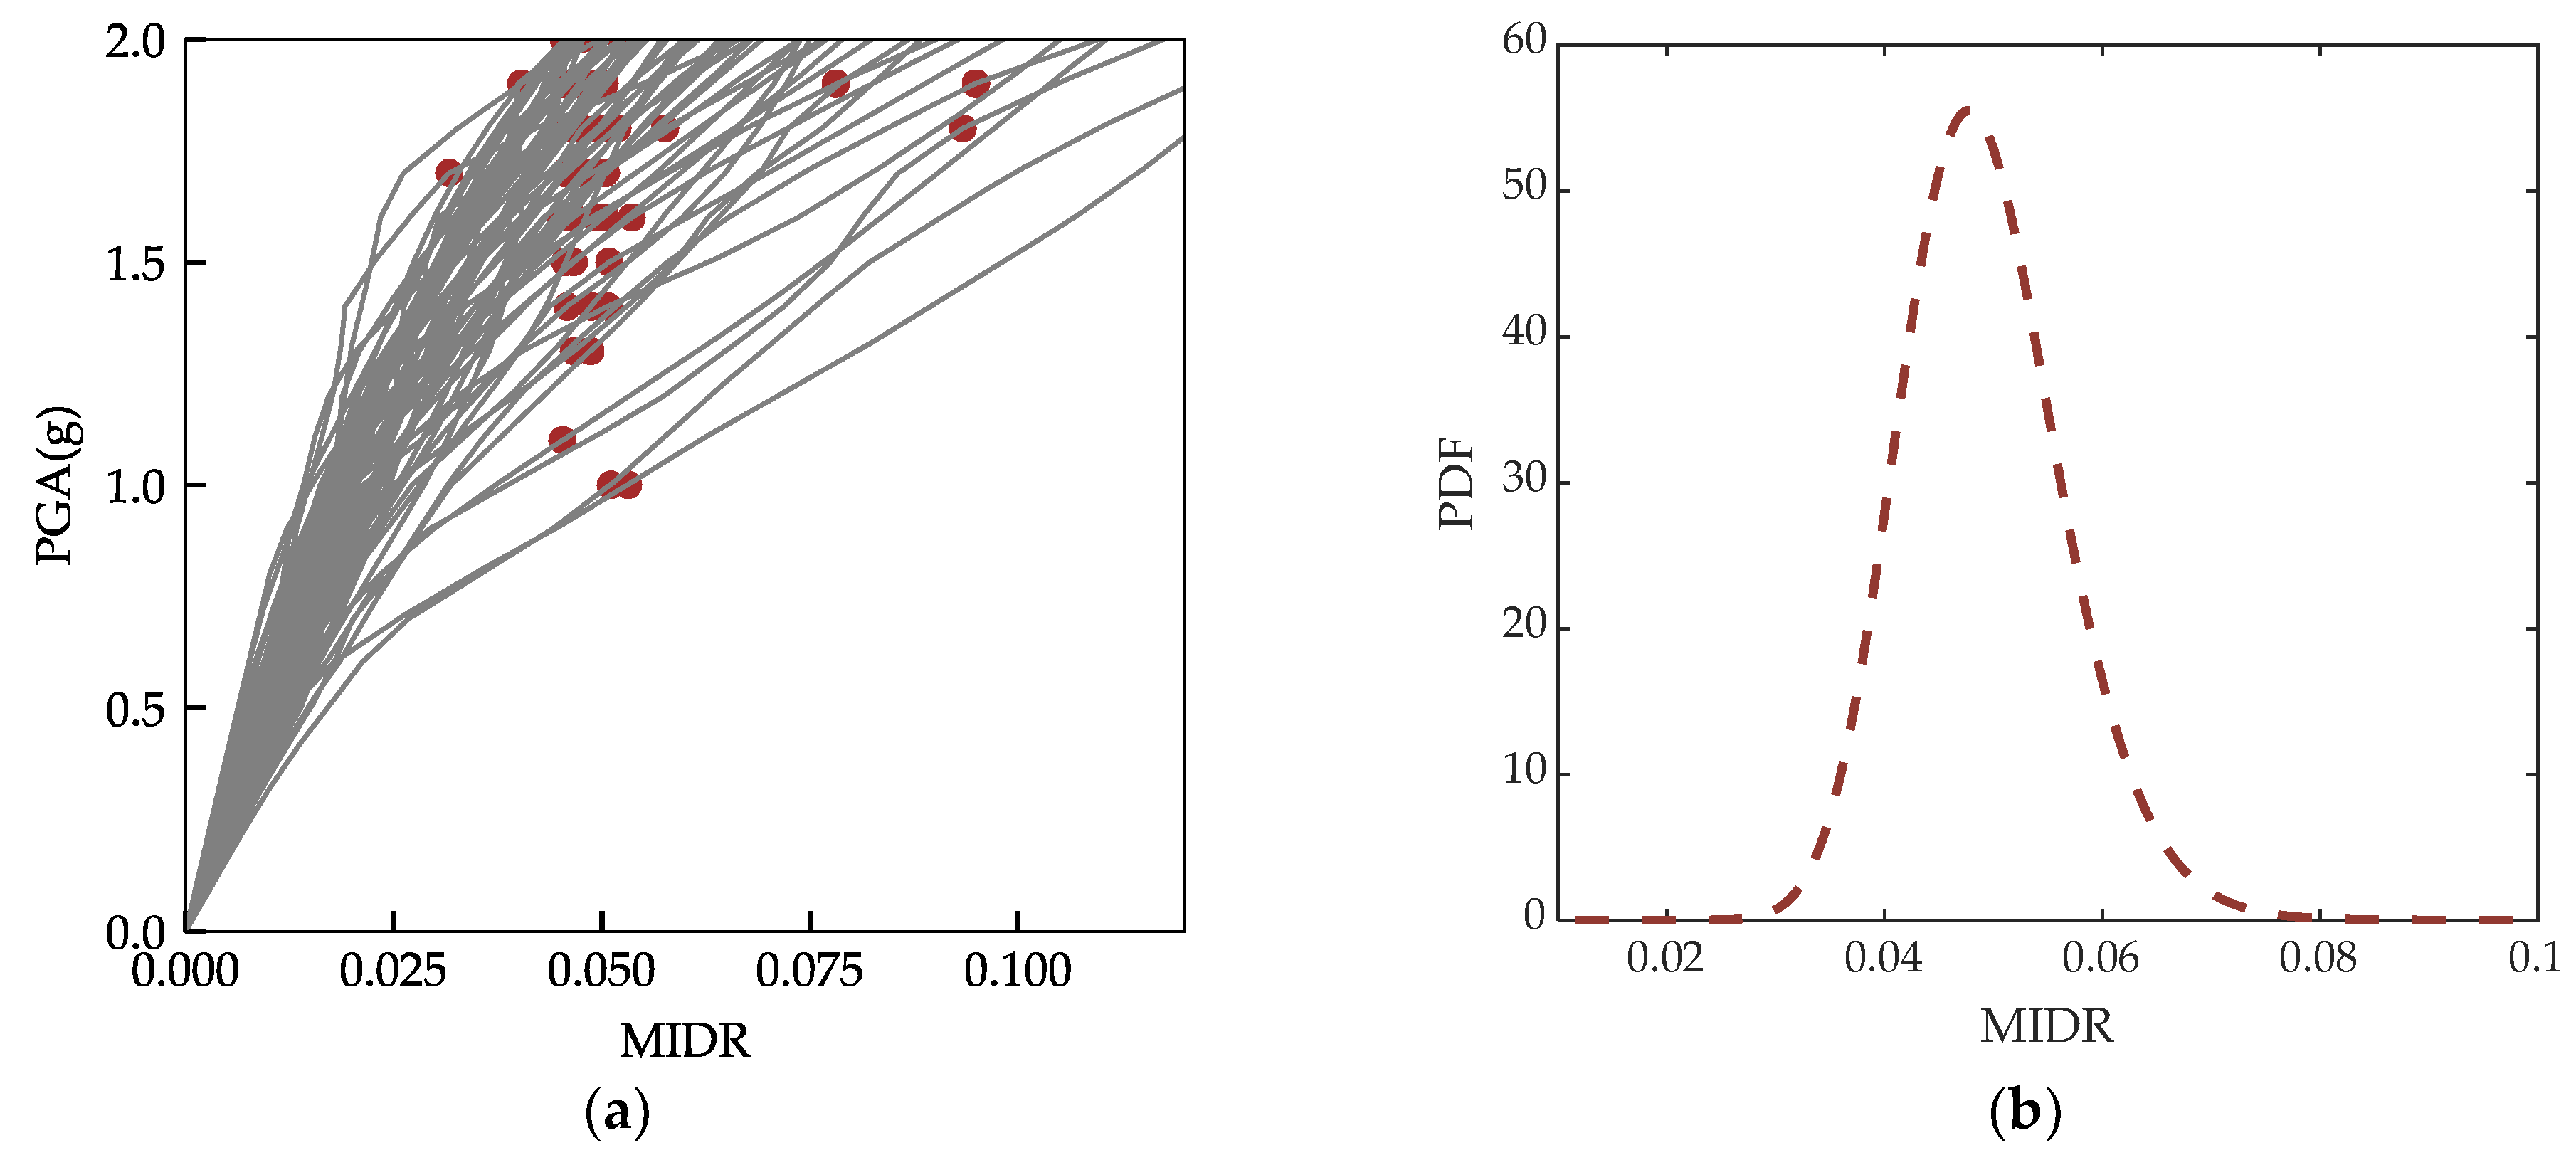
4.3. Distribution of the Maximum Inter-Story Drift Ratios at the Collapse Point

In order to obtain the distribution of MIDRs at the collapse points of the structure under earthquakes, this study selects 100 natural earthquake waves based on the recommendations of FEMA P695 (ATC-63) [50]. The PGA is adjusted from 0 to 2.0 g in increments of 0.1 g for the initial incremental dynamic analyses. The IDA curves are shown in Figure 6a. With the increase in the IM, the stiffness of the IDA curves decreases, and then, the collapse points can be obtained based on the collapse determination proposed in this paper. Samples of the MIDRs at the collapse points, derived using the FEM-MEM, are fitted to yield the distribution shown in Figure 6b.
Next, 89 samples of fully non-stationary stochastic ground motions are generated using the spectral representation method, with their PGA adjusted to exceed 1.0 g for the IDA. The FEM-MEM is then employed to fit the samples of the EDPs, resulting in the distribution of these parameters under different IMs. Figure 7 shows the distribution of the EDPs(D) and MIDRs(C) at the collapse points for two typical IMs. In this study, FEM-MEM is utilized to derive unknown distributions with a limited number of samples [30,51], which can efficiently solve the failure probability in the fragility analysis.

4.4. Seismic Collapse Fragility Curve

Based on the obtained distribution of the structural EDPs and the MIDRs at collapse points under different IMs, a Monte Carlo simulation is performed to generate random variables D and C that match these distributions.
The structural failure probability, accounting for bearing capacity uncertainty, is then calculated using Equation (5). Finally, the structural collapse fragility curve is reconstructed using the SGLD. For comparison, fragility curves are also derived under the assumption of a lognormal distribution, with the collapse limits defined at MIDRs of 1/50 and 1/25, as illustrated in Figure 8.
The results indicate that the MIDRs of the collapse points of the structure under seismic excitation show various values, which should be considered in the collapse fragility analysis. Table 2 presents the failure probabilities of the structure under different thresholds and IMs using the seismic reliability method. The failure probability accounting for bearing capacity uncertainty is lower than that of the two deterministic thresholds in this study. On the other hand, the lognormal fragility model does not accurately fit the failure probability obtained through the reliability-based method. Compared to the lognormal-based fragility model, the four-parameters SGLD fragility model provides a significantly better fit for the reference points. The fitting capacity of the lognormal distribution is relatively constrained, often failing to accurately match the target reference points. The method proposed in this paper is capable of comprehensively taking into account the bearing capacity of the structure and can offer a more precise estimation of the fragility curve.
The analysis framework proposed in this paper can also be adopted for the fragility assessment of other types of structures. It is worth noting that the definition of the limit states for different types of structures should be carefully considered, which is crucial for the fragility analysis.

5. Results and Discussion

This article concurrently addresses the uncertainty of the EDPs and bearing capacity, introduces a fragility analysis framework based on a seismic reliability method, and employs the SGLD to model the failure probability, resulting in the seismic collapse fragility curve of the structure. The conclusions of the article are as follows:
(1)
According to the time history analysis results, the structural bearing capacity is not a definite value, which shows a certain distribution pattern. The uncertainty of the bearing capacity has a significant impact on the fragility of the structure. Compared to the inter-story drift ratio limits of 1/25 and 1/50, the median collapse IMs considering the uncertainty of the bearing capacity has increased by 13.2% and 87.3%, respectively.
(2)
The lognormal fragility model exhibits a poor fit for the failure probability obtained through the seismic reliability method. Compared to the fragility function assumed by the lognormal, using the SGLD as the fragility function model can more accurately reconstruct the fragility curve. The SGLD is more flexible and more universal in different fragility analysis scenarios.
(3)
The failure probability obtained by considering the uncertainty of the bearing capacity is lower than the failure probability obtained based on the deterministic threshold, and structural seismic risk assessment should consider the uncertainty of the bearing capacity.
However, there are still some limitations in this study that need to be further investigated. (1) The artificial seismic waves should consider more characteristics of real earthquakes, and it is necessary to explore the influence of these aspects on the seismic risk assessment. (2) The IDA method adopted in this paper is time-consuming. A method of efficiently and accurately obtaining the collapse point of the structure is worth further research. (3) This study takes reinforced concrete structures as an example for seismic collapse analysis. However, further research is required for different types of structures.

Author Contributions

Methodology, T.Z. and Y.L.; investigation, T.Z.; data curation, T.Z. and Y.L.; writing—original draft preparation, T.Z. and Y.L.; writing—review and editing, T.Z. All authors have read and agreed to the published version of the manuscript.

Funding

This research received no external funding.

Data Availability Statement

The original contributions presented in this study are included in the article. Further inquiries can be directed to the corresponding author.

Conflicts of Interest

The authors declare no conflicts of interest.

References

  1. Barbat, A.H.; Moya, F.Y.; Canas, J.A. Damage Scenarios Simulation for Seismic Risk Assessment in Urban Zones. Earthq. Spectra 1996, 12, 371–394. [Google Scholar] [CrossRef]
  2. Fragility Analysis Methods: Review of Existing Approaches and Application. Nucl. Eng. Des. 2017, 323, 245–258. [CrossRef]
  3. Ruggieri, S.; Calò, M.; Cardellicchio, A.; Uva, G. Analytical-Mechanical Based Framework for Seismic Overall Fragility Analysis of Existing RC Buildings in Town Compartments. Bull. Earthq. Eng. 2022, 20, 8179–8216. [Google Scholar] [CrossRef]
  4. Whitman, R.V.; Reed, J.W.; Hong, S.T. Earthquake Damage Probability Matrices; IIT Kanpur: Kanpur, India, 1974. [Google Scholar]
  5. Rossetto, T.; Elnashai, A. Derivation of Vulnerability Functions for European-Type RC Structures Based on Observational Data. Eng. Struct. 2003, 25, 1241–1263. [Google Scholar] [CrossRef]
  6. Vamvatsikos, D.; Cornell, C.A. Incremental Dynamic Analysis. Earthq. Eng. Struct. Dyn. 2002, 31, 491–514. [Google Scholar] [CrossRef]
  7. Vamvatsikos, D.; Cornell, C.A. The Incremental Dynamic Analysis and Its Application to Performance-Based Earthquake Engineering. In Proceedings of the 12th European Conference on Earthquake Engineering, London, UK, 9–13 September 2002. [Google Scholar]
  8. Scozzese, F.; Tubaldi, E.; Dall’Asta, A. Assessment of the Effectiveness of Multiple-Stripe Analysis by Using a Stochastic Earthquake Input Model. Bull. Earthq. Eng. 2020, 18, 3167–3203. [Google Scholar] [CrossRef]
  9. Ni, P.P.; Wang, S.H.; Jiang, L.; Huang, R.Q. Seismic Risk Assessment of Structures Using Multiple Stripe Analysis. Appl. Mech. Mater. 2012, 226–228, 897–900. [Google Scholar] [CrossRef]
  10. Jalayer, F.; De Risi, R.; Manfredi, G. Bayesian Cloud Analysis: Efficient Structural Fragility Assessment Using Linear Regression. Bull. Earthq. Eng. 2015, 13, 1183–1203. [Google Scholar] [CrossRef]
  11. Nettis, A.; Gentile, R.; Raffaele, D.; Uva, G.; Galasso, C. Cloud Capacity Spectrum Method: Accounting for Record-to-Record Variability in Fragility Analysis Using Nonlinear Static Procedures. Soil Dyn. Earthq. Eng. 2021, 150, 106829. [Google Scholar] [CrossRef]
  12. Sainct, R.; Feau, C.; Martinez, J.-M.; Garnier, J. Efficient Methodology for Seismic Fragility Curves Estimation by Active Learning on Support Vector Machines. Struct. Saf. 2020, 86, 101972. [Google Scholar] [CrossRef]
  13. Kazemi, F.; Asgarkhani, N.; Jankowski, R. Machine Learning-Based Seismic Fragility and Seismic Vulnerability Assessment of Reinforced Concrete Structures. Soil Dyn. Earthq. Eng. 2023, 166, 107761. [Google Scholar] [CrossRef]
  14. Feng, D.-C.; Cao, X.-Y.; Wang, D.; Wu, G. A PDEM-Based Non-Parametric Seismic Fragility Assessment Method for RC Structures under Non-Stationary Ground Motions. J. Build. Eng. 2023, 63, 105465. [Google Scholar] [CrossRef]
  15. Liu, Z.; Zhang, Z. Artificial Neural Network Based Method for Seismic Fragility Analysis of Steel Frames. KSCE J. Civ. Eng. 2018, 22, 708–717. [Google Scholar] [CrossRef]
  16. Xu, J.; Liao, L.; Zhang, Y.; Wang, D. Efficient Seismic Fragility Analysis of Structures from Dynamic Reliability Perspective. Eng. Struct. 2022, 271, 114889. [Google Scholar] [CrossRef]
  17. Mai, C.; Konakli, K.; Sudret, B. Seismic Fragility Curves for Structures Using Non-Parametric Representations. Front. Struct. Civ. Eng. 2017, 11, 169–186. [Google Scholar] [CrossRef]
  18. Zheng, X.-W.; Li, H.-N.; Shi, Z.-Q. Hybrid AI-Bayesian-Based Demand Models and Fragility Estimates for Tall Buildings against Multi-Hazard of Earthquakes and Winds. Thin-Walled Struct. 2023, 187, 110749. [Google Scholar] [CrossRef]
  19. Wang, Q.; Geng, P.; Wang, L.; He, D.; Shen, H. Machine Learning-Driven Feature Importance Appraisal of Seismic Parameters on Tunnel Damage and Seismic Fragility Prediction. Eng. Appl. Artif. Intell. 2024, 137, 109101. [Google Scholar] [CrossRef]
  20. Wei, B.; Zheng, X.; Jiang, L.; Lai, Z.; Zhang, R.; Chen, J.; Yang, Z. Seismic Response Prediction and Fragility Assessment of High-Speed Railway Bridges Using Machine Learning Technology. Structures 2024, 66, 106845. [Google Scholar] [CrossRef]
  21. Bertero, V.V. Strength and Deformation Capacities of Buildings under Extreme Environments. Struct. Eng. Mech. 1977, 53, 211–215. [Google Scholar]
  22. FEMA. Recommended Seismic Design Criteria for New Steel Moment-Frame Buildings; Federal Emergency Management Agency: Washington, DC, USA, 2000.
  23. Fattahi, F.; Gholizadeh, S. Seismic Fragility Assessment of Optimally Designed Steel Moment Frames. Eng. Struct. 2019, 179, 37–51. [Google Scholar] [CrossRef]
  24. Cardone, D.; Perrone, G.; Piesco, V. Developing Collapse Fragility Curves for Base-Isolated Buildings. Earthq. Eng. Struct. Dyn. 2019, 48, 78–102. [Google Scholar] [CrossRef]
  25. Dabaghi, M.; Saad, G.; Allhassania, N. Seismic Collapse Fragility Analysis of Reinforced Concrete Shear Wall Buildings. Earthq. Spectra 2019, 35, 383–404. [Google Scholar] [CrossRef]
  26. Lu, X.; Gu, D.; Zhao, P.; Zhang, C.; Cheav, P.C. Performance-based design of building structures for collapse under earthquake. Build. Struct. 2022, 52, 50–57+133. (In Chinese) [Google Scholar] [CrossRef]
  27. Pourreza, F.; Mousazadeh, M.; Basim, M.C. An Efficient Method for Incorporating Modeling Uncertainties into Collapse Fragility of Steel Structures. Struct. Saf. 2021, 88, 102009. [Google Scholar] [CrossRef]
  28. Cao, X.-Y.; Feng, D.-C.; Beer, M. Consistent Seismic Hazard and Fragility Analysis Considering Combined Capacity-Demand Uncertainties via Probability Density Evolution Method. Struct. Saf. 2023, 103, 102330. [Google Scholar] [CrossRef]
  29. Jia, D.-W.; Wu, Z.-Y. Seismic Risk Analysis Based on Imprecise Distribution and Failure Probability Function under Multidimensional Limit State. Structures 2023, 50, 963–977. [Google Scholar] [CrossRef]
  30. He, S.; Xu, J.; Zhang, Y. Reliability Computation via a Transformed Mixed-Degree Cubature Rule and Maximum Entropy. Appl. Math. Model. 2022, 104, 122–139. [Google Scholar] [CrossRef]
  31. Li, G.; He, W.; Zeng, Y. An Improved Maximum Entropy Method via Fractional Moments with Laplace Transform for Reliability Analysis. Struct. Multidiscip. Optim. 2018, 59, 1301–1320. [Google Scholar] [CrossRef]
  32. Xu, J. A New Method for Reliability Assessment of Structural Dynamic Systems with Random Parameters. Struct. Saf. 2016, 60, 130–143. [Google Scholar] [CrossRef]
  33. Baker, J.W. Efficient Analytical Fragility Function Fitting Using Dynamic Structural Analysis. Earthq. Spectra 2015, 31, 579–599. [Google Scholar] [CrossRef]
  34. Jeon, J.-S.; Mangalathu, S.; Song, J.; Desroches, R. Parameterized Seismic Fragility Curves for Curved Multi-Frame Concrete Box-Girder Bridges Using Bayesian Parameter Estimation. J. Earthq. Eng. 2019, 23, 954–979. [Google Scholar] [CrossRef]
  35. Mangalathu, S.; Jeon, J.-S. Stripe-Based Fragility Analysis of Multispan Concrete Bridge Classes Using Machine Learning Techniques. Earthq. Eng. Struct. Dyn. 2019, 48, 1238–1255. [Google Scholar] [CrossRef]
  36. Low, Y.M. A New Distribution for Fitting Four Moments and Its Applications to Reliability Analysis. Struct. Saf. 2013, 42, 12–25. [Google Scholar] [CrossRef]
  37. Yuan, P.-T. On the Logarithmic Frequency Distribution and the Semi-Logarithmic Correlation Surface. Ann. Math. Statist. 1933, 4, 30–74. [Google Scholar] [CrossRef]
  38. Amin, M.; Ang Alfredo, H.S. Nonstationary Stochastic Models of Earthquake Motions. J. Eng. Mech. Div. 1968, 94, 559–584. [Google Scholar] [CrossRef]
  39. Yeh, C.-H.; Wen, Y.K. Modeling of Nonstationary Ground Motion and Analysis of Inelastic Structural Response. Struct. Saf. 1990, 8, 281–298. [Google Scholar] [CrossRef]
  40. Shinozuka, M.; Deodatis, G. Simulation of Stochastic Processes by Spectral Representation. Appl. Mech. Rev. 1991, 44, 191–204. [Google Scholar] [CrossRef]
  41. Liu, Z.; Liu, W.; Peng, Y. Random Function Based Spectral Representation of Stationary and Non-Stationary Stochastic Processes. Probabilistic Eng. Mech. 2016, 45, 115–126. [Google Scholar] [CrossRef]
  42. Clough, R.W.; Penzien, J.; Griffin, D.S. Dynamics of Structures; Prentice Hall: Hoboken, NJ, USA, 1990. [Google Scholar]
  43. Xu, J.; Feng, D.-C. Stochastic Dynamic Response Analysis and Reliability Assessment of Non-Linear Structures under Fully Non-Stationary Ground Motions. Struct. Saf. 2019, 79, 94–106. [Google Scholar] [CrossRef]
  44. Yang, Q.; Tian, Y. Earthquake Ground Motions & Artificial Generation; Science Press: Beijing, China, 2014. [Google Scholar]
  45. Yu, X.; Lu, D.; Li, B. Relating Seismic Design Level and Seismic Performance: Fragility-Based Investigation of RC Moment-Resisting Frame Buildings in China. J. Perform. Constr. Facil. 2017, 31, 04017075. [Google Scholar] [CrossRef]
  46. GB50011; Code for Seismic Design of Buildings. Standardization Administration of China: Beijing, China, 2010.
  47. Scott, B.; Park, R.; Priestley, M.J.N. Stress-Strain Behavior of Concrete Confined by Overlapping Hoops at Low and High Strain Rates. ACI J. Proc. 1982, 79, 13–27. [Google Scholar] [CrossRef]
  48. Cao, X.-Y.; Wu, G.; Ju, J.-W.W. Seismic Performance Improvement of Existing RCFs Using External PT-PBSPC Frame Sub-Structures: Experimental Verification and Numerical Investigation. J. Build. Eng. 2022, 46, 103649. [Google Scholar] [CrossRef]
  49. Liu, Z.; Zeng, B.; Wu, L. Simulation of non stationary ground motion by spectral representation and random functions . J. Vib. Eng. 2015, 28, 411–417. (In Chinese) [Google Scholar] [CrossRef]
  50. FEMA. Quantification of Building Seismic Performance Factors; Federal Emergency Management Agency: Washington, DC, USA, 2009.
  51. Xu, J.; Dang, C. A Novel Fractional Moments-Based Maximum Entropy Method for High-Dimensional Reliability Analysis. Appl. Math. Model. 2019, 75, 749–768. [Google Scholar] [CrossRef]
Figure 1. The flowchart of the proposed method.
Buildings 15 00694 g001
Figure 2. Definition of the collapse point.
Buildings 15 00694 g002
Figure 3. Layout of the frame and sectional reinforcements: (a) Plane arrangement of the structure. (b) Elevation arrangement of the structure. (c) Size and reinforcement of (A). (d) Size and reinforcement of (B). (e) Size and reinforcement of (C).
Buildings 15 00694 g003
Figure 4. Artificial ground motion samples: (a) seismic wave 1; (b) seismic wave 2.
Buildings 15 00694 g004
Figure 5. Acceleration response spectra comparisons: (a) original response spectra and mean spectrum; (b) corrected response spectra and mean spectrum.
Buildings 15 00694 g005
Figure 6. IDA curves and distribution of the collapse points: (a) IDA curves and collapse points; (b) the distribution of the collapse points.
Buildings 15 00694 g006
Figure 7. Distribution of the EDPs under different IMs: (a) PGA = 1.0 g; (b) PGA = 1.5 g.
Buildings 15 00694 g007
Figure 8. Comparison of fragility curves under different limits.
Buildings 15 00694 g008
Table 1. Parameters in the simulation of non-stationary seismic ground motions.
ParametersDescriptionParametersDescription
ω g Dominant frequency Δ ω Frequency interval
ω f Parameter of the second filter binding the low-frequency c Average arrival time of PGA
ζ g Damping ratio of the site soil η 0 Frequency modulation factor
ζ f Parameter of the second filter binding the low-frequency component T Duration time
a ¯ max PGA value k Shape control coefficient
γ 0 Peak value factor ω k Discrete frequencies
Table 2. Comparison of failure probability.
IM(g)0.10.51.01.21.41.61.82.0
Failure Prob. (CPI)000.00070.02400.10360.25510.44550.6113
Failure Prob.
(1/25)
000.00370.05800.22320.44960.65560.7980
Failure Prob.
(1/50)
00.00060.51210.77610.90190.95150.97590.9877
Disclaimer/Publisher’s Note: The statements, opinions and data contained in all publications are solely those of the individual author(s) and contributor(s) and not of MDPI and/or the editor(s). MDPI and/or the editor(s) disclaim responsibility for any injury to people or property resulting from any ideas, methods, instructions or products referred to in the content.

